AE3160 Experimental Fluid and Solid Mechanicsaelabs.gatech.edu/ae3610/Fa17_Buckling.pdfElastic...
17
AE3160 Experimental Fluid and Solid Mechanics Column Buckling C.V. Di Leo 1
Transcript of AE3160 Experimental Fluid and Solid Mechanicsaelabs.gatech.edu/ae3610/Fa17_Buckling.pdfElastic...

AE3160Experimental Fluid and Solid Mechanics
Column Buckling
C.V. Di Leo
1

Outline
2
• Elastic Stability• Elastic Stability of a beam (on the board)
• Euler buckling load• Euler’s hyperbola
• Elastic stability of an imperfect beam (on the board)• Southwell plot
• Lab Setup• Southwell plot using bending strain

Elastic Stability• Selection of structural & machine elements is based on three
characteristics: strength, stiffness & stability• Structural instabilities may occur when compressive stresses
are present
3
Global buckling
(CC115465 Flight Safety Investigation, Advanced Structures Group, U. of Cambridge. Lamont, U. of Edinburgh)
Local buckling

Elastic Stability• Selection of structural & machine elements is based on three
characteristics: strength, stiffness & stability• Structural instabilities may occur when compressive stresses
are present• Elastic systems are in equilibrium when their elastic potential
is stationary
4
Elastic stability
Snap-through/bi-stable structures:I
https://youtu.be/xP_iiMFk5W4
Buckling of an orthogrid cylinder:I
https://youtu.be/nUjpVBktTAI
Stable Neutral stability Unstable
2 / 11
�(x0 + �) > �(x0)
�
Elastic stability
Snap-through/bi-stable structures:I
https://youtu.be/xP_iiMFk5W4
Buckling of an orthogrid cylinder:I
https://youtu.be/nUjpVBktTAI
Stable Neutral stability Unstable
2 / 11
�(x0 + �) = �(x0)
�
Elastic stability
Snap-through/bi-stable structures:I
https://youtu.be/xP_iiMFk5W4
Buckling of an orthogrid cylinder:I
https://youtu.be/nUjpVBktTAI
Stable Neutral stability Unstable
2 / 11
�(x0 + �) < �(x0)
�

Elastic Stability of A beam
5
NASA’s Marshall Center

Elastic Stability of a Beam
• What happens as P increases?
6
Elastic stability of a beam
P P
L
L/2
Strain gauge A
Strain gauge B
What happens as P increases?
3 / 11

AE 3610 - BUCKLING OF AN ELASTIC COLUMN
: Younes Mobucus E
(MOMENT OF INERTIA I
×
"
¥\\ { U⇒µtrw=o
:
→I
←W * NEGLECTING SHEAK LOADS
.
# M ONLY VALID FOR ShipleyP
SUPPORTED B. C.
From BEAM THEORY
U=EI . day ⇒ EI day + Pw=o
date +two ,s2÷÷
THE GENERAL Form OF THE SOLUTION IS GIVEN By
w=Asw(r× ) + Bcoscrx )
A,
B ARE DETERMINED FROM BOUNDARY CONDITIONS
@ x=o, w(o)=B → B -0
A=o ( Trivial )@ ×=L
,wH=o → wk)=Asm(kD { gµ(s[)=o
r
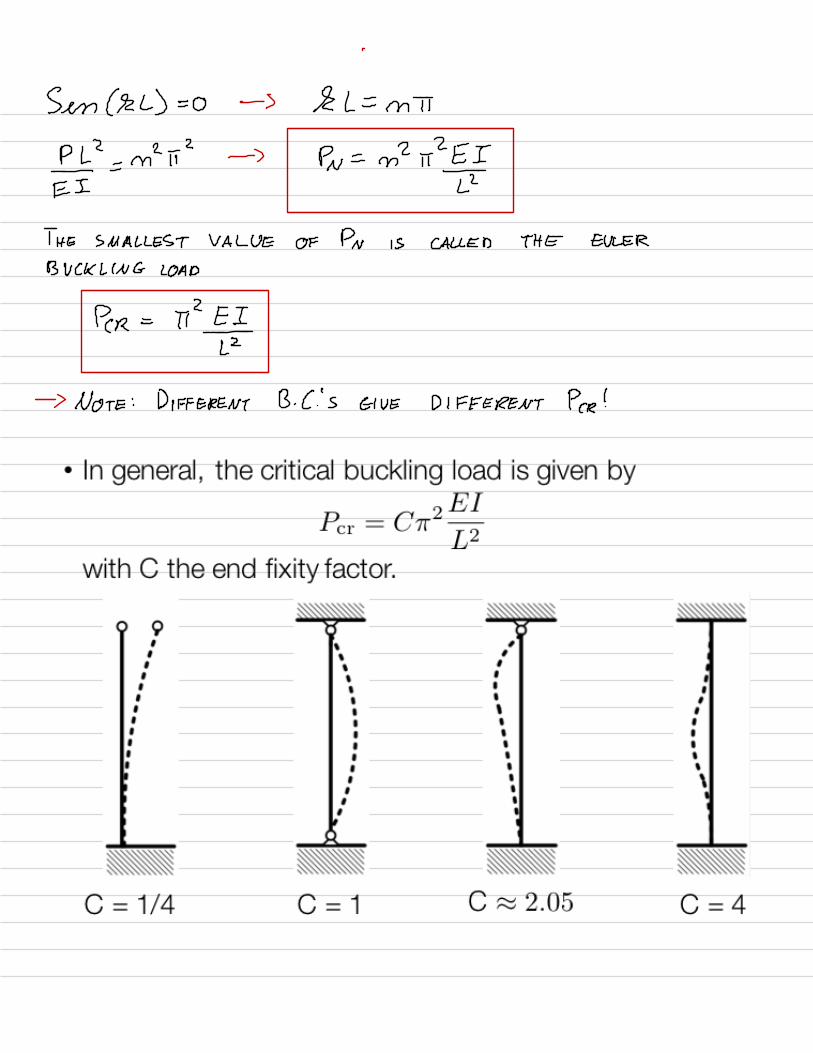
Sen(sL)=o → &L=mT
PL2=m2I2→ P~=m2A2EI
- -
EI LZ
HE SMALLEST VALUE OF PN is CALLED THE EULER
BUCKLING LOAD
Per = ITZEILZ
NOTE : DIFFERENT B. C.
'S GIVE DIFFERENT Pcr !

Boundary Conditions• In general, the critical buckling load is given by
with C the end fixity factor.
7
Pcr = C�2 EI
L2
C = 1C = 1/4 C = 4C � 2.05

EULER 's HYPERBOLA
ALLOWS US TO COMPARE
THE PERFORMANCE OF DIFFERENT
MATERIALS
1) RADIUS OF GYRATION
Ro=(aI)k [u]
2) SLENDERNESS RATIO
Sr=± I ]RG
3) CRITICAL STRESS
Ocr =
R¥=n2EIz=T¥z
HE UPPER LIMIT ON Ock IS OFTEN THE YIELD STRESS Of
* EULERS HYPERBOCA Is A PLOT OF Ocr ( Or Ocr/Oy ) V. s. Sr

Euler’s Hyperbola
8
§26.3 FAILURE MODE: BUCKLING VERSUS YIELD
1.2
1.0
0.8
0.6
0.4
0.2
0.00 50 100 150 200
σ
= σ
/σ
crcr
Y
Slenderness ratio s = L /r
Aluminum
eff
SteelFir Wood
Failure by buckling(long columns)
Failure by yield(short columns)
Figure 26.2. Column failure modes: buckling versus yield plotted in terms of theslenderness ratio. Solid lines (“Euler hyperbolas”) represent failure by buckling; dashed
line failure by yield; black dots mark the critical slenderness ratios.
§26.3.2. Long Versus Short ColumnsThe following three failure cases may be distinguished according to the slenderness of the column.• Long column. If the slenderness exceeds a critical value scr defined below, the column will
fail by elastic buckling, in which case σcr < σY or σcr < 1. Failure occurs at one of the solidcurves, which are known as Euler hyperbolas in the literature.
• Short column. If the slenderness is less than than the critical value scr defined below, it eitherfails by yield at σ = P/A = σY , or σcr = 1 and the failure occurs at the dashed line.
• Goldilocks column. Not too short, not too long. If s = scr , where s2cr = π2 E = π2 E/σY
the column will fail simultaneously by buckling and yield. That transition is marked by theblack dot in Figure 26.2. It represents the most efficient use of the material, so it is an optimaldesign in that particular sense.
Remark 26.1. Most Mechanics of Materials books show failure diagrams by plotting (26.3) directly, that is,without dividing through bt σY . As a result the horizontal scale is dimensionless (the slenderness ratio) butthe vertical scale (in stress) is not. The resulting graphs depend on column material as well as physical unitschosen.
Example 26.1. A pinned-pinned steel column with E = 210 GPa and σY = 210 MPa has a pin-to-pin lengthof L = 5 m = 5000 mm and a b × h solid rectangular cross section with b = 0.12 m = 120 mm, and h = 0.08m = 80 mm. Will the column fail first by yield or elastic buckling?Solution. The critical Euler buckling load is Pcr = π 2 E I/L2 since Lef f = L for the pinned-pinned case.The minimum second moment of inertia is I = bh3/12 because h < b. Replace and divide by A = bh toget σcr = Pcr/A = π2 E h2/(12L2) = 44.8 N/mm2 = 44.8 MPa. Compare to yield: σcr < σY = 210 MPa.Thus the column will fail first by buckling .
Alternatively one can check the slenderness ratio: s = Lef f /r , where Lef f = L and r 2 = I/A = h2/12. Aquick computation gives s = L
√12/h = 5000
√12/80 ≈ 216, which is way into the “long column” range as
can be quickly checked from Figure 26.2.
26–5
• Plot of the critical stress �cr (sometimes normalizedby either �y or E) vs. the slenderness ratio SR =L/RG
�cr
=�cr
/�y
Slenderness Ratio, SR = L/RG, with RG = (I/A)1/2

Elastic stability of an imperfect beam
• In reality beams have defects. • Assume that the beam has an initial imperfection of the
form:
9
Elastic stability of a beam
P P
L
L/2
Strain gauge A
Strain gauge B
What happens as P increases?
3 / 11
Buckling of imperfect structures
Our model of the beam does not reflect reality: The beam is notperfectly straight and the load is not perfectly aligned
How do real beams behave if they have some initial curvature?
Assume an initial imperfection:
a1 sin⇣⇡x
L
⌘
The deflection � will now depend on the load
� = w(L/2) =Pa1
P
cr
� P
8 / 11
a1 sin��x
L
�

BUCKLING W/ AN IMPERFECTION . SOUTHWELL PLOT
P
¥
,dP
I
¥¥wo→)¥←w+wo. fin! p
Ut PCW two )=o:/
I M=EId2w.
a
day +94W - wo )=o,
s2=IEI
ASSUME AN INITIAL IMPERFECTION OF THE FORM
Wo = A , Senc HHL )
ASSUME A SOLUTION OF THE FORM
W= A Sen(FX/D ( SAME SOLUTION AS BEFORE USING ONLY
THE FIRST MODE,
Nsl )
-
At÷smGTxr) + s'
( Ata , )Sen(Tx/D=O
-
Ang + s4 A- + a.) =o
Afl-
Ea ) = a ,

UsinaRemove EI
£=⇐I± ,Pcr =I2t¥ - y÷z=P¥
WHICH YIELDS
A ( I -
Py )= - a ,
A = a ,P_Pcr - P
w= Aip SENGTXK )Pcr - P
EWALUATE @ X=L/2
w( 42 ) = 0 = Aip of → MID SPAN DEFLECTION
Pcr - P
of =p{n +91→ SOUTHWELL PLOT !
Pcr
PLOT OF % V. 5. 0 has A SLOPE
EQUAL TO VPCR ! WE CAN MEASURE PCR FROM
LOAD AND MIDSPAN DEFLECTION DATA !

The Southwell Plot
10
• Southwell (around 1936) recognized this relationship• Allows us to experimentally estimate Pcr in a non-
destructive manner• Technique can be extended to more complex structures.
Southwell, R.V., An Introduction to the Theory of Elasticity,Oxford at the Cambridge Press, 1936, p.425.
experimental data
�/P
�
Slope = 1/Pcr
�
P=
�
Pcr+
a1
Pcr

Southwell plot in terms of bending strain• In the lab we will not directly measure the mid-span deflection !, rather we
will measure the bending strain
11
strain gages
(front and back)
Simply supported Al column
• Strain gauges measure:
�a = �axial + �bend
�b = �axial � �bend
• We want to estimate the bending strain, whichis given as
�bend =1
2(�a � �b)
• The bending strain can be related to the mo-ment in the beam, and the deflection through
�bend = � hM
2EI, and M = �P
• Hence
�
P=
�
Pcr+
a1
Pcr� �bend =
�bend
PPcr + c

The Southwell Plot• Southwell (around 1936) recognized this relationship• Allows us to experimentally estimate Pcr in a non-
destructive manner• Technique can be extended to more complex structures.
experimental data
�/P
�
Slope = 1/Pcr
�
P=
�
Pcr+
a1
Pcr
experimental data
�bend =�bendP
Pcr + c
�bend
�bend/P
Slope = Pcr


![1880.] On the Stability, or Instability, of certain Fluid ...gibbs.if.usp.br/~marchett/fluidos/instability_rayleigh-1.pdf · On the Stability, or Instability, of certain Fluid Motions.](https://static.fdocuments.net/doc/165x107/5b43259c7f8b9a26268bbb3f/1880-on-the-stability-or-instability-of-certain-fluid-gibbsifuspbrmarchettfluidosinstabilityrayleigh-1pdf.jpg)