
Advertising Amid Crisis
27
Advertising Amid Crisis Advertising Amid Crisis Lessons from the Financial & Automotive Industries in 2009 Brad Fay COO Keller Fay Group David Shiffman SVP Mediavest
Transcript of Advertising Amid Crisis
Advertising Amid CrisisAdvertising Amid CrisisLessons from the Financial &Automotive Industries in 2009
Brad FayCOOKeller Fay Group
David ShiffmanSVP
Mediavest
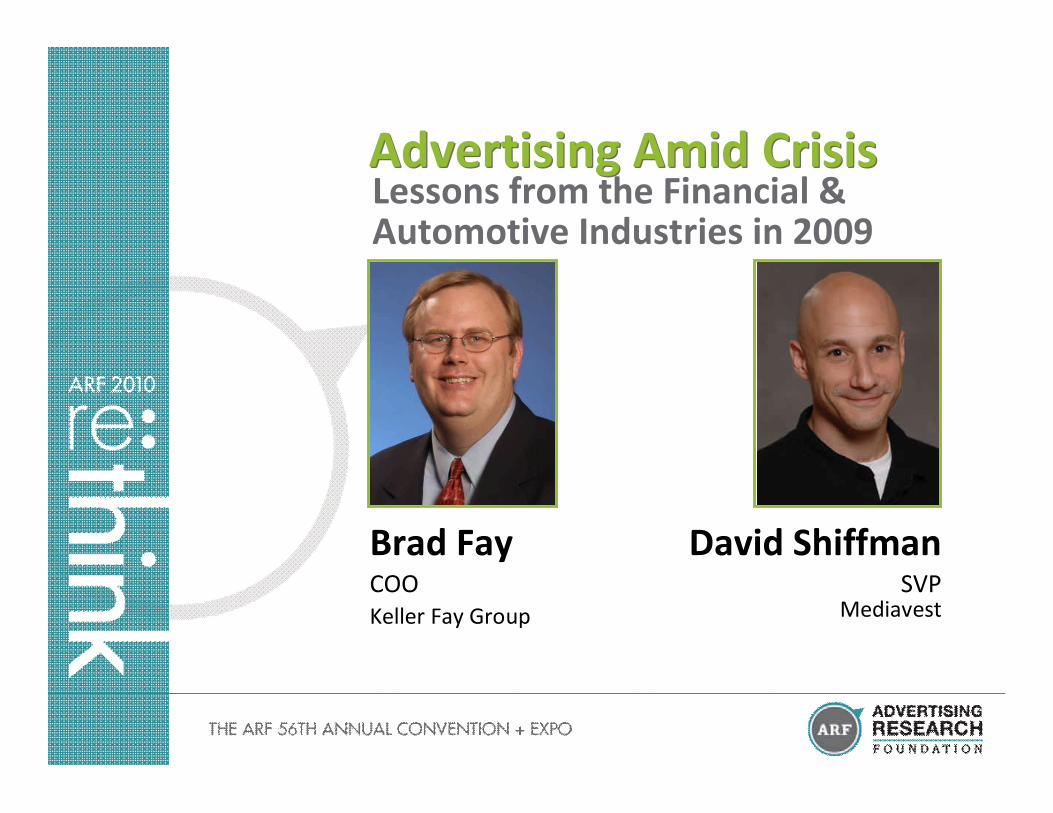
“Bailout Plan: $2.5 Trillion and a Strong US Hand” – New York Times, Feb. 10
“AIG Planning Huge Bonuses After $170M Bailout” – New York Times, March 14
“AIG Faces Growing Wrath Over Payouts” – Wall Street Journal, March 16
“US Expands Plan to Buy Banks’ Troubled Assets” – NY Times, March 24
“US Gets Majority Stake in New GM; Investors Cry Foul” – Washington Post, April 1
“Rescued Banks Balk at Chrysler Deal; Creditors Pushed to SurrenderClaims of Billions” – Washington Post, April 17
“Judge Attacks Merrill Pre-Merger Bonuses” – New York Times, Aug. 10, 2009
“GM To Draw Down More US Funds” – Wall Street Journal, Oct. 29, 2009
“TARP Can’t Save Some Banks” – Wall Street Journal, Nov. 17, 2009
2009 Was a Bad Year,Especially for Auto & Financial Industries2009 Was a Bad Year,Especially for Auto & Financial Industries
To Advertise or Not to Advertise?To Advertise or Not to Advertise?
The crisis raised this critical question for all marketers,especially in automotive and financial industries
– A desire to save money amid unprecedented financial pressures –not to mention taxpayer ownership – argued against advertising
– But many arguments existed for continuing to advertise Manage reputations against a storm of negative news
Speak to and educate customers with a reassuring voice
Capture market share from struggling competitors
Ultimately, companies made different choices, and thesedifferences provide us with a valuable case study aboutadvertising amid crisis
– Applies to whole industries during times of national or global crisis
– May also apply to individual companies facing individual corporate crises

Our ApproachOur Approach
Two data sources utilized:– Keller Fay Group’s TalkTrack® monitoring word of mouth about
specific companies based on a continuous online survey
– Nielsen advertising expenditures via Mediavest
Word of mouth data– Over 70,000 interviews in 2008 & 2009 with nationally representative
samples of adults 18-69
– Tracks positive vs. negative polarity of consumer conversations aboutthe brands throughout the crisis, with linkages made to news andadvertising as information sources
Ad spend data– Allowed us to group word of mouth data based on brands or
companies that maintained ad spending, versus those who cut backa moderate or large amount
Financial Services
4%
5%
6%
7%
8%
9%
2008
W/E
Jun
01
2008
W/E
Jun22
2008
W/E
Jul 1
3
2008
W/E
Aug03
2008
W/E
Aug24
2008
W/E
Sep14
2008
W/E
Oct
05
2008
W/E
Oct
26
2008
W/E
Nov
16
2008
W/E
Dec07
2008
W/E
Dec28
2009
W/E
Jan18
2009
W/E
Feb08
2009
W/E
Mar
01
2009
W/E
Mar
22
2009
W/E
Apr
12
2009
W/E
May
03
2009
W/E
May
24
2009
W/E
Jun
14
2009
W/E
Jul 0
5
2009
W/E
Jul 2
6
2009
W/E
Aug16
2009
W/E
Sep06
2009
W/E
Sep27
2009
W/E
Oct
18
2009
W/E
Nov
08
2009
W/E
Nov
29
2009
W/E
Dec20
2010
W/E
Jan
10
2010
W/E
Jan31
Financial Services
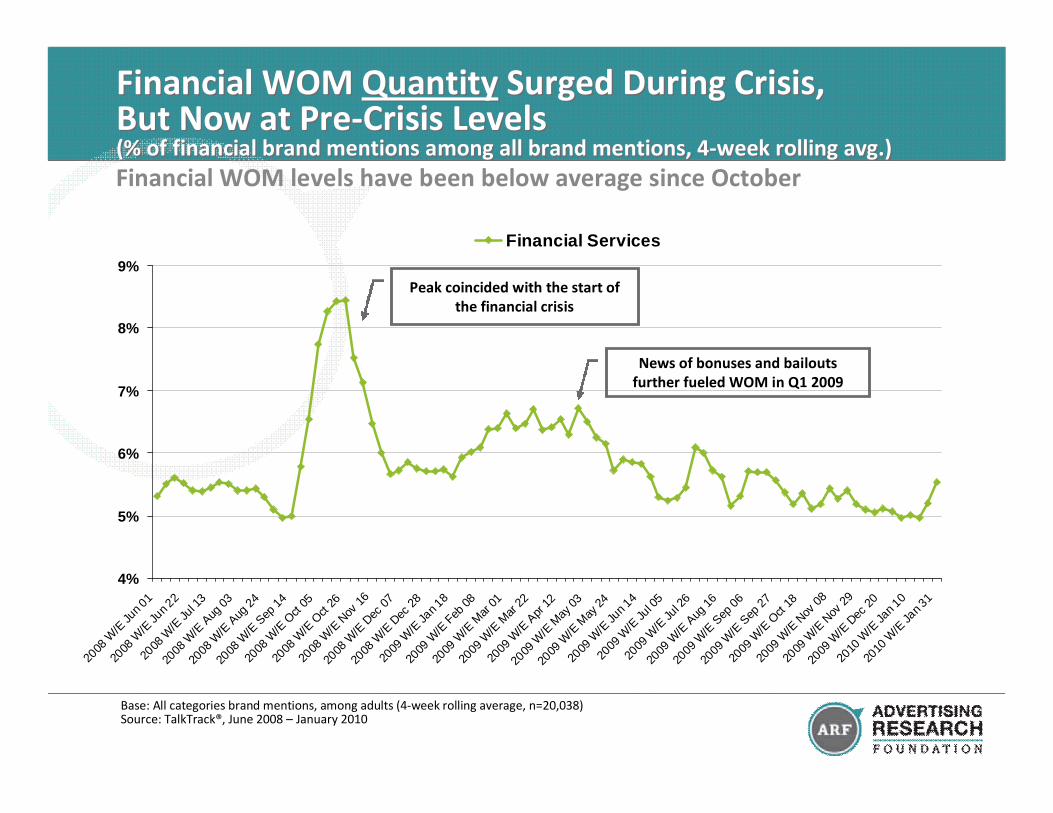
Financial WOM Quantity Surged During Crisis,But Now at Pre-Crisis Levels(% of financial brand mentions among all brand mentions, 4-week rolling avg.)
Financial WOM Quantity Surged During Crisis,But Now at Pre-Crisis Levels(% of financial brand mentions among all brand mentions, 4-week rolling avg.)
Base: All categories brand mentions, among adults (4-week rolling average, n=20,038)Source: TalkTrack®, June 2008 – January 2010
Financial WOM levels have been below average since October
Peak coincided with the start ofthe financial crisis
News of bonuses and bailoutsfurther fueled WOM in Q1 2009
0%
10%
20%
30%
40%
50%
60%
70%
2008
W/E
Jun
01
2008
W/E
Jun
22
2008
W/E
Jul 1
3
2008
W/E
Aug03
2008
W/E
Aug24
2008
W/E
Sep14
2008
W/E
Oct
05
2008
W/E
Oct
26
2008
W/E
Nov16
2008
W/E
Dec07
2008
W/E
Dec28
2009
W/E
Jan
18
2009
W/E
Feb08
2009
W/E
Mar
01
2009
W/E
Mar
22
2009
W/E
Apr12
2009
W/E
May
03
2009
W/E
May
24
2009
W/E
Jun
14
2009
W/E
Jul 0
5
2009
W/E
Jul 2
6
2009
W/E
Aug16
2009
W/E
Sep06
2009
W/E
Sep27
2009
W/E
Oct
18
2009
W/E
Nov08
2009
W/E
Nov29
2009
W/E
Dec20
2010
W/E
Jan
10
2010
W/E
Jan
31
Mostly Positive Mostly Negative Mixed
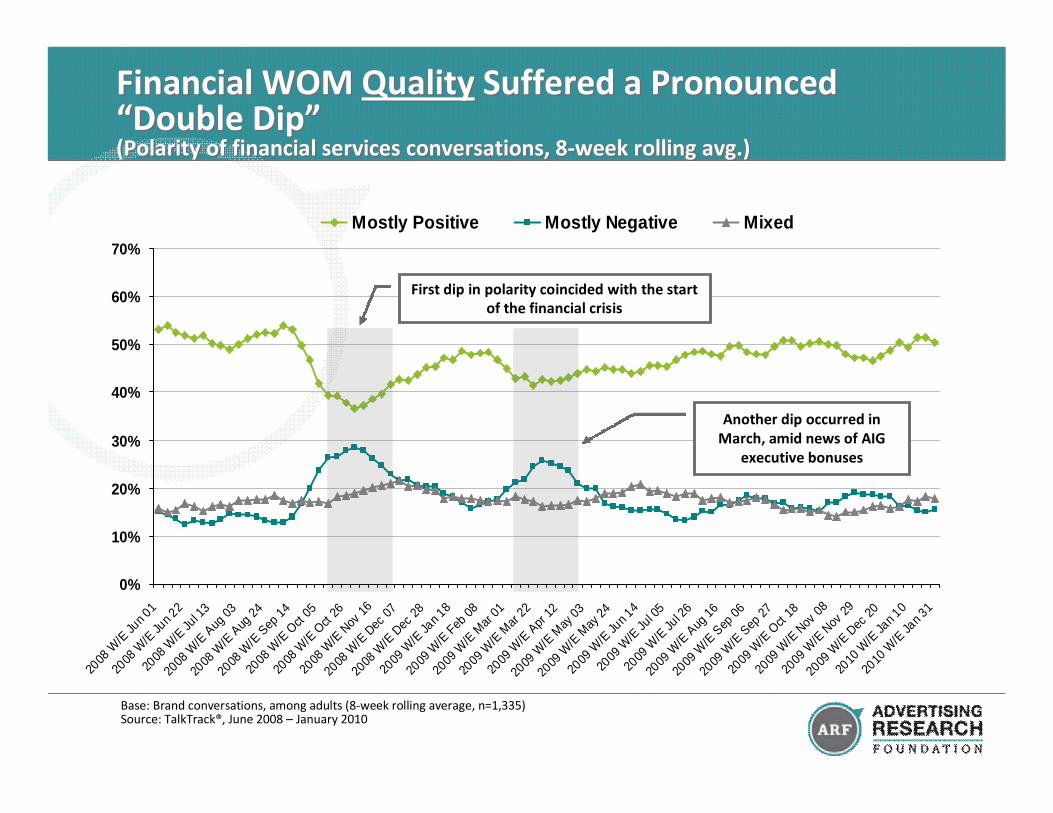
Financial WOM Quality Suffered a Pronounced“Double Dip”(Polarity of financial services conversations, 8-week rolling avg.)
Financial WOM Quality Suffered a Pronounced“Double Dip”(Polarity of financial services conversations, 8-week rolling avg.)
Base: Brand conversations, among adults (8-week rolling average, n=1,335)Source: TalkTrack®, June 2008 – January 2010
First dip in polarity coincided with the startof the financial crisis
Another dip occurred inMarch, amid news of AIG
executive bonuses

40%
23%
8%
29%
25%
12%
36%
21%22%
16%
42%
20%
24%
27%
17%
39%38%
16%
22%24%
Buy it or Try it Consider it Avoid it No RecommendationMade
All Categories
Financial Services (Pre-Crisis)Financial Services (Early Crisis)
Financial Services (Mid-Crisis)Financial Services (Late Crisis)
Recommendations Moved from “Buy” to “Avoid,”and Have Not Fully Recovered(Specific recommendation received in word of mouth conversation)
Recommendations Moved from “Buy” to “Avoid,”and Have Not Fully Recovered(Specific recommendation received in word of mouth conversation)
Base: Brand mentions where someone else provided advice, among adults (All Categories, n=44,542. Financial: Pre-Crisis, n=2,319;Early Crisis, n=2,643; Mid Crisis, n=2,553; Late Crisis, n=2,312)Note: Most recent period (“Late Crisis”) examined for “All Categories”Source: TalkTrack®, February 2008 – January 2010
Pre-Crisis = Feb – Jul 2008Early Crisis = Aug 2008 – Jan 2009
Mid Crisis = Feb – Jul 2009Late Crisis = Aug 2009 – Jan 2010
Recommendations to “buy it or try it” increased 4 pts for the financialservices category since the mid-crisis period. “Consider it” and “avoid it”recommendations decreased slightly, along with the percentage ofconversations containing no specific recommendation.

50%
35%
50%48%
37%
44%45%
35%37%
47%
33%
36%
47%
36%
41%
Likely to Pass Along to Others Likely to Seek Out Information Likely to Purchase
All CategoriesFinancial Services (Pre-Crisis)Financial Services (Early Crisis)Financial Services (Mid-Crisis)Financial Services (Late Crisis)
WOM-Based Purchase Intent Suffered,But Has Recently Improved(% rating WOM highly likely to inspire action, “9” or “10” on 0-10 scale)
WOM-Based Purchase Intent Suffered,But Has Recently Improved(% rating WOM highly likely to inspire action, “9” or “10” on 0-10 scale)
Base: Brand mentions where someone else provided advice, among adults (All Categories, n=44,542. Financial: Pre-Crisis, n=2,319;Early Crisis, n=2,643; Mid Crisis, n=2,553; Late Crisis, n=2,312)Note: Most recent period (“Late Crisis”) examined for “All Categories”Source: TalkTrack®, February 2008 – January 2010
Pre-Crisis = Feb – Jul 2008Early Crisis = Aug 2008 – Jan 2009
Mid Crisis = Feb – Jul 2009Late Crisis = Aug 2009 – Jan 2010
Likelihood to purchase increased 5 pts since the mid-crisis period, whilelikelihood to seek out information increased by 3 pts.
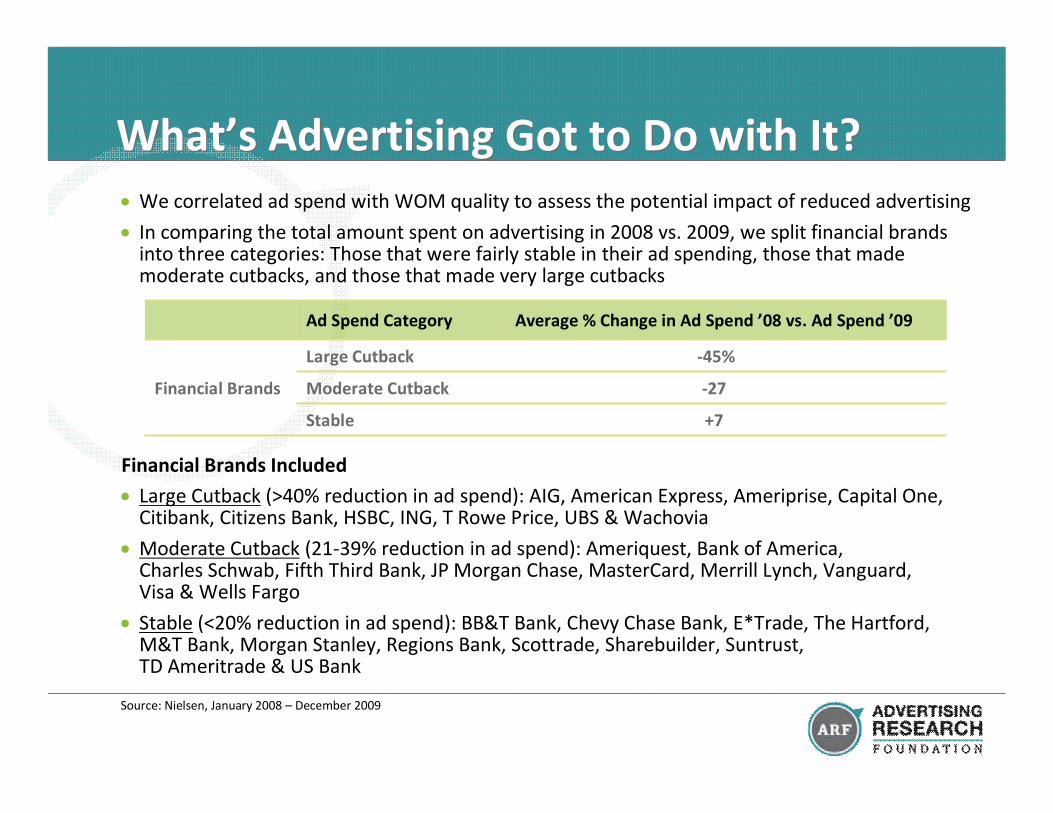
Ad Spend Category Average % Change in Ad Spend ’08 vs. Ad Spend ’09
Financial Brands
Large Cutback -45%
Moderate Cutback -27
Stable +7
What’s Advertising Got to Do with It?What’s Advertising Got to Do with It?
Source: Nielsen, January 2008 – December 2009
We correlated ad spend with WOM quality to assess the potential impact of reduced advertising
In comparing the total amount spent on advertising in 2008 vs. 2009, we split financial brandsinto three categories: Those that were fairly stable in their ad spending, those that mademoderate cutbacks, and those that made very large cutbacks
Financial Brands Included
Large Cutback (>40% reduction in ad spend): AIG, American Express, Ameriprise, Capital One,Citibank, Citizens Bank, HSBC, ING, T Rowe Price, UBS & Wachovia
Moderate Cutback (21-39% reduction in ad spend): Ameriquest, Bank of America,Charles Schwab, Fifth Third Bank, JP Morgan Chase, MasterCard, Merrill Lynch, Vanguard,Visa & Wells Fargo
Stable (<20% reduction in ad spend): BB&T Bank, Chevy Chase Bank, E*Trade, The Hartford,M&T Bank, Morgan Stanley, Regions Bank, Scottrade, Sharebuilder, Suntrust,TD Ameritrade & US Bank
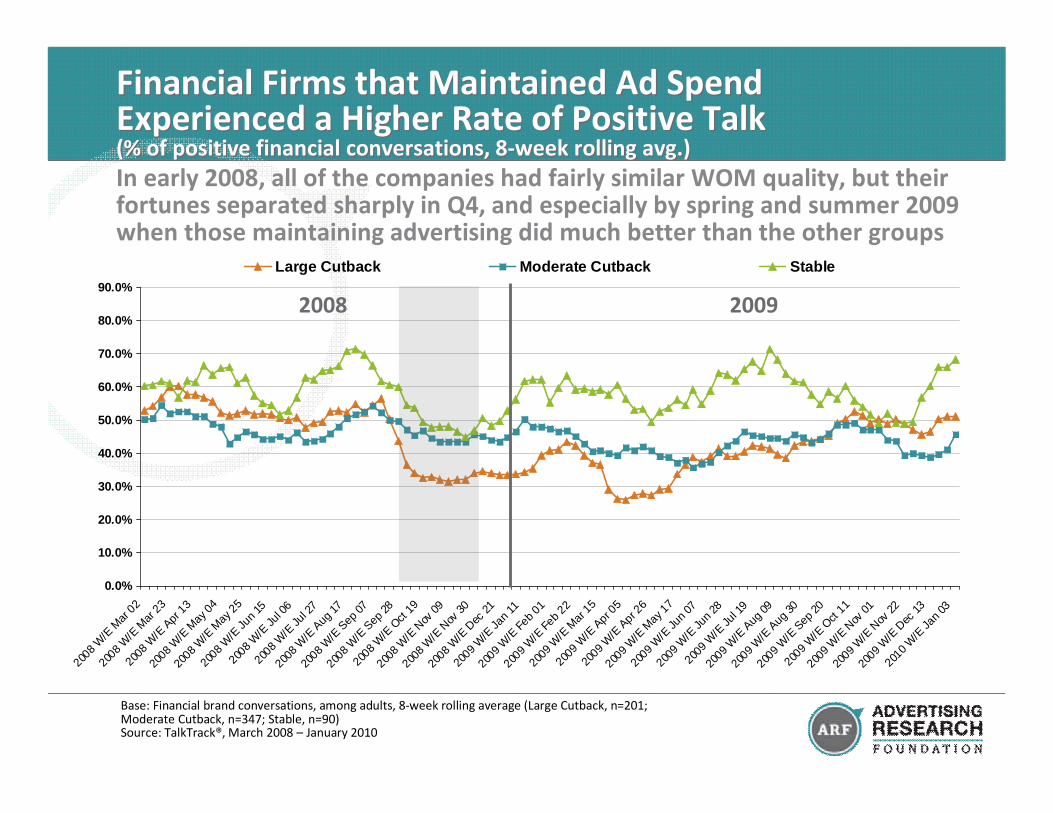
In early 2008, all of the companies had fairly similar WOM quality, but theirfortunes separated sharply in Q4, and especially by spring and summer 2009when those maintaining advertising did much better than the other groups
Financial Firms that Maintained Ad SpendExperienced a Higher Rate of Positive Talk(% of positive financial conversations, 8-week rolling avg.)
Financial Firms that Maintained Ad SpendExperienced a Higher Rate of Positive Talk(% of positive financial conversations, 8-week rolling avg.)
0.0%
10.0%
20.0%
30.0%
40.0%
50.0%
60.0%
70.0%
80.0%
90.0%
2008
W/E
Mar
02
2008
W/E
Mar
23
2008
W/E
Apr13
2008
W/E
May
04
2008
W/E
May
25
2008
W/E
Jun
15
2008
W/E
Jul 0
6
2008
W/E
Jul 2
7
2008
W/E
Aug17
2008
W/E
Sep07
2008
W/E
Sep28
2008
W/E
Oct
19
2008
W/E
Nov
09
2008
W/E
Nov
30
2008
W/E
Dec
21
2009
W/E
Jan
11
2009
W/E
Feb
01
2009
W/E
Feb
22
2009
W/E
Mar 1
5
2009
W/E
Apr 05
2009
W/E
Apr 26
2009
W/E
May
17
2009
W/E
Jun
07
2009
W/E
Jun
28
2009
W/E
Jul 1
9
2009
W/E
Aug09
2009
W/E
Aug30
2009
W/E
Sep20
2009
W/E
Oct
11
2009
W/E
Nov
01
2009
W/E
Nov
22
2009
W/E
Dec
13
2010
W/E
Jan
03
Large Cutback Moderate Cutback Stable
Base: Financial brand conversations, among adults, 8-week rolling average (Large Cutback, n=201;Moderate Cutback, n=347; Stable, n=90)Source: TalkTrack®, March 2008 – January 2010
2008 2009
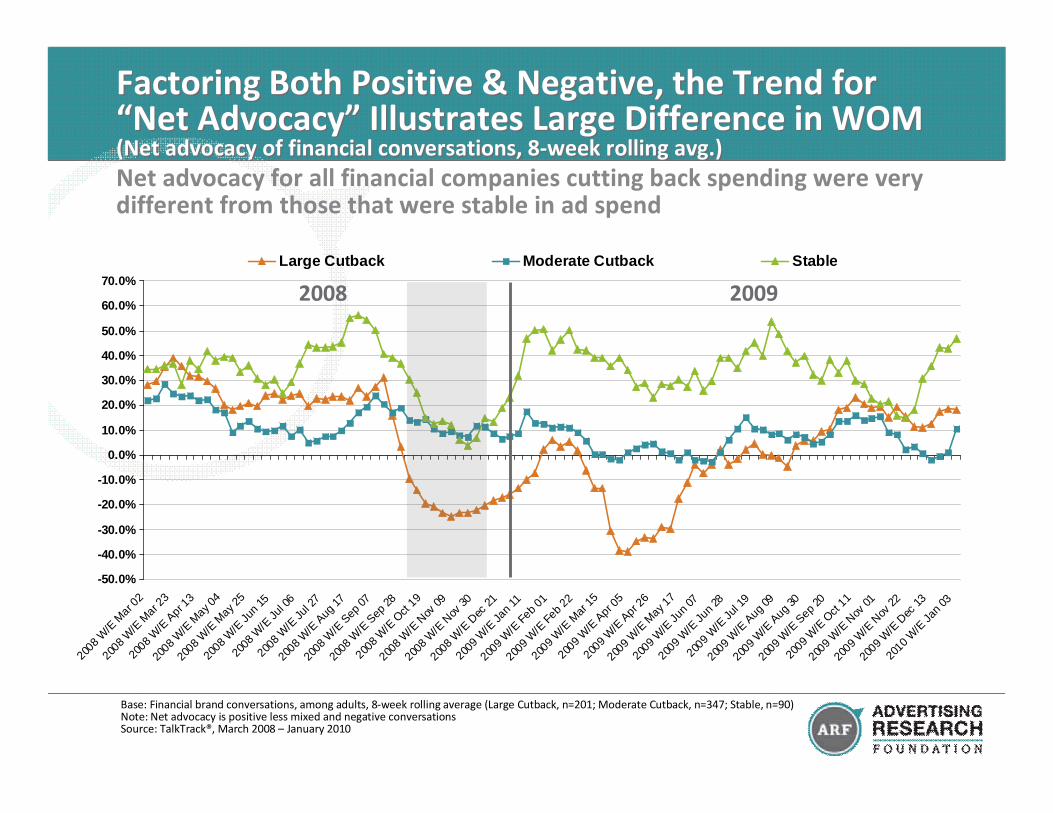
Net advocacy for all financial companies cutting back spending were verydifferent from those that were stable in ad spend
Factoring Both Positive & Negative, the Trend for“Net Advocacy” Illustrates Large Difference in WOM(Net advocacy of financial conversations, 8-week rolling avg.)
Factoring Both Positive & Negative, the Trend for“Net Advocacy” Illustrates Large Difference in WOM(Net advocacy of financial conversations, 8-week rolling avg.)
-50.0%
-40.0%
-30.0%
-20.0%
-10.0%
0.0%
10.0%
20.0%
30.0%
40.0%
50.0%
60.0%
70.0%
2008
W/E
Mar 0
2
2008
W/E
Mar 2
3
2008
W/E
Apr 13
2008
W/E
May
04
2008
W/E
May
25
2008
W/E
Jun
15
2008
W/E
Jul 0
6
2008
W/E
Jul 2
7
2008
W/E
Aug17
2008
W/E
Sep07
2008
W/E
Sep28
2008
W/E
Oct
19
2008
W/E
Nov
09
2008
W/E
Nov
30
2008
W/E
Dec
21
2009
W/E
Jan
11
2009
W/E
Feb
01
2009
W/E
Feb
22
2009
W/E
Mar
15
2009
W/E
Apr 05
2009
W/E
Apr 26
2009
W/E
May
17
2009
W/E
Jun
07
2009
W/E
Jun
28
2009
W/E
Jul 1
9
2009
W/E
Aug09
2009
W/E
Aug30
2009
W/E
Sep20
2009
W/E
Oct
11
2009
W/E
Nov
01
2009
W/E
Nov
22
2009
W/E
Dec
13
2010
W/E
Jan
03
Large Cutback Moderate Cutback Stable
2008 2009
Base: Financial brand conversations, among adults, 8-week rolling average (Large Cutback, n=201; Moderate Cutback, n=347; Stable, n=90)Note: Net advocacy is positive less mixed and negative conversationsSource: TalkTrack®, March 2008 – January 2010
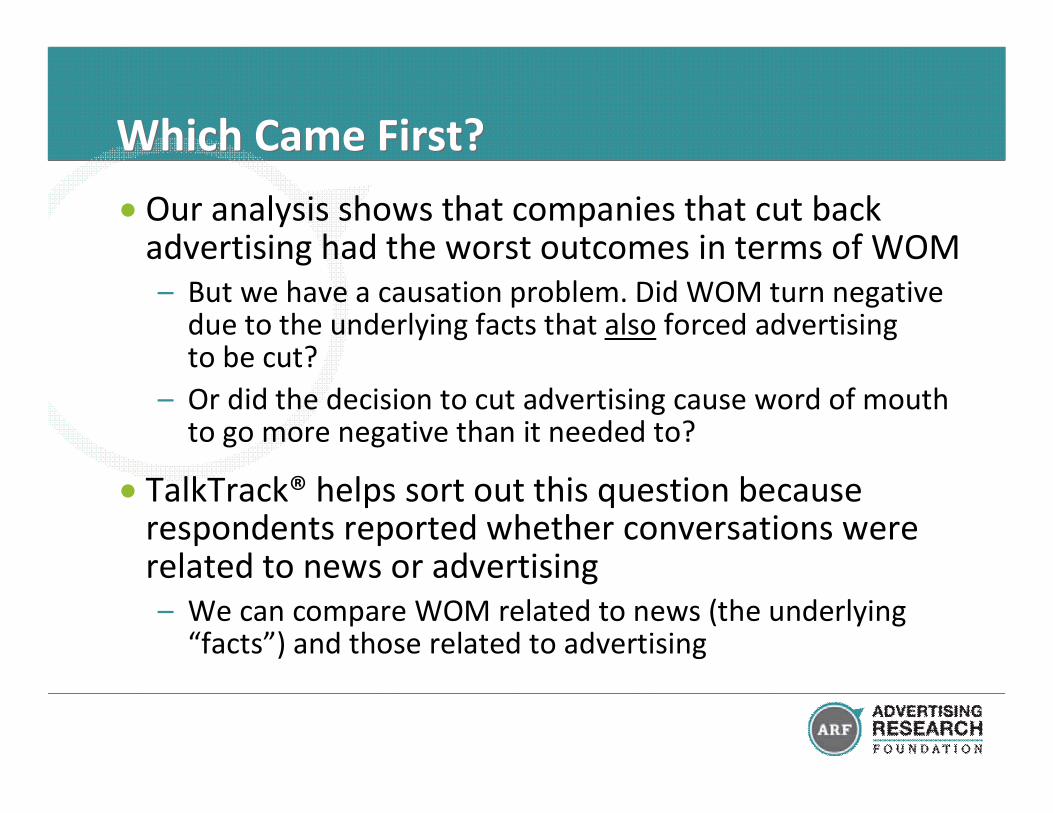
Which Came First?Which Came First?
Our analysis shows that companies that cut backadvertising had the worst outcomes in terms of WOM– But we have a causation problem. Did WOM turn negative
due to the underlying facts that also forced advertisingto be cut?
– Or did the decision to cut advertising cause word of mouthto go more negative than it needed to?
TalkTrack® helps sort out this question becauserespondents reported whether conversations wererelated to news or advertising– We can compare WOM related to news (the underlying
“facts”) and those related to advertising
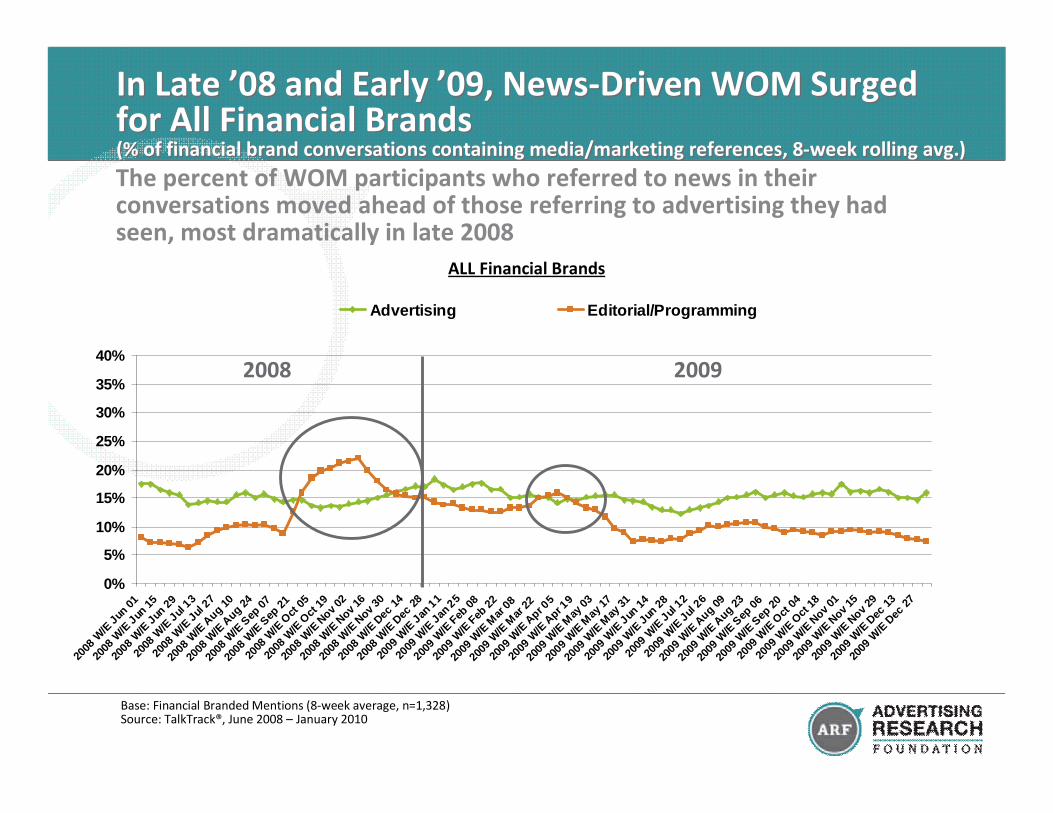
In Late ’08 and Early ’09, News-Driven WOM Surgedfor All Financial Brands(% of financial brand conversations containing media/marketing references, 8-week rolling avg.)
In Late ’08 and Early ’09, News-Driven WOM Surgedfor All Financial Brands(% of financial brand conversations containing media/marketing references, 8-week rolling avg.)
0%
5%
10%
15%
20%
25%
30%
35%
40%
2008
W/E
Jun01
2008
W/E
Jun15
2008
W/E
Jun29
2008
W/E
Jul13
2008
W/E
Jul27
2008
W/E
Aug
10
2008
W/E
Aug
24
2008
W/E
Sep
07
2008
W/E
Sep
21
2008
W/E
Oct
05
2008
W/E
Oct
19
2008
W/E
Nov02
2008
W/E
Nov16
2008
W/E
Nov30
2008
W/E
Dec14
2008
W/E
Dec28
2009
W/E
Jan11
2009
W/E
Jan25
2009
W/E
Feb08
2009
W/E
Feb22
2009
W/E
Mar
08
2009
W/E
Mar
22
2009
W/E
Apr 05
2009
W/E
Apr 19
2009
W/E
May
03
2009
W/E
May
17
2009
W/E
May
31
2009
W/E
Jun14
2009
W/E
Jun28
2009
W/E
Jul12
2009
W/E
Jul26
2009
W/E
Aug
09
2009
W/E
Aug
23
2009
W/E
Sep
06
2009
W/E
Sep
20
2009
W/E
Oct
04
2009
W/E
Oct
18
2009
W/E
Nov01
2009
W/E
Nov15
2009
W/E
Nov29
2009
W/E
Dec13
2009
W/E
Dec27
Advertising Editorial/Programming
ALL Financial Brands
Base: Financial Branded Mentions (8-week average, n=1,328)Source: TalkTrack®, June 2008 – January 2010
2008 2009
The percent of WOM participants who referred to news in theirconversations moved ahead of those referring to advertising they hadseen, most dramatically in late 2008
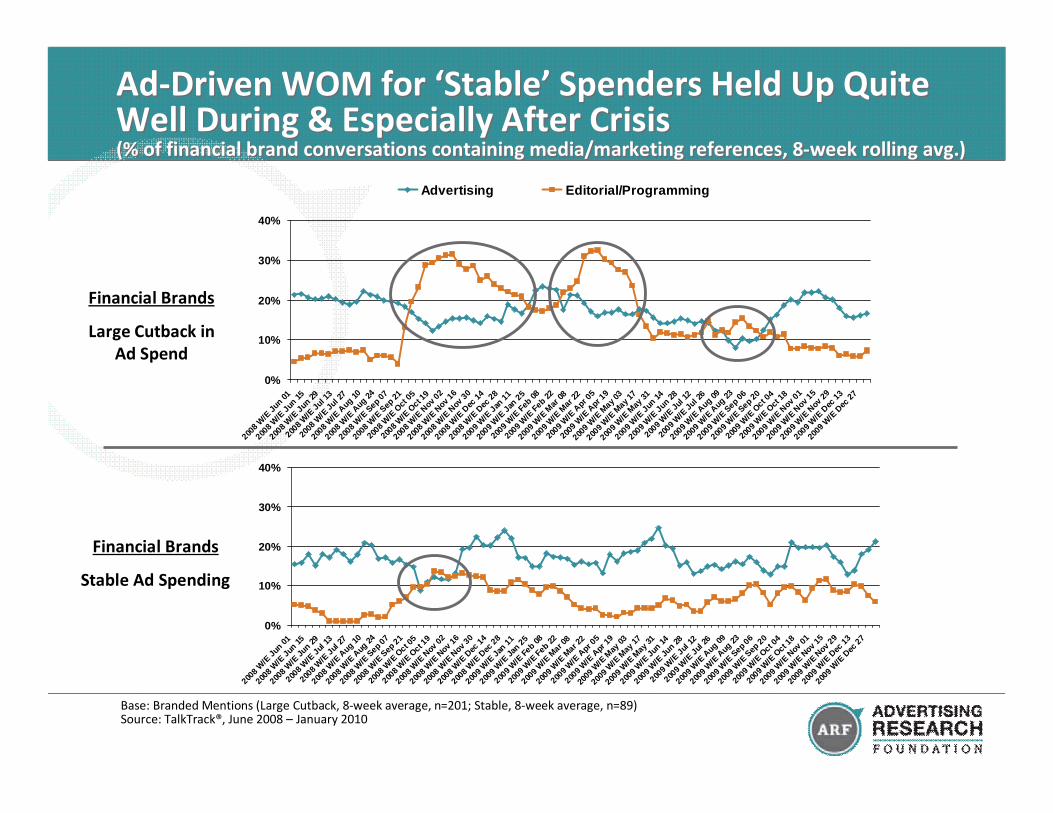
Ad-Driven WOM for ‘Stable’ Spenders Held Up QuiteWell During & Especially After Crisis(% of financial brand conversations containing media/marketing references, 8-week rolling avg.)
Ad-Driven WOM for ‘Stable’ Spenders Held Up QuiteWell During & Especially After Crisis(% of financial brand conversations containing media/marketing references, 8-week rolling avg.)
Financial Brands
Large Cutback inAd Spend
0%
10%
20%
30%
40%
2008
W/E
Jun01
2008
W/E
Jun15
2008
W/E
Jun
29
2008
W/E
Jul13
2008
W/E
Jul27
2008
W/E
Aug
10
2008
W/E
Aug
24
2008
W/E
Sep07
2008
W/E
Sep21
2008
W/E
Oct 05
2008
W/E
Oct 1
9
2008
W/E
Nov
02
2008
W/E
Nov
16
2008
W/E
Nov
30
2008
W/E
Dec
14
2008
W/E
Dec
28
2009
W/E
Jan11
2009
W/E
Jan
25
2009
W/E
Feb
08
2009
W/E
Feb22
2009
W/E
Mar 08
2009
W/E
Mar 22
2009
W/E
Apr 05
2009
W/E
Apr
19
2009
W/E
May
03
2009
W/E
May
17
2009
W/E
May
31
2009
W/E
Jun14
2009
W/E
Jun
28
2009
W/E
Jul12
2009
W/E
Jul26
2009
W/E
Aug
09
2009
W/E
Aug
23
2009
W/E
Sep06
2009
W/E
Sep20
2009
W/E
Oct 04
2009
W/E
Oct 18
2009
W/E
Nov
01
2009
W/E
Nov
15
2009
W/E
Nov
29
2009
W/E
Dec
13
2009
W/E
Dec
27
Financial Brands
Stable Ad Spending
Base: Branded Mentions (Large Cutback, 8-week average, n=201; Stable, 8-week average, n=89)Source: TalkTrack®, June 2008 – January 2010
0%
10%
20%
30%
40%
2008
W/E
Jun
01
2008
W/E
Jun15
2008
W/E
Jun29
2008
W/E
Jul 13
2008
W/E
Jul 27
2008
W/E
Aug
10
2008
W/E
Aug
24
2008
W/E
Sep07
2008
W/E
Sep21
2008
W/E
Oct
05
2008
W/E
Oct 1
9
2008
W/E
Nov
02
2008
W/E
Nov
16
2008
W/E
Nov
30
2008
W/E
Dec
14
2008
W/E
Dec
28
2009
W/E
Jan11
2009
W/E
Jan25
2009
W/E
Feb08
2009
W/E
Feb22
2009
W/E
Mar
08
2009
W/E
Mar 22
2009
W/E
Apr 05
2009
W/E
Apr 19
2009
W/E
May
03
2009
W/E
May
17
2009
W/E
May
31
2009
W/E
Jun14
2009
W/E
Jun28
2009
W/E
Jul12
2009
W/E
Jul 26
2009
W/E
Aug
09
2009
W/E
Aug
23
2009
W/E
Sep06
2009
W/E
Sep20
2009
W/E
Oct 04
2009
W/E
Oct
18
2009
W/E
Nov
01
2009
W/E
Nov
15
2009
W/E
Nov
29
2009
W/E
Dec
13
2009
W/E
Dec
27
Advertising Editorial/Programming
-19%
-18%
-44%
-18%
32%
51%
-15%
-19%
-27%
-16%
50%
55%
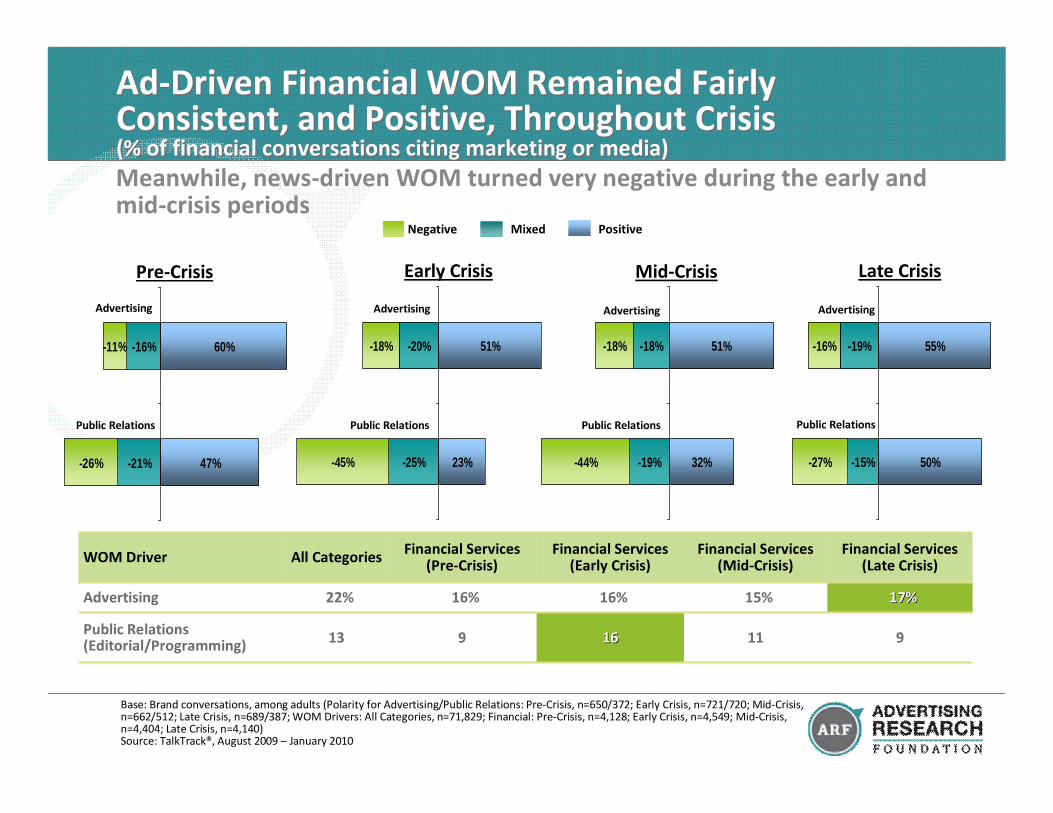
Ad-Driven Financial WOM Remained FairlyConsistent, and Positive, Throughout Crisis(% of financial conversations citing marketing or media)
Ad-Driven Financial WOM Remained FairlyConsistent, and Positive, Throughout Crisis(% of financial conversations citing marketing or media)
Base: Brand conversations, among adults (Polarity for Advertising/Public Relations: Pre-Crisis, n=650/372; Early Crisis, n=721/720; Mid-Crisis,n=662/512; Late Crisis, n=689/387; WOM Drivers: All Categories, n=71,829; Financial: Pre-Crisis, n=4,128; Early Crisis, n=4,549; Mid-Crisis,n=4,404; Late Crisis, n=4,140)Source: TalkTrack®, August 2009 – January 2010
-21%
-16%
-26%
-11%
47%
60%
Pre-Crisis Mid-CrisisEarly Crisis
-25%
-20%
-45%
-18%
23%
51%
MixedNegative Positive
Meanwhile, news-driven WOM turned very negative during the early andmid-crisis periods
Advertising Advertising Advertising
Public Relations Public Relations Public Relations
Late Crisis
Advertising
Public Relations
WOM Driver All CategoriesFinancial Services
(Pre-Crisis)Financial Services
(Early Crisis)Financial Services
(Mid-Crisis)Financial Services
(Late Crisis)
Advertising 22% 16% 16% 15% 17%17%
Public Relations(Editorial/Programming) 13 9 1616 11 9
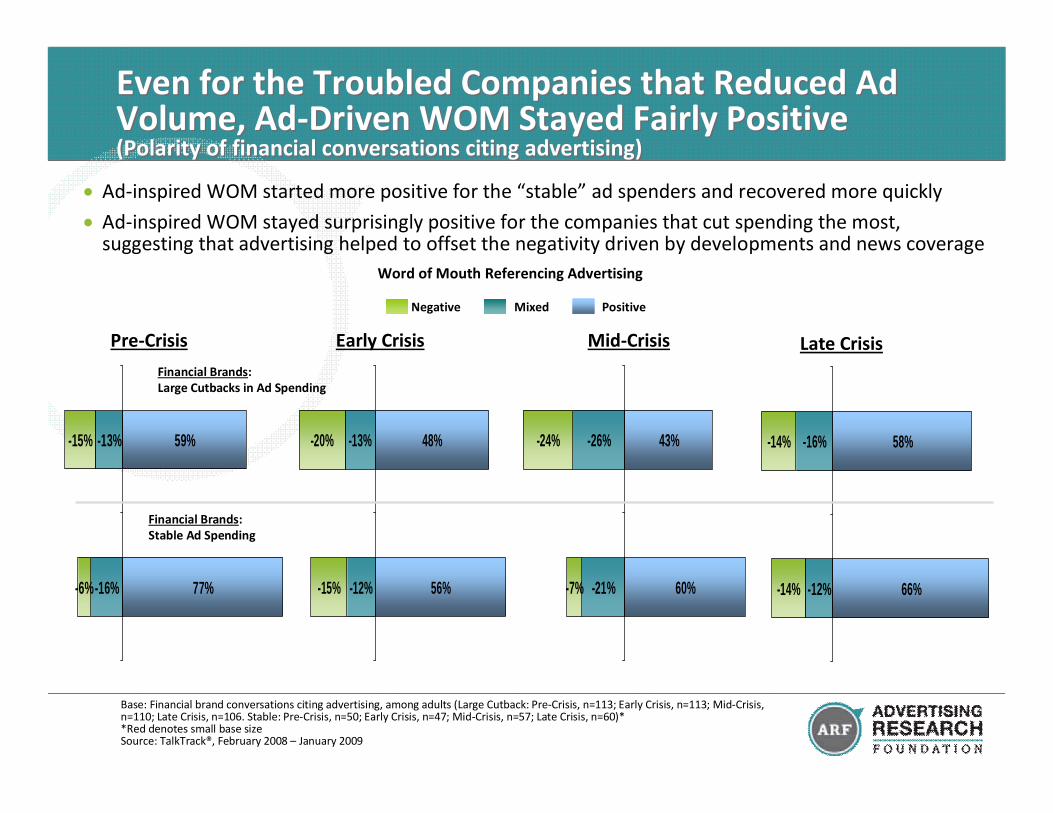
Ad-inspired WOM started more positive for the “stable” ad spenders and recovered more quickly
Ad-inspired WOM stayed surprisingly positive for the companies that cut spending the most,suggesting that advertising helped to offset the negativity driven by developments and news coverage
-21%
-26%
-7%
-24%
60%
43%
-12%
-16%
-14%
-14%
66%
58%
Even for the Troubled Companies that Reduced AdVolume, Ad-Driven WOM Stayed Fairly Positive(Polarity of financial conversations citing advertising)
Even for the Troubled Companies that Reduced AdVolume, Ad-Driven WOM Stayed Fairly Positive(Polarity of financial conversations citing advertising)
Base: Financial brand conversations citing advertising, among adults (Large Cutback: Pre-Crisis, n=113; Early Crisis, n=113; Mid-Crisis,n=110; Late Crisis, n=106. Stable: Pre-Crisis, n=50; Early Crisis, n=47; Mid-Crisis, n=57; Late Crisis, n=60)**Red denotes small base sizeSource: TalkTrack®, February 2008 – January 2009
-16%
-13%
-6%
-15%
77%
59%
Pre-Crisis Mid-CrisisEarly Crisis
-12%
-13%
-15%
-20%
56%
48%
MixedNegative Positive
Financial Brands:Large Cutbacks in Ad Spending
Financial Brands:Stable Ad Spending
Late Crisis
Word of Mouth Referencing Advertising
Automotive Brands
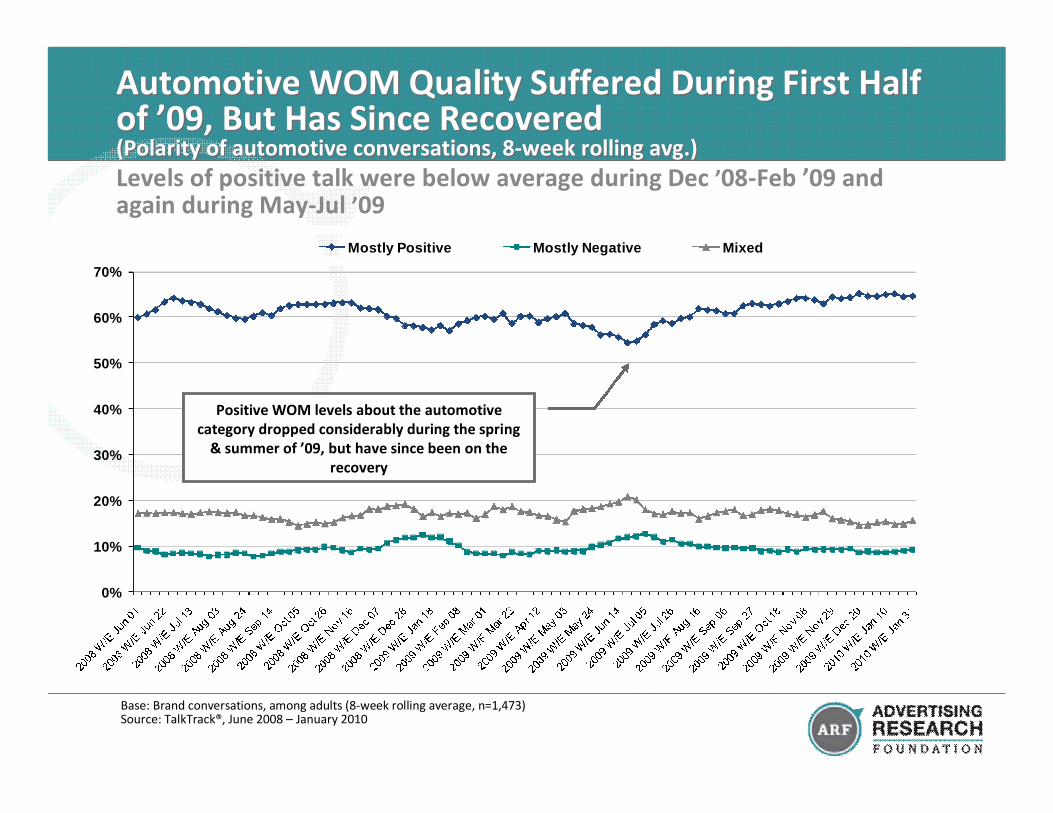
Automotive WOM Quality Suffered During First Halfof ’09, But Has Since Recovered(Polarity of automotive conversations, 8-week rolling avg.)
Automotive WOM Quality Suffered During First Halfof ’09, But Has Since Recovered(Polarity of automotive conversations, 8-week rolling avg.)
Base: Brand conversations, among adults (8-week rolling average, n=1,473)Source: TalkTrack®, June 2008 – January 2010
Levels of positive talk were below average during Dec ’08-Feb ’09 andagain during May-Jul ’09
0%
10%
20%
30%
40%
50%
60%
70%
Mostly Positive Mostly Negative Mixed
Positive WOM levels about the automotivecategory dropped considerably during the spring
& summer of ’09, but have since been on therecovery
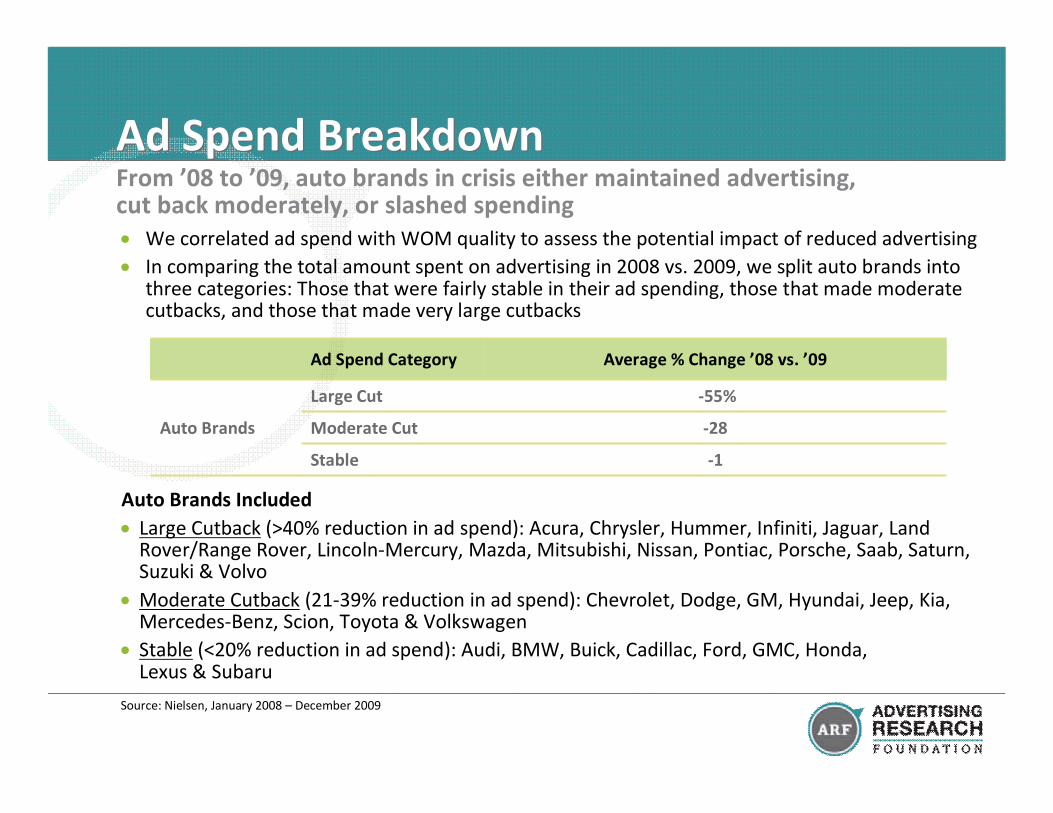
Ad Spend Category Average % Change ’08 vs. ’09
Auto Brands
Large Cut -55%
Moderate Cut -28
Stable -1
Ad Spend BreakdownAd Spend Breakdown
Source: Nielsen, January 2008 – December 2009
Auto Brands Included
Large Cutback (>40% reduction in ad spend): Acura, Chrysler, Hummer, Infiniti, Jaguar, LandRover/Range Rover, Lincoln-Mercury, Mazda, Mitsubishi, Nissan, Pontiac, Porsche, Saab, Saturn,Suzuki & Volvo
Moderate Cutback (21-39% reduction in ad spend): Chevrolet, Dodge, GM, Hyundai, Jeep, Kia,Mercedes-Benz, Scion, Toyota & Volkswagen
Stable (<20% reduction in ad spend): Audi, BMW, Buick, Cadillac, Ford, GMC, Honda,Lexus & Subaru
We correlated ad spend with WOM quality to assess the potential impact of reduced advertising
In comparing the total amount spent on advertising in 2008 vs. 2009, we split auto brands intothree categories: Those that were fairly stable in their ad spending, those that made moderatecutbacks, and those that made very large cutbacks
From ’08 to ’09, auto brands in crisis either maintained advertising,cut back moderately, or slashed spending
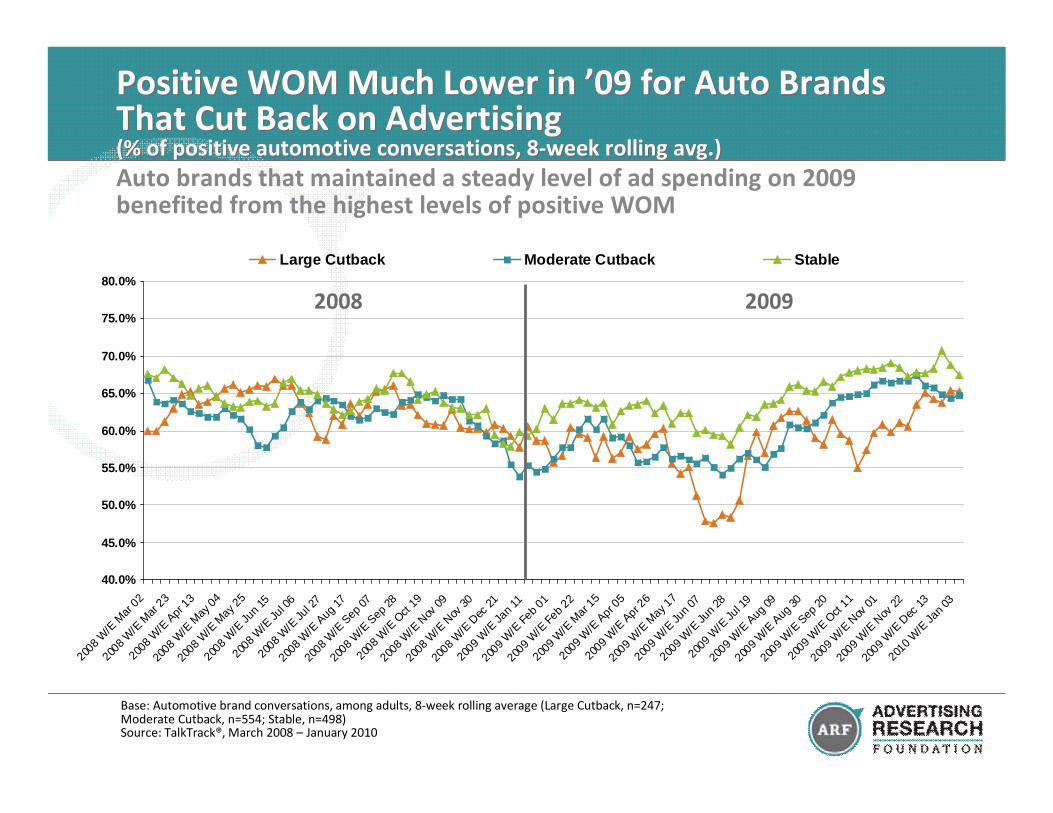
Auto brands that maintained a steady level of ad spending on 2009benefited from the highest levels of positive WOM
Positive WOM Much Lower in ’09 for Auto BrandsThat Cut Back on Advertising(% of positive automotive conversations, 8-week rolling avg.)
Positive WOM Much Lower in ’09 for Auto BrandsThat Cut Back on Advertising(% of positive automotive conversations, 8-week rolling avg.)
40.0%
45.0%
50.0%
55.0%
60.0%
65.0%
70.0%
75.0%
80.0%
2008
W/E
Mar
02
2008
W/E
Mar
23
2008
W/E
Apr13
2008
W/E
May
04
2008
W/E
May
25
2008
W/E
Jun
15
2008
W/E
Jul 0
6
2008
W/E
Jul 2
7
2008
W/E
Aug17
2008
W/E
Sep07
2008
W/E
Sep28
2008
W/E
Oct
19
2008
W/E
Nov
09
2008
W/E
Nov
30
2008
W/E
Dec
21
2009
W/E
Jan
11
2009
W/E
Feb
01
2009
W/E
Feb
22
2009
W/E
Mar 1
5
2009
W/E
Apr 05
2009
W/E
Apr 26
2009
W/E
May
17
2009
W/E
Jun
07
2009
W/E
Jun
28
2009
W/E
Jul 1
9
2009
W/E
Aug09
2009
W/E
Aug30
2009
W/E
Sep20
2009
W/E
Oct
11
2009
W/E
Nov
01
2009
W/E
Nov
22
2009
W/E
Dec
13
2010
W/E
Jan
03
Large Cutback Moderate Cutback Stable
Base: Automotive brand conversations, among adults, 8-week rolling average (Large Cutback, n=247;Moderate Cutback, n=554; Stable, n=498)Source: TalkTrack®, March 2008 – January 2010
2008 2009
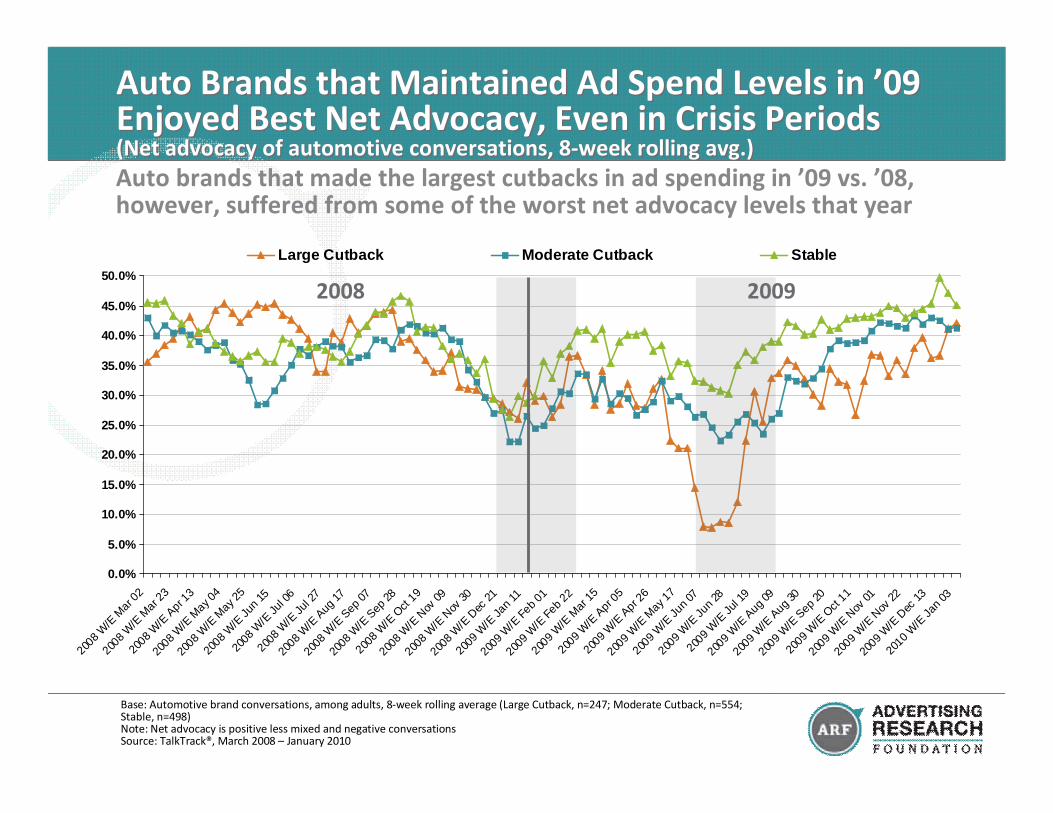
Auto brands that made the largest cutbacks in ad spending in ’09 vs. ’08,however, suffered from some of the worst net advocacy levels that year
Auto Brands that Maintained Ad Spend Levels in ’09Enjoyed Best Net Advocacy, Even in Crisis Periods(Net advocacy of automotive conversations, 8-week rolling avg.)
Auto Brands that Maintained Ad Spend Levels in ’09Enjoyed Best Net Advocacy, Even in Crisis Periods(Net advocacy of automotive conversations, 8-week rolling avg.)
0.0%
5.0%
10.0%
15.0%
20.0%
25.0%
30.0%
35.0%
40.0%
45.0%
50.0%
2008
W/E
Mar 0
2
2008
W/E
Mar 2
3
2008
W/E
Apr 13
2008
W/E
May
04
2008
W/E
May
25
2008
W/E
Jun
15
2008
W/E
Jul 0
6
2008
W/E
Jul 2
7
2008
W/E
Aug17
2008
W/E
Sep07
2008
W/E
Sep28
2008
W/E
Oct
19
2008
W/E
Nov
09
2008
W/E
Nov
30
2008
W/E
Dec
21
2009
W/E
Jan
11
2009
W/E
Feb
01
2009
W/E
Feb
22
2009
W/E
Mar
15
2009
W/E
Apr 05
2009
W/E
Apr 26
2009
W/E
May
17
2009
W/E
Jun
07
2009
W/E
Jun
28
2009
W/E
Jul 1
9
2009
W/E
Aug09
2009
W/E
Aug30
2009
W/E
Sep20
2009
W/E
Oct
11
2009
W/E
Nov
01
2009
W/E
Nov
22
2009
W/E
Dec
13
2010
W/E
Jan
03
Large Cutback Moderate Cutback Stable
2008 2009
Base: Automotive brand conversations, among adults, 8-week rolling average (Large Cutback, n=247; Moderate Cutback, n=554;Stable, n=498)Note: Net advocacy is positive less mixed and negative conversationsSource: TalkTrack®, March 2008 – January 2010
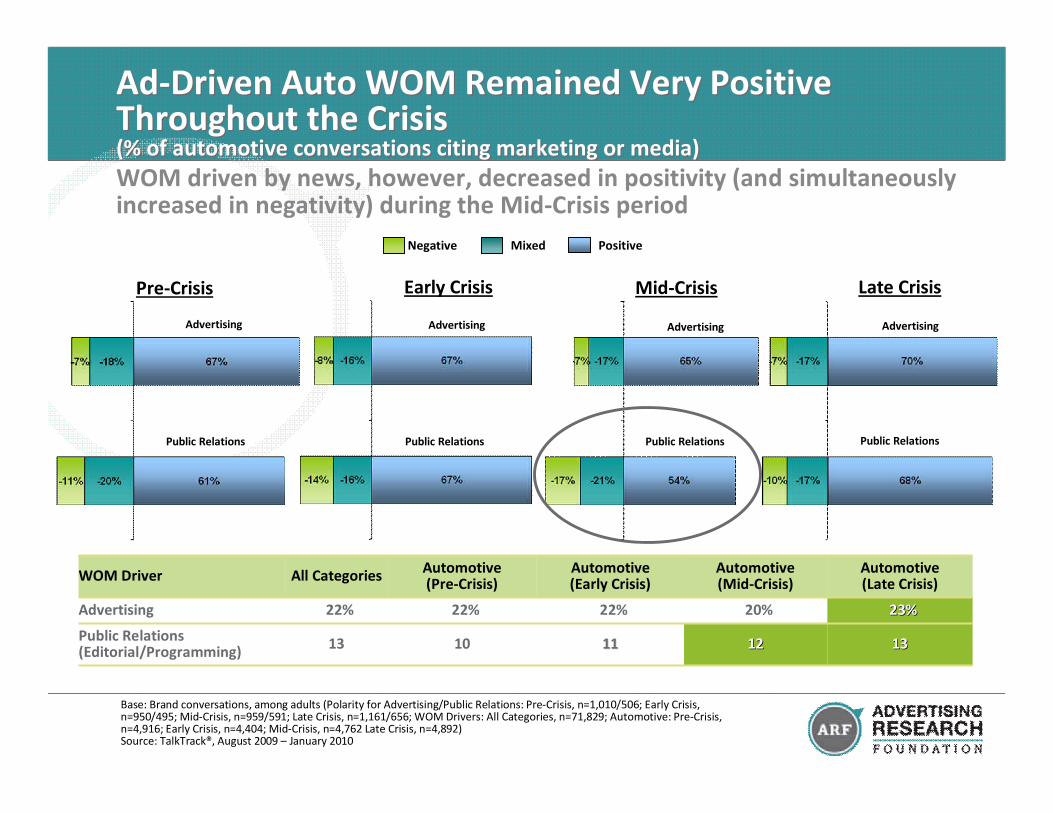
Ad-Driven Auto WOM Remained Very PositiveThroughout the Crisis(% of automotive conversations citing marketing or media)
Ad-Driven Auto WOM Remained Very PositiveThroughout the Crisis(% of automotive conversations citing marketing or media)
Base: Brand conversations, among adults (Polarity for Advertising/Public Relations: Pre-Crisis, n=1,010/506; Early Crisis,n=950/495; Mid-Crisis, n=959/591; Late Crisis, n=1,161/656; WOM Drivers: All Categories, n=71,829; Automotive: Pre-Crisis,n=4,916; Early Crisis, n=4,404; Mid-Crisis, n=4,762 Late Crisis, n=4,892)Source: TalkTrack®, August 2009 – January 2010
Pre-Crisis Mid-CrisisEarly Crisis
MixedNegative Positive
WOM driven by news, however, decreased in positivity (and simultaneouslyincreased in negativity) during the Mid-Crisis period
Advertising Advertising Advertising
Public Relations Public Relations Public Relations
Late Crisis
Advertising
Public Relations
WOM Driver All Categories Automotive(Pre-Crisis)
Automotive(Early Crisis)
Automotive(Mid-Crisis)
Automotive(Late Crisis)
Advertising 22% 22% 22% 20% 23%23%
Public Relations(Editorial/Programming)
13 10 1111 1212 1313
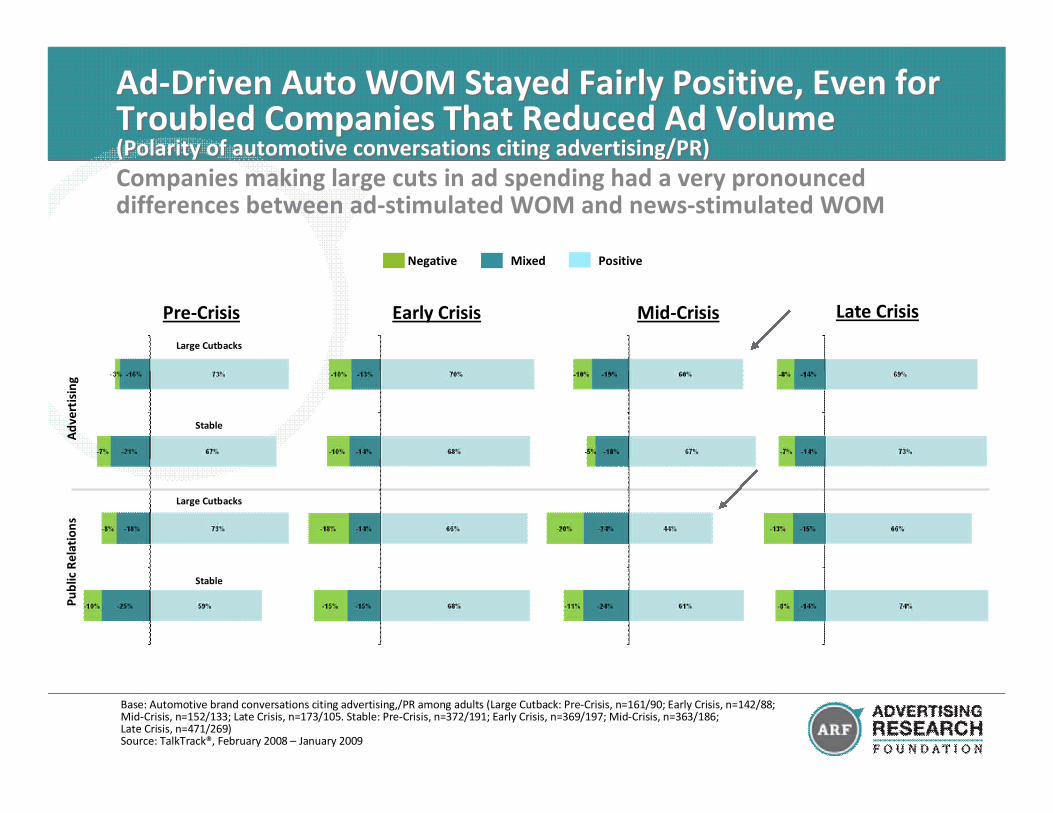
Ad-Driven Auto WOM Stayed Fairly Positive, Even forTroubled Companies That Reduced Ad Volume(Polarity of automotive conversations citing advertising/PR)
Ad-Driven Auto WOM Stayed Fairly Positive, Even forTroubled Companies That Reduced Ad Volume(Polarity of automotive conversations citing advertising/PR)
Base: Automotive brand conversations citing advertising,/PR among adults (Large Cutback: Pre-Crisis, n=161/90; Early Crisis, n=142/88;Mid-Crisis, n=152/133; Late Crisis, n=173/105. Stable: Pre-Crisis, n=372/191; Early Crisis, n=369/197; Mid-Crisis, n=363/186;Late Crisis, n=471/269)Source: TalkTrack®, February 2008 – January 2009
Pre-Crisis Mid-CrisisEarly Crisis
MixedNegative Positive
Large Cutbacks
Late Crisis
Ad
vert
isin
gP
ub
licR
ela
tio
ns
Stable
Large Cutbacks
Stable
Companies making large cuts in ad spending had a very pronounceddifferences between ad-stimulated WOM and news-stimulated WOM
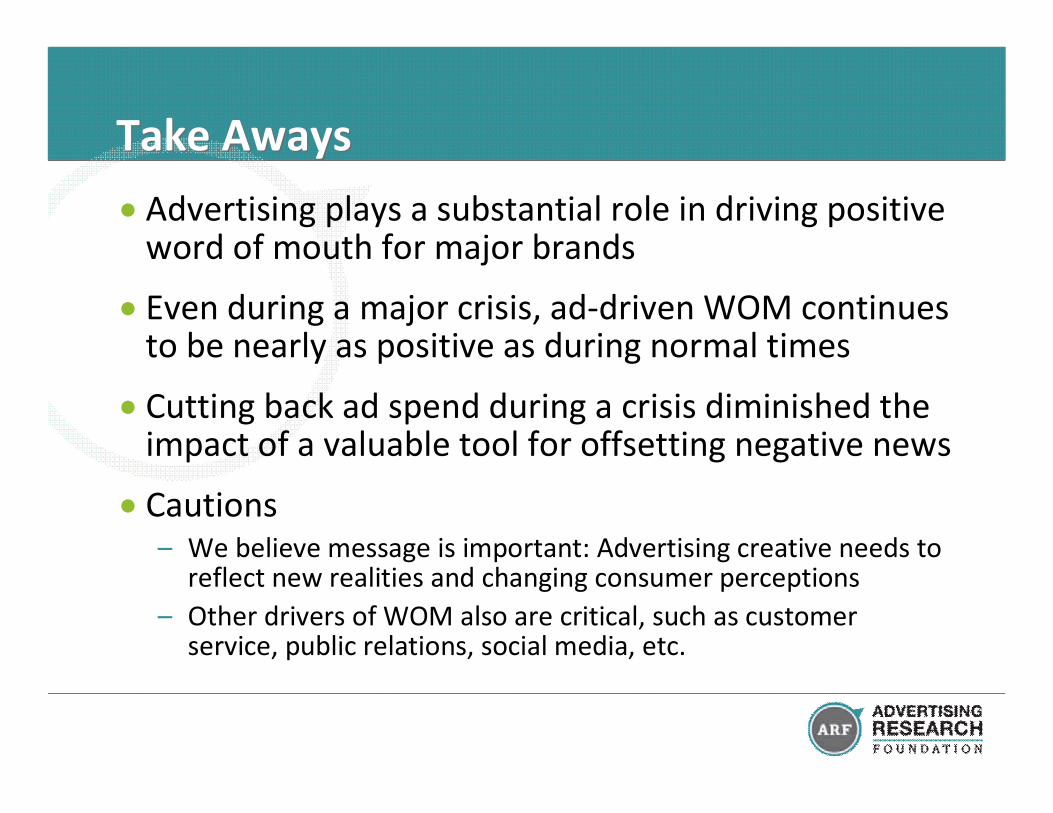
Take AwaysTake Aways
Advertising plays a substantial role in driving positiveword of mouth for major brands
Even during a major crisis, ad-driven WOM continuesto be nearly as positive as during normal times
Cutting back ad spend during a crisis diminished theimpact of a valuable tool for offsetting negative news
Cautions– We believe message is important: Advertising creative needs to
reflect new realities and changing consumer perceptions
– Other drivers of WOM also are critical, such as customerservice, public relations, social media, etc.
TalkTrack® MethodologyTalkTrack® Methodology
Data collected through an online survey– Sample drawn from largest online consumer panels
– Demographically balanced to Census for ages 13-69
Conversations counted with assistance of24-hour diary
– Respondents recruited to take notes on conversations in 15 marketingcategories over next 24 hours
– Re-contacted a day later to answer standardized questions aboutbrands/companies talked about
Sample sizes support time series analysis– 700 respondents per week; 36,000 per year
– Yield 7,000 conversational brand mentions weekly;
– ~ 350,000 per year