Adverse Events and Medical Errorsmed.fsu.edu/uploads/files/Presentation.pdfabnormal laboratory test...
77
Adverse Events and Medical Errors Dennis Tsilimingras, M.D., M.P.H. Director, Center on Patient Safety Assistant Professor of Family Medicine & Rural Health The Florida State University College of Medicine
-
Upload
truongdung -
Category
Documents
-
view
217 -
download
0
Transcript of Adverse Events and Medical Errorsmed.fsu.edu/uploads/files/Presentation.pdfabnormal laboratory test...

Adverse Events and Medical Errors
Dennis Tsilimingras, M.D., M.P.H.Director, Center on Patient Safety
Assistant Professor of Family Medicine & Rural HealthThe Florida State University College of Medicine

Objectives(1) To become familiar with common patient safety definitions.(2) To become familiar with the theory for the occurrence of
adverse events/medical errors in the healthcare system.(3) To become familiar with major inpatient studies and reports
on adverse events/medical errors.(4) To become familiar with major postdischarge studies on
adverse events/medical errors.(5) To become familiar with the common types of adverse
events.(6) To become familiar with recommendation that may prevent
adverse events/medical errors in the healthcare system.

Outline
• Patient safety definitions• Discontinuities in care (theory for the occurrence of
adverse events/medical errors)• Major inpatient adverse event/medical error studies • Common types of inpatient adverse events/medical errors• Institute of Medicine and AHRQ reports on patient safety• Post-discharge adverse event studies• Common types of postdischarge adverse events• Diagnostic errors/mis-diagnoses• Clinical scenarios of inpatient and post-discharge adverse
events/medical errors• Recommendations for improvement• Conclusions

Patient Safety Definitions
• Medical error, defined as the failure of a planned action to be completed as intended or the use of a wrong plan to achieve an aim.
• Adverse event, defined as an injury caused by medical management rather than by the underlying disease or condition of the patient.
• Preventable adverse event, defined as an adverse event injury that could have been avoided as a result of an error or system design flaw.

Patient Safety Definitions• Ameliorable adverse event, defined as an injury
whose severity could have been substantially reduced if different actions or procedures had been performed or followed.
• Negligence, defined as whether the care provided failed to meet the standard of care reasonably expected of an average physician qualified to take care of the patient in question.
• Error of omission, occurs when a necessary procedure or intervention failed to be performed leading to morbidity or mortality to the patient involved.

Patient Safety Definitions
• Most medical errors do not result in medical injury, though some do, and these are termed preventable adverse events.
• Many adverse events are neither preventable nor ameliorable.

Medical Errors
Potential Adverse Events
Adverse Events
Preventable or Ameliorable Adverse Events
Non-preventable, Non-ameliorable Adverse Events
Figure 1: Relationship between medical errors, potential adverse events, and adverse events.
Miller MR, et al. Medication errors in pediatric care: a systematic review of epidemiology and an evaluation of evidence supporting reduction strategy recommendations. Qual Saf Health Care. 2007;16:116-126.
Errors that have the potential to
cause harm
Errors that did not cause harm and have no potential to cause harm

Patient Safety Definitions
• For example, an unavoidable adverse event can occur from an unknown drug reaction in a patient who received the appropriate administration of a particular drug for the first time.
• However, if a drug reaction occurred in a patient who knowingly had a previous allergic reaction to that particular drug, the adverse event would be considered preventable, and might be considered negligent.

The patient developed a hoarse voice afterbeing discharged with a prescription for aninhaled steroid. The patient did not recallbeing taught about gargling or rinsing afterusing the inhaled steroid.
This scenario describes:
1 2 3
30%
20%
50%
1. Adverse Event2. Error of omission3. Medical error

A patient with no known drug allergies has an allergic reaction to a drug administered.
This scenario describes:
1 2 3
6%
81%
13%
1. A preventable adverse event2. An ameliorable adverse event3. An unavoidable adverse event

A diabetic patient had the wrong foot amputated.
This scenario describes:
1 2 3
89%
2%9%
1. Preventable adverse event2. Ameliorable adverse event3. Unavoidable adverse event

Most medical errors result in medical injury.
1 2
98%
2%
1. True2. False

Discontinuities in Care
• Discontinuities or gaps in care (the theory for the occurrence of adverse events/medical errors):
-occur in complex systems, such as the healthcaresystem, that involves the interaction of numeroushealth professionals.-health professionals are faced with the responsibilityto deliver optimal care within a limited time frame, tofocus on cost-saving efforts, and to develop new skills and judgment abilities for advances in medical knowledge and technology.

Discontinuities in Care-all of these factors create pressures for healthcare professionals to efficiently deliver care and are majorcontributors in raising the level of risk for medicalerrors and adverse events.-such complexity within a system increases the potential for error when multiple and expedient hand-offs are necessary throughout the system.-during hand-offs is when the system is mostvulnerable for gaps that result between multipletasks along the continuum of care.

Figure 2: Conceptual Model for the Occurrence ofMedical Errors/Adverse Events
___________________________________________
[ Discontinuities in Care ]
[ Hand-Offs ]
and/or
NumerousProfessionals
Poor InformationTransfer
Faulty Communication
During a Hospitalization
After Hospital DischargeAmbulatory Care
Medical ErrorsAdverse events

Discontinuities in Care-Discontinuities in care arise mainly from poor information transfer and faulty communicationthat often take place:
(1) between inpatient and outpatient pharmacies(increased risk of overmedication & harmful druginteractions).
(2) as a result of unstructured cross-coveragephysician sign-outs (patient’s medical condition,laboratory data, resuscitation status, problem list,medication allergies, and follow-ups).

Discontinuities in Care(3) as a result of unstructured physician discharge
summaries (invite inaccuracies & significantdelays in transmitting pertinent info to outpatient providers; structured, database-generateddischarge summaries).
(4) inadequate discharge planning process (early homereturn, assessment of plans & needs for dischargeby a nurse at admission, and early involvement of asocial worker & home nurse if indicated).
(5) inadequate patient notification and follow-up ofabnormal laboratory test results.
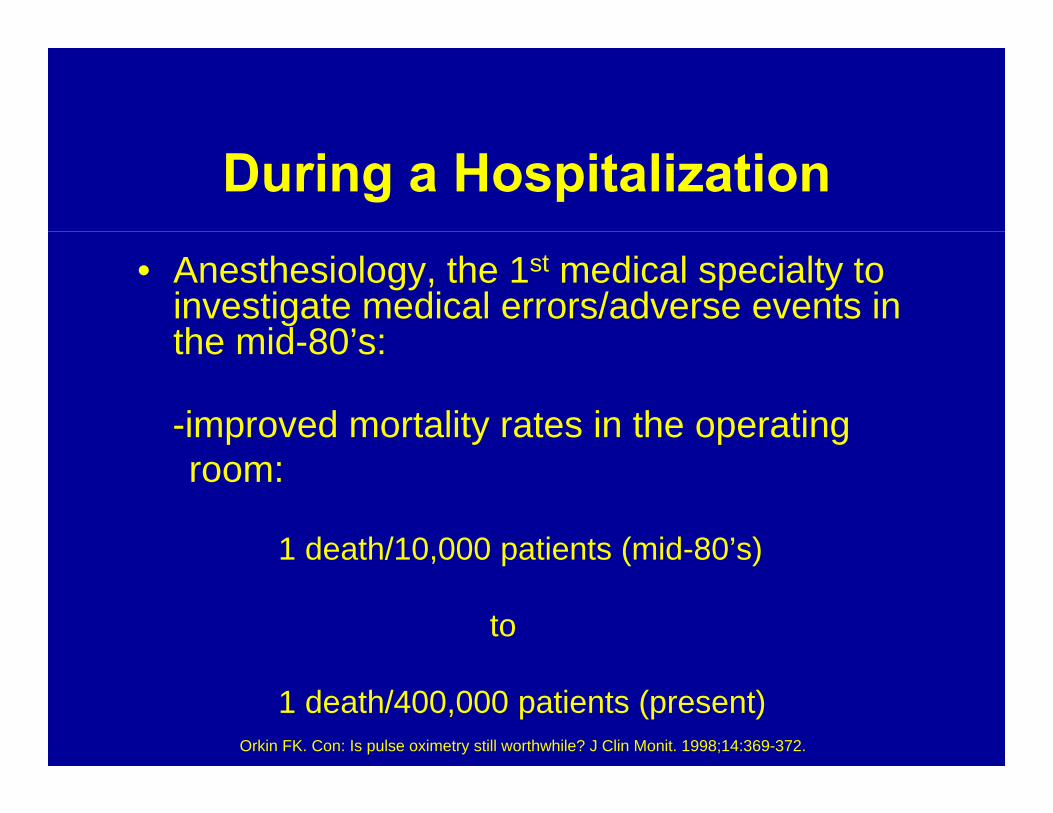
During a Hospitalization• Anesthesiology, the 1st medical specialty to
investigate medical errors/adverse events in the mid-80’s:
-improved mortality rates in the operatingroom:
1 death/10,000 patients (mid-80’s)
to
1 death/400,000 patients (present)Orkin FK. Con: Is pulse oximetry still worthwhile? J Clin Monit. 1998;14:369-372.

During a Hospitalization(Adults)
• Harvard Medical Practice Study (NEJM 1991):
-landmark study on medical errors/adverse events.-fueled the 1st Institute of Medicine report on patient safety, “To Err Is Human”. -1st patient safety study to randomly select a large numberof records involving many institutions and develop morecurrent and more reliable estimates for the incidence ofadverse events and negligence. -sampled 30,000 patients from 51 institutions in New YorkState using 1984 data.

During a Hospitalization
Results of the Harvard Medical Practice Study:-adverse events related to treatment occurred in 3.7%of patients with 27.6% of those involving negligence.-over 70% of adverse events contributed to disability lasting less than 6-months, with 2.6% resulting in permanent disability, and 13.6% leading to death.

During a Hospitalization
(continued):-patients aged 65 years and older accounted for 27% ofthe hospitalized population but 43% of all adverseevents.-patients aged 65 years and older had a two-fold risk fordeveloping adverse events when compared to individualsbetween 16 and 44 years.

Table 1: Rates of Adverse Events and Negligence amongClinical-Specialty Groups in New York State (1984)
Specialty Rate of Adverse Events(%) Rate of Negligence(%)
Orthopedics 4.1 22.4Urology 4.9 19.4Neurosurgery 9.9 35.6Thoracic and cardiac surgery 10.8 23.0Vascular surgery 16.1 18.0 Obstetrics 1.5 38.3Neonatology 0.6 25.8General surgery 7.0 28.0 General Medicine 3.6 30.9
P value <0.001 0.64
Brennan TA, et al. Incidence of adverse events and negligence in hospitalized patients: results of the Harvard Medical Practice Study I. N Engl J Med. 1991;324:370-6.

Table 2: Types of Adverse Events and Proportion of Events Involving Negligence in New York State (1984)
Type of Event In Population(%) Due to Negligence(%) With Serious Disability(%)
OperativeWound infection 13.6 12.5 17.9Technical complication 12.9 17.6 12.0 Late complication 10.6 13.6 35.7Non-technical complication 7.0 20.1 43.8Surgical Failure 3.6 36.4 17.5
Non-operativeDrug-related 19.4 17.7 14.1Diagnostic mishap 8.1 75.2 47.0Therapeutic mishap 7.5 76.8 35.0Procedure-related 7.0 15.1 28.8Fall 2.7 -- --Fractures 1.2 -- --Postpartum 1.1 -- --Anesthesia-related 1.1 -- --Neonatal 0.9 -- --
P value <0.01
Leape LL, et al. The nature of adverse events in hospitalized patients: results of the Harvard Medical Practice Study II. N Engl J Med. 1991;324:377-84.

Table 3: Drug-Related Adverse Events, According to Class of Drug Involved in New York State (1984)
Drug Class Adverse Events (%)Antibiotic 16.2Anti-tumor 15.5Anticoagulant 11.2Cardiovascular 8.5Anti-seizure 8.1 Diabetes 5.5Antihypertensive 5.0Analgesic 3.5Anti-asthmatic 2.8 Sedative or hypnotic 2.3 Antidepressant 0.9Antipsychotic 0.7Peptic ulcer 0.5
Leape LL, et al. The nature of adverse events in hospitalized patients: results of the Harvard Medical Practice Study II.N Engl J Med. 1991;324:377-84.

Table 4: Sites of Care that Resulted in Adverse Events in New YorkState (1984)
Site of Care In Sample(%) Due to Negligence(%) With Serious Disability(%)
In hospitalOperating room 41.0 13.7 22.0 Patient’s room 26.5 41.1 30.4Emergency room 2.9 70.4 24.8 Labor and delivery room 2.8 27.7 9.8 Intensive care unit 2.7 30.2 50.4Radiology 2.0 36.9 35.4Cardiac catheterization laboratory 0.9 -- --Ambulatory care unit 0.8 -- --
Outside hospitalPhysician’s office 7.7 31.2 21.0Home 2.7 11.4 8.2 Ambulatory care unit 1.4 53.6 13.7Nursing home 0.9 -- --
P value <0.01
Leape LL, et al. The nature of adverse events in hospitalized patients: results of the Harvard Medical Practice Study II. N Engl J Med. 1991;324:377-84.

During a Hospitalization• Utah and Colorado Medical Practice Study
(Med Care 2000):
-2nd medical practice study to randomly select a large number of records involving many institutions and develop more current and more reliable estimates for the incidence of adverse events and negligence.
-sampled 15,000 hospitalized patients in 1992. -adverse events related to treatment occurred in 2.9% of patients.-overall results were similar to those of the Harvard Medical Practice Study.

During a Hospitalization
• The 1st Institute of Medicine Report on Patient Safety, “To Err is Human” (2000):
-estimated 44,000-98,000 deaths, with 1 million injuries, from medical errors annually in US hospitals based on the Harvard and Utah/Colorado Medical Practice Studies. -annual cost estimated between $17 and $29 billion in 1996. -set forth a national agenda to reduce errors and improve the quality of care.-stimulated national initiatives from governmental, business, and medical leaders to reduce errors.

During a Hospitalization• The 2nd Institute of Medicine Report on
Patient Safety, “Crossing the Quality Chasm” (2001):
-highlighted quality-related issues by providing strategies to redesign the current health care system.
-emphasized the use of existing medical knowledge and information technology by clinicians to properly care for their patients.

During a Hospitalization
• Hospital Patient Safety Indicators (PSIs) (AHRQ Report 2002):
-developed by the Stanford U – UCSF Evidence BasedPractice Center for AHRQ. -purpose to screen for potential inhospital safety problems(surgical complications and some medical care) using acomputerized algorithm involving ICD-9-CM codes.-resulted from a 4-step process: literature review, evaluation of candidate PSIs by clinical panels, consultation with coding experts, and empirical analyses of candidate PSIs.

During a Hospitalization
Accepted AHRQ Hospital PSIs:(1) Complications of Anesthesia (2) Death in low mortality DRGs(3) Decubitus ulcer(4) Failure to rescue(5) Foreign body left during procedure(6) Iatrogenic pneumothorax(7) Infection due to medical care(8) Accidental puncture or laceration

During a Hospitalization
(continued):(9) Postoperative hip fracture
(10) Postoperative hemorrhage or hematoma(11) Postoperative physiologic and metabolic derangements(12) Postoperative respiratory failure(13) Postoperative PE or DVT(14) Postoperative sepsis(15) Postoperative wound dehiscence(16) Transfusion reaction

During a Hospitalization
(1) Postoperative PE or DVT:definition and numerator = discharges with ICD-9-CM codes for PE or DVT in any secondarydiagnosis field per 1000 surgical discharges.denominator = includes all surgical discharges; excludes pts with a principal diagnosis of DVT; excludes all obstetric admissions; and excludes ptswith secondary procedure codes for PE, when PEprocedures occur on the day of or previous to theday of the principle procedure.
During a Hospitalization
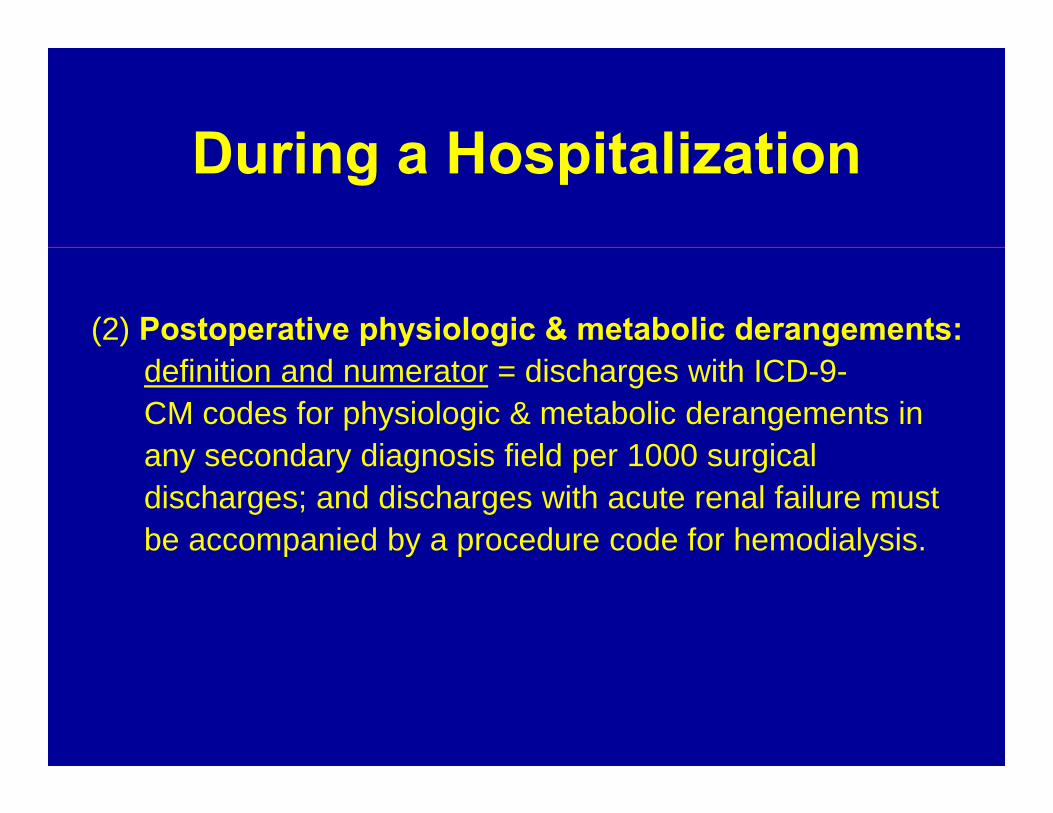
(2) Postoperative physiologic & metabolic derangements:definition and numerator = discharges with ICD-9-CM codes for physiologic & metabolic derangements in any secondary diagnosis field per 1000 surgical discharges; and discharges with acute renal failure must be accompanied by a procedure code for hemodialysis.

During a Hospitalization
(continued):denominator = include all elective surgical discharges; exclude pts with both a diagnosis code of ketoacidosis, hyperosmolarity, or other coma, and principle diagnosisof diabetes mellitus; exclude pts with both a secondary diagnosis code for acute renal failure and a principal diagnosis of acute MI, cardiac arrhythmia, cardiac arrest, shock, hemorrhage or GI hemorrhage; and exclude all obstetric admissions.

During a Hospitalization
(3) Failure to rescue:definition and numerator = all discharges withdisposition of “deceased” per 1000 population at risk.denominator = include discharges with potential complications of care listed in failure to rescue definition (e.g., pneumonia, PE/DVT, sepsis, acuterenal failure, shock/cardiac arrest, or GI hemorrhage/acute ulcer); and exclude pts transferred to an acute care facility, transferred from an acute care facility, or admitted from a long-term care facility.

Patient Safety Indicator
Table 5: Rates of Patient Safety Indicator (PSI) Events in VA Data (FY 2001) (n=430,552)*
Numerator Denominator UnadjustedRisk-
Adjusted†HCUP-NIS
2000¶Medicare
2000║
Note: All rates are reported per 1000 discharges at risk using Patient Safety Indicator software, Version 2.1, Revision 1. (Revision 2 was recently released. Preliminary results suggest that only rates for postoperative hip fracture and postoperative pulmonary embolism or changed noticeably- both decreased.)
*Rates are calculated based on 430,552 acute care hospitalizations using the VA Health Economics Resource Center’s (HERC) definitions of acute and non-acute bedsections.
†Adjusted for age, sex, age-sex interactions, modified DRGs, and modified comorbidities (reference population is Healthcare Cost and Utilization Project State Inpatient Database (HCUP-SID 2000)).
‡VA risk-adjusted rates are significantly higher based on 95% confidence intervals.§VA risk-adjusted rates are significantly lower basde on 95% confidence intervals.¶National Healthcare Quality Report 2003 (all rates are risk-adjusted as above except for “transfusion reaction”).║Report to the Congress: Medicare Payment Policy 2004 (all rates are risk-adjusted as above). PSIs #1,5, and 16 were not calculated due to infrequent events.Rosen AK, et al. Evaluating the Patient Safety Indicators: How Well Do They Perform on Veterans Health Administration Data? Med Care. 2005;43:873-884.
PSI #
55178
32073316
73469817
81315
77107
1262106129
12163
Complications of anesthesiaDeath in low mortality DRGsDecubitus ulcerFailure to rescueForeign body left in during procedureIatrogenic pneumothoraxInfection due to medical carePostoperative hip fracturePostoperative hemorrhage or hematomaPostop physiologic & metabolic derangementsPostoperative respiratory failurePostoperative pulmonary embolism or DVTPostoperative sepsisPostoperative wound dehiscenceTechnical difficulty with procedureTransfusion reaction
97,48255,079
208,09721,318
430,536402,185345,44271,05397,47940,78831,20797,23117,28320,115
430,524430,536
0.563.23
15.41155.55
0.171.172.371.143.231.893.43
13.006.136.412.82
0.007
.0591.99
18.36156.16
0.171.201.861.332.901.812.00
10.626.624.493.82
-
0.720.42
21.56148.40
0.090.702.010.822.241.143.668.96
11.262.063.40
0.0040
-3.10
29.70165.20
-1.102.801.802.601.307.50
12.0012.70
3.703.20
-
123456789
10111213141516
§
§
§
§
§
‡
§
§
§
‡
‡
§
‡
‡
§
‡
‡
§
‡
§
‡

Figure 3: Comparison of Median Length of Stay (Days) for Hospitalizations with PSI Events Versus Hospitalizations without
PSI Events in the VA (FY 2001)
30
8
24
6
23
4
20
5
0
5
10
15
20
25
30
35PSI
No PSI
PostoperativeWound
DehiscenceP<0.0001
PostoperativeSepsis
P<0.0001
PostoperativeRespiratory
FailureP<0.0001
PostoperativePhysiologic and
Metabolic Derangements
P<0.0001Rosen AK, et al. Evaluating the Patient Safety Indicators: How Well Do They Perform on Veterans Health Administration Data? Med Care. 2005;43:873-884.

Figure 4: Comparison of In-Hospital Mortality (Deaths per 1000) for Hospitalizations with PSI Events Versus
Hospitalizations without PSI Events in the VA (FY 2001)456
11
368
11
300
7.2
225
53
0
100
200
300
400
500PSI
No PSI
PostoperativePhysiologic
and MetabolicDerangements
P<0.0001
PostoperativeSepsis
P<0.0001
PostoperativeRespiratory
FailureP<0.0001
PostoperativeWound
DehiscenceP<0.0001
Rosen AK, et al. Evaluating the Patient Safety Indicators: How Well Do They Perform on Veterans Health Administration Data? Med Care. 2005;43:873-884.

Figure 5: Comparison of Median Estimated Cost (Thousands of Dollars) for Hospitalizations with PSI Events Versus
Hospitalizations without PSI Events in the VA (FY 2001)
$57.00
16.184
$53.47
13.94
$49.17
9.32
$48.44
10.983
$0
$20
$40
$60
$80PSI
No PSI
PostoperativeWound
DehiscenceP<0.0001
PostoperativeSepsis
P<0.0001
PostoperativeRespiratory
FailureP<0.0001
PostoperativePhysiologic and
Metabolic Derangements
P<0.0001Rosen AK, et al. Evaluating the Patient Safety Indicators: How Well Do They Perform on Veterans Health Administration Data? Medical Care. 2005;43:873-884.

Medical errors and adverse events result primary because of
1 2 3
5%
93%
2%
1. poor information transfer 2. faulty communication3. poor information transfer
& faulty communication

The inpatient adverse event rate identified in the Harvard Medical Practice Study was
1 2 3
28%
63%
10%
1. 2.4%2. 1.8%3. 3.7%

During a Hospitalization(Children)
• Utah and Colorado Study (Pediatrics 2005):-1st study to randomly select a large number of records involving several institutions and reliably estimatethe incidence of adverse events and preventable adverseevents in children.-data suggested that ~70,000 children hospitalized in the United States experience an adverse event annually. -sampled 3,719 discharged hospitalized children and 7,528discharged hospitalized nonelderly adults using 1992 data.

During a Hospitalization
-adverse events related to treatment occurred in 1% of hospitalized children.-60% of these adverse events may be preventable.-future research should focus on adolescenthospitalized patients, birth-related medical care, anddiagnostic errors in pediatrics.

Table 6: Rates and Preventable Adverse Events by Age Group
Age Group Adverse Events Proportion of Preventable Adverse(Years) Rate (95% CI) Preventable Adverse Events Events Rate (95% CI)
0–0.99 0.63 (0.43–0.83) 78.0 0.53 (0.33–0.73)
1–12.99 0.92 (0.62–1.22) 10.8 0.22 (0.12–0.32)
13–20.99 3.41 (3.36–3.46) 78.6 0.95 (0.65–1.25)
21–65.99 3.84 (3.79–3.89) 40.7 1.50 (1.20–1.80)
Woods D, et al. Adverse Events and Preventable Adverse Events in Children. Pediatrics. 2005;115:155-160.

Table 7: Distribution of Adverse Events and Preventable Adverse Events by Type: Children and Nonelderly Adults
Type Proportion (%) of Proportion (%) of Proportion ofAdverse Events Preventable Adverse Preventable Adverse
(95% CI)* Events (95% CI) Events (95% CI) inNonelderly Adults
Birth related 29.6 (17.1–42.2) 32.2 (15.8–48.6) —Diagnostic 21.3 (12.5–30.1) 30.4 (14.3–46.5) 10.1 (5.2–15.0)Medication 19.1 (12.1–26.1) 21.3 (6.9–35.7) 6.6 (2.5–10.4)Surgical 16.3 (4.4–28.2) 3.5 (0–9.9) 54.6 (47.3–61.9)Postpartum 6.1 (1.9–10.3) 8.7 (0–18.6) 5.5 (0–11.0)Therapeutic 0.8 (0.4–1.2) 2.8 (0–8.6) 5.7 (11.9–9.5)Nonsurgical procedures 7.7 (0–17.2) 1.1 (0–4.8) 9.6 (5.4–13.8)
Woods D, et al. Adverse Events and Preventable Adverse Events in Children. Pediatrics. 2005;115:155-160.

Table 8: Estimated Frequency Distribution of PediatricAdverse Events and Preventable Adverse Events by Covering
Service and Location of the Event
Adverse Events Preventable Adverse(95% CI) Events (95% CI)
ServiceObstetrics 34.2 (47.4–21.0) 38.6 (20.9–55.7)Surgery 18.0 (7.9–28.1) 8.5 (0–18.3)Pediatrics 14.5 (15.2–23.8) 11.4 (0.3–22.5)Family practice 10.3 (2.3–18.3) 16.7 (3.6–29.8)Pharmacy 9.4 (1.7–17.1) 21.4 (7.0–35.8)Gynecology 1.6 (0–5.8) 6.8 (2.9–10.7)
LocationLabor and delivery 26.2 (13.8–38.6) 26.2 (10.8–41.6)Pharmacy 14.9 (10.7–19.1) 21.4 (7.0–35.8)Ambulatory care 17.8 (9.0–26.6) 18.9 (5.2–32.6)Operating room 19.5 (8.4–30.6) 11.0 (0–22.0)Patient room 11.8 (1.7–21.9) 15.7 (2.9–28.5)Newborn nursery 4.8 (0–10.6) 6.9 (0–15.7)
Woods D, et al. Adverse Events and Preventable Adverse Events in Children. Pediatrics. 2005;115:155-160.

During a Hospitalization
• A Multicenter Study of Children’s Hospitals(Pediatrics 2008):-to determine excess charges and lengths of stay attributable to adverse patient-care events during pediatric hospitalizations.
-pediatric-specific quality indicators were used to identify adverse events in 431,524 discharges from 38 pediatric hospitals in the United States participating in the Pediatric Health Information System (PHIS) database in 2006.

During a Hospitalization
-primary outcomes were excess lengths of stay andcharges attributable to adverse patient-safetyevents as determined by 12 pediatric-specific qualityindicators.

Table 9: PHIS Rates for AHRQ PDIs in 2006 Variable PHIS, No. PHIS Risk PHIS Rate per 1000 Children’s Hospitals
of Events Pool Discharges at Risk Rate Reported by AHRQa
Accidental puncture and laceration 679 427616 1.59 1.58
Decubitus ulcer 374 82707 4.52 4.33Foreign body left in during procedure 40 427650 0.09 0.07
Iatrogenic pneumothorax neonate 13 10753 1.21 0.68
Iatrogenic pneumothorax non-neonates 144 392647 0.37 0.44
In-hospital mortality after pediatric heart surgery 402 10158 39.57 46.66b
Postoperative hemorrhage or hematoma 206 53052 3.88 1.76
Postoperative respiratory failure 1076 42767 25.16 17.03
Postoperative sepsis 958 34455 27.80 31.33
Kronman MP, et al. Charges and Lengths of Stay Attributable to Adverse Patient-Care Events Using Pediatric-Specific Quality Indicators: A Multicenter Study of Freestanding Children’s Hospitals. Pediatrics. 2008;121:e1653-e1659.

Table 9: PHIS Rates for AHRQ PDIs in 2006 (continued)
Variable PHIS, No. PHIS Risk PHIS Rate per 1000 Children’s Hospitalsof Events Pool Discharges at Risk Rate Reported by
AHRQa
Postoperative wound dehiscence 18 20101 0.90 0.82
Infection because ofmedical care 2736 323253 8.46 6.15
Transfusion reaction 10 380112 0.03 0.002
a Data are based on the Healthcare Cost and Utilization Project KID 2003.b Data show the overall rate. The children’s hospital rate was not reported by the AHRQ.
Kronman MP, et al. Charges and Lengths of Stay Attributable to Adverse Patient-Care Events Using Pediatric-Specific Quality Indicators: A Multicenter Study of Freestanding Children’s Hospitals. Pediatrics. 2008;121:e1653-e1659.

Table 10: Excesses in LOS and Total Charges for PatientSafety Events Flagged in the PHIS
Variable Matched Excess LOS Excess Total ChargesRate, % a Mean (SE), days Mean (SE), dollars
Accidental puncture and laceration 82 2.77 (1.06)b 34 884 (8891)b
Decubitus ulcer 62 8.07 (1.73)b 59 225 (17 581)b
Foreign body left in during procedure 85 14.30 (7.23)b 144 889 (79 488)Iatrogenic pneumothorax neonate 92 -1.61 (26.51) 77 365 (208 750)Iatrogenic pneumothorax 69 3.39 (2.11) 53 604 (19 355)b
In-hospital mortality after pediatric heart surgery 49 12.92 (4.40) 337 226 (44 039)b
Postoperative hemorrhage or hematoma 78 6.17 (2.70) 111 653 (35 094)b
Postoperative respiratory failure 37 4.80 (2.09)b 77 739 (18 769)b
Postoperative sepsis 53 23.52 (2.29)b 261 173 (22 795)b
Postoperative wound dehiscence 67 7.32 (4.85) 69 220 (43 851)Infection because of medical care 73 22.43 (1.02)b 172 484 (9400)b
Transfusion reaction 70 12.26 (13.76) 45 313 (59 340)a Data show the percentage of case subjects who could be matched to1 control subject.b Data denote the statistically significant difference (P.006) after the Bonferroni correction.
Kronman MP, et al. Charges and Lengths of Stay Attributable to Adverse Patient-Care Events Using Pediatric-Specific Quality Indicators: A Multicenter Study of Freestanding Children’s Hospitals. Pediatrics. 2008;121:e1653-e1659.

After Discharge• United States Post-Discharge Study (Forster AJ,
et al. The incidence and severity of adverse events affecting patients after discharge from hospital. Ann Intern Med. 2003;138:161-7)
-landmark study on post-discharge adverse events.-reported a 19% adverse event incidence rateamong patients discharged home from the generalinternal medicine service of a major teaching hospital (Brigham & Women’s Hospital in Boston).-66% were adverse drug events, 17% wereprocedure-related problems, 5% were nosocomialinfections, and 4% were falls.-1/3 were preventable and 1/3 were ameliorableadverse events.

After Discharge• Canadian Post-Discharge Study (Forster AJ, et al.
Adverse events among medical patients after discharge from hospital. CMAJ. 2004;170:345-9)
-reported a 23% adverse event incidence rateamong patients discharged home from the generalinternal medicine service of a major teaching hospital (Ottawa Hospital in Ottawa, Canada).-76% were adverse drug events, 16% weretherapeutic errors, 11% were nosocomialinfections, 7% were procedure-related problems, 7%were pressure ulcers, 6% were diagnostic errors,and 2% were falls.

After Discharge
• As a result of post-discharge adverse events, both the US and Canadian studies reported:
9% - 21% of pts required an additional physician visit17% - 24% of pts required a hospital readmission11% - 12% of pts required an ED visit
3% of pts experienced death

After Discharge
• In the Canadian post-discharge study:
14% of hospital readmissions were preventable2% of hospital readmissions were ameliorable 6% of ED visits were preventable6% of ED visits were ameliorable
14% of deaths were preventable

Table 11: Common Types of Post-Discharge Adverse Events
Adverse Event Type
Drug Related*Drug Related¶Drug Related†
Procedure Related¶Procedure Related*
Therapeutic Errors*
Nosocomial Infections*Nosocomial Infections¶
Pressure Ulcers*
Diagnostic Errors*
Falls¶Falls*
72%66%25%
17%7%
16%
11%5%
7%
6%
4%2%
Preventable IR Ameliorable IR
IR=Incidence Rate. N/A=Not Available.*Forster AJ, et al. Adverse events among medical patients after discharge from hospital. CMAJ. 2004;170:345-349.¶Forster AJ, et al. The incidence and severity of adverse events affecting patients after discharge from hospital. Ann Intern Med. 2003;138:161-7.†Gandhi TK, et al. Adverse drug events in ambulatory care. N Engl J Med. 2003;348:1556-64.
N/A50%11%
8%N/A
N/A
N/A0%
N/A
N/A
8%N/A
IR
N/A76%28%
12%N/A
N/A
N/A4%
N/A
N/A
0%N/A

Figure 6: The Most Common Drugs Causing Post-Discharge Adverse Events
38
1614
10 8
0
10
20
30
40
50
Post
-Dis
char
ge A
dver
se E
vent
s(P
erce
nt)
Antibiotics Cortico-steroids
Cardio-vascular
Drugs
Analgesics Anti-coagulants
Forster AJ, et al. The incidence and severity of adverse events affecting patients after discharge from hospital. Ann Intern Med. 2003;138:161-7.

Diagnostic Errors
• Diagnostic error , is defined as a diagnosis that is missed, wrong, or delayed, as detected by some subsequent definitive test or finding.
• Not all diagnostic errors result in harm to the patient, and harm may be due to either disease or intervention.
• Misdiagnosis related harm, is defined as preventable harm that results from the delay or failure to treat a condition actually present (when the working diagnosis was wrong or unknown) or from treatment provided for a condition not actually present.
Tsilimingras D, et al. Patient Safety in Geriatrics: A Call for Action. J Gerontol Med Sci. 2003;58A:813-819. Newman-Toker DE, et al. Diagnostic errors: the next frontier for patient safety. JAMA. 2009;301:1060-1062.

Diagnostic Errors
• An estimated 40,000 to 80,000 hospital deaths result from mis-diagnosis annually in the US.
• Approximately 5% of autopsies reveal lethal diagnostic errors.
• During a hospitalization (Harvard Medical Practice Study), 8% of adverse events resulted from misdiagnoses, 75% of misdiagnoses were considered negligent, and 47% of misdiagnoses resulted in serious disability to the patient.
• After discharge from the hospital (Canadian Post-Discharge Study), 6% of adverse events resulted from misdiagnoses.
Newman-Toker DE, et al. Diagnostic errors: the next frontier for patient safety. JAMA. 2009;301:1060-1062.Leape LL, et al. The nature of adverse events in hospitalized patients: results of the Harvard Medical Practice Study II.N Engl J Med. 1991;324:377-84.Forster AJ, et al. Adverse events among medical patients after discharge from hospital. CMAJ. 2004;170:345-349.

Diagnostic Errors
Comparison of Types of Preventable Adverse Events Between Children and Adults (Utah and Colorado Study)
Types of Preventable Adverse Events OR (Odds Ratio) P ValueDiagnostic 1.352 <0.001Surgical 0.107 <0.001Postpartum 0.527 <0.001Nonoperative procedure 0.016 <0.001Medication 0.346 <0.001Therapeutic 0.099 <0.001All types 0.501 <0.001
• Children are 1.35 times more likely to experience a preventable adverse event as a result of a diagnostic error than adults during a hospitalization. Woods D, et al. Adverse Events and Preventable Adverse Events in Children. Pediatrics. 2005;115:155-160.

The adverse event rate after discharge from the hospital ranges between
1 2 3
58%
8%
35%
1. 19%-23%2. 15%-18%3. 4%-7%

Recommendations for Improvement
(A) Identifying System Failures:
• If a misdiagnosis is not detected or reported, the identification of systemic failures and the initiation of immediate medical attention (for a condition that was missed) will not occur.
• The failure to identify systemic failures and to initiate immediate medical attention will result in avoidable harm to patients.

Recommendations for Improvement
(1) Physicians must detect and report a misdiagnosis.(2) Identify underlying system failures that resulted in a
misdiagnosis.
Example: Identify a new-onset of a condition and retrospectivelyoutline the sequential chain of clinical events leading to its(condition) occurrence. The sequential chain of clinical events may include human factors as the reason that physiciansfailed to recognize the occurrence of a condition, technicalfactors involving a computer system, or organizational factorssuch a payment system that required preauthorization for thecare of patients.
Tsilimingras D, et al. Patient Safety in Geriatrics: A Call for Action. J Gerontol Med Sci. 2003;58A:813-19.

Recommendations for Improvement
(3) By outlining the sequence of clinical events that led to amisdiagnosis, physicians would be able to identify systemic failures and develop solutions to reverse their outcome.

Recommendations for Improvement(B) Improving Transitional Care:
(1) By creating transitional care teams that include a physician, nurse coordinator, dietician, pharmacist,psychologist, and social worker.
(2) Transitional care teams should follow a patientduring the inpatient setting, transitional interface, and outpatient setting.
(3) Transitional care teams have significantly reduced readmissions, ER visits, deaths, adverse events, andcost of care.
Tsilimingras D , et al. Addressing Post-Discharge Adverse Events: A Neglected Area. Joint CommissionJournal on Quality & Patient Safety. 2008;34(2):85-97.

Recommendations for Improvement
(C) Improving Information Transfer Through Strategic Useof Electronic Health Records (EHRs):
(1) Implementing inpatient and outpatient EHRs.(2) Linking inpatient and outpatient EHRs.(3) Creating and linking patient personal EHRs.
Tsilimingras D, et al. Addressing Post-Discharge Adverse Events: A Neglected Area. Joint CommissionJournal on Quality & Patient Safety. 2008;34(2):85-97.

Recommendations for Improvement
Example: a physician that examines a patient in thehospital for the 1st time should have access to thepatient’s recent outpatient and/or inpatient EHRprior to making medical decisions for the care ofthat particular patient. By outlining the sequence ofclinical events and therapeutic modifications for thatparticular patient, physicians would be able to makeinformed decisions in the care of patients when theyare seen inside and outside the hospital.
Tsilimingras D, et al. Addressing Post-Discharge Adverse Events: A Neglected Area. JointCommission Journal on Quality & Patient Safety. 2008;34(2):85-97.

Recommendations for Improvement
(4) Implementing Computerized Physician Order Entry(CPOE) & computerized alert monitors within EHRs:
(a) in hospitals and home care. (b) to properly transfer a patient’s drug info between
inpatient and outpatient pharmacies (and vice-versa).
(c) these systems have reduced prescribing errors by more than 50%.
(d) these systems are effective and imperative forreducing the rate of potential adverse drug events.
Tsilimingras D, et al. Patient Safety in Geriatrics: A Call for Action. J Gerontol Med Sci. 2003;58A:813-19.

Recommendations for Improvement
(5) An early intervention by a pharmacist can improve poor information transfer and faulty communicationbetween inpatient and outpatient care in addition toEHRs.
Tsilimingras D, et al. Addressing Post-Discharge Adverse Events: A Neglected Area. JointCommission Journal on Quality & Patient Safety. 2008;34(2):85-97.

Recommendations for Improvement
Example: Randomized trial included 92 pts in the intervention group and 84 pts in the control group from the IM service of a large teaching hospital (Arch Intern Med 2006).
- A pharmacist reviewed all meds and counseled pts regarding potential side effects at discharge, along with a follow-up phone call 3-5 days after discharge.
- Only 1% of patients in the intervention group experienced preventable adverse drug events compared to 11% of patients that experienced preventable adverse drug events in the control group.
Schnipper JL, et al. Role of pharmacist in preventing adverse drug events after hospitalization. Arch Intern Med. 2006;166:565-571.

Recommendations for Improvement
(6) Implementing structured database-generatedphysician discharged summaries.
(7) Implementing structured cross-coverage sign-outsbetween physicians.
(8) Implementing a comprehensive discharge planningprocess.
(9) Require proper patient notification and follow-up ofabnormal laboratory test results.
Tsilimingras D, et al. Patient Safety in Geriatrics: A Call for Action. J Gerontol Med Sci. 2003;58A:813-19. Tsilimingras D, et al. Addressing Post-Discharge Adverse Events: A Neglected Area. Joint CommissionJournal on Quality & Patient Safety. 2008;34(2):85-97.

Recommendations for Improvement
(D) Medication Reconciliation:
(1) A process of identifying the most accurate list of all medications a patient is taking at interfaces of care.
(2) Includes the identification of a medication’s name,dose, frequency and route, and the subsequent use ofthis information to provide correct medications for patients within the health care system.
(3) The process also involves comparing a patient’s currentlist of medications with a physician’s admission,transfer, and/or discharge orders.
Tsilimingras D , et al. Addressing Post-Discharge Adverse Events: A Neglected Area. Joint CommissionJournal on Quality & Patient Safety. 2008;34(2):85-97.

Recommendations for Improvement
(E) Utilizing Screening Methods to Identify Patients WithAdverse Events:
(1) Inpatient computerized programs which use ICD-9-CM codes to identify medical or surgical complications.
(2) Inpatient computerized programs that combine microbiology, pharmacy, and clinical laboratory data toidentify adverse events.
(3) Outpatient computerized programs which use ICD-9-CM codes and combine laboratory and pharmacy data to identify adverse events.
Tsilimingras D, et al. Addressing Post-Discharge Adverse Events: A Neglected Area. JointCommission Journal on Quality & Patient Safety. 2008;34(2):85-97.

Recommendations for Improvement(F) Performing Root Cause Analysis (RCA):
(1) To identify the underlying system and organizational problems that led to the adverse event or events.
(2) It will not be practical for every adverse event.(3) It should be performed when a pattern of events is
identified or even a single very serious event.(4) A systematic RCA may expose common root causes
that link several serious adverse events at a particulartime of occurrence and help design systems to preventfuture incidents.
Tsilimingras D, et al. Addressing Post-Discharge Adverse Events: A Neglected Area. JointCommission Journal on Quality & Patient Safety. 2008;34(2):85-97.

Recommendations for Improvement(G) Improving Residency and Fellowship Programs:
(1) No matter how clinically skilled physicians may be, they will not be able to provide optimal patient careunless the system is appropriately structured.
(2) Advocating for such a system is not easy and requiresadvocacy and management skills that are not part of current residency programs.
(3) Residency programs should emphasize therecommendations mentioned here and continue to emphasize skills in patient-centered care andevidence-based practice.
Tsilimingras D, et al. Patient Safety in Geriatrics: A Call for Action. J Gerontol Med Sci. 2003;58A:813-19.

Conclusions
(A) Enhanced care can be achieved by adopting well-established safety recommendations such as the onesmentioned here.
(B) The recommendations mentioned here, are only the tip of the iceberg in confronting the magnitude of thisproblem.
(C) Additional recommendations and further research in thisarea are critical in improving the quality and safety of patient care.
Tsilimingras D, et al. Addressing Post-Discharge Adverse Events: A Neglected Area. JointCommission Journal on Quality & Patient Safety. 2008;34(2):85-97.

The Second Victim
• The second victim of a medical error, besides the patient, is the physician that cared for the patient.
• Implications for the second victim:-emotional and psychological -may result in a career change
• Patient Safety Organizations (PSO)-created by the Patient Safety Act of 2005-encourages clinicians and health care organizationsto voluntarily report and share quality and patientsafety information without fear of legal discovery.
Wu AW. Medical error: the second victim. BMJ. 2000;320:726-727. AHRQ, http://www.pso.ahrq.gov/