ADVERSE EFFECT CHARTS 2016 - Agency of...
19
ADVERSE EFFECT CHARTS 2016 Adverse Effect Charts (Revised: July 18, 2016) Page 1 of 19 WRITTEN EXPRESSION EXAMPLES CRITERION FOR COMPARISON MEASURE 1 Individually Administered Nationally Normed Achievement Test any standardized achievement test that offers results in the form of standard scores or percentiles 1.Woodcock-Johnson Achievement Test 2. Test of Early Written Language 3. Word Identification and Spelling Test 4. Wechsler Individual Achievement Test 5. Kaufman Test of Educational Achievement 6. Diagnostic Assessment of Reading 7. Test of Orthographic Competence 8. Test of Written Spelling 9. Test of Written Expression 10. Test of Written Language Scores at or below the 15 th percentile or 1 standard deviation below the mean (typically a score of 85 or below) using grade norms MEASURE 2 Group Administered Nationally Normed Achievement Test standardized tests that are given to all students in a group format - results provide national percentile ranking 1. Gates-MacGinitie 2. Stanford Achievement Test 3. Terra Nova 4. Otis Lennon School Ability Test 5. Metropolitan Achievement Test 6. Comprehensive Test of Basic Skills Scores at or below the 15th percentile or 1 standard deviation below the mean (typically a score of 85 or below) using grade norms MEASURE 3 Grades grades indicate that the student is not meeting the standard or is showing little evidence of meeting the standard for that stage of development 1. Most recent report card or progress report 2. Student’s level of written expression is within the lowest 15% when compared to grade level peers 3. Teacher determined grading system 4. IEP based individualized grading systems Generally, in comparison to the Common Core Standards, the VT Standards or VELS (kindergarten) In heterogeneous classrooms, the student’s grade is among the lowest 15 % of grade level peers Otherwise, the student’s grades represent the lowest 15 % in comparison to the expected level of performance for grade level peers
Transcript of ADVERSE EFFECT CHARTS 2016 - Agency of...

ADVERSE EFFECT CHARTS 2016
Adverse Effect Charts
(Revised: July 18, 2016)
Page 1 of 19
WRITTEN
EXPRESSION EXAMPLES CRITERION FOR COMPARISON
MEASURE 1 Individually
Administered Nationally
Normed Achievement
Test any standardized
achievement test that
offers results in the form
of standard scores or
percentiles
1.Woodcock-Johnson Achievement Test
2. Test of Early Written Language
3. Word Identification and Spelling Test
4. Wechsler Individual Achievement Test
5. Kaufman Test of Educational Achievement
6. Diagnostic Assessment of Reading
7. Test of Orthographic Competence
8. Test of Written Spelling
9. Test of Written Expression
10. Test of Written Language
Scores at or below the 15th percentile or 1
standard deviation below the mean (typically a
score of 85 or below) using grade norms
MEASURE 2 Group Administered
Nationally Normed
Achievement Test standardized tests that are
given to all students in a
group format - results
provide national
percentile ranking
1. Gates-MacGinitie
2. Stanford Achievement Test
3. Terra Nova
4. Otis Lennon School Ability Test
5. Metropolitan Achievement Test
6. Comprehensive Test of Basic Skills
Scores at or below the 15th percentile or 1
standard deviation below the mean (typically a
score of 85 or below) using grade norms
MEASURE 3 Grades
grades indicate that the
student is not meeting the
standard or is showing
little evidence of meeting
the standard for that stage
of development
1. Most recent report card or progress report
2. Student’s level of written expression is within the
lowest 15% when compared to grade level peers
3. Teacher determined grading system
4. IEP based individualized grading systems
Generally, in comparison to the Common Core
Standards, the VT Standards or VELS
(kindergarten)
In heterogeneous classrooms, the
student’s grade is among the lowest 15%
of grade level peers
Otherwise, the student’s grades represent
the lowest 15% in comparison to the
expected level of performance for grade
level peers

ADVERSE EFFECT CHARTS 2016
Adverse Effect Charts
(Revised: July 18, 2016)
Page 2 of 19
WRITTEN
EXPRESSION EXAMPLES CRITERION FOR COMPARISON
MEASURE 4 Curriculum Based
Measures data that reports the
student’s performance
over an extended period
of time – data is reported
in reference to a grade
level expectation -
information is not
quantified in a standard
score format
1. On-demand writing prompt compared to
Common Core, Grade Equivalents, or a classroom
rubric
2. Writing fluency (number of sentences produced)
as compared to peers
3. Quality of writing as compared to peers – lowest
15% – teacher statement
4. Charts, graphs, or checklists
Comparison to performance of grade level peers
on same measure which indicates that the
student is among the lowest 15%
MEASURE 5 Criterion Referenced
Assessments tests that are not
standardized, but are
scored on a level of
expected development -
test results indicate how
the student is performing
in relation to grade level
peers
1. Brigance Inventory
2. Developmental Reading Assessment
3. Assessment of Basic Language and Learning Skills
4. Verbal Behavior Milestones Assessment and
Placement Program
5. Primary Observation Assessment
6. Measures of Academic Progress (MAPS)
Individual: Test results indicate that the student
lacks skills or knowledge as compared to grade
level peers
Group: Comparison to performance of average
grade level peers on same measure in relation to
the Common Core or VT Standards which
indicates that the student is among the lowest
15%
MEASURE 6 Other Measures of
Performance class work that
demonstrates limited
ability when compared to
the performance of grade
level peers on the same
measure
1. Alternative placement due to written expression
weaknesses
2. Writing portfolio
3. Grade Equivalent comparison – writing skills/
expression well below grade level
Comparison to performance of grade level peers
on same measure which indicates that the
student is among the lowest 15%

ADVERSE EFFECT CHARTS 2016
Adverse Effect Charts
(Revised: July 18, 2016)
Page 3 of 19
READING FLUENCY EXAMPLES CRITERION FOR COMPARISON
MEASURE 1 Individually
Administered Nationally
Normed Achievement
Test any standardized
achievement test that
offers results in the form
of standard scores or
percentiles
1. Comprehensive Test of Phonological Processing
2. Woodcock-Johnson Achievement Test
3. Word Identification and Spelling Test
4. Gray Oral Reading Test
5. Wechsler Individual Achievement Test
6. Test of Word Reading Efficiency
7. Test of Silent Word Reading Fluency
8. Diagnostic Assessment of Reading
9. Phonological Awareness Test
10. Nelson-Denny Reading Test
11. Kaufman Test of Educational Achievement
Scores at or below the 15th percentile or 1
standard deviation below the mean (typically a
score of 85 or below) using grade norms
MEASURE 2 Group Administered
Nationally Normed
Achievement Test standardized tests that are
given to all students in a
group format - results
provide national
percentile ranking
1. Gates-MacGinitie
2. Stanford Achievement Test
3. Terra Nova
4. Otis Lennon School Ability Test
5. Metropolitan Achievement Test
6. Comprehensive Test of Basic Skills
Scores at or below the 15th percentile or 1
standard deviation below the mean (typically a
score of 85 or below) using grade norms
MEASURE 3 Grades
grades indicate that the
student is not meeting the
standard or is showing
little evidence of meeting
the standard for that stage
of development
1. Most recent report card or progress report
2. Student’s reading accuracy/text level is within the
lowest 15% when compared to grade level peers
3. Teacher determined grading system
4. IEP based individualized grading systems
Generally, in comparison to the Common Core
Standards, the VT Standards or Vermont Early
Learning Standards (kindergarten)
In heterogeneous classrooms, the
student’s grade is among the lowest 15%
of grade level peers
Otherwise, the student’s grades represent
the lowest 15% in comparison to the
expected level of performance for grade
level peers
MEASURE 4 Curriculum Based
Measures data that reports the
student’s performance
1. Reading group text level as compared to peers,
Common Core Standards or Grade Equivalents
2. Running Records – text level – lowest 15%
3. Charts, graphs, or checklists indicating student
performance over time
Comparison to performance of grade level peers on
same measure which indicates that the student is
among the lowest 15%
NOTE: The SBAC should be used here only as a
ADVERSE EFFECT CHARTS 2016
Adverse Effect Charts
(Revised: July 18, 2016)
Page 4 of 19
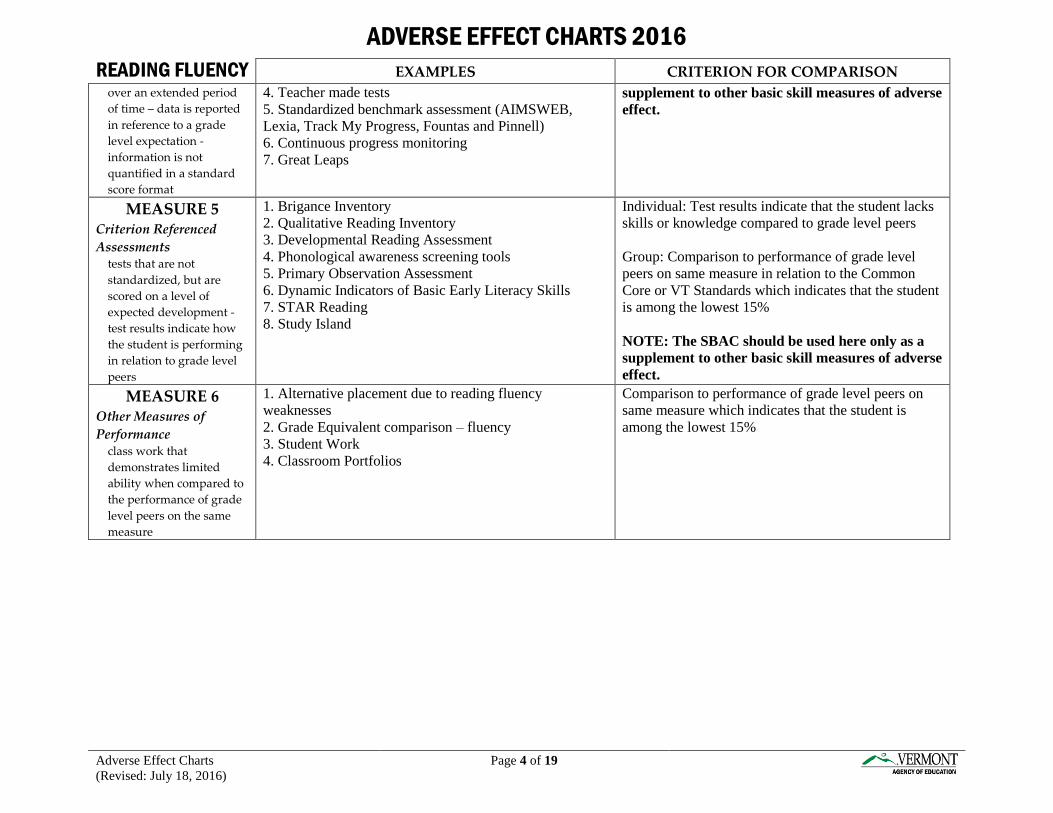
READING FLUENCY EXAMPLES CRITERION FOR COMPARISON
over an extended period
of time – data is reported
in reference to a grade
level expectation -
information is not
quantified in a standard
score format
4. Teacher made tests
5. Standardized benchmark assessment (AIMSWEB,
Lexia, Track My Progress, Fountas and Pinnell)
6. Continuous progress monitoring
7. Great Leaps
supplement to other basic skill measures of adverse
effect.
MEASURE 5 Criterion Referenced
Assessments tests that are not
standardized, but are
scored on a level of
expected development -
test results indicate how
the student is performing
in relation to grade level
peers
1. Brigance Inventory
2. Qualitative Reading Inventory
3. Developmental Reading Assessment
4. Phonological awareness screening tools
5. Primary Observation Assessment
6. Dynamic Indicators of Basic Early Literacy Skills
7. STAR Reading
8. Study Island
Individual: Test results indicate that the student lacks
skills or knowledge compared to grade level peers
Group: Comparison to performance of grade level
peers on same measure in relation to the Common
Core or VT Standards which indicates that the student
is among the lowest 15%
NOTE: The SBAC should be used here only as a
supplement to other basic skill measures of adverse
effect.
MEASURE 6 Other Measures of
Performance class work that
demonstrates limited
ability when compared to
the performance of grade
level peers on the same
measure
1. Alternative placement due to reading fluency
weaknesses
2. Grade Equivalent comparison – fluency
3. Student Work
4. Classroom Portfolios
Comparison to performance of grade level peers on
same measure which indicates that the student is
among the lowest 15%

ADVERSE EFFECT CHARTS 2016
Adverse Effect Charts
(Revised: July 18, 2016)
Page 5 of 19
READING
COMPREHENSION EXAMPLES CRITERION FOR COMPARISON
MEASURE 1 Individually Administered
Nationally Normed
Achievement Test any standardized achievement
test that offers results in the
form of standard scores or
percentiles
1. Woodcock-Johnson Achievement Test
2. Test of Early Reading Ability
3. Gray Oral Reading Test
4. Wechsler Individual Achievement Test
5. Diagnostic Assessment of Reading
6. Gray Silent Reading Test
7. Test of Reading Comprehension
8. Test of Silent Contextual Reading Fluency
9. Kaufman Test of Educational Achievement
Scores at or below the 15th percentile or 1
standard deviation below the mean (typically
a score of 85 or below) using grade norms.
MEASURE 2 Group Administered
Nationally Normed
Achievement Test standardized tests that are
given to all students in a group
format - results provide
national percentile ranking
1. Gates-MacGinitie
2. Stanford Achievement Test
3. Terra Nova
4. Otis Lennon School Ability Test
5. Metropolitan Achievement Test
6. Comprehensive Test of Basic Skills
Scores at or below the 15th percentile or 1
standard deviation below the mean (typically
a score of 85 or below) using grade norms.
MEASURE 3 Grades
grades indicate that the
student is not meeting the
standard or is showing little
evidence of meeting the
standard for that stage of
development
1. Most recent report card or progress report
2. Student’s reading comprehension level is within
the lowest 15th %ile when compared to grade level
peers
3. Teacher determined grading system
4. IEP based individualized grading systems
Generally, in comparison to the Common
Core Standards, the VT Standards or Vermont
Early Learning Standards (VELS) through
kindergarten
In heterogeneous classrooms, the
student’s grade is among the lowest
15% of grade level peers
Otherwise, the student’s grades
represent the lowest 15% in comparison
to the expected level of performance
for grade level peers

ADVERSE EFFECT CHARTS 2016
Adverse Effect Charts
(Revised: July 18, 2016)
Page 6 of 19
READING
COMPREHENSION EXAMPLES CRITERION FOR COMPARISON
MEASURE 4 Curriculum Based Measures
data that reports the student’s
performance over an extended
period of time – data is
reported in reference to a
grade level expectation -
information is not quantified in
a standard score format
1. Reading group comprehension level as compared
to peers, Common Core Standards or GEs
3. Charts, graphs, or checklists indicating student
performance over time
4. Teacher made tests
5. Standardized benchmark assessment (AIMSWEB,
Lexia, Fountas and Pinnell, Great Leaps)
6. Continuous progress monitoring
7. Classroom assessment measuring understanding of
concepts/vocabulary from silent or oral reading
Comparison to performance of grade level
peers on same measure which indicates that
the student is among the lowest 15%
NOTE: The SBAC should be used here only
as a supplement to other basic skill measures
of adverse effect.
MEASURE 5 Criterion Referenced
Assessments tests that are not standardized,
but are scored on a level of
expected development - test
results indicate how the
student is performing in
relation to grade level peers
1. Brigance Inventory
2. Qualitative Reading Inventory
3. Developmental Reading Assessment
4. Primary Observation Assessment
5. Dynamic Indicators of Basic Early Literacy Skills
6. Assessment of Basic Language and Learning Skills
7. Verbal Behavior Milestones Assessment and
Placement Program
8. STAR Reading
9. Study Island
9. Measures of Academic Progress (MAPS)
Individual: Test results indicate that the
student lacks skills or knowledge compared to
grade level peers
Group: Comparison to performance of grade
level peers on same measure in relation to the
Common Core or VT Standards
Performance indicates that the student
is among the lowest 15%
NOTE: The SBAC should be used here only
as a supplement to other basic skill measures
of adverse effect.
MEASURE 6 Other Measures of
Performance class work that demonstrates
limited ability when compared
to the performance of grade
level peers on the same
measure
1. Alternative placement due to reading
comprehension weaknesses
2. Grade Equivalent comparison – comprehension
3. Student Work
4. Classroom Portfolios
Comparison to performance of grade level
peers on same measure which indicates that
the student is among the lowest 15%

ADVERSE EFFECT CHARTS 2016
Adverse Effect Charts
(Revised: July 18, 2016)
Page 7 of 19
BASIC READING EXAMPLES CRITERION FOR COMPARISON
MEASURE 1 Individually
Administered Nationally
Normed Achievement
Test any standardized
achievement test that
offers results in the form
of standard scores or
percentiles
1. Comprehensive Test of Phonological Processing
2. Woodcock-Johnson Achievement Test
3. Test of Early Reading Ability
4. Word Identification and Spelling Test
5. Gray Oral Reading Test
6. Wechsler Individual Achievement Test
7. Test of Word Reading Efficiency
8. Test of Silent Word Reading Fluency
9. Diagnostic Assessment of Reading
10. Phonological Awareness Test
11. Nelson-Denny Reading Test
12. Kaufman Test of Educational Achievement
Scores at or below the 15th percentile or 1
standard deviation below the mean (typically a
score of 85 or below) using grade norms.
MEASURE 2 Group Administered
Nationally Normed
Achievement Test standardized tests that are
given to all students in a
group format - results
provide national
percentile ranking
1. Gates-MacGinitie
2. Stanford Achievement Test
3. Terra Nova
4. Otis Lennon School Ability Test
5. Metropolitan Achievement Test
6. Comprehensive Test of Basic Skills
Scores at or below the 15th percentile or 1
standard deviation below the mean (typically a
score of 85 or below) using grade norms.
MEASURE 3 Grades
grades indicate that the
student is not meeting the
standard or is showing
little evidence of meeting
the standard for that stage
of development
1. Most recent report card or progress report
2. Student’s reading accuracy/text level is within the
lowest 15% when compared to grade level peers
3. Teacher determined grading system
4. IEP based individualized grading systems
Generally, in comparison to the Common Core
Standards, the VT Standards or Vermont Early
Learning Standards (VELS - kindergarten)
In heterogeneous classrooms, the
student’s grade is among the lowest 15%
of grade level peers
Otherwise, the student’s grades represent
the lowest 15% in comparison to the
expected level of performance for grade
level peers

ADVERSE EFFECT CHARTS 2016
Adverse Effect Charts
(Revised: July 18, 2016)
Page 8 of 19
BASIC READING EXAMPLES CRITERION FOR COMPARISON
MEASURE 4 Curriculum Based
Measures data that reports the
student’s performance
over an extended period
of time – data is reported
in reference to a grade
level expectation -
information is not
quantified in a standard
score format
1. Reading group text level as compared to peers,
Common Core Standards or GEs
2. Running Records – text level – lowest 15%
3. Charts, graphs, or checklists indicating student
performance over time
4. Teacher made tests
5. Standardized benchmark assessment (AIMSWEB,
Lexia, Track My Progress, Fountas and Pinnell,)
6. Continuous progress monitoring
7. Great Leaps
Comparison to performance of grade level peers
on same measure which indicates that the
student is among the lowest 15%.
NOTE: The SBAC should be used here only as
a supplement to other basic skill measures of
adverse effect.
MEASURE 5 Criterion Referenced
Assessments tests that are not
standardized, but are
scored on a level of
expected development -
test results indicate how
the student is performing
in relation to grade level
peers
1. Brigance Inventory
2. Qualitative Reading Inventory
3. Developmental Reading Assessment
4. Phonological awareness screening tools
5. Primary Observation Assessment
6. Dynamic Indicators of Basic Early Literacy Skills
7. Assessment of Basic Language and Learning Skills
8. Verbal Behavior Milestones Assessment and
Placement Program
9. STAR Reading
10. Study Island
9. Measures of Academic Progress (MAPS)
Individual: Test results indicate that the student
lacks skills or knowledge compared to grade
level peers
Group: Comparison to performance of grade
level peers on same measure in relation to the
Common Core or VT Standards which indicates
that the student is among the lowest 15%
NOTE: The SBAC should be used here only as
a supplement to other basic skill measures of
adverse effect.
MEASURE 6 Other Measures of
Performance class work that
demonstrates limited
ability when compared to
the performance of grade
level peers on the same
measure
1. Alternative placement due to reading skill
weaknesses
2. Grade Equivalent comparison – decoding ability
3. Student Work
4. Classroom Portfolios
Comparison to performance of grade level peers
on same measure which indicates that the
student is among the lowest 15%

ADVERSE EFFECT CHARTS 2016
Adverse Effect Charts
(Revised: July 18, 2016)
Page 9 of 19
MATH REASONING EXAMPLES CRITERION FOR COMPARISON
MEASURE 1 Individually
Administered Nationally
Normed Achievement
Test any standardized
achievement test that
offers results in the form
of standard scores or
percentiles
1. Woodcock-Johnson Achievement Test
2. Wechsler Individual Achievement Test
3. Kaufman Test of Educational Achievement
4. Comprehensive Mathematical Abilities Test
5. Key Math
6. Test of Early Mathematical Ability
7. Test of Mathematical Ability
Scores at or below the 15th percentile or 1
standard deviation below the mean (typically a
score of 85 or below) using grade norms
MEASURE 2 Group Administered
Nationally Normed
Achievement Test standardized tests that are
given to all students in a
group format - results
provide national
percentile ranking
1. Gates-MacGinitie
2. Stanford Achievement Test
3. Terra Nova
4. Otis Lennon School Ability Test
5. Metropolitan Achievement Test
6. Comprehensive Test of Basic Skills
Scores at or below the 15th percentile or 1
standard deviation below the mean (typically a
score of 85 or below) using grade norms
MEASURE 3 Grades
grades indicate that the
student is not meeting the
standard or is showing
little evidence of meeting
the standard for that stage
of development
1. Most recent report card or progress report
2. Student’s math reasoning level is within the
lowest 15% when compared to grade level peers
3. Teacher determined grading system
4. IEP based individualized grading systems
Generally, in comparison to the Common Core
Standards, the VT Standards or Vermont Early
Learning Standards (VELS - kindergarten)
In heterogeneous classrooms, the
student’s grade is among the lowest 15%
of grade level peers
Otherwise, the student’s grades represent
the lowest 15% in comparison to the
expected level of performance for grade
level peers
MEASURE 4 Curriculum Based
Measures data that reports the
student’s performance
over an extended period
of time – data is reported
1. Math computation level as compared to peers or
grade level expectations
2. Classroom assessment based on classroom math
calculation instruction or Common Core/Grade
Equivalents
3. Mad Minutes mastery as compared to peers
Comparison to performance of average grade
level peers on same measure which indicates that
the student is among the lowest 15%
NOTE: The SBAC should be used here only as
a supplement to other basic skill measures of
adverse effect.

ADVERSE EFFECT CHARTS 2016
Adverse Effect Charts
(Revised: July 18, 2016)
Page 10 of 19
MATH REASONING EXAMPLES CRITERION FOR COMPARISON
in reference to a grade
level expectation -
information is not
quantified in a standard
score format
4. Charts, graphs, or checklists indicating student
performance over time
5. Teacher made tests
6. Standardized benchmark assessment (AIMSWEB)
7. Continuous progress monitoring
MEASURE 5 Criterion Referenced
Assessments tests that are not
standardized, but are
scored on a level of
expected development -
test results indicate how
the student is performing
in relation to grade level
peers
1. Brigance Inventory
2. District Math Assessment
3. Primary Numbers and Operations Assessment
4. Early Numeracy Assessment
5. Assessing Math Concepts (Kathy Richardson)
6. Assessment of Basic Language and Learning Skills
7. Verbal Behavior Milestones Assessment and
Placement Program
8. STAR Math
9. Measures of Academic Progress (MAPS)
Individual: Test results indicate that the student
lacks skills or knowledge as compared to grade
level peers
Group: Comparison to performance of grade
level peers on same measure in relation to the
Common Core or VT Standards which indicates
that the student is among the lowest 15%
NOTE: The SBAC should be used here only as
a supplement to other basic skill measures of
adverse effect.
MEASURE 6 Other Measures of
Performance class work that
demonstrates limited
ability when compared to
the performance of grade
level peers on the same
measure
1. Alternative ‘out of level’ placement due to math
reasoning weaknesses
2. Common Core/Grade Equivalent comparison –
still working on standards well below grade level
3. Math Portfolio – math reasoning work
4. Teacher statement that student is within lowest
15%
Comparison to performance of grade level peers
on same measure which indicates that the
student is among the lowest 15%

ADVERSE EFFECT CHARTS 2016
Adverse Effect Charts
(Revised: July 18, 2016)
Page 11 of 19
MATH
CALCULATION EXAMPLES CRITERION FOR COMPARISON
MEASURE 1 Individually
Administered Nationally
Normed Achievement
Test any standardized
achievement test that
offers results in the form
of standard scores or
percentiles
1. Woodcock-Johnson Achievement Test
2. Wechsler Individual Achievement Test
3. Kaufman Test of Educational Achievement
4. Comprehensive Mathematical Abilities Test
5. Key Math
6. Test of Early Mathematical Ability
7. Test of Mathematical Ability
Scores at or below the 15th percentile or 1
standard deviation below the mean (typically a
score of 85 or below) using grade norms
MEASURE 2 Group Administered
Nationally Normed
Achievement Test standardized tests that are
given to all students in a
group format - results
provide national
percentile ranking
1. Gates-MacGinitie
2. Stanford Achievement Test
3. Terra Nova
4. Otis Lennon School Ability Test
5. Metropolitan Achievement Test
6. Comprehensive Test of Basic Skills
Scores at or below the 15th percentile or 1
standard deviation below the mean (typically a
score of 85 or below) using grade norms
MEASURE 3 Grades
grades indicate that the
student is not meeting the
standard or is showing
little evidence of meeting
the standard for that stage
of development
1. Most recent report card or progress report
2. Student’s math calculation level is within the
lowest 15% when compared to grade level peers
3. Teacher determined grading system
4. IEP based individualized grading systems
Generally, in comparison to the Common Core
Standards, the VT Standards or Vermont Early
Learning Standards (VELS - kindergarten)
In heterogeneous classrooms, the
student’s grade is among the lowest 15%
of grade level peers
Otherwise, the student’s grades represent
the lowest 15% in comparison to the
expected level of performance for grade
level peers
MEASURE 4 Curriculum Based
Measures data that reports the
student’s performance
over an extended period
1. Math computation level as compared to peers or
grade level expectations
2. Classroom assessment based on classroom math
calculation instruction or Common Core/Grade
Equivalents
Comparison to performance of average grade
level peers on same measure which indicates that
the student is among the lowest 15%
NOTE: The SBAC should be used here only as

ADVERSE EFFECT CHARTS 2016
Adverse Effect Charts
(Revised: July 18, 2016)
Page 12 of 19
MATH
CALCULATION EXAMPLES CRITERION FOR COMPARISON
of time – data is reported
in reference to a grade
level expectation -
information is not
quantified in a standard
score format
3. Mad Minutes mastery as compared to peers
4. Charts, graphs, or checklists indicating student
performance over time
5. Teacher made tests
6. Standardized benchmark assessment (AIMSWEB,
Track My Progress)
7. Continuous progress monitoring
a supplement to other basic skill measures of
adverse effect.
MEASURE 5 Criterion Referenced
Assessments tests that are not
standardized, but are
scored on a level of
expected development -
test results indicate how
the student is performing
in relation to grade level
peers
1. Brigance Inventory
2. District Math Assessment
3. Primary Numbers and Operations Assessment
4. Early Numeracy Assessment
5. Assessing Math Concepts (Kathy Richardson)
6. Assessment of Basic Language and Learning Skills
7. Verbal Behavior Milestones Assessment and
Placement Program
8. STAR Math
Individual: Test results indicate that the student
lacks skills or knowledge as compared to grade
level peers
Group: Comparison to performance of grade
level peers on same measure in relation to the
Common Core or VT Standards which indicates
that the student is among the lowest 15%
NOTE: The SBAC should be used here only as
a supplement to other basic skill measures of
adverse effect.
MEASURE 6 Other Measures of
Performance class work that
demonstrates limited
ability when compared to
the performance of grade
level peers on the same
measure
1. Alternative ‘out of level’ placement due to math
calculation weaknesses
2. Common Core/Grade Equivalent comparison –
still working on standards well below grade level
3. Math Portfolio – computation work
4. Teacher statement that student is within lowest
15%
Comparison to performance of grade level peers
on same measure which indicates that the
student is among the lowest 15%

ADVERSE EFFECT CHARTS 2016
Adverse Effect Charts
(Revised: July 18, 2016)
Page 13 of 19
LISTENING
COMPREHENSION EXAMPLES CRITERION FOR COMPARISON
MEASURE 1 Individually
Administered Nationally
Normed Achievement
Test any standardized
achievement test that
offers results in the form
of standard scores or
percentiles
1. Woodcock Johnson Cluster Scores
2. Wechsler Individual Achievement Test Skill Areas
3. Comprehensive Assessment of Speech & Language
4. Comprehensive Receptive & Expressive Vocabulary
Test
5. Clinical Evaluation of Language Fundamentals –
Receptive Cluster
6. Peabody Picture Vocabulary Test
7. Test of Language Competence
8. The Listening Comprehension Test
9. Oral and Written Language Scales – Receptive
Language Cluster
10. Batelle Developmental Inventory
Scores at or below the 15th percentile or 1 standard
deviation below the mean (typically a score of 85 or
below) using grade norms
MEASURE 2 Group Administered
Nationally Normed
Achievement Test standardized tests that are
given to all students in a
group format - results
provide national
percentile ranking
Scores at or below the 15th percentile or 1 standard
deviation below the mean (typically a score of 85 or
below) using grade norms
MEASURE 3 Grades
grades indicate that the
student is not meeting the
standard or is showing
little evidence of meeting
the standard for that stage
of development
1. Most recent report card or progress report
2. Any grade that has been directly impacted by a deficit
in listening comprehension – ex. following directions
3. Teacher determined grading systems
4. IEP based individualized grading systems
5. With a teacher statement that this student is within the
lowest 15%
Generally, in comparison to the Common Core
Standards, the VT Standards or Vermont Early
Learning Standards (VELS - kindergarten)
In heterogeneous classrooms, the student’s
grade is among the lowest 15% of grade level
peers
Otherwise, the student’s grades represent the
lowest 15% in comparison to the expected level
of performance for grade level peers

ADVERSE EFFECT CHARTS 2016
Adverse Effect Charts
(Revised: July 18, 2016)
Page 14 of 19
LISTENING
COMPREHENSION EXAMPLES CRITERION FOR COMPARISON
MEASURE 4 Curriculum Based
Measures data that reports the
student’s performance
over an extended period
of time – data is reported
in reference to a grade
level expectation -
information is not
quantified in a standard
score format
1. Listening comprehension ability as compared to peers
or grade level expectations, (i.e. when asked to take notes,
follow directions, respond to questions, analyze/filter
orally presented information)
2. Classroom observation by Speech Language Pathologist
3. Teacher made tests (e.g., vocabulary)
4. Rubric 1.13 Communication Standards - Listening
5. Teacher statement that the student is within the lowest
15%
Comparison to performance of average grade level
peers on same measure which indicates that the
student is among the lowest 15%
MEASURE 5 Criterion Referenced
Assessments tests that are not
standardized, but are
scored on a level of
expected development -
test results indicate how
the student is performing
in relation to grade level
peers
1. Brigance Inventory of Basic Skills
2. Qualitative Reading Inventory (Listening
Comprehension Subtest, Passage Retelling)
3. Primary Observation Assessment
4. Developmental Reading Assessment
5. Assessment of Basic Language and Learning Skills
6. Verbal Behavior Milestones Assessment and
Placement Program
Individual: Test results indicate that the student lacks
skills or knowledge as compared to grade level peers
Group: Comparison to performance of grade level
peers on same measure in relation to the Common
Core or VT Standards which indicates that the student
is among the lowest 15%
MEASURE 6 Other Measures of
Performance class work that
demonstrates limited
ability when compared to
the performance of grade
level peers on the same
measure
1. Grade Expectation based rubric or rubric of
developmental standards for listening comprehension
skills
2. Language Sample by Speech Language Pathologist –
emphasis upon listening comprehension
3. Student work
4. Observation by Speech Language Pathologist in
learning environment
Comparison to performance of grade level peers on
same measure which indicates that the student is
among the lowest 15%

ADVERSE EFFECT CHARTS 2016
Adverse Effect Charts
(Revised: July 18, 2016)
Page 15 of 19
ORAL EXPRESSION EXAMPLES CRITERION FOR COMPARISON
MEASURE 1 Individually Administered
Nationally Normed Achievement
Test any standardized achievement test
that offers results in the form of
standard scores or percentiles
1. Woodcock Johnson Cluster Scores
2. Wechsler Individual Achievement Test Skill
Areas
3.Comprehensive Assessment of Speech &
Language
4.Comprehensive Receptive & Expressive
Vocabulary Test
5. Clinical Evaluation of Language Fundamentals –
Expressive Cluster
6. Oral and Written Language Scales – Expressive
Language Cluster
6. Test of Language Competence
7. Expressive Vocabulary Test
8. Expressive One-Word Picture Vocabulary Test
9. Test of Problem Solving (Expressive, pragmatic
measure)
10. Goldman-Fristoe Test of Articulation
11. Arizona Articulation Proficiency Scale
12. Batelle Developmental Inventory
Scores at or below the 15th percentile or 1 standard
deviation below the mean (typically a score of 85 or
below) using grade norms
MEASURE 2 Group Administered Nationally
Normed Achievement Test standardized tests that are given to
all students in a group format -
results provide national percentile
ranking
Scores at or below the 15th percentile or 1 standard
deviation below the mean (typically a score of 85 or
below) using grade norms
MEASURE 3 Grades
grades indicate that the student is
not meeting the standard or is
showing little evidence of meeting
the standard for that stage of
development
1. Most recent report card or progress report
2. Any grade that has been directly impacted by a
deficit in oral expression – ex. Class participation
3. Teacher determined grading systems
4. IEP based individualized grading systems
5. With a teacher statement that this child is within
the lowest 15%
Generally, in comparison to the Common Core
Standards, the VT Standards or Vermont Early
Learning Standards (VELS - kindergarten)
In heterogeneous classrooms, the student’s
grade is among the lowest 15% of grade level
peers
Otherwise, the student’s grades represent the
lowest 15% in comparison to the expected level
of performance for grade level peers

ADVERSE EFFECT CHARTS 2016
Adverse Effect Charts
(Revised: July 18, 2016)
Page 16 of 19
ORAL EXPRESSION EXAMPLES CRITERION FOR COMPARISON
MEASURE 4 Curriculum Based Measures
data that reports the student’s
performance over an extended
period of time – data is reported in
reference to a grade level
expectation - information is not
quantified in a standard score
format
1. Oral expression ability as compared to peers or
grade level expectations
when expressing ideas, responding to questions, or
when asked to do oral reports- Morning Meeting -
2. Speech Language Pathologist observation
3. Language sample
4. Rubric 1.15 Communication Standards –
Expression/Speaking
5. Teacher statement that the student is within the
lowest 15%
Comparison to performance of average grade level
peers on same measure which indicates that the
student is among the lowest 15%
MEASURE 5 Criterion Referenced Assessments
tests that are not standardized, but
are scored on a level of expected
development - test results indicate
how the student is performing in
relation to grade level peers
1. Oral retell from Developmental Reading
Assessment or Benchmark Assessment if retell is
clearly related to oral expression deficits versus
comprehension deficits
2. Peer comparison
3. Clinical Evaluation of Language Functioning -
Pragmatics Profile, Teacher Checklist in oral
expression
4. Qualitative Reading Inventory – Passage
Retelling (if retell is clearly related to oral
expression deficits versus comprehension deficits)
5. Assessment of Basic Language and Learning
Skills
6. Verbal Behavior Milestones Assessment and
Placement Program
Individual: Test results indicate that the student lacks
skills or knowledge as compared to grade level peers
Group: Comparison to performance of grade level
peers on same measure in relation to the Common
Core or VT Standards which indicates that the student
is among the lowest 15%
MEASURE 6 Other Measures of Performance
class work that demonstrates limited
ability when compared to the
performance of grade level peers on
the same measure
1. Grade Equivalent based rubric based on oral
expression skills
2. Developmental benchmarks for oral expression -
articulation standards
3. Language Samples
4. SLP observation in the learning environment
Comparison to performance of average grade level
peers on same measure which indicates that the
student is among the lowest 15%

ADVERSE EFFECT CHARTS 2016
Adverse Effect Charts
(Revised: July 18, 2016)
Page 17 of 19
MOTOR EXAMPLES CRITERION FOR COMPARISON
MEASURE 1 Individually Administered
Nationally Normed Achievement
Test any standardized achievement test
that offers results in the form of
standard scores or percentiles
1. Alberta Infant Motor Scales
2. Batelle Developmental Inventory
3. Bruinink-Oseretsky Test of Motor Proficiency
4. Klein-Bell Activities of Daily Living Scale
5. Kaufman Assessment Battery for Children
6. Miller Assessment for Preschoolers
7. Motor-Free Visual Perception Test
8. Movement Assessment Battery for Children
9. Peabody Developmental Motor Scales
10. Pediatric Evaluation of Disability Inventory
11. Behavior Problem Checklist
12. Standardized Sensory Assessment
13. Test of Gross Motor Development
14. Test of Visual-Motor Skills
15. Test of Visual-Perceptual Skills
16. WeeFIM
17. Pediatric Evaluation of Disability Inventory
Scores at or below the 15th percentile or 1
standard deviation below the mean (typically a
score of 85 or below) using grade norms
MEASURE 2 Group Administered Nationally
Normed Achievement Test standardized tests that are given to
all students in a group format -
results provide national percentile
ranking
Scores at or below the 15th percentile or 1
standard deviation below the mean (typically a
score of 85 or below) using grade norms
MEASURE 3 Grades
grades indicate that the student is
not meeting the standard or is
showing little evidence of meeting
the standard for that stage of
development
1. Most recent report card or progress report
2. Student’s motor skill level is within the lowest 15% when
compared to grade level peers
3. Teacher determined grading system
4. IEP based individualized grading systems
Generally, in comparison to the Common Core
Standards, the VT Standards or Vermont Early
Learning Standards (VELS - kindergarten)
In heterogeneous classrooms, the
student’s grade is among the lowest
15% of grade level peers
Otherwise, the student’s grades
represent the lowest 15% in comparison
to the expected level of performance
for grade level peers

ADVERSE EFFECT CHARTS 2016
Adverse Effect Charts
(Revised: July 18, 2016)
Page 18 of 19
MOTOR EXAMPLES CRITERION FOR COMPARISON
MEASURE 4 Curriculum Based Measures
data that reports the student’s
performance over an extended
period of time – data is reported in
reference to a grade level
expectation - information is not
quantified in a standard score
format
1. Charts, graphs, or checklists indicating student
performance over time
2. Classroom assessments
3. Fluency measures
4. Timed handwriting tests
5. Handwriting Without Tears assessment
6. Hoops, Groups and other Loops?
7. PE Skill checklists /assessments
Comparison to performance of average grade
level peers on same measure which indicates
that the student is among the lowest 15%
MEASURE 5 Criterion Referenced Assessments
tests that are not standardized, but
are scored on a level of expected
development - test results indicate
how the student is performing in
relation to grade level peers
1. Quality of Upper Extremity Skills Test
2. Pediatric Outcomes Data Collection Questionnaires
3. Juvenile Arthritis Self-Report Index
4. Gross Motor Function Measure
5. Erhardt Developmental Prehension Assessment
6. Early Intervention Developmental Profile
7. Child Development Inventory
8. Behavioral Assessment Scale of Oral Functions in
Feeding
9. Barthel Index
10. Activities Scales for Kids
11. School Functional Assessment
12. Canadian Occupational Performance Measure
13. Brigance Inventories
14. Goal Attainment Scaling
15. Heartland
16. HELP
17. Sensory Profile
18. Assessment of Basic Language and Learning Skills
19. Verbal Behavior Milestones Assessment and Placement
Program
Individual: Test results indicate that the
student lacks skills or knowledge as compared
with grade level peers
Group: Comparison to performance of average
grade level peers on same measure in relation
to the Common Core or VT Standards which
indicates that the student is among the lowest
15%
MEASURE 6 Other Measures of Performance
class work that demonstrates
limited ability when compared to
the performance of grade level
peers on the same measure
1. Student work
2. Alternative placement due to motor skill challenges
(Adaptive PE, etc.)
3. Observation by Occupational Therapist/Physical
Therapist in learning environment
Comparison to performance of grade level
peers on same measure which indicates that
the student is among the lowest 15%

ADVERSE EFFECT CHARTS 2016
Adverse Effect Charts
(Revised: July 18, 2016)
Page 19 of 19
FUNCTIONAL PERFORMANCE
Where a student demonstrates behavioral, emotional, adaptive behavior or social skills issues which may have an impact on their access to the
general education environment and progress in the general education curriculum, the Evaluation Planning Team must document the effect of
these functional performance concerns in determining a student’s adverse effect in a basic skill. This review would include both formal and
informal assessments, such as a combination of the examples for formal assessments below, coupled with observations of the student in structured
and unstructured environments and other anecdotal information related to the student’s functional performance.
EXAMPLES AREAS/VERSIONS FOR COMPARISON
1. Burks Behavior Rating Scale Parent and teacher behavior rating versions.
2. Behavior Assessment System for Children (BASC) Parent, teacher, and child behavior rating versions.
3. Conners Parent and Teacher Rating Scales Primarily used to determine Attention Deficit Hyperactivity Disorder (ADHD).
4. Child Behavior Rating Scales Measures behavior within a classroom setting.
5. Behavioral and Emotional Rating Scale Measures personal strengths and competencies. Parent, teacher. and child scales
6. Vanderbilt ADHD Teacher and Parent Rating Scales Used to determine ADHD.
7. Nisonger Child Behavior Rating Form
Parent and teacher versions for students with developmental or intellectual delays
and a third version for students with normal developmental levels.
8. The Assessment of Functional Living Skills
Measures six areas of functional behavior: Basic Living Skills; Home Skills and
Community Participation Skills; School Skills; Independent Living Skills and
Vocational Skills
9. Assessment of Basic Language and Learning
Specifically designed to assess functional skills for students in Applied Behavioral
Analysis (ABA) programs
10. Vineland Adaptive Behavior Scales
Normed by age groups. Teacher and Parent versions.
11. The Callier Asuza Scale Designed specifically for blind-deaf students.
12. Adaptive Behavior Assessment System Primarily for use with students with an intellectual disability.
13. Diagnostic Adaptive Behavior Scale Test of adaptive and functional skills for students with an intellectual disability.
14. Achenbach System of Empirically Based Assessment Assesses adaptive and maladaptive functioning in students