Adverse Child Sex Ratios Challenges for Development International Workshop on Feminist Economics in...
16
Adverse Child Sex Ratios Challenges for Development International Workshop on Feminist Economics in China and India Mary E John
-
Upload
belinda-mcbride -
Category
Documents
-
view
221 -
download
4
Transcript of Adverse Child Sex Ratios Challenges for Development International Workshop on Feminist Economics in...

Adverse Child Sex RatiosChallenges for Development
International Workshop on Feminist Economics in China and
India
Mary E John

The Adverse Child Sex Ratio
• Does the story begin with Amartya Sen?• Colonial north west India and female
infanticide• 1970s: Demographers discover long term
declines in overall sex ratios; correlated with poverty, low health and work patterns
• Women’s organisations and health activists discover abuse of amniocentesis testing for foetal abnormalities in 1982

The 1990s
• Joint activism by women and health groups results in first legislation against sex determination testing in Maharashtra in 1986
• 1991 Census data show a decline in both overall sex ratio to 927 and CSR (0-6) 945
• But north-western states CSR around 900• National law to regulate pre-natal diagnostic
techniques (PNDT Act) 1994
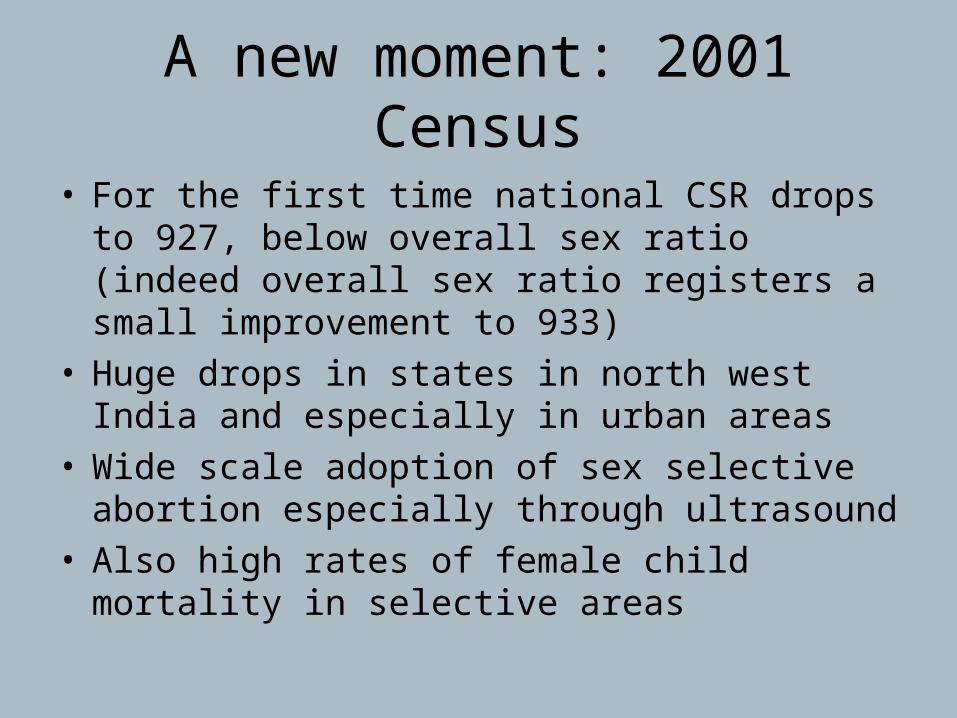
A new moment: 2001 Census
• For the first time national CSR drops to 927, below overall sex ratio (indeed overall sex ratio registers a small improvement to 933)
• Huge drops in states in north west India and especially in urban areas
• Wide scale adoption of sex selective abortion especially through ultrasound
• Also high rates of female child mortality in selective areas

• Uneven regional patterns
• “Prosperity Effect”
• Correlations of high education, lower fertility with skewed child sex ratios
• Two child norm
• Impunity of Medical Establishment
Problems

Responses
• State: PCPNDT Act (revised) in 2004• Various states launch Schemes for the
“girl child”• Religious and caste organisations now join
the fray, given very low CSRs among Sikhs and Hindus
• New researches both macro and micro• NGO campaigns• International focus

Planning Families, Planning Gender
• Study conducted by a team of researchers in low CSR districts in PU, HA, HP, RA, MP
• In depth analyses of contextual factors at work in these diverse contexts
• Ranging from poverty to affluence• Low CSRs especially among some groups and
sites• But not specific to particular castes and classes

Patterns of low CSR
• Diverse patterns
• Sex selection most prevalent and growing
• High female child mortality in pockets
• Cases of infanticide
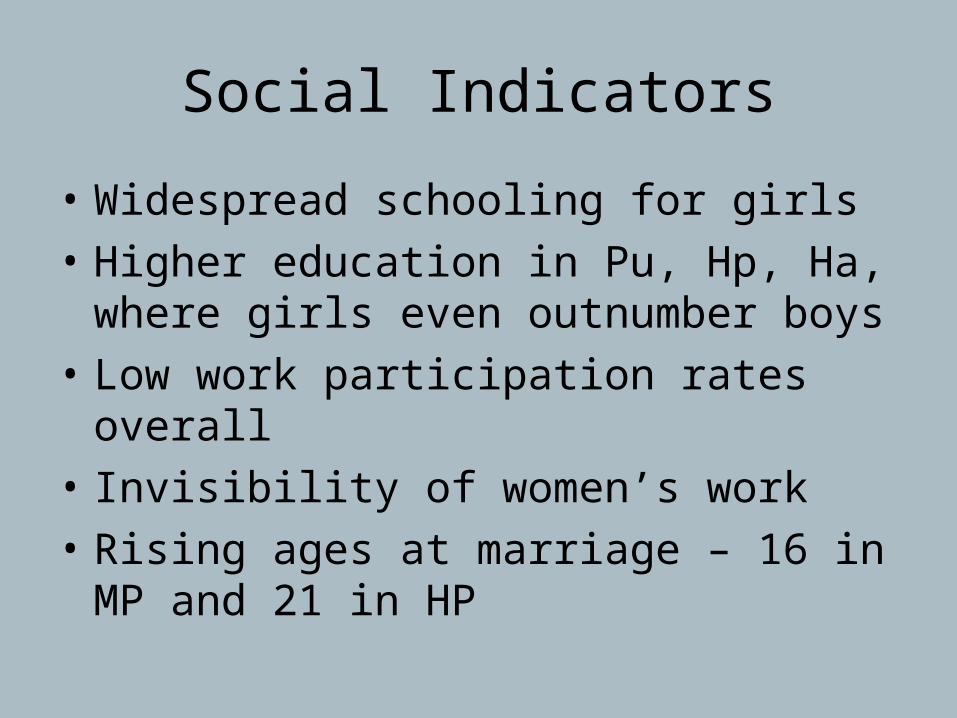
Social Indicators
• Widespread schooling for girls
• Higher education in Pu, Hp, Ha, where girls even outnumber boys
• Low work participation rates overall
• Invisibility of women’s work
• Rising ages at marriage – 16 in MP and 21 in HP

Fertility Patterns
• Stated preferences “one boy, one girl”, weak in MP strong in HP
• Fertility declines everywhere to different degrees
• Revealed preferences: growing proportion of families with one boy, one girl; but also two boys, two boys, one girl…
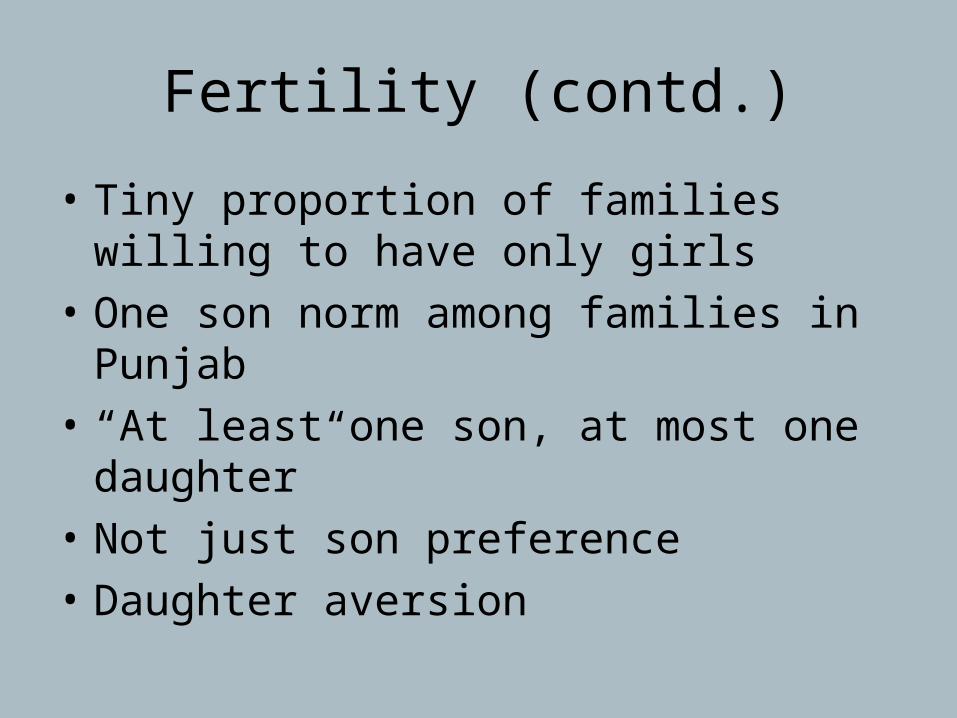
Fertility (contd.)
• Tiny proportion of families willing to have only girls
• One son norm among families in Punjab
• “At least one son, at most one daughter”
• Not just son preference
• Daughter aversion
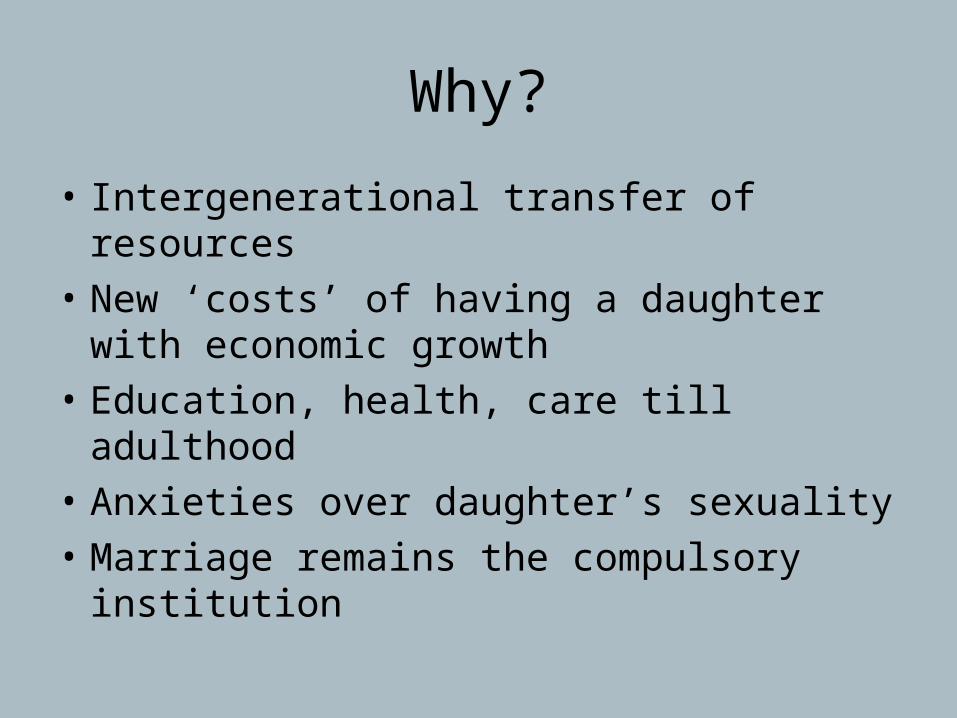
Why?
• Intergenerational transfer of resources
• New ‘costs’ of having a daughter with economic growth
• Education, health, care till adulthood
• Anxieties over daughter’s sexuality
• Marriage remains the compulsory institution

Problems and differences
• Aggressive use of technology by medical establishment locally and globally, ever newer technologies
• Shortage of “women” and “bare branches”
• Traditional and/or new forms of gender discrimination
• Ethics and language of choice
• Sex selection and the right to abortion
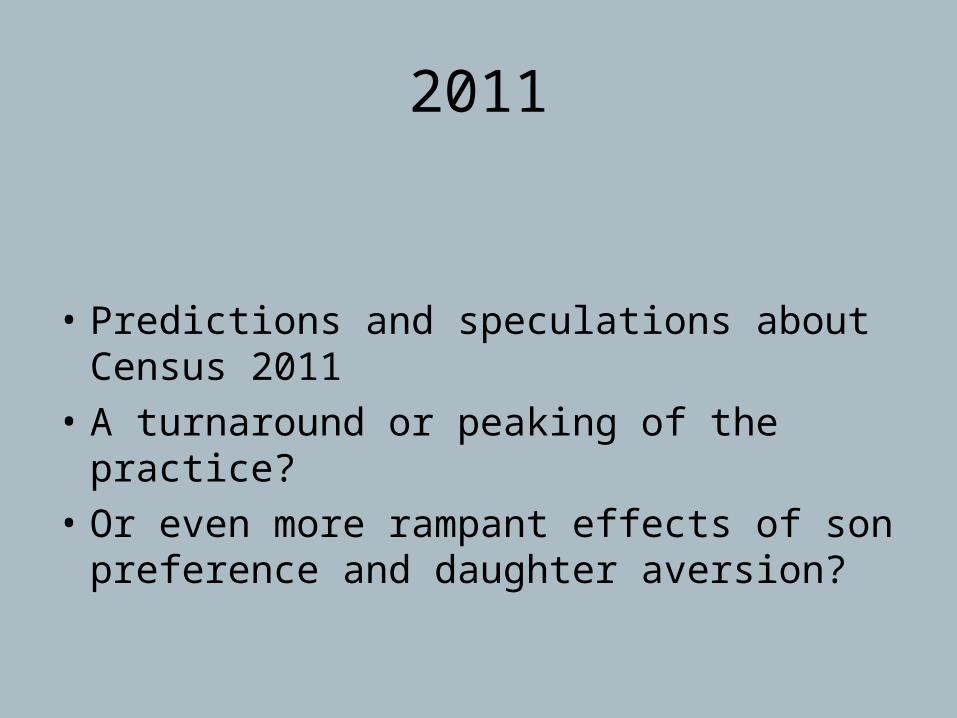
2011
• Predictions and speculations about Census 2011
• A turnaround or peaking of the practice?
• Or even more rampant effects of son preference and daughter aversion?

CHILD SEX RATIOS (0-6 years), NORTH-WESTERN REGIONCensus 1991, 2001 and 2011, Females per 1000 Males, Select States
State 1991 2001CHANGE2001-1991
2011CHANGE2011-2001
Himachal 951 896 -55 906 +10
Punjab 875 798 -77 846 +48
Haryana 879 819 -60 830 +11
Chandigarh 899 845 -46 867 + 22
Delhi 915 886 -49 888 + 2
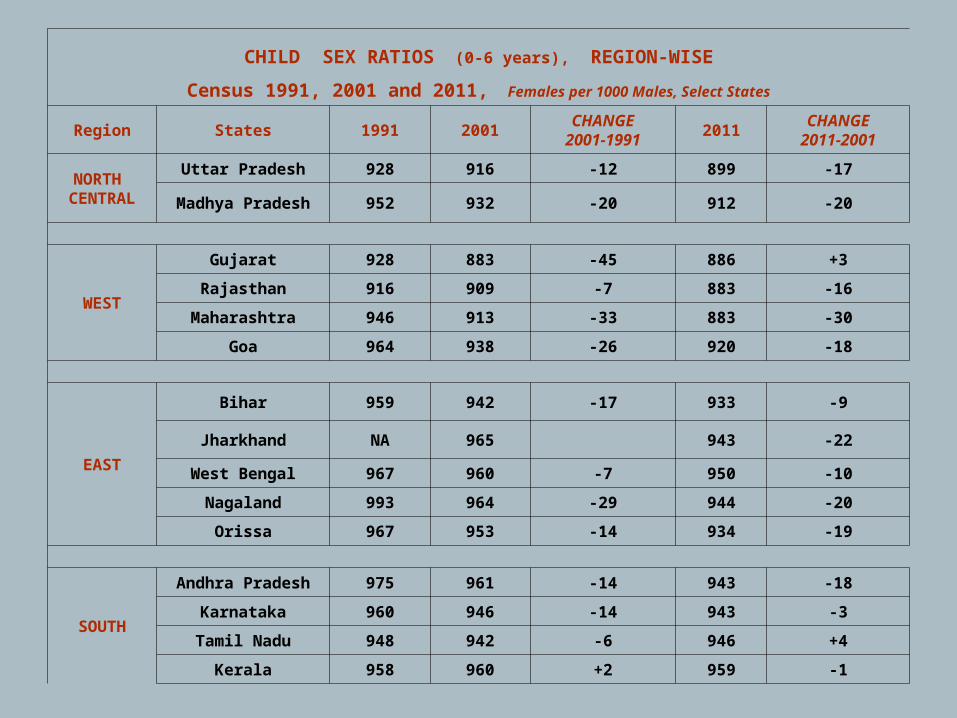
CHILD SEX RATIOS (0-6 years), REGION-WISE
Census 1991, 2001 and 2011, Females per 1000 Males, Select States
Region States 1991 2001CHANGE2001-1991
2011CHANGE2011-2001
NORTH CENTRAL
Uttar Pradesh 928 916 -12 899 -17
Madhya Pradesh 952 932 -20 912 -20
WEST
Gujarat 928 883 -45 886 +3
Rajasthan 916 909 -7 883 -16
Maharashtra 946 913 -33 883 -30
Goa 964 938 -26 920 -18
EAST
Bihar 959 942 -17 933 -9
Jharkhand NA 965 943 -22
West Bengal 967 960 -7 950 -10
Nagaland 993 964 -29 944 -20
Orissa 967 953 -14 934 -19
SOUTH
Andhra Pradesh 975 961 -14 943 -18
Karnataka 960 946 -14 943 -3
Tamil Nadu 948 942 -6 946 +4
Kerala 958 960 +2 959 -1