Advantaged and Reliable CoatingsMEK Methyl ethyl ketone MIBK Methyl isobutyl ketone MPK Methyl...
61
FINAL REPORT Scale-Up, Demonstration and Validation of Environmentally Advantaged and Reliable Coatings ESTCP Project WP-200303 JULY 2008 Roddy Keish Aeronautical Systems Center's Environmental Division (ASC) Lucas S. Reyher Thomas A. Ferrill Science Applications International Corporation (SAIC) Distribution Statement A This document has been cleared for public release
Transcript of Advantaged and Reliable CoatingsMEK Methyl ethyl ketone MIBK Methyl isobutyl ketone MPK Methyl...
FINAL REPORT Scale-Up, Demonstration and Validation of Environmentally
Advantaged and Reliable Coatings
ESTCP Project WP-200303
JULY 2008
Roddy Keish Aeronautical Systems Center's Environmental Division (ASC) Lucas S. Reyher Thomas A. Ferrill Science Applications International Corporation (SAIC)
Distribution Statement A
This document has been cleared for public release

This report was prepared under contract to the Department of Defense Environmental Security Technology Certification Program (ESTCP). The publication of this report does not indicate endorsement by the Department of Defense, nor should the contents be construed as reflecting the official policy or position of the Department of Defense. Reference herein to any specific commercial product, process, or service by trade name, trademark, manufacturer, or otherwise, does not necessarily constitute or imply its endorsement, recommendation, or favoring by the Department of Defense.
ii
07-30-2008 Final Report 03/2003 – 12/2007
FP 60-2 Final Report WP – 0303
Reyher, Lucas S. Ferrill, Thomas A.
Science Applications International Corporation 4031 Colonel Glenn Highway Beavercreek, OH 45431
Aeronautical Systems Center; Acquisition Environmental, Safety & Health Division; Pollution Prevention Branch 1801 Tenth Street, Bldg. B, Suite 2 Wright-Patterson AFB, OH 45433
ASC/ENVV
This Environmental Security Technology Certification Program (ESTCP) project focused on the demonstration and validation of the low Volatile Organic Compound/Hazardous Air Pollutant (VOC/HAP), rapid deposition, quick cure aerospace coating, FP 60-2. Testing and demonstration/validation activities were performed at Lockheed Martin Aeronautics Company (LM Aero) facilities within Air Force Plant 4 (AFP 4), Ft. Worth, TX and at the Northrop Grumman Corporation (Northrop) facility in El Segundo, CA. The results from this effort provided stakeholders with information required for the qualification of FP 60-2 for the weapons system of interest. FP 60-2 demonstrated environmental, application, and durability advantages relative to the current baseline, FP 60, which will result in significant life-cycle environmental and economic savings for the weapons system of interest. Aerospace Coatings, Low VOC, Paint Emissions, Rapid Deposition, Quick Cure, Durable
U U U UU 60
Roddy Keish
937-255-3541
Distribution Statement “A” applies. Approved for public release; distribution is unlimited
iii
TABLE OF CONTENTS ACRONYMS ............................................................................................................................................................. VI ACKNOWLEDGEMENTS .................................................................................................................................. VIII ABSTRACT ................................................................................................................................................................. 1 1. INTRODUCTION .............................................................................................................................................. 3
1.1 SCOPE OF ESTCP PROJECT WP-0303 ......................................................................................................... 3 1.2 BACKGROUND ............................................................................................................................................. 3 1.3 OBJECTIVES OF THE DEMONSTRATION ........................................................................................................ 4 1.4 REGULATORY DRIVERS ............................................................................................................................... 4 1.5 STAKEHOLDER/END-USER ISSUES ............................................................................................................... 4
2. TECHNOLOGY DESCRIPTION .................................................................................................................... 6 2.1 TECHNOLOGY DEVELOPMENT AND APPLICATION ....................................................................................... 6 2.2 PREVIOUS TESTING OF THE TECHNOLOGY ................................................................................................... 7 2.3 FACTORS AFFECTING COST AND PERFORMANCE......................................................................................... 7 2.4 ADVANTAGES AND LIMITATIONS OF THE TECHNOLOGY ............................................................................. 8
3. DEMONSTRATION DESIGN ....................................................................................................................... 11 3.1 PERFORMANCE OBJECTIVES ...................................................................................................................... 11 3.2 SELECTING TEST PLATFORMS/FACILITIES ................................................................................................. 11 3.3 TEST PLATFORM/FACILITY CHARACTERISTICS/HISTORY .......................................................................... 12
3.3.1 Northrop Facility, El Segundo, CA ...................................................................................................... 12 3.3.2 AFP 4, Ft. Worth, TX ........................................................................................................................... 12
3.4 PRESENT OPERATIONS ............................................................................................................................... 12 3.5 PRE-DEMONSTRATION TESTING AND ANALYSIS ....................................................................................... 13 3.6 TESTING AND EVALUATION PLAN ............................................................................................................. 13
3.6.1 Demonstration Set-Up and Start-Up ................................................................................................... 13 3.6.2 Period of Operation ............................................................................................................................. 14 3.6.3 Amount/Treatment Rate of Material to be Treated .............................................................................. 14
3.6.3.1 Lab-Scale Application Study ..................................................................................................................... 14 3.6.3.2 Weapon System Material Performance Specification Testing ................................................................... 14 3.6.3.3 Airflow Testing .......................................................................................................................................... 14 3.6.3.4 Full-Scale Application Study ..................................................................................................................... 15 3.6.3.5 Puffer Box Testing ..................................................................................................................................... 15
3.6.4 Operating Parameters for the Technology .......................................................................................... 16 3.6.4.1 Lab-Scale Application Study ..................................................................................................................... 16 3.6.4.2 Weapon System Material Performance Specification Testing ................................................................... 17 3.6.4.3 Airflow Testing .......................................................................................................................................... 17 3.6.4.4 Full-Scale Application Study ..................................................................................................................... 18 3.6.4.5 Puffer Box Testing ..................................................................................................................................... 19
3.6.5 Experimental Design............................................................................................................................ 19 3.6.5.1 Lab-Scale Application Study ..................................................................................................................... 19 3.6.5.2 Full-Scale Application Study ..................................................................................................................... 20
3.6.6 Product Testing .................................................................................................................................... 21 3.6.7 Demobilization ..................................................................................................................................... 22
3.7 SELECTION OF ANALYTICAL/TESTING METHODS ...................................................................................... 22 3.7.1 Lab-Scale Application Study ................................................................................................................ 22 3.7.2 Weapon System Material Performance Specification Testing ............................................................. 23 3.7.3 Airflow Testing ..................................................................................................................................... 24 3.7.4 Full-Scale Application Study ............................................................................................................... 24 3.7.5 Puffer Box Testing ............................................................................................................................... 25
iv
3.8 SELECTION OF ANALYTICAL/TESTING LABORATORY ................................................................................ 25 4. PERFORMANCE ASSESSMENT ................................................................................................................. 26
4.1 PERFORMANCE CRITERIA .......................................................................................................................... 26 4.2 PERFORMANCE CONFIRMATION METHODS ............................................................................................... 26 4.3 DATA ANALYSIS, INTERPRETATION AND EVALUATION ............................................................................. 29
5. COST ASSESSMENT ..................................................................................................................................... 33 5.1 COST REPORTING ...................................................................................................................................... 33 5.2 COST ANALYSIS ........................................................................................................................................ 37
5.2.1 Cost Comparison ................................................................................................................................. 37 5.2.2 Cost Basis ............................................................................................................................................ 37 5.2.3 Cost Drivers ......................................................................................................................................... 38 5.2.4 Life Cycle Costs ................................................................................................................................... 38
5.2.4.1 Facility Capital Cost .................................................................................................................................. 38 5.2.4.2 Startup, Operations, and Maintenance Costs .............................................................................................. 38 5.2.4.3 Equipment Replacement Costs .................................................................................................................. 40 5.2.4.4 Re-application Costs .................................................................................................................................. 40 5.2.4.5 Financial Metrics ....................................................................................................................................... 40
6. PERFORMANCE ANALYSIS – OVERALL ESTCP PROJECT WP-0303.............................................. 45 6.1 ENVIRONMENTAL PERFORMANCE ANALYSIS – OVERALL ESTCP PROJECT WP-0303 .............................. 45 6.2 ECONOMIC PERFORMANCE ANALYSIS – OVERALL ESTCP PROJECT WP-0303 ........................................ 46 6.3 OVERALL ANALYSIS OF ESTCP PROJECT WP-0303 ................................................................................. 48
7. IMPLEMENTATION ISSUES ....................................................................................................................... 49 7.1 ENVIRONMENTAL PERMITS ....................................................................................................................... 49 7.2 OTHER REGULATORY ISSUES .................................................................................................................... 49 7.3 END-USER/ORIGINAL EQUIPMENT MANUFACTURER (OEM) ISSUES ......................................................... 49
8. REFERENCES ................................................................................................................................................. 51 9. POINTS OF CONTACT .................................................................................................................................. A
v
LIST OF FIGURES FIGURE 1: DURATIONS OF DEMONSTRATION PHASES FOR FP 60-2 ............................................................................... 14 FIGURE 2 – PUFFER BOX AFTER BLOCK 4 .................................................................................................................... 31 FIGURE 3 – PUFFER BOX AFTER BLOCK 4 .................................................................................................................... 31
LIST OF TABLES TABLE 1: PERFORMANCE OBJECTIVES .......................................................................................................................... 11 TABLE 2: LABORATORY-SCALE APPLICATION STUDY MONITORING ............................................................................ 19 TABLE 3: MAXIMUM BUILD RATE STUDY MONITORING .............................................................................................. 20 TABLE 4: FULL-SCALE PROTOTYPE APPLICATION STUDY MONITORING ...................................................................... 21 TABLE 5: SUBSTRATES USED AND REPORTS WRITTEN FOR EACH PHASE OF TESTING ................................................. 22 TABLE 6: LABORATORY-SCALE APPLICATION STUDY ANALYTICAL PROCEDURES ...................................................... 23 TABLE 7: WEAPON SYSTEM MATERIAL PERFORMANCE SPECIFICATION ANALYTICAL PROCEDURES .......................... 23 TABLE 8: AIRFLOW TEST ANALYTICAL PROCEDURES .................................................................................................. 24 TABLE 9: MAXIMUM BUILD RATE STUDY ANALYTICAL PROCEDURES ........................................................................ 24 TABLE 10: FULL-SCALE PROTOTYPE APPLICATION STUDY ANALYTICAL PROCEDURES .............................................. 25 TABLE 11: PUFFER BOX TEST ANALYTICAL PROCEDURES ........................................................................................... 25 TABLE 12: PERFORMANCE CRITERIA ............................................................................................................................ 26 TABLE 13: EXPECTED AND ACTUAL PERFORMANCE CRITERIA AND PERFORMANCE CONFIRMATION METHODS ......... 28 TABLE 14: EXPECTED VOC AND HAP LIFE-CYCLE REDUCTIONS FOR THE WS OF INTEREST ..................................... 29 TABLE 15: SUMMARY OF AVERAGED FULL-SCALE APPLICATION STUDY RESULTS ..................................................... 30 TABLE 16: ECAM COST REPORTING TABLE FOR BASELINE MATERIAL (FP 60) .......................................................... 35 TABLE 17: ECAM COST REPORTING TABLE FOR FP 60-2 ............................................................................................ 36 TABLE 18: DOD-WIDE LIFE-CYCLE COST SAVINGS FOR FP 60-2 IMPLEMENTATION ................................................... 42 TABLE 19: ESTCP LIFE-CYCLE COST SAVINGS FOR FP 60-2 IMPLEMENTATION ......................................................... 42 TABLE 20: SUMMARY OF EXPECTED FINANCIAL METRICS FROM IMPLEMENTATION OF FP 60-2 ................................. 43 TABLE 21: EXPECTED VOC AND HAP LIFE-CYCLE REDUCTIONS FOR THE FP 212-TARGETED WEAPON SYSTEM OF
INTEREST ............................................................................................................................................................ 45 TABLE 22: EXPECTED VOC AND HAP LIFE-CYCLE REDUCTIONS FOR THE FP 60-2 AND FP 212-TARGETED WEAPON
SYSTEMS OF INTEREST ........................................................................................................................................ 46 TABLE 23: SUMMARY OF EXPECTED FINANCIAL METRICS RESULTING FROM IMPLEMENTATION OF FP 212 ............... 47 TABLE 24: SUMMARY OF EXPECTED FINANCIAL METRICS RESULTING FROM IMPLEMENTATION OF FP 60-2 AND FP
212 ..................................................................................................................................................................... 47
vi
ACRONYMS
AFB Air Force Base AFP Air Force Plant AFRL/MLSC Air Force Research Laboratory, Materials and Manufacturing Directorate,
Acquisition Systems Support Branch AMS Aerospace Material Specification ASC/ENVV Aeronautical Systems Center, Acquisition Environmental, Safety & Health
Division, Pollution Prevention Branch ASTM American Society for Testing and Materials BACT Best Available Control Technology CAA Clean Air Act DoD Department of Defense ECAM Environmental Cost Analysis Methodology EPA Environmental Protection Agency ESTCP Environmental Security Technology Certification Program FED-STD Federal Standard FP 212 Second Weapon System’s Formulated 002-Based Coating FP 60 Weapon System’s Baseline Coating FP 60-2 Weapon System’s Formulated 002-Based Coating g/L Grams per Liter GOCO Government-Owned, Contractor-Operated HAP Hazardous Air Pollutant IRR Internal Rate of Return LCC Life-Cycle Cost LM Aero Lockheed Martin Aeronautics Company M Mach MEK Methyl ethyl ketone MIBK Methyl isobutyl ketone MPK Methyl propyl ketone Mil 0.001 inches NDCEE National Defense Center for Environmental Excellence NESHAP National Emission Standards for Hazardous Air Pollutants Northrop Northrop Grumman Corporation NPV Net Present Value OEM Original Equipment Manufacturer OMB Office of Management and Budget PDM Programmed Depot Maintenance PPE Personal Protective Equipment QPL Qualified Products List RH Relative Humidity SAIC Science Applications International Corporation SPO System Program Office
vii
TIM Technical Interchange Meeting UV Ultraviolet VOC Volatile Organic Compound WPAFB Wright-Patterson Air Force Base WS Weapon System
viii
ACKNOWLEDGEMENTS
This Final Report was prepared by Science Applications International Corporation (SAIC) employees Lucas Reyher and Thomas Ferrill under the guidance of James Byron at the SAIC, Dayton, OH facility. This report was completed under Project Number WP-0303 for the Environmental Security Technology Certification Program (ESTCP). Special acknowledgements go to all Lockheed Martin Aeronautics Company (LM Aero) and Northrop Grumman Corporation (Northrop) personnel who supported this program. Individuals at LM Aero who were key to this program’s success include Randall Reed, Greg Flusche, John Schueler, and Mike Miller. Northrop personnel who made invaluable contributions to this program include Stan Bean, Bobby Dabbs, Ralph Jaffke, and Kevin Corcoran. Numerous spray operators from LM Aero and Northrop contributed significantly to this program by preparing test specimens and performing lab-scale and full-scale application studies. Within the Aeronautical Systems Center, Acquisition Environmental, Safety & Health Division, Pollution Prevention Branch (ASC/ENVV), Wright-Patterson Air Force Base (WPAFB), OH, gratitude is given to Capt Lowell Usrey, Frank Ivancic, Frank Brown, and Roddy Keish for providing program management and coordination between all interested parties. Personnel from the Air Force Research Laboratory (AFRL), WPAFB, OH, provided excellent technical oversight and recommendations throughout this program. Special thanks are given to ESTCP for supporting this program and for promoting good stewardship of the environment through the demonstration and validation of innovative environmental technologies.
1
ABSTRACT
The need for ESTCP Project WP-0303 resulted from two primary issues with conventional aerospace coatings: long application times and high Volatile Organic Compound (VOC) contents. Applying these coatings to desired thicknesses often requires significant labor hours for application, requiring multiple application passes of only a few mils (mil = 0.001 inch) per pass while allowing 5 to 10 minutes between passes for solvent flash. Once material application is complete, long cure times often create bottlenecks in Department of Defense (DoD) production and Programmed Depot Maintenance (PDM) processes and result in logistical issues during field repairs. These coatings often contain significant quantities of VOCs and Hazardous Air Pollutants (HAPs). The continued use of these high-VOC/HAP processes presents significant logistical and safety issues, as well as relatively long manufacturing/repair flow times. Two Weapon Systems (WS) were identified as having potential to benefit greatly from low VOC, rapid deposition, quick cure aerospace coatings. ESTCP Project WP-0303 focused on demonstrating and validating two separate low VOC, rapid deposition, quick cure aerospace coatings, FP 60-2 and FP 212, one for each of the WS platforms of interest. This ESTCP Final Report summarizes the demonstration and validation of FP 60-2. A separate ESTCP Final Report was completed for FP 212 and is available from ESTCP. The objectives of the program summarized in this report were to qualify FP 60-2 for the WS of interest and to demonstrate the environmental and economic advantages that FP 60-2 has relative to one of the baseline coatings, FP 60, of the WS of interest. Lab-scale performance testing showed that the material performance properties of FP 60-2 were similar to FP 60 and allowed FP 60-2 to be added to the Qualified Product List (QPL) of the WS of interest. A full-scale application study provided side-by-side comparisons of the application properties of FP 60 and FP 60-2. It was determined that FP 60-2 can be built up to desired thickness much quicker and reaches full cure quicker than FP 60. The full-scale application study was performed using full-scale spray equipment to apply FP 60 and FP 60-2 to a full-scale engineering prototype of a section of the WS that FP 60-2 will be applied to when transitioned. The results from this full-scale application study are highly accurate for determining the impacts of FP 60-2 application during production and PDM processes. During this program, it was discovered that FP 60-2 is much more durable in maritime environments than FP 60, due mainly to the use of a new and improved resin (002 resin) in the formulation of FP 60-2. This was an unexpected benefit that should result in significant life-cycle VOC and HAP emission reductions and significant reductions in Life-Cycle Costs (LCC) for the WS of interest.
The testing performed during this program demonstrated significant environmental advantages of FP 60-2 compared to FP 60. The VOC content of FP 60-2 is 213 g/L, which is a 51 percent reduction in VOC content relative to FP 60, with a VOC content of 432 g/L. This reduction in VOC content is expected to decrease VOC and HAP emissions by 386,840 pounds and 447,625 pounds, respectively, for production and PDM processes during the life-cycle of the WS of interest. While these reductions are significant, they will most likely not result in decreased monitoring, permitting, and controlling costs and responsibilities associated with VOC emissions
2
at the facilities where the WS is produced, according to environmental managers at these facilities. The location of PDM activities for the WS of interest has not yet been determined. Consequently, an evaluation of the impact of decreased VOC and HAP emissions to PDM facilities is not yet possible. This program also demonstrated significant economic advantages of FP 60-2 relative to FP 60. The application advantages of FP 60-2 demonstrated during the full-scale application study will decrease labor hours for material application and will decrease production flow times. The increased durability of FP 60-2 in maritime environments will virtually eliminate depot-level repairs that would have been required to FP 60. These depot-level repairs would require aircraft down-time, material purchase and usage, significant labor hours for repair and material reapplication, and would generate VOC emissions. The advantages of FP 60-2 relative to FP 60 are projected to result in LCC savings of $49 million (in current-year dollars) over the next 40 years, a payback period of less than one year on funding contributions from ESTCP and DoD as a whole, and an Internal Rate of Return (IRR) of 49.5 percent and 36.9 percent for ESTCP and DoD, respectively. As a result of the exceptional performance of FP 60-2 relative to FP 60, the decision has been made by relevant Original Equipment Manufacturer (OEM) and Systems Program Office (SPO) managers and engineers to transition additional 002 resin-based materials besides FP 60-2 to the WS of interest. These materials are expected to exhibit the same increased durability in maritime environments relative to the materials that they will replace that FP 60-2 exhibits in maritime environments relative to FP 60. Therefore, as a result of this ESTCP program, the life-cycle environmental and economic benefits for the WS of interest are expected to be orders of magnitude higher than those stated in this report.
FP 60-2 is one of three potential alternatives for the baseline coating, FP 60. However, FP 60-2 is currently the only fully qualified drop-in replacement for FP 60. A mold-in-place coating is being evaluated to replace certain portions of FP 60 application to the WS of interest. An Ultraviolet (UV) Cure coating is being evaluated primarily as a repair material for FP 60. Unlike FP 60-2, these coatings will not be drop-in replacements for FP 60 due to their special application methods. Additionally, these other potential alternatives may not have the same durability benefits in maritime environments relative to FP 60 that FP 60-2 has. Finally, FP 60-2 will replace FP 60 in its entirety during production processes at AFP 42 and AFP 4, while the other two potential alternatives are being evaluated to replace only certain portions of FP 60 during production processes or when repairs are required.
FP 60-2 has been approved for application to the WS of interest by the relevant OEM and SPO decision makers. Production acceptance testing is currently being performed on FP 60-2, which is the final evaluation phase prior to implementation. It is highly probable that production acceptance testing will be successful for FP 60-2 due to the exceptional performance of FP 60-2 during all previous phases of testing.
3
1. INTRODUCTION
1.1 Scope of ESTCP Project WP-0303 The overall scope of this ESTCP Project (WP-0303) focused on testing and demonstrating two low Volatile Organic Compound (VOC), rapid deposition, quick cure aerospace coatings. These coatings, FP 60-2 and FP 212, were formulated to meet the material property requirements of separate Weapon Systems (WS). At the start of this ESTCP program, FP 60-2 and FP 212 were in different stages of development and use and had different qualification and demonstration requirements for the two WS platforms of interest, which necessitated two separate ESTCP Demonstrations Plans, one for FP 60-2 and one for FP 212. Separate ESTCP Final Reports were written to report on the results of completing the two Demonstration Plans. This report addresses the demonstration and validation of FP 60-2, with periodic references to FP 212 test results that provided risk reduction for FP 60-2 demonstration and validation. The ESTCP Final Report for FP 212 is available from ESTCP.
1.2 Background Conventional aerospace coatings are typically applied as paints to varying thicknesses, depending on the specific application. Applying these coatings to desired thicknesses often requires significant labor hours for application, requiring multiple application passes of only a few mils (mil = 0.001 inch) per pass while allowing 5 to 10 minutes between passes for solvent flash. Typical aerospace coating stack-up applications require several hours and multiple working shifts to complete, as well as long cure times which often create bottlenecks in Department of Defense (DoD) production and Programmed Depot Maintenance (PDM) processes and result in logistical issues during field repairs. These coatings often contain significant quantities of Volatile Organic Compounds (VOCs) and Hazardous Air Pollutants (HAPs) such as Methyl Ethyl Ketone (MEK), Methyl Isobutyl Ketone (MIBK), toluene, or xylene. The continued use of these high-VOC/HAP processes presents significant logistical and safety issues, as well as relatively long manufacturing/repair flow times. Use of low VOC, rapid deposition, quick cure aerospace coatings has the potential beneficial impacts of improving worker safety, reducing VOC/HAP emissions, and decreasing the flow times of manufacturing and repair processes. This program demonstrated the performance of a low VOC, rapid deposition, quick cure aerospace coating, designated FP 60-2. The VOC content of FP 60-2 is 213 g/L, which is a 51 percent reduction in VOC content relative to the baseline coating, FP 60, with a VOC content of 432 g/L. The relatively low VOC content of FP 60-2 was achieved by using acetone as the primary solvent. According to Environmental Protection Agency (EPA) guidelines, acetone is not considered a VOC since it does not react with atmospheric compounds to form ozone in the lower atmosphere. Acetone was also the main driver for the rapid deposition, quick curing nature of FP 60-2. The vapor pressure of acetone is relatively high (180 mmHg at 20°C), which allows much of it to evaporate prior to reaching the substrate when FP 60-2 is being applied, resulting in relatively high effective build rates (mils/pass) and quick cure times.
4
Lab-scale studies were performed on FP 60-2 to assess physical, mechanical, and application properties. These lab-scale tests provided the data required for qualification of FP 60-2 to the relevant material specifications. The full-scale capabilities of FP 60-2 were demonstrated and validated during full-scale application studies.
1.3 Objectives of the Demonstration The objectives of this demonstration were to validate that FP 60-2 is a viable drop-in replacement for one of the baseline materials (FP 60) of the WS of interest and that FP 60-2 had certain environmental, application, and sprayability advantages relative to FP 60. Multiple test phases were used to evaluate the material properties and application properties of FP 60-2 and to determine if the objectives were achieved. A lab-scale application study was performed on FP 60-2 at the Northrop Grumman Corporation (Northrop) facility in El Segundo, CA by Northrop and Lockheed Martin Aeronautics Company (LM Aero) personnel. LM Aero conducted material performance testing, air flow testing, and a full-scale application study on FP 60-2 at Air Force Plant 4 (AFP 4), Ft. Worth, TX, which is a Government Owned Contractor Operated (GOCO) facility. The formulation of FP 60-2 results in a 51 percent reduction in VOC content relative to FP 60 (213 g/L vs. 432 g/L). The material performance testing confirmed that the physical, mechanical, and other properties of FP 60-2 are acceptable and allowed FP 60-2 to be listed on the Qualified Products List (QPL) of the WS of interest. The lab-scale and full-scale application studies confirmed that FP 60-2 can be built up to desired thickness much quicker than FP 60, due to increased build rate (mils/pass) and decreased cure time, which can lead to decreased labor hours and process time for material application and cure time relative to FP 60. During this program, the durability of FP 60-2 in a simulated maritime environment was observed to be significantly superior to the durability of FP 60 in the same environment. This was an unexpected advantage of FP 60-2 relative to FP 60 that should result in significant reductions in the Life-Cycle Costs (LCC) and life-cycle VOC and HAP emissions for the WS of interest.
1.4 Regulatory Drivers Title V of the Clean Air Act (CAA) was the primary regulatory driver for this project. Aerospace coating stack-ups often contribute significantly to a facility’s overall emissions, which are subject to state, local and site restrictions on total VOC emissions.
1.5 Stakeholder/End-User Issues In order to replace the baseline material, FP 60, which had already been qualified to the WS of interest at the start of this program, FP 60-2 had to pass all goals in the material performance specification of the WS of interest and show environmental and economic advantages relative to FP 60. Results from the material performance testing that LM Aero performed at AFP 4, which was performed in accordance with the material performance specification of the WS of interest, were favorable and allowed FP 60-2 to be included on the QPL of the WS of interest. Environmental advantages of FP 60-2 relative to FP 60 are expected due to a 51 percent decrease in VOC content. The lab-scale and full-scale application studies that Northrop and LM Aero performed showed that FP 60-2 can be built up to desired thickness much quicker and can cure

5
quicker than FP 60, which will lead to material application and process time advantages. Airflow testing performed on FP 60 and FP 60-2 showed that FP 60-2 performs the same as FP 60 in high velocity airflow. The unexpected advantage of superior durability in maritime environments was viewed by stakeholders as a monumental benefit that FP 60-2 has relative to FP 60. The performance of FP 60-2 during this program provided stakeholders and decision makers from the Original Equipment Manufacturers (OEMs) and Systems Program Office (SPO) with the justification to conclude that FP 60-2 is qualified for use on the WS of interest and should have significant environmental and economic advantages relative to FP 60.
The depot site for the WS program has not yet been determined. No discussion can be made concerning depot managers who must accept the technology. However, the increased durability of FP 60-2 in maritime environments compared to FP 60 are expected to significantly decrease the frequency and extent of depot-level repairs for FP 60-2 during the life-cycle of the WS of interest.
6
2. TECHNOLOGY DESCRIPTION
2.1 Technology Development and Application This program focused on providing a low VOC, rapid deposition, quick cure alternative to the baseline coating, FP 60. Key parameters considered during the formulation of FP 60-2 were VOC content and application time. Following were key FP 60-2 design criteria:
• Significant reduction (≥ 75%) of coating application times • Significant reduction (≥ 50%) of VOC emissions • Drop-in replacement for existing coating
FP 60-2 was formulated by the same material supplier that formulated FP 60. FP 60-2 was designed to be a drop-in replacement for FP 60. To address lowering the VOC content, FP 60-2 was partially formulated with solvents that are exempt from VOC status by EPA standards. VOCs are defined as compounds that readily evaporate and react with other compounds in the lower atmosphere to form ozone. Examples of VOCs include xylene, toluene, and MEK. Exempt solvents are ones that do not readily react with other atmospheric compounds to form ozone and are therefore not considered VOCs by EPA standards. Examples of exempt solvents include Oxsol 100® and acetone. The solvents used in FP 60-2 are Methyl Propyl Ketone (MPK - non-exempt) and acetone (exempt). This solvent package gives FP 60-2 a VOC content of 213 g/L, compared to 432 g/L for FP 60. The use of acetone in the formulation of FP 60-2 was the main driver for the rapid deposition, quick curing nature of FP 60-2. The vapor pressure of acetone is relatively high (180 mmHg at 20°C), which allows much of it to evaporate prior to reaching the substrate when FP 60-2 is being sprayed. As a result of the relatively small quantity of acetone that reaches the substrate, vertical shrinkage of the wet material is minimized, which increases the effective (dry) build rate (mils/pass). This allows FP 60-2 to be built up to desired thickness much faster than FP 60, which does not have acetone in its formulation. Additionally, since there is only a small quantity of acetone that reaches the substrate and since acetone has such a high vapor pressure, FP 60-2 quickly cures to the point that it is dry-to-sand. The dry-to-sand time is the time required for a coating to cure to the point that it can be sanded without gumming up or balling up. After a coating is dry-to-sand, the next important cure time metric is time-to-overcoat, which is the cure time required before a coating can have materials applied over it. When a material has reached the time-to-overcoat, it is an indication that solvent evaporation out of the material has slowed to the point that surface finishes of materials applied above it will not be adversely impacted by defects such as bubbling and orange peel caused by solvent evaporation. The time from application of first coat to dry-to-sand time of final coat after being built up to a common thickness was determined for FP 60 and FP 60-2. As results will show, FP 60-2 reaches this point much more quickly than FP 60, which is an indication that FP 60-2 can be topcoated much more quickly than FP 60 and should lead to decreased production and maintenance times in processes where the application of FP 60-2 a limiting factor.
7
The chronology of development of FP 60-2 began in the fall of 1999. A program was initiated out of the Air Force Research Laboratory, Materials and Manufacturing Directorate, Acquisition Systems Support Branch (AFRL/MLSC) at Wright-Patterson Air Force Base (WPAFB), OH to develop aerospace coatings characterized by low VOC content and decreased overall application time relative to existing baseline aerospace coatings. The AFRL program ended with the successful development of two coatings that met all AFRL program goals. One coating was formulated with a supplier-designated 002 resin. When this Environmental Security Technology Certification Program (ESTCP) effort began, Science Applications International Corporation (SAIC) worked with LM Aero and the material supplier to formulate FP 60-2 using the 002 resin as the base.
2.2 Previous Testing of the Technology The 002 resin, which acts as the base resin for FP 60-2, was formulated and initially tested in the form of a different type of material than FP 60-2 during a project funded by AFRL/MLSC at WPAFB, OH. This 002 resin-based material was downselected from a group of 9 initial materials formulated for low VOC content and quick cure times and tested thoroughly for physical, mechanical, and resistance properties. Based on the impressive environmental and performance results of this 002 resin-based material generated during the AFRL program, the 002 resin was chosen as the base resin for FP 60-2.
2.3 Factors Affecting Cost and Performance The cost of implementing and applying FP 60-2 during production processes and repair processes should be much less than for FP 60. FP 60-2 is a drop-in replacement for FP 60, which eliminates costs associated with transitioning to FP 60-2, such as training and equipment/facility modifications. FP 60-2 costs approximately 4 percent more than FP 60 on a per-gallon basis, but the application and durability advantages will offset this increase in price by many orders of magnitude. The application advantages of FP 60-2 relative to FP 60 should lead to reductions in labor hours and process flow time in processes where application of FP 60-2 is a limiting factor. While reductions in VOC and HAP emissions should be significant over the lifetime of the WS of interest, there will be negligible cost impacts to production facilities where FP 60-2 is applied. Best Available Control Technology (BACT) applied at AFP 42 will destroy the majority of VOC/HAP emissions, so the lower VOC content of FP 60-2 will not have an impact on VOC emissions or on any costs associated with VOC/HAP emissions, such as monitoring and permitting costs, at AFP 42. There is expected to be a reduction in VOC emissions at AFP 4 since VOC-destroying BACT is not in use, but AFP 4 is currently not in a non-attainment zone, so permitting costs will not be impacted, nor will monitoring and reporting costs, according to AFP 4 facilities personnel. The depot site for the weapon system of interest has not yet been selected, so the impact to depot facilities of decreased VOC content is not yet known. The most significant factor affecting the cost of using FP 60-2 is the increased durability in maritime environments relative to FP 60. The increased durability is expected to significantly reduce the frequency and extent of repairs that would have been required for FP 60 applied to
8
aircraft operating in maritime environments. All costs associated with repairs, including material purchase, labor hours, and aircraft down-time, will be significantly reduced by transitioning to FP 60-2. The performance of FP 60-2 during material application will largely be affected by the solvents that FP 60-2 has been formulated with, which should lead to increased build rate and decreased cure time. During the lab-scale application study, it was discovered that the build rate and cure time of FP 60-2 are enhanced when FP 60-2 is applied under elevated temperature and humidity conditions. However, application of FP 60-2 during production processes will occur under “normal” environmental conditions that are similar to those that were used during the full-scale application study [78°F, 60% Relative Humidity (RH)]. Under these conditions, FP 60-2 shows application advantages relative to FP 60, but not to the extent that would be realized if material application was performed under elevated temperature and humidity conditions. The performance of FP 60-2 during aircraft operation will largely be impacted by the 002 resin system that acts as the base of the FP 60-2 formulation. The 002 resin has proven to be extremely durable in maritime environments, compared to the durability of the 001 resin that is used in the formulation of FP 60, which should significantly decrease the frequency and extent of repairs that will be made to FP 60-2 during an aircraft lifetime.
2.4 Advantages and Limitations of the Technology Prior to the qualification of FP 60-2, FP 60 was the only coating that had been qualified to the WS material performance specification for application onto certain areas of the WS. The successful testing and qualification of FP 60-2 per the WS material performance specification has positioned FP 60-2 as currently the only existing and fully qualified alternative to FP 60. There are two other technologies in addition to FP 60-2 that are being tested as alternatives to FP 60. A mold-in-place coating is being tested as an alternative to replace a certain portion of FP 60 application during production processes. An Ultraviolet (UV) Cure coating is being tested mainly as a repair material for FP 60. However, these technologies have not completed all qualification testing and are therefore currently not valid, qualified replacements for FP 60, and due to their special application methods, they would not be drop-in replacements for FP 60. Additionally, these alternatives may not have the same durability benefits relative to FP 60 that FP 60-2 has in maritime environments, which may not make these two other alternative technologies as attractive as FP 60-2 from the stand-point of LCC reductions relative to FP 60. Finally, FP 60-2 will replace FP 60 in its entirety during production processes at AFP 42 and AFP 4, while the other two potential alternatives are being evaluated to replace only certain portions of FP 60 during production processes or when repairs are required. The advantages of FP 60-2 relative to FP 60 as demonstrated during this program are as follows:
• lower VOC content (213 g/L vs. 432 g/L) • increased build rate (mils/pass) • decreased cure time • decreased material usage
9
• decreased overall application time • increased durability
There are limitations to the degree of each of the stated advantages. The solvent package of FP 60-2 determines the VOC content, and to a large extent, the build rate, cure time, material usage, and overall application time. The types and quantities of solvents used in the formulation of FP 60-2 were governed by the requirements to formulate a low VOC coating with superior application and sprayability properties. During the formulation of FP 60-2, the material supplier performed spray trials with various solvents to determine the types and quantities of solvents that would minimize VOC content, maximize build rate, and minimize cure time, material usage and overall application time while achieving a smooth, acceptable surface finish. The solvents used in the formulation of FP 60-2 consist of MPK and acetone. Acetone is an exempt solvent, which means it is not considered a VOC by EPA standards because it does not react with compounds in the lower atmosphere to form ozone. MPK is not an exempt solvent and is the main source of VOC content for FP 60-2. A complete shift to acetone in the formulation of FP 60-2 would have resulted in a VOC content of 0 g/L but would also have resulted in unacceptable surface finish (bubbling, significant orange peel) since acetone evaporates extremely rapidly. The addition of MPK results in a slower (but still relatively rapid) evaporation rate of acetone, which leads to a smoother, acceptable surface finish. The rapid evaporation rate of acetone leads to a relatively high build rate and quick cure time, where cure time is defined as dry-to-sand time. Consequently, the overall application time of FP 60-2, defined as the time from application of the first layer of FP 60-2 to the time when the final layer of FP 60-2 is dry-to-sand, is relatively low. In terms of material usage, a lesser quantity of FP 60-2 is required to be sprayed to achieve a desired thickness over a given area of application relative to the amount of FP 60 required to achieve the same desired thickness over the same given area of application. It is speculated that this difference is related to the relatively low viscosity that FP 60-2 has relative to FP 60, which most likely results in a greater spray efficiency of FP 60-2 relative to FP 60, although spray efficiency was not evaluated during this project. For equal amounts of FP 60-2 and FP 60 that are sprayed, it is speculated that a greater percentage of the sprayed FP 60-2 resin reaches the substrate compared to the percentage of sprayed FP 60 resin that reaches the substrate. This leads to decreased material usage requirements for FP 60-2 relative to FP 60. The durability of FP 60-2 is governed mainly by the type of resin used in its formulation. As described in the ESTCP Cost and Performance and Final Reports for the other material demonstrated during this program (FP 212, which will be applied to a different WS than FP 60-2), puffer box testing evaluated the durabilities of the 002 resin (used in the formulation of FP 60-2) and of the 001 resin (used in the formulation of FP 60). It was shown that the 002 resin lasts 2 to 3 times longer than the 001 resin in a maritime-simulated environment. For more information on the puffer box test and results, refer to the ESTCP Cost and Performance and Final Report for FP 212 or to the technical report entitled FP 212 Puffer Box Testing, which describes this test and the test results in detail and is available from the Aeronautical Systems

10
Center, Acquisition Environmental, Safety & Health Division, Pollution Prevention Branch (ASC/ENVV).
11
3. DEMONSTRATION DESIGN
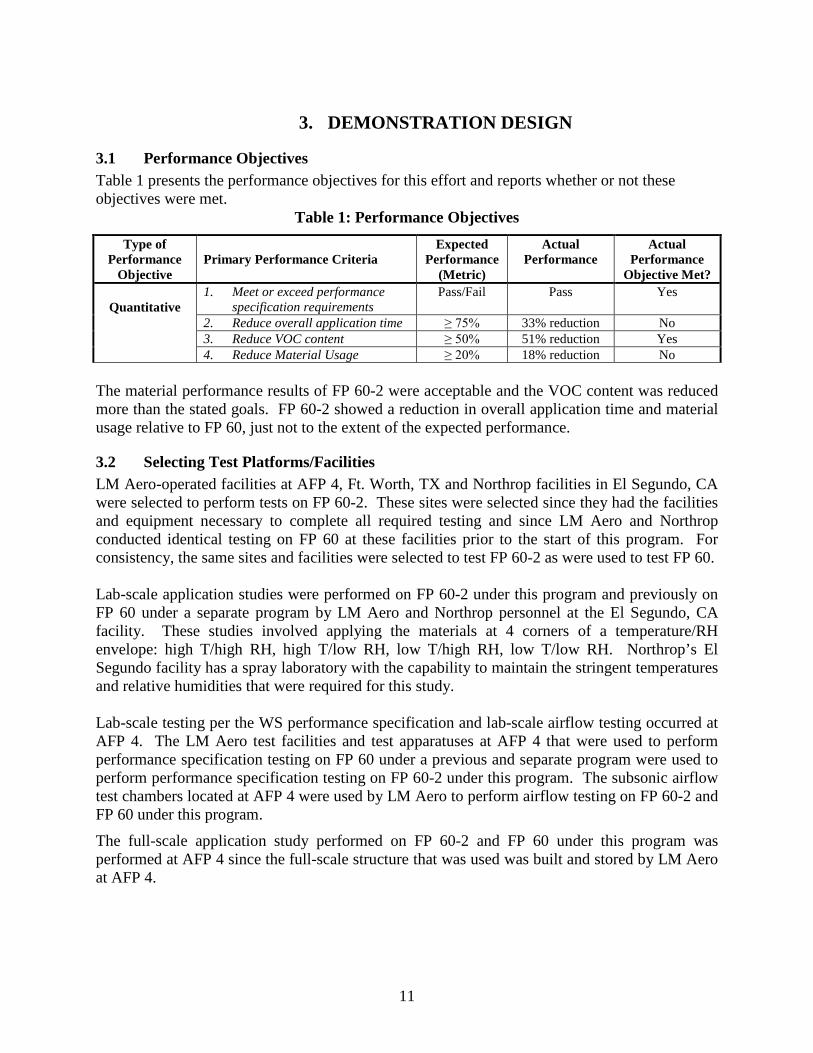
3.1 Performance Objectives Table 1 presents the performance objectives for this effort and reports whether or not these objectives were met.
Table 1: Performance Objectives Type of
Performance Objective
Primary Performance Criteria Expected
Performance (Metric)
Actual Performance
Actual Performance
Objective Met?
Quantitative 1. Meet or exceed performance
specification requirements Pass/Fail Pass Yes
2. Reduce overall application time ≥ 75% 33% reduction No 3. Reduce VOC content ≥ 50% 51% reduction Yes 4. Reduce Material Usage ≥ 20% 18% reduction No
The material performance results of FP 60-2 were acceptable and the VOC content was reduced more than the stated goals. FP 60-2 showed a reduction in overall application time and material usage relative to FP 60, just not to the extent of the expected performance.
3.2 Selecting Test Platforms/Facilities LM Aero-operated facilities at AFP 4, Ft. Worth, TX and Northrop facilities in El Segundo, CA were selected to perform tests on FP 60-2. These sites were selected since they had the facilities and equipment necessary to complete all required testing and since LM Aero and Northrop conducted identical testing on FP 60 at these facilities prior to the start of this program. For consistency, the same sites and facilities were selected to test FP 60-2 as were used to test FP 60. Lab-scale application studies were performed on FP 60-2 under this program and previously on FP 60 under a separate program by LM Aero and Northrop personnel at the El Segundo, CA facility. These studies involved applying the materials at 4 corners of a temperature/RH envelope: high T/high RH, high T/low RH, low T/high RH, low T/low RH. Northrop’s El Segundo facility has a spray laboratory with the capability to maintain the stringent temperatures and relative humidities that were required for this study. Lab-scale testing per the WS performance specification and lab-scale airflow testing occurred at AFP 4. The LM Aero test facilities and test apparatuses at AFP 4 that were used to perform performance specification testing on FP 60 under a previous and separate program were used to perform performance specification testing on FP 60-2 under this program. The subsonic airflow test chambers located at AFP 4 were used by LM Aero to perform airflow testing on FP 60-2 and FP 60 under this program.
The full-scale application study performed on FP 60-2 and FP 60 under this program was performed at AFP 4 since the full-scale structure that was used was built and stored by LM Aero at AFP 4.
12
The WS for which FP 60-2 was demonstrated was chosen since LM Aero and SPO managers had identified a need to decrease the VOC content and application time relative to FP 60.
3.3 Test Platform/Facility Characteristics/History
3.3.1 Northrop Facility, El Segundo, CA The Northrop, El Segundo facility supports Northrop Grumman's Integrated Systems sector, which comprises more than 20 locations nationwide and globally. At the El Segundo facility, Northrop designs, develops, produces and supports integrated systems for multiple DoD applications. For decades, the El Segundo facility has manufactured components and integrated systems for several of the fighters, bombers, and unmanned air vehicles in use by US military forces. There will be no application of FP 60-2 to the WS of interest at the Northrop, El Segundo facility. As stated previously, the Northrop, El Segundo facility was chosen for the capabilities of its laboratories to tightly control temperature and humidity for the lab-scale application study.
3.3.2 AFP 4, Ft. Worth, TX AFP 4, Ft. Worth, TX is a GOCO aircraft manufacturing facility which has been producing aircraft continuously since 1942. Plant operation has included production involvement in advanced tactical fighters, bombers and cargo aircraft in use by US military forces. General Dynamics began operating the facility in 1953 until Lockheed Martin took over operation of the facility in 1993. Following is a list of the 3 other GOCO facilities, their locations, and the contractor(s) that operate them:
• AFP 6, Marietta, GA; LM Aero • AFP 44, Tucson, AZ; Raytheon • AFP 42, Palmdale, CA; Boeing, LM Aero, Northrop
SAIC worked with LM Aero at AFP 4, Ft. Worth, TX to accomplish material performance testing, air flow testing, and a full-scale material application analysis of the FP 60-2 coating. Test facilities included laboratory platforms for measuring material properties, air flow chambers for air flow testing, and a full-scale engineering prototype structure used during the full-scale application study.
3.4 Present Operations Portions of the WS of interest are manufactured at AFP 42, Palmdale, CA by Northrop and other portions at AFP 4, Ft. Worth, TX by LM Aero. During production operations at AFP 42, FP 60 is applied using a robotic spray system that sprays ad-mixed material. The FP 60-2 coating will be a drop-in replacement since it was designed to be an ad-mixed material. During final finish operations at AFP 4, FP 60 is applied using the manual spray equipment that was used during the full-scale application study performed on FP 60 and FP 60-2 at AFP 4. FP 60-2 proved to be a drop-in replacement for FP 60 for the manual spray equipment and showed superior application properties to FP 60.
13
3.5 Pre-Demonstration Testing and Analysis LM Aero previously conducted a lab-scale application study and material performance testing per the WS material performance specification on FP 60 before this program began. The results from these studies were used as baseline data against which data from the same studies performed on FP 60-2 were compared. During this program, airflow testing and a full-scale application study were performed on FP 60 and FP 60-2 for side-by-side comparisons of the two materials.
3.6 Testing and Evaluation Plan
3.6.1 Demonstration Set-Up and Start-Up FP 60-2 was designed to be a drop-in solution for FP 60. As such, there were no equipment mobilization or installation costs incurred during this program. Existing facilities and equipment were used for the lab-scale application study, material performance testing, and airflow testing. For the full-scale application study, LM Aero used existing spray equipment but had to build the full-scale engineering model that was used in this study. The utilities required to perform the testing on FP 60-2 were slightly less than they were for the same tests performed on FP 60 since FP 60-2 had superior application properties, which decreased the amount of time and utility usage required to prepare test specimens and complete the full-scale application study, compared to FP 60. In addition, no additional Personal Protective Equipment (PPE) was required during application of FP 60-2 compared with the PPE required for application of FP 60. The PPE requirement remained unchanged since FP 60-2 avoided introducing additional HAPs or toxic chemicals, while reducing the amount of VOCs released. FP 60-2 is expected to have major advantages relative to FP 60 from a maintainability standpoint. FP 60-2 proved to be much more durable in a simulated maritime environment compared to FP 60, which should lead to far fewer repairs compared to the repairs that would be required to FP 60. The only notable problem encountered during the demonstration was a failure to provide conclusive data from the roller peel adhesion test of FP 60-2. This test is intended to measure the cohesive strength of the material. Adhesive failures (rather than cohesive failures) consistently appeared during roller peel adhesion testing of FP 60-2 and resulted in inconclusive results concerning the cohesive strength of FP 60-2. After several iterations of roller peel adhesion testing during which test conditions and test specimen preparation methods were modified to try to induce cohesive failure within FP 60-2, the T-peel test was performed on FP 60-2 since it evaluates the same properties as roller peel adhesion testing but was known to consistently promote cohesive failures in the materials being tested. T-peel testing generated conclusive and acceptable cohesive strength results for FP 60-2.
14
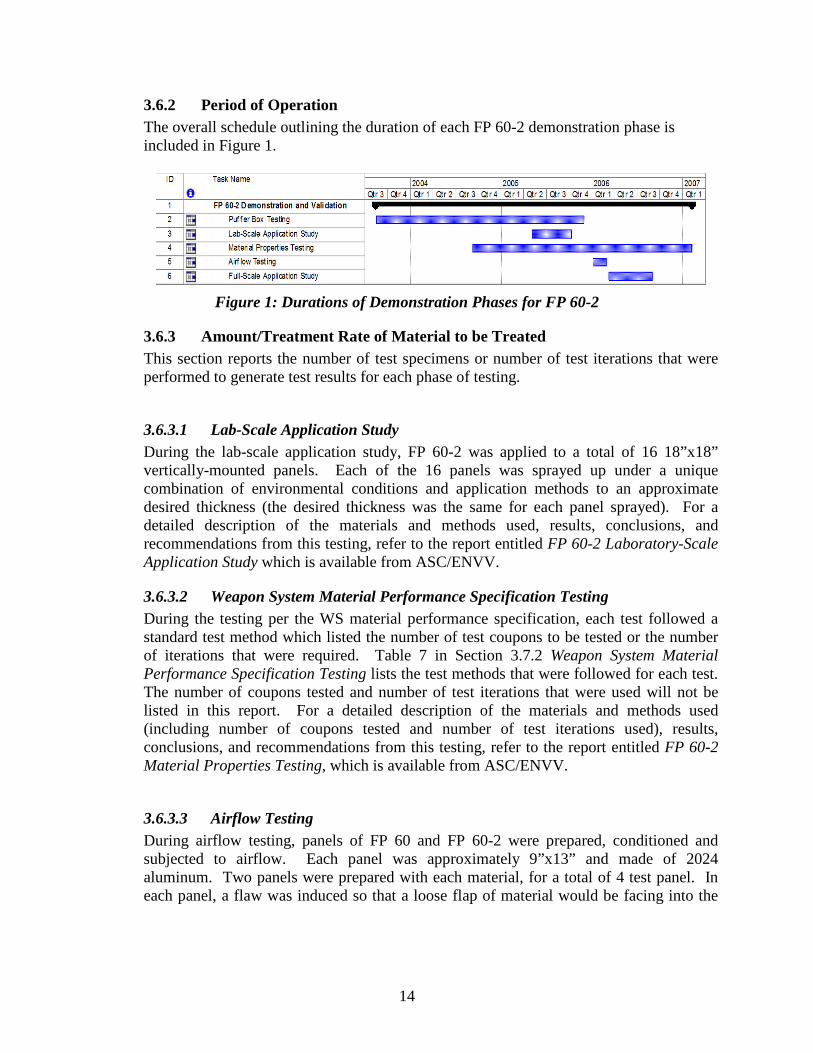
3.6.2 Period of Operation The overall schedule outlining the duration of each FP 60-2 demonstration phase is included in Figure 1.
Figure 1: Durations of Demonstration Phases for FP 60-2
3.6.3 Amount/Treatment Rate of Material to be Treated This section reports the number of test specimens or number of test iterations that were performed to generate test results for each phase of testing.
3.6.3.1 Lab-Scale Application Study During the lab-scale application study, FP 60-2 was applied to a total of 16 18”x18” vertically-mounted panels. Each of the 16 panels was sprayed up under a unique combination of environmental conditions and application methods to an approximate desired thickness (the desired thickness was the same for each panel sprayed). For a detailed description of the materials and methods used, results, conclusions, and recommendations from this testing, refer to the report entitled FP 60-2 Laboratory-Scale Application Study which is available from ASC/ENVV.
3.6.3.2 Weapon System Material Performance Specification Testing During the testing per the WS material performance specification, each test followed a standard test method which listed the number of test coupons to be tested or the number of iterations that were required. Table 7 in Section 3.7.2 Weapon System Material Performance Specification Testing lists the test methods that were followed for each test. The number of coupons tested and number of test iterations that were used will not be listed in this report. For a detailed description of the materials and methods used (including number of coupons tested and number of test iterations used), results, conclusions, and recommendations from this testing, refer to the report entitled FP 60-2 Material Properties Testing, which is available from ASC/ENVV.
3.6.3.3 Airflow Testing During airflow testing, panels of FP 60 and FP 60-2 were prepared, conditioned and subjected to airflow. Each panel was approximately 9”x13” and made of 2024 aluminum. Two panels were prepared with each material, for a total of 4 test panel. In each panel, a flaw was induced so that a loose flap of material would be facing into the
15
airflow. This was done to determine if the flaw would propagate during testing. One panel of each material received no conditioning to act as control panels while the other panel of each material was exposed to JP-8. Each panel was then exposed to airflow testing. For a detailed description of the materials and methods used, results, conclusions, and recommendations from this testing, refer to the report entitled FP 60-2 Airflow Testing, which is available from ASC/ENVV.
3.6.3.4 Full-Scale Application Study During the full-scale application study, FP 60-2 and the baseline material, FP 60, were applied to a full-scale engineering prototype of a section of the aircraft to which FP 60-2 will be applied. Three spray trials were performed with each material. A release agent was applied to the substrate so that materials could be easily removed after each trial. Average values for all application parameters were calculated after the three spray trials were completed for each material. For a detailed description of the materials and methods used, results, conclusions, and recommendations from this testing, refer to the report entitled FP 60-2 Full-Scale Application Study which is available from ASC/ENVV.
3.6.3.5 Puffer Box Testing An additional test that is relevant for assessing the performance of FP 60-2 is puffer box testing. This test evaluates the temperatures, pressures, and exposures that a material experiences when located on certain portions of an aircraft operating continuously in a maritime environment. Puffer box testing was not conducted on FP 60-2. Instead, as part of this overall ESTCP program, puffer box testing was conducted on another experimental material, FP 212, which is formulated with the 002 resin, and on a legacy material, which is formulated with the 001 resin (for more information on FP 212, refer to the reports entitled FP 212 Cost and Performance Report and FP 212 Final Report, which are available from ESTCP). Like FP 212, FP 60-2 is formulated with the 002 resin, and like the legacy material, FP 60 is formulated with the 001 resin. Since the resin is largely responsible for a coating’s durability, the puffer box results for FP 212 and the legacy material are relevant for assessing the durabilities FP 60-2 and FP 60, respectively. For a detailed description of the materials and methods used, results, conclusions, and recommendations from this testing, refer to the report entitled, FP 212 Puffer Box Testing, which is available from ASC/ENVV. Eight total blocks of puffer box testing are required for a full evaluation and simulate the exposures and stresses that a coating stack-up would experience on an aircraft operating continuously in a maritime environment for 30 years (See Section 3.6.4.5 Puffer Box Testing for a description of the puffer box testing operating parameters). Significant degradation of the legacy material was observed after the fourth block, and it had to be repaired. There was virtually no degradation observed in FP 212 by the completion of
16
the eighth block. In order to try to push FP 212 to failure so that its failure mode could be observed, two additional blocks were performed for a total of 10 blocks.
3.6.4 Operating Parameters for the Technology This section describes the operational parameters and monitoring analysis that took place for each phase of testing.
3.6.4.1 Lab-Scale Application Study The lab-scale application study was performed on FP 60-2 at the Northrop, El Segundo, CA facility using full-scale spray equipment in a lab where a wide range of temperature and humidity conditions could be achieved. The same study, using the same personnel, facilities, and equipment, was performed on FP 60 under a separate project a few years prior to this study. The purpose of this study was to evaluate the application properties of FP 60-2 at the four corners of the temperature / RH envelope; high T / high RH, high T / low RH, low T / high RH, low T / low RH. Four parameters were adjusted during the application study:
• temperature • relative humidity • time between each application pass • build rate
Each parameter was adjusted to one of two values, resulting in 16 unique sets of conditions, hence the 16 panels that were sprayed up during this study. The temperature and humidity were controlled by environmental controls in the lab where spraying was performed. The listed time between passes was predetermined, based on the FP 60 application study, and the spray operator did not deviate from these times. The build rate was controlled by the speed at which the spray operator moved the spray gun across the panel during spraying. A trained spray operator knows the approximate speed at which he must move the spray gun across a panel to achieve an approximate build rate. In order to achieve a relatively low build rate, the spray operator moves the spray gun relatively quickly across the panel. In order to achieve a relatively high build rate, the spray operator moves the spray gun relatively slowly across the panel. The expected number of passes to reach desired final thickness is a function of the wet build rate and is arrived at by dividing the desired final wet thickness by the wet build rate. Assuming the spray operator is able to apply the exact desired build rate for each pass, and that environmental conditions do not affect the build rate, then the expected number of passes will result in the desired wet thickness. However, if the desired build rate is not achieved, then it will take more or fewer passes than expected to build up to the desired thickness. The expected application time to reach desired final thickness is a function of the wet build rate and time between passes and is arrived at by multiplying the expected number of passes to reach desired wet thickness by the time between passes.
17
Since the expected application time to reach desired final thickness is partially a function of the expected number of passes to build up to desired thickness, variations in the desired wet build rate will impact the expected time to build up to desired thickness. As material was being applied to each panel, the material thickness was checked periodically with a wet gauge to ensure the material thickness was approximately where it should be based on the number of coats applied (passes made). As long as the material thickness was approximately where it should be based on the number of coats applied, the spray operator continued to apply coats until the expected number of passes to build up to desired thickness had been applied. Once the expected number of passes to build up to desired thickness had been applied, the panels were allowed to cure for 5 days at standard conditions and a final dry thickness measurement was taken.
During material application, surface finish was evaluated visually for any flaws, such as orange peel, dripping, and sagging. Also recorded was the total continuous process time (hours) that were required to apply the number of coats necessary to build up to desired thickness. Hardness testing was performed on coated panels after 4 hours. After curing for 5 days at standard conditions, hardness measurements were taken again and panels were evaluated for other physical and mechanical properties. For a detailed description of the materials and methods used, results, conclusions, and recommendations from this testing, refer to the report entitled FP 60-2 Laboratory-Scale Application Study, which is available from ASC/ENVV.
3.6.4.2 Weapon System Material Performance Specification Testing This testing was performed by LM Aero at AFP 4, TX. Each test followed a standard test method which specified the operating parameters. Table 7 in Section 3.7.2 Weapon System Material Performance Specification Testing lists the test methods that were followed for each test. Test specimens were monitored while conditioning and testing occurred. Relevant observations and the results from testing were recorded. For a detailed description of the materials and methods used, results, conclusions, and recommendations from this testing, refer to the report entitled FP 60-2 Material Properties Testing, which is available from ASC/ENVV.
3.6.4.3 Airflow Testing This testing was performed by LM Aero at AFP 4, Ft Worth, TX. After test panels had been prepared, they were exposed to ten minute dwells in an airflow chamber at each of three different Mach (M) numbers. The airflow testing was conducted at an internal chamber temperature of 250°F. During the airflow testing, the panels were observed to determine if or when the flap of material that had been induced prior to testing broke off. After testing, the panels were visually assessed to determine if there was any propagation of the flaws that had been induced prior to testing. For a detailed description of the
18
materials and methods used, results, conclusions, and recommendations from this testing, refer to the report entitled FP 60-2 Airflow Testing, which is available from ASC/ENVV.
3.6.4.4 Full-Scale Application Study The full-scale application study was performed at AFP 4, Ft. Worth, TX using production spray equipment. The purpose of this study was to compare the full-scale application properties of FP 60 and FP 60-2 in a lab that simulated the environmental conditions present during production processes at AFP 4. The environmental conditions were held constant for the duration of this study. Prior to this study, a small study was performed to determine what the maximum built rate was for each material at the environmental conditions present during this study (for more information on the max build rate study, refer to the report entitled FP 60-2 Full-Scale Application Study that is available from ASC/ENVV). Following the max build rate study, the max build rate for each material was used or was attempted to be used to build up to desired thickness during material application to the full-scale engineering prototype structure (when a spray operator attempts to build up to a desired thickness by using the spray methods described in Section 3.6.4.1 Lab-Scale Application Study, build rates of different materials can vary, despite the best efforts of the spray operator to apply material at a desired build rate, due to inherent differences in the formulations of the materials). Each material was sprayed onto the full-scale engineering prototype until the desired thickness had been approximately achieved. During material application the following parameters were recorded:
• Build rate • Time between passes • Tack-free time • Dry-to-sand time • Total number of passes to achieve desired thickness • Total application time from start of material application to dry-to-sand of final
layer of material • Final material thickness (wet and dry) • Total quantity of each type of material used • Total quantity of waste material (cleaned out of pots and spray lines) • Total quantity of solvent used to clean spray pots and spray lines • Total time spent cleaning out spray system • All necessary observations made, such as surface finish of each material
The material was then peeled from the engineering structure and the process was repeated two more times, for a total of three spray iterations for each material.
19
3.6.4.5 Puffer Box Testing Puffer box testing was performed at AFP 4, Ft. Worth, TX. The puffer box test article, with the materials applied to it, was subjected to humidity and salt fog exposure, followed by pressure testing, and ended with thermal cycling. This cycle of exposures comprises one block of puffer box testing. After each block, the coatings on the puffer box are visually assessed for any signs of degradation. Patches of degradation are marked, measured, and photographed. If coatings degrade significantly prior to completion of the 8th block of puffer box testing, they are repaired, and testing continues.
3.6.5 Experimental Design This section describes parameters that were monitored and monitoring methods that were used while material was being sprayed during lab-scale and full-scale application studies. Monitoring procedures during material application were critical during the lab-scale and full-scale application studies in order to assess key application properties, such as build rate and time between passes. Monitoring material application during test specimen preparation for airflow testing, lab-scale testing per the WS material performance specification, and puffer box testing were not of particular importance, other than to ensure that test specimen preparation procedures were being followed to prepare proper test panels. As such, monitoring procedures used during test panel preparation for airflow testing, lab-scale testing per the WS material performance specification, and puffer box testing will not be discussed. The cured material parameters that were evaluated during all phases of testing are discussed in Section 3.7 Selection of Analytical / Testing Methods.
3.6.5.1 Lab-Scale Application Study Northrop and LM Aero conducted a lab-scale application study of FP 60-2 at the Northrop facility in El Segundo, CA to test application rates at the “envelope” temperature/humidity conditions. The objective of this study was to determine the performance of application properties of FP 60-2 under different temperature and humidity conditions and to compare these results to the results of this same study performed previously on FP 60 by LM Aero and Northrop under a separate project. During this study, LM Aero and Northrop engineers closely monitored the application properties of FP 60-2 as it was applied to vertically mounted panels under different temperature and humidity conditions. The performance parameters of interest that were monitored during material application are located in Table 2.
Table 2: Laboratory-Scale Application Study Monitoring
PERFORMANCE PARAMETER MONITORING FREQUENCY
MONITORING METHOD
DEMO PLAN DEVIATIONS
Application temperature Continuously during sample stack-up
Spray booth thermostat None
Application humidity Continuously during sample stack-up
Spray booth humidistat None
20
Wet mils per pass Once after each spray pass Wet mil gauge None
Time between passes Between each spray pass Time tracking None
Wet coating performance (formation of sags, runs, drips)
During each spray pass
Qualitative visual inspection None
Total application time Once during each spray-up Time tracking None
Total number of passes Each pass tallied Visually None
After the panels were prepared during this study, they were shipped to AFP 4, where LM Aero conducted limited tests on the cured panels to evaluate the properties of the cured panels (tests performed on these panels are listed in Section 3.7.1 Lab-Scale Application Study).
3.6.5.2 Full-Scale Application Study During the maximum build rate study (which is considered part of the full-scale application study) performed by LM Aero at AFP 4 on vertically-mounted square panels prior to material application to the full-scale prototype, monitoring was completed for the performance parameters listed in Table 3. The objective of this study was to determine the maximum build rate of FP 60-2 and FP 60 under “normal” laboratory temperature and humidity conditions (approximately 78°F and 60% RH). These environmental conditions approximate the environmental conditions that will be present during FP 60-2 application at AFP 4. Full-scale spray equipment was used to complete this study. The maximum build rate established for FP 60 and FP 60-2 during this study was used during the full-scale application study.
Table 3: Maximum Build Rate Study Monitoring
PERFORMANCE PARAMETER MONITORING FREQUENCY
MONITORING METHOD
DEMO PLAN DEVIATIONS
Application temperature Continuously during build rate trial
Spray booth thermostat None
Application humidity Continuously during build rate trial
Spray booth humidistat None
Wet mils per pass Once after each spray pass Wet mil gauge
Extreme wet thickness once
(~20 mils)
Time between passes Between each spray pass Time tracking None
Wet coating performance (formation of sags, runs, drips) During each spray pass Qualitative visual
inspection None
Total wet material thickness After application of final pass Wet mil gauge None
21
During the full-scale application study performed by LM Aero at AFP 4 on FP 60-2 and FP 60, monitoring was accomplished for the listed performance parameters according to the following schedule in Table 4. The objective of this study was to use the max build rates determined for each material during the max build rate study to provide a side-by-side comparison of the application performances of FP 60-2 and FP 60 under “normal” laboratory temperature and humidity conditions (approximately 78°F and 60% RH). These environmental conditions approximate the environmental conditions that will be present during FP 60-2 application at AFP 4. Full-scale production spray equipment was used during this study to apply FP 60-2 and FP 60 to a full-scale engineering prototype of one of the proposed FP 60-2 application areas of the WS of interest.
Table 4: Full-Scale Prototype Application Study Monitoring
PERFORMANCE PARAMETER MONITORING FREQUENCY
MONITORING METHOD
DEMO PLAN DEVIATIONS
Application temperature Continuously during prototype trial
Spray booth thermostat None
Application humidity Continuously during prototype trial
Spray booth humidistat None
Volume of mixed material used Once during each kit mixed Inventory tracking None
Wet mils per pass Once after each spray pass Wet mil gauge None
Time between passes Between each spray pass Time tracking None
Wet coating performance (formation of sags, runs, drips) During each spray pass Qualitative visual
inspection None
Total wet material thickness After application of final pass Wet mil gauge None
Total application time Once during each spray-up Time tracking None
Total number of passes Each pass tallied Visual None
Volume of material used Once after each spray-up
Weight change of spray equipment None
Volume of waste material Once after each spray-up
Weight change of spray equipment None
Spray equipment cleaning time Once after each spray-up Time tracking None
Volume of solvent used Once after each spray-up Inventory tracking None
3.6.6 Product Testing No parts or panels from in-service operational vehicles or weapon systems were manufactured or maintained during the demonstration of FP 60-2. Table 5 summarizes the substrates, test specimens, and structures that were used in each phase of the FP 60-2 evaluation. The testing that was conducted during each phase followed test methodologies that were approved by LM Aero and/or SPO engineers. For a detailed
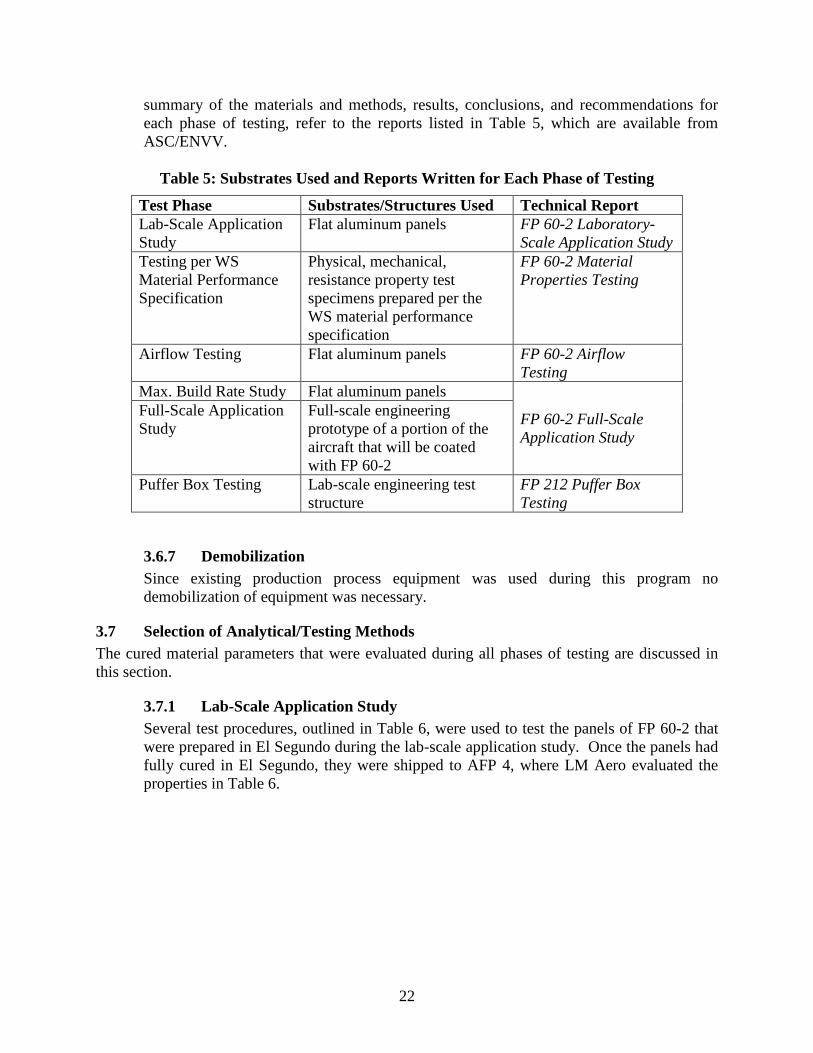
22
summary of the materials and methods, results, conclusions, and recommendations for each phase of testing, refer to the reports listed in Table 5, which are available from ASC/ENVV.
Table 5: Substrates Used and Reports Written for Each Phase of Testing
Test Phase Substrates/Structures Used Technical Report Lab-Scale Application Study
Flat aluminum panels FP 60-2 Laboratory-Scale Application Study
Testing per WS Material Performance Specification
Physical, mechanical, resistance property test specimens prepared per the WS material performance specification
FP 60-2 Material Properties Testing
Airflow Testing Flat aluminum panels FP 60-2 Airflow Testing
Max. Build Rate Study Flat aluminum panels
FP 60-2 Full-Scale Application Study
Full-Scale Application Study
Full-scale engineering prototype of a portion of the aircraft that will be coated with FP 60-2
Puffer Box Testing Lab-scale engineering test structure
FP 212 Puffer Box Testing
3.6.7 Demobilization Since existing production process equipment was used during this program no demobilization of equipment was necessary.
3.7 Selection of Analytical/Testing Methods The cured material parameters that were evaluated during all phases of testing are discussed in this section.
3.7.1 Lab-Scale Application Study Several test procedures, outlined in Table 6, were used to test the panels of FP 60-2 that were prepared in El Segundo during the lab-scale application study. Once the panels had fully cured in El Segundo, they were shipped to AFP 4, where LM Aero evaluated the properties in Table 6.
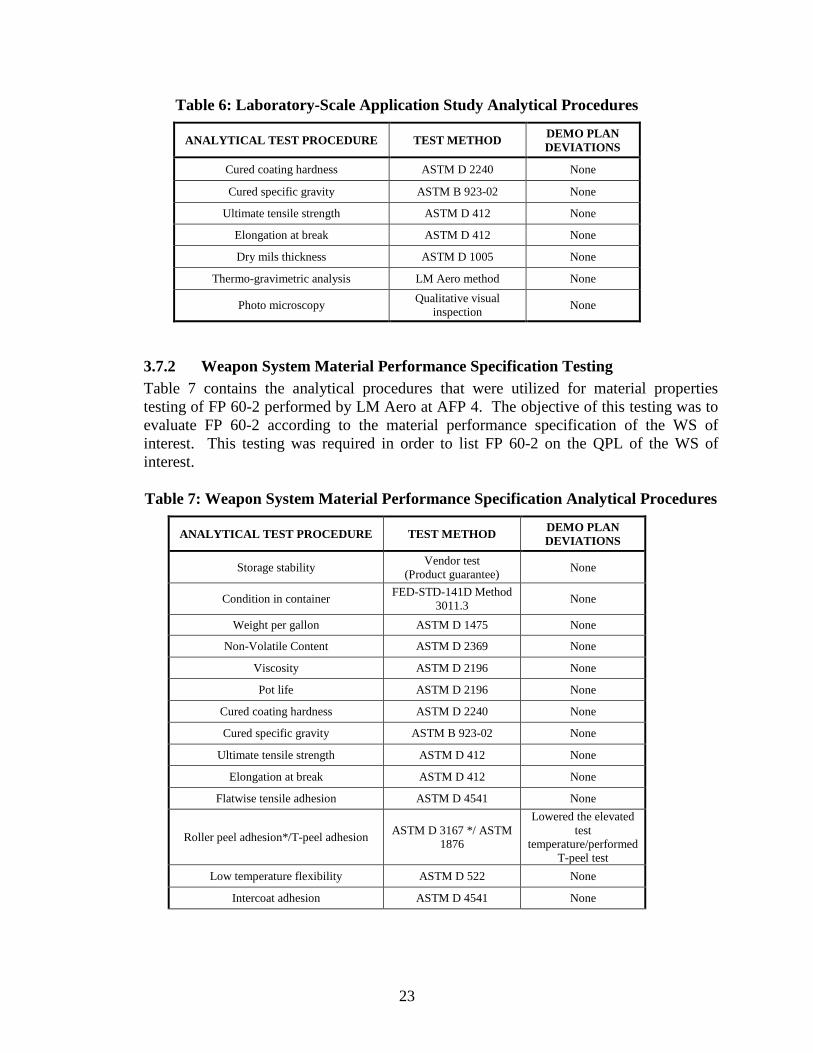
23
Table 6: Laboratory-Scale Application Study Analytical Procedures
ANALYTICAL TEST PROCEDURE TEST METHOD DEMO PLAN DEVIATIONS
Cured coating hardness ASTM D 2240 None
Cured specific gravity ASTM B 923-02 None
Ultimate tensile strength ASTM D 412 None
Elongation at break ASTM D 412 None
Dry mils thickness ASTM D 1005 None
Thermo-gravimetric analysis LM Aero method None
Photo microscopy Qualitative visual inspection None
3.7.2 Weapon System Material Performance Specification Testing Table 7 contains the analytical procedures that were utilized for material properties testing of FP 60-2 performed by LM Aero at AFP 4. The objective of this testing was to evaluate FP 60-2 according to the material performance specification of the WS of interest. This testing was required in order to list FP 60-2 on the QPL of the WS of interest.
Table 7: Weapon System Material Performance Specification Analytical Procedures
ANALYTICAL TEST PROCEDURE TEST METHOD DEMO PLAN DEVIATIONS
Storage stability Vendor test (Product guarantee) None
Condition in container FED-STD-141D Method 3011.3 None
Weight per gallon ASTM D 1475 None
Non-Volatile Content ASTM D 2369 None
Viscosity ASTM D 2196 None
Pot life ASTM D 2196 None
Cured coating hardness ASTM D 2240 None
Cured specific gravity ASTM B 923-02 None
Ultimate tensile strength ASTM D 412 None
Elongation at break ASTM D 412 None
Flatwise tensile adhesion ASTM D 4541 None
Roller peel adhesion*/T-peel adhesion ASTM D 3167 */ ASTM 1876
Lowered the elevated test
temperature/performed T-peel test
Low temperature flexibility ASTM D 522 None
Intercoat adhesion ASTM D 4541 None
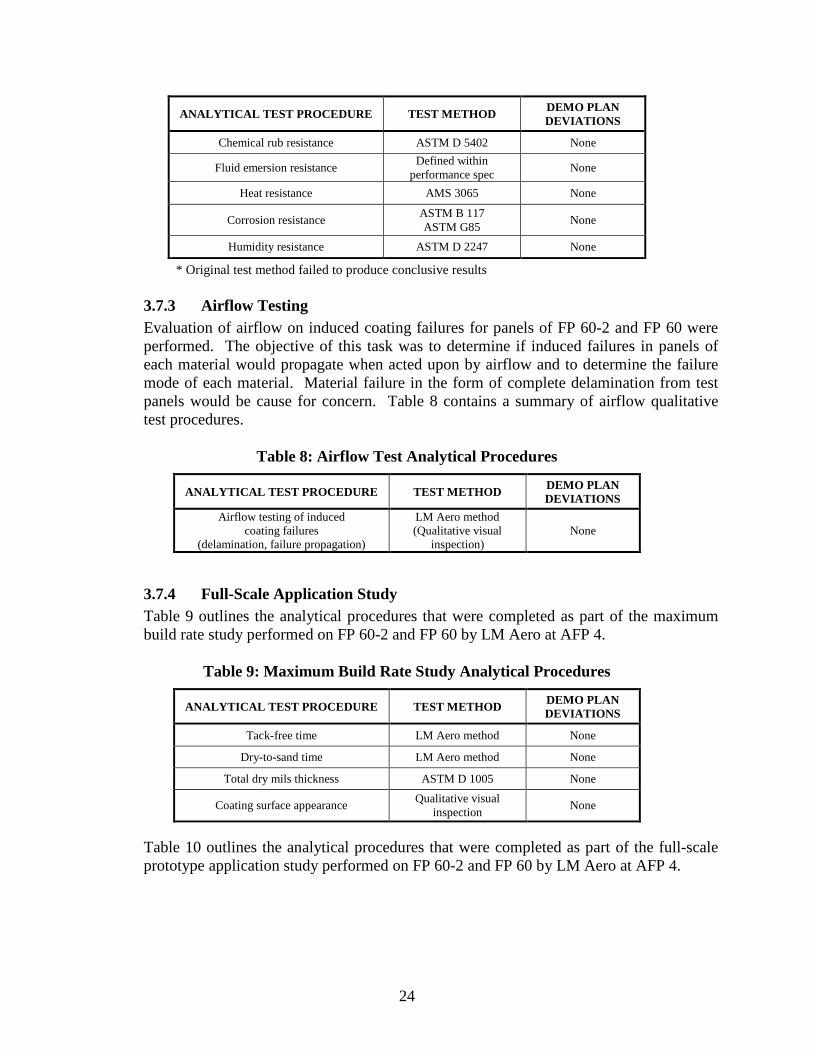
24
ANALYTICAL TEST PROCEDURE TEST METHOD DEMO PLAN DEVIATIONS
Chemical rub resistance ASTM D 5402 None
Fluid emersion resistance Defined within performance spec None
Heat resistance AMS 3065 None
Corrosion resistance ASTM B 117 ASTM G85 None
Humidity resistance ASTM D 2247 None
* Original test method failed to produce conclusive results
3.7.3 Airflow Testing Evaluation of airflow on induced coating failures for panels of FP 60-2 and FP 60 were performed. The objective of this task was to determine if induced failures in panels of each material would propagate when acted upon by airflow and to determine the failure mode of each material. Material failure in the form of complete delamination from test panels would be cause for concern. Table 8 contains a summary of airflow qualitative test procedures.
Table 8: Airflow Test Analytical Procedures
ANALYTICAL TEST PROCEDURE TEST METHOD DEMO PLAN DEVIATIONS
Airflow testing of induced coating failures
(delamination, failure propagation)
LM Aero method (Qualitative visual
inspection) None
3.7.4 Full-Scale Application Study Table 9 outlines the analytical procedures that were completed as part of the maximum build rate study performed on FP 60-2 and FP 60 by LM Aero at AFP 4.
Table 9: Maximum Build Rate Study Analytical Procedures
ANALYTICAL TEST PROCEDURE TEST METHOD DEMO PLAN DEVIATIONS
Tack-free time LM Aero method None
Dry-to-sand time LM Aero method None
Total dry mils thickness ASTM D 1005 None
Coating surface appearance Qualitative visual inspection None
Table 10 outlines the analytical procedures that were completed as part of the full-scale prototype application study performed on FP 60-2 and FP 60 by LM Aero at AFP 4.
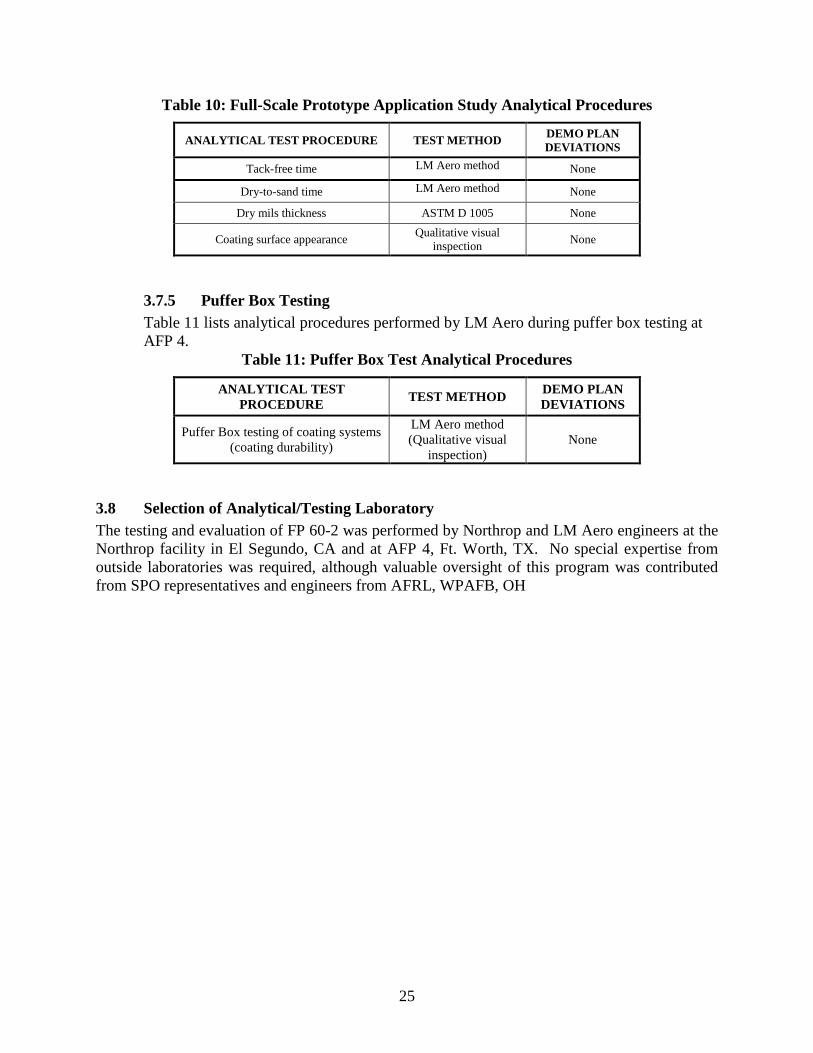
25
Table 10: Full-Scale Prototype Application Study Analytical Procedures
ANALYTICAL TEST PROCEDURE TEST METHOD DEMO PLAN DEVIATIONS
Tack-free time LM Aero method None
Dry-to-sand time LM Aero method None
Dry mils thickness ASTM D 1005 None
Coating surface appearance Qualitative visual inspection None
3.7.5 Puffer Box Testing Table 11 lists analytical procedures performed by LM Aero during puffer box testing at AFP 4.
Table 11: Puffer Box Test Analytical Procedures
ANALYTICAL TEST PROCEDURE TEST METHOD DEMO PLAN
DEVIATIONS
Puffer Box testing of coating systems (coating durability)
LM Aero method (Qualitative visual
inspection) None
3.8 Selection of Analytical/Testing Laboratory The testing and evaluation of FP 60-2 was performed by Northrop and LM Aero engineers at the Northrop facility in El Segundo, CA and at AFP 4, Ft. Worth, TX. No special expertise from outside laboratories was required, although valuable oversight of this program was contributed from SPO representatives and engineers from AFRL, WPAFB, OH
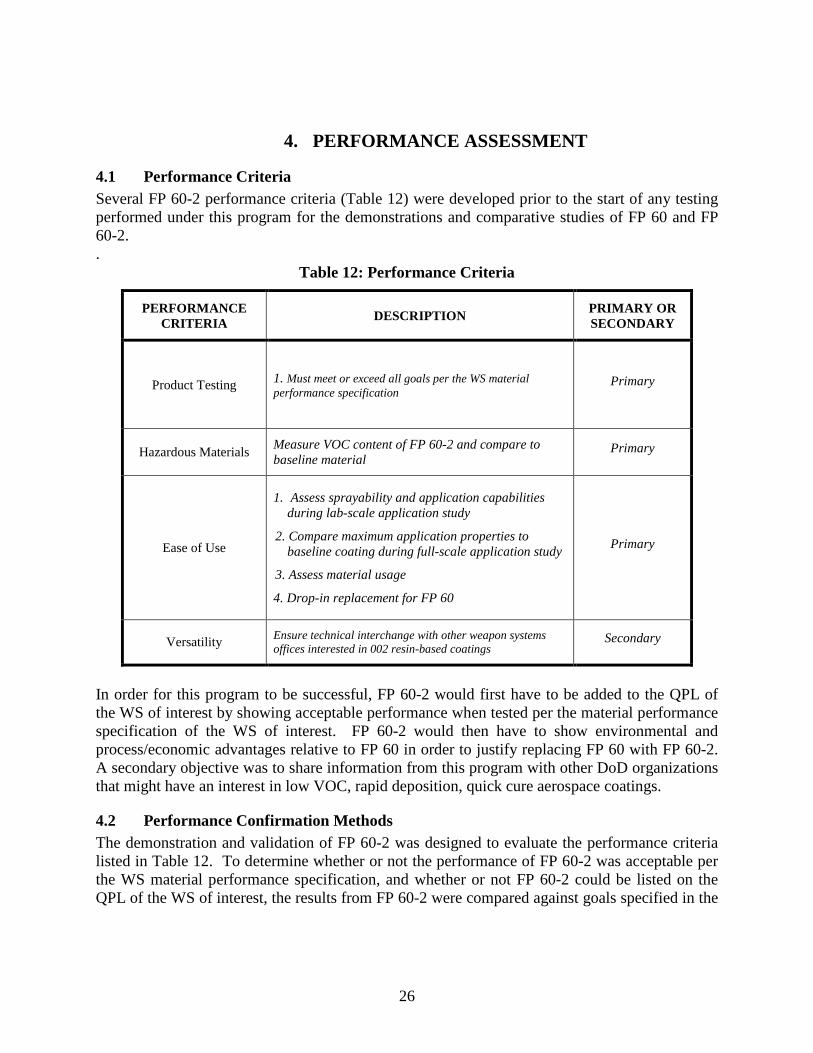
26
4. PERFORMANCE ASSESSMENT
4.1 Performance Criteria Several FP 60-2 performance criteria (Table 12) were developed prior to the start of any testing performed under this program for the demonstrations and comparative studies of FP 60 and FP 60-2. .
Table 12: Performance Criteria
PERFORMANCE CRITERIA DESCRIPTION PRIMARY OR
SECONDARY
Product Testing 1. Must meet or exceed all goals per the WS material performance specification
Primary
Hazardous Materials Measure VOC content of FP 60-2 and compare to baseline material
Primary
Ease of Use
1. Assess sprayability and application capabilities during lab-scale application study
2. Compare maximum application properties to baseline coating during full-scale application study
3. Assess material usage
4. Drop-in replacement for FP 60
Primary
Versatility Ensure technical interchange with other weapon systems offices interested in 002 resin-based coatings
Secondary
In order for this program to be successful, FP 60-2 would first have to be added to the QPL of the WS of interest by showing acceptable performance when tested per the material performance specification of the WS of interest. FP 60-2 would then have to show environmental and process/economic advantages relative to FP 60 in order to justify replacing FP 60 with FP 60-2. A secondary objective was to share information from this program with other DoD organizations that might have an interest in low VOC, rapid deposition, quick cure aerospace coatings.
4.2 Performance Confirmation Methods The demonstration and validation of FP 60-2 was designed to evaluate the performance criteria listed in Table 12. To determine whether or not the performance of FP 60-2 was acceptable per the WS material performance specification, and whether or not FP 60-2 could be listed on the QPL of the WS of interest, the results from FP 60-2 were compared against goals specified in the
27
material performance specification. Section 3.7 Selection of Analytical/Testing Methods lists the formal methods that were followed when analyzing the results of this testing. The ease of use of FP 60-2 was evaluated as a comparison to the ease of use of FP 60. The lab-scale application study performed on FP 60-2 was a duplication of the lab-scale application study performed on FP 60 years before this program began. Northrop and LM Aero engineers who participated in the study on FP 60 also participated in the study on FP 60-2 so that a comparison of the sprayability and application capabilities of these two coatings could be made by those who participated in both studies. Four parameters were adjusted during this study:
• temperature • relative humidity • time between each application pass during material build-up • build rate
Each parameter was adjusted to one of two values, resulting in 16 unique sets of conditions, hence the 16 panels that were sprayed up during this study. The full-scale application study provided a side-by side comparison of FP 60-2 and FP 60 as both materials were applied to a full-scale engineering prototype of a section of the aircraft that will be coated with FP 60-2. Each material was applied to the full-scale prototype separately and peeled off afterwards. This process was performed 3 times for each material so that average values for the data collected during material application could be calculated. The results from this study were assessed in real time by LM Aero engineers and allowed for a direct determination of any application characteristics of FP 60-2 that would lead to process/economic advantages relative to FP 60. The environmental performance of FP 60-2 relative to FP 60 was made by a direct comparison of the VOC contents that each material is formulated with, according to the MSDSs for each material. Puffer box testing provided a side-by side comparison of the durabilities of the 002 resin used in the formulation of FP 60-2 and FP 212 and the 001 resin used in the formulation of FP 60 and a legacy material. A total of 10 blocks of puffer box testing were performed on FP 212. The results from this study were assessed in real time by LM Aero engineers and allowed for a direct comparison of the durabilities of the 002 and 001 resin systems. Table 13 outlines the methods used to conduct FP 60-2 performance assessments and the related outcomes. No significant deviations from the procedures documented within the demonstration plan occurred for FP 60-2 or FP 60.
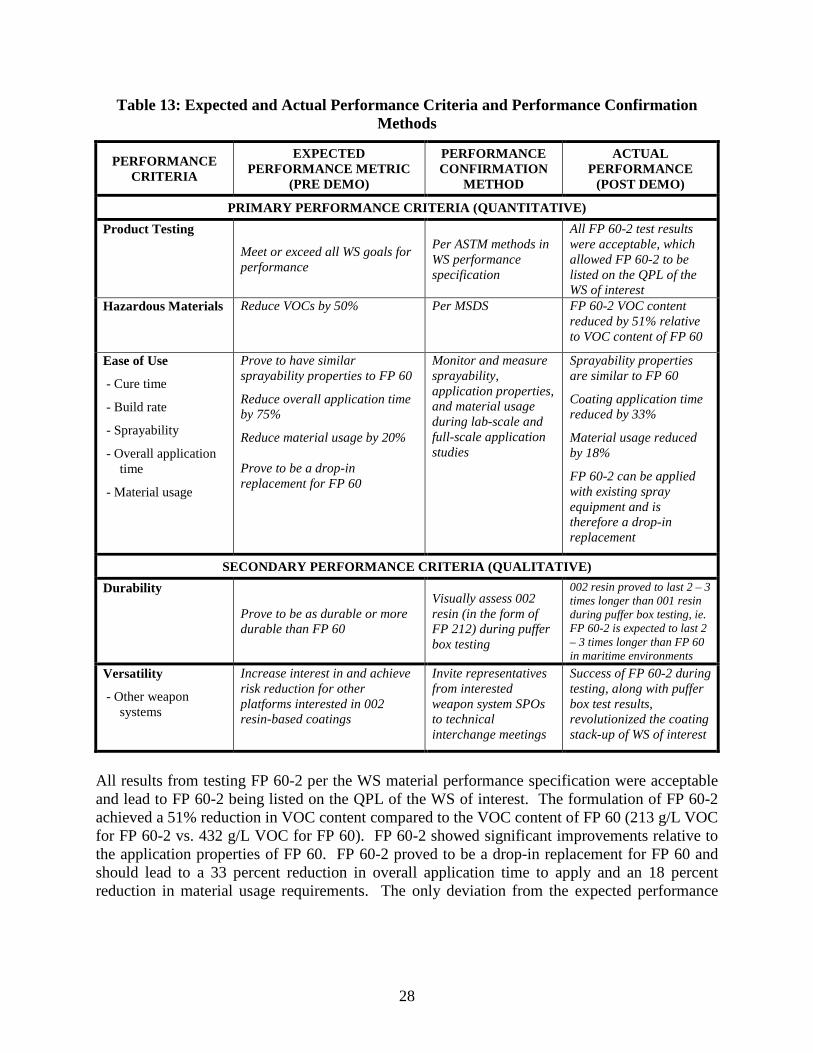
28
Table 13: Expected and Actual Performance Criteria and Performance Confirmation Methods
PERFORMANCE CRITERIA
EXPECTED PERFORMANCE METRIC
(PRE DEMO)
PERFORMANCE CONFIRMATION
METHOD
ACTUAL PERFORMANCE
(POST DEMO)
PRIMARY PERFORMANCE CRITERIA (QUANTITATIVE) Product Testing
Meet or exceed all WS goals for performance
Per ASTM methods in WS performance specification
All FP 60-2 test results were acceptable, which allowed FP 60-2 to be listed on the QPL of the WS of interest
Hazardous Materials Reduce VOCs by 50% Per MSDS FP 60-2 VOC content reduced by 51% relative to VOC content of FP 60
Ease of Use
- Cure time
- Build rate
- Sprayability
- Overall application time
- Material usage
Prove to have similar sprayability properties to FP 60
Reduce overall application time by 75%
Reduce material usage by 20% Prove to be a drop-in replacement for FP 60
Monitor and measure sprayability, application properties, and material usage during lab-scale and full-scale application studies
Sprayability properties are similar to FP 60
Coating application time reduced by 33%
Material usage reduced by 18%
FP 60-2 can be applied with existing spray equipment and is therefore a drop-in replacement
SECONDARY PERFORMANCE CRITERIA (QUALITATIVE) Durability
Prove to be as durable or more durable than FP 60
Visually assess 002 resin (in the form of FP 212) during puffer box testing
002 resin proved to last 2 – 3 times longer than 001 resin during puffer box testing, ie. FP 60-2 is expected to last 2 – 3 times longer than FP 60 in maritime environments
Versatility
- Other weapon systems
Increase interest in and achieve risk reduction for other platforms interested in 002 resin-based coatings
Invite representatives from interested weapon system SPOs to technical interchange meetings
Success of FP 60-2 during testing, along with puffer box test results, revolutionized the coating stack-up of WS of interest
All results from testing FP 60-2 per the WS material performance specification were acceptable and lead to FP 60-2 being listed on the QPL of the WS of interest. The formulation of FP 60-2 achieved a 51% reduction in VOC content compared to the VOC content of FP 60 (213 g/L VOC for FP 60-2 vs. 432 g/L VOC for FP 60). FP 60-2 showed significant improvements relative to the application properties of FP 60. FP 60-2 proved to be a drop-in replacement for FP 60 and should lead to a 33 percent reduction in overall application time to apply and an 18 percent reduction in material usage requirements. The only deviation from the expected performance
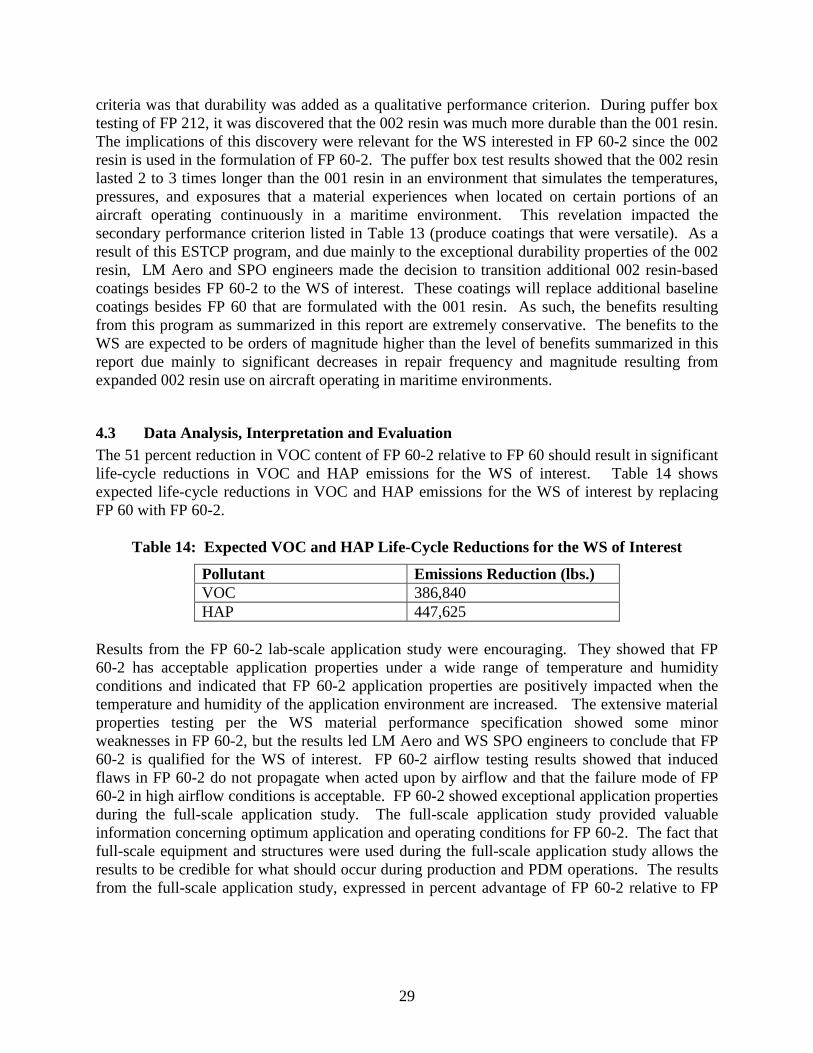
29
criteria was that durability was added as a qualitative performance criterion. During puffer box testing of FP 212, it was discovered that the 002 resin was much more durable than the 001 resin. The implications of this discovery were relevant for the WS interested in FP 60-2 since the 002 resin is used in the formulation of FP 60-2. The puffer box test results showed that the 002 resin lasted 2 to 3 times longer than the 001 resin in an environment that simulates the temperatures, pressures, and exposures that a material experiences when located on certain portions of an aircraft operating continuously in a maritime environment. This revelation impacted the secondary performance criterion listed in Table 13 (produce coatings that were versatile). As a result of this ESTCP program, and due mainly to the exceptional durability properties of the 002 resin, LM Aero and SPO engineers made the decision to transition additional 002 resin-based coatings besides FP 60-2 to the WS of interest. These coatings will replace additional baseline coatings besides FP 60 that are formulated with the 001 resin. As such, the benefits resulting from this program as summarized in this report are extremely conservative. The benefits to the WS are expected to be orders of magnitude higher than the level of benefits summarized in this report due mainly to significant decreases in repair frequency and magnitude resulting from expanded 002 resin use on aircraft operating in maritime environments.
4.3 Data Analysis, Interpretation and Evaluation The 51 percent reduction in VOC content of FP 60-2 relative to FP 60 should result in significant life-cycle reductions in VOC and HAP emissions for the WS of interest. Table 14 shows expected life-cycle reductions in VOC and HAP emissions for the WS of interest by replacing FP 60 with FP 60-2.
Table 14: Expected VOC and HAP Life-Cycle Reductions for the WS of Interest
Pollutant Emissions Reduction (lbs.) VOC 386,840 HAP 447,625
Results from the FP 60-2 lab-scale application study were encouraging. They showed that FP 60-2 has acceptable application properties under a wide range of temperature and humidity conditions and indicated that FP 60-2 application properties are positively impacted when the temperature and humidity of the application environment are increased. The extensive material properties testing per the WS material performance specification showed some minor weaknesses in FP 60-2, but the results led LM Aero and WS SPO engineers to conclude that FP 60-2 is qualified for the WS of interest. FP 60-2 airflow testing results showed that induced flaws in FP 60-2 do not propagate when acted upon by airflow and that the failure mode of FP 60-2 in high airflow conditions is acceptable. FP 60-2 showed exceptional application properties during the full-scale application study. The full-scale application study provided valuable information concerning optimum application and operating conditions for FP 60-2. The fact that full-scale equipment and structures were used during the full-scale application study allows the results to be credible for what should occur during production and PDM operations. The results from the full-scale application study, expressed in percent advantage of FP 60-2 relative to FP
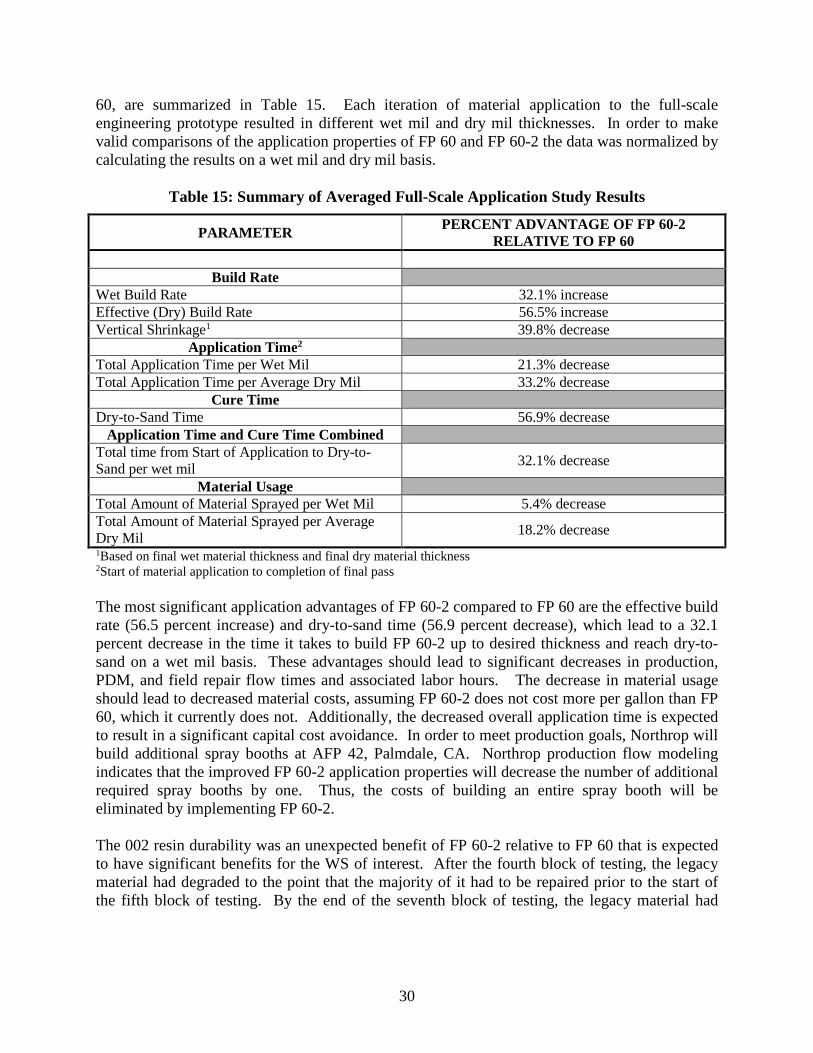
30
60, are summarized in Table 15. Each iteration of material application to the full-scale engineering prototype resulted in different wet mil and dry mil thicknesses. In order to make valid comparisons of the application properties of FP 60 and FP 60-2 the data was normalized by calculating the results on a wet mil and dry mil basis.
Table 15: Summary of Averaged Full-Scale Application Study Results
PARAMETER PERCENT ADVANTAGE OF FP 60-2 RELATIVE TO FP 60
Build Rate
Wet Build Rate 32.1% increase Effective (Dry) Build Rate 56.5% increase Vertical Shrinkage1 39.8% decrease
Application Time2 Total Application Time per Wet Mil 21.3% decrease Total Application Time per Average Dry Mil 33.2% decrease
Cure Time Dry-to-Sand Time 56.9% decrease
Application Time and Cure Time Combined Total time from Start of Application to Dry-to-Sand per wet mil 32.1% decrease
Material Usage Total Amount of Material Sprayed per Wet Mil 5.4% decrease Total Amount of Material Sprayed per Average Dry Mil 18.2% decrease 1Based on final wet material thickness and final dry material thickness 2Start of material application to completion of final pass
The most significant application advantages of FP 60-2 compared to FP 60 are the effective build rate (56.5 percent increase) and dry-to-sand time (56.9 percent decrease), which lead to a 32.1 percent decrease in the time it takes to build FP 60-2 up to desired thickness and reach dry-to-sand on a wet mil basis. These advantages should lead to significant decreases in production, PDM, and field repair flow times and associated labor hours. The decrease in material usage should lead to decreased material costs, assuming FP 60-2 does not cost more per gallon than FP 60, which it currently does not. Additionally, the decreased overall application time is expected to result in a significant capital cost avoidance. In order to meet production goals, Northrop will build additional spray booths at AFP 42, Palmdale, CA. Northrop production flow modeling indicates that the improved FP 60-2 application properties will decrease the number of additional required spray booths by one. Thus, the costs of building an entire spray booth will be eliminated by implementing FP 60-2. The 002 resin durability was an unexpected benefit of FP 60-2 relative to FP 60 that is expected to have significant benefits for the WS of interest. After the fourth block of testing, the legacy material had degraded to the point that the majority of it had to be repaired prior to the start of the fifth block of testing. By the end of the seventh block of testing, the legacy material had
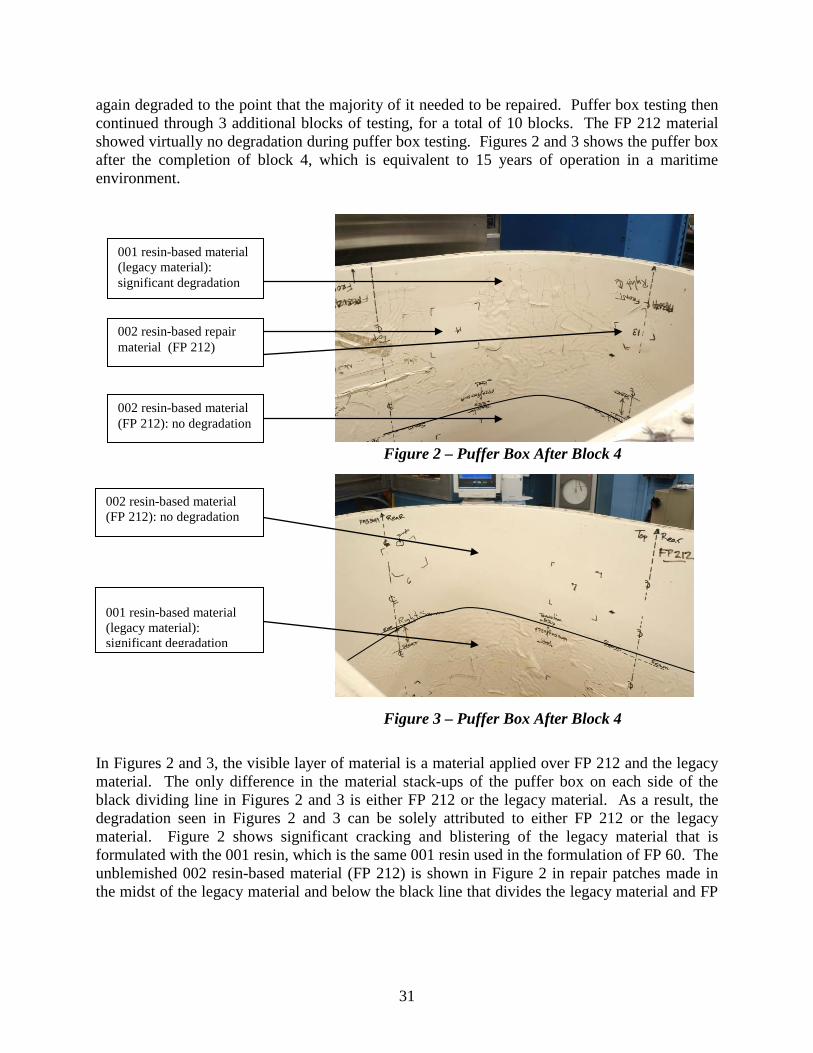
31
again degraded to the point that the majority of it needed to be repaired. Puffer box testing then continued through 3 additional blocks of testing, for a total of 10 blocks. The FP 212 material showed virtually no degradation during puffer box testing. Figures 2 and 3 shows the puffer box after the completion of block 4, which is equivalent to 15 years of operation in a maritime environment.
Figure 2 – Puffer Box After Block 4
Figure 3 – Puffer Box After Block 4 In Figures 2 and 3, the visible layer of material is a material applied over FP 212 and the legacy material. The only difference in the material stack-ups of the puffer box on each side of the black dividing line in Figures 2 and 3 is either FP 212 or the legacy material. As a result, the degradation seen in Figures 2 and 3 can be solely attributed to either FP 212 or the legacy material. Figure 2 shows significant cracking and blistering of the legacy material that is formulated with the 001 resin, which is the same 001 resin used in the formulation of FP 60. The unblemished 002 resin-based material (FP 212) is shown in Figure 2 in repair patches made in the midst of the legacy material and below the black line that divides the legacy material and FP
001 resin-based material (legacy material): significant degradation
002 resin-based material (FP 212): no degradation
002 resin-based repair material (FP 212)
002 resin-based material (FP 212): no degradation
001 resin-based material (legacy material): significant degradation
32
212. Figure 3 is a picture of the puffer box that has been turned over to give a better view of the unblemished, undegraded FP 212 material which is formulated with the same 002 resin that is used in the formulation of FP 60-2. By the end of the tenth block of testing, FP 212 looked nearly the same as it does in Figures 2 and 3. It needs to be stressed that the legacy material is not an unacceptable material; it has been operating on a legacy WS for multiple years. Figures 2 and 3 simply show that 002 resin-based materials are more durable in maritime environments than 001 resin-based materials. The legacy WS does not primarily operate in maritime environments so durability of the legacy material in a maritime environment is not as much of a concern as it is for FP 60-2, which will be applied to aircraft that operate primarily in maritime environments. Overall, FP 60-2 performed better than expected and showed significant environmental and application improvements relative to the baseline, FP 60. The exceptional performance of FP 60-2, combined with the fact that it is a drop-in replacement for FP 60 and that it does not pose increased risk to worker health, makes FP 60-2 a viable replacement for FP 60. With a 51 percent decrease in VOC levels, FP 60-2 should perform better than FP 60 from an environmental stand-point. From a production stand-point, FP 60-2 should decrease overall application time and cure time relative to FP 60. As a result, labor hours for material application and production flow times per unit should decrease. The increased durability of FP 60-2 compared to FP 60 in maritime environments should prove to result in substantial environmental and economic benefits during the life-cycle of the WS of interest. Repairs resulting from FP 60 degradation in maritime environments would result in aircraft downtime, material purchase/usage, labor hours, and VOC emissions. Implementation of FP 60-2 will significantly decrease the frequency and extent of aircraft repairs and all related costs over the WS lifetime. In terms of data reduction, validation, and reporting, LM Aero and Northrop engineers included all raw process data and observations recorded during each demonstration phase as part of the test results deliverables to SAIC. The technical reports and ESTCP reports were then completed by SAIC based on data obtained from LM Aero and Northrop.
33
5. COST ASSESSMENT
5.1 Cost Reporting The full-scale application study provided side-by-side comparisons of the application properties of FP 60-2 and FP 60 and provided useful data for estimating economic advantages for FP 60-2 relative to FP 60. Since full-scale production equipment and full-scale structures were used during this study, the results require no extrapolation to what should occur during production and PDM processes; these results are highly accurate and representative of what should occur during production and PDM activities. The full-scale application study results were used to estimate the labor hour and flow time reductions that should result by transitioning FP 60-2. Relevant personnel at the production facilities where FP 60-2 will be transitioned were consulted to determine if and to what extent the Operations and Maintenance Costs, Indirect Environmental Activity Costs, and Other Costs would change after FP 60 was replaced with FP 60-2. Puffer box testing provided side-by-side comparisons of the durabilities of the 002 and 001 resins, which are relevant for FP 60-2 and FP 60 since they are formulated with the 002 resin and 001 resin, respectively. As such, the puffer box test results provide useful data for estimating economic advantages for FP 60-2 relative to FP 60. Puffer box test results showed that the 002 resin used in FP 60-2 lasts 2 to 3 times longer in an environment that simulates the temperatures, pressures, and exposures that a material experiences when located on certain portions of an aircraft operating continuously in a maritime environment. According to LM Aero engineers, the puffer box test has a high degree of accuracy in terms of the overall exposures and stresses that a material will experience when applied to in-service aircraft operating in a maritime environment. This conclusion is a result of field reports, including pictures, of 001 resin degradation on aircraft operating continuously in maritime environments. The increased durability of the 002 resin should result in significant life-cycle environmental and cost reductions for the WS of interest as the number of depot-level repairs required on aircraft operating in maritime environments will be significantly reduced. The puffer box test results were a major factor for making the decision to replace FP 60 with FP 60-2. In order to quantify the benefits of the increased durability of the 002 resin, puffer box test results were used to estimate the degree and frequency of the degradation that would have occurred in the 001 resin had it been applied to the WS of interest. Additionally, as a result of this program, a few additional 002 resin-based materials besides FP 60-2 have been qualified and transitioned to the WS of interest to replace additional baseline coatings other than FP 60 that are formulated with the 001 resin and that cover a significant portion of the aircraft. The testing of the additional 002 resin-based coatings was performed under a separate Air Force program that ran parallel to this program. It was outside the scope of this program to evaluate any coating other than FP 60-2 since it was not known until near the end of this program that the 002 resin would revolutionize the coating stack-up on the WS of interest. Therefore, the environmental and economic benefits resulting from this program as summarized in this report are extremely conservative. The benefits to the WS of interest as a result of this
34
program are expected to be orders of magnitude higher than the level of benefits summarized in this report due to the increased durability of the 002 resin in maritime environments compared to the durability of the 001 resin in maritime environments. The cost assessment for this program follows the general format of the Environmental Cost Analysis Methodology (ECAM) which was developed by the National Defense Center for Environmental Excellence (NDCEE). A Level II ECAM analysis was performed on the technology demonstrated during this program. Tables 16 and 17 organize and compare the Direct Environmental Activity Process Costs and Indirect Environmental Activity Costs for FP 60 and FP 60-2, based on data from the full-scale application study and puffer box testing. Only those costs that differ between FP 60 and FP 60-2 were quantified. This assessment utilizes a basis founded on per aircraft costs for the purpose of cost reporting.
35
Table 16: ECAM Cost Reporting Table for Baseline Material (FP 60)
Direct Environmental Activity Process Costs Indirect Environmental Activity Costs Other Costs
Start-Up Operations & Maintenance
Activity Unit $ Activity Unit $ Activity Unit $ Activity Unit $
Facility preparation, mobilization
NC Labor for setup, application, cleaning, and repairs
$32,000 Compliance audits NC
NOT WITHIN THE SCOPE OF THIS
PROGRAM
Equipment Design NC Labor to manage hazardous waste
NC Document Maintenance
NC
Equipment purchase and installation
$5,300 Utilities NC Envr. Mmgt. Plan development & maintenance
NC
Training of operators NC Mgmt/Treatment of by-products
NC Reporting requirements
NC
Hazardous waste disposal fees
NC Test/analyze waste streams
NC
OEM & Depot Repair Coating Materials
$26,000 Medical exams (including loss of productive labor)
NC
Process chemicals, Nutrients
NC Waste transportation (on and off-site)
NC
Consumables and supplies
NC OSHA/EHS training NC
Equipment maintenance
NC
Training of operators NC
Totals Per Unit $5,300 $58,000 NC
No Change (NC) relative to FP 60-2 (costs held constant)
36
Table 17: ECAM Cost Reporting Table for FP 60-2
Direct Environmental Activity Process Costs Indirect Environmental Activity Costs Other Costs
Start-Up Operations & Maintenance
Activity Unit $ Activity Unit $ Activity Unit $ Activity Unit $
Facility preparation, mobilization
NC Labor for setup, application, cleaning, and repairs
$4,100 Compliance audits NC
NOT WITHIN THE SCOPE OF THIS
PROGRAM
Equipment Design NC Labor to manage hazardous waste
NC Document Maintenance
NC
Equipment purchase and installation
$4,000 Utilities NC Envr. Mmgt. Plan development & maintenance
NC
Training of operators NC Mgmt/Treatment of by-products
NC Reporting requirements
NC
Hazardous waste disposal fees
NC Test/analyze waste streams
NC
OEM & Depot Repair Coating Materials
$15,400 Medical exams (including loss of productive labor)
NC
Process chemicals, Nutrients
NC Waste transportation (on and off-site)
NC
Consumables and supplies
NC OSHA/EHS training NC
Equipment maintenance
NC
Training of operators NC
Totals Per Unit $4,000 $19,500 NC
No Change (NC) relative to FP 60 (costs held constant)
37
5.2 Cost Analysis
5.2.1 Cost Comparison Tables 16 and 17 show that Start-Up Costs for FP 60-2 will be less than Start-Up costs for FP 60 due to decreased Equipment Purchase and Installation costs on a per unit basis if FP 60-2 is transitioned. The improved application properties of FP 60-2 will eliminate one spray booth that Northrop had planned to build to meet production goals. When this cost avoidance is spread out over the expected total number of aircraft to be produced, the result will be an estimated Equipment Purchase and Installation cost avoidance of $1,300 per aircraft (the difference between $5,300 for FP 60 and $4,000 for FP 60-2).
As Tables 16 and 17 show, the most significant economic benefits of FP 60-2 will be the reduction in labor hours and flow times for production processes and the reduction in the frequency and extent of repairs, which will reduce downtime, labor costs, and material costs associated with repairs. Estimated Operations and Maintenance (O&M) costs on a per aircraft basis for FP 60 are $58,000 and for FP 60-2 are $19,500 for a reduction in total per unit costs of $38,500.
Tables 16 and 17 indicate that the transition to FP 60-2 will have no impact on Indirect Environmental Activity Costs. The 51 percent reduction in VOC content of FP 60-2 relative to FP 60 (213 g/L vs. 432 g/L) will result in significant life-cycle reductions in VOC and HAP emissions. It is estimated that life-cycle VOC and HAP emissions of the WS of interest will be reduced by 386,840 pounds and 447,625 pounds, respectively, by replacing FP 60 with FP 60-2 in production and PDM operations. However, according to the facilities personnel who were consulted during this project who are located at facilities where FP 60-2 will be transitioned, the decrease in VOC and HAP reductions will most likely have no impact on Indirect Environmental Activity Costs. Currently, FP 60-2 is the only qualified alternative to FP 60. The absence of additional qualified innovative technologies prevents this program from conducting a comparison of potential alternatives.
5.2.2 Cost Basis This assessment utilizes a basis founded on per aircraft costs for the purpose of cost reporting. Production and PDM operations were considered when estimating the annual benefits of replacing FP 60 with FP 60-2. Since FP 60-2 will be transitioned to the WS of interest early in its life cycle, significant cost savings will be realized in production and PDM operations over the course of the life cycle. In order to estimate cost savings from production processes, the expected annual production rates of the WS of interest were considered from the expected date of transition of FP 60-2 into production processes through the end of the expected timeframe for producing all aircraft.
38
Cost savings realized from increased durability in maritime environments were estimated based on the number of aircraft that are expected to operate primarily in maritime environments and on when these aircraft begin operating in maritime environments. Puffer box test results provided data for determining the length of time that FP 60 and FP 60-2 could operate on certain locations of an aircraft operating continuously in a maritime environment before PDM-level repairs would be required. Puffer box test results also provided data for determining the extent of repairs that would be required to FP 60 and FP 60-2 on aircraft operating in maritime environments. This data was used to determine when PDM-level repairs to FP 60 would be expected to begin and what the expected extent and frequency of the repairs to FP 60 would be on aircraft that are going to be operating primarily in maritime environments. Puffer box test results showed that PDM-level repairs should not be required for FP 60-2 during the life-cycle of an aircraft operating primarily in a maritime environment.
5.2.3 Cost Drivers The major cost drivers associated with FP 60 are: (1) low build rate, (2) the length of material cure times, and (3) expected degradation in maritime environments. These cost drivers lead to relatively high labor costs for material application, lengthy flow times, and significant costs associated with repairs. In turn, the increased process flow time negatively impacts OEM and PDM weapon system delivery schedules, which has the potential to reduce overall mission readiness. FP 60-2 has significant advantages relative to FP 60 in all of the stated cost driver categories. As such, the investment in demonstrating and validating FP 60-2 will be extremely rewarding. The drop-in replacement status of FP 60-2, combined with significant annual and LCC cost reductions, will lead to excellent financial metrics for DoD as a whole and for ESTCP.
5.2.4 Life Cycle Costs The LCC of FP 60-2 are expected to be significantly less than those of FP 60. The following sections address expected cost savings during the WS life cycle.
5.2.4.1 Facility Capital Cost Implementation of FP 60-2 will result in a reduction of planned facility costs with respect to the number of spray booths that are required to be built to meet production goals. An assessment performed by Northrop personnel at AFP 42 attribute the elimination of one spray booth to the application advantages of FP 60-2 relative to FP 60. These booths incorporate BACT and are priced at well over a million dollars each for equipment and installation.
5.2.4.2 Startup, Operations, and Maintenance Costs Since FP 60-2 is a drop-in replacement for FP 60, the start-up costs of transitioning to FP 60-2 should be minimal. Facilities should anticipate a brief

39
period for operators to become proficient with application of FP 60-2. However, the expected financial impact is minimal since the testing performed during this program, especially the full-scale application study, allowed engineers and spray operators to become familiar with the application properties of FP 60-2 and provided training for applying FP 60-2. Results from the full-scale application study indicate that the operational costs of FP 60-2 will be lower than those for FP 60. Facilities that use FP 60-2 in production and PDM operations should realize reduced flow time requirements due to the greater build rate, faster cure, and decreased overall application time of FP 60-2 relative to FP 60. The full-scale application study provided data that was used to estimate overall application times of each coating that were then converted into estimated labor hours required for material application time and flow time on a per-aircraft basis. These estimated per-aircraft cost reductions were then applied to expected annual production rates for the WS of interest to determine expected annual cost reductions during production operations resulting from improved FP 60-2 application properties. While the significant environmental benefits of this program will most likely not result in economic savings, they are still considered and quantified for the positive impacts they will have on the environment and human health. The release of VOC and HAP emissions into the Earth’s atmosphere impacts air quality and increases the risk of health problems. VOCs have been shown to contribute to the formation of ground-level ozone, which is a pollutant and can lead to severe respiratory problems and can damage crops and vegetation. HAPs are known or suspected carcinogens. Through the use of FP 60-2, approximately 386,840 pounds of VOC emissions and 447,625 pounds of HAP emissions will be eliminated from production and PDM operations during the life-cycle of the WS of interest. Puffer box test results indicate that the cost of maintaining FP 60-2 during the WS life-cycle will be significantly less compared to the cost of maintaining FP 60. The results from puffer box testing allowed for a determination to be made of the frequency and extent of repairs that would be required to FP 60 and FP 60-2 applied to aircraft operating in maritime environments. Expected aircraft production schedules were used to determine the number of manufactured aircraft per year that would be operating in maritime environments and when these aircraft would begin operating in the maritime environments. Puffer box test results were then used to determine when PDM-level repairs would begin to be required for these aircraft, had FP 60 been applied to them, and what the extent of the repairs would be. Estimates were determined for the costs associated with repairs that would have to be made to FP 60 on operational aircraft that exhibited the material degradation observed during puffer box testing. The most significant costs would be for material purchase and labor
40
hours required to make the repairs. The puffer box test results indicated that PDM-level repairs would be required to be made to FP 60 twice during the life-cycle of an aircraft operating in a maritime environment. No PDM-level repairs would be required for FP 60-2 at any time during the life-cycle of an aircraft operating in a maritime environment.
5.2.4.3 Equipment Replacement Costs There will be no equipment replacement costs since FP 60-2 is a drop-in replacement for FP 60.
5.2.4.4 Re-application Costs Small-scale repairs (not to be confused with PDM-level repairs) would most likely be required for FP 60 and FP 60-2 due to damage during flight operations from debris, bird strikes, heavy rain and hail, and battle damage. Application costs to make small-area repairs are expected to be less for FP 60-2 compared to FP 60 since FP 60-2 builds up quicker and cures quicker, reducing labor hours for application. However, no attempt was made to estimate the frequency or extent of small area repairs that would be required of either coating during a WS life-cycle. Instead, PDM-level repairs were considered when assessing re-application costs. Puffer box test results indicate that FP 60-2 will not require PDM-level repairs at any time during the WS life-cycle, where FP 60 would require such repairs twice during the WS life-cycle.
5.2.4.5 Financial Metrics In order to evaluate the cost performance of this program and the impacts of FP 60-2 transition, the series of negative cash flows that occurred to execute this program and the series of positive cash flows that are expected to occur once FP 60-2 is implemented are evaluated. Tables 18 and 19 report the negative cash flows (costs) that resulted from the cost of the FP 60-2 demonstration and the positive cash flows [expected annual cost savings (benefits)] once FP 60-2 is implemented, the present values of the costs and benefits, and the difference between the present values of the benefits and costs, which is the Net Present Value (NPV) of the series of negative and positive cash flows. Table 18 reports these financial metrics on a DoD-wide basis that includes costs contributed by AFRL/MLSC, ASC/ENVV, and ESTCP. Table 19 reports these financial metrics on an ESTCP basis that includes costs contributed by ESTCP only. The positive cash flows (expected annual benefits) reported in Tables 18 and 19 are the same since they both reflect the benefits that should occur once FP 60-2 replaces FP 60. The only difference between Tables 18 and 19 is the series of
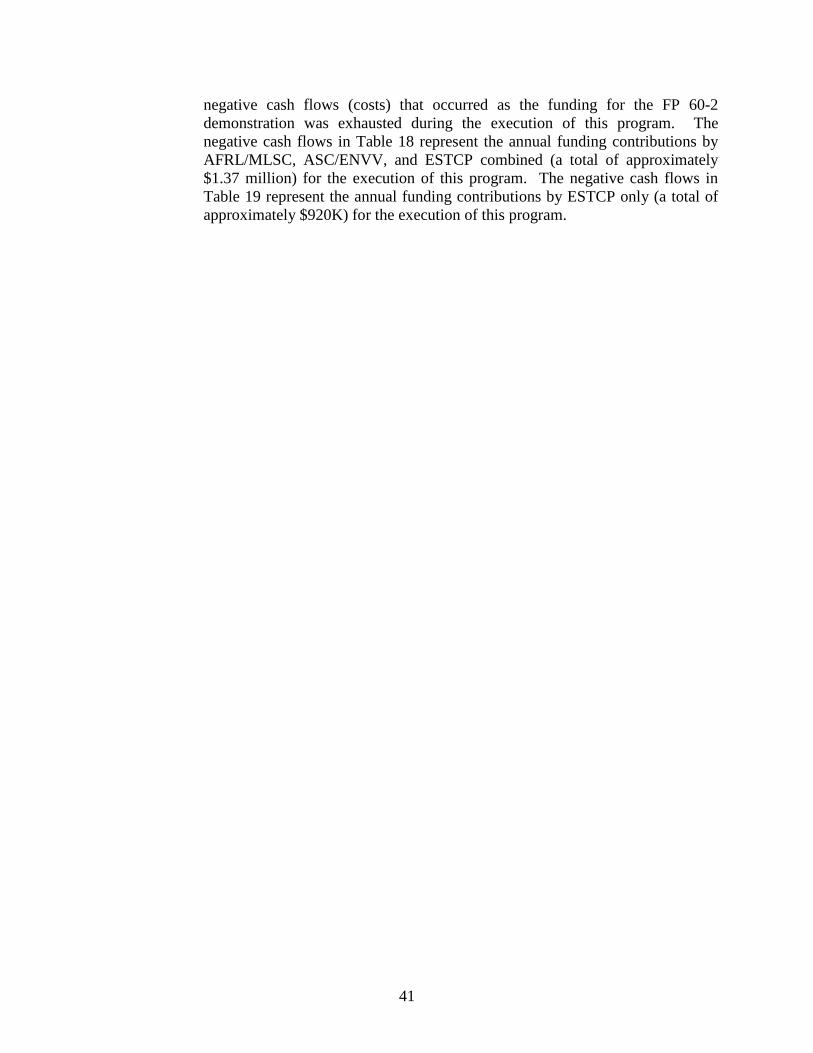
41
negative cash flows (costs) that occurred as the funding for the FP 60-2 demonstration was exhausted during the execution of this program. The negative cash flows in Table 18 represent the annual funding contributions by AFRL/MLSC, ASC/ENVV, and ESTCP combined (a total of approximately $1.37 million) for the execution of this program. The negative cash flows in Table 19 represent the annual funding contributions by ESTCP only (a total of approximately $920K) for the execution of this program.
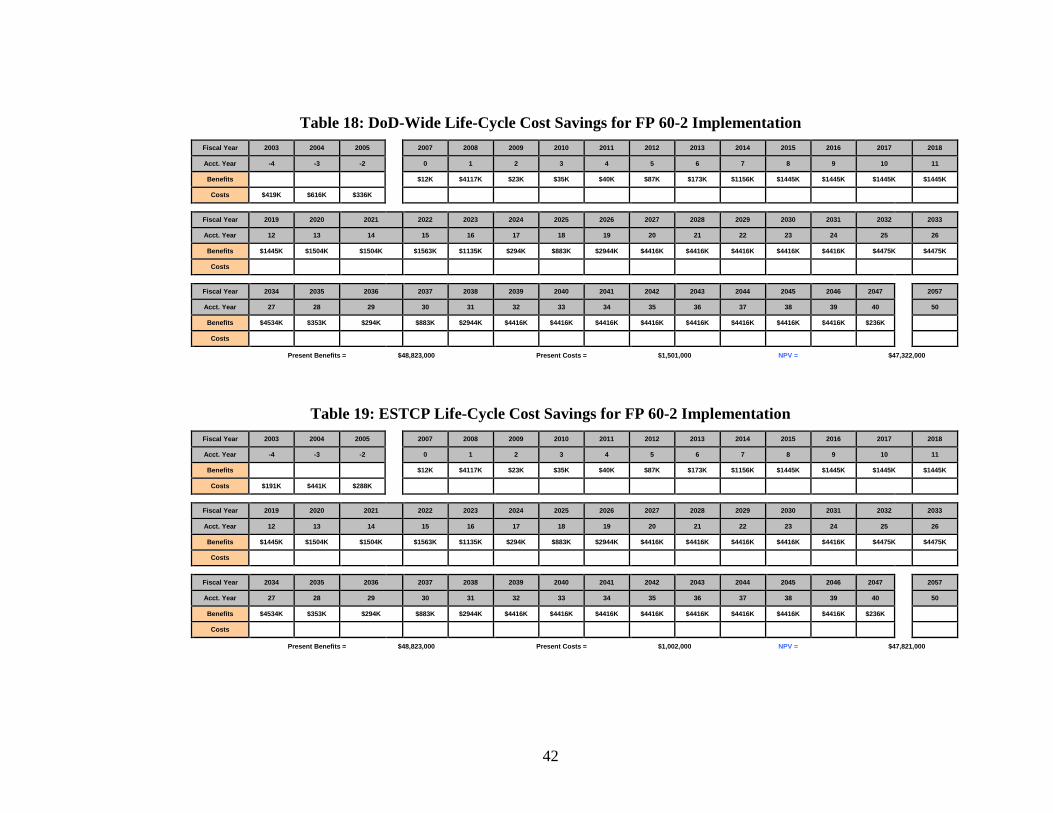
42
Table 18: DoD-Wide Life-Cycle Cost Savings for FP 60-2 Implementation
Fiscal Year 2003 2004 2005 2007 2008 2009 2010 2011 2012 2013 2014 2015 2016 2017 2018
Acct. Year -4 -3 -2 0 1 2 3 4 5 6 7 8 9 10 11
Benefits $12K $4117K $23K $35K $40K $87K $173K $1156K $1445K $1445K $1445K $1445K
Costs $419K $616K $336K
Fiscal Year 2019 2020 2021 2022 2023 2024 2025 2026 2027 2028 2029 2030 2031 2032 2033
Acct. Year 12 13 14 15 16 17 18 19 20 21 22 23 24 25 26
Benefits $1445K $1504K $1504K $1563K $1135K $294K $883K $2944K $4416K $4416K $4416K $4416K $4416K $4475K $4475K
Costs
Fiscal Year 2034 2035 2036 2037 2038 2039 2040 2041 2042 2043 2044 2045 2046 2047 2057
Acct. Year 27 28 29 30 31 32 33 34 35 36 37 38 39 40 50
Benefits $4534K $353K $294K $883K $2944K $4416K $4416K $4416K $4416K $4416K $4416K $4416K $4416K $236K
Costs
Present Benefits = $48,823,000 Present Costs = $1,501,000 NPV = $47,322,000
Table 19: ESTCP Life-Cycle Cost Savings for FP 60-2 Implementation
Fiscal Year 2003 2004 2005 2007 2008 2009 2010 2011 2012 2013 2014 2015 2016 2017 2018
Acct. Year -4 -3 -2 0 1 2 3 4 5 6 7 8 9 10 11
Benefits $12K $4117K $23K $35K $40K $87K $173K $1156K $1445K $1445K $1445K $1445K
Costs $191K $441K $288K
Fiscal Year 2019 2020 2021 2022 2023 2024 2025 2026 2027 2028 2029 2030 2031 2032 2033
Acct. Year 12 13 14 15 16 17 18 19 20 21 22 23 24 25 26
Benefits $1445K $1504K $1504K $1563K $1135K $294K $883K $2944K $4416K $4416K $4416K $4416K $4416K $4475K $4475K
Costs
Fiscal Year 2034 2035 2036 2037 2038 2039 2040 2041 2042 2043 2044 2045 2046 2047 2057
Acct. Year 27 28 29 30 31 32 33 34 35 36 37 38 39 40 50
Benefits $4534K $353K $294K $883K $2944K $4416K $4416K $4416K $4416K $4416K $4416K $4416K $4416K $236K
Costs
Present Benefits = $48,823,000 Present Costs = $1,002,000 NPV = $47,821,000
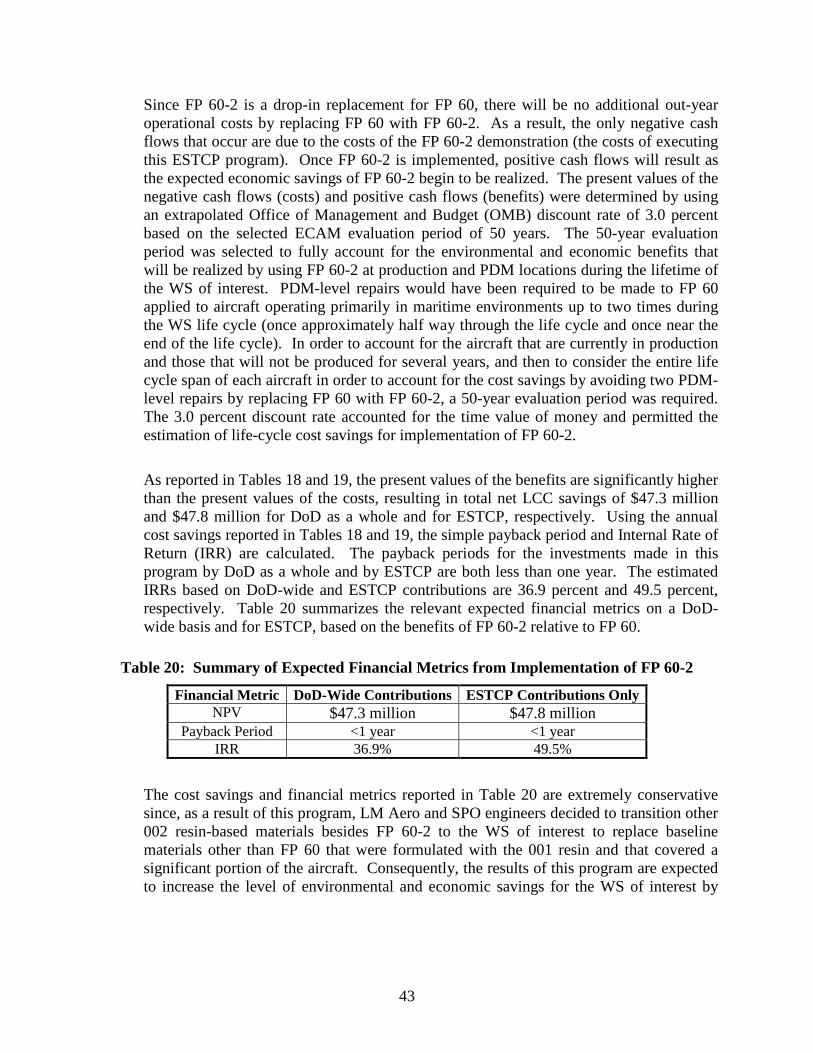
43
Since FP 60-2 is a drop-in replacement for FP 60, there will be no additional out-year operational costs by replacing FP 60 with FP 60-2. As a result, the only negative cash flows that occur are due to the costs of the FP 60-2 demonstration (the costs of executing this ESTCP program). Once FP 60-2 is implemented, positive cash flows will result as the expected economic savings of FP 60-2 begin to be realized. The present values of the negative cash flows (costs) and positive cash flows (benefits) were determined by using an extrapolated Office of Management and Budget (OMB) discount rate of 3.0 percent based on the selected ECAM evaluation period of 50 years. The 50-year evaluation period was selected to fully account for the environmental and economic benefits that will be realized by using FP 60-2 at production and PDM locations during the lifetime of the WS of interest. PDM-level repairs would have been required to be made to FP 60 applied to aircraft operating primarily in maritime environments up to two times during the WS life cycle (once approximately half way through the life cycle and once near the end of the life cycle). In order to account for the aircraft that are currently in production and those that will not be produced for several years, and then to consider the entire life cycle span of each aircraft in order to account for the cost savings by avoiding two PDM-level repairs by replacing FP 60 with FP 60-2, a 50-year evaluation period was required. The 3.0 percent discount rate accounted for the time value of money and permitted the estimation of life-cycle cost savings for implementation of FP 60-2. As reported in Tables 18 and 19, the present values of the benefits are significantly higher than the present values of the costs, resulting in total net LCC savings of $47.3 million and $47.8 million for DoD as a whole and for ESTCP, respectively. Using the annual cost savings reported in Tables 18 and 19, the simple payback period and Internal Rate of Return (IRR) are calculated. The payback periods for the investments made in this program by DoD as a whole and by ESTCP are both less than one year. The estimated IRRs based on DoD-wide and ESTCP contributions are 36.9 percent and 49.5 percent, respectively. Table 20 summarizes the relevant expected financial metrics on a DoD-wide basis and for ESTCP, based on the benefits of FP 60-2 relative to FP 60.
Table 20: Summary of Expected Financial Metrics from Implementation of FP 60-2
Financial Metric DoD-Wide Contributions ESTCP Contributions Only NPV $47.3 million $47.8 million
Payback Period <1 year <1 year IRR 36.9% 49.5%
The cost savings and financial metrics reported in Table 20 are extremely conservative since, as a result of this program, LM Aero and SPO engineers decided to transition other 002 resin-based materials besides FP 60-2 to the WS of interest to replace baseline materials other than FP 60 that were formulated with the 001 resin and that covered a significant portion of the aircraft. Consequently, the results of this program are expected to increase the level of environmental and economic savings for the WS of interest by
44
orders of magnitude relative to those summarized in this report due to the increased durability of the 002 resin in maritime environments compared to the durability of the 001 resin in maritime environments.
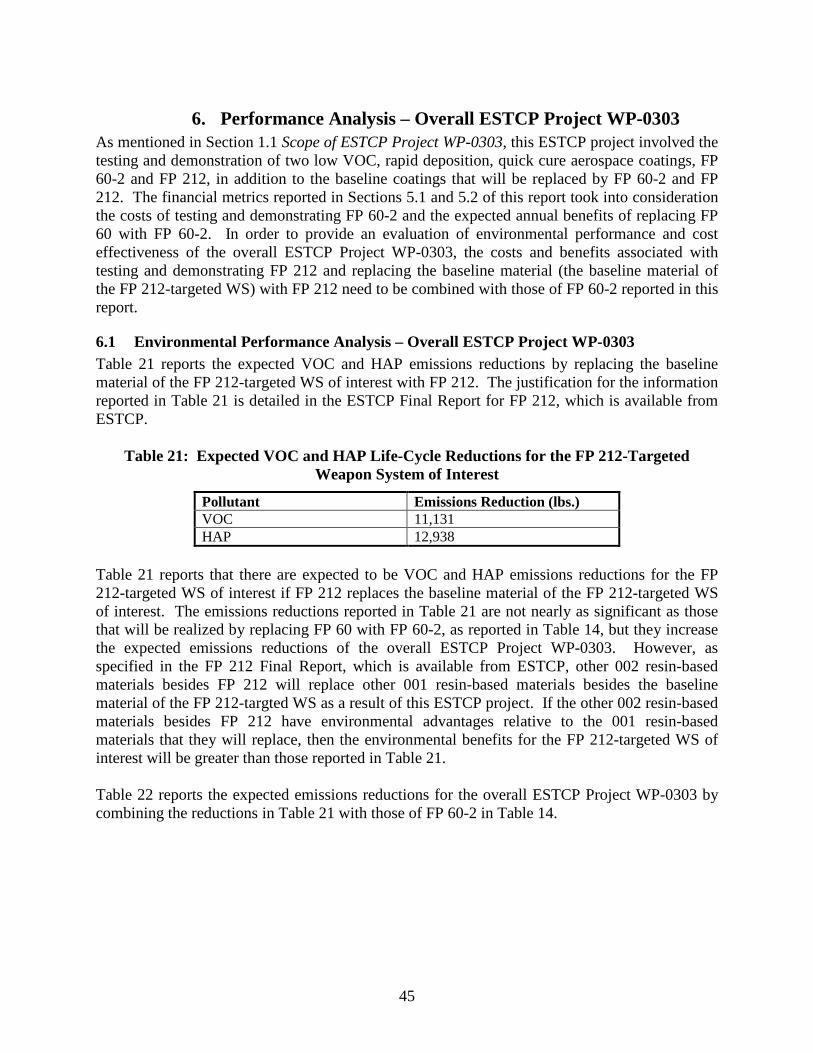
45
6. Performance Analysis – Overall ESTCP Project WP-0303 As mentioned in Section 1.1 Scope of ESTCP Project WP-0303, this ESTCP project involved the testing and demonstration of two low VOC, rapid deposition, quick cure aerospace coatings, FP 60-2 and FP 212, in addition to the baseline coatings that will be replaced by FP 60-2 and FP 212. The financial metrics reported in Sections 5.1 and 5.2 of this report took into consideration the costs of testing and demonstrating FP 60-2 and the expected annual benefits of replacing FP 60 with FP 60-2. In order to provide an evaluation of environmental performance and cost effectiveness of the overall ESTCP Project WP-0303, the costs and benefits associated with testing and demonstrating FP 212 and replacing the baseline material (the baseline material of the FP 212-targeted WS) with FP 212 need to be combined with those of FP 60-2 reported in this report.
6.1 Environmental Performance Analysis – Overall ESTCP Project WP-0303 Table 21 reports the expected VOC and HAP emissions reductions by replacing the baseline material of the FP 212-targeted WS of interest with FP 212. The justification for the information reported in Table 21 is detailed in the ESTCP Final Report for FP 212, which is available from ESTCP.
Table 21: Expected VOC and HAP Life-Cycle Reductions for the FP 212-Targeted Weapon System of Interest
Pollutant Emissions Reduction (lbs.) VOC 11,131 HAP 12,938
Table 21 reports that there are expected to be VOC and HAP emissions reductions for the FP 212-targeted WS of interest if FP 212 replaces the baseline material of the FP 212-targeted WS of interest. The emissions reductions reported in Table 21 are not nearly as significant as those that will be realized by replacing FP 60 with FP 60-2, as reported in Table 14, but they increase the expected emissions reductions of the overall ESTCP Project WP-0303. However, as specified in the FP 212 Final Report, which is available from ESTCP, other 002 resin-based materials besides FP 212 will replace other 001 resin-based materials besides the baseline material of the FP 212-targted WS as a result of this ESTCP project. If the other 002 resin-based materials besides FP 212 have environmental advantages relative to the 001 resin-based materials that they will replace, then the environmental benefits for the FP 212-targeted WS of interest will be greater than those reported in Table 21. Table 22 reports the expected emissions reductions for the overall ESTCP Project WP-0303 by combining the reductions in Table 21 with those of FP 60-2 in Table 14.
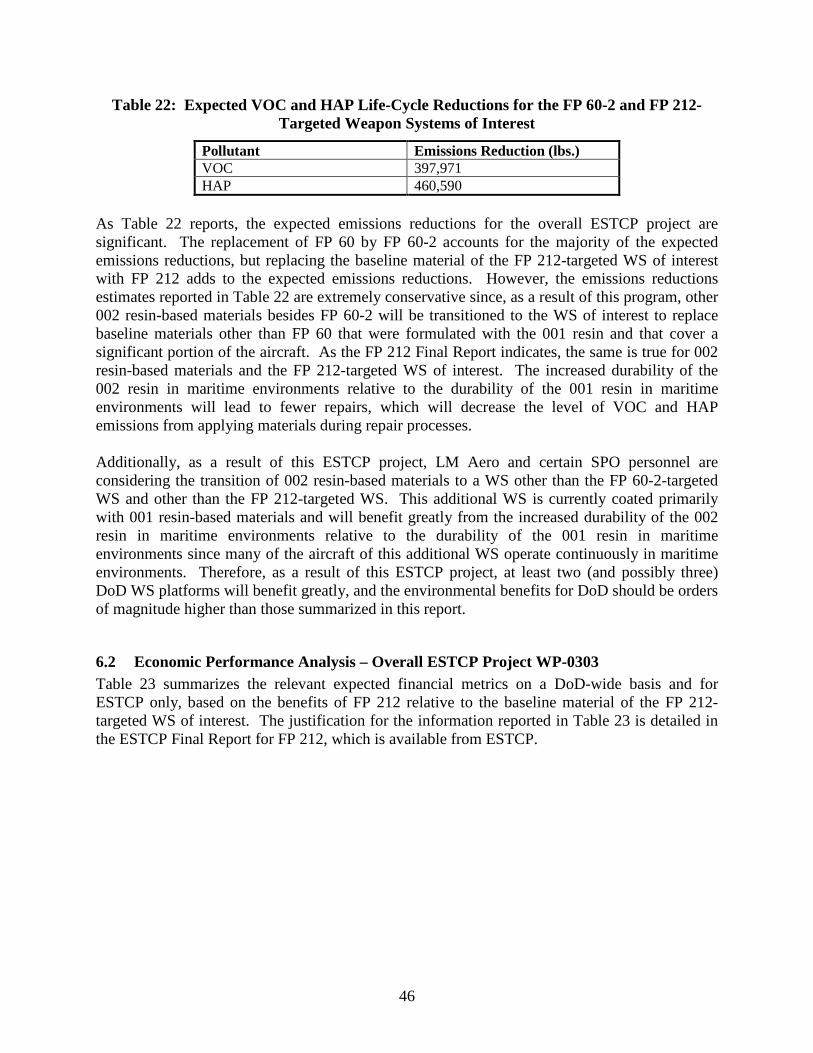
46
Table 22: Expected VOC and HAP Life-Cycle Reductions for the FP 60-2 and FP 212-Targeted Weapon Systems of Interest
Pollutant Emissions Reduction (lbs.) VOC 397,971 HAP 460,590
As Table 22 reports, the expected emissions reductions for the overall ESTCP project are significant. The replacement of FP 60 by FP 60-2 accounts for the majority of the expected emissions reductions, but replacing the baseline material of the FP 212-targeted WS of interest with FP 212 adds to the expected emissions reductions. However, the emissions reductions estimates reported in Table 22 are extremely conservative since, as a result of this program, other 002 resin-based materials besides FP 60-2 will be transitioned to the WS of interest to replace baseline materials other than FP 60 that were formulated with the 001 resin and that cover a significant portion of the aircraft. As the FP 212 Final Report indicates, the same is true for 002 resin-based materials and the FP 212-targeted WS of interest. The increased durability of the 002 resin in maritime environments relative to the durability of the 001 resin in maritime environments will lead to fewer repairs, which will decrease the level of VOC and HAP emissions from applying materials during repair processes. Additionally, as a result of this ESTCP project, LM Aero and certain SPO personnel are considering the transition of 002 resin-based materials to a WS other than the FP 60-2-targeted WS and other than the FP 212-targeted WS. This additional WS is currently coated primarily with 001 resin-based materials and will benefit greatly from the increased durability of the 002 resin in maritime environments relative to the durability of the 001 resin in maritime environments since many of the aircraft of this additional WS operate continuously in maritime environments. Therefore, as a result of this ESTCP project, at least two (and possibly three) DoD WS platforms will benefit greatly, and the environmental benefits for DoD should be orders of magnitude higher than those summarized in this report.
6.2 Economic Performance Analysis – Overall ESTCP Project WP-0303 Table 23 summarizes the relevant expected financial metrics on a DoD-wide basis and for ESTCP only, based on the benefits of FP 212 relative to the baseline material of the FP 212-targeted WS of interest. The justification for the information reported in Table 23 is detailed in the ESTCP Final Report for FP 212, which is available from ESTCP.
47
Table 23: Summary of Expected Financial Metrics Resulting from Implementation of FP 212
Financial Metric DoD-Wide Contributions ESTCP Contributions Only NPV -$401K -$326K
Payback Period N/A* N/A* IRR -18.6% -17.0%
*The total expected positive cash flows (estimated cumulative annual cost savings) are lower than the total negative cash flows (cost of the FP 212 testing and demonstration) As Table 23 shows, the NPV on a DoD-Wide basis and for ESTCP are both negative since the present value of the costs associated with testing and demonstration of FP 212 are greater than the present value of the expected benefits of replacing the baseline material with FP 212. As a result, the costs of testing and demonstrating FP 212 will not be “paid back” and the IRRs for the DoD-wide contributions and ESTCP-only contributions are negative. However, as specified in the FP 212 Final Report, which is available from ESTCP, other 002 resin-based materials besides FP 212 will replace other 001 resin-based materials besides the baseline material of the FP 212-targted WS as a result of this ESTCP project. If the other 002 resin-based materials besides FP 212 have application advantages relative to the 001 resin-based materials that they will replace, then the financial metrics for the FP 212-targeted WS of interest will be better than those reported in Table 23. Table 24 summarizes the relevant expected financial metrics on a DoD-wide basis and for ESTCP for the overall ESTCP Project WP-0303. Table 24: Summary of Expected Financial Metrics Resulting from Implementation of FP
60-2 and FP 212
Financial Metric DoD-Wide Contributions ESTCP Contributions Only NPV $46.9 million $47.5 million
Payback Period <1 year <1 year IRR 30.9% 39.7%
As reported in Table 23, even though the financial metrics for the FP 212 portion of ESTCP Project WP-0303 are negative, the overall financial metrics for ESTCP Project WP-0303 are extremely attractive, as Table 24 reports, due to the substantial economic benefits that are expected to result by replacing FP 60 with FP 60-2, as reported in Table 20. However, these financial metric estimates are extremely conservative since, as a result of this program, other 002 resin-based materials besides FP 60-2 will be transitioned to the FP 60-2-targeted WS of interest to replace baseline materials other than FP 60 that are formulated with the 001 resin and that cover a significant portion of the aircraft. As the FP 212 Final Report indicates, the same is true for 002 resin-based materials and the FP 212-targeted WS of interest. Additionally, as a result of this ESTCP project, LM Aero and certain SPO personnel are considering the transition of 002 resin-based materials to a WS other than the FP 60-2-targeted
48
WS and other than the FP 212-targeted WS. This additional WS is currently coated primarily with 001 resin-based materials and will benefit greatly from the increased durability of the 002 resin in maritime environments relative to the durability of the 001 resin in maritime environments since many of the aircraft of this additional WS operate continuously in maritime environments. Therefore, as a result of this ESTCP project, at least two (and possibly three) DoD WS platforms will benefit greatly, and the economic benefits for DoD should be orders of magnitude higher than those summarized in this report.
6.3 Overall Analysis of ESTCP Project WP-0303 The two materials demonstrated and validated during this project, FP 212 and FP 60-2, have lower VOC contents and superior application properties than the materials they will replace. These advantages are expected to result in environmental and economic benefits for the facilities that transition these materials. The durabilities of FP 212 and FP 60-2 in maritime environments were demonstrated to be far superior to the durabilities in maritime environments of the materials that they will replace due to the superior durability of the 002 resin in maritime environments compared to the durability of the 001 resin in maritime environments. It is anticipated that transitioning to 002 resin-based materials will allow aircraft that operate continuously in maritime environments to avoid material degradation that would require PDM-level repairs. The results of this ESTCP project have revolutionized the material stack-ups of two WS platforms of interest, and a third WS is strongly evaluating the results of this project. As a result of this ESTCP project, the material stack-ups have shifted from 001 resin-based materials to 002 resin-based materials, due mainly to the superior durability of the 002 resin in maritime environments compared to the durability of the 001 resin in maritime environments. The increased durability of the 002 resin relative to the 001 resin will have far-reaching beneficial impacts to aircraft that operate continuously in maritime environments. Life-cycle VOC and HAP emissions reductions will significantly decrease the life-cycle environmental foot-print of the two WS platforms of interest. The cost reductions to be realized over the life-cycle of the two WS platforms of interest have resulted in financial metrics for this ESTCP project that are highly favorable. Additionally, LM Aero is considering the transition of 002 resin-based materials to replace 001 resin-based materials on a WS platform other than the two targeted during this project. The environmental and economic benefits that DoD should realize as a result of this ESTCP project are expected to be orders of magnitude higher than those reported in this Final Report since it was outside the scope of this project to evaluate the benefits of all of the 002 resin-based materials that will be transitioned to the two WS platforms of interest and possibly to a third WS of interest.
49
7. IMPLEMENTATION ISSUES
7.1 Environmental Permits Title V of the CAA was the primary regulatory driver for this project. Application of aerospace coatings are subject to state, local and site restrictions on total VOC allotments. Furthermore, coating applications may comprise a significant portion of a facility’s overall emissions, which are subject to National Emission Standards for Hazardous Air Pollutants (NESHAP) regulation. No new regulatory approvals, licenses, or permits were required as part of this demonstration since the VOC content of FP 60-2 is 51 percent lower than the VOC content of FP 60. Also, there was no involvement or interaction with regulators or governmental validation programs beyond that which was part of normal day-to-day operations at each AFP.
7.2 Other Regulatory Issues It is unlikely that regulatory issues will arise from full-scale implementation of FP 60-2 since this coating is a drop-in replacement that creates a smaller environmental “footprint” on a per-weapon system basis than FP 60. Northrop personnel at AFP 42 and LM Aero personnel at AFP 4 will share FP 60-2 technology performance with site regulators to the extent currently established for FP 60. Information regarding FP 60-2 application and environmental impact will be provided to interested public entities within the limits permissible by law.
7.3 End-User/Original Equipment Manufacturer (OEM) Issues The prime contractor and subcontractor for the WS of interest, LM Aero and Northrop, respectively, and representatives from the WS SPO had significant involvement in this program. The lab-scale application study was performed by LM Aero and Northrop at the Northrop facility in El Segundo, CA, and the lab-scale qualification testing, airflow testing, and full-scale application study were performed by LM Aero at AFP 4, Ft. Worth, TX. The puffer box test was also performed by LM Aero at AFP 4. In attendance at the Technical Interchange Meetings (TIMs) for this program were the relevant LM Aero and Northrop engineers, as well as relevant SPO engineers for the WS of interest, SAIC engineers, and the ASC/ENVV program manager. After all testing performed under this program was completed, the final Technical Interchange Meeting (TIM) for this program was held at the SAIC facility in Dayton, OH on 11 April 2007. In attendance at the meeting were the ASC/ENVV program manager, the relevant SPO representatives from the Air Force and Navy (NAVAIR), the LM Aero manager for the WS Materials and Processes, additional LM Aero engineers, and SAIC engineers. After a review of all test data generated during this program, the decision was made to begin production acceptance testing of FP 60-2. This decision indicates that the relevant LM Aero and SPO engineers feel that the performance of FP 60-2 is acceptable and that FP 60-2 will be listed on the LM Aero QPL. For production acceptance testing, full-scale production batches of FP 60-2 will be ordered and sent to AFP 42, where Northrop will perform spray optimization evaluations with the robotic spray system. LM Aero will test a few kits (gallons) from each full-scale batch
50
to evaluate variability in critical properties from batch to batch. The objective of production acceptance testing is to finalize preparations for FP 60-2 transition into production processes. Once production acceptance testing is completed, FP 60-2 will be transitioned to production processes, assuming no major problems are encountered during production acceptance testing. It is highly unlikely that any major problems will be experienced during production acceptance testing since there were no major problems encountered during FP 60-2 testing at any previous point in this program. Production acceptance testing will be funded by the SPO of the WS of interest. There should be little risk in procurement issues related to FP 60-2 since the same vendor that has provided FP 60, which has been in use by LM Aero for multiple years, also provides FP 60-2. No additional equipment will need to be purchased since FP 60-2 is a drop-in replacement for FP 60. LM Aero, Northrop and the WS SPO actively participated in this ESTCP effort to facilitate the decision to transition FP 60-2 to AFP 42 and AFP 4. Transition of this technology to repair facilities cannot occur at this time due to the fact that depot-level responsibilities have not been assigned for the WS of interest.
51
8. REFERENCES Reyher, Lucas S., Ferrill, Thomas A. (2008). FP 60-2 Cost & Performance Report. Contractor Report. Contract No. F41624-03-D-8614, Task Order 108. July. Reyher, Lucas S. (2006). FP 60-2 Laboratory-Scale Application Study. Contractor Report. Contract No. F41624-03-D-8614, Task Order 89. June. Reyher, Lucas S., Gulley, Lee R. (2006). FP 212 Puffer Box Testing. Contractor Report. Contract No. F41624-03-D-8614, Task Order 56. July. Reyher, Lucas S., Ferrill, Thomas A. (2007). FP 60-2 Material Properties Testing. Contractor Report. Contract No. F41624-03-D-8614, Task Order 56. November. Reyher, Lucas S., Ferrill, Thomas A. (2006). FP 60-2 Airflow Testing. Contractor Report. Contract No. F41624-03-D-8614, Task Order 56. July. Reyher, Lucas S., Ferrill, Thomas A. (2007). FP 60-2 Full-Scale Application Study. Contractor Report. Contract No. F41624-03-D-8614, Task Order 108. February. National Defense Center for Environmental Excellence. (1999). Environmental Cost Analysis Methodology (ECAM) Handbook. March. Office of Management and Budget. (2007). Circular Number A-94, Appendix C (revised January 2007). Discount Rates for Cost-Effectiveness, Lease Purchase, and Related Analyses. http://www.whitehouse.gov/omb/circulars/a094/a94_appx-c.html U.S. Government Accountability Office. (2006). Report to Congressional Committees.
A-1
9. POINTS OF CONTACT
POINT OF CONTACT
Name
ORGANIZATION Name
Address Phone/Email Role in Project
Roddy Keish ASC/ENVV 1801 Tenth St.
WPAFB, OH 45433
(937) 255-3541 [email protected]
Government Program Manager
James Byron
SAIC 4031 Colonel Glenn Hwy Beavercreek, OH 45431
(937) 431-2239 [email protected]
SAIC Project Manager
Lucas Reyher SAIC 4031 Colonel Glenn Hwy Beavercreek, OH 45431
(937) 431-4426 [email protected]
SAIC Principle Investigator
Thomas Ferrill SAIC 4031 Colonel Glenn Hwy Beavercreek, OH 45431
(937) 431-2330 [email protected]
SAIC Technical Support
Randall Reed LM Aeronautics Co. PO Box 748
Mail Zone 2893 Ft Worth, TX 76101
(817) 763-7396 [email protected]
LM Aero Project Manager
John Schueler LM Aeronautics Co. PO Box 749
Mail Zone 2893 Ft Worth, TX 76101
(817) 763-7377 [email protected]
LM Aero Manager, Materials and
Processes
Greg Flusche LM Aeronautics Co. PO Box 749
Mail Zone 2893 Ft Worth, TX 76101
(817) 777-5109 [email protected]
LM Aero Principle Investigator
Stan Bean Northrop Grumman Corporation
El Segundo, CA
(310) 350-5595 [email protected]
Northrop Grumman Principle Investigator