
ADVANTAGE OR PARADOX? - UNICEF › media › 60451 › file › Advantage... · Advantage or...
40
ADVANTAGE OR PARADOX? The challenge for children and young people of growing up urban
Transcript of ADVANTAGE OR PARADOX? - UNICEF › media › 60451 › file › Advantage... · Advantage or...

ADVANTAGE OR PARADOX?
The challenge for children and young people
of growing up urban

Acknowledgements
Core report teamJan Beise, Bin Lian and Danzhen You
Strategic conceptualization and technical guidance Laurence Chandy, Mark Hereward and Danzhen You
Project management and coordinationDanzhen You
Raw data processingIvana Bjelic, Yadigar Coskun and Tijana Sukilovic
Data analysis and researchJan Beise and Bin Lian
Additional analytical inputsRobert Bain, Claudia Cappa, Liliana Carvajal, Enrique Delamonica, Mamadou Diallo, Chika Hayashi, Lucia Hug, Aleya Khalifa, Julia Krasevec, Richard Kumapley, Chibwe Lwamba, Vrinda Mehra, Christina Misunas, Suguru Mizunoya, Padraic Murphy, Tyler Porth, David Sharrow, Tom Slaymaker, Xinxin Yu and Yanhong Zhang.
Policy inputsDavid Anthony and Thomas George
WritingDavid Anthony and Jan Beise
Copy editing Margaret Ferry, Anna Mukerjee and Brina Seidel
Data visualization, design and layout Sinae Lee
This report has benefited from valuable inputs and support by many colleagues. Particular thanks to: Jens Aerts, Mitchell Cook, Marija Adrianna de Wijn, Attila Hancioglu, Priscilla Idele, Debra Jackson, Gautam Narasimhan, Rada Noeva, Khin Wityee Oo, Luwei Pearson, Stefan Swartling Peterson, Cecilia Silva Venturini, Anthony Spalton, Ayano Suzumura, Upasana Young, Willibald Zeck and the UNICEF Urban Task Team.
ISBN: 978-92-806-4977-2
Photograph creditsCover: © UNICEF/UNI155639/LovellPage 8 - 9: © UNICEF/UNI127684/VishwanathanPage 12: © UNICEF/UN014915/EsteyPage 17: © UNICEF/UNI165049/Lovell Page 23: © UNICEF/UNI106910/DorminoPage 28 - 29: © UNICEF/UN044344/SujanPage 31: © UNICEF/UN0118472/ShresthaPage 32 - 33: © UNICEF/UN0216074Page 34: © UNICEF/UN060147/NooraniPage 39: © UNICEF/UNI133214/Khan
© United Nations Children’s Fund (UNICEF), 2018Permission is required to reproduce any part of this publication. Permission will be freely granted to educational or non-profit organizations.
Please contact:United Nations Children’s Fund3 United Nations Plaza, New York, NY 10017, USA
This publication was developed by the Data and Analytics Section, Division of Data, Research and Policy in UNICEF HQ.

Table of Contents
OVERVIEW 4
6
8
28
32
3437
KEY FACTS AND TRENDS ON URBANIZATION
FINDINGS
IMPLICATIONS, RISKS AND OPPORTUNITIES
CONCLUSION
ANNEX
END NOTES

Advantage or Paradox? | The challenge for children and young people of growing up urban
4
OVERVIEW
Approximately a decade ago, the world officially became a majority urban planet. Along with urbanization a great deal of human progress has come to pass, including great leaps in child survival and development. Aggregate statistics regularly show that on average, compared to their rural peers, urban children have access to better essential services such as health care and education, water and sanitation, energy and better outcomes.
This is in part due to factors associated with the so-called ‘urban advantage.’ On average, urban households earn higher incomes, benefit from improved infrastructure, have improved knowledge and reside in greater proximity to services.
A closer look at the evidence, however, suggests that not all urban children are benefiting equally, and that the urban advantage for children is perhaps an overgeneralization. Unplanned urbanization, which is taking place in many parts of the world, is leading to sprawl and low urban population density, undermining the advantage of proximity that is a key component of the urban advantage. Informality and insecure residential status are leaving many urban households excluded from government-provided services. The quality of urban services for the marginalized and disadvantaged is often poor. Environmental and health hazards, such as air pollution, unprocessed waste and wastewater, pollution and poor air quality can heighten the risk of disease. Urban dwellers living in informal conditions often have a lower resilience to shocks and stressors such as natural hazards (including those exacerbated by climate change) or economic turbulence. These factors often leave the poorest urban children at a considerable disadvantage compared to their more affluent urban peers, and sometimes even compared to their rural counterparts.
This is the ‘urban paradox’: though urban residents on average enjoy better access to services and opportunities, a substantial part of the urban population is being left behind. The presumed urban advantage is not available to all. Poverty, previously predominantly a rural phenomenon, is becoming increasingly urban. As more and more children live in cities and towns, it is becoming increasingly critical to understand the prevalence of the urban paradox and the extent to which it is masked by the narrative of the urban advantage.
To better understand this issue, UNICEF examined the best available international evidence for 10 selected indicators of child well-being drawn from the most recent Multiple Indicator Cluster Surveys (MICS) and Demographic and Health Surveys (DHS) from 77 mostly low- and middle-income countries. These indicators cover environmental health, health care and identity, education and knowledge, and survival and physical growth outcomes. Much of the analysis focuses on comparing rural and urban populations and comparing the top and bottom wealth quintiles for these populations.
The analysis has some limitations. The survey data in this report are given as observed. Since surveys are usually designed to be representative at the national level or larger administrative levels, the analyses can reach the limit of the surveys’ statistical power when comparing quintiles within urban and rural populations. In particular, small gaps between groups may fall within the uncertainty range of the samples surveyed. Furthermore, the definition of an urban area is decided by each country’s statistical office, and definitions therefore vary significantly from country to country. These limitations should be kept in mind when interpreting the results in this report.

5
Overview
The report’s key findings are as follows:
1. The average country exhibits a clear urban advantage on all 10 indicators of child survival and well-being.
2. The size of this aggregate urban advantage varies across indicators. 3. Urban averages can mask large inequities within urban areas. 4. Inequities also exist in rural areas, and there is no evidence that urban
wealth disparities are consistently larger than those in rural areas. 5. Urban wealth disparities diminish with economic development. 6. Much of the urban advantage disappears if we control for wealth. 7. In a number of countries, the poorest and most vulnerable urban
children fare worse than their peers in rural areas. 8. Urban wealth disparity gaps are larger in Africa than in other regions. 9. Urban inequality can take different shapes – from only the wealthiest
moving ahead to only the poorest being left behind. 10. Maternal education, like household wealth, is an important correlate of
child welfare in urban and rural areas alike.
The purpose of this report primarily is to describe urban inequality as observed – within the limits of methodology and available data. In doing so, it raises questions regarding where the observed inequalities come from and what can be done to overcome them. Although the report does not intend to answer those questions, a number of important implications for policies and programmes can be drawn from its results. These include:
• The urban setting has to become an integral part of programming for children.
• Capacities of inclusive urban planning must be further developed on all levels of government – national, regional and local.
• The development of urban systems has to accelerate to keep pace with ongoing rapid urbanization.
• Solutions have to be found for the lack of financial resources needed to improve urban systems and to increase equity within urban areas.
• Better data and better use of existing data are needed to understand the true dimension of urban inequity.
Turning the urban paradox experienced by millions of children and young people into an urban advantage is a key challenge for cities and towns across the world. Now is the time to step up efforts in this area. The 2015 Sustainable Development Goals (SDGs)1 and the New Urban Agenda2 that emerged in 2016 from Habitat III (the United Nations Conference on Housing and Sustainable Urban Development that takes place every 20 years)3 both set ambitious goals for the world’s urban areas. By the time of Habitat IV in 2036, a whole new generation of young people will have grown up in urban areas. The deprivations or advantages they experience in childhood and adolescence will critically influence their prospects in adulthood.
The cost of inaction is high: almost 90 per cent of the world’s children and adolescents live in Africa and Asia, which are urbanizing rapidly. Today, approximately 1 billion people are estimated to live in slums, the worst form of informal settlement, and hundreds of millions of them are children under 18. Based on current trends, those numbers are likely to triple by 2050.4 In the absence of new models targeting the urban poor, inequity in child health may widen and an increasing number of urban children will be shut out of overall progress.5
Scaling up urban programming for children and young people is now a global imperative in all regions.

6
Advantage or Paradox? | The challenge for children and young people of growing up urban
1970
1990
20102018
20302050
37%
43%
52%3.6 b
4.2 b
2.3 b
55% 5.2 b6.7 b60%68%
As of 2018, 55 per cent of the world’s population — 4.2 billion inhabitants — lives in urban areas.
220,000 inhabitants every day
80 million per year
Based on current trends, by 2030, approximately 60 per cent of the global population — 5.2 billion people — will live in urban areas. By 2050, that number will increase to 68 per cent, or 6.7 billion people.
The global urban population is expanding by
(average 2015-2020)
or
Although the share of the rural population has been declining since at least 1950, its size has been increasing as a consequence of the fast-growing total population. The rural population is estimated to peak in 2021 at 3.4 billion people.
KEY FACTS AND TRENDS ON URBANIZATION
●
Africa
Asia
Europe
Latin Amercia & the Caribbean
NorthernAmerica
Oceania
+19 million
+48 million
+2 million
+7 million
+3 million
+0.4 million
82%
81%43%
74%
50%
68%
The highest urbanization levels are found in the Americas, where 8 out of every 10 people live in cities and other urban settlements.
Average annual increase of urban population 2015 - 2020
Share of urban poulation
Africa and Asia have the lowest levels of urbanization. In 2018, half of Asia’s population and 43 per cent of Africa’s live in urban areas. However, both regions are urbanizing rapidly.
Asia is currently adding 48 million people annually to its urban population, more than all other regions combined. Africa’s urban population is the fastest growing, with an average annual rate of urban growth of 3.7 per cent from 2015-2020 – adding around 19 million persons to its urban population every year.
Urban population
Urbanization levels by region
6
RuralUrban

7
Key facts and trends on urbanization
While the share of the urban population living in slums fell from 46.2 per cent in 1990 to 29.7 per cent in 2014, the number of people living in slums has actually risen. The world’s slum population has increased by 25 per cent over that same period, from 690 million in 1990 to 880 million in 2014 – 300 million of those being children (there is no estimation available for the number of children in 1990).8
Asia in particular will experience rapid growth of large megacities. Currently, the world’s three largest cities are in Asia: Tokyo (37.5 million), Delhi (28.5 million) and Shanghai (25.6 million). By 2030, seven out of the 10 largest cities in the world will be in Asia: Delhi, Tokyo, Shanghai, Dhaka, Mumbai, Beijing and Osaka. Many of these cities are at risk of increased flooding due to climate change.
Cities’ areas are growing faster than their population, reflecting decreasing population density and larger spread.7 Much of the growth in the cities is currently taking place in an unplanned fashion, characterized by fragmented urban development, inadequate infrastructure, increased pollution and waste, lack of climate resilience, low compactness and walkability, congestion, and poor quality housing.
The population of megacities is predicted to increase by 290 million (62 per cent), from 460 million in 2015 to 750 million by 2030. Over the same period, the population in cities with less than 300,000 inhabitants will increase by almost the same amount, although this will represent an increase of only 17 per cent (from 1.7 billion to 2 billion).
The urban future lies with developing countries. Approximately two-thirds of the world’s urban population growth in the coming decades will take place in low- and lower-middle-income countries.
Low income
Lower middle income
= 100 millionUpper middle
& High income
Increase urban population 2018 - 2050
Megacities
Development of cities
Slum population
Urban population by size of settlement
● ● ● ● ● ● ●
●
37.5 m 28.5m 25.6m
38.9 m 36.6 m 32.9 m
2018
2030
Tokyo
Tokyo
Delhi
Delhi
Shanghai
Shanghai
Sao Paulo
Sao Paulo
Mexico City
Mexico City
Cairo
Cairo
Mumbai
Mumbai
Beijing
Beijing
Dhaka
Dhaka
Osaka
Osaka
Slum population
Share of urban population living in slum690 million 46.2%
29.7%880 million
1990
2014
300 millionchildren
Half of the world’s urban population lives in cities with half a million or more inhabitants. Megacities, with over 10 million inhabitants, are the fastest growing urban settlements.
460million
750million
1.7 billion 2 billion
2015 2030
+62%
+17%
Mega cities (> 10 million inhabitants)
Cities with < 300,000 inhabitants
Cities in Asia Cities in other regions

8
Advantage or Paradox? | The challenge for children and young people of growing up urban

9
Findings
FINDINGS

Looking at the aggregate level, an urban advantage can clearly be seen across countries. In all 10 indicators of child survival and well-being assessed in this report, the urban child population fares better on average than their rural counterparts (see Figure 1). In urban areas, a higher share of urban households has access to basic drinking water and sanitation services. More births are attended by skilled health personnel and are registered, and fewer children are stunted or die before their fifth birthday. Among young people (between 15 and 24 years of age), knowledge about HIV and AIDS is higher in urban areas than in rural. The only indicator where an urban advantage does not show strongly is the DTP3 immunization indicator. This is likely an encouraging sign of the effectiveness of vaccination programmes in rural areas, though system inefficiencies in urban areas may play a role here as well.
Most countries exhibit a clear urban advantage in terms of children’s survival and well-being.
Indicators and their labels used in this report
If not explicitly marked otherwise, disparity gaps are shown as absolute differences, not relative differences. More details regarding the methodology can be found in the Annex.
Indicator values and gaps presented in this report typically refer to the median of sample countries – either the median of the indicator value or the median of the disparity gap (between urban and rural or between richest and poorest wealth quintile). Results are not weighted by country population.
Water Use of at least basic drinking water services
Sanitation Use of at least basic sanitation services
Birth attendant Coverage of skilled attendant at birth
Birth registration Birth registration prevalence
Immunization DTP3 immunization coverage
Education Primary education completion rate
HIV knowledgewomen
Coverage of comprehensive knowledge about HIV/AIDS among young women aged 15-24 years
HIV knowledgemen
Coverage of comprehensive knowledge about HIV/AIDS among young men aged 15-24 years
StuntingStunting prevalence among children under 5 years of age
Mortality Under-five mortality rate
!
!
10

Figure 1: Levels of selected indicators across countries and areas by urban and rural (2011-2016)
Notes: Chart shows the median of country averages (unweighted by population). Higher values represent better conditions, except for stunting and mortality, where lower values represent better conditions. Mortality has a different scale (deaths per 1,000 live births) and levels therefore cannot be directly compared with the other indicators.
0%
20%
40%
60%
80%
100%
0%
100%
20%
40%
60%
80%
0
50
100
150
deat
hs p
er 1
,000
live
birt
hs
50% of countries
median75 percentile
25 percentile
Urban Rural Urban Rural Urban Rural Urban Rural Urban Rural
Urban Rural Urban Rural Urban Rural Urban Rural Urban Rural
Education
Immunization
Stunting Mortality
Water Sanitation Birth registrationBirth attendantWater
Education!
HIV knowledge menHIV knowledge women!
11
Findings

12
Advantage or Paradox? | The challenge for children and young people of growing up urban
Although an urban advantage can be seen for all indicators, the urban advantage is not identical for all indicators (Figure 2) and the urban population does not fare better in all countries (Figure 3).
The largest differences are in use of basic drinking water, with coverage in urban areas 22 percentage points higher than in rural areas (based on the median values presented in Figure 2). This means that, in half the countries with data, the percent of the population with access to basic drinking water services is at least 22 percentage points higher than that of the rural population. Other indicators showing a comparatively large ‘urban advantage’ include access to basic sanitation (17 percentage points higher in urban areas), the primary education completion rate (13 points higher), the share of births attended by skilled personnel (12 points higher) and the percentage of young people with comprehensive knowledge about HIV/AIDS (12 points higher for men and 11 points higher for women). Only a small urban advantage can be
found for birth registration coverage and there is hardly any difference in DTP3 immunization coverage rates and urban and rural areas. There is no indicator that shows on average a ‘rural advantage.’
Both outcome indicators show a strong urban advantage. Children under five in rural areas have a 37 per cent higher prevalence of being stunted, with a median difference of 8 percentage points between urban and rural areas. They also have 46 per cent higher risk of dying, with a median difference of 16 deaths per 1,000 live births.
This urban advantage is likely related by a number of factors that are only accessible to some children. These include higher average incomes, better infrastructure, greater proximity to services, and the existence of private services such as private clinics or private schools.
The extent of the ‘urban advantage’ varies across indicators.

Note: ‘Urban advantage’ is defined as a positive urban-rural difference of the coverage or prevalence, except for stunting and under five-mortality (where higher values show worse conditions) for which the advantage is defined based on the rural-urban difference. In both cases, negative values indicate an ‘urban disadvantage’.
13
Findings
ImmunizationWater Sanitation Birth registration
Birth attendant
MortalityEducationHIV
knowledge women
StuntingHIV
knowledgemen
! !
50% of countries
median75 percentile
25 percentile
20 20
0
40
0
40
Urb
an a
dvan
tage
(per
cent
age
poin
ts)
Urb
an a
dvan
tage
(d
eath
s pe
r 1,
000
live
birt
hs)
Figure 2 : Magnitude of ‘urban advantage’ for selected indicators across countries and areas (2011-2016)
14
Advantage or Paradox? | The challenge for children and young people of growing up urban
Note: ‘Urban advantage’ is defined as a positive urban-rural difference of the coverage or prevalence, except for stunting and under five-mortality (where higher values show worse conditions) for which the advantage is defined based on the rural-urban difference. In both cases, negative values indicate an ‘urban disadvantage’.
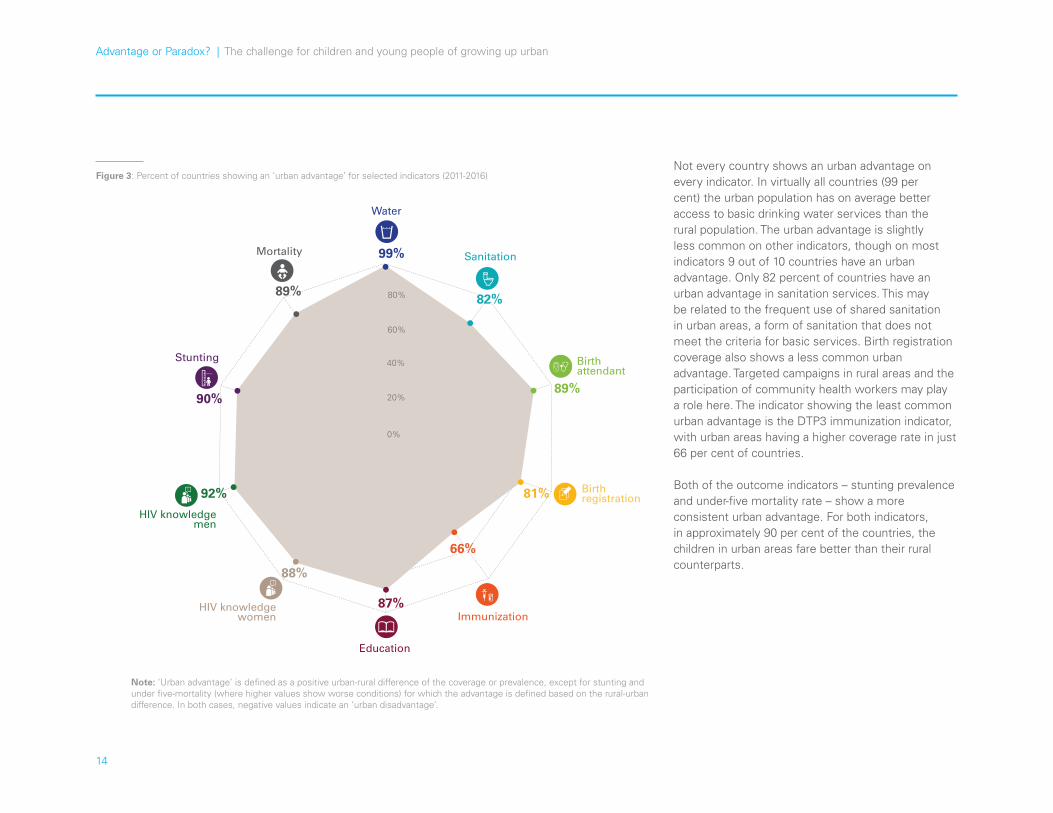
Not every country shows an urban advantage on every indicator. In virtually all countries (99 per cent) the urban population has on average better access to basic drinking water services than the rural population. The urban advantage is slightly less common on other indicators, though on most indicators 9 out of 10 countries have an urban advantage. Only 82 percent of countries have an urban advantage in sanitation services. This may be related to the frequent use of shared sanitation in urban areas, a form of sanitation that does not meet the criteria for basic services. Birth registration coverage also shows a less common urban advantage. Targeted campaigns in rural areas and the participation of community health workers may play a role here. The indicator showing the least common urban advantage is the DTP3 immunization indicator, with urban areas having a higher coverage rate in just 66 per cent of countries.
Both of the outcome indicators – stunting prevalence and under-five mortality rate – show a more consistent urban advantage. For both indicators, in approximately 90 per cent of the countries, the children in urban areas fare better than their rural counterparts.
20%
0%
40%
60%
80%
Immunization
66%
Birth registration
Education
89%
Birthattendant
99%
Water
82%
Sanitation
81%
87%
88%!
HIV knowledgewomen
!
HIV knowledgemen
92%!
Stunting
90%
Mortality
89%
Figure 3: Percent of countries showing an ‘urban advantage’ for selected indicators (2011-2016)

Note: The urban ‘wealth advantage’ is defined as a positive difference in the coverage or prevalence between the richest urban quintile and the poorest urban quintile, except for stunting and under five-mortality (where higher values show worse conditions) for which the advantage is defined based on the difference between poorest and richest quintile. In both cases, negative values indicate a ‘wealth disadvantage’.
Figure 4: ‘Wealth advantage’ for selected indicators in the urban population across countries and areas (2011-2016)
Not all children fare equally in urban areas; some are more vulnerable than others. Many advantages are generally strongly associated with household wealth.
Among all indicators, the wealthiest quintile of the urban population has better access and outcomes than the poorest quintile (see Figure 4). The wealth advantage is largest for sanitation: in half of the countries, the gap between the richest and the poorest urban quintiles is at least
44 percentage points. In one-quarter of all countries, it is 60 percentage points or higher. There is also a large wealth advantage in access to at least basic drinking water services. The gap between the richest and poorest urban quintile is at least 18 percentage points in half of the countries assessed, and in one-quarter of the countries it is 35 points or higher. This may be due in part to the fact that access to water and sanitation facilities helps determine a household’s value on the wealth index that we use; see the Annex for further discussion of this matter.
15
Findings
Urban averages can mask large inequities within urban areas.
0
10
20
30
40
50
60
0
10
20
30
40
50
60
Adv
anta
ge r
iche
st q
uint
ile o
ver
poor
est
quin
tile
(per
cent
age
poin
ts)
Adv
anta
ge r
iche
st q
uint
ile o
ver
poor
est
quin
tile
(dea
ths
per
1,00
0 liv
e bi
rths
)
50% of countries
median75 percentile
25 percentile
ImmunizationWater Sanitation Birth registration
Birthattendant
MortalityEducationHIV
knowledgewomen
StuntingHIV knowledge
men
! !

16
Advantage or Paradox? | The challenge for children and young people of growing up urban
Note: The ‘relative wealth disparity’ is calculated as the ratio of richest quintile to poorest quintile – except for stunting and under-five (where higher values show worse conditions) for which the ratio between poorest to richest quintile is used. A ratio of one indicates complete equality between poorest and wealthiest; a ratio higher than one indicates better conditions for the wealthiest quintile; a ratio of lower than one indicates better conditions for the poorest quintile. To account for uncertainties around the estimated indicator values, a range of plus/minus 10 per cent around the ‘neutral’ ratio is regarded as showing no inequality (i.e. 0.9 to 1.1).
Urban inequity can be dramatic – in one out of five countries, stunting prevalence among the poorest urban is at least four times higher compared to the wealthiest
Inequalities between the richest and the poorest can be huge – both in urban areas and in rural areas. In half of the countries analysed, children in the poorest quintile are at least twice as likely to die before their fifth birthday as their richest urban peers. The relative disparity is even more pronounced for stunting, where prevalence in the poorest urban quintile is at least twice as high as for peers in the richest quintile in approximately 8 out of 10 of the countries analysed, and at least four times higher in 2 out of 10 countries. For both stunting and under-five mortality, relative inequality is higher in urban areas than in rural areas – a pattern opposite to that of the other indicators.
The extent of these relative wealth disparities illustrates why it is difficult to generalize about human well-being in urban areas. Furthermore, inequality in child well-being is not confined just to childhood outcomes – it is already manifest in access to essential services. Sanitation shows one of the largest relative disparities: in half of the countries analysed, children of households in the poorest urban quintile have basic sanitation services that are at least two times lower than children from the richest urban quintile. Coverage is four or more times lower in almost half of the countries analysed in rural areas.
This examination of relative wealth disparities does not account for the fact that the absolute level of each indicator is higher in some countries than others, so the results should be interpreted with care. The relative wealth disparity metric is instead intended to shed light on the inequalities in the conditions facing the richest and poorest in urban and rural areas of the same country.
Share of countries and areas with relative wealth disparity gaps (ratio richest to poorest quintiles) by urban and rural (2011-2016)
BOX
HIV knowledgewomen
HIV knowledge men
Education! !
Sanitation Stunting Water Birth registration
Birthattendant Immunization Mortality
4 or more< 0.9 ≥ 3 − 4≥ 2 − 3≥ 1.1 − 2.0≥ 0.9 −1.1
Ratio of poorest to richest
0%
25%
50%
75%
100%
Pro
port
ion
of c
ount
ries
(%)
RuralUrban RuralUrban RuralUrban RuralUrban RuralUrban RuralUrban RuralUrban RuralUrban RuralUrban RuralUrban
Poorest better
Same Poorest worse than richest

Urban wealth disparities are not consistently larger than rural wealth disparities.
Note: See Annex for a reference table with country codes and country and area names.
17
Findings
Comparing the wealth disparity gaps in urban and rural areas can generate insights into living conditions between urban and rural areas as well as differences in access to and quality of crucial health- or education-related services.
Larger wealth inequity might be expected in urban areas, mirroring the higher income inequality which is regularly observed in urban settings. Overall, though, there is no simple relationship between residence and the size of the wealth disparity gap. In approximately half of the indicators, the disparity gap is larger in urban areas than in rural, while the other indicators show the opposite pattern. Figure 5 shows under-five mortality, where the majority of countries show larger urban wealth disparities than rural, and DTP3 immunization, where the opposite holds true.
Figure 5: Difference between intra-urban and intra-rural wealth disparity gap of under-five mortality rate and DTP3 immunization coverage, by country and country’s income level group (2011-2016)
URBAN disparity larger than rural disparity
RURAL disparity larger than urban disparity
Low incomeMiddle income
−80
−60
−40
−20
0
20
40
60
80
TG
OM
WI
TC
DC
OD
BE
NZ
WE
NP
LR
WA
GN
BE
TH
SLE
AFG
CO
MLB
RS
EN
GM
BN
ER
TZ
AH
TI
MLI
GIN
AG
OY
EM
ST
PM
EX
NA
MH
ND
MD
AG
TM
TH
AP
AN
KA
ZJO
RP
SE
ZM
BG
HA
TU
RM
NG
KG
ZIN
DV
NM
TK
ME
GY
TU
NC
OG
PH
LD
ZA
CIV
PR
YS
LVT
JKK
HM
KE
NLA
OB
GD
NG
AC
MR
IDN
DO
MG
AB
SD
NS
RB
UK
RP
AK
Urb
an −
rur
al d
iffer
ence
(per
cent
age
poin
ts)
Immunization
GN
BN
ER
CO
DN
PL
ET
HT
GO
HT
IB
EN
TZ
AS
EN
GIN
MLI
SLE
ZW
ELB
RR
WA
AFG
TC
DM
WI
AG
OC
OG
NA
MC
IVS
DN
PAK
BG
DJO
RG
AB
GT
MP
HL
PR
YH
ND
TU
RP
ER
TJK
CM
RD
OM
NG
AC
OL
YE
MK
EN
ZM
BM
NG
EG
YG
HA
SLV
LAO
VN
MK
HM
IDN
URBAN disparity larger than rural disparity
RURAL disparity larger than urban disparity
−80
−60
−40
−20
0
20
40
60
80
Low incomeMiddle income
Urb
an −
rur
al d
iffer
ence
(dea
ths
per
1,00
0 liv
e bi
rths
)
Mortality

18
Advantage or Paradox? | The challenge for children and young people of growing up urban
Urban wealth disparities diminish with economic development.
−30
−20
−10
0
10
20
30
40
50
60
70
80
90
Low incomeLower middle income
Upper middle income
High Income Low income
Lower middle income
Upper middle income
High Income Low income
Lower middle income
Upper middle income
High Income Low income
Lower middle income
Upper middle income
High Income Low income
Lower middle income
Upper middle income
High Income
ImmunizationWater Sanitation Birth registrationBirth attendant
Education HIV knowledge women HIV knowledge men Stunting Mortality! !
−30
−20
−10
0
10
20
30
40
50
60
70
80
90
GNI per capita, Atlas method (current US$)
Adv
anta
ge o
f th
e ric
hest
qui
ntile
(per
cent
age
poin
ts)
Adv
anta
ge o
f th
e ric
hest
qui
ntile
(dea
ths
per
1,00
0 liv
e bi
rtsh
)
−50
−40
−30
−20
−10
0
10
20
30
40
50
60
70
80
90
100
1005 3955 12235 1005 3955 12235 1005 3955 12235 1005 3955 12235 1005 3955 122351005 3955 12235
1005 3955 12235 1005 3955 12235 1005 3955 12235 1005 3955 12235 1005 3955 122351005 3955 12235
Figure 6: Urban wealth disparity gaps by indicator and country’s gross national income (GNI) per capita across countries and areas (2011-2016)

Low income Lower middleincome
Upper middleincome
High Income
0%
20%
40%
60%
80%
100%
250 500 25001000 5000 10000 20000
GNI per capita, Atlas method (current US$)
Poorest
Richest
Urban
RichestRural
Poorest
19
Findings
A country’s income level has a strong influence on the size of wealth disparity gaps in urban areas on most indicators (see Figure 6). In low-income countries, the absolute gaps between the richest and poorest quintiles are usually higher than in middle-income countries. With increasing national income9, the basic but important services analysed here also become accessible for the relatively poorer part of the population. However, other disparities such as access to decent jobs and good quality educations presumably remain, and could conceivably even get worse.
For some of the indicators analysed, however, the wealth disparity gap in urban areas remains large or even slightly widens for countries in the lower-middle income range, before finally decreasing significantly at higher income levels. Exceptions to this are the immunization indicator, which shows a flat trend in the lower income range followed by an only slight decrease from the middle income threshold; and the indicators on comprehensive knowledge about HIV and AIDS, where the trend is flat over the whole income level range for men and women. This suggests that other factors might be more important in influencing the size of the gap for this indicator.
In rural areas, the narrowing of the wealth disparity gap between richest and poorest is less marked as incomes increase. For example, in use of basic drinking water services (see Figure 7) the gap between the richest and poorest urban quintile is approximately 30 percentage points in low-income countries but narrows to approximately four percentage points for upper-middle countries. In contrast, in rural areas the gap of approximately 41 percentage points for low-income countries only halves to approximately 22 percentage points for upper-middle income countries.
Figure 7: Use of basic drinking water services for urban and rural population by wealth quintile (poorest and richest only) and by country’s gross national income (GNI) per capita across countries and areas (2011-2016).
Note: The lines show LOESS trendlines for the respective residence-wealth-group data across countries and areas. The shaded area shows the ‘gap’ between poorest and richest among urban and rural population, respectively.
Water
20
Advantage or Paradox? | The challenge for children and young people of growing up urban
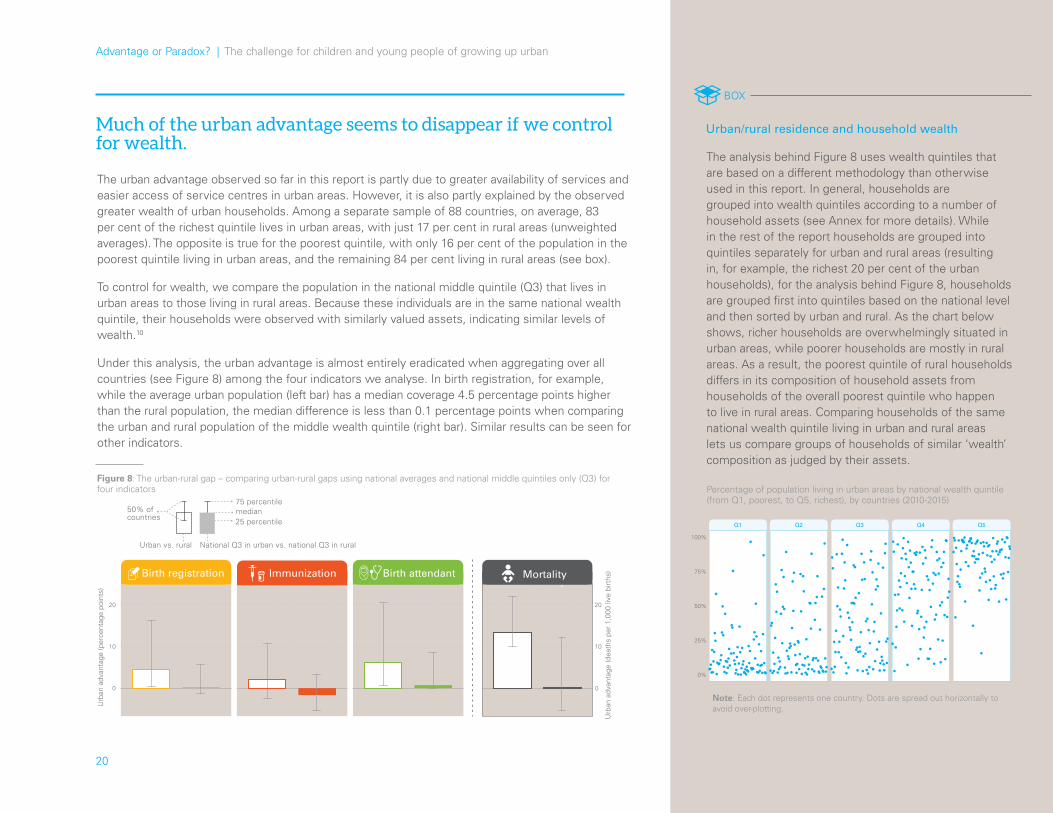
The urban advantage observed so far in this report is partly due to greater availability of services and easier access of service centres in urban areas. However, it is also partly explained by the observed greater wealth of urban households. Among a separate sample of 88 countries, on average, 83 per cent of the richest quintile lives in urban areas, with just 17 per cent in rural areas (unweighted averages). The opposite is true for the poorest quintile, with only 16 per cent of the population in the poorest quintile living in urban areas, and the remaining 84 per cent living in rural areas (see box).
To control for wealth, we compare the population in the national middle quintile (Q3) that lives in urban areas to those living in rural areas. Because these individuals are in the same national wealth quintile, their households were observed with similarly valued assets, indicating similar levels of wealth.10
Under this analysis, the urban advantage is almost entirely eradicated when aggregating over all countries (see Figure 8) among the four indicators we analyse. In birth registration, for example, while the average urban population (left bar) has a median coverage 4.5 percentage points higher than the rural population, the median difference is less than 0.1 percentage points when comparing the urban and rural population of the middle wealth quintile (right bar). Similar results can be seen for other indicators.
The analysis behind Figure 8 uses wealth quintiles that are based on a different methodology than otherwise used in this report. In general, households are grouped into wealth quintiles according to a number of household assets (see Annex for more details). While in the rest of the report households are grouped into quintiles separately for urban and rural areas (resulting in, for example, the richest 20 per cent of the urban households), for the analysis behind Figure 8, households are grouped first into quintiles based on the national level and then sorted by urban and rural. As the chart below shows, richer households are overwhelmingly situated in urban areas, while poorer households are mostly in rural areas. As a result, the poorest quintile of rural households differs in its composition of household assets from households of the overall poorest quintile who happen to live in rural areas. Comparing households of the same national wealth quintile living in urban and rural areas lets us compare groups of households of similar ‘wealth’ composition as judged by their assets.
Percentage of population living in urban areas by national wealth quintile (from Q1, poorest, to Q5, richest), by countries (2010-2015)
Figure 8: The urban-rural gap – comparing urban-rural gaps using national averages and national middle quintiles only (Q3) for four indicators
Mortality
0
10
20
0
10
20
Urb
an a
dvan
tage
(per
cent
age
poin
ts)
Urb
an a
dvan
tage
(dea
ths
per
1,00
0 liv
e bi
rths
)
Urban vs. rural National Q3 in urban vs. national Q3 in rural
50% of countries
median75 percentile
25 percentile
Birth registration MortalityBirth attendantImmunization
Urban/rural residence and household wealth
Q1 Q2 Q3 Q4 Q5
0%
25%
50%
75%
100%
●
●
●●●
●
●
●
●
●
●
●●
●
●
● ●
●
●
●
●
●
●
●
●
●
●●●
●
●
●
●
●
●●
●
●
●●
●
●
●
●
●●●
●
● ●
●
●
● ●●●
●
●
●
●
●
●
●
●
●
●
●
●
●
●
●
●●
●
●
●
●
●
●
●
●
●
●●●
●
●●
●
●
●
●
●
●
●
●●
●
●
●
●
●
●
●
●
●
●
●
●
●
●
●
●
●●
●
●
●
●
●
●
●
●
●
●
●
●●
●
●
●
●●
●
●
●
●
●
●●
●
●
●
●
●
●●
●
●
●
●
●
●
●
●
●
●
●
●
●●
●
●
●
●●
●
●
●
●
● ●
●
●
●
●
●
●
●
●
●
●
●
●
●
●
●
●
●
●
●
●
●
●
●
●
●
●
●
●
●
●
●
●
●
●
●●
●
●
●
●
●●●●
●
●
●●
●
●
●
●
●
●●
●
●
●
●
●
●
●
●
●
●
●
●
●
●●
●
●
●
●
●
●
●
●
●
●
●
●
●
●
●
●
●
●
●
●
●
●
●
●●
●●
●
●
●
●
●
●
●
●
●
●
●●
●
●
●
●
●
●
●
●
●
●
●
●●
●
●
●
●●
●●
●
●
●
●
●
●
●
●
●
●
●
●
●
●
●
●
●
●
●
●
●
●
●●
●
●
●
●
●
●
●
●
●
●
●
●
●
●
●
●●
●
●
●
●
●
●
●●
●
●
●
●
●
●
●
●
●
●
●
●
●
●
●
●●
●
●
●
●
●
●●●
●
●●
●
●
●
●
●
●
●●
●
●
●●
●●
●
●
●●
●
●
●
●
●
●
●
●
●
●
●
●
●
●
●●●
●
●
●
●
●
●
●●
●
●
●●
●
●●
●
●
●●
BOX
Note: Each dot represents one country. Dots are spread out horizontally to avoid over-plotting.
Much of the urban advantage seems to disappear if we control for wealth.

21
Findings
Urban vs. ruralNational middle quintile in urban vs. national middle quintile in rural
Urban advantage
0
Urban disadvantage
Birth registration
ImmunizationBirth attendant
CongoHaiti Mozambique
0
50
100
MozambiqueRwanda
0
20
40
60
80
100
ComorosMexico Panama
0
20
40
60
80
100
CameroonPakistan Punjab Eswatini
0
20
40
60
80
100
Q3Urban
Q3Rural
Q3Urban
Q3Rural
Q3Urban
Q3Rural
Q3Urban
Q3Rural
Q3Urban
Q3Rural
Q3Urban
Q3Rural
Q3Urban
Q3Rural
Q3Urban
Q3Rural
Q3Urban
Q3Rural
Q3Urban
Q3Rural
Q3Urban
Q3Rural
Q3Urban
Q3Rural
Countries with largest urban disadvantages amonghousehoulds in national middle quintile
Countries with largest urban disadvantages amonghousehoulds in national middle quintile
Countries with largest urban disadvantages amonghousehoulds in national middle quintile
Countries with largest urban disadvantagesamong househoulds in national middle quintile
Pakistan Punjab
Perc
enta
ge p
oint
sPe
rcen
tage
poi
nts
Perc
enta
ge p
oint
sD
eath
s pe
r 1,
000
live
birt
hs
Perc
enta
ge p
oint
s
Dea
ths
per
1,00
0 liv
e bi
rths
Perc
enta
ge p
oint
s
Perc
enta
ge p
oint
s
●
●
●
● ●
●
●
●
●
●
●
●
●●
●
●
●
●
●
●
●
●
●
●
●
●
●
●
●
●
●
●
●
●
●
●
●
●
●
●
●
●
●
●
●
●
●
●
●
●●
● ● ●● ●
●●
● ●●
●
●
●
BFA
BGD
SLE
COM
GHA
NGA
AFG
COD
AGO
PER
CMR
EGY
SEN
CIV
GTM
BEN
LBRIDN
YEM
PAK
PHL
GM
B
KEN
TZA
JOR
NA
M
DO
M
HN
D
ZMB
CO
G
MO
Z
HTI
0
0
-20
20
20
-20
40
0
20
40
0
-40
40
Mortality
●
●
●
●
●
●
●
●
●
●
●●
●
●
●
●
●
●
●
●
●
●
●
●
●
●
●
●
●
●
●●
●
●●
●●
●
●●
●
●
●
●
●●
● ●
●
●
●
●
●
●●
●
●
●
●
●
●● ●
●
●
● ●
●
●
●
●
●
●
●
●●
● ●
●
●
REN CA
FU
GA
CIV
AFG
SD
NY
EM
MM
RM
WI
PAK
TZA
GIN
SSD
PBA
CM
RB
DI
NG
AKS
VSE
NM
RTB
FAG
HA
LBR
ZMB
TCD
SLE
LAO
HN
DG
NB
SUR
MKD
MDA
PAN
MNG
EGY
BGDST
PKG
ZKAZ
IRQ
BTN
BRB
CRI
SRB
TKM
UKR
THA
DZA
NAM
PILCOG
IDN
MNE
JOR
TUN
PSE
LSO
SLV
ARM
COM
BLZ
MEX
GUY
VNM
MLI
DOM
BENLCAKHMSWZ
TJKHTINPLAGOGABCODGMBPPUMOZRWA
●
●
●
●
●
●
●●
●●
●
●
●●
●
●
●●
●●
●
●●
●
●
●
●
●●
●
●●
●●
●●
●●●●●●●●●●●●●
●●●
●●
●
●
●
●
●
●
●
●
●
●
●
●
●
●
●
●
●●●
●●
●●
●●
●
SRBCIVIRQPBAMOZAFGCAF
PERBIH
ZMBNGA
COGVNM
SLETZA
SLVBEN
LSOCMRYEM
SSDJOR
EGYMNGIDNUKRPHLTJKBGDPSEBLZPAKKGZBFASENGHAHTISTPCRIGNBTH
AKAZSDNCO
DGTMD
ZAPPUTUN
HN
D
MD
A
AGO
LBR
MR
T
SUR
LAO
MW
I
NA
M
DO
M
GM
B
JAM
TGO
CO
M
PANXE
M
●
●
●
●
●
●
●
●●
●
●
●
●
●
●
●
●
●
●
●
●
●
●
●
●
●
●
●
●
●
●
●
●
●
●
●
●
●
●
●
●
●
●
●
●
●
●
●●
●
●
●
●
●
●
●
●
●
●
●
●
●
●
●
●
●
●
●
●
●
●
●
●●
●
●
●
●
●
●
●
●
●
●
●
●●
●
●
●●
●●
●●●
●●
●●
●●●
●●●●
●●●
●●●●●
●●
●●●
●
●
●●
●
●
●
●
PP
U
SW
Z
CM
R
UK
R
BLZCR
I
SUR
BLRBG
D
PANBIHJA
MKSVM
DAMKDSR
BTHATU
NDOMPS
EKAZVN
MSTPM
EXSLVM
NGKGZGUY
NGADZA
PILSLE
SSDMWI
MRTIRQ
PBASDN
AFG
NPL
GHA
GNB
LAO
TGO
CAF
BTN
TCD
COD
●
●
●
●
●
●
●
●
●
●
●
●
●●
●
●
●
●
●
●●
●
●
●
●
●●
●
●
●
●
●●
●
●
●
●
●
●
●
●●
●
●
●
●
●
●
●
●
●●●●●●●●●●
●●
●●
●●
●●
●●
●●
●●●
●
●
●●
●●
●●
●●
●
●●
●
●
●
●
●
●
●
●
Figure 9: The urban-rural gap – comparing urban-rural gaps using national averages (grey bars) and middle wealth quintiles only (Q3, blue bars) for four indicators, by country.
Analysis at the country level provides a more varied picture (see Figure 9) with some cases where the urban advantage remains and others where it transforms into a disadvantage.
How to read the chart: Each quarter shows the results for one specific indicator (top left quarter for under five mortality, top right for birth registrations, bottom left for skilled attendant at birth, and bottom right for immunization). Each line represents the result for a specific country. The dotted lines show the difference between urban population and rural population for a specific indicator. The solid lines show the difference between the population of the national middle-quintile by wealth living in urban areas and the population of the national middle-quintile by wealth living in rural areas. Lines in the area with light blue background color indicate an urban advantage and those in the white area suggest an urban disadvantage. See Annex for a reference table with country codes and country and area names.

22
Advantage or Paradox? | The challenge for children and young people of growing up urban
WaterSanitation
Birth attendantBirth registration
Immunization
StuntingMortality
EducationHIV knowledge women
HIV knowledge men
16%59%14%42%50%
44%38%
39%37%37%
Access to at least basic sanitation services
Intra-urban disparities can be so large that many of the most disadvantaged children in urban areas fare worse than children in rural areas (see Figure 10, left panel). For example, in approximately 60 per cent of countries analysed, the percent of children in the poorest urban quintile with access to basic sanitation is lower than the percent of all rural children with access. The same is true for DTP3 immunization coverage in approximately half the countries. For birth registration coverage and lower primary education completion rates, this is the case in approximately 40 per cent of countries. Similarly, in 44 per cent of the countries the poorest urban children have higher stunting prevalence than children in rural areas and their under-five mortality rate is 38 per cent higher.
Even when comparing with the poorest quintile in rural areas, children in the poorest urban quintile fare worse in quite a number of countries (see Figure 10, right panel). In almost 30 per cent of the countries analysed, the poorest urban children have lower DTP3 immunization coverage, and in 20 per cent birth registration coverage is lower compared to children in the poorest rural quintile.
For under-five mortality rate this share of countries is 24 per cent – this amounts to roughly 4.3 million children among the urban poorest who face a higher risk of dying before their fifth birthday than their rural peers.11 Similarly, the 18 per cent of countries where urban poorest children are less likely to complete their primary education than the poorest children in rural areas translates to around 13.4 million children.12 In both cases, these numbers refer only to the set of countries studied in this report – the actual global number will be much higher.
Though conventional wisdom holds that the rural poor are worse off than the urban poor, our analysis demonstrates that this is not always true.
In a number of countries, the most marginalized urban children fare worse than their peers in rural areas.
Proportion of countries where urban poorest quintile
worse than rural total population
Figure 10: Share of countries in which the poorest urban quintile fares worse than the rural population on average (left) or worse than the poorest rural quintile (right) (2011-2016)
WaterSanitation
Birth attendantBirth registration
Immunization
StuntingMortality
EducationHIV knowledge women
HIV knowledge men
3%15%8%
20%28%
14%24%
18%10%16%
Proportion of countries where urban poorest quintile
worse than rural poorest population

23
Findings

24
Advantage or Paradox? | The challenge for children and young people of growing up urban
Urban wealth disparity gaps are larger in Africa than in other regions.
Inequity within urban regions is larger in Africa than in the other regions. African countries make up approximately half of the countries in this study. They also account for 80 per cent of the low-income countries, which, as shown in Figure 6, tend to show larger inequity. But even when comparing countries within the same income group, countries in Africa show larger urban wealth disparities than countries in Asia, Latin America and the Caribbean (see Figure 11a).
For both low-income countries and middle-income countries, the median urban wealth disparity gap for African countries is approximately 23 percentage points across all indicators. By comparison, the gap in low-income Asian countries is about 17 percent and just half of that, about 9 percent, in middle-income Asian countries. The gap in middle-income Latin American and Caribbean countries is similarly low.
Low income countries Middle income countries
0
20
40
Adv
anta
ge o
f ric
hest
ove
r po
ores
t qu
intil
e (p
erce
ntag
e po
ints
)
Africa Asia Africa Asia Latin America and the Caribbean
Low income countries Middle income countries
0
20
40
Africa Asia Africa Asia Latin America and the Caribbean
50% of countries
median75 percentile
25 percentile
a) Urban b) Rural
Figure 11: Magnitude of the wealth disparity gap (advantage richest over poorest quintile) in urban areas (left) and rural areas (right) averaged over eight indicators and across countries and areas by region and national income level (2011-2016)
Note: Indicators include: water, sanitation, birth attendant, birth registration, immunization, education, HIV knowledge women, HIV knowledge men. Only four countries are included in the analysis of low-income Asian countries, while the single low-income country in this sample from Latin America and the Caribbean was excluded.

25
Findings
The drastically larger intra-urban wealth disparities in low-income African countries are mostly driven by the water and sanitation indicators, with additional disparities observed in skilled birth attendant and under-five mortality. This is true to a lesser extent in both low- and middle-income countries. Although the results related to low-income countries are based on only four countries in Asia and therefore should be interpreted with caution, the analysis of middle-income countries (with a more equal regional balance) shows a similar pattern: The largest regional differences can be observed for the same indicators as for low-income countries and in addition for education (primary education completion rate) and the HIV/AIDS knowledge indicator. Very few differences between the regions can be seen for immunization and stunting.
Regional differences in intra-rural inequity are less clearly defined (Figure 11b). Over all indicators, the median intra-rural wealth gap in low-income countries is 17 percentage points in Africa and 20 percentage points in Asia. In middle-income countries, it is 21 points in Africa, 13 in Asia, and 24 in Latin America and the Caribbean. While inequities are unusually high in urban African areas, the same is not true of rural African areas.
This suggests that there are specific conditions of Africa’s urbanization experience that have made the benefits of cities less accessible to the poor. Compared to other regions in the world, Africa is urbanizing at a lower level of income (see box below). The World Bank identified three characteristics of African cities that constrain economic development and growth: growing density of population in poorer neighbourhoods and dwellings without investments in infrastructure and commercial services; disconnectedness due to lack of transport and other infrastructure that is limiting workers’ job opportunities; and high costs for households and firms.
Africa is urbanizing at a lower income level than any other region.
BOX
Urbanization in Africa is occurring at a lower level of income than in other regions. In addition, in Sub-Saharan Africa, urbanization has not coincided with economic growth. Between 1970 and 2000 the urbanization level in Sub-Saharan Africa increased from approximately 20 per cent to 30 per cent, while GDP per capita decreased over the same period.13 While, on average, an African country reaches
an urbanization rate of 50 per cent at an average income level of US$1,600 per capita (GNI, 2005 prices), an Asian country reaches the same threshold at US$3,700 per capita. Urbanization without shared economic growth bears the danger of creating a whole class of urban poor deprived of necessary services and security living in slums at the margins of urban centres.14
Urbanization level by gross national income (GNI) per capita for countries in Africa and Asia (2016)
●●
●
●
●
●
●
●
●
● ●
●●
●
●
●
●
●
●
●
●●
●●
●●●
●
●
●
●
●
●
●
●
●
●
●
●
●
●
●
●
●
●
●
●
●
●
100
1000
10000
80000
0 20 40 60 80 100Share of population living in urban areas
GN
I per
cap
ita, A
tlas
met
hod
(cur
rent
US
$)
Africa
Asia
●

Sanitation
Bangladesh Pakistan Lao PDR
0
20
40
60
80
100
120
Dea
ths
per
1,00
0 liv
e bi
rths
Q1 Q2 Q3 Q4 Q5Q1 Q2 Q3 Q4 Q5 Q1 Q2 Q3 Q4 Q5
26
Advantage or Paradox? | The challenge for children and young people of growing up urban
Figure 12b: Access to at least basic sanitation services by wealth quintile (from poorest, Q1, to richest, Q5) in urban areas for selected countries (percentage)
Figure 12a: Under-five mortality rate by wealth quintile (from poorest, Q1, to richest, Q5) in urban areas for selected countries (deaths per 1,000 live births)
The relationship between household wealth and coverage of services or the well-being of children can take several different forms. The following three stylized patterns are observed for the under-five mortality rate (see Figure 12a, from left to right) but can be observed in all other indicators as well (see Figure 12b for the example of access to at least basic sanitation services):
1. Advantage for the richest only: The under-five mortality rate is similarly high for all wealth quintiles except for the richest. 2. Advantage improves with wealth: The higher the household wealth, the lower the under-five mortality rate. 3. Disadvantage for the poorest only: The under-five mortality rate is low for all quintiles except for the poorest.
Variations and combinations of these patterns are also possible. In Lao People’s Democratic Republic, for example, a survival disadvantage for the poorest is observed among the urban children only, while in rural areas survival improves gradually with wealth.
Although this report focuses on a comparison of the poorest and richest quintiles of the wealth distribution, an understanding of the entire distribution is important to inform policy. Different distributional patterns suggest different underlying causes behind inequities facing children. They also imply different policy responses such as whether universal or targeted interventions have most merit.
Urban inequality can take different shapes – from the wealthiest moving ahead to the poorest being the only ones left behind.
Kenya (2014)
Q1 Q2 Q3 Q4 Q5 Q1 Q2 Q3 Q4 Q5 Q1 Q2 Q3 Q4 Q50%
25%
50%
75%
100%Angola (2015) Paraguay (2016)
Under-five mortality

Birth attendant Birth attendant
27
Findings
Low income Lower middleincome
Upper middleincome
High Income
Poorest
Richest
Urban
RichestRural
Poorest
0%
20%
40%
60%
80%
100%
250 500 25001000 5000 10000 20000
GNI per capita, Atlas method (current US$)
The educational attainment of the mother – or, depending on the indicator, the household head – is another important factor influencing inequality both in urban and rural areas. Children in households where the mother or the household head has more education fare better than children from households with less education. This is true for most countries and for most indicators.
Household wealth, educational attainment and residence are correlated. Both wealthier households and those with a high-ly educated mother are more likely to be located in urban areas. Figure 13 compares urban and rural disparity by household wealth and by maternal education for the indicator of skilled birth attendance. The disparity patterns look very similar: women with secondary or higher education have shares of birth attended by skilled personnel at levels comparable to women from the highest wealth quintile. The same pattern exists between women with no education and women from the poorest quintile.
A similar pattern can be observed for most other indicators, with the exception of the sanitation indicator, where the rela-tionship is less distinct and households in the wealthiest urban quintile exhibit a substantially higher coverage than house-holds in the highest education category. This may be in part a result of the use of sanitation measures in the construction of the wealth index, as discussed further in the Annex.
Low income Lower middleincome
Upper middleincome
High Income
GNI per capita, Atlas method (current US$)
0%
20%
40%
60%
80%
100%
250 500 25001000 5000 10000 20000
None
PrimarySecondary +
Secondary +
Urban
PrimaryRural
None
Maternal education, like household wealth, is an important correlate of child well-being in both urban and rural areas.
Figure 13: Comparing disparity by wealth and disparity by mother’s education for the indicator ‘Coverage of skilled attendant at birth’ by gross national income (GNI) per capita across countries and areas (2011-2016).
a) Disparity by wealth quintile b) Disparity by mother’s education
Almost no urban wealth disparity gaps by gender
In addition to wealth and education, the gender of the child is another potential disparity dimension. Overall, gender gaps were virtually non-existent or very small in the indicators analysed. (Data disaggregated by gender of individual household members is not available for water and sanitation indicators and has only very limited meaning for skilled birth attendant since the sex of the child is in many cases unknown before birth). Stunting and under-five mortality are notable exceptions to this trend with the data revealing higher rates for boys than girls in most countries. However, these particular gaps are expected even in the absence of any gender-based discrimination or preference and are based on innate biological differences that make boys more susceptible to disease, stunting and premature death.
BOX

Advantage or Paradox? | The challenge for children and young people of growing up urban
28
Advantage or Paradox? | The challenge for children and young people of growing up urban
20
Implications, Risks and Opportunities

IMPLICATIONS, RISKS AND OPPORTUNITIES

30
Advantage or Paradox? | The challenge for children and young people of growing up urban
The urban setting has to become an integral part of programming for children. Since the urban advantage breaks down when we look beyond averages and control for wealth, programming for child survival and development must pay greater attention to the realities of urbanization for children. With rapid urbanization, cities need to account for projected populations in their plans. They must also consider unconventional, innovative, urban-specific means to reach marginalized children in informal settlements, migrants, refugees and children living on the streets. With increasing numbers of children living in urban contexts, it is no longer sufficient to focus solely on rural-based initiatives, as this may mean many disadvantaged children will miss out. Rising mobility, and in particular rural-urban migration, fuels fast urban growth and creates a rapidly evolving urban environment. The urban share of poverty is on the rise. This is particularly true in Sub-Saharan Africa, which is urbanizing at lower economic levels than other regions have done in the past. A refocus on programming for the poorest and most marginalized urban children and young people is urgently required. This in turn will require greater disaggregation in collecting evidence and planning for development.
Capacities of an inclusive urban planning must be further developed on all levels of government – national, regional and local. City governments, in particular, have to plan and budget in a way that is responsive to the realization of the rights of all children. Many urban children are facing deprivations as acute as their impoverished rural counterparts, and are equally lacking equitable access to quality essential services. Marginalized urban children and young people, often living in informal settlements, are excluded from the superior urban infrastructure that benefits more affluent children and families. Planning, governing and budgeting cities taking these huge disparities between neighbourhoods into account will be critical to address these inequities. Although disadvantaged neighbourhoods are easily identifiable in many cities, they are under-represented in data systems that drive research and policy,15 which results in local governments having inadequate information about those neighbourhoods. City averages or even urban averages are of very limited use for planning policy interventions since they mask the existing huge variability within cities.16
The development of urban systems has to accelerate to keep pace with the ongoing rapid urbanization. Children are affected by inadequate access to services in terms of health care, education, child protection, food and water supply, sanitation and waste management. Both basic infrastructure and public services have too often failed to keep pace with rapid population growth. The population in informal settlements often is not counted for planning purposes, thereby increasing the load on existing services. Proper mechanisms are usually not in place to regulate the private sector, which plays a major role in service delivery in urban areas. Extension and outreach services are not as developed in urban areas as in rural areas. All these issues are compounded by the ambiguity in accountabilities for service delivery in urban areas between the decentralized structures of sector ministries and city governments.
Solutions have to be found for the lack of financial resources needed to improve urban systems and to increase equity within urban areas. Limited fiscal resources, limited financial management capacity and unpredictable transfers from the national governments are major challenges related to public service delivery by city governments. There is an increasing trend to implement fiscal decentralization programmes, but in practice national governments are delegating spending responsibilities and keeping control of taxing powers. More emphasis should be placed on fixing responsibility for the different levels of government in providing public goods and services, transfer of funds to local governments as per their accountability, own source revenue generation and strengthening local public financial management.
Better data and better use of existing data are needed to understand the true dimension of urban inequity. This report highlights the large disparities within urban areas in terms of the 10 indicators studied and the dire situation of the urban poor in many countries. In reality, the situation is invariably even worse than what is presented here. The urban disparities are almost certainly underestimated since the most vulnerable populations are under-represented in surveys and censuses.17 This under-representation refers in particular to residents of informal settlements who tend to be undercounted due to
The key points highlighted in this review of urban and rural disparities for children have important implications for global efforts to foster equitable and sustainable urban development for children in the 21st century.

31
Implications, risks and opportunities
practical or political reasons.18 Disaggregated urban data often are limited. A lack of adequate, high quality, timely data poses great challenges to fully understanding the true dimension of urban inequity. In addition to efforts to collect better urban data, special efforts also are needed to sufficiently use and share existing data.

32
Advantage or Paradox? | The challenge for children and young people of growing up urban
32
CONCLUSION

As we enter the era of the Sustainable Development Goals (SDGs), this report shows the importance of investing in urban areas, metropolitan cities and smaller towns. SDG 11 is explicitly devoted to the urban topic, defined as making ‘cities and human settlements inclusive, safe, resilient and sustainable.’ Most of the SDGs are directly or indirectly linked to an urban perspective.19 Unless the focus on cities and other urban areas is strengthened, many of the goals will not be achievable, be it ending poverty (SDG 1), ending hunger (SDG 2), ensuring healthy lives and promoting well-being for all at all ages (SDG3) or ensuring availability and sustainable management of water and sanitation for all (SDG 6), to name just a few. SDG 10, reducing inequality within and among countries, is of particular importance here. As this report shows, inequality is ubiquitous both in rural and urban areas. But inequality in cities has its own dynamics that for too long have been left unexplored.20 Urban inequality is a direct consequence of a fast-growing urban population combined with a lack of planning and investments in housing and other physical infrastructure.
The purpose of this report is not to answer all of the policy issues its analysis raises, but rather to spark further discussion on how to address inequalities within urban areas and cities to which this report gives witness. The details to overcome this situation may differ between sectors, and country- and even city-specific characteristics may add an additional layer of complexity. Nevertheless, one implication is clear: all stakeholders and actors at all levels – from the local to the global, from civil society to the public and private sectors – need to pool their resources and energies to create urban environments that reduce inequalities and increase the well-being of all children in our increasingly urban world.
33
Conclusion

Surveys analysed in this reportThe analysis is based on 80 surveys (Demographic and Health Survey, DHS, and Multiple Indicator Cluster Surveys, MICS) from 77 countries conducted between 2011 and 2016. These 77 countries represent 51 per cent of the global population (2018).
For each country, the latest survey in this period was used. Three countries with indicator-specific data quality issues had a second, error-free survey available in the same period (2011-2016). In these cases, the older survey was used for analysis of that specific indicator only (Dominican Republic, Kyrgyzstan, Nigeria).21
Of the 77 countries in the sample, 31 per cent are low income countries (14 per cent globally), 40 per cent are lower middle income countries (24 per cent globally), 27 per cent are upper middle income countries (26 per cent globally) and 3 per cent are high income countries (36 per cent globally).
List of surveys included in the analysis (sorted by country code):
Code Country or area Survey* YearAFG Afghanistan DHS 2015AGO Angola DHS 2015ARM Armenia DHS 2015BEN Benin MICS 2014BGD Bangladesh DHS 2014
BIH Bosnia and Herzegovina MICS 2011
BLR Belarus MICS 2012BRB Barbados MICS 2012CIV Cote d'Ivoire DHS 2011CMR Cameroon MICS 2014
COD Democratic Republic of the Congo DHS 2013
COG Congo DHS 2011COL Colombia DHS 2015COM Comoros DHS 2012
DOM Dominican Republic DHSMICS
20132014
DZA Algeria MICS 2012EGY Egypt DHS 2014ETH Ethiopia DHS 2016GAB Gabon DHS 2012GHA Ghana DHS 2014
Code Country or area Survey YearGIN Guinea DHS 2012GMB Gambia DHS 2013GNB Guinea-Bissau MICS 2014GTM Guatemala DHS 2014GUY Guyana MICS 2014HND Honduras DHS 2011HTI Haiti DHS 2012IDN Indonesia DHS 2012IND India DHS 2015JOR Jordan DHS 2012KAZ Kazakhstan MICS 2015KEN Kenya DHS 2014
KGZ Kyrgyzstan DHSMICS
20122014
KHM Cambodia DHS 2014
LAO Lao People's Democratic Republic MICS 2011
LBR Liberia DHS 2013LCA Saint Lucia MICS 2012LSO Lesotho DHS 2014MDA Republic of Moldova MICS 2012MEX Mexico MICS 2015MLI Mali DHS 2012
ANNEX
*DHS: Demographic and Health Survey; MICS: Multiple Indicator Cluster Surveys
Code Country or area Survey YearMNE Montenegro MICS 2013MNG Mongolia MICS 2013MWI Malawi DHS 2015NAM Namibia DHS 2013NER Niger DHS 2012
NGA Nigeria DHSMICS
20132016
NPL Nepal DHS 2016PAK Pakistan DHS 2012PAN Panama MICS 2013PER Peru DHS 2012PHL Philippines DHS 2013PRY Paraguay MICS 2016PSE State of Palestine MICS 2014RWA Rwanda DHS 2014SDN Sudan MICS 2014SEN Senegal DHS 2016SLE Sierra Leone DHS 2013SLV El Salvador MICS 2014SRB Serbia MICS 2014
Code Country or area Survey Year
STP Sao Tome and Principe MICS 2014
SWZ Eswatini MICS 2014TCD Chad DHS 2014TGO Togo DHS 2013THA Thailand MICS 2012TJK Tajikistan DHS 2012TKM Turkmenistan MICS 2015TUN Tunisia MICS 2011TUR Turkey DHS 2013
TZA United Republic of Tanzania DHS 2015
UKR Ukraine MICS 2012URY Uruguay MICS 2012VNM Viet Nam MICS 2014XKX Kosovo22 MICS 2013YEM Yemen DHS 2013ZMB Zambia DHS 2013ZWE Zimbabwe DHS 2015
Indicators analyzed in this reportTen indicators were selected to analyse disparity in urban and rural areas. The following list shows the selected indicators ordered in an approximate life-course sequence with underlying health-related indicators at the beginning and outcome indicators at the end. Each survey could not provide data for each indicator, either because the respective questions were not part of the questionnaire or because indicators selectively had to be excluded because of quality or sample size issues.23 For each indicator, the number of countries with valid values for urban and rural levels is noted in parenthesis, along with the percentage of low income countries (LIC) among them.
Health and rights service indicators (for newborns):
Skilled births attendant rate (77 countries, 27 per cent LIC)
Birth registration rate (74 countries, 28 per cent LIC)
DTP3 Immunization rate (71 countries, 30 per cent LIC)
Education and knowledge indicators:
Outcome indicators:
Primary education completion rate (77 countries, 27 per cent LIC)
Comprehensive knowledge about HIV/AIDS among young women aged 15-24 years (73 countries, 20 per cent LIC)
Comprehensive knowledge about HIV/AIDS among young men aged 15-24 years (52 countries, 38 per cent LIC)
Stunting prevalence among children under 5 years of age (64 countries, 30 per cent LIC)
Under-five mortality rate (56 countries, 34 per cent LIC)
!
!
Household indicators (with basic health relevance):
Use of basic drinking water services (73 countries, 28 per cent LIC)
Use of basic sanitation services (74 countries, 28 per cent LIC)
35
Annex

Measuring wealthFor the purpose of exploring the disparity within populations, this report compares population groups based on their urban or rural residence and within each residence type by their wealth status. The wealth status is based on the wealth index, which is a composite measure of a household’s cumulative living standard. It is constructed using information on the household’s ownership of assets and access to various household services. These include ownership of a mobile phone, ownership of cattle, dwelling roof material, electricity, and the type of water and sanitation facilities.
It should be noted that this index introduces some endogeneity into our analysis of access to water and sanitation facilities by wealth quintile. Because wealth is in part a function of access to water and sanitation facilities, the poorest are definitionally less likely to have access than the richest.24 Nevertheless, it is considered a best practice to use a wealth index that includes water and sanitation measures when analysing water and sanitation in conjunction with other indicators, as we do in this report.
Members of households are ranked according to this index and sorted into five equal-size groups (quintiles). For most analyses in this report, this sorting is done separately for urban and rural households and compares the bottom quintile (the poorest) with the top quintile (the richest).
Absolute versus relative inequalityInequality can be measured in absolute and relative terms. This report mostly uses the former. Absolute inequality measures the difference between the more advantaged group (the urban population or the richest quintile) and the more disadvantaged group (the rural population or the poorest quintile). For most indicators, this difference is measured in percentage points since the indicators measure the share of the population affected. On under-five mortality, however, we maintain the unit of the indicator (births per 1,000 live births). Relative inequality is given as the ratio of the indicator value for the two groups. The measure of absolute inequality gives information about the amount of effort needed to close the gap whereas the measure of relative inequality is more a measure of fairness and as such has a moral component.25 For instance, a 5 percentage point difference results in a large
relative gap when the levels are 2 per cent and 5 per cent, but only a small gap when the levels are 92 per cent and 97 per cent. But in both cases, the same amount of investment or effort may be needed to increase the service coverage by 5 percentage points.
LimitationsThis study has some limitation related to concepts and statistical power. The terms ‘urban’ and ‘rural’ are used as defined by the countries. There are significant differences between countries as to the size of an area defined as ‘urban,’ ranging from a population threshold of 200 (in Denmark and Sweden) to 30,000 (Mali) or even 50,000 (Japan). Most countries using a population criteria use a threshold of between 2,000 and 5,000.26 The data do not allow for different treatment of informal settlements and regular settlements.
Indicator values in this report are given as observed. Since surveys are usually designed to be representative at the national level or larger administrative levels and at the urban-rural level, the analyses can reach the limit of the statistical power for most indicators when comparing quintiles within urban and rural populations. In particular, small measured differences may not be statistically significant, meaning that the sample is too small and the outcome too variable to give us confidence that the measured differences reflect true differences in the populations. Thus, caution should be exercised when interpreting the results. However, the broad patterns in this analysis that hold over a large number of countries and indicators are likely reliable despite the possible imprecision of the point estimates.
36
Advantage or Paradox? | The challenge for children and young people of growing up urban

37
End notes
1 See more information on SDGs on United Nations, ‘Sustainable Development Knowledge Platform’, <https://sustainabledevelopment.un.org/sdgs>2 The ‘New Urban Agenda’ was presented at the UN-HABITAT III Conference held in Quito, Ecuador, in October 2016, see also <http://habitat3.org/the-new-urban-agenda/>3 See United Nations Conference on Housing and Sustainable Urban Development (Habitat III), <http://habitat3.org>4 United Nations, Department of Economic and Social Affairs, World Economic and Social Survey 2013, E/2013/50/Rev. 1, ST/ESA/344, United Nations, New York, 2013, p. 655 For example, Save the Children, State of the World’s Mothers 2015 – The urban disadvantage, Save the Children, Fairfield, 2015, p. 27: in 19 of 40 analysed countries the intra-urban gap in U5MR had widened recently6 All numbers based on United Nations, Department of Economic and Social Affairs, Population Division, World Urbanization Prospects: The 2018 Revision, Online Edition, if not otherwise noted.7 Angel et al., Atlas of Urban Expansion—2016 Edition, Volume 1: Areas and Densities, New York University, 2016.8 United Nations Human Settlements Programme (UN-Habitat), World Cities Report 2016, UN-Habitat, Nairobi, 2016, p. 203.9 Note that this analysis is based on cross-sectional data and not on time series data. Other factors than development – such as regional biases – may influence the interpretation: for example, low-income countries in this sample are mostly composed from countries in Sub-Saharan Africa while the majority of the upper-middle income countries are from Latin America and the Caribbean and Asia.10 This analysis cannot completely control for differences in wealth between urban and rural populations because there is significant variation in wealth even within a single quintile. It is likely that the poorer individuals in the national middle wealth quintile tend to be rural, while the richer ones tend to be urban. Nevertheless, this analysis comes as close as the data permits to comparing individuals with the same level of wealth.11 Estimated number of children is based on 20 per cent of the urban population in the age group 0 to 4 (2018) in the respective countries showing higher under-five mortality rates for the urban poorest compared to the rural poorest. The urban population by age is extrapolated using: United Nations, Department of Economic and Social Affairs, Population Division (2014). Urban and Rural Population by Age and Sex, 1980-2015; United Nations, Department of Economic and Social Affairs, Population Division (2018). World Urbanization Prospects: The 2018 Revision, Online Edition; and United Nations, Department of Economic and Social Affairs, Population Division (2017). World Population Prospects: The 2017 Revision, DVD Edition.12 Estimated number of children is based on 20 per cent of the urban population in the age group 0 to 17 (2018) in the respective countries showing lower primary education completion rate for the urban poorest compared to the rural poorest. For the estimation of the urban population by age see the previous footnote.13 United Nations, Department of Economic and Social Affairs, World Economic and Social Survey 2013, E/2013/50/Rev. 1, ST/ESA/344, United Nations, New York, 2013, p. 60.14 Dudwick, Nora et al., From Farm to Firm Rural - Urban transition in developing countries, World Bank Group, Washington D.C., 2011.15 Lilford, Richard et al., Improving the health and welfare of people who live in slums, Lancet, vol. 389, 2017, pp. 559–570.16 World Health Organization, Hidden Cities - unmasking and overcoming health inequities in urban settings, 2010, The WHO Centre for Health Development, Kobe, 2010, p. xiii17 World Health Organization, Global report on urban health - equitable, healthier cities for sustainable development, WHO Geneva, 2016, p. 3418 Lucci, Paula et al., Are We Underestimating Urban Poverty, Overseas Development Institute, London, 2016.19 Cities Alliance, Sustainable Development Goals and Habitat III: Opportunities for a successful New Urban, Discussion paper No. 3, Cities Alliance, Brussels, 2015.20 Save the Children, State of the World’s Mothers 2015 – The urban disadvantage, Save the Children, Fairfield, 2015, p. 5.21 Dominican Republic (analysis based on MICS, 2014 except for “stunting”: DHS, 2013); Kyrgyzstan (MICS, 2014 except for “HIV knowledge men”: DHS, 2012); Nigeria (analysis based on MICS, 2016 except for “under-5 mortality”: DHS, 2013)22 All references to Kosovo are made in the context of UN Security Council Resolution 1244 (1999)23 Following the methodology applied by both DHS and MICS we defined a small sample size as all groups (e.g. urban, poorest quintile) with less than 25 cases (unweighted population). This threshold was used for all indicators except for under-five mortality where the threshold was defined as 250 (applied to the number of exposure). Surveys were excluded for specific indicators based on specific quality issues (for example internal inconsistencies, lack of national representativeness, indicator levels incompatible with other sources).24 One study found that, when using an alternative wealth index that isn’t based on water or sanitation measures, the gap in water and sanitation coverage between the poorest and richest quintile is always narrower than it is using the usual wealth index. See further discussion in Martel, Pierre (2016), “Review of options for reporting water, sanitation and hygiene coverage by wealth quintile,” MICS Methodological Papers, No. 4, Data and Analytics Section, Division of Data, Research and Policy, UNICEF New York.25 See also: Harper, Sam Et Al., Implicit Value Judgments in the Measurement of Health Inequalities, Milbank Quarterly, vol. 88, no. 1, 2010, pp. 4–2926 United Nations, Department of Economic and Social Affairs, Population Division (2018). World Urbanization Prospects: The 2018 Revision, Online Edition.
END NOTES


Advantage or Paradox? | The challenge for children and young people of growing up urban
Published by UNICEF3 United Nations PlazaNew York, NY 10017, USA
ISBN: 978-92-806-4977-2
www.unicef.org
© United Nations Children’s Fund (UNICEF) October 2018