Advantage of Globalization
36
European Review of Economic History: page 1 of 36 C European Historical Economics Society 2010 doi:10.1017/S136149161000002X Taking advantage of globalization? Spain and the building of the international market in Mediterranean horticultural products, 1850–1935 VICENTE PINILLA + AND MAR ´ IA-ISABEL AYUDA ++ +Department of Applied Economics and Economic History, University of Zaragoza, Gran V´ ıa 4, 50005 Zaragoza, Spain, [email protected] ++Department of Economic Analysis, University of Zaragoza, Gran V´ ıa 4, 50005 Zaragoza, Spain, [email protected] This article examines how globalization and industrialization offered the nations of the European periphery opportunities to develop exports in sectors where they enjoyed a comparative advantage. As a case in point, we consider Spanish exports of Mediterranean horticultural products (MHP). Two bi-equational export supply and demand models (an equilibrium and a disequilibrium model) are proposed, in which volumes and prices are determined simultaneously, to throw light on the main causes of Spain’s expanding exports of MHP. The results clearly reflect the primacy of rightward shifts in the supply and demand curves in explaining the growth of MHP trade by volume. Thus, both rising incomes in the more developed countries and technological change in agriculture specializing in these products were key to the growth of this trade. Meanwhile, Spanish exporters also benefited from the increasing integration of international markets, especially through declining transport costs and, to a lesser extent, trade liberalization. 1. Introduction Industrialization and globalization are without a doubt the two most important phenomena of the period 1800–1914, and the connection between the two has already been shown to be unequivocal (Findlay and O’Rourke 2007, pp. 310–64). One of the key elements of the globalization process was the trade boom, which far outstripped that achieved in preceding centuries (O’Rourke and Williamson 1999; Findlay and O’Rourke 2003). Although opinion is unanimous regarding the importance of the trade boom, there exists an intense debate concerning its causes. There is widespread agreement that rising incomes were, obviously, a fundamental
-
Upload
ramiro-paz -
Category
Documents
-
view
44 -
download
1
description
GLOBALIZATION
Transcript of Advantage of Globalization

European Review of Economic History: page 1 of 36 C© European Historical Economics Society 2010
doi:10.1017/S136149161000002X
Taking advantage of globalization?Spain and the building of theinternational market in Mediterraneanhorticultural products, 1850–1935
VICENTE PINILLA+ A N DM A R IA - ISAB E L AYU DA+++Department of Applied Economics and Economic History, University ofZaragoza, Gran Vıa 4, 50005 Zaragoza, Spain, [email protected]++Department of Economic Analysis, University of Zaragoza, Gran Vıa 4,50005 Zaragoza, Spain, [email protected]
This article examines how globalization and industrialization offered thenations of the European periphery opportunities to develop exports insectors where they enjoyed a comparative advantage. As a case in point, weconsider Spanish exports of Mediterranean horticultural products (MHP).Two bi-equational export supply and demand models (an equilibrium anda disequilibrium model) are proposed, in which volumes and prices aredetermined simultaneously, to throw light on the main causes of Spain’sexpanding exports of MHP. The results clearly reflect the primacy ofrightward shifts in the supply and demand curves in explaining the growthof MHP trade by volume. Thus, both rising incomes in the moredeveloped countries and technological change in agriculture specializing inthese products were key to the growth of this trade. Meanwhile, Spanishexporters also benefited from the increasing integration of internationalmarkets, especially through declining transport costs and, to a lesserextent, trade liberalization.
1. Introduction
Industrialization and globalization are without a doubt the two mostimportant phenomena of the period 1800–1914, and the connection betweenthe two has already been shown to be unequivocal (Findlay and O’Rourke2007, pp. 310–64). One of the key elements of the globalization process wasthe trade boom, which far outstripped that achieved in preceding centuries(O’Rourke and Williamson 1999; Findlay and O’Rourke 2003).
Although opinion is unanimous regarding the importance of the tradeboom, there exists an intense debate concerning its causes. There iswidespread agreement that rising incomes were, obviously, a fundamental
2 European Review of Economic History
cause of increasing trade (Irwin 2002; Estevadeordal, Frantz and Taylor2003; Jacks and Pendakur 2008), while trade liberalization and exchangerate stability were also extremely important (Jacks 2006; Estevadeordal,Frantz and Taylor 2003; Lopez-Cordova and Meissner 2003). By contrast,the debate regarding the role of the reduction of transport costs is by nomeans closed (O’Rourke and Williamson 1999; Jacks, Meissner and Novy2008; Jacks and Pendakur 2008). Other possible relevant variables may bethe stock of immigrants and colonial status (Dunlevy and Hutchinson 1999;Jacks 2005; Mitchener and Weidenmier 2008).
A recent review of the principal determinants of trade growth in the firstwave of globalization concluded that the key factors were changes in outputand the reduction of trade barriers, the latter having greater weight. However,in the case of Europe the contribution of the two factors was estimated to beequivalent (Jacks, Meissner and Novy 2009).
International trade in agricultural and food products also grew duringthe nineteenth century, and its rise was rapid comparable to that of totaltrade (Aparicio, Pinilla and Serrano 2009). The analysis of trade in thistype of product has mainly focused on the ‘invasion’ of Europe (particularlyby cereals from America and the Russian Empire) and its impact on localagriculture, trade policy responses and economic development in general.1
Such analyses are of course highly relevant with regard to Mediterraneancountries’ imports and the impact of the ‘invasion’ on their agriculture.However, the southern European nations also played a key role ininternational trade as exporters, enjoying not only a clear competitiveadvantage but also a centuries-long tradition of producing certain goods,in particular olive oil, wine and fruit and vegetables. Indeed, a number ofrecent papers have dealt with precisely this subject, focusing on internationalcompetition in these products and the effects of importers’ trade policies.
In the cases of the wine and olive oil sectors, the literature refers aboveall to intra-Mediterranean competition (including the discriminatory tradepolicy applied by France) and the trade barriers erected in the Americancontinent to protect its young domestic wine industry.2 As for Mediterraneanhorticulture, the main focus has been competition between California andthe Mediterranean countries.3 The shifts in the demand curves for suchproducts, due to rising incomes in the most industrialized countries, havealso received a certain amount of attention.4
The aim of the present article is to examine how globalization andthe profound economic changes produced by the industrialization of the
1 O’Rourke and Williamson (1999); O’Rourke (1997); Tracy (1964).2 Pinilla and Ayuda (2002); Pinilla and Serrano (2008), Ramon-Munoz (2000).3 Morilla, Olmstead and Rhode (1999) and (2000); Garrido (2007); Pinilla and Ayuda
(2009).4 Pinilla and Ayuda (2008); Pinilla and Serrano (2008).

Taking advantage of globalization 3
advanced nations offered the countries of the European periphery exportopportunities in certain sectors where they enjoyed clear comparativeadvantages and a manifest complementarity with more developedeconomies.5 In summary, it is a contribution to the debate on the impact ofthe globalization and industrialization of the countries of the ‘centre’ uponthe backward countries of the southern periphery of Europe. Our intentionis to establish what the principal determinants of the growth of internationaltrade were in the first wave of globalization in these countries.
To this end, we have chosen as a case study Spanish exports ofMediterranean horticultural products, or MHPs. These comprise fresh fruit,dried fruit and fresh vegetables. Such products formed a significant partof the exports of the countries of the southern periphery of Europe andconsequently provide a good example of the type of trade under analysishere. The case of Spain is of particular interest due to its significant share ofthe international market in these products; in the first third of the nineteenthcentury Spain accounted for approximately one-third of world exports ofMHPs (see Table 1).
Our hypothesis is that for this type of product the growth of internationaltrade was principally determined by the changes directly produced byindustrialization, such as rising incomes or technological progress. However,another series of changes which we may consider as fundamental in theprocess of market integration also played an important role. Of these,the most notable were the fall in transport costs and the process of tradeliberalization. In our opinion, the relative weight of the two types of variablesmay differ significantly according to the type of products traded, somethingwhich analysis at a more aggregate level is unable to capture.
To examine the hypothesis, we propose a bi-equational supply and demandmodel for Spanish MHPs in the period 1870–1935. This permits us todetermine the key variables in the tremendous expansion of Spanish exportsof these products. Our econometric results underline the fact that in thiscase shifts to the right of the supply and demand curves were much moreimportant than the reduction in transport costs and the liberalization oftrade. Thus, rising incomes in the advanced countries and the greaterprofitability offered by MHPs compared to traditional products were theprincipal determinants of the growth in their exports.
Following this introduction, Section 2 presents a theoretical and empiricalreview of the causes of the growth of international trade during the first waveof globalization, with special reference to the products we shall study. Section3 analyses the evolution of their international trade, and then assesses the roleof Spain in the construction of the global market for MHPs. Sector 4 attemptsto establish the principal causes of the expansion of the Spanish MHP export
5 A discussion of the effects of this complementarity and the concentration of exports inthose more developed economies can be found in Fraile (1992).
4 European Review of Economic History
sector, and we propose a bi-equational export supply and demand model.In Section 5 we explain the variables used in the model, and in Section 6
we then propose the corresponding econometric models and explain theirresults. The article ends with some general conclusions regarding the subjectstudied.
2. The causes of the growth of international trade in MHPsduring the first wave of globalization: theory andhistorical evidence
In the first half of the nineteenth century, MHP production and trade waslargely concentrated in the countries on the northern and southern shoresof the Mediterranean Sea. There was also significant production in partsof the Far East, where favourable climatic conditions prevailed, but tradewas limited. In most of western Europe, meanwhile, MHPs were consideredexotic and their market presence was insignificant.
However, international trade in fruit and horticultural products surgedfrom the mid nineteenth century to the first third of the twentieth, increasingits share of total trade in agricultural products (Aparicio, Pinilla andSerrano 2009). This growth in the volume of trade was due to commoditymarket integration (defined as globalization by Kevin O’Rourke and JeffreyWilliamson) and outward shifts in both the import demand and exportsupply curves.6
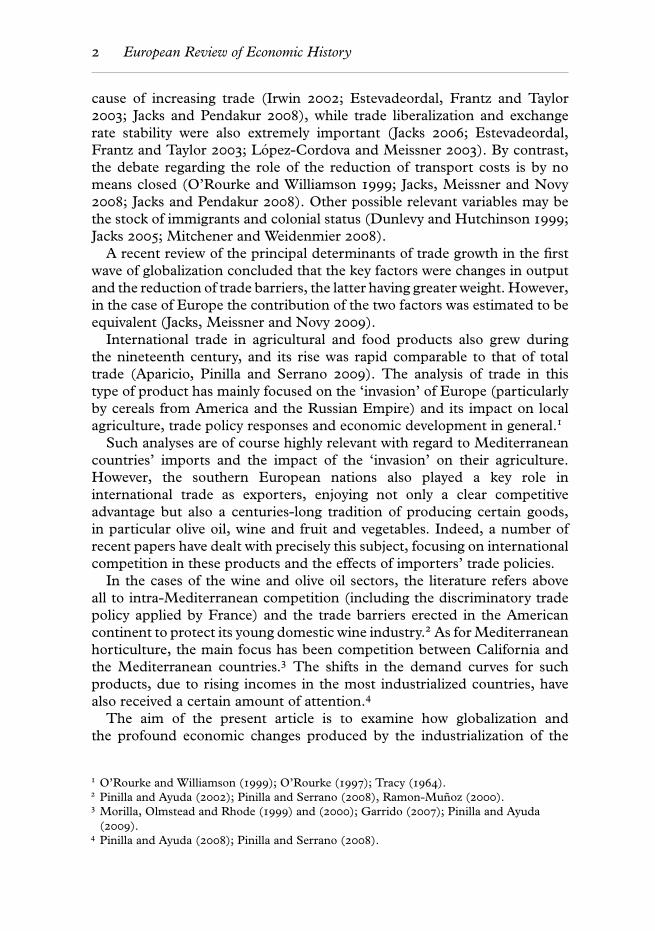
Figure 1 shows the effect which a reduction of transport and tariff costs hadupon international trade. We propose an S-curve for the supply of SpanishMHP exports to the rest of the world. As can be observed, the increase inthe quantities launched onto the market depended basically on their price,p. In turn, M is the demand curve from the rest of the world for SpanishMHPs, which depended on the price at which they arrived on the market,p∗. Logically, prior to globalization, high transport costs and tariff barriersto trade produced a distance t1 between Spanish export prices p and theprices at which Spanish fruit and vegetables arrived on the markets of theimporting countries p∗. A fall in transport costs and the process of tariffliberalization produced a reduction of the difference t1 between Spanishexport prices p and those of the international markets p∗, to t2. It can beseen that the simple reduction of transport costs and tariffs occurring duringglobalization generated an increase in the volumes traded, if all other factorsremained constant.
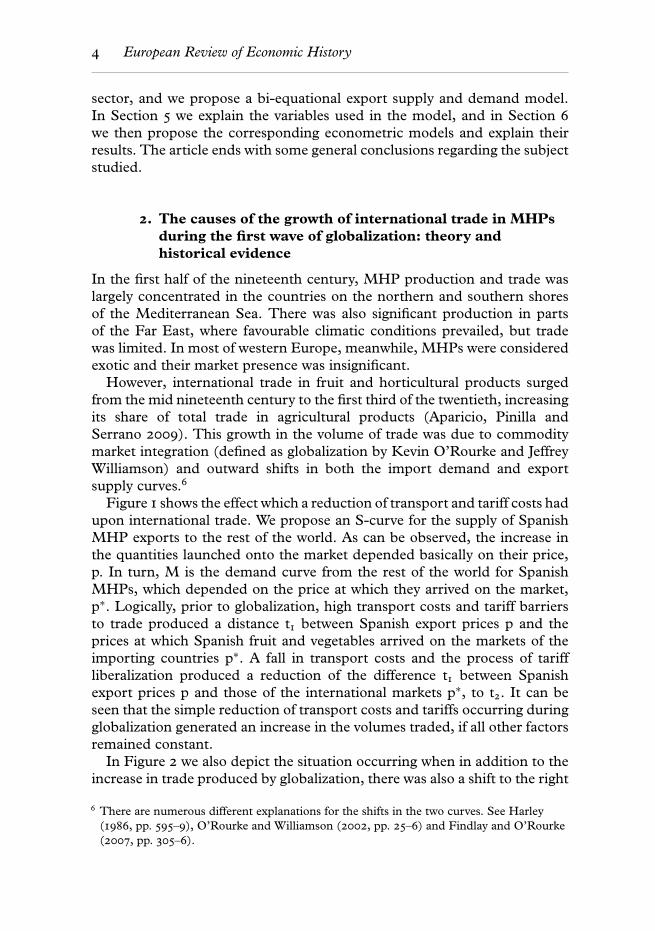
In Figure 2 we also depict the situation occurring when in addition to theincrease in trade produced by globalization, there was also a shift to the right
6 There are numerous different explanations for the shifts in the two curves. See Harley(1986, pp. 595–9), O’Rourke and Williamson (2002, pp. 25–6) and Findlay and O’Rourke(2007, pp. 305–6).
Taking advantage of globalization 5
MS
t1 t2
p, p*
q
SM
q1 q2
p1
p1*
p2
p2*
Figure 1. Effect of globalization upon international trade
Source: Based on Harley (1986, pp. 595–7) and O’Rourke and Williamson (2002,p. 24).
M1S1
t2
S2
p, p*
q
M2
q1q2
Figure 2. Effect of supply and demand shifts upon international trade
Source: Based on Harley (1986, pp. 595–7) and O’Rourke and Williamson (2002,p. 24).
of the demand curve (due essentially to increasing incomes in the importingcountries) and of the supply curve for Spanish exports (possibly as a result oftechnological change, the accumulation of capital or the cultivation of newlands). In this case, if t2 now remains constant, the quantities traded alsoincreased, although for reasons different to those visible in Figure 1.
6 European Review of Economic History
The rising consumption of MHPs in the more advanced countries andthe gradual change in traditional diet were key factors in developing theexport potential of producer countries. This increase in consumption wasessentially a consequence of rising per capita income in the industrializingcountries, as clearly illustrated by the case of the consumption of orangesin the UK, especially in the second half of the nineteenth century (Pinillaand Ayuda 2008). Naturally, demand was also driven by rapid populationgrowth during this period, and thus there was an evident shift in the demandcurve.
The expansion of exports required factors to be reallocated, and in somecases this implied major changes in the production function which wentfar beyond a mere switch of resources to the products for which demandwas strongest. Indeed, such changes involved a profound transformation ofagriculture in those areas that were most directly engaged in internationaltrade. Furthermore, this process did not take place in isolation fromproduction for the domestic markets of the producer countries, but insteadtended to incorporate similar processes of technological change, such asirrigation in areas that had previously cultivated rain-fed land crops, the moreintensive use of new fertilizers, mechanization, the attempt to eradicate croppests and blights, changes in crop varieties, etc. (Pinilla and Ayuda 2009).The resulting shifts in both the supply and the demand curves were bothlinked and interdependent.7
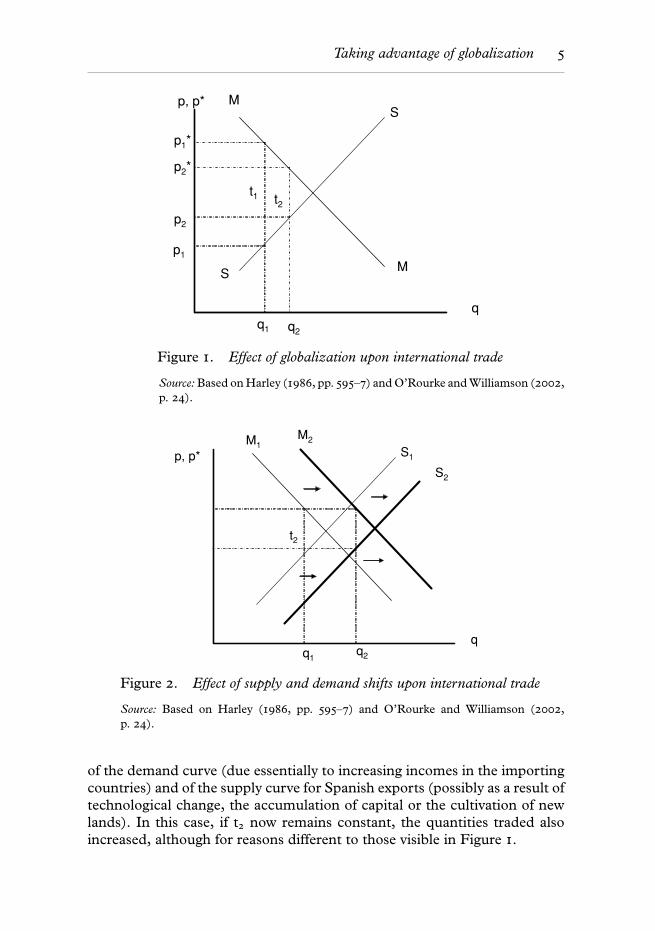
The expansion of trade in MHPs was also stimulated by the process ofglobalization, behind which falling transport costs and market liberalizationwere the principal driving forces.8 The importance of market integration canbe seen by using as a proxy an annual index of world trade intensity (theratio of real-world exports to real-world GDP, both in US dollars) which wehave estimated for the years 1850–1938.
These data, displayed in Figure 3, are richer than those so far publishedin other studies, which use benchmark years. They provide an overview ofthe depth and scope of the globalization process between 1850 and 1914.Obviously, however, the First World War resulted in a sharp halt, while thesubsequent recovery never reached the heights of the pre-war years. Finally,the stock market crash of 1929 and the ensuing depression had a profoundeffect on globalization, which went into headlong retreat.
There is considerable consensus today regarding the fall in trade costsoccurring in the first wave of globalization.9 However, as we noted inthe introduction, there are considerable discrepancies regarding the mostimportant causes of this decrease. Jacks, Meissner and Novy (2009) have
7 For the Mediterranean countries, see Federico (1991a) and (1991b) on this subject.8 Mohammed and Williamson (2004); Clemens and Williamson (2004); Jacks (2006).9 A dissenting view on the emphasis of transatlantic freight as a cause of convergence in
Federico and Persson (2007, pp. 97–102).

Taking advantage of globalization 7
60
70
80
90
100
110
120
130
140
150
18
50
18
55
18
60
18
65
18
70
18
75
18
80
18
85
18
90
18
95
19
00
19
05
19
10
19
15
19
20
19
25
19
30
19
35
Figure 3. Globalization index: ratio of world trade to world output,1850–1938
Source: See Appendix.
estimated that in the first wave of globalization this reduction amounted toapproximately 33 per cent, with significant regional variations. As a numberof studies have recently shown, market integration, measured as precisely aspossible, i.e. through price behaviour, advanced significantly until 1914 andagricultural products participated strongly in this process of integration.
3. The building of a global market for Mediterraneanhorticultural products
The growth in MHP trade took place in a context of increasing competitionin international markets (Pinilla and Ayuda 2009). For a significant part ofthe later nineteenth century, competition was basically intra-Mediterranean,leading to specialization on the part of the producer countries (somecountries achieved strong positions in certain products, such as Spainwith oranges, Italy with lemons, Greece and Turkey with raisins). Fromthe end of the nineteenth century onwards, however, the excellent tradeprospects increased international competition in two ways: firstly, theprogressive emergence of ‘new Mediterranean countries’ from within thesame geographical area (North Africa and Mandatory Palestine); secondly,the rise of competitors in temperate zones outside the region (the USA,Brazil, Australia and South Africa). Expatriates of European descent playeda key role in the promotion of Mediterranean agriculture in all of theseareas. The USA (and, more specifically, California) was undoubtedly thecompetitor with the greatest capacity to threaten the dominant market

8 European Review of Economic History
position of the long-standing Mediterranean producers (Morilla, Olmsteadand Rhode 1999).
The principal importers of fruit and vegetables were the more developedcountries, with the UK clearly at the head, followed by France, Germany,the USA, Canada, Belgium, Holland and Switzerland. The most remarkablechange in the constitution of this group is the decline in US imports; it wasthe leading consumer of MHPs, but the decline in imports was due tothe development of its domestic crops. Consequently, MHP supply cameto be controlled by agriculture in California and other states specializingin these commodities. The combination of efficient, modern agriculture,excellent marketing and high protectionism had the effect of excluding fromthe US market a significant part of the fruit and vegetables produced bytheir traditional exporters. The data available for international trade insuch products only begin in the twentieth century (and at different datesdepending on the product), a fundamental shortcoming which makes itdifficult to capture the events of the second half of the nineteenth century.In the light of British foreign trade statistics, however, it seems reasonable toindicate the sharp rise in MHP imports as the most notable feature of thisperiod.10 Nevertheless, as the nucleus of industrialized countries expanded,the UK’s share of this trade in Europe gradually declined.
Based on data available for a range of products (see Table 1), Europe wasthe main importer of MHPs until the Second World War, accounting forover 84 per cent of the world market in them. The evolution of this tradeover the first third of the twentieth century was determined by a number ofdevelopments, the most significant being the decline of US imports and theemergence (real or statistical, since trade in MHPs had not previously beenregistered) of small markets in Asia and South America, which were mainlysupplied by neighbouring producers.
The leading exporters were initially the countries lying on the northernshore of the Mediterranean; these tended to monopolize the internationalmarkets in MHPs. The expansion of Spanish and Italian exports clearlyillustrates the point to which certain traditional producers took advantage ofthe opportunities unveiling before them. With time, these countries beganto face increasing competition from a significant number of non-Europeancountries, particularly from the beginning of the twentieth century onwards.However, this did not result in any serious detriment to European exports. Inabsolute terms, they grew by approximately 20 per cent until the 1930s. Thevery low starting point of other regions meant they achieved proportionallymuch higher growth rates. On the basis of the limited evidence available,European exports increased where the pattern of demand was more dynamic,and levelled out or fell elsewhere.11
10 Pinilla and Ayuda (2008).11 See Pinilla and Ayuda (2009) for data on individual products.

Taking advantage of globalization 9
Table 1. International trade in MHPs, 1909–38
1909–13 1925–8 1929–32 1933–5 1936–8
Exports Regional shares (%)Spain 34.5 35.2 37.8 32.3 n.a.Europe 77.4 67.3 66.7 57.6 42.9N. & C. America 4.7 13.8 12.7 11.8 15.1South America 1.4 2.1 1.9 4.8 7.2Asia 14.0 11.8 11.8 15.6 21.4Africa 2.4 2.7 3.5 5.2 8.1Aust. & Oceania 0.1 2.2 3.3 5.0 5.3World exports 100.0 100.0 100.0 100.0 100.0ImportsGermany 17.9 20.6 21.3 18.9 17.2France 6.9 6.7 8.9 11.4 9.0UK 35.7 37.1 35.1 33.4 32.9Europe 86.3 84.7 88.6 86.5 84.3N. & C. America 10.6 10.2 7.1 6.7 8.2S. America 0.4 0.8 0.4 2.0 1.8Asia 0.3 1.4 1.5 2.8 3.7Africa 1.7 2.1 1.5 1.1 0.9Aust. & Oceania 0.7 0.8 0.9 0.9 1.2World imports 100.0 100.0 100.0 100.0 100.0
Exports Index numbers (100 = 1909–13)Spain 100 130 159 151 n.a.Europe 100 111 125 120 92N. & C. America 100 377 397 408 537South America 100 193 200 550 854Asia 100 107 123 180 254Africa 100 145 210 351 558Aust. & Oceania 100 4,088 7,118 11,801 12,967World exports 100 127 145 162 166ImportsGermany 100 147 182 182 164France 100 123 197 284 222UK 100 133 151 161 157Europe 100 125 157 173 167N. & C. America 100 123 102 109 132S. America 100 232 148 786 695Asia 100 637 801 1,649 2,177Africa 100 158 138 118 87Aust. & Oceania 100 131 188 213 276World imports 100 127 153 172 171
The table includes trade in oranges, lemons, table grapes and raisins. The quantities havebeen multiplied by their respective prices in 1925.Source: Pinilla and Ayuda (2009), based on International Institute of Agriculture (1909–39).

10 European Review of Economic History
Turning from the evolution of trade in absolute terms to an analysis ofworld market shares, we may note the general decline in the European marketshare caused by the emergence of new producers. New exporters of orangeswere the USA, Brazil, South Africa, Japan and, above all, Palestine, whichbecame the second largest exporter at world level, after Spain. In the lemontrade, only one European country, Spain, threatened Italian hegemony, andthe continent’s share was therefore not affected. Finally, Algeria and the USAbecame significant exporters of table grapes, and the USA and Australia ofraisins.
However, these data conceal the main impact of increasing competitionupon the traditional Mediterranean producers, namely the loss of exports tothe USA, where the supply of MHPs was gradually taken over by domesticagriculture.12 This notwithstanding, the damage to traditional exporters isnot reflected in any serious fall in their exports (except in the case of raisins),or in the loss of relative market share (which was generally mild), but ratherin the opportunities that would have existed in the world’s biggest market hadUS agriculture failed to become able to supply its own market. Competitionfrom California consequently affected the MHP exports of Mediterraneancountries, which nevertheless displayed dynamic and expansive behaviour inthe period under analysis.13 In addition, international competition affectedthe prices of these products.
3.1. The Spanish role in the global MHP market
In our view, it is important to emphasize that the development and growth ofspecialized horticulture in Mediterranean countries such as Spain occurredsimultaneously with the processes of industrialization and globalizationthemselves. Thus, the new opportunities that emerged in the second halfof the nineteenth century led the Mediterranean countries to increase theirproduction within the framework of a new pattern of specialized, intensiveagriculture.
In the Spain of the mid nineteenth century, the production and exportationof MHPs was insignificant. Even in irrigated areas, the predominant cropswere wheat, grapes and olives, and the main objective was to obtain regularproduction that depended to only a limited extent on rainfall, which waserratic in a country as arid as Spain. Logically, a secondary objective wasalso to increase production. Orange and other fruit trees were normally
12 The fall in American imports is described in Morilla, Olmstead and Rhode (1999).13 Morilla, Olmstead and Rhode (1999, pp. 343–5), estimated that in 1910 the MHP revenue
lost by the Mediterranean countries due to US production would have been sufficient tosupport about half a million people. Pinilla and Ayuda (2009, p. 194), have calculated thatif US citrus production had not existed, Spanish GDP in 1910 would have been 0.85%higher.

Taking advantage of globalization 11
grown on the edges of irrigated smallholdings, while orchard plantationswere extremely rare. Furthermore, in some areas there were small marketgardens used for the summer production of vegetables, essentially for self-consumption, and to cultivate certain commercial products, such as textilefibres (hemp, flax and white mulberry leaves to feed silkworms).
The development of a system of agriculture that was commercial innature and specialized in Mediterranean horticulture required significantmodification with regard to traditional farming. Increasing production bythe volume necessary to satisfy external demand was impossible using theold systems of cultivation. The necessary technical transformation requiredthe implementation of a process in which the dynamism of supply was crucial,driven by the greater profitability of MHPs compared to traditional crops.14
In Spain, the principal obstacle to this process was water: withoutirrigation, hardly any of the crops in question are viable in the IberianPeninsula. Although expansion was possible in some areas, by changing landuse in irrigated areas, it was also necessary to increase the supply of water toallow the transformation from dry-land to irrigated farming.15 This increasewas the result of public investment in major regulation and distributionprojects (reservoirs and canals), and the digging of wells. However, thegovernment was very slow to make any commitment to water-related civilengineering projects (which did not really get under way until the last decadeof the nineteenth century) and the level of investment remained low, whichlimited its impact to areas specializing in Mediterranean horticulture (Pinilla2006).
As a result, private initiatives played the key role in increasing water supply,by tapping underground water using the latest technologies and using theenergy derived from fossil fuels to provide irrigation.16 Traditional multi-cropfarming gave way to farms that specialized in a smaller range of products,which required not only water but also a series of technical innovations, suchas the more intensive use of fertilizers (guano and, subsequently, chemicalfertilizers), the introduction of new varieties, the combating of plant pestsand diseases, etc.
The expansion of this type of agriculture took place above all in theareas closest to the Mediterranean coast, which enjoyed ideal environmentalconditions and a locational advantage for access to international markets.Growth had already reached spectacular levels by the second half of thenineteenth century, although the absence of complete statistical data doesnot permit precise estimates. The main MHP crop, oranges, serves as an
14 Concerning the gap between the returns from MHPs and traditional crops, see Garrabou(1985), Roncales (1998).
15 Until 1900 the cultivation of oranges in once dry-land areas that had been transformed byirrigation was much more important than in traditional market gardens.
16 Calatayud and Martınez-Carrion (1999).
12 European Review of Economic History
excellent example to gauge the early dynamism of the sector. In the Spanishprovinces where the cultivation of oranges was particularly important,Castellon and Valencia, the area given over to the fruit increased from1,249 hectares in 1860 (just ten years after cultivation in regular plantationsis generally agreed to have begun) to 9,880 hectares by 1890. In thesetwo provinces, the figure had reached 36,705 hectares by 1922 and 58,773
hectares by 1932, when there were almost 75,000 hectares under productionin the whole of Spain.
The data for MHP production, although only available for the secondphase of expansion (beginning at the start of the twentieth century), are alsoillustrative: between 1902 and 1932 the production of oranges and almondsdoubled; that of lemons had multiplied five-fold; that of peaches and apricotsdoubled and quadrupled, respectively (from only 1910 onwards).17 Simpsonhas calculated that the production of oranges in the province of Valenciaincreased at an annual rate of 3.8 per cent between 1881 and 1932 (Simpson1995, p. 193).
Logically, the relative share of MHPs in total Spanish agriculturalproduction (including livestock and forestry) also increased considerably.Fruit and horticultural products represented 7.4 per cent of total productionin 1890, but by 1931 the figure was 14 per cent, while productivity haddoubled in the same period.18 The estimations of Simpson also displaya formidable increase in relative weight; in 1897–1901 they accounted for15.9 per cent of final agricultural production (without including the forestrysector), rising to 26.1 per cent in 1929–33.19
Thus, Spain became the main world exporter of MHPs; throughout thefirst third of the twentieth century Spain’s share always exceeded 30 percent of total world exports. In the principal import market for this type ofproducts, the UK, the Spanish position was even more important; at the endof the 1920s it accounted for over 70 per cent of the imports of oranges, tablegrapes, apricots and watermelons, and also had significant shares in otherMHPs (Pinilla and Ayuda 2009, p. 182).
This dominant position was achieved by a truly impressive rise in Spanishexports. In 1930–5 fruit exports were 6,000 per cent higher in volume than in1850–9, nut exports were almost 700 per cent higher and vegetable exportshad increased by 3,000 per cent. Overall, export volumes increased by 1,100
per cent (Table 2). Meanwhile, the faster relative growth of fresh fruit andvegetable exports meant that their share of total MHP exports increased; in1850 fresh fruit represented less than 15 per cent of such exports, but hadrisen to over 60 per cent by 1935 (Table 3).
17 Data from Garrabou (1985) and Grupo de Estudios de Historia Rural (1991).18 Grupo de Estudios de Historia Rural (1983, pp. 243–51).19 Simpson (1994, p. 48).

Taking advantage of globalization 13
Table 2. Evolution of Spanish exports of Mediterranean horticulturalproducts. Volume index (1850–1859 = 100) (1910 prices)
Nuts Dried fruits Fresh fruits Vegetables Total1850–9 100 100 100 100 1001860–9 111 125 167 118 1241870–9 152 212 371 203 2081880–9 150 197 808 341 2561890–9 242 193 1,481 951 3901900–9 338 165 2,895 1,910 6131910–19 410 130 3,235 2,876 6991920–9 530 110 4,610 3,230 9071930–5 689 79 6,285 3,068 1,137
Source: Appendix, Table A1.
Table 3. Breakdown of Spanish exports of Mediterranean horticulturalproducts
Nuts Dried fruits Fresh fruits Vegetables Total% at 1910 prices
1850–9 37.0 47.6 11.5 3.9 1001860–9 33.0 47.8 15.5 3.7 1001870–9 27.1 48.5 20.6 3.9 1001880–9 21.7 36.6 36.4 5.3 1001890–9 23.0 23.6 43.8 9.6 1001900–9 20.4 12.9 54.4 12.3 1001910–19 21.7 8.8 53.3 16.2 1001920–9 21.6 5.8 58.5 14.0 1001930–5 22.4 3.3 63.7 10.6 100
% at current prices1850–9 22.6 59.6 13.8 3.9 1001860–9 24.9 46.5 24.7 3.9 1001870–9 18.0 54.9 24.1 3.0 1001880–9 14.4 35.4 44.4 5.8 1001890–9 18.2 21.1 51.4 9.4 1001900–9 18.8 14.6 55.9 10.7 1001910–19 23.0 9.2 51.5 16.2 1001920–9 20.5 5.9 58.2 15.5 1001930–5 16.6 3.5 69.4 10.6 100
aThe composition of exports for each period has been calculated as an average of the annualcomposition for the corresponding years.Source: Appendix, Tables A1 and A2.
Due to this dramatic expansion, the share of MHPs in total Spanishexports of food, agricultural, livestock and forestry products increasedsubstantially, from less than 15 per cent in 1850–9 to almost 50 per centin 1930–5. Given that exports of agricultural and food products in the latterperiod represented 76.6 per cent of total Spanish exports, there can be no
14 European Review of Economic History
doubt that Mediterranean horticulture was essential to the financing of theimports required by an industrializing country, as Spain was at that time.20
In the long run, Mediterranean horticulture was by far the most dynamicsector of Spanish agriculture, progressively concentrating an increasingvolume of productive factors and making an essential contribution to Spain’sexport trade (Clar and Pinilla 2009).
The importance of this trade is also reflected by the elevated share ofexports in the total production of Spanish MHPs. Oranges were the principalSpanish export product; exports accounted for well over 60 per cent ofdomestic production, a figure which climbed as high as 90 per cent in the1930s. The export share of production was also high for the other principalMHPs.
We now examine more closely the causes of this impressive expansion ofSpanish MHPs, beginning by discussing the most suitable theoretical modelfor the purpose.
4. A theoretical model to explain the growth of SpanishMHP exports
For approximately the last fifty years there has been considerable interestin the estimation of time-series models for foreign trade flows. The mostcommonly used theoretical approach to determine a country’s exports isbased on the assumption that the price-elasticity of supply is infinite (at leastin the long run), given the existence of a horizontal long-run export supplycurve. The majority of empirical studies treat export prices as exogenous andhave therefore focused exclusively on the estimation of demand functions,analysing only export volumes and consumer behaviour. A second commonapproach is to analyse producer behaviour, concentrating on the analysis ofexport prices based on estimates of supply functions. Consequently, fewstudies have utilized export prices and volumes simultaneously (Sawyerand Sprinkle 1999; Strauss 2004). However, whether we examine aggregateexports or the exports of a given product by a single country, it is unrealisticto imagine that volumes can significantly increase without price levels beingaffected, especially if the nation in question accounts for a significant part oftotal world supply.
The simultaneous analysis of export supply and demand was discussed ina seminal paper by Goldstein and Khan (1978), who found strong evidenceof upward-sloping supply curves for eight OECD countries in the period1955–70. However, remarkably few studies have amplified or deepened thispromising start. The updating and perfecting of their work by Strauss (2004)is a notable exception.
20 Pinilla (1995, p. 155).

Taking advantage of globalization 15
Following Goldstein and Khan, and using as the time horizon for ouranalysis the period 1870–1935 (coinciding with what has been called thefirst wave of globalization and with its backlash in the turbulent interwaryears), we have estimated simultaneously a bi-equational supply–demandmultivariate model for Spanish MHP exports.21 This is an innovativeapproach because it combines and takes into account both the demand forand supply of exports in the study of historical problems.22 We also attempt,following O’Rourke and Williamson (2002) and Strauss (2004), to drawan analytical distinction between globalization and the classic variables ofsupply and demand to explain export growth.
This requires treating an increase in exports derived from improvements inthe international division of labour (or greater market integration) separately.The simple export demand model derived from the CES production functioncannot explain all export growth, as it does not contain all of the remainingconditions favouring export volumes from 1870 onwards. Similarly, thesupply of exports as conventionally modelled fails to reflect the impact ofmarket integration.
Trade liberalization boosted exports far beyond what can be captured byproduction figures. Falling transport costs were another factor, and theirstimulation of international trade volumes has been well explained in thetheoretical literature (Krugman 1980).
Thus, our model of the volume of Spanish MHP exports in demandworldwide (XD) will depend on the rest of the world’s income (YW), theexport prices of Spanish MHPs expressed in pesetas (PX), the consumerprices of importing countries, again expressed in Spanish pesetas (PW) and,finally, on two variables that seek to capture the effect of globalization, whichconsists of the evolution in real terms of international maritime transportcosts (FR) and the level of tariff protection existing in international markets(T).
XD = f (YW, P X, PW, FR, T) (1)
where
PW = PW∗.e (2)
The consumer prices of importing countries expressed in pesetas are nationalprices converted to pesetas at the nominal peseta/foreign currency exchangerate.
In this model it is important to know whether the demand for MHPexports is ‘separable’. Separability implies that export demand depends onthe volume of world trade and export prices relative to competitors’ prices.
21 The only reason for not beginning the series in 1850 is the lack of data for certainvariables in the years 1850–69.
22 One of the few applications to be found is Federico (1996).
16 European Review of Economic History
Non-separability implies that export demand depends on world income andthat export prices are relative to the price index for world output. In theformer case, agents decide first of all how much they want to import andonly then do they decide where to obtain the goods; total imports andtheir provenance by country are separated. In the latter case, agents do notdetermine their import decisions in two separate stages. Instead the decisionto import from country i is reached simultaneously with the decision toimport from country j (Beenstock, Lavi and Ribon 1994, pp. 334–5). In ourcase, we consider the hypothesis of non-separability to be the more logical,for three reasons. Firstly, if the level of aggregation for the categories of goodsis defined too narrowly (as in the present case) the separability assumptionis likely to be violated (Goldstein and Khan 1985, p. 1065). Secondly, thehypothesis of non-separability is more realistic when the exporting countryhas a dominant position in international markets and a significant shareof the volume of trade in the corresponding products. As Table 1 shows,this assumption is realistic for the case of Spain in the first third of thetwentieth century and even more so in the second half of the nineteenthcentury. Lastly, from a practical point of view, it would not be possible toconstruct MHP price series for exporting countries competing with Spain forthe entire period under analysis, since the most important of them enteredthe international market after 1900.
Consequently, Spanish MHP exports depended on rising incomes inthe rest of the world and the behaviour of MHP Spanish export pricesrelative to domestic prices in the countries of destination, as well as theopportunities derived from market integration, in turn caused by the firstwave of globalization.
The supply of Spanish MHP exports depended on the relative profitabilityof exporting (RP), an index of Spain’s MHP production capacity (C) andthe impact of globalization via the variables defined above (FR and T).
XS = g(RP, C, FR, T) (3)
where
RP = P X/P (4)
The relative profitability of exporting is defined as the ratio of MHP exportprices (PX) to domestic prices (P).
Exporters allocate output to the domestic and foreign markets accordingto the price signals they receive. This produces an upward export supplycurve and the ensuing argument that a rise in exports depends on thestrength of the export price increase. When absolute levels of exports areestimated, as is the case here, the trade-off between producing more exportsand producing more non-tradable goods is of course weakened by anincrease in the production capacity of the economy (Strauss 2004). Hence,
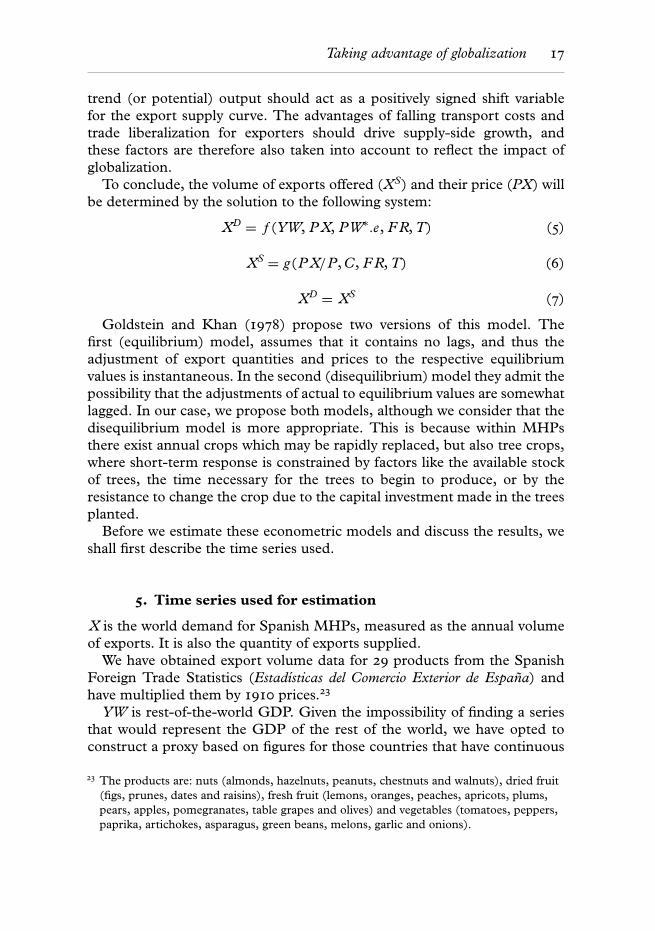
Taking advantage of globalization 17
trend (or potential) output should act as a positively signed shift variablefor the export supply curve. The advantages of falling transport costs andtrade liberalization for exporters should drive supply-side growth, andthese factors are therefore also taken into account to reflect the impact ofglobalization.
To conclude, the volume of exports offered (XS) and their price (PX) willbe determined by the solution to the following system:
XD = f (YW, P X, PW∗.e, FR, T) (5)
XS = g(P X/P, C, FR, T) (6)
XD = XS (7)
Goldstein and Khan (1978) propose two versions of this model. Thefirst (equilibrium) model, assumes that it contains no lags, and thus theadjustment of export quantities and prices to the respective equilibriumvalues is instantaneous. In the second (disequilibrium) model they admit thepossibility that the adjustments of actual to equilibrium values are somewhatlagged. In our case, we propose both models, although we consider that thedisequilibrium model is more appropriate. This is because within MHPsthere exist annual crops which may be rapidly replaced, but also tree crops,where short-term response is constrained by factors like the available stockof trees, the time necessary for the trees to begin to produce, or by theresistance to change the crop due to the capital investment made in the treesplanted.
Before we estimate these econometric models and discuss the results, weshall first describe the time series used.
5. Time series used for estimation
X is the world demand for Spanish MHPs, measured as the annual volumeof exports. It is also the quantity of exports supplied.
We have obtained export volume data for 29 products from the SpanishForeign Trade Statistics (Estadısticas del Comercio Exterior de Espana) andhave multiplied them by 1910 prices.23
YW is rest-of-the-world GDP. Given the impossibility of finding a seriesthat would represent the GDP of the rest of the world, we have opted toconstruct a proxy based on figures for those countries that have continuous
23 The products are: nuts (almonds, hazelnuts, peanuts, chestnuts and walnuts), dried fruit(figs, prunes, dates and raisins), fresh fruit (lemons, oranges, peaches, apricots, plums,pears, apples, pomegranates, table grapes and olives) and vegetables (tomatoes, peppers,paprika, artichokes, asparagus, green beans, melons, garlic and onions).

18 European Review of Economic History
series for the period 1870–1935.24 Thus, our variable is constructed fromthe aggregate GDP of Belgium, Denmark, France, Germany, Sweden,Switzerland, the United Kingdom and the USA. In the present case,this proxy variable may be considered both relevant and representative tomeasure the evolution of income in the countries where MHPs of Spanishorigin were in demand, insofar as these were its main trade partners. Basedon the data in Tena (2006, pp. 614–15), 61.5 per cent of Spanish exports weresent to these countries (not including Denmark, Sweden and Switzerland)between 1850 and 1854. In 1900–4 they accounted for 71.0 per cent and 72.2per cent in 1931–35 (including Denmark, Sweden and Switzerland, whichthree accounted for 4 per cent).
P X is the price index of Spanish horticultural exports; this was obtainedby firstly multiplying our series of 29 products at current values by an indexobtained from Tena (2006, pp. 600–1), to correct the deviation of officialfrom real values, as estimated by that author. Finally, we divided the series ofcurrent MHP values adjusted through the Tena index by the series of MHPexports by volume at 1910 prices.
PW is the French–UK consumer price index as a proxy of consumer pricesfor importing countries.25
FR is a real-terms index of the evolution of international maritimetransport prices, taken from Isserlis (1938).26
T is a simple arithmetic mean of tariff protection in eight industrializednations27 which were of enormous importance to Spanish exports. Basedon the data in Tena (2006, pp. 614–15), 60.8 per cent of Spanish exportswere sent to these countries (not including Denmark, Sweden, Norway andCanada) between 1850 and 1854. In 1900–4 they accounted for 63.8 per cent
24 We have used Maddison’s (2001) data.25 We have used the arithmetic mean of the French and UK consumer prices indices
(Mitchell 2003) as a proxy variable of the weighted average of the consumer prices indicesof all Spain’s trading partners. It must be emphasized that between 1850 and 1913 thesetwo countries accounted for, depending on the year in question, a minimum of 46.3 percent and a maximum of 68.1 per cent of total Spanish exports (Prados de la Escosura1982, p. 48).
26 We have opted for this series rather than the one recently published by Mohammed andWilliamson (2004) because it provides annual rather than five-yearly figures. The latterstudy does not contain a specific subseries for trade between Great Britain and thewestern Mediterranean. Nevertheless, what we have used appears to be fairlyrepresentative of this trade. Of those presented by Mohammed and Williamson (2004),the most appropriate are those titled ‘Western Mediterranean’ and ‘Coal to Genoa’.Neither of the two is complete for the period under analysis, 1869–1935; however, theirproximity to the series employed is high. Thus, for the years available the correlationcoefficients between the Isserlis series employed and ‘Western Mediterranean’ and ‘Coalto Genoa’ are 0.97 (1882–1936) and 0.96 (1869–13), respectively.
27 These are the United States, Canada, France, the United Kingdom, Germany, Norway,Sweden and Denmark.
Taking advantage of globalization 19
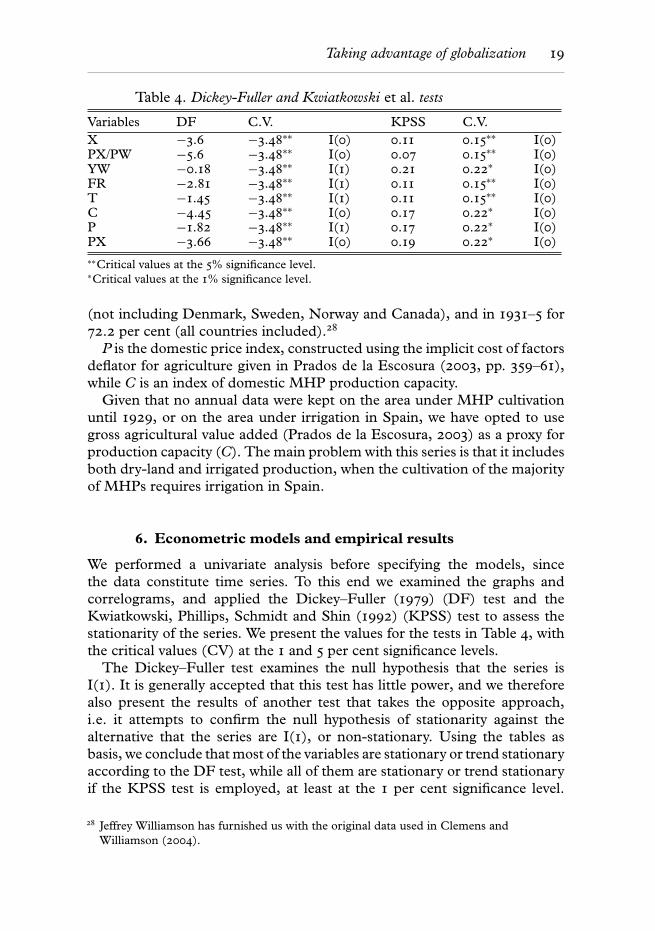
Table 4. Dickey-Fuller and Kwiatkowski et al. tests
Variables DF C.V. KPSS C.V.X −3.6 −3.48∗∗ I(0) 0.11 0.15∗∗ I(0)PX/PW −5.6 −3.48∗∗ I(0) 0.07 0.15∗∗ I(0)YW −0.18 −3.48∗∗ I(1) 0.21 0.22∗ I(0)FR −2.81 −3.48∗∗ I(1) 0.11 0.15∗∗ I(0)T −1.45 −3.48∗∗ I(1) 0.11 0.15∗∗ I(0)C −4.45 −3.48∗∗ I(0) 0.17 0.22∗ I(0)P −1.82 −3.48∗∗ I(1) 0.17 0.22∗ I(0)PX −3.66 −3.48∗∗ I(0) 0.19 0.22∗ I(0)∗∗Critical values at the 5% significance level.∗Critical values at the 1% significance level.
(not including Denmark, Sweden, Norway and Canada), and in 1931–5 for72.2 per cent (all countries included).28
P is the domestic price index, constructed using the implicit cost of factorsdeflator for agriculture given in Prados de la Escosura (2003, pp. 359–61),while C is an index of domestic MHP production capacity.
Given that no annual data were kept on the area under MHP cultivationuntil 1929, or on the area under irrigation in Spain, we have opted to usegross agricultural value added (Prados de la Escosura, 2003) as a proxy forproduction capacity (C). The main problem with this series is that it includesboth dry-land and irrigated production, when the cultivation of the majorityof MHPs requires irrigation in Spain.
6. Econometric models and empirical results
We performed a univariate analysis before specifying the models, sincethe data constitute time series. To this end we examined the graphs andcorrelograms, and applied the Dickey–Fuller (1979) (DF) test and theKwiatkowski, Phillips, Schmidt and Shin (1992) (KPSS) test to assess thestationarity of the series. We present the values for the tests in Table 4, withthe critical values (CV) at the 1 and 5 per cent significance levels.
The Dickey–Fuller test examines the null hypothesis that the series isI(1). It is generally accepted that this test has little power, and we thereforealso present the results of another test that takes the opposite approach,i.e. it attempts to confirm the null hypothesis of stationarity against thealternative that the series are I(1), or non-stationary. Using the tables asbasis, we conclude that most of the variables are stationary or trend stationaryaccording to the DF test, while all of them are stationary or trend stationaryif the KPSS test is employed, at least at the 1 per cent significance level.
28 Jeffrey Williamson has furnished us with the original data used in Clemens andWilliamson (2004).
20 European Review of Economic History
Thus, we specify the models considering that all the variables are stationaryor trend stationary, and in order to ensure the specification is correct wetest whether the residuals of the proposed models are also stationary. Themodels are specified as follows:
(a) Equilibrium model.
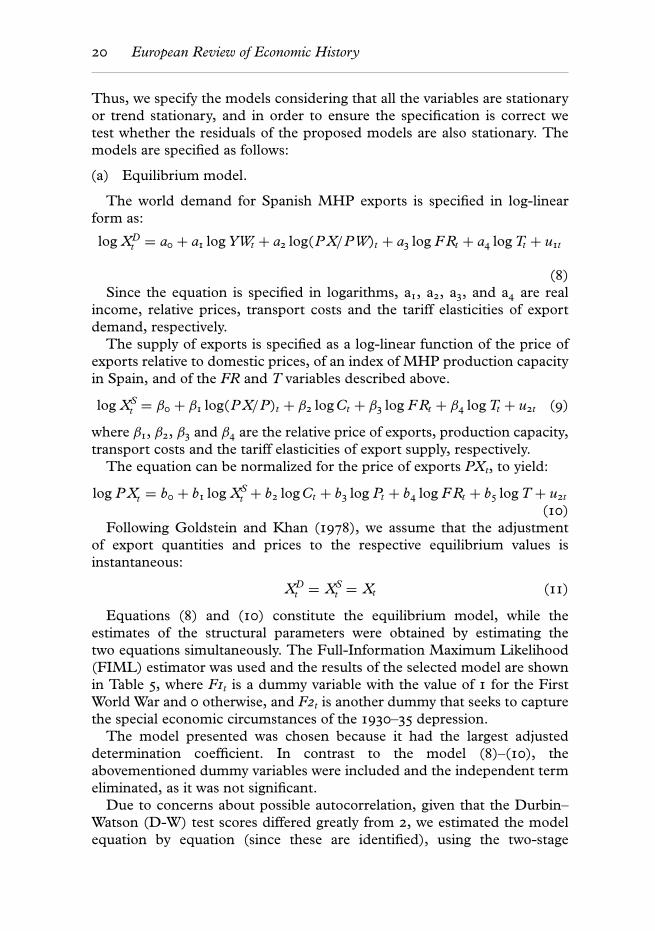
The world demand for Spanish MHP exports is specified in log-linearform as:
log XDt = a0 + a1 log YWt + a2 log(P X/PW)t + a3 log FRt + a4 log Tt + u1t
(8)Since the equation is specified in logarithms, a1, a2, a3, and a4 are real
income, relative prices, transport costs and the tariff elasticities of exportdemand, respectively.
The supply of exports is specified as a log-linear function of the price ofexports relative to domestic prices, of an index of MHP production capacityin Spain, and of the FR and T variables described above.
log XSt = β0 + β1 log(P X/P)t + β2 log Ct + β3 log FRt + β4 log Tt + u2t (9)
where β1, β2, β3 and β4 are the relative price of exports, production capacity,transport costs and the tariff elasticities of export supply, respectively.
The equation can be normalized for the price of exports PXt, to yield:
log P Xt = b0 + b1 log XSt + b2 log Ct + b3 log Pt + b4 log FRt + b5 log T + u2t
(10)Following Goldstein and Khan (1978), we assume that the adjustment
of export quantities and prices to the respective equilibrium values isinstantaneous:
XDt = XS
t = Xt (11)
Equations (8) and (10) constitute the equilibrium model, while theestimates of the structural parameters were obtained by estimating thetwo equations simultaneously. The Full-Information Maximum Likelihood(FIML) estimator was used and the results of the selected model are shownin Table 5, where F1t is a dummy variable with the value of 1 for the FirstWorld War and 0 otherwise, and F2t is another dummy that seeks to capturethe special economic circumstances of the 1930–35 depression.
The model presented was chosen because it had the largest adjusteddetermination coefficient. In contrast to the model (8)–(10), theabovementioned dummy variables were included and the independent termeliminated, as it was not significant.
Due to concerns about possible autocorrelation, given that the Durbin–Watson (D-W) test scores differed greatly from 2, we estimated the modelequation by equation (since these are identified), using the two-stage

Taking advantage of globalization 21
Table 5. FIML estimates of the equilibrium model
log Xt = −0.22(−1.56)
log(PX/PXW )t + 1.31(41.95)
log YW t
− 0.08(−2.47)
log FRt − 0.21(−4.96)
log Tt − 0.18(−1.91)
F1t + 0.13(1.75)
F2t
R2 = 0.98 R2 = 0.98 S.E. = 0.10 DW = 1.5
ADF(res) = −6.48[0.00] KPSS(res) = 0.08[0.46]
log P Xt = 0.29(3.20)
log Xt + 0.51(2.86)
log Pt − 0.17(−0.73)
log Ct + 0.28(3.58)
log F Rt
+ 0.06(0.58)
log Tt − 0.55(−4.27)
F1t + 0.17(2.00)
F2t
R2 = 0.82 R2 = 0.81 S.E. = 0.15 DW = 1.3
ADF(res) = −6.53[0.00] KPSS(res) = 0.06[0.46]
t-ratios in brackets and critical values at the 5% significance level in squarebrackets. ADF(res) is the Augmented Dickey-Fuller test applied to themodel’s residuals.KPSS(res) is the Kwiatkowski et al. (1992) test for stationarity in themodel’s residuals.
Table 6. Estimated supply and demand export elasticities (FIML).Equilibrium model
Demand elasticity Supply elasticity
a1 = −0.22 (PX/PW) (−1.56) β1 = 3.44a (PX/P) (3.22)a2 =1.30a (YW) (41.95) β2 = 0.58 (C) (0.85)a3 =−0.08a (FR) (−2.47) β3 = −0.96a (FR) (−2.82)a4 =−0.21a (T) (−4.96) β4 = −0.20 (T) (−0.6)aSignificant at the 5% significance level.t-ratios in brackets.
least squares method (TSLS). The Breusch–Godfrey tests were appliedin search of potential autocorrelation problems and the White test forpossible heteroskedasticity. As a result, we were able to conclude that thedemand equation does not display autocorrelation and is homoskedastic ata significance level of 5 per cent. The same conclusion was obtained for thesupply equation, except that we found certain autocorrelation problems at a5 per cent significance level; however, no autocorrelation problems wereapparent at a significance level of 1 per cent. Consequently, the FIMLestimation presented may be considered as adequate.
Table 6 presents the FIML estimation of the export elasticities of supplyand demand.
In the demand function, all of the elasticities display the expected sign,although the price variable is not significant at a level of 5 per cent. In the

22 European Review of Economic History
supply function, the elasticities display the expected sign, but the variablesmeasuring production capacity (C) and tariff protection (T) variables werenot significant, even at a level of 10 per cent.
While both seem to be reasonably well specified, judging by the value of theR-squares obtained, the fit of the supply equation is somewhat poorer thanthat of the demand equation. The estimated models have no spurious relationbecause the tests to detect the possible non-stationarity of the residuals(ADF(res) and KPSS(res)) confirm the stationarity of the residuals in all themodels.
(b) Disequilibrium model
In order to include the possibility of disequilibrium behaviour in the model,exports are assumed to adjust to the difference between demand in period tand the actual flow in the previous period:
� log Xt = γ[log Xd
t − log Xt−1
], γ > 0 (12)
where γ is the coefficient of adjustment assumed to be positive, �logXt =logXt − logXt−1.
By substituting equation (8) for (12) we obtain:
log Xt = c0 + c1 log YWt + c2 log(P X/PW)t + c3 log FRt
+c4 log Tt + c5 log Xt−1 + u1t (13)
Since the quantity of exports is specified as adjusting to excess demand,export prices adjust to conditions of excess supply:
logP Xt = λ[logXt − logXs
t
], λ > 0 (14)
where λ is the adjustment coefficient.Substituting equation (9) for (14) and solving for log P Xt we obtain:
log P Xt = d0 + d1 log XSt + d2 log Ct + d3 log Pt + d4 log FRt
+d5 log T + d6 log P Xt−1 + u2t (15)
Equations (13) and (15) constitute the disequilibrium model, and theestimates of the structural parameters were obtained by estimating thetwo simultaneously. The Full-Information Maximum Likelihood (FIML)estimator was used and the results of the selected model are as shown inTable 7.
The coefficient of lagged exports is significantly different from zero,implying a dynamic adjustment. The mean time lag for the adjustment ofexports to changes in the independent variables is estimated at approximately1.4 years (1/γ ), on average for all products. This result is merely anapproximation, since the lag acts as a weighted average of products withlong lags (tree crops) and products with no lags (yearly crops). In this modelwe utilize an adjustment mechanism in which demand imbalances lead

Taking advantage of globalization 23
Table 7. FIML estimates of the disequilibrium model
log Xt = −0.27(−1.46)
log(P X/P XW)t + 0.96(5.19)
log YWt − 0.05(−1.21)
log F Rt+
− 0.18(−3.43)
log Tt − 0.22(−2.32)
F1t + 0.28(2.06)
log Xt−1
γ = 0.72(5.31)
∗; a1 = −0.38(−1.68)
; a2 = 1.33∗(30.24)
; a3 = −0.07(−1.36)
; a4 = −0.25∗(−3.99)
;
R2 = 0.98 R2 = 0.97 S.E. = 0.09 D − W = 1.97
ADF(res) = −7.90[0.00] KPSS(res) = 0.13[0.46]
log P Xt = 0.18(2.31)
log Xt + 0.21(1.17)
log Pt − 0.02(−0.07)
log Ct + 0.20(2.41)
log F Rt
− 0.04(−0.33)
log Tt − 0.40(−3.09)
F1t + 0.45(4.33)
log P Xt−1
λ = 0.41∗(1.79)
; β1 = 2.98∗(2.64)
; β2 = 0.04(0.07)
; β3 = −0.41 ∗ ∗(−1.91)
; β4 = 0.11(0.27)
;
R2 = 0.88 R2 = 0.87 S.E. = 0.13 D − W = 1.77
ADF(res) = −7.83[0.00] KPSS(res) = 0.08[0.46]
∗Significant at the 5% significance level.∗∗Significant at the 10% significance level.t-ratios in brackets and critical values at the 5% significance level in squarebrackets. ADF(res) is the Augmented Dickey–Fuller test applied to the model’sresiduals. KPSS(res) is the Kwiatkowski et al. (1992) test for stationarity in themodel’s residuals.
exclusively to a change in export volumes; supply imbalances are correctedonly by price adjustments (Strauss 2004, p. 39). We may assume that in thecase under analysis Spain was capable of satisfying excess demand withoutraising prices. Adjustment in the case of tree crops was complicated, sincethe time lags between the decision whether to plant trees and to attempt toincrease or decrease production each year via watering, fertilizers or caringfor the trees in general are clearly different.
Having identified the equations, we estimated the model equationby equation using the TSLS method, in search of problems ofpossible autocorrelation and/or heteroscedasticity. The Breusch–Godfreytest detected autocorrelation problems in both equations, even at the 1
per cent significance level, and thus we present the TSLS estimationsof the disequilibrium model, corrected for the autocorrelation observed(Table 8). As in the models estimated using FIML, we present the ADF(res)and KPSS(res) tests, concluding that these relations are not spurious.
Table 9 presents the TSLS estimated export elasticities of supply anddemand.

24 European Review of Economic History
Table 8. TSLS estimates of the disequilibrium model
log Xt = −0.34(−1.23)
log(PX/PXW )t + 1.03(2.99)
log YWt − 0.05(−1.31)
log F Rt+
− 0.19(−2.65)
log Tt − 0.25(−2.31)
F1t + 0.23(0.89)
log Xt−1 + 0.05(0.15)
u1t−1
γ = 0.77(3.08)
∗; a1 = −0.44(−1.29)
; a2 = 1.33∗(38.07)
; a3 = −0.07(−1.62)
; a4 = −0.26∗(−4.46)
;
R2 = 0.97 R2 = 0.97 S.E. = 0.10 D − W = 1.96
ADF(res) = −7.82[0.00] KPSS(res) = 0.08[0.46]
log P Xt = 0.19(2.73)
log Xt + 0.15(0.92)
log Pt − 0.14(−0.73)
log Ct + 0.24(3.73)
log F Rt
+ 0.03(0.32)
log Tt − 0.40(−4.15)
F1t + 0.51(3.59)
log P Xt−1 + 0.01(0.07)
u2t−1
λ = 0.37∗(2.82)
; β1 = 2.57∗(3.38)
; β2 = 0.43(0.74)
; β3 = −0.53 ∗ ∗(−1.92)
; β4 = −0.08(−0.37)
;
R2 = 0.89 R2 = 0.88 S.E. = 0.12 D − W = 1.97
ADF(res) = −7.82[0.00] KPSS(res) = 0.06[0.46]
∗Significant at the 5% significance level. ∗∗ Significant at the 10% significancelevel; u1t are the residuals of the demand equation, u2t are the residuals of thesupply equation. t-ratios in brackets and critical values at the 5% significancelevel in square brackets. ADF(res) is the Augmented Dickey–Fuller test appliedto the model’s residuals. KPSS(res) is the Kwiatkowski et al. (1992) test forstationarity in the model’s residuals.
Table 9. Estimated supply and demand export elasticities (TSLS).Disequilibrium model
Demand elasticity Supply elasticity
a1 = −0.44 (PX/PW) (−1.29) β1 = 2.57 a (PX/P) (3.38)a2 =1.33a (YW) (38.07) β2 = 0.43 (C) (0.74)a3 =−0.07 b (FR) (−1.62) β3 = −0.53 b (FR) (−1.91)a4 =−0.26 a (T) (−4.46) β4 = −0.08 (T) (−0.36)
aSignificant at the 5% significance level. b Significant at the 10% significance level. t-ratios inbrackets.
In any event, the results regarding elasticities are similar whichever esti-mation method is used. In the export demand function all of the coefficients(except relative prices) display the expected sign and are significant.
In the export supply function, the coefficients also take the expectedsign, but C and T are not significant. However, if these are eliminated, theresults for the remaining coefficients hardly vary and the selection criteria formodels, such as the R2, worsened. Consequently, we have opted to presentthe model with all its variables. As we explain in the section in which the series

Taking advantage of globalization 25
utilized are discussed, those employed for both C and T are approximations,since in the first case the data are not available and in the second theyare general protection levels, as more specific series were not at ourdisposal.
From an econometric point of view it is not clear which version of themodel (equilibrium or disequilibrium) is superior. Based on conventionalstatistics, such as the adjusted determination coefficient, both models aresimilar and display similar goodness-of-fit. Nevertheless, in our view thedisequilibrium model approximates reality much more closely. Tree cropsformed a considerable part of Spanish MHP exports, and short-termresponse was therefore limited. As a result, we shall restrict our commentsto the results of the disequilibrium model.
The results clearly reflect the importance for export growth of risingincomes in the world’s most developed countries (Spain’s main tradingpartners), with an income elasticity of 1.33 and significance at 5 per cent.This coefficient, and that of price (although the latter is not significant), arewithin the habitual range of the results obtained in the abundant empiricalliterature.29
In a previous section we emphasized that the shift in the demand curve isinsufficient to explain the rapid response of supply. It must be rememberedthat quite apart from establishing a new system of specialized agriculture,it was also necessary to overcome the scarcity of water, the main obstacleto this type of agriculture in Spain. This formidable production effort wasthe cause of the supply-side response, and it was reflected in the increasingshare of Mediterranean horticulture in Spanish agricultural production as awhole. In our view, the explanation lies in the high returns earned, comparedto traditional products.30 The high elasticity of supply with respect to relativeprofitability (2.57) clearly shows the importance of changes in this variablefor the evolution of supply.
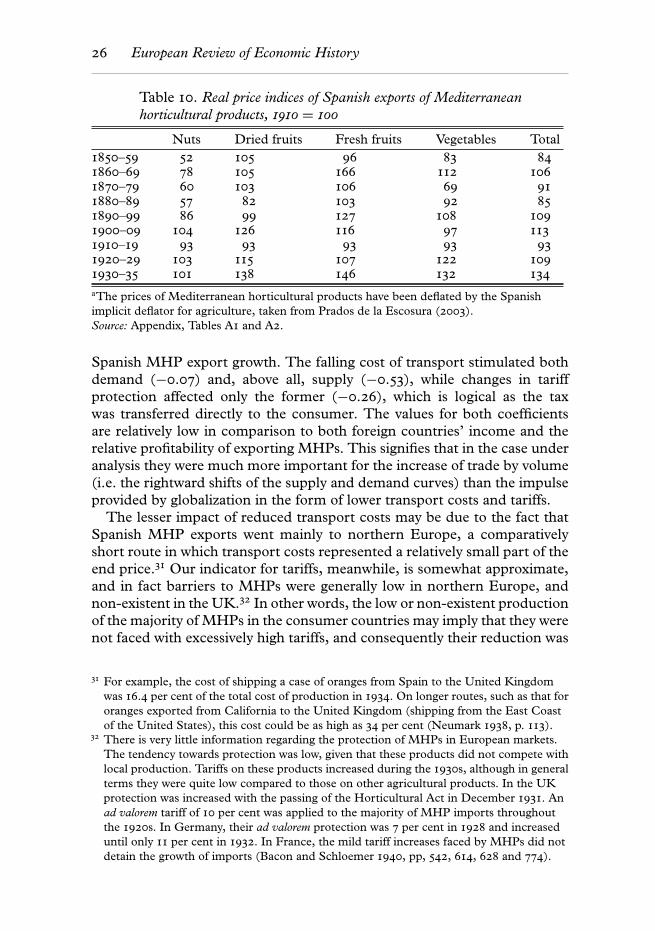
The behaviour of MHP export prices shows how they stimulated supply-side growth. Until the First World War, the weighted prices index for Spanishhorticultural exports rose 13 per cent faster than the Spanish implicit deflatorfor agriculture (Table 10). Furthermore, price recovery from the fall causedby the First World War was swift, and their behaviour during the Depressionof the 1930s was outstanding.
Finally, the two variables we have used to approximate increasing marketintegration (transport costs and tariff protection) also clearly stimulated
29 The estimated income elasticities of demand generally fall within the range of 1 to 2 andthe estimated price elasticities of demand range from 0 to –1. For agricultural products,the most habitual range for the estimated income elasticities of demand is between 0.5and 1.5 (Sawyer and Sprinkle 1999, pp. 119–71).
30 For example, the return per hectare in the Valencia orange groves was 248 per cent higherthan the all-crop average in 1881, and approximately 200 per cent higher than the returnon any other irrigation-based product (Roncales 1998, pp. 186–97).
26 European Review of Economic History
Table 10. Real price indices of Spanish exports of Mediterraneanhorticultural products, 1910 = 100
Nuts Dried fruits Fresh fruits Vegetables Total1850–59 52 105 96 83 841860–69 78 105 166 112 1061870–79 60 103 106 69 911880–89 57 82 103 92 851890–99 86 99 127 108 1091900–09 104 126 116 97 1131910–19 93 93 93 93 931920–29 103 115 107 122 1091930–35 101 138 146 132 134
aThe prices of Mediterranean horticultural products have been deflated by the Spanishimplicit deflator for agriculture, taken from Prados de la Escosura (2003).Source: Appendix, Tables A1 and A2.
Spanish MHP export growth. The falling cost of transport stimulated bothdemand (−0.07) and, above all, supply (−0.53), while changes in tariffprotection affected only the former (−0.26), which is logical as the taxwas transferred directly to the consumer. The values for both coefficientsare relatively low in comparison to both foreign countries’ income and therelative profitability of exporting MHPs. This signifies that in the case underanalysis they were much more important for the increase of trade by volume(i.e. the rightward shifts of the supply and demand curves) than the impulseprovided by globalization in the form of lower transport costs and tariffs.
The lesser impact of reduced transport costs may be due to the fact thatSpanish MHP exports went mainly to northern Europe, a comparativelyshort route in which transport costs represented a relatively small part of theend price.31 Our indicator for tariffs, meanwhile, is somewhat approximate,and in fact barriers to MHPs were generally low in northern Europe, andnon-existent in the UK.32 In other words, the low or non-existent productionof the majority of MHPs in the consumer countries may imply that they werenot faced with excessively high tariffs, and consequently their reduction was
31 For example, the cost of shipping a case of oranges from Spain to the United Kingdomwas 16.4 per cent of the total cost of production in 1934. On longer routes, such as that fororanges exported from California to the United Kingdom (shipping from the East Coastof the United States), this cost could be as high as 34 per cent (Neumark 1938, p. 113).
32 There is very little information regarding the protection of MHPs in European markets.The tendency towards protection was low, given that these products did not compete withlocal production. Tariffs on these products increased during the 1930s, although in generalterms they were quite low compared to those on other agricultural products. In the UKprotection was increased with the passing of the Horticultural Act in December 1931. Anad valorem tariff of 10 per cent was applied to the majority of MHP imports throughoutthe 1920s. In Germany, their ad valorem protection was 7 per cent in 1928 and increaseduntil only 11 per cent in 1932. In France, the mild tariff increases faced by MHPs did notdetain the growth of imports (Bacon and Schloemer 1940, pp, 542, 614, 628 and 774).
Taking advantage of globalization 27
not such a decisive factor in this case. The exception to this general rule is theUSA, which since the end of the nineteenth century had strongly protectedsuch products, thereby seriously limiting European exports.33
Regarding transport costs and tariffs, it was also decisive that the periodunder analysis covered not only the years of enormous trade expansion inthe first wave of globalization, but also the stagnation of the interwar period.Insofar as this stagnation was produced essentially by rising trade costs,which the increase in output could only compensate for (Jacks, Meissnerand Novy 2009), it is reasonable to assume that it affects our result. Thus,the expansion of Spanish MHP exports in the interwar period was veryimportant in a context of trade stagnation, but was no longer able totake advantage of trade cost reductions. On the contrary, this expansionof exports took place between 1914 and 1935, despite sharp rises in transportcosts and strong protectionism surrounding commercial exchanges. In thissame period, however, the prices of Spanish MHPs displayed notably betterbehaviour than those of other agricultural products.
7. Concluding remarks: taking advantage of globalization?
From the mid nineteenth century onwards the nascent processes ofindustrialization and globalization of the world’s economies had importantconsequences; these have come to be regarded as a priority area for researchin economic history. In this article, we have focused on their impact upontrade in Mediterranean horticultural products.
Firstly, we have shown how the countries lying on the northern shoreof the Mediterranean seized the opportunity (provided by the sharpincrease in the industrialized countries’ demand for MHPs) to increasetheir production and exports; this demand signal was particularly strongin the case of the United Kingdom. By the closing years of the nineteenthcentury, the producer countries were solidly positioned in the internationalmarkets for MHPs. However, they would gradually be threatened bythe globalization of production that resulted from rising consumption. Itwas, above all, Californian agriculture (with its modern technology andinnovative marketing) that posed the greatest challenge to the Europeanproducers. While the traditional producers lost large swathes of the NorthAmerican market, partly due to protectionist trade barriers, they neverthelessmaintained strong positions in their remaining markets, ensuring thatMediterranean horticulture remained a source of agricultural progress andgrowth. Despite globalization, however, it was impossible to increase exportsto the US market. Spanish MHP exporters’ inability to gain more than alimited presence in the world’s most dynamic market was undoubtedly a
33 Ad valorem tariffs in excess of 60 per cent were common in the USA for the majority ofMHPs (Olmstead and Rhode 1995). On this topic, see Pinilla and Ayuda (2009).

28 European Review of Economic History
significant cost, as we have argued, in terms of both lost opportunities andthe impact of increasing US production on prices (Morilla, Olmstead andRhode 1999).
Spain took advantage of rising demand in the industrialized countries toexpand its Mediterranean horticultural production, which was by far themost dynamic sector of its agriculture until the outbreak of the SecondWorld War. MHP exports also increased very significantly, to the extentthat they became one of the pillars of Spanish foreign trade. Thus, we haveseen how in the second half of the nineteenth century a new and dynamicagriculture developed, specializing in MHPs. Competition from Californiadid not halt this expansion, which continued throughout the first third ofthe twentieth century, and Spanish MHP exports enjoyed truly spectaculargrowth between 1850 and 1936.
The primary objective of the present study is to contribute to the empiricalliterature on the factors determining the expansion of trade in agriculturalproducts and food in the first wave of globalization. We have used Spain asa case study to shed light on this question.
In order to achieve our objective, we have estimated simultaneously a bi-equational supply–demand model, using data for Spanish MHP exports inthe period 1870–1935. The results clearly reflect the primacy of rightwardshifts in the supply and demand curves in explaining the growth of MHPtrade by volume. Thus, both rising incomes in the more developed countriesand technological change in agriculture specializing in these products werekey to the growth of this trade. Meanwhile, Spanish exporters also benefitedfrom the increasing integration of international markets, especially throughdeclining transport costs and, to a lesser extent, trade liberalization.
Acknowledgments
We are particularly indebted to Peter H. Lindert, Alan L. Olmstead, the AgriculturalHistory Centre, the Department of Economics and the Institute of GovernmentalAffairs of the University of California, Davis. Jeffrey G. Williamson generouslyshared with us his data on transport costs and tariff protection. We are also indebtedto Antonio Aznar, Gema Aparicio, Fernando Collantes, Riitta Hjerppe, HakonLobell, Pilar Nogues, Matti Peltonen, Paul Rhode and Marcela Sabate. Previousversions have been read and commented on by the editors, two anonymous referees,Salvador Calatayud, Domingo Gallego, Michael Kopsidis, Jacob Metzer, Alan L.Olmstead, Dulce Saura, the participants in the Economic History Seminars atthe Universities of Barcelona, Valencia and Zaragoza, the 5th European HistoricalEconomics Society Conference, the All-University of California Group in EconomicHistory Conference ‘Agricultural Development in Economic History’ and theEuropean Cost A-35 Project ‘Progressore’ Conference on ‘The impact of marketson the management of rural land’. We are grateful for finance from the SpanishDepartment of Education and Science, Project SEJ 2005-077556, the SpanishDepartment of Science and Innovation, Projects ECO2009-07796 and ECO2009-07936, and the Department of Science, Technology and Universities of the

Taking advantage of globalization 29
Government of Aragon, excellence research group for ‘Agri-food Economic History’and research group ‘Econometric Model Selection’.
References
APARICIO, G., PINILLA, V. and SERRANO, R. (2009). Europe and the internationalagricultural and food trade, 1870–2000. In P. Lains and V. Pinilla (eds.),Agriculture and Economic Development in Europe since 1870. London: Routledge,pp. 52–75.
BACON, L. B. and SCHLOEMER, F. C. (1940). World Trade in Agricultural Products.Its Growth; Its Crisis; and the New Trade Policies. Rome: International Institute ofAgriculture.
BEENSTOCK, M., LAVI, Y. and RIBON, S. (1994). The supply and demand forexports in Israel. Journal of Development Economics 44, pp. 333–50.
CALATAYUD, S. and MARTINEZ-CARRION, J. M. (1999). El cambio tecnico en lossistemas de captacion e impulsion de aguas subterraneas para riego en la EspanaMediterranea. In R. Garrabou and J. M. Naredo (eds.), El agua en los sistemasagrarios: una perspectiva historica. Madrid: Fundacion Argentaria, pp. 15–40.
CLAR, E. and PINILLA, V. (2009). The contribution of agriculture to Spanisheconomic development, 1870–1973. In P. Lains and V. Pinilla (eds.), Agricultureand Economic Development in Europe since 1870. London: Routledge, pp. 311–32.
CLEMENS, M. A. and WILLIAMSON, J. G. (2004). Why did the tariff-growthcorrelation change after 1950? Journal of Economic Growth 9, pp. 5–46.
DICKEY, D. A. and FULLER, W. A. (1979). Distribution of the estimators forautoregressive time series with a unit root. Journal of the American StatisticalAssociation 74, pp. 427–31.
DUNLEVY, J. A. and HUTCHINSON, W. K. (1999). The impact of immigration onAmerican import trade in the late nineteenth and early twentieth centuries.Journal of Economic History 59(4), pp. 1043–62.
ESTEVADEORDAL, A., FRANTZ, B. and TAYLOR, A. M. (2003). The rise and fall ofworld trade, 1870–1939. Quarterly Journal of Economics 118(2), pp. 359–407.
FEDERICO, G. (1991a). Oltre Frontiera: L’Italia nel mercato agricolointernazionale. In P. Bevilacqua (ed), Storia dell’agricoltura italiana in etacontemporanea, vol. III: Mercati e istituzioni. Venice: Marsilio Editor, pp. 189–222.
FEDERICO, G. (1991b). El comercio exterior de los paıses mediterraneos en el sigloXIX. In L. Prados de la Escosura and V. Zamagni (eds.), El desarrollo Economicoen la Europa del Sur: Espana e Italia en Perspectiva Historica. Madrid: AlianzaEditorial, pp. 269–92.
FEDERICO, G. (1996). An econometric model of world silk production, 1870–1914.Explorations in Economic History 33(2), pp. 250–74.
FEDERICO, G. and PERSSON, K. G. (2007). Market integration and convergence inthe world wheat market, 1800–2000. In T. J. Hatton, K. O. O’Rourke and A.Taylor (eds.), The New Comparative Economic History: Essays in Honor of JeffreyG. Williamson. Cambridge, MA: MIT Press, pp. 87–113.
FINDLAY, R. and O’ROURKE, K. H. (2003). Commodity market integration,1500–2000. In M. D. Bordo, A. M. Taylor and J. G. Williamson (eds),Globalization in Historical Perspective. Chicago: University of Chicago Press,pp. 13–64.
30 European Review of Economic History
FINDLAY, R. and O’ROURKE, K. H. (2007). Power and Plenty: Trade, War, and theWorld Economy in the Second Millennium. Princeton: Princeton University Press.
FRAILE, P. (1992). Los mercados del centro y las economıas atrasadas de Europa,1900–1930. In L. Prados de la Escosura and V. Zamagni (eds.), El desarrolloeconomico en la Europa del sur: Espana e Italia en perspectiva historica. Madrid:Alianza Editorial, pp. 253–68.
GARRABOU, R. (1985). Un fals dilema: modernitat o endarreriment de l’agriculturavalenciana, 1850–1900. Valencia: Instituticio Alfons el Magnanim.
GARRIDO, S. (2007). ‘The Anticalifornia’: family, farming, prices, and qualityproduct in the Spanish citrus industry (1840–1936). Working Paper AsociacionEspanola de Historia Economica DT 0701.
GOLDSTEIN, M. and KHAN, M. S. (1978). The supply and demand for exports: asimultaneous approach. Review of Economics and Statistics 60(2), pp. 275–86.
GOLDSTEIN, M. and KHAN, M. S. (1985). Income and price effects in foreigntrade. In R.W. Jones and P. B. Kenen (eds.), Handbook of InternationalEconomics, vol. II. Amsterdam: Elsevier, pp. 1041–1105.
Grupo de Estudios de Historia Rural (1983). Notas sobre la produccion agrariaespanola, 1891–1931. Revista de Historia Economica 1(2), pp. 185–252.
Grupo de Estudios de Historia Rural (1991). Estadısticas historicas de la produccionagraria Espanola, 1850–1935. Madrid: Ministerio de Agricultura.
HARLEY, C. K. (1986). Late nineteenth century transportation, trade andsettlement. In W. Fisher, R. M. McInnis and J. Schneider (eds.), The Emergenceof a World Economy, 1500–1914, part II, 1850–1914. Wiesbaden: Franz SteinerVerlag, 593–618.
International Institute of Agriculture (1909–39). Annuaire International deStatistique Agricole. Rome.
IRWIN, D. A. (2002). Long-run trends in world trade and income. World TradeReview, 1(1), pp. 89–100.
ISSERLIS, L. (1938). Tramp shipping, cargoes and freights. Journal of the RoyalStatistical Society 101, pp. 53–146.
JACKS, D. J. (2005). Immigrant stocks and trade flows, 1870–1913. Journal ofEuropean Economic History 34(3), pp. 625–49.
JACKS, D. J. (2006). What drove 19th century commodity market integration?Explorations in Economic History 43, pp. 383–412.
JACKS, D. J., MEISSNER, C. M. and NOVY, D. (2008). Trade costs, 1870–2000.American Economic Review 98(2), 529–34.
JACKS, D. J., MEISSNER, C. M. and NOVY, D. (2009). Trade booms, trade boostsand trade costs. NBER Working Paper 15267.
JACKS, D. J. and PENDAKUR, K. (2008). Global trade and the maritime transportrevolution. NBER Working Paper 14139.
KRUGMAN, P. (1980). Scale economies, product differentiation and the pattern oftrade. American Economic Review 70(5), pp. 950–9.
KWIATKOWSKI, D., PHILLIPS, P. C. B., SCHMIDT, P. and SHIN, Y. (1992). Testingthe null hipotesis of stationarity against the alternative of a unit root. Journal ofEconometrics 54(1–3), pp. 159–78.
LOPEZ-CORDOVA, J. E. and MEISNNER, C. M. (2003). Exchange-rate regimes andinternational trade: evidence from the classical gold standard era. AmericanEconomic Review 93(1), pp. 344–54.

Taking advantage of globalization 31
MADDISON, A. (1991). Dynamic Forces in Economic Development. Oxford: OxfordUniversity Press.
MADDISON, A. (2001). The World Economy: A Millennial Perspective. Paris: OECD.MITCHELL, B. R. (2003). International Historical Statistics. Europe, 1750–2000.
London: Macmillan.MITCHELL, B. R. (2003). International Historical Statistics: The Americas, 1750–2000.
Basingstoke: Macmillan.MITCHENER, C. and WEIDENMIER, M. (2008). Trade and empire. Economic
Journal 533, pp. 1805–34.MOHAMMED, S. I. S and WILLIAMSON, J. G. (2004). Freight rates and
productivity gains in British tramp shipping 1869–1959. Explorations in EconomicHistory 41, pp. 172–203.
MORILLA, J., OLMSTEAD, A. L. and RHODE, P. W. (1999). ‘Horn of plenty’: theglobalization of Mediterranean horticulture and the economic development ofsouthern Europe, 1880–1930. Journal of Economic History 59(2), pp. 316–52.
MORILLA, J., OLMSTEAD, A. L. and RHODE, P. W. (2000). Internationalcompetition and the development of the dried-fruit industry, 1880–1930. In S.Pamuk and J. G. Williamson (eds.), The Mediterranean Response to GlobalizationBefore 1950. London: Routledge, pp. 199–232.
NEUMARK, S. D. (1938). The Citrus Industry of South Africa. Johannesburg:Witwatersrand University Press.
OLMSTEAD, A. and RHODE, P. W. (1995). La competencia internacional enproductos mediterraneos y el auge de la industria frutıcola californiana,1880–1930. In J. Morilla (ed.), California y el Mediterraneo: estudios de la historiade dos agriculturas competidoras, Madrid: Ministerio de Agricultura, Pesca yAlimentacion, pp. 173–232
O’ROURKE, K. H. (1997). The European grain invasion, 1870–1913. Journal ofEconomic History 57(4), pp. 775–801.
O’ROURKE, K. H. and WILLIAMSON, J. G. (1999). Globalization and History: TheEvolution of a Nineteenth-Century Atlantic Economy. Cambridge, MA: MIT Press.
O’ROURKE, K. H. and WILLIAMSON, J. G. (2002). When did globalization begin?European Review of Economic History 6(1), pp. 23–50.
PINILLA, V. (1995). Cambio agrario y comercio exterior en la Espanacontemporanea. Agricultura y Sociedad 75, pp. 153–79.
PINILLA, V. (2006). The development of irrigated agriculture in twentieth centurySpain: a case study of the Ebro Basin. Agricultural History Review 54(1),pp. 122–41.
PINILLA, V. and AYUDA, M. I. (2002). The political economy of the wine trade:Spanish exports and the international market, 1890–1935. European Review ofEconomic History 6(1), pp. 51–86.
PINILLA, V. and AYUDA, M. I. (2008). Market dynamism and international tradein Mediterranean agricultural products, 1850–1935. Applied Economics 40(5),pp. 583–95.
PINILLA, V. and AYUDA, M. I. (2009). Foreign markets, globalization andagricultural change in Spain, 1850–1935. In V. Pinilla (ed.), Markets andAgricultural Change in Europe from the 13th to the 20th century. Turnhout: BrepolsPublishers, pp. 173–208.
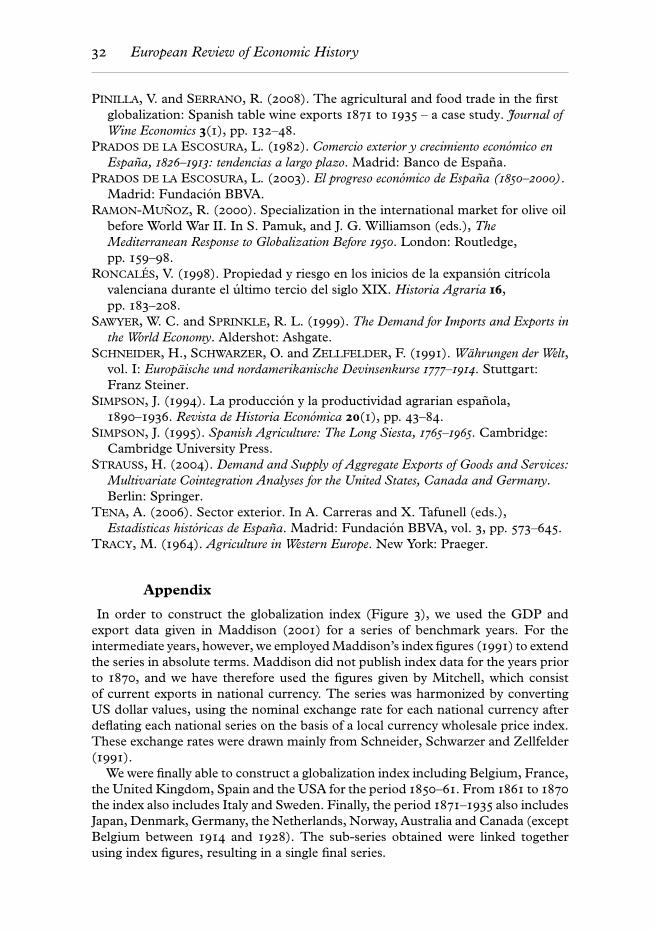
32 European Review of Economic History
PINILLA, V. and SERRANO, R. (2008). The agricultural and food trade in the firstglobalization: Spanish table wine exports 1871 to 1935 – a case study. Journal ofWine Economics 3(1), pp. 132–48.
PRADOS DE LA ESCOSURA, L. (1982). Comercio exterior y crecimiento economico enEspana, 1826–1913: tendencias a largo plazo. Madrid: Banco de Espana.
PRADOS DE LA ESCOSURA, L. (2003). El progreso economico de Espana (1850–2000).Madrid: Fundacion BBVA.
RAMON-MUNOZ, R. (2000). Specialization in the international market for olive oilbefore World War II. In S. Pamuk, and J. G. Williamson (eds.), TheMediterranean Response to Globalization Before 1950. London: Routledge,pp. 159–98.
RONCALES, V. (1998). Propiedad y riesgo en los inicios de la expansion citrıcolavalenciana durante el ultimo tercio del siglo XIX. Historia Agraria 16,pp. 183–208.
SAWYER, W. C. and SPRINKLE, R. L. (1999). The Demand for Imports and Exports inthe World Economy. Aldershot: Ashgate.
SCHNEIDER, H., SCHWARZER, O. and ZELLFELDER, F. (1991). Wahrungen der Welt,vol. I: Europaische und nordamerikanische Devinsenkurse 1777–1914. Stuttgart:Franz Steiner.
SIMPSON, J. (1994). La produccion y la productividad agrarian espanola,1890–1936. Revista de Historia Economica 20(1), pp. 43–84.
SIMPSON, J. (1995). Spanish Agriculture: The Long Siesta, 1765–1965. Cambridge:Cambridge University Press.
STRAUSS, H. (2004). Demand and Supply of Aggregate Exports of Goods and Services:Multivariate Cointegration Analyses for the United States, Canada and Germany.Berlin: Springer.
TENA, A. (2006). Sector exterior. In A. Carreras and X. Tafunell (eds.),Estadısticas historicas de Espana. Madrid: Fundacion BBVA, vol. 3, pp. 573–645.
TRACY, M. (1964). Agriculture in Western Europe. New York: Praeger.
Appendix
In order to construct the globalization index (Figure 3), we used the GDP andexport data given in Maddison (2001) for a series of benchmark years. For theintermediate years, however, we employed Maddison’s index figures (1991) to extendthe series in absolute terms. Maddison did not publish index data for the years priorto 1870, and we have therefore used the figures given by Mitchell, which consistof current exports in national currency. The series was harmonized by convertingUS dollar values, using the nominal exchange rate for each national currency afterdeflating each national series on the basis of a local currency wholesale price index.These exchange rates were drawn mainly from Schneider, Schwarzer and Zellfelder(1991).
We were finally able to construct a globalization index including Belgium, France,the United Kingdom, Spain and the USA for the period 1850–61. From 1861 to 1870
the index also includes Italy and Sweden. Finally, the period 1871–1935 also includesJapan, Denmark, Germany, the Netherlands, Norway, Australia and Canada (exceptBelgium between 1914 and 1928). The sub-series obtained were linked togetherusing index figures, resulting in a single final series.
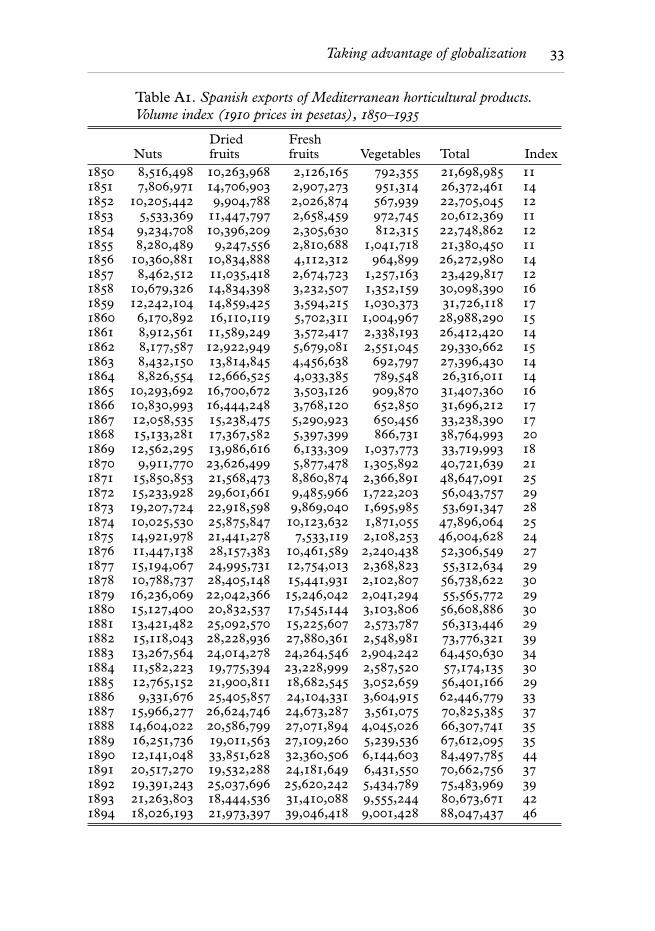
Taking advantage of globalization 33
Table A1. Spanish exports of Mediterranean horticultural products.Volume index (1910 prices in pesetas), 1850–1935
NutsDriedfruits
Freshfruits Vegetables Total Index
1850 8,516,498 10,263,968 2,126,165 792,355 21,698,985 111851 7,806,971 14,706,903 2,907,273 951,314 26,372,461 141852 10,205,442 9,904,788 2,026,874 567,939 22,705,045 121853 5,533,369 11,447,797 2,658,459 972,745 20,612,369 111854 9,234,708 10,396,209 2,305,630 812,315 22,748,862 121855 8,280,489 9,247,556 2,810,688 1,041,718 21,380,450 111856 10,360,881 10,834,888 4,112,312 964,899 26,272,980 141857 8,462,512 11,035,418 2,674,723 1,257,163 23,429,817 121858 10,679,326 14,834,398 3,232,507 1,352,159 30,098,390 161859 12,242,104 14,859,425 3,594,215 1,030,373 31,726,118 171860 6,170,892 16,110,119 5,702,311 1,004,967 28,988,290 151861 8,912,561 11,589,249 3,572,417 2,338,193 26,412,420 141862 8,177,587 12,922,949 5,679,081 2,551,045 29,330,662 151863 8,432,150 13,814,845 4,456,638 692,797 27,396,430 141864 8,826,554 12,666,525 4,033,385 789,548 26,316,011 141865 10,293,692 16,700,672 3,503,126 909,870 31,407,360 161866 10,830,993 16,444,248 3,768,120 652,850 31,696,212 171867 12,058,535 15,238,475 5,290,923 650,456 33,238,390 171868 15,133,281 17,367,582 5,397,399 866,731 38,764,993 201869 12,562,295 13,986,616 6,133,309 1,037,773 33,719,993 181870 9,911,770 23,626,499 5,877,478 1,305,892 40,721,639 211871 15,850,853 21,568,473 8,860,874 2,366,891 48,647,091 251872 15,233,928 29,601,661 9,485,966 1,722,203 56,043,757 291873 19,207,724 22,918,598 9,869,040 1,695,985 53,691,347 281874 10,025,530 25,875,847 10,123,632 1,871,055 47,896,064 251875 14,921,978 21,441,278 7,533,119 2,108,253 46,004,628 241876 11,447,138 28,157,383 10,461,589 2,240,438 52,306,549 271877 15,194,067 24,995,731 12,754,013 2,368,823 55,312,634 291878 10,788,737 28,405,148 15,441,931 2,102,807 56,738,622 301879 16,236,069 22,042,366 15,246,042 2,041,294 55,565,772 291880 15,127,400 20,832,537 17,545,144 3,103,806 56,608,886 301881 13,421,482 25,092,570 15,225,607 2,573,787 56,313,446 291882 15,118,043 28,228,936 27,880,361 2,548,981 73,776,321 391883 13,267,564 24,014,278 24,264,546 2,904,242 64,450,630 341884 11,582,223 19,775,394 23,228,999 2,587,520 57,174,135 301885 12,765,152 21,900,811 18,682,545 3,052,659 56,401,166 291886 9,331,676 25,405,857 24,104,331 3,604,915 62,446,779 331887 15,966,277 26,624,746 24,673,287 3,561,075 70,825,385 371888 14,604,022 20,586,799 27,071,894 4,045,026 66,307,741 351889 16,251,736 19,011,563 27,109,260 5,239,536 67,612,095 351890 12,141,048 33,851,628 32,360,506 6,144,603 84,497,785 441891 20,517,270 19,532,288 24,181,649 6,431,550 70,662,756 371892 19,391,243 25,037,696 25,620,242 5,434,789 75,483,969 391893 21,263,803 18,444,536 31,410,088 9,555,244 80,673,671 421894 18,026,193 21,973,397 39,046,418 9,001,428 88,047,437 46

34 European Review of Economic History
Table A1. Continued
NutsDriedfruits Fresh fruits Vegetables Total Index
1895 22,292,793 19,241,135 49,625,520 9,870,438 101,029,886 531896 24,360,049 20,185,984 45,999,379 11,041,128 101,586,542 531897 28,445,843 21,244,657 55,500,465 10,071,769 115,262,735 601898 27,617,521 23,687,493 51,714,285 11,321,462 114,340,761 601899 26,904,920 24,184,724 65,952,389 13,749,555 130,791,587 681900 17,498,345 24,538,879 59,678,398 13,485,987 115,201,609 601901 22,477,383 21,474,088 64,580,239 15,472,461 124,004,171 651902 28,650,175 19,609,526 77,315,760 14,817,298 140,392,759 731903 35,336,073 20,955,773 88,597,914 18,953,897 163,843,656 861904 39,721,812 18,089,613 88,797,131 20,412,816 167,021,372 871905 31,448,961 20,082,054 73,037,639 18,054,932 142,623,586 751906 28,257,595 14,070,470 81,846,248 18,276,938 142,451,250 741907 33,116,161 18,268,523 103,238,765 22,614,594 177,238,042 931908 29,817,115 17,703,739 92,206,188 21,730,198 161,457,240 841909 42,689,303 19,674,894 94,392,288 22,227,798 178,984,282 941910 37,372,934 18,953,441 107,865,651 27,167,397 191,359,424 1001911 42,964,307 19,961,528 97,601,954 30,777,531 191,305,321 1001912 34,593,475 12,534,438 117,248,762 29,839,740 194,216,415 1011913 41,346,100 13,912,381 119,592,391 30,433,009 205,283,881 1071914 25,633,380 10,509,519 98,670,852 27,463,816 162,277,567 851915 36,677,618 11,642,560 85,958,972 27,900,638 162,179,788 851916 28,647,580 15,062,329 98,313,216 29,937,088 171,960,213 901917 26,947,578 11,127,559 58,316,448 30,632,970 127,024,555 661918 40,095,642 15,379,444 53,594,479 20,579,475 129,649,040 681919 60,117,860 23,150,962 83,109,959 25,428,406 191,807,187 1001920 35,207,537 20,965,450 71,461,628 27,688,100 155,322,715 811921 38,367,114 14,298,990 93,157,028 29,724,320 175,547,451 921922 37,157,320 12,032,248 97,586,461 24,539,863 171,315,892 901923 44,447,677 9,398,590 106,672,104 28,806,964 189,325,335 991924 58,937,944 12,998,212 143,653,748 34,733,363 250,323,267 1311925 46,898,515 12,845,209 148,011,817 33,518,997 241,274,539 1261926 45,799,885 13,550,879 148,364,834 33,985,720 241,701,319 1261927 52,501,259 13,041,946 135,690,539 31,472,376 232,706,120 1221928 60,473,684 10,169,951 184,756,971 34,102,919 289,503,524 1511929 64,482,427 10,538,105 182,077,125 36,160,484 293,258,140 1531930 49,601,071 10,916,912 221,702,740 35,065,333 317,286,056 1661931 62,588,127 10,807,416 169,111,330 27,831,223 270,338,095 1411932 53,359,468 10,091,822 180,366,744 33,366,010 277,184,044 1451933 56,874,723 7,166,713 183,542,550 28,444,809 276,028,794 1441934 70,509,152 8,413,478 178,671,702 29,433,761 287,028,092 1501935 84,637,201 8,156,550 139,336,327 25,186,964 257,317,042 134
Source: Spanish Foreign Trade Statistics (Estadıstica del Comercio Exterior de Espana).

Taking advantage of globalization 35
Table A2. Spanish exports of Mediterranean horticultural products(current prices in pesetas), 1850–1935
NutsDriedfruits
Freshfruits Vegetables Total
1850 4,090,538 8,315,284 1,633,994 654,833 14,694,6501851 2,670,413 10,089,346 2,175,306 656,838 15,591,9041852 4,050,947 5,590,544 1,195,343 355,999 11,192,8341853 2,555,771 11,139,389 1,753,103 855,067 16,303,3301854 2,305,167 5,760,668 954,024 345,199 9,365,0591855 4,661,915 10,743,995 2,340,698 750,975 18,497,5841856 7,736,139 18,322,365 6,842,240 1,055,739 33,956,4821857 5,753,752 17,711,821 3,742,438 1,222,682 28,430,6941858 5,415,028 16,853,567 3,383,945 1,022,893 26,675,4341859 7,801,902 19,374,905 4,702,854 1,155,427 33,035,0871860 3,940,658 21,570,824 6,437,445 959,741 32,908,6681861 7,088,537 15,026,916 4,992,595 2,290,726 29,398,7741862 6,429,961 15,472,121 10,942,809 2,925,204 35,770,0941863 7,681,650 17,891,629 8,294,406 770,722 34,638,4081864 6,599,700 15,731,931 6,555,483 908,943 29,796,0571865 6,306,152 12,858,203 5,270,856 1,066,729 25,501,9401866 8,468,007 11,922,219 6,021,854 672,409 27,084,4881867 12,233,856 15,005,913 12,669,268 879,657 40,788,6941868 14,416,995 17,322,231 10,368,328 1,132,051 43,239,6051869 13,116,446 18,541,006 14,202,742 1,755,191 47,615,3861870 6,031,285 23,138,614 4,877,836 792,695 34,840,4291871 12,033,568 24,830,589 9,765,803 1,752,097 48,382,0561872 9,776,680 35,562,559 10,504,154 1,164,397 57,007,7891873 12,303,780 24,853,806 10,995,870 1,257,873 49,411,3291874 7,076,752 30,798,678 13,481,692 1,526,084 52,883,2061875 10,945,334 27,842,654 11,114,443 1,758,330 51,660,7601876 6,855,997 31,184,867 12,994,739 1,571,231 52,606,8341877 10,184,295 30,069,684 16,578,739 1,902,965 58,735,6831878 7,480,372 32,167,097 17,543,755 1,879,148 59,070,3731879 10,429,135 23,054,978 16,896,104 1,745,664 52,125,8801880 10,439,899 24,085,919 20,652,980 2,686,470 57,865,2681881 9,442,045 28,861,855 17,129,476 2,268,481 57,701,8571882 9,455,993 28,662,562 37,252,535 1,989,575 77,360,6651883 10,759,339 25,982,485 36,149,485 3,655,889 76,547,1981884 8,475,020 19,769,198 35,478,092 3,626,557 67,348,8661885 8,940,621 22,469,272 23,849,429 3,940,470 59,199,7921886 6,787,557 26,878,803 31,715,843 4,792,261 70,174,4641887 10,724,292 24,171,084 29,782,014 4,539,681 69,217,0711888 10,261,725 19,034,045 33,829,653 5,129,678 68,255,1001889 11,351,408 17,268,918 30,998,586 5,955,921 65,574,8341890 8,717,990 27,625,115 34,095,113 6,136,795 76,575,0121891 16,106,062 15,926,154 26,758,356 6,601,732 65,392,3031892 19,132,630 25,968,278 36,616,550 6,727,315 88,444,7731893 20,395,176 22,101,847 37,610,091 11,717,660 91,824,7741894 17,130,623 27,694,402 57,467,118 11,668,950 113,961,093

36 European Review of Economic History
Table A2. Continued
NutsDriedfruits Fresh fruits Vegetables Total
1895 18,539,812 18,838,874 67,890,305 10,332,704 115,601,6961896 19,806,099 19,220,579 66,978,838 11,251,448 117,256,9651897 23,635,115 20,924,584 90,919,631 10,731,661 146,210,9901898 28,936,471 26,610,004 56,573,353 13,614,879 125,734,7061899 25,047,379 23,847,521 82,914,204 12,795,005 144,604,1091900 20,922,760 36,122,090 86,189,176 14,542,848 157,776,8731901 27,726,198 31,616,172 93,705,329 16,773,145 169,820,8441902 32,895,053 26,236,673 103,440,211 14,659,420 177,231,3571903 38,200,335 28,492,688 110,600,245 17,632,141 194,925,4091904 44,616,874 25,544,591 115,750,509 19,740,717 205,652,6911905 36,781,001 29,620,393 101,423,618 18,427,252 186,252,2641906 34,504,021 21,449,273 106,807,083 22,141,206 184,901,5831907 41,526,860 28,815,260 134,408,777 27,188,087 231,938,9841908 30,824,638 22,998,054 92,755,673 26,340,010 172,918,3751909 40,842,366 18,823,667 90,308,442 21,168,749 171,143,2231910 37,372,934 18,953,441 107,865,651 27,167,397 191,359,4241911 46,677,593 21,686,748 106,037,422 33,437,802 207,839,5651912 39,045,852 14,147,692 132,339,345 33,734,189 219,267,0781913 46,034,983 15,490,125 133,162,657 33,943,501 228,631,2671914 21,973,247 9,008,888 84,581,869 23,582,077 139,146,0811915 37,698,047 11,966,476 88,350,490 28,720,266 166,735,2791916 26,991,301 14,191,492 92,629,509 28,278,245 162,090,5471917 43,968,101 18,155,808 95,149,901 49,969,347 207,243,1571918 78,281,504 30,026,357 104,585,653 40,173,058 253,066,5721919 115,135,522 44,337,875 159,169,156 48,700,921 367,343,4751920 50,475,505 30,117,137 102,655,546 38,493,609 221,741,7961921 73,667,598 43,830,914 199,105,995 89,333,208 405,937,7151922 56,270,356 29,826,550 190,213,245 64,284,363 340,594,5151923 87,085,515 25,453,689 208,091,431 75,938,132 396,568,7671924 128,345,954 37,475,750 304,042,268 100,146,193 570,010,1651925 125,160,490 26,302,013 382,393,894 86,594,719 620,451,1151926 117,645,778 27,021,437 383,419,050 88,455,643 616,541,9081927 111,140,144 22,030,352 269,491,586 58,849,203 461,511,2851928 127,823,150 18,038,600 384,770,824 69,149,091 599,781,6651929 124,311,254 26,253,568 417,011,133 83,482,644 651,058,5981930 111,168,826 32,848,637 636,669,087 100,197,457 880,884,0081931 155,524,970 37,103,850 594,398,935 87,224,404 874,252,1591932 100,292,960 22,587,215 513,186,536 79,562,286 715,628,9971933 92,912,013 17,946,187 449,190,979 60,089,817 620,138,9951934 109,046,787 18,018,060 402,526,106 66,210,668 595,801,6201935 123,740,046 15,823,361 303,040,363 47,732,522 490,336,293
Source: Estadıstica del Comercio Exterior de Espana.