
Advancing Weather and Climate Science Hale Time Series ...
27
Advancing Weather and Climate Science Claude Duchon and Robert Hale Time Series Analysis in Meteorology and Climatology An Introduction
Transcript of Advancing Weather and Climate Science Hale Time Series ...

Claude DuchonUniversity of Oklahoma, USA
Time Series Analysisin Meteorology and Climatology
Time Series Analysis in Meteorology and Climatology provides an accessible overview of this notoriously difficult subject. Clearly structured throughout, the authors develop the theoretical foundation necessary for students and researchers to understand the basis for applying various analytical methods to a time series and show how to interpret the results of their application. Taking a unique approach to the subject, the authors use a combination of theory and application to real data sets to enhance understanding throughout the book.
This book is written for individuals who have a data set in the form of a time series and are confronted with the problem of how to analyse their data. Each chapter discusses appropriate methods that can be used to carry out the analysis. Theoretical topics include the mathematical basis of Fourier analysis, spectral consequences of linear input-output systems (including analog and digital filtering), and the statistical effects of autocorrelation. Each theoretical topic is then applied to real data sets in which scalar variables are used for ease of understanding (for example, air temperature, wind speed, and precipitation).
Based on the acclaimed and long standing course at the University of Oklahoma, the book is distinct in its approach to the subject matter: while it is written for readers in meteorology and climatology, the material is presented in a sufficiently broad manner that it has application to any field in which data are ordered in time or space.
Provides a unique, physical science-based approach to time series analysis, employing tried and tested teaching methods that combine theory and application.
Each chapter contains self-assessment problems that consolidate theory and practice in order to better understand statistical concepts and their application to one-dimensional time series.
Incorporates numerous examples from meteorology and climatology to place the subject into context.
Written for students and researchers from a wide spectrum of scientific fields.
Included in RMetS Book series ‘Advancing Weather and Climate Science’
Additional material available on the companion website at www.wiley.com/go/duchon/timeseriesanalysis
Advancing Weather and Climate Science
Advancing Weather and Climate Science
Time Series Analysis in M
eteorology and Climatology
Duchon
Hale
Claude Duchon and Robert Hale
Time Series Analysis in Meteorology and
ClimatologyAn IntroductionRobert Hale
Colorado State University, USA


Time Series Analysisin Meteorologyand Climatology

Companion Website
This book has a companion website www.wiley.com/go/duchon/timeseriesanalysis
with datasets for the problems in each chapter.

Time Series Analysisin Meteorologyand ClimatologyAn Introduction
Claude Duchon
University of Oklahoma, USA
Robert Hale
Colorado State University, USA

This edition first published 2012 � 2012 by John Wiley & Sons, Ltd.
Wiley-Blackwell is an imprint of John Wiley & Sons, formed by the merger of Wiley’s global Scientific,
Technical and Medical business with Blackwell Publishing.
Registered office : John Wiley & Sons, Ltd, The Atrium, Southern Gate, Chichester, West Sussex,
PO19 8SQ, UK
Editorial offices : 9600 Garsington Road, Oxford, OX4 2DQ, UK
The Atrium, Southern Gate, Chichester, West Sussex, PO19 8SQ, UK
111 River Street, Hoboken, NJ 07030-5774, USA
For details of our global editorial offices, for customer services and for information about
how to apply for permission to reuse the copyright material in this book please see our website
at www.wiley.com/wiley-blackwell.
The right of the author to be identified as the author of this work has been asserted in accordance
with the UK Copyright, Designs and Patents Act 1988.
All rights reserved. No part of this publication may be reproduced, stored in a retrieval system, or
transmitted, in any form or by any means, electronic, mechanical, photocopying, recording or otherwise,
except as permitted by the UK Copyright, Designs and Patents Act 1988, without the prior permission
of the publisher.
Designations used by companies to distinguish their products are often claimed as trademarks.
All brand names and product names used in this book are trade names, service marks, trademarks or
registered trademarks of their respective owners. The publisher is not associated with any product
or vendor mentioned in this book. This publication is designed to provide accurate and authoritative
information in regard to the subject matter covered. It is sold on the understanding that the publisher
is not engaged in rendering professional services. If professional advice or other expert assistance is required,
the services of a competent professional should be sought.
Library of Congress Cataloging-in-Publication Data
Duchon, Claude E.
Time series analysis in meteorology and climatology : an introduction / Claude Duchon and Robert Hale.
p. cm. – (Advancing weather and climate science)
Includes bibliographical references and index.
ISBN 978-0-470-97199-4 (hardback)
1. Meteorology–Statistical methods. 2. Time-series analysis. I. Hale, Robert, 1940- II. Title.
QC874.5.D83 2011
551.501 051955–dc232011030428
A catalogue record for this book is available from the British Library.
This book is published in the following electronic formats: ePDF 9781119953098; Wiley Online Library
9781119953104; ePub 9781119960980; Mobi 9781119960997
Set in 10.5/13pt Minion by Thomson Digital, Noida, India
First Impression 2012

Contents
Series foreword vii
Preface ix
1. Fourier analysis 1
1.1 Overview and terminology 2
1.2 Analysis and synthesis 6
1.3 Example data sets 14
1.4 Statistical properties of the periodogram 23
1.5 Further important topics in Fourier analysis 47
Appendix 1.A Subroutine foranx 83
Appendix 1.B Sum of complex exponentials 86
Appendix 1.C Distribution of harmonic variances 86
Appendix 1.D Derivation of Equation 1.42 92
Problems 93
References 99
2. Linear systems 1012.1 Input–output relationships 102
2.2 Evaluation of the convolution integral 104
2.3 Fourier transforms for analog data 110
2.4 The delta function 113
2.5 Special input functions 118
2.6 The frequency response function 122
2.7 Fourier transform of the convolution integral 128
2.8 Linear systems in series 130
2.9 Ideal interpolation formula 132
Problems 137
References 142

3. Filtering data 1433.1 Recursive and nonrecursive filtering 144
3.2 Commonly used digital nonrecursive filters 150
3.3 Filter design 159
3.4 Lanczos filtering 161
Appendix 3.A Convolution of two running mean filters 173
Appendix 3.B Derivation of Equation 3.20 176
Appendix 3.C Subroutine sigma 177
Problems 180
References 182
4. Autocorrelation 1834.1 Definition and properties 184
4.2 Formulas for the acvf and acf 188
4.3 The acvf and acf for stationary digital processes 192
4.4 The acvf and acf for selected processes 195
4.5 Statistical formulas 201
4.6 Confidence limits for the population mean 206
4.7 Variance of the acvf and acf estimators 211
Appendix 4.A Generating a normal random variable 215
Problems 216
References 221
5. Lagged-product spectrum analysis 2235.1 The variance density spectrum 223
5.2 Relationship between the variance density spectrum and the acvf 226
5.3 Spectra of random processes 230
5.4 Spectra of selected processes 232
5.5 Smoothing the spectrum 236
Appendix 5.A Proof of Equation 5.11 239
Appendix 5.B Proof of Equation 5.12 240
Problems 241
References 243
Index 245
vi CONTENTS

Series foreword
Advances in weather and climate
Meteorology is a rapidly moving science. New developments in weather forecasting,
climate science and observing techniques are happening all the time, as shown by
the wealth of papers published in the various meteorological journals. Often these
developments takemany years tomake it into academic textbooks, bywhich time the
science itself has moved on. At the same time, the underpinning principles of atmo-
spheric science are well understood but could be brought up to date in the light of the
ever increasing volume of new and exciting observations and the underlying patterns
of climate change that may affect somany aspects of weather and the climate system.
In this series, the Royal Meteorological Society, in conjunction with
Wiley–Blackwell, is aiming to bring together both the underpinning principles and
new developments in the science into a unified set of books suitable for under-
graduate and postgraduate study as well as being a useful resource for the profes-
sional meteorologist or Earth system scientist. New developments in weather and
climate sciences will be described together with a comprehensive survey of the
underpinning principles, thoroughly updated for the 21st century. The series will
build into a comprehensive teaching resource for the growing number of courses in
weather and climate science at the undergraduate and postgraduate levels.
Series Editors
Peter Inness
University of Reading, UK
William Beasley
University of Oklahoma, USA


Preface
Time series analysis is widely used in meteorological and climatological studies
because the vast majority of observations of atmospheric and land surface variables
are ordered in time (or space). Over the years we have found a continuing interest by
both students and researchers in our profession (and those allied to it) in under-
standing basic methods for analyzing observations ordered in time or space and
evaluating the results. The purpose of this book is to respond to this interest. We’ve
done this by deriving and interpreting various equations that are useful in explaining
the structure of data and then, using computer programs, applying them to
meteorological data sets. Overall, the material we cover serves as an introduction
in the application of statistics to the analysis of univariate time series. The topics
discussed should be relevant to anyone in any science where events are observed in
time and/or space. To demonstrate a procedure, we use scalar atmospheric variables,
for example, air temperature. Anyone who completes the five chapters, including
working the problems at the end of each chapter, will have acquired sufficient
understanding of time series terminology andmethodology to confidently deal with
more advanced spectrum analysis, for example, that found in radar and atmospheric
turbulence measurements, analysis, and theory.
Chapter 1 deals with Fourier analysis and is divided into five sections. In the first
three sections, mathematical formulas for representing a time series by Fourier sine
and cosine coefficients are developed and their inherent symmetry emphasized.
These formulas are applied to three data sets, two of which are actual observations.
The three sections provide the background necessary to apply Fourier analysis to a
time series, and one of the end-of-chapter problems invites the reader to write a
computer program designed to accomplish this.
In the fourth section of Chapter 1 we investigate statistical properties of the
Fourier spectrum. These statistical properties arise because time series from the phys-
ical world are usually nondeterministic, that is, no two data sets are alike. We explore
the concept of a random variable, a realization, a population, stationarity, expec-
tation, and a probability density function. The goal is to understand how random
data produce a distribution of variances at each harmonic frequency and the
statistical properties of this distribution. Armed with this information, the last part

of this section involves testing the hypothesis that a particular data set, as viewed
through the Fourier spectrum, is a sample from a population of white noise, that is,
random numbers.
The fifth section of Chapter 1 is an examination of various topics relevant to
time series analysis.We discuss aliasing, spectrum folding, and spectrumwindows,
phenomena that are a direct consequence of digital sampling, and show examples
of each. In addition, we develop the Fourier transform, the mathematical for-
mula that in one step converts a time series into its Fourier components in the
frequency domain.
Chapter 1 is the longest of the five chapters because it encompasses both
theory and application of Fourier analysis, relevant statistical concepts, and
the foundation of methods of time series analysis developed in the remaining
chapters.
The subject of Chapter 2 is linear systems. This chapter is the study of the
relationships between two time series, an input series and an output series, and the
associated input and output spectra. What links the two time series is a physical
system, as in the case of measurement of some physical variable (for example, a
thermometer to measure temperature), or a mathematical system, as in the case of
filtering an observed time series to remove unwanted noise in the data.
Fundamental to Chapter 2 is the convolution integral. Whether a system is
physical or mathematical, the convolution integral provides the mathematical
connection between the input and output series, and its Fourier transform provides
the connection between the input and output spectra.
Most variables of interest in the physical sciences are continuous in time (or
space). Nevertheless, we practically always analyze digital time series. We investigate
the relationship between analog and digital time series using a generalized function
called the Dirac delta function. Through its application we can explain how the
structure of an output time series that has passed through a linear system is altered
relative to the input time series in terms of modified Fourier coefficients and phase
angles. Two examples are discussed, a first order linear system and an integrator,
both of which have practical use in meteorology and climatology, and the physical
sciences in general.
Chapter 3 is principally about nonrecursive data filtering; that is, a filtered output
time series is related only to the input time series – there is no feedback (as in
recursive filtering). Time series that are to be filtered are viewed as data that already
have been collected as opposed to real time filtering.
The primary objective of this chapter is to design and apply a two-parameter filter
called the Lanczos filter. The two design parameters are the number of weights and
the frequency that separates the Fourier spectrum into harmonic variances that
remain unchanged and those that are suppressed. This filter provides its designer
much more control of the filtering process than simple one-parameter filters, for
example, the runningmean. The theory of Lanczos filtering is developed, examples of
x PREFACE

its use are shown, and a computer program is provided so that the reader can apply
the procedure to a data set.
One of the goals of a physical scientist is to understand the morphology of natural
events. An obvious step that must be taken is to obtain samples in time and/or space
of variables that characterize the physical properties of an event over its lifetime.
The fact that an event has a lifetime implies that it evolves in time and/or space, a
consequence of which is that successive observations of its properties are related.
This is called autocorrelation, the title of Chapter 4. To realize the importance of
autocorrelation in analyzing time series, we compare the formula for calculating the
variance of the mean of a random variable with autocorrelation to that without
autocorrelation. The latter formula is the form seen in typical undergraduate
statistics texts while the former formula takes into account the degree of dependence
in the time series.
In Chapter 4 we are interested in finding the best formula for estimating themean,
variance, autocovariance function, and autocorrelation function of a population of
time series based, typically, on a single observed time series taken from that
population. We examine populations of independent as well as autocorrelated data.
Among the five chapters, this one is the most statistically oriented.
The lagged-product method discussed in Chapter 5 is an alternative to Fourier
analysis. Quite often, Fourier analysis of geophysical data yields noisy-looking
spectra. When this occurs, it is common to smooth a spectrum to make it more
visually interpretable. In the lagged-productmethod, a smoothed variance spectrum
can be obtained directly from the Fourier transform of the product of the auto-
covariance function with another function that alters its shape. The degree of
smoothing is controlled entirely by the latter function. The term lagged-product
is used because the autocovariance function comprises time-lagged (or spatially-
lagged) products and it is the autocovariance function that is being transformed.
This book was written for students and scientists who have a background in
calculus and statistics, and familiarity with complex variables. Prior in-depth study
of complex variables is not required.
The authors wish to thank the many students who have provided valuable com-
ments and corrections over the years the material was used as lecture notes.
Chapters 2, 4, and 5 were inspired by the book Spectral Analysis and its Applications
(1968) by G.M. Jenkins and D.G. Watts, a classic volume in time series analysis.
Claude Duchon and Rob Hale
22 May 2011
PREFACE xi


1Fourier analysis
It is often the case in the physical sciences, and sometimes the social sciences as well,
that measurements of a particular variable are collected over a period of time. The
collected values form a data set, or time series, that may be quite lengthy or otherwise
difficult to interpret in its raw form. We then may turn to various types of statistical
analyses to aid our identification of important attributes of the time series and their
underlying physical origins. Basic statistics such as the mean, median, or total
variance of the data set help us succinctly portray the characteristics of the data set as
a whole, and, potentially, compare it to other similar data sets.
Further insight regarding the time series, however, can be gained through the use
of Fourier, harmonic, or periodogram analysis – three names used to describe a single
methodology. The primary aim of such an analysis is to determine how the total
variance of the time series is distributed as a function of frequency, expressed either
as ordinary frequency in cycles per unit of time, for example, cycles per second, or
angular frequency in radians per unit of time. This allows us to quantify, in away that
the basic statistics named above cannot, any periodic components present in the data.
For example, outside air temperature typically rises and falls with some regularity
over the course of a day, a periodic component governed by the rising and setting of
the sun as the earth rotates about its axis. Such a periodic component is readily
apparent and quantifiable after applying Fourier analysis, but is not describedwell by
the mean, median, or total variance of the data.
In the first two sections of Chapter 1, we will learn some essential terminology of
Fourier analysis and the fundamentals of performing Fourier analysis and its inverse,
Fourier synthesis. Example data sets and their analyses are presented in Section 1.3 to
further aid in understanding the methodology.
As with other types of statistical analyses, statistical significance plays an impor-
tant role in Fourier analysis. That is, after performing a Fourier analysis, what if we
Time Series Analysis in Meteorology and Climatology: An Introduction, First Edition. Claude Duchon and Robert Hale.
� 2012 John Wiley & Sons, Ltd. Published 2012 by John Wiley & Sons, Ltd.

find that the variance at one frequency is noticeably larger than at other frequencies?
Is this the result of an underlying physical phenomenon that has a periodic nature?
Or, is the larger variance simply statistical chance, owing to the randomnature of the
process? To answer these questions, in Section 1.4 we examine how to ascribe
confidence intervals to the results of our Fourier analysis.
In Section 1.5, we take a more detailed look at particular issues that may be
encountered when using Fourier analyses. Although not generally requisite to
performing a Fourier analysis, the concepts covered are often critical to correct
interpretation of the results, and in some cases may increase the efficacy of an
analysis. An understanding of these topics will allow an investigator to pursue
Fourier analysis with a high degree of confidence.
1.1 Overview and terminology
1.1.1 Obtaining the Fourier amplitude coefficients
The goal of Fourier analysis is to decompose a data sequence into harmonics
(sinusoidal waveforms) such that, when added together, they reproduce the time
series.Whatmakes sinusoidal waveforms an appropriate representation of the data is
their orthogonality property, their ability to successfully model waves in the
atmosphere, oceans, and earth, as well as phenomena resulting from solar forcing,
and the fact that the harmonic amplitudes are independent of time origin and time
scale (Bloomfield, 1976, p. 7).
Harmonic frequencies are gauged with respect to the fundamental period, the
shortest record length for which the time series is not repeated. In most practical
cases, this is the entire length of the available record, since the record typically
does not contain repeated sequences of identical data. The harmonic frequencies
include harmonic 1, which corresponds to one cycle over the fundamental
period, and higher harmonics that are integer multiples of one cycle. Thus each
harmonic is always an integer number of cycles over the length of the funda-
mental period.
To establish a sense of Fourier analysis, consider a simple example. The heavy line
in Figure 1.1 connects the average monthly temperatures at Oklahoma City over
the three-year period 2007–2009. By looking at the heavy line only, it is quite evident
that there is a strong annual cycle in temperature. It is equally clear that one sinusoid
will not exactly fit all the data, so other harmonics are required. The fundamental
period, or period of the first harmonic, is the length of the record, three years. The
third harmonic has a period one-third the length of the fundamental period, and
consequently represents the annual cycle. The thin line in Figure 1.1 shows the third
harmonic after it has been added to the mean of all 36 months, that is, the
0-th harmonic. As expected, the third harmonic provides a close fit to the observed
time series.
2 CH 1 FOURIER ANALYSIS

1.1.2 Obtaining the periodogram
The computation of variance arises in elementary statistics as a defined measure of
the variability in a data set. When the computation of variance is applied to a time
series, it is similarly defined. Now, though, the variance in the data set can be
decomposed into individual variances, each one related to the amplitude of a
harmonic. Just as adding the sinusoids from all harmonics reproduces the original
time series, adding all harmonic variances yields the total variance in the time series.
How the decomposition is achieved and how variance is related to harmonic
amplitude are discussed in Section 1.2.
A periodogram is a plot of the variance associated with each harmonic (usually
excluding the 0-th) versus harmonic number and shows the contribution by each
harmonic to the total variance in the time series. Henceforth, the term periodogram
will be used to refer to the calculation of variance at the harmonic frequencies.
The term Fourier line variance spectrum is synonymous with periodogram, while
the generic term spectrum generally means the distribution of some quantity
with frequency.
The variance at each harmonic frequency is given by the square of its amplitude
divided by two, except at the last harmonic. Figure 1.2 shows the periodogram
(truncated to the first 10 harmonics) of the data in Figure 1.1 where we see that
harmonic 3 dominates the variability in the data. The small variances at harmonics 6
(period¼ 6 months) and harmonic 9 (period¼ 4 months) are easily observed in
Figure 1.2, but, in fact, there are nonzero variances at all 18 possible harmonics
(excluding the 0-th) and their sum equals the total variance of 75.23 �C2 in the
2007–2009 Oklahoma City mean monthly temperature time series.
0
5
10
15
20
25
30
0 12 24 36
Tem
pera
ture
(°C
)
Month
2007
fundamental period = 36 months
2008 2009
Figure 1.1 Mean monthly temperatures at Oklahoma City 2007–2009 (heavy line), and
harmonic 3 (light line) of the Fourier decomposition.
1.1 OVERVIEW AND TERMINOLOGY 3

The periodogram in Figure 1.2 was computed using the computer program
given in Appendix 1.A. This program, written in Fortran 77, performs a ‘fast’ Fourier
analysis of any data set with an even number of data and has been used throughout
this chapter to compute the periodograms we discuss.
1.1.3 Classification of time series
We can classify time series of data into four distinct types of records. The type
of record determines the mathematical procedure to be applied to the data to obtain
its spectrum.
The 36 values of temperature xn, in Figure 1.1, connected by straight-line segments
for ease in visualization, constitute a finite digital record. Digital time series arise in
twoways (Box and Jenkins, 1970, p. 23): sampling an analog time series, for example,
measuring continuously changing air temperature each hour on the hour; or
accumulating or averaging a variable over a period of time, for example, the previous
record of monthly mean temperatures at Oklahoma City. With respect to the latter
case, if N is the number ofmonths of data andDt the time interval between successive
values, the record length in Figure 1.1 isNDt¼ 36months. In this case, as well as with
all finite digital records, all data points can be exactly fitted with a finite number of
harmonics. This is in contrast to a finite analog record of length T, such as a pen trace
on an analog strip chart, for example, a seismograph, for which an infinite number of
harmonics may be required to fit the signal.
Figure 1.3 is an example of a finite analog record. Sampling the time series at
intervals ofDt yields the finite digital record shown in Figure 1.4. The sample values
again have been connected by straight-line segments to better visualize the variations
0
10
20
30
40
50
60
70
80
1 2 3 4 5 6 7 8 9 10
Variance (
°C
2)
Harmonic
Figure 1.2 Variance at each harmonic through 10 for the data in Figure 1.1.
4 CH 1 FOURIER ANALYSIS

in xn. The sampling interval,Dt, associated with each datum can be shown on a time
series plot to the left or right of, or centered on, each datum – it is a matter of choice.
In Figure 1.4, Dt is to the right of each datum. One might think that there should
be a fifteenth sample point at the very end of the curve in Figure 1.3. However,
because of the association of each sampled value with oneDt, the length of the digitalrecord would be one sample interval longer than the analog record. Conceptually,
the fifteenth sample point is the first value of a continuing, but unavailable,
analog record.
The concept of an infinite analog record is often used in theoretical work.
An example would be the trace in Figure 1.3 extended indefinitely in both directions
of time. For this case a continuum of harmonics is required to fit the signal, thereby
resulting in a variance density spectrum. Note, however, that a variance density
spectrum can be created also with a finite digital record. How this comes about is
0
t0 T
xt
Figure 1.3 An example of a finite analog data record.
n = 0 1 2 3 4 5 6 7 8 9 10 11 12 13 14
Δt
NΔt = 14Δt
xn
0
Figure 1.4 An example of a finite digital data record obtained by sampling the finite analog
record in Figure 1.3. There are N¼ 14 data.
1.1 OVERVIEW AND TERMINOLOGY 5

discussed in Chapter 5. An infinite digital record would be obtained by sampling the
infinite analog record at intervals of Dt. We will use infinite analog and digital
records in Section 3.1.4 (Chapter 3) to determine the effects on the mean value of a
time series after it is filtered.
By far the type of record most commonly observed and analyzed in science and
technology is the finite digital record. With a few exceptions, this is the type of data
recordwewill dealwith in the remainder ofChapter 1, and forwhich the formulas for
computing a periodogram are presented.
1.2 Analysis and synthesis
1.2.1 Formulas
If one of the data sets collected in your research is a time series of atmospheric
pressure, Fourier “analysis” can be used to derive its periodogram and to examine
which harmonics dominate the series. Conversely, once the analysis has been done,
the original time series of pressure can be reconstructed purely from knowledge of
the harmonic amplitudes. Thus Fourier “synthesis” is the inverse process of analysis.
Note that the title of this chapter employs the more generic meaning of analysis and
includes both the analysis and synthesis terms just described.
The formulas in Table 1.1 are those needed to perform analysis and synthesis. The
equations under Fourier Analysis are used to calculate the Fourier coefficients or
harmonic amplitudes. The equations under Fourier Synthesis express the time series
xn as the sum of products of cosines and sines with amplitudes Am and Bm,
respectively, or, alternatively, the sum of products of cosines only with amplitudes
Rm and phase angles qm. Notice that the expressions are slightly different dependingon whether the time series has an even or an odd number of data. The synthesis
equations are equivalent to the forms introduced by Shuster around 1900
(Robinson, 1982).
The arguments of the cosine and sine terms associated with the Am and Bmcoefficients are of the form
2pmnDt
NDt
where m is harmonic number and nDt a point in time along the time axis of total
length NDt. Thus, 2pm is the number of radians in them-th harmonic over the total
length of the time series. The product of 2pmand the ratio nDt/NDt provide locationalong the sinusoid in radians. Because the time increments (Dt) cancel, they are notshown in Table 1.1. In Fourier synthesis, the summation is over all harmonics at a
given location nDt, while in Fourier analysis the summation is over all data locations
for a given harmonic m.
6 CH 1 FOURIER ANALYSIS

The variance at each harmonic for even and odd data lengths is given in Table 1.1
under the heading Variance at Harmonic m. Note that the only exception to the
general formula for harmonic variance occurs at m¼N/2 when N is even. The
cosine coefficient at N/2 is squared but not divided by two (the sine coefficient is
zero). The formulas for the total variance S2 under the heading Total Variance yield
the same variance estimates as the formula
S2 ¼ 1
N
XN�1
n¼ 0
xn � xð Þ2 ð1:1Þ
for computing total variance directly from the data, in which x is the series mean.
The two formulas in Table 1.1 are nearly the same, the only difference being that the
Table 1.1 Formulas used in Fourier synthesis and analysis for an even or odd number of data.
Fourier Analysis
A0 ¼ 1N
PN�1
n¼ 0
xn B0 ¼ 0
Am ¼ 2N
PN�1
n¼ 0
xn cos2pmn
NBm ¼ 2
N
PN�1
n¼0
xn sin2pmn
N
m¼ 1;N2�1
� �N evenð Þ; m¼ 1;N�1
2
� �Noddð Þ
AN=2 ¼ 1N
PN�1
n¼ 0
xn cosðpnÞ BN=2 ¼ 0 ðN evenÞ
Rm ¼ffiffiffiffiffiffiffiffiffiffiffiffiffiffiffiffiffiffiA2m þ B2
m
qqm ¼ tan�1 Bm
Am
� �
Fourier Synthesis
xn ¼PN=2m¼0
Amcos2pmn
NþBmsin
2pmn
N
� �¼ PN=2
m¼0
Rmcos2pmn
N�qm
� �; n¼ 0;N�1½ � ðN evenÞ
xn ¼PN�12
m¼0
Amcos2pmn
NþBmsin
2pmn
N
� �¼ PN�1
2
m¼0
Rmcos2pmn
N�qm
� �; n¼ 0;N�1½ � ðN oddÞ
Variance at Harmonic m
S2m ¼ A2m þ B2
m
2m ¼ 1; N
2�1
� � ðNevenÞ; m ¼ 1; N�12
� � ðN oddÞ
S2N=2 ¼ A2N=2 ðN evenÞ
Total Variance
S2 ¼ PN=2m¼ 1
S2m ðN evenÞ S2 ¼ PN�12
m¼ 1
S2m ðN oddÞ
1.2 ANALYSIS AND SYNTHESIS 7

expression for the upper limit of each summation depends on whether N is even
or odd.
1.2.2 Fourier coefficients
The method for obtaining the Fourier coefficients is based on the orthogonality of
cosine and sine functions at harmonic frequencies, where orthogonality means that
the sumof the products of two functions over some interval equals zero. Themethod
entails multiplying both sides of a Fourier synthesis equation by one of the cosine or
sine harmonic terms, summing over all n, and solving for the coefficient associated
with the harmonic term.
For example, consider multiplying both sides of the first Fourier synthesis equa-
tion in Table 1.1 (using the Am, Bm form) by cos 2pknN
and summing over all n. The
second summation on the right-hand side will have the form and result
XN�1
n¼ 0
sin2pmn
Ncos
2pkn
N¼ 0 ð1:2Þ
wherem and k are integers. That this sum is zero can be shown with two examples as
well as mathematically. The sine and cosine terms for m¼ k¼ 1 are shown in
Figure 1.5 and for m¼ 1 and k¼ 2 in Figure 1.6. The algebraic signs of the sum of
cross products within each quadrant are shown at the base of each figure. Because of
symmetry, the absolute magnitude of each sum is the same for each quadrant in
−1
−0.5
0
0.5
1
n = 0 n = N+ +− −
sin(2πmn/N)
cos(2πkn/N)
Figure 1.5 Signs of sums of cross products of cosine and sine terms for m¼ k¼ 1.
8 CH 1 FOURIER ANALYSIS

Figure 1.5 and similarly for Figure 1.6. Thus the waveforms are orthogonal because
the sum of their cross products is zero over the interval 0 to N in each illustration.
It can be surmised from these figures that the sumof the cross products is zero over
the fundamental period for any combination of the m and k integers. But how could
this be shown mathematically? Firstly, we put the sine and cosine terms in complex
exponential form, and then expand the summation above using Euler’s formula
to obtain
XN�1
n¼0
sinð2pmn=NÞ cosð2pkn=NÞ
¼XN�1
n¼0
1
2iðei2pmn=N� e�i2pmn=NÞ 1
2ðei2pkn=Nþ e�2pkn=NÞ
¼ 1
4i
XN�1
n¼0
ðei2pðmþkÞn=Nþ ei2pðm�kÞn=N� e�i2pðm�kÞn=N� e�i2pðmþkÞn=NÞ: ð1:3Þ
A procedure is developed in Appendix 1.B for finding the sum of complex
exponentials. The final two formulas, Equations 1.B.3 and 1.B.4, are very useful
for quickly finding the sums of sines and cosines over any range of their arguments.
An example of using the first formula follows.
Consider just the first summation on the right-hand side in Equation 1.3. Let
Q ¼XN�1
n¼ 0
ei2pðmþkÞn=N: ð1:4Þ
cos(2πkn/N)
sin(2πmn/N)
−1
−0.5
0
0.5
1
n = 0 n = N
++ −− −+
Figure 1.6 Signs of sums of cross products of cosine and sine terms for m¼ 1 and k¼ 2.
1.2 ANALYSIS AND SYNTHESIS 9

Using Equation 1.B.3, Q becomes
Q ¼ 1� ei2pðmþkÞ
1� ei2pðmþkÞ=N
¼ 1� cos½2pðmþ kÞ� � i sin½2pðmþ kÞ�1� cos½2pðmþ kÞ=N� � i sin½2pðmþ kÞ=N�
¼ 0; mþ k 6¼ 0; N: ð1:5Þ
The numerator is zero for all integer values of m and k while the denominator is
nonzero except when (mþ k)¼ 0 or N, in which cases the denominator is 0 and
Equation 1.5 is indeterminate. To evaluate Equation 1.5 for these cases we can apply
l’Hopital’s rule. The result of taking the first derivative with respect to (mþ k) in
both the numerator anddenominator yields a determinate formwith valueN. That is
Q0 ¼ 2p sin½2pðmþ kÞ� � i 2p cos½2pðmþ kÞ�ð2p=NÞ sin½2pðmþ kÞ=N� � i ð2p=NÞ cos½2pðmþ kÞ=N�
¼ N; mþ k ¼ 0; N: ð1:6Þ
The same result also can be obtained by substituting 0 or N for (mþk) in
Equation 1.4. We observe that the first and fourth summations in Equation 1.3
cancel each other for these values.
We can apply the above procedure to the second term in Equation 1.3. The
summation will be zero again, except when (m� k) is 0 or N. Employing l’Hopital’s
rule yields a determinate form with value N for these cases, similar to Equation 1.6.
And again, the same results can be obtained from Equation 1.4. Accordingly, when
(m� k)¼ 0 or N, the second and third summations in Equation 1.3 cancel. Thus
Equation 1.2 is valid for any integer k orm. This includes the possibility that (kþm)
is an integer multiple of N.
Now that we have shown that the summed sine–cosine cross product terms akin
to Equation 1.2 must be zero, let us consider the sums of sine–sine and cosine–
cosine products resulting from multiplying the first Fourier synthesis equation
by cos 2pknN
and summing over all n. Following the procedure in Appendix 1.B we
find that
XN�1
n¼0
sin2pmn
Nsin
2pkn
N¼
0 ; k 6¼mN2; k ¼ m 6¼ 0; N
2ðNevenÞ; k ¼ m 6¼ 0 ðNoddÞ
0 ; k ¼ m ¼ 0; N2ðNevenÞ; k ¼ m ¼ 0 ðNoddÞ
8>>><>>>:
ð1:7Þ
10 CH 1 FOURIER ANALYSIS
and
XN�1
n¼0
cos2pmn
Ncos
2pkn
N¼
0 ; k 6¼m
N2; k ¼m 6¼0; N
2ðNevenÞ; k ¼m 6¼0ðNoddÞ
N; k ¼m¼ 0; N2ðNevenÞ; k ¼m¼ 0ðNoddÞ:
8>>><>>>:
ð1:8Þ
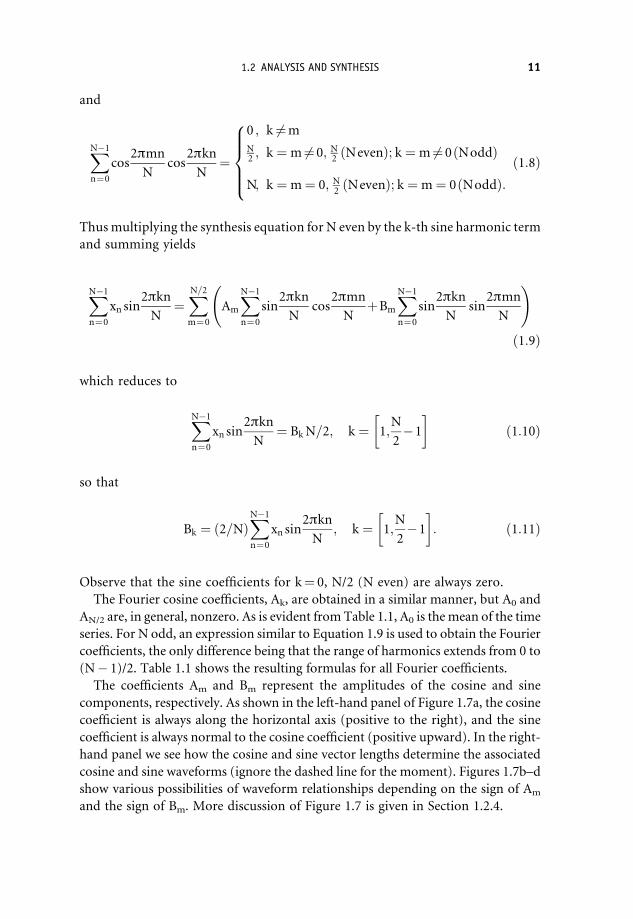
Thusmultiplying the synthesis equation for N even by the k-th sine harmonic term
and summing yields
XN�1
n¼0
xn sin2pkn
N¼XN=2m¼0
Am
XN�1
n¼0
sin2pkn
Ncos
2pmn
NþBm
XN�1
n¼0
sin2pkn
Nsin
2pmn
N
!
ð1:9Þ
which reduces to
XN�1
n¼0
xn sin2pkn
N¼ BkN=2; k ¼ 1;
N
2�1
� �ð1:10Þ
so that
Bk ¼ ð2=NÞXN�1
n¼0
xn sin2pkn
N; k ¼ 1;
N
2�1
� �: ð1:11Þ
Observe that the sine coefficients for k¼ 0, N/2 (N even) are always zero.
The Fourier cosine coefficients, Ak, are obtained in a similar manner, but A0 and
AN/2 are, in general, nonzero. As is evident from Table 1.1, A0 is the mean of the time
series. For N odd, an expression similar to Equation 1.9 is used to obtain the Fourier
coefficients, the only difference being that the range of harmonics extends from 0 to
(N� 1)/2. Table 1.1 shows the resulting formulas for all Fourier coefficients.
The coefficients Am and Bm represent the amplitudes of the cosine and sine
components, respectively. As shown in the left-hand panel of Figure 1.7a, the cosine
coefficient is always along the horizontal axis (positive to the right), and the sine
coefficient is always normal to the cosine coefficient (positive upward). In the right-
hand panel we see how the cosine and sine vector lengths determine the associated
cosine and sine waveforms (ignore the dashed line for the moment). Figures 1.7b–d
show various possibilities of waveform relationships depending on the sign of Am
and the sign of Bm. More discussion of Figure 1.7 is given in Section 1.2.4.
1.2 ANALYSIS AND SYNTHESIS 11

Bm(+)
Bm(+)
Am(+)
Am(−)
θm(+)
θm(+)
θm(+)
θm(+)
Rm
0 ≤ θm ≤ π/2
π/2 ≤ θm ≤ π
n = 0
Rm
Bm(+)
n
xnAm(+)
Rm
n = 0
n
xn Bm(+)
Am(−)
Rm
(a) θm is in the first quadrant.
(b) θm is in the second quadrant.
Bm(−) m(−)
Am(−)
Rm
m /2
xn
n = 0
n
m(−)
Rm
x
Bm(−)
m(−)
Am(+)
Rm
/2 m ≤ 0
xn
n = 0
n
Rm
m(−)
(c) m is in the third quadrant.
(d) m is in the fourth quadrant.
Bm(−)Am(−)
Am(+)
Bm(−)
≤ θ
≤≤ θ
Figure 1.7 (a)–(d) The magnitude and sign of each Fourier coefficient determines the
quadrant in which the phase angle lies. Geometric vector lengths in the left hand panels are
twice the lengths of the Fourier coefficients in the right hand panels.
12 CH 1 FOURIER ANALYSIS

An alternative approach can be taken to solve for the Fourier coefficients.
As shown by Bloomfield (1976, p. 13), the As and Bs above are identical to the
coefficients from a least-squares fit of individual harmonics to the data.
1.2.3 Total and harmonic variances
The standard formula for the total variance of a time series of length N
S2 ¼ 1
N
XN�1
n¼ 0
xn � xð Þ2 ð1:1Þ
was given in section in Section 1.2.1. The total variance is identical to the sum of
the variances at the individual harmonics as shown in Table 1.1 for N even and
N odd. The variance at an individual harmonic can be derived from Equation 1.1
by first substituting the Fourier synthesis equations for N even or N odd in
Table 1.1 into Equation 1.1 for xn and x. The substitution for x is A0. After
expanding the synthesis equation inside the parentheses in Equation 1.1,
squaring the result, and performing the required summation, the cross product
terms vanish (see Equation 1.2) and, using Equations 1.7 and 1.8, the remaining
squared terms will reduce to the equations for variance at any harmonic seen in
Table 1.1. With one exception, a harmonic variance is the sum of the squares of
the Fourier cosine and sine coefficients divided by two. The exception occurs at
harmonic m¼N/2. The expansion of Equation 1.1 into the sum of harmo-
nic variances is a good exercise in the application of orthogonality in time
series analysis.
1.2.4 Amplitude and phase representation
Instead of representing a time series by the appropriate sums of both sines and
cosines, an alternative representation is to use either sines or cosines alone and
include phase angles, as seen in the right-hand equations in Table 1.1 under Fourier
Synthesis. Because of orthogonality, the cosine term is shifted by 90� or p/2 radiansfrom the sine term for any harmonic. As a result, a single sinusoid can be represented
by two amplitude coefficients (Am and Bm) or, equivalently, by a single amplitude
coefficient Rm and a phase angle qm. The advantages of the latter are a slightly more
compact representation of xn and only one waveform for each harmonic.
Figure 1.7a illustrates the connection between the two forms of Fourier synthesis.
The dashed sinusoid with amplitude Rm in the right-hand panel has been decom-
posed into a cosine term and a sine term. Their respective amplitudes Am and Bmdepend on the location of the dashed sinusoid relative to the origin n¼ 0, that is, its
1.2 ANALYSIS AND SYNTHESIS 13