
Advances in the all oral HCV DAA to treat HCV/HIV: “No...
70
Advances in the all oral HCV DAA to treat HCV/HIV: “No longer a special population?” Josep Mallolas Hospital Clínic-University of Barcelona
Transcript of Advances in the all oral HCV DAA to treat HCV/HIV: “No...

Advances in the all oral HCV DAA to treat HCV/HIV: “No longer a special population?” Josep Mallolas Hospital Clínic-University of Barcelona

2
HCV in HIV/HCV: No longer a special population?
HIV/HCV co-infected patients
HIV/HCV epidemiology HIV/HCV natural history
Drug-drug interactions Treatment guidelines
Treatment Co-morbidities

3
HCV in HIV/HCV: No longer a special population?
HIV/HCV co-infected patients
HIV/HCV epidemiology HIV/HCV natural history
Drug-drug interactions Treatment guidelines
Treatment Co-morbidities
4
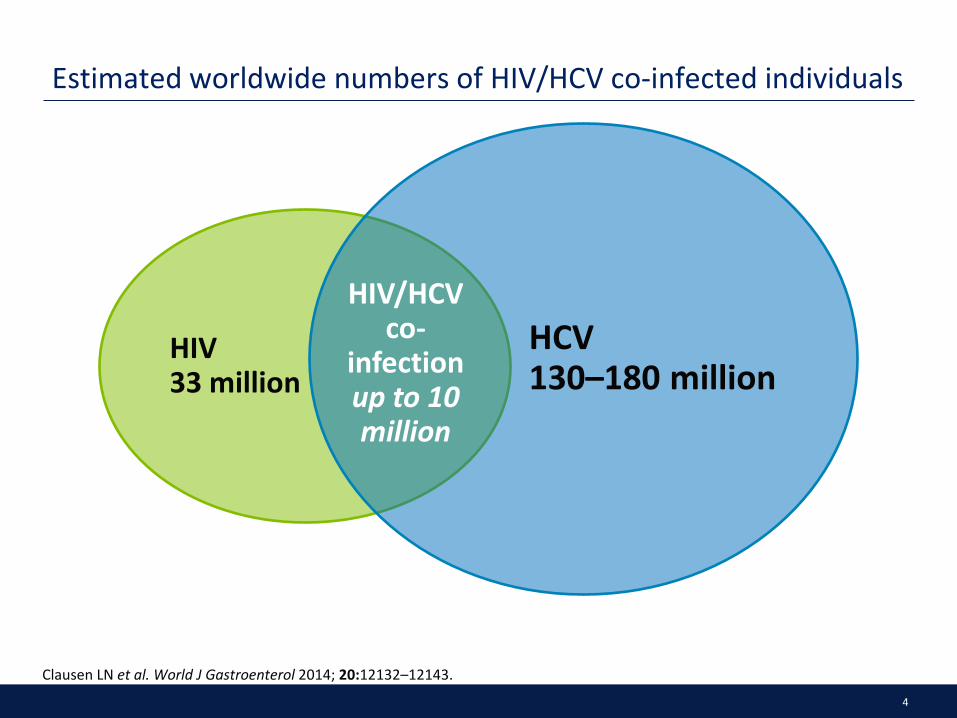
Estimated worldwide numbers of HIV/HCV co-infected individuals
Clausen LN et al. World J Gastroenterol 2014; 20:12132–12143.
HIV 33 million
HCV 130–180 million
HIV/HCV co-
infection up to 10 million

5
South: 41%
North: 23%
East: 47%
Center: 20%
Prevalence 1960/5957 patients: 33%1
Prevalence of HCV/HIV co-infection in Europe
1. Rockstroh, JK., et al. Influence of Hepatitis C Virus Infection on HIV-1 Disease Progression and Response to Highly Active Antiretroviral Therapy. J Infect Dis. 2005; 192:992–1002 2. Castro Iglesisas, MA. Epidemiología de la coinfección por VHC y VIH. GH Continuada. enero-febrero 2011. Vol. 10 N.º 1. 3. González García, J., et al. Estudio multicéntrico sobre prevalencia de las coinfecciones por virus de hepatitis, indicación de tratamiento de hepatitis crónica C y necesidad de trasplante hepático en pacientes infectados por el VIH en España. Estudio GESIDA 29/02-FIPSE 12185/01Enferm Infecc Microbiol Clin 2005;23(6):340-8.

6
HCV 450,000
HIV 150,000
HIV/HCV 50,000
Prevalence of HCV-HIV co-infection in Spain
1. Encuesta Hospitalaria de pacientes con VIH/sida. 2000-2013. Ministerio Sanidad.
7
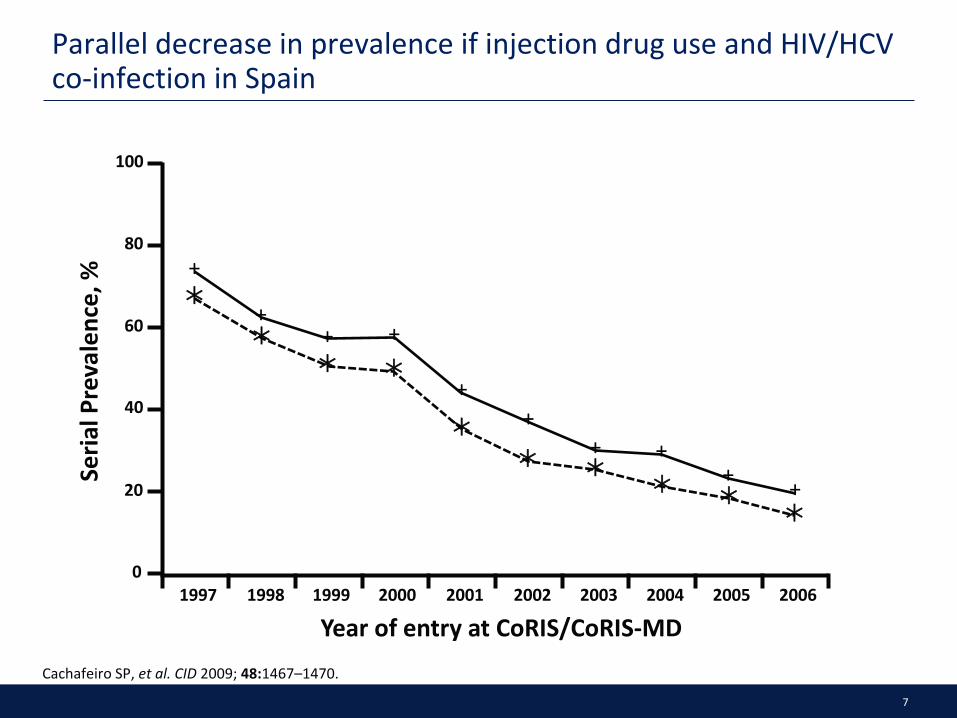
Parallel decrease in prevalence if injection drug use and HIV/HCV co-infection in Spain
Cachafeiro SP, et al. CID 2009; 48:1467–1470.
1997 1998 1999 2000 2001 2002 2003 2004 2005 2006
Year of entry at CoRIS/CoRIS-MD
Seria
l Pre
vale
nce,
%
100
80
60
40
20
0
+
+ + +
+ +
+ + + +
8
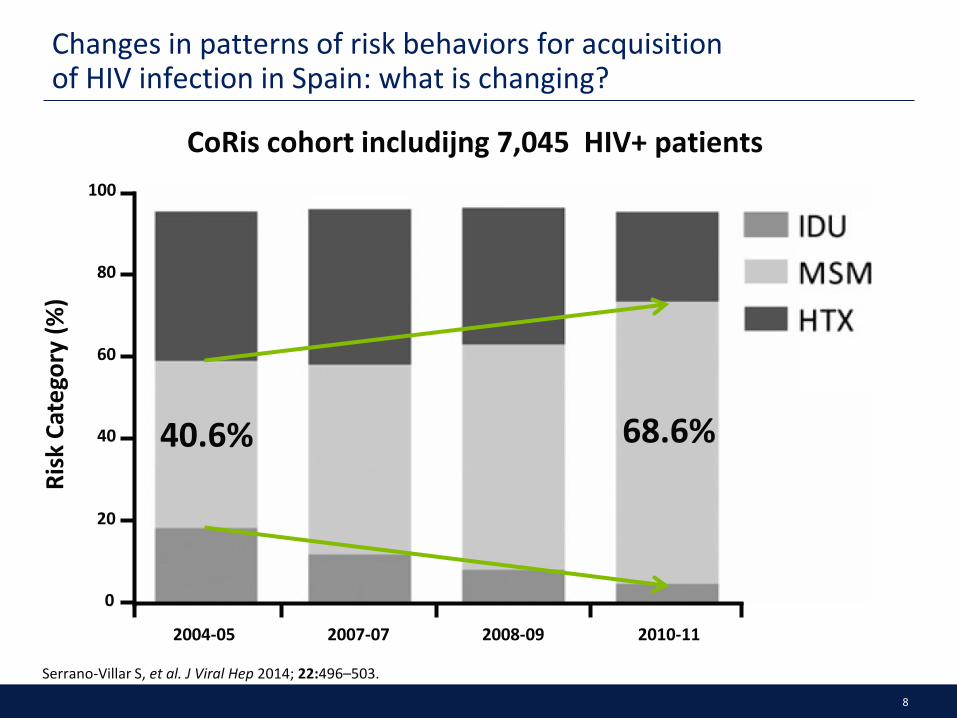
Changes in patterns of risk behaviors for acquisition of HIV infection in Spain: what is changing?
Serrano-Villar S, et al. J Viral Hep 2014; 22:496–503.
CoRis cohort includijng 7,045 HIV+ patients
2004-05 2007-07 2008-09 2010-11
Risk
Cat
egor
y (%
)
100
80
60
40
20
0
40.6% 68.6%

9
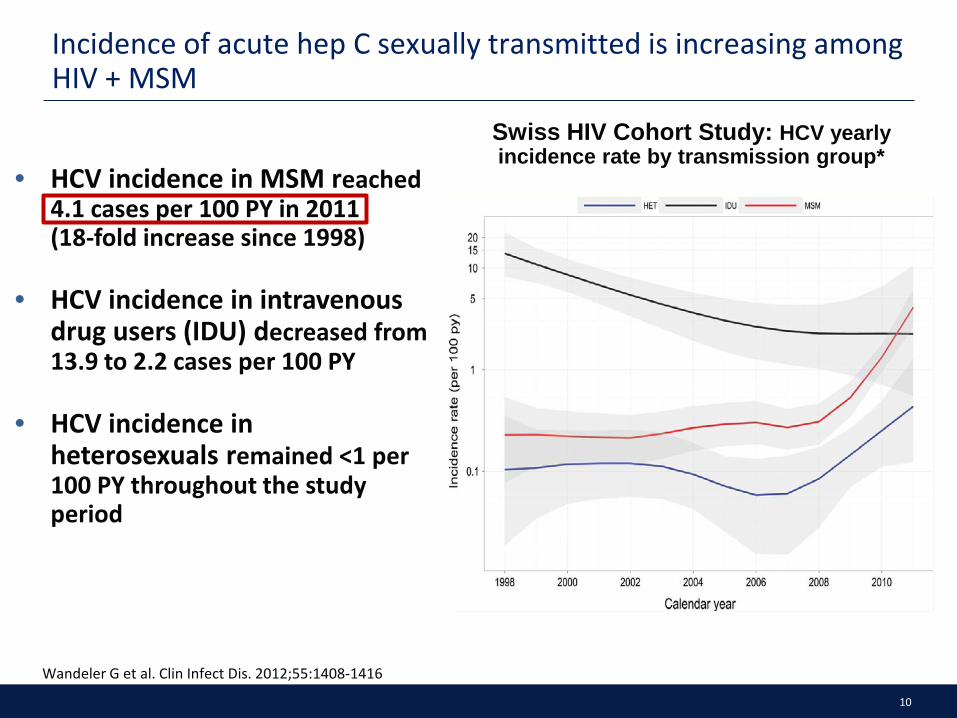
• HCV incidence in MSM reached 4.1 cases per 100 PY in 2011 (18-fold increase since 1998)
• HCV incidence in intravenous drug users (IDU) decreased from 13.9 to 2.2 cases per 100 PY
• HCV incidence in heterosexuals remained <1 per 100 PY throughout the study period
Swiss HIV Cohort Study: HCV yearly incidence rate by transmission group*
Incidence of acute hep C sexually transmitted is increasing among HIV + MSM
Wandeler G et al. Clin Infect Dis. 2012;55:1408-1416
10
• HCV incidence in MSM reached 4.1 cases per 100 PY in 2011 (18-fold increase since 1998)
• HCV incidence in intravenous drug users (IDU) decreased from 13.9 to 2.2 cases per 100 PY
• HCV incidence in heterosexuals remained <1 per 100 PY throughout the study period
Swiss HIV Cohort Study: HCV yearly incidence rate by transmission group*
Incidence of acute hep C sexually transmitted is increasing among HIV + MSM
Wandeler G et al. Clin Infect Dis. 2012;55:1408-1416

11
• HCV incidence in MSM reached 4.1 cases per 100 PY in 2011 (18-fold increase since 1998)
• HCV incidence in intravenous drug users (IDU) decreased from 13.9 to 2.2 cases per 100 PY
• HCV incidence in heterosexuals remained <1 per 100 PY throughout the study period
Swiss HIV Cohort Study: HCV yearly incidence rate by transmission group*
Incidence of acute hep C sexually transmitted is increasing among HIV + MSM
Wandeler G et al. Clin Infect Dis. 2012;55:1408-1416

12

13
• We observed an exponential increase in the incidence of AHC • The main route of infection was sexual
Num
ber o
f AHC
cas
es
05
10152025303540
2003 2004 2005 2006 2007 2008 2009 2010 2011 2012 2013 2014
Diagnosis of acute hepatitis C (AHC) in HIV–infected MSM from 2003 to 2014
Martínez-Rebollar et al. Enferm Infec Microbiol Clin, 2015

14
Results (I)
January 2003-March 2014
• n: 140 cases in 130 patients
– 126 M (MSM)
– 1 M (Drug addict)
– 3 F (1 het, 1 nos, 1 Drug Addict)
• 8 spontaneous clearance: Rate 5.4%
• 9 re-infections (1 patient with 3 episodes)
– Re-infection rate: 7.1%
Martínez-Rebollar et al. Enferm Infec Microbiol Clin, 2015

15
Results (I)
January 2003-March 2014
• n: 140 cases in 130 patients
– 126 M (MSM)
– 1 M (Drug addict)
– 3 F (1 het, 1 nos, 1 Drug Addict)
• 8 spontaneous clearance: Rate 5.4%
• 9 re-infections (1 patient with 3 episodes)
– Re-infection rate: 7.1%
Martínez-Rebollar et al. Enferm Infec Microbiol Clin, 2015
16
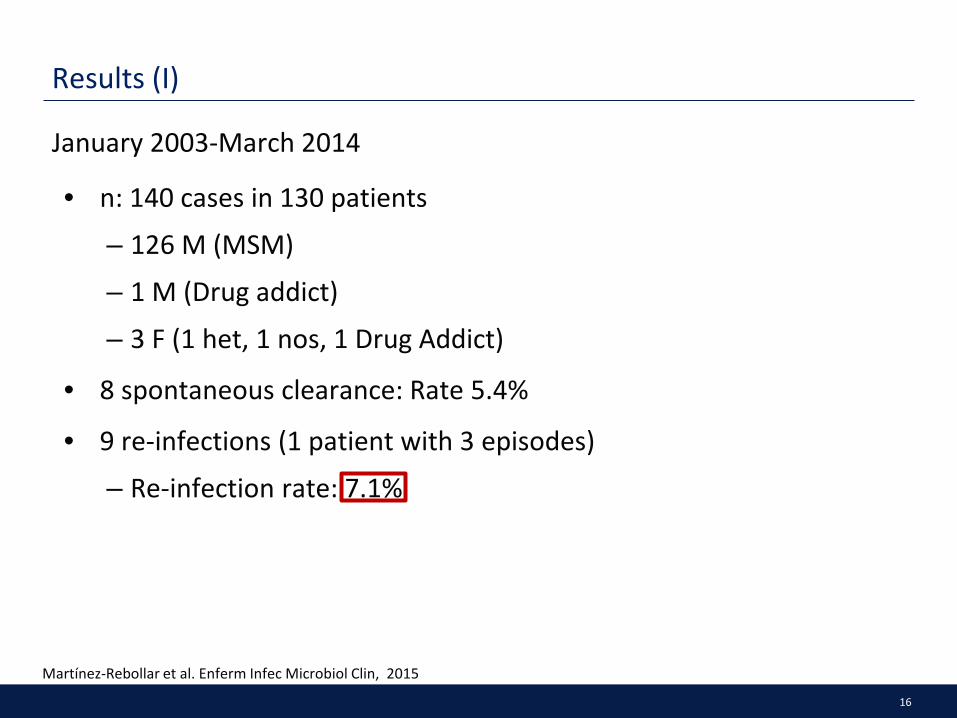
Results (I)
January 2003-March 2014
• n: 140 cases in 130 patients
– 126 M (MSM)
– 1 M (Drug addict)
– 3 F (1 het, 1 nos, 1 Drug Addict)
• 8 spontaneous clearance: Rate 5.4%
• 9 re-infections (1 patient with 3 episodes)
– Re-infection rate: 7.1%
Martínez-Rebollar et al. Enferm Infec Microbiol Clin, 2015

17
Results (II)
• Co-infection with other STD (40.8%) : (n: 93 cases)
– 17 Syphilis
– 3 Syphilis + LGV
– 3 Syphilis + Gonococcal urethritis + Chlamydia
– 5 LGV
– 3 Gonococcal urethritis +Chlamydia
– 1 Herpes
– 1 Inespecific proctitis
– 5 HIV primary infection
• SVR: 56%
Martínez-Rebollar et al. Enferm Infec Microbiol Clin, 2015

18
Results (II)
• Co-infection with other STD (40.8%) : (n: 93 cases)
– 17 Syphilis
– 3 Syphilis + LGV
– 3 Syphilis + Gonococcal urethritis + Chlamydia
– 5 LGV
– 3 Gonococcal urethritis +Chlamydia
– 1 Herpes
– 1 Inespecific proctitis
– 5 HIV primary infection
• SVR: 56%
Martínez-Rebollar et al. Enferm Infec Microbiol Clin, 2015

19
Results (II)
• Co-infection with other STD (40.8%) : (n: 93 cases)
– 17 Syphilis
– 3 Syphilis + LGV
– 3 Syphilis + Gonococcal urethritis + Chlamydia
– 5 LGV
– 3 Gonococcal urethritis +Chlamydia
– 1 Herpes
– 1 Inespecific proctitis
– 5 HIV primary infection
• SVR: 56%
Martínez-Rebollar et al. Enferm Infec Microbiol Clin, 2015

20
N=38 SVR: 47%

21
Phylogenetic analysis of an epidemic outbreak of acute hepatitis C in HIV-infected
patients by massive sequencing
Noelia Caro-Pérez (1) , María Martínez-Rebollar (2), Josep Gregori (3),(4) , Josep Quer (3), Patricia González (1), Martina Gambato (1), Hanna Visser (2), Juan I. Esteban (3), Josep Mallolas (2), Xavier Forns (1),
Sofía Pérez-del-Pulgar (1), Montse Laguno (2).
Liver Unit, Hospital Clínic, IDIBAPS, CIBERehd, Barcelona, Spain (1). Infectious Diseases Unit, Hospital Clínic, IDIBAPS (2). Liver Unit, Vall d'Hebron Institut de Recerca-Hospital Universitari Vall) d'Hebron , CIBERehd, Barcelona, (3) Roche Diagnostics SL. ,
Sant Cugat del Vallès, Barcelona, Spain (4)
Suggest this slide is deleted and the reference
placed on subsequent slides
22
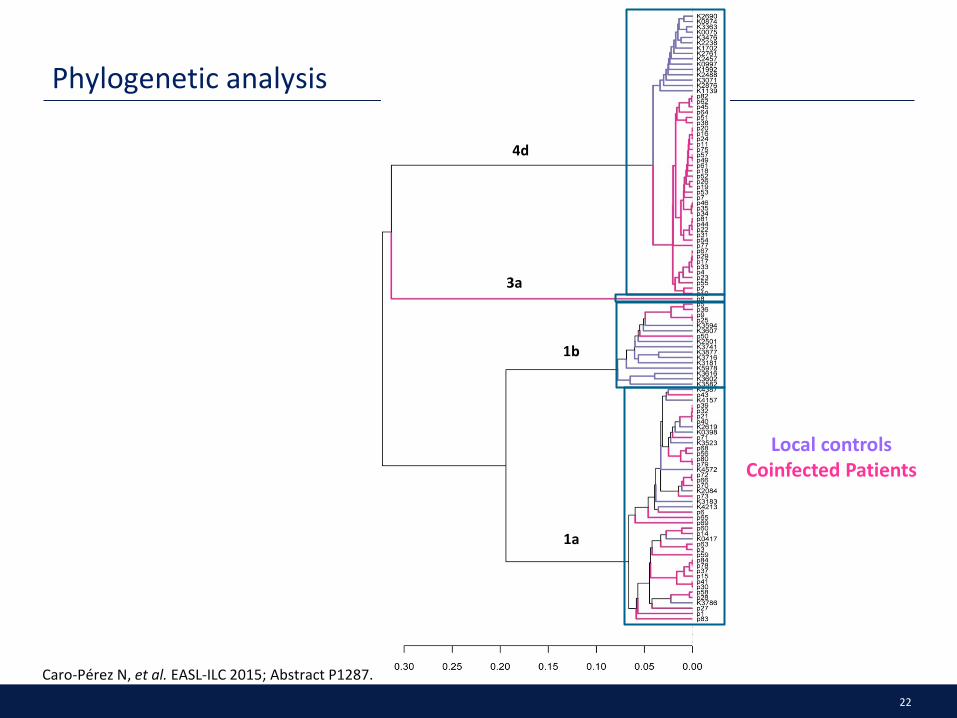
Phylogenetic analysis
Caro-Pérez N, et al. EASL-ILC 2015; Abstract P1287.
4d
3a
1b
1a
Local controls Coinfected Patients

23
Clusters identified by genotype
4d 1b 1a
1 CLUSTER
8 CLUSTERS 5 CLUSTERS
Caro-Pérez N, et al. EASL-ILC 2015; Abstract P1287.

24
Genetic distance analysis
Genetic distance p
dA(4d) < dA(1a) < 2.2e-16
dA(4d) < dA(1b) 0.039
dA(1b) < dA(1a) 0.0086
Caro-Pérez N, et al. EASL-ILC 2015; Abstract P1287.

25
Hypothetical network of infection in genotype 4d patients
• Monitoring common mutations in the quasispecies
• Date of acute hepatitis C diagnosis
p75
03/11/2008
p67
27/07/2010
p4
07/04/2011
p17
14/09/2012
p29
04/06/2012
p62
28/01/2009
p45
03/04/2013
p51
04/06/2013
p38
04/01/2013
p16
14/03/2012
p57
16/10/2013
Caro-Pérez N, et al. EASL-ILC 2015; Abstract P1287.

26
HCV in HIV/HCV: No longer a special population?
HIV/HCV co-infected patients
HIV/HCV epidemiology HIV/HCV natural history
Drug-drug interactions Treatment guidelines
Treatment Co-morbidities

27
HCV/HIV Coinfection: Natural History Considerations
• Accelerated rates of fibrosis progression – Possible weak cellular immune response to HCV antigens – HIV-associated immune activation may influence progression of liver disease – Activation of hepatic stellate cells – HCV-associated proinflammatory cytokines may impact HIV disease
• HCV coinfection is associated with higher rates of morbidity and mortality related to end-stage liver disease – Lower rates of spontaneous HCV clearance in HIV patients – Faster progression to cirrhosis and decompensated liver disease – HCC occurs at a younger age and associated with shorter survival
Lin W, et al. J Infect Dis. 2013;207(suppl 1):S13-S18. Weber R, et al. Arch Intern Med. 2006;166:1632-1641. Ioannou GN, et al. Hepatology. 2013;57:249-257. Weber R, et al. HIV Med. 2013;14:195-207. Macias J, et al. Clin Infect Dis. 2013;57:1401-1408. Curry MP. J Infect Dis. 2013(suppl 1):S40-S44. Chen TY, et al. Clin Infect Dis. 2009;49:1605-1615.

28
Increase with CD4 <200/mm3, ETOH, age
Fibr
osis
Gra
des
(MET
AVIR
Sco
re)
Duration of HCV Infection (years)
HIV+ (n = 122) Matched controls (n = 122) Simulated controls (n = 122)
4
3
2
1
0 40 30 20 10 0
Effect of HIV on HCV Liver Fibrosis Progression Rate
Benhamou et al. Hepatology 1999;30:1054.

29
ALIVE Study: HIV, Age, and Severity of HCV-Related Liver Diseases
Prospective cohort of HCV-infected IDUs (2006-2011) (n=1176) • HIV co-infected (n=394) • Baseline and semi-annual
elastography
Fibrosis was significantly greater in HCV/HIV co-infected versus HCV monoinfection (P<0.001) • No cirrhosis (12.9% versus 9.5%) • With cirrhosis (19.5% versus 11.0%) • Independently associated with
increasing age and HIV infection
HCV/HIV patients have liver fibrosis similar to HCV mono-infected patients who are nearly 10 years older
ALIVE: AIDS Linked to the IntraVenous Experience. Kirk GD, et al. Ann Intern Med. 2013;158:658-666.
Liver Fibrosis and Age: HCV/HIV Versus HCV Infection
Pred
icte
d Fi
broS
can
Scor
e (k
Pa)
Age (years)
HCV/HIV
HCV
9.2 years 6
8
10
12
14
30 35 40 45 50 55 60

30
Risk of Liver Decompensation in HCV/HIV Patients With Advanced Fibrosis
Retrospective Spanish study (11 tertiary centers (1990-2002) (n=892) • HCV treatment-naïve or no SVR • Biopsy (n=317) or LSM (n=575)
proven advanced fibrosis
Liver decompensation rate (events/100 patient-years): • Biopsy: 2.3 (1.7-3.1) • LSM: 3.98 (3.04-5.21)
Risk of decompensation increased by baseline fibrosis stage (for both biopsy and LSM) • Implications for immediate HCV
therapy
LSM: liver stiffness measurement. Macias J, et al. Clin Infect Dis. 2013;57:1401-1408.
Probability of Decompensation
Patie
nts W
ith D
ecom
pens
atio
n (%
)
Time (years)
0
10
20
30
40
50
60
1% 2% 5%
20%
4%
13%
23%
44%
1 (n=149/168)
3 (n=128/150)
5 (n=112/116)
>5 (n=81/77)
P=0.023 for trend
Baseline Fibrosis (biopsy) F3 F4

31
GESIDA HIV/HCV Cohort: HCV Eradication Reduces Liver-Related Outcomes
Berenguer J, et al. J Hepatol. 2013;58:1104-1112.
Liver Decompensation
Follow-Up (months)
Liver-Related Events
Patie
nts (
%)
Follow-Up (months)
Patie
nts (
%)
HCC Mortality
Follow-Up (months)
Patie
nts (
%)
Follow-Up (months)
80
85
90
95
100
96 0 12 24 36 48 60 72 84
SVR*†
Relapse†
NR
*P<0.05 versus NR and relapse; †P<0.05 versus NR.
Patie
nts (
%)
80
85
90
95
100 SVR†
Relapse†
NR
96 0 12 24 36 48 60 72 84 80
85
90
95
100 SVR†
Relapse†
NR
96 0 12 24 36 48 60 72 84
80
85
90
95
100SVR*†
Relapse†
NR
96 0 12 24 36 48 60 72 84

32
HCV in HIV/HCV: No longer a special population?
HIV/HCV co-infected patients
HIV/HCV epidemiology HIV/HCV natural history
Drug-drug interactions Treatment guidelines
Treatment Co-morbidities

33
P/R = PegIFN/RBV.
SVR12/24 rates over time in HCV GT1 subjects co-infected with HIV — from IFN/RBV to single DAAs ± P/R
7 14
29
63 74 74
89 85
0
20
40
60
80
100
IFN + RBV PegIFN PegIFN/RBV BOC + P/R TVR + P/R SMV + P/R SOF + P/R SOF + RBV
SVR
(%)
Torriani FJ, et al. N Engl J Med 2004; 351:438–450; Sulkowski M, et al. Lancet Infect Dis 2013; 13:597–605;
Sulkowski M, et al. Ann Intern Med 2013; 159:86–96; Dieterich D, et al. EACS 2013. Abstract LBPS9/5;
Rodriguez-Torres M, et al. ID Week 2013; Poster 714; Molina JM, et al. AIDS 2014, Abs 105LB.

34
SVR12/24 rates over time in HCV GT1 subjects co-infected with HIV — from IFN/RBV to single DAAs ± P/R
P/R = PegIFN/RBV.
7 14
29
63 74 74
89 85
0
20
40
60
80
100
IFN + RBV PegIFN PegIFN/RBV BOC + P/R TVR + P/R SMV + P/R SOF + P/R SOF + RBV
SVR
(%)
Torriani FJ, et al. N Engl J Med 2004; 351:438–450; Sulkowski M, et al. Lancet Infect Dis 2013; 13:597–605;
Sulkowski M, et al. Ann Intern Med 2013; 159:86–96; Dieterich D, et al. EACS 2013. Abstract LBPS9/5;
Rodriguez-Torres M, et al. ID Week 2013; Poster 714; Molina JM, et al. AIDS 2014, Abs 105LB.
But now we have emerging data with all oral DAAs

35
PHOTON-2: Sofosbuvir + Ribavirin in GT1-4 HCV Pts Coinfected With HIV
• Ongoing, nonrandomized, open-label phase III study
– Stable ART (HIV-1 RNA < 50 copies/mL for ≥ 8 wks before enrollment); CD4: > 200 cells/mm3 if ART treated; > 500 cells/mm3 if ART naive – 97% on ART: TDF/FTC, 100%; EFV: 25%; ATV/RTV: 17%; DRV/RTV: 21%; RAL:
23%; RPV: 5%
• 20% of pts with compensated cirrhosis
• Primary endpoint: SVR12
Molina JM, et al. AIDS 2014. Abstract MOAB0105LB.
Wk 24
Sofosbuvir + Ribavirin (n = 200)
Sofosbuvir + Ribavirin (n = 55)
Sofosbuvir + Ribavirin (n = 19)
Wk 12
Tx-naive GT1, 3, 4
Tx-naive GT2
Tx-exp’d GT2, 3
Sofosbuvir 400 mg QD; weight-based ribavirin 1000 or 1200 mg/day

36
PHOTON-2 Study: Overall SVR12 Rates and Virologic Failure
HCV treatment-naïve genotypes 1, 3, 4 and HCV treatment-experienced genotypes 2,3: 24 weeks of therapy. HCV treatment-naïve genotypes 2, 3: 12 weeks of therapy. Molina J-M, et al. 20th IAC. Melbourne, 2014. Abstract MOAB0105LB.
85% 88% 89% 84%
0
20
40
60
80
100
Genotype 1 Genotype 2 Genotype 3 Genotype 4
95/112 22/25 94/106 26/31
14 (13%) 2 (8%) 10 (9%) 5 (16%) 0 0 1 (0.9%) 0
Relapse: Breakthrough:
SVR1
2 (%
)
37
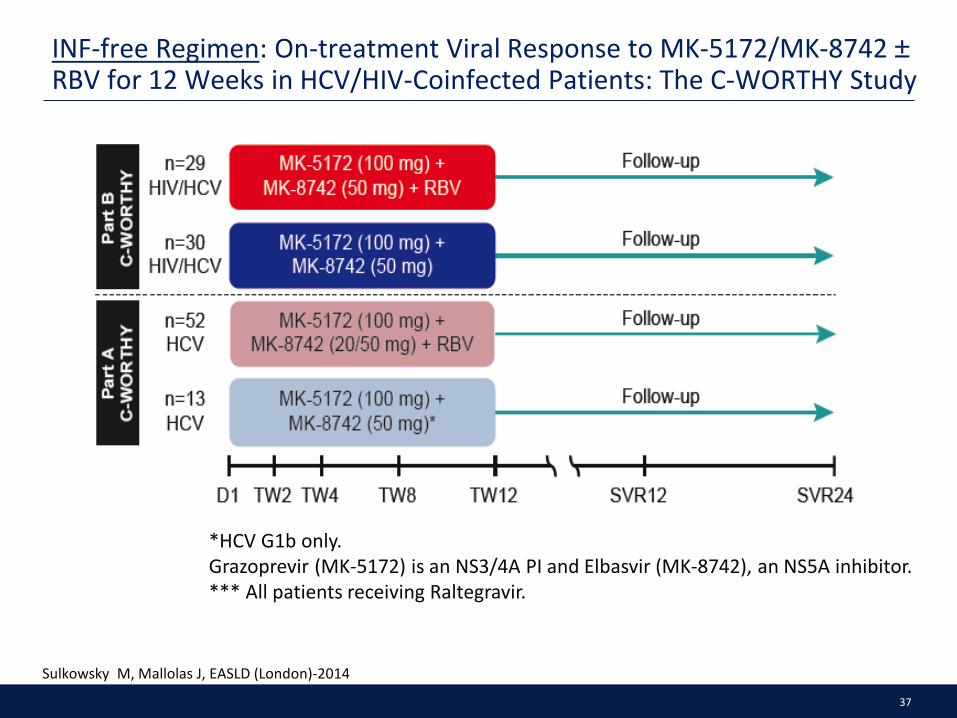
*HCV G1b only. Grazoprevir (MK-5172) is an NS3/4A PI and Elbasvir (MK-8742), an NS5A inhibitor. *** All patients receiving Raltegravir.
INF-free Regimen: On-treatment Viral Response to MK-5172/MK-8742 ± RBV for 12 Weeks in HCV/HIV-Coinfected Patients: The C-WORTHY Study
Sulkowsky M, Mallolas J, EASLD (London)-2014

38
INF-free Regimen: On-treatment Viral Response to MK-5172/MK-8742 ± RBV for 12 Weeks in HCV/HIV-Coinfected Patients: The C-WORTHY Study
Sulkowsky M, Mallolas J, EASLD (London)-2014
Virologic responses (per-protocol population)
39
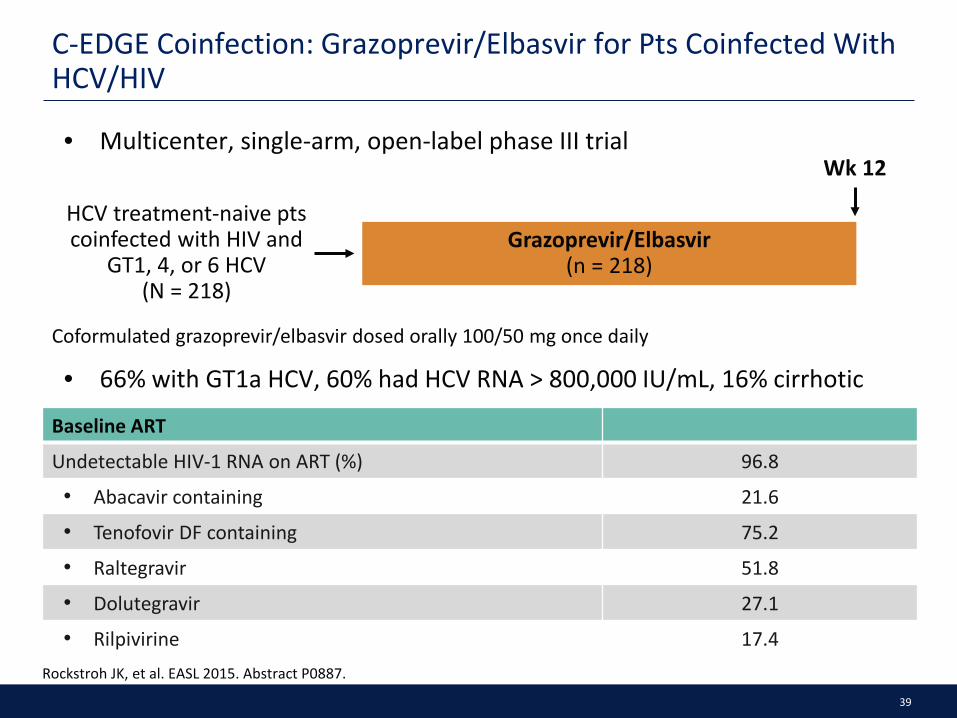
C-EDGE Coinfection: Grazoprevir/Elbasvir for Pts Coinfected With HCV/HIV
• Multicenter, single-arm, open-label phase III trial
Rockstroh JK, et al. EASL 2015. Abstract P0887.
Grazoprevir/Elbasvir (n = 218)
HCV treatment-naive pts coinfected with HIV and
GT1, 4, or 6 HCV (N = 218)
Wk 12
Coformulated grazoprevir/elbasvir dosed orally 100/50 mg once daily
Baseline ART
Undetectable HIV-1 RNA on ART (%) 96.8
• Abacavir containing 21.6
• Tenofovir DF containing 75.2
• Raltegravir 51.8
• Dolutegravir 27.1
• Rilpivirine 17.4
• 66% with GT1a HCV, 60% had HCV RNA > 800,000 IU/mL, 16% cirrhotic

40
C-EDGE Coinfection: Key Findings
• No subgroup provided an efficacy advantage or disadvantage
• New NS3, NS5A RAVs detected at failure in 5 of 6 pts who relapsed
• Short-lived HIV-1 RNA increases occurred in 2 pts on ART during grazoprevir/elbasvir treatment: both resuppressed HIV-1 RNA without change of ART
• During 12 wks of treatment, no significant changes in CD4+ cell count (n = 207)
• Grazoprevir/elbasvir well tolerated: no pt discontinued for AEs and no serious treatment-related AEs
Rockstroh JK, et al. EASL 2015. Abstract P0887.
SVR12 With 12 Wks GZR/EBV According to Genotype
LTFU or DC* 4 3 1 0
Breakthrough 0 0 0 0
Relapse 6 4 1 1
Reinfection 1 1 0 0
*Unrelated to virologic failure.
SVR1
2 (%
)
136/ 144
42/ 44
27/ 28
All Pts GT1a GT1b GT4
95.0 94.4 95.5 96.4
207/ 218
0
100
80
60
20 n/N =
40

41
TURQUOISE-I: SVR12 rates in HIV/HCV co-infected patients treated with OBV/PTV/r + DSV + RBV
Sulkowski MS, et al. JAMA 2015; 313:1223–1231.
OBV/PTV/r + DSV + RBV for 12 or 24 weeks in GT1 treatment-naive and -experienced patients, all with HIV/HCV co-infection
OBV/PTV/r + DSV + RBV
(n=31)
0 24 12
Study weeks
OBV/PTV/r + DSV + RBV (n=32)
HCV GT1, naive or
experienced, (N=63)*
* Including 6 (19%) patients with cirrhosis (F4) in the 12 week arm and 6 (19%) patients with cirrhosis (F4) in the 24 week arm. DSV = dasabuvir; OBV = ombitasvir; PTV/r = paritaprevir/ritonavir.
94 91
0
20
40
60
80
100
SVR1
2 (%
) 12 weeks 24 weeks OBV/PTV/r + DSV + RBV 2 patients in the 24-week arm had recurrence of HCV believed to be
due to re-infection
n N
29 32
29 31

42
TURQUOISE-I: high SVR12 rates in patients receiving either atazanavir or raltegravir
ART = anti-retroviral therapy. Eron JJ, et al. J Int AIDS Soc. 2014; 17(Suppl 3):19500.
Atazanavir ART: • 1 patient withdrew consent
Raltegravir ART: • 1 patient in the 12-week
arm relapsed • 1 patient in the 24-week arm
experienced viral breakthrough • 2 patients in the 24-week arm had
recurrence of HCV believed to be due to re-infection
94 93 100 85
Atazanavir Raltegravir0
20
40
60
80
100
SVR1
2 (%
)
12 weeks 24 weeks
15 16
14 15
12 12
17 20
n N
Response in patients on HIV ART Reasons for non-response

43
Time to HCV RNA <25 IU/mL in HCV mono-infected and HIV/HCV co-infected patients and SVR12 by time to HCV RNA Suppression
Wyles D, et al. CROI 2015. Abstract 147
<25 IU/mL (LLOQ)
Treatment Week
Cum
ulat
ive
%
0 2 40
20
40
60
80
100
1 6+
<15 IU/mL (LLOD)
Treatment Week
Cum
ulat
ive
%
0 2 40
20
40
60
80
100
1 6+
HCV Mono-infectedHCV/HIV-1 Co-infected
SVR1
2, %
Pat
ient
s
Week 1 Week 2 Week 4 Week 6+0
20
40
60
80
10097 9698 10097 98
617628
2930
9921024
55
2425
355362
HCV Mono-infected HCV/HIV-1 Co-infected
NA92
1213
OBV/PTV/r + DSV + RBV

44
96 95 97 96 94
0
20
40
60
80
100
Overall Naive Exp Nocirrhosis
Cirrhosis
SVR1
2 (%
)
n N
321 335
179 185
142 150
258 268
63 67
ION-4: LDV/SOF in HCV GT1 or 4 patients with HIV co-infection — SVR12 rates
* Including 8 (2.4%) patient with GT4 and 67 (20%) patients with cirrhosis. Exp = experienced. Cooper E, et al. EASL-ILC 2015; Poster presentation P1353.
LDV/SOF (N=335)
0 12 Study weeks
Study design: GT1 and 4 with
HIV/HCV co-infection*
Efficacy results: GT1 and 4 with
HIV/HCV co-infection

ION-4: LDV/SOF Effective Across All Pt Demographic and Disease Subgroups
10 relapses all in black pts
No pt with HIV virologic rebound
No discontinuation of therapy due to adverse events
4 pts experienced increase in creatinine > 0.4 mg/dL
– 2 completed treatment without change in ART
– 1 pt changed TDF to new NRTI
– TDF dose reduced in 1 pt
Black Nonblack 1a 1b 4 < 800,000 ≥ 800,000 < 30 ≥ 30 CC CT TT TDF/FTC/EFV TDF/FTC + RAL TDF/FTC/RPV < 350 ≥ 350
HCV Genotype
Baseline HCV RNA (IU/mL)
Baseline BMI (kg/m2)
Race
IL28B
ARV Regimen
Baseline CD4 (cells/mm³)
Overall
60 70 80 90 100
SVR12, % (95% CI)
Statistically significant in multivariate analysis
Naggie S, et al. CROI 2015. Abstract 152LB. Cooper C et al. EASL 2015. Reproduced with permission.

ION-4: Resistance Analysis and LDV/SOF Drug–Drug Interactions With bPIs
Deep sequencing at BL identified 67 (20%) pts with NS5A RAVs[1]
– 63 (94%) of these pts achieved SVR12
RAVs in NS5A found in 10/12 pts with virologic failure
No S282T mutation in NS5B found in any pt at BL or virologic failure
In drug–drug interaction studies with LDV/SOF and boosted PIs and TFV[2]
– LDV/SOF increases ATV, RTV, and TFV exposure
– ATV/RTV + TDF/FTC increases LDV
– DRV/RTV + TDF/FTC decreases SOF
Staggered administration did not mitigate interactions but interactions not deemed clinically relevant
1. Naggie S, et al. CROI 2015. Abstract 152LB. Cooper C et al. EASL 2015. 2. German P, et al. CROI 2015. Abstract 82.

ALLY-2: SOF + DCV in GT1-6 HCV/HIV-Coinfected Pts
Phase III open-label study
– Non GT1 < 20% in each cohort; compensated cirrhosis < 50% overall; HIV-1 RNA < 50 c/mL and CD4+ ≥ 100 in pts on ART; CD4 ≥ 350 in pts not on ART
– ART allowed: PI/RTV, NRTIs, NNRTIs, INSTIs, MVC, ENF
Primary endpoint: SVR12 in GT1 naive pts treated for 12 wks
Wyles DL, et al. CROI 2015. Abstract 151LB. EASL 2015. Abstract LP01
Treatment-naive pts (N = 151)
SOF 400 mg QD + DCV 30/60/90* mg QD
(n = 101)
SOF 400 mg QD + DCV 30/60/90* mg QD
(n = 52)
Treatment-experienced pts (N = 52)
Wk 12
Pts followed to Wk 36
SOF 400 mg QD + DCV 30/60/90* mg QD
(n = 50)
Wk 8
*Standard dose of 60 mg adjusted for ART: 30 mg with RTV; 90 mg with NNRTIs except RPV.

High SVR12 rates with 12 wks SOF + DCV
– Large decline in SVR rate with shortening to 8 wks
12-Wk 12-Wk 8-Wk 12-Wk 12-Wk 8-Wk
ALLY-2: Virologic Outcomes With SOF + DCV in HIV/HCV-Coinfected Pts
In 12-wk groups analyzed by GT, 100% with SVR12 except GT1a
– GT1a naive: 96%; exp’d: 97%
Similar SVR12 rates in pts with or without baseline NS5A RAVs
12 pts with relapse, 10 in 8-wk arm
– 1 in 8-wk arm had emergent NS5A RAVs
No NS5B RAVs at BL or time of failure
No discontinuation of therapy due to AEs
10 pts with HIV-1 RNA > 50 at EOT
– 8 with repeat testing; 7 with suppression without change in ART; 1 with HIV-1 RNA of 59; 2 LTFU
2 with HIV VF = HIV-1 RNA ≥ 400 c/mL
SVR
12, %
96
0
20
40
60
80
98
76
97 98
n/N = 80/ 83
43/ 44
100
31/ 41
98/ 101
51/ 52
76
38/ 50
Wyles DL, et al. CROI 2015. Abstract 151LB. EASL 2015. Abstract LP01.
Naive Exp’d Naive Exp’d
GT1 Overall

DACLATASVIR PLUS SOFOSBUVIR WITH OR WITHOUT RIBAVIRIN IN PATIENTS WITH HIV-HCV COINFECTION: INTERIM ANALYSIS OF A
FRENCH MULTICENTER COMPASSIONATE USE PROGRAM
Hélène Fontaine, Karine Lacombe, Catherine Dhiver et al.
EASL 2015 April 22-26 Vienna Austria
50
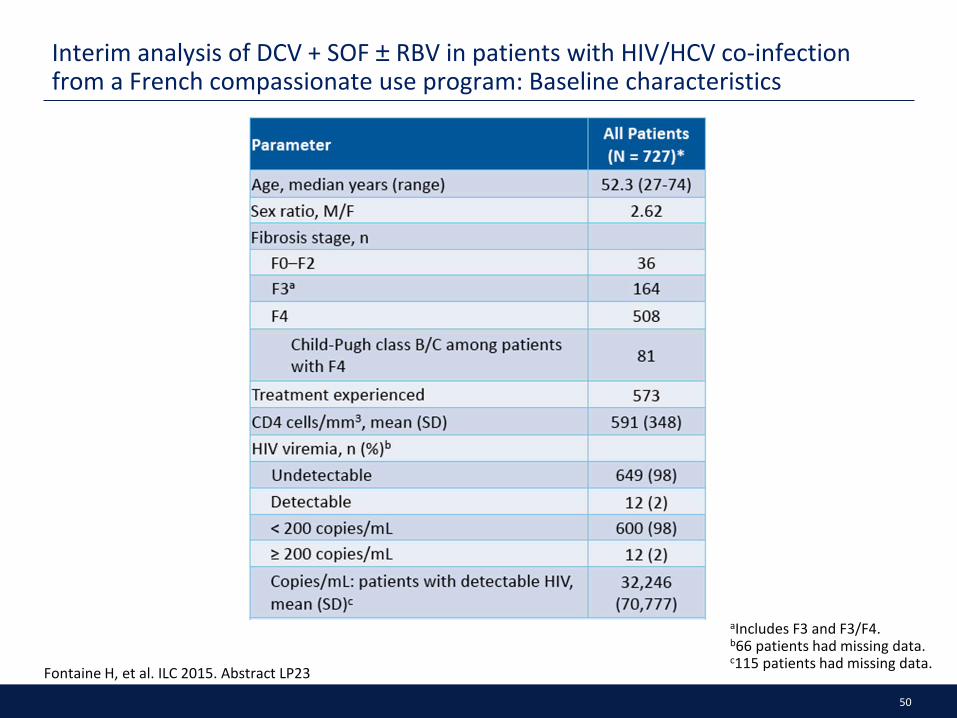
Interim analysis of DCV + SOF ± RBV in patients with HIV/HCV co-infection from a French compassionate use program: Baseline characteristics
aIncludes F3 and F3/F4. b66 patients had missing data. c115 patients had missing data. Fontaine H, et al. ILC 2015. Abstract LP23
51
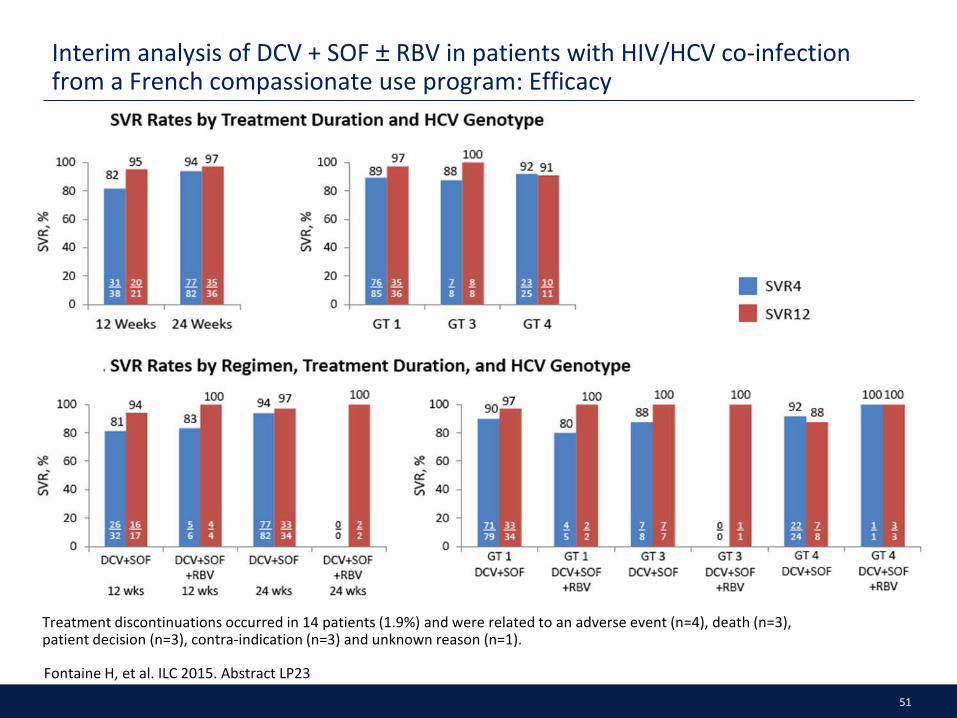
Interim analysis of DCV + SOF ± RBV in patients with HIV/HCV co-infection from a French compassionate use program: Efficacy
Treatment discontinuations occurred in 14 patients (1.9%) and were related to an adverse event (n=4), death (n=3), patient decision (n=3), contra-indication (n=3) and unknown reason (n=1).
Fontaine H, et al. ILC 2015. Abstract LP23

52
HCV in HIV/HCV: No longer a special population?
HIV/HCV co-infected patients
HIV/HCV epidemiology HIV/HCV natural history
Drug-drug interactions Treatment guidelines
Treatment Co-morbidities

53
Co-morbidities among HIV/HCV co-infected patients
• Among 8,039 HIV infected veterans, 5251 (65.3%) had HCV co-infection
• All cause mortality rate was:
• 74.1 (70.4 to 77.9) per 1000 person years among veterans with HIV/HCV co-infection
• 39.8 (36.3 to 43.6) per 1000 person years among veterans with HIV mono-infection
• Positive predictors of mortality included:
• Decompensated liver disease (2.33 (1.98 to 2.74))
• Coronary artery disease (1.74 (1.32 to 2.28))
• Chronic kidney disease (1.62 (1.36 to 1.92))
• Anemia (1.58 (1.31 to 1.89))
Erqou S, et al. ISRN Gastroenterol. 2014 Apr 7;2014:764540. doi: 10.1155/2014/764540.

54
RUBY-I: Ongoing study in HCV infected patients with advanced renal disease treated with OBV/PTV/r + DSV ± RBV — design
Pockros PJ, et al. EASL-ILC 2015; Oral presentation L01.
Day 1 Week 12
Open-label Treatment
OBV/PTV/r + DSV
OBV/PTV/r + DSV + RBV
SVR12
Week 24
GT1b
GT1a
• For GT1a: RBV 200 mg QD • For GT1b: No RBV
SVR4

55
RUBY-I: Ongoing study in HCV infected patients with advanced renal disease treated with OBV/PTV/r + DSV ± RBV — efficacy
Pockros PJ, et al. EASL-ILC 2015; Oral presentation L01.
All patients completing treatment to date had virologic response
Virologic response has been sustained in all patients who have reached post-treatment weeks 4 and 12
Time-point N Virologic
Response (n) Percent
End of Treatment 14 14 100
Post-treatment Week 4 10 10 100
Post-treatment Week 12 2 2 100
56
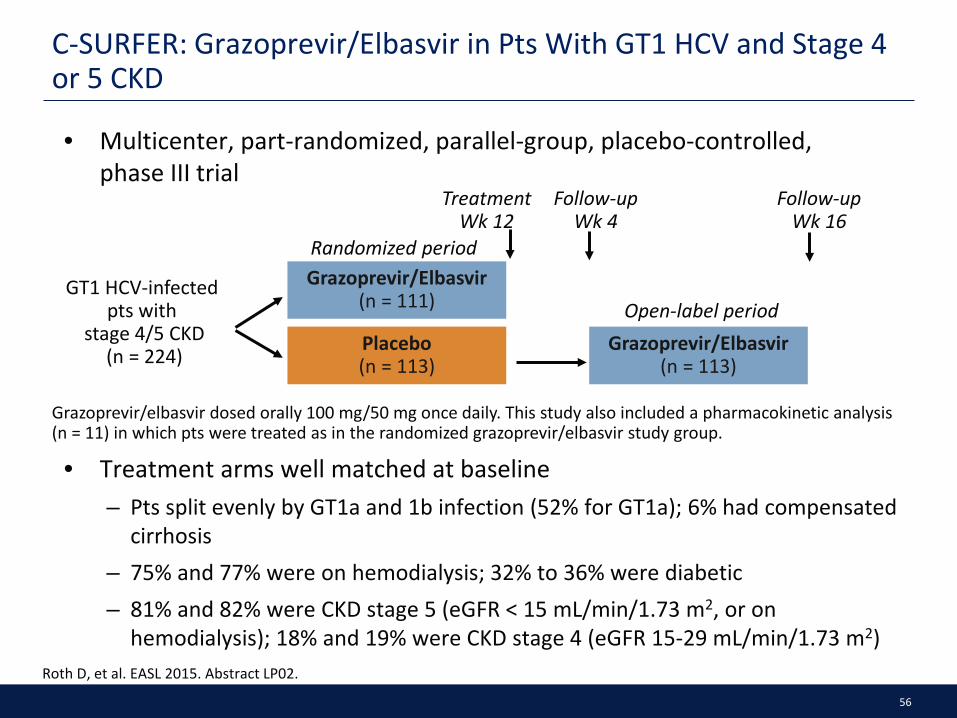
C-SURFER: Grazoprevir/Elbasvir in Pts With GT1 HCV and Stage 4 or 5 CKD
• Multicenter, part-randomized, parallel-group, placebo-controlled, phase III trial
Roth D, et al. EASL 2015. Abstract LP02.
Grazoprevir/Elbasvir (n = 111)
Placebo (n = 113)
GT1 HCV-infected pts with
stage 4/5 CKD (n = 224) Grazoprevir/Elbasvir
(n = 113)
Grazoprevir/elbasvir dosed orally 100 mg/50 mg once daily. This study also included a pharmacokinetic analysis (n = 11) in which pts were treated as in the randomized grazoprevir/elbasvir study group.
Treatment Wk 12
Follow-up Wk 4
Follow-up Wk 16
Open-label period
Randomized period
• Treatment arms well matched at baseline – Pts split evenly by GT1a and 1b infection (52% for GT1a); 6% had compensated
cirrhosis – 75% and 77% were on hemodialysis; 32% to 36% were diabetic – 81% and 82% were CKD stage 5 (eGFR < 15 mL/min/1.73 m2, or on
hemodialysis); 18% and 19% were CKD stage 4 (eGFR 15-29 mL/min/1.73 m2)

57
C-SURFER: Efficacy Results
Modified analysis set: pts in pharmacokinetic substudy and pts randomized to immediate treatment who received ≥ 1 drug dose; excludes pts who died or discontinued where cause not related to study treatment. Full analysis set: all pts receiving ≥ 1 drug dose. *1 pt relapsed on each arm. †6 pts in the full analysis set discontinued unrelated to treatment: lost to follow-up (n = 2), n = 1 each for death, noncompliance, withdrawal by subject, and withdrawal by physician (owing to violent behavior). Roth D, et al. EASL 2015. Abstract LP02.
GZR/EBR 12 wks
SVR1
2 (%
)
94 99
115/ 116*
115/ 122*†
100
6/6
100
61/61
98.2
54/55
98.9
86/87
97.6
40/41
Cirrhotic GT 1a HCV
GT 1b HCV
Diabetic On hemodialysis
Modified Full Analysis Set
Full Analysis Set
20 n/N =
100
80
60
40
0

58
HCV in HIV/HCV: No longer a special population?
HIV/HCV co-infected patients
HIV/HCV epidemiology HIV/HCV natural history
Drug-drug interactions Treatment guidelines
Treatment Co-morbidities

59
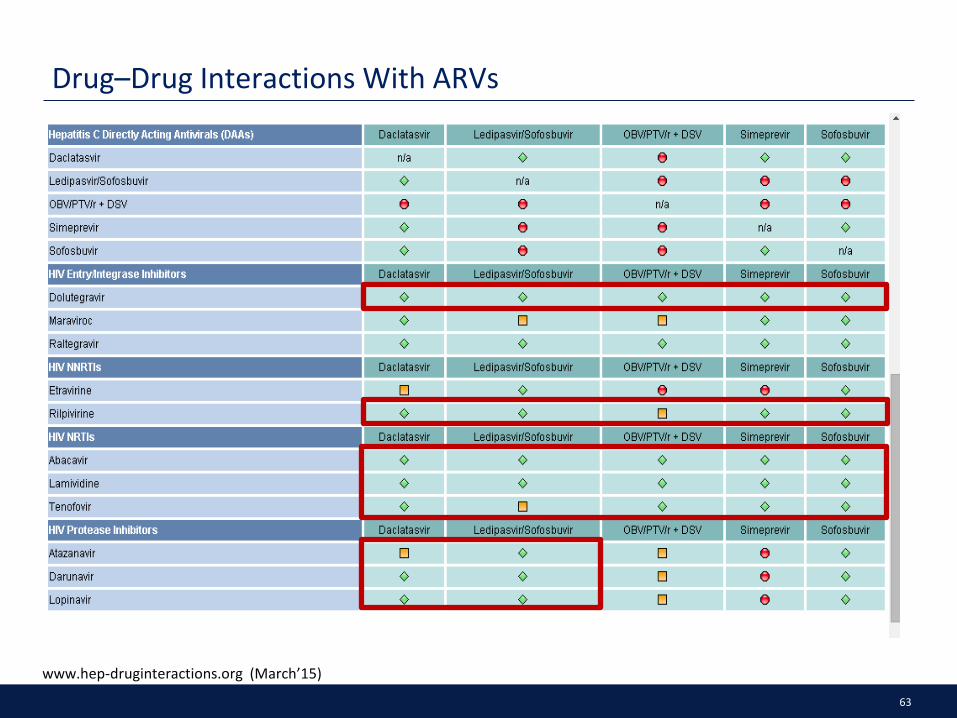
Drug–Drug Interactions With ARVs
www.hep-druginteractions.org (March’15)

60
Drug–Drug Interactions With ARVs
www.hep-druginteractions.org (March’15)

61
Drug–Drug Interactions With ARVs
www.hep-druginteractions.org (March’15)
62
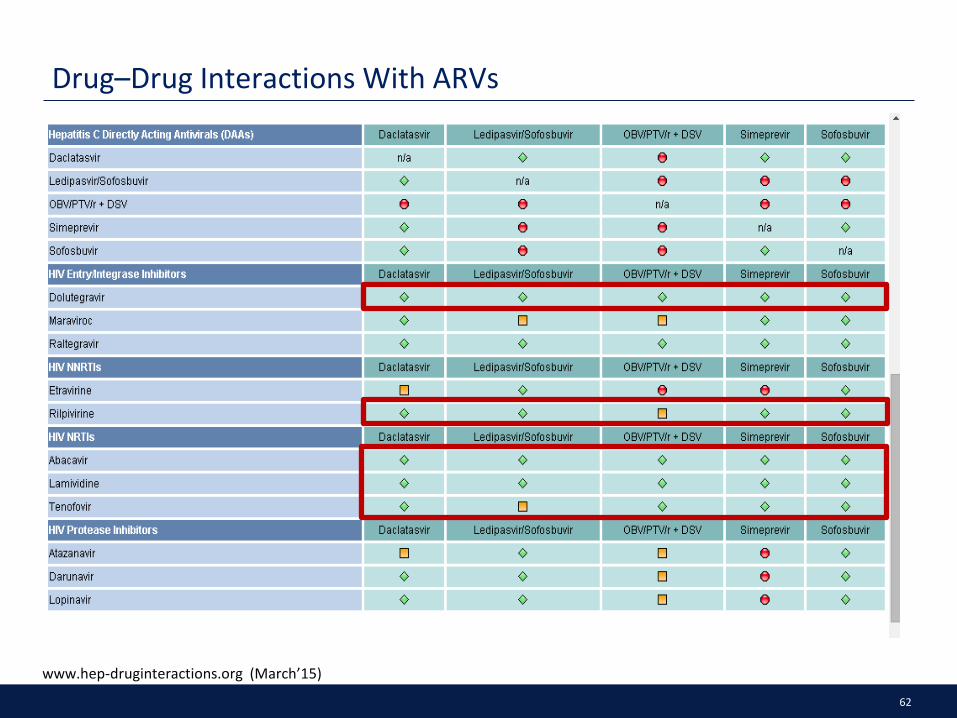
Drug–Drug Interactions With ARVs
www.hep-druginteractions.org (March’15)
63
Drug–Drug Interactions With ARVs
www.hep-druginteractions.org (March’15)

64
www.hep-druginteractions.org (Accessed May 2015).
But there are resources out there to help…

65
HCV in HIV/HCV: No longer a special population?
HIV/HCV co-infected patients
HIV/HCV epidemiology HIV/HCV natural history
Drug-drug interactions Treatment guidelines
Treatment Co-morbidities

66
AASLD/IDSA Guidance for HIV/HCV Coinfection
Same recommendations as in HCV-monoinfected patients, but consider drug–drug interactions
• Need to adjust or withhold RTV if receiving a boosted PI with OMV/PTV/RTV + DSV
• Potential for LDV-mediated increase in tenofovir levels, especially if tenofovir used with RTV
– Avoid LDV if CrCl < 60 mL/min or if receiving tenofovir with RTV-boosted PI
• OMV/PTV/RTV + DSV can be used with raltegravir (and probably dolutegravir), enfuvirtide, tenofovir, emtricitabine, lamivudine, atazanavir
• SMV can be used with: raltegravir (and probably dolutegravir), rilpivirine, maraviroc, enfuvirtide, tenofovir, emtricitabine, lamivudine, abacavir
• Other interactions at aidsinfo.nih.gov/guidelines, hiv-druginteractions.org
AASLD/IDSA/IAS–USA. Recommendations for testing, managing, and treating hepatitis C.

67
EASL Recomendations on Treatment of Hepatitis C in 2015
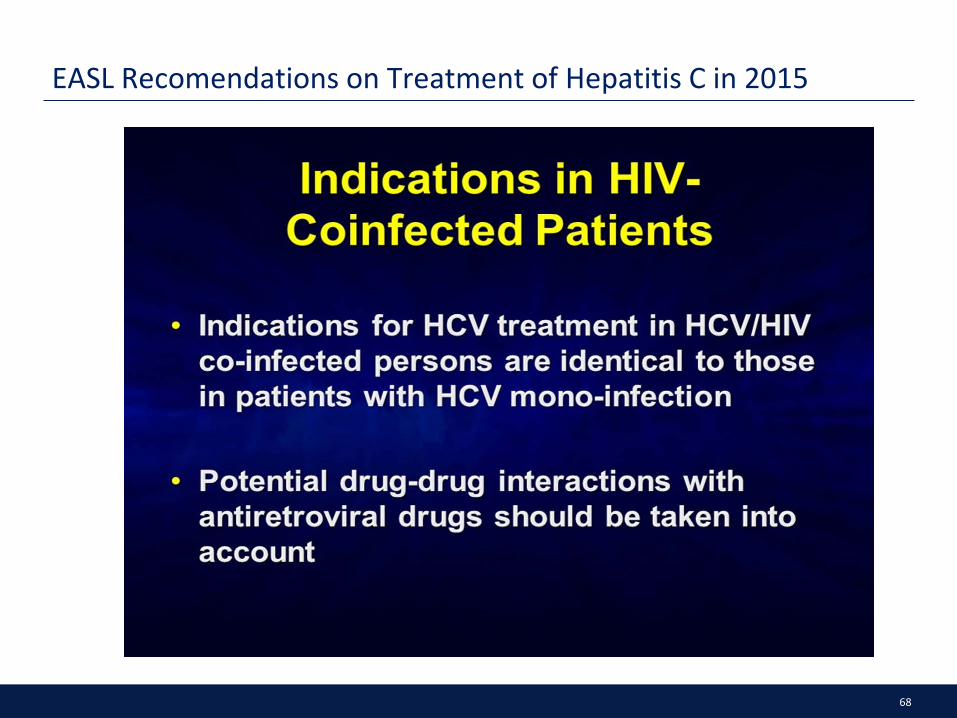
68
EASL Recomendations on Treatment of Hepatitis C in 2015

69
EASL recommendations for treatment prioritisation

70
Summary
HIV/HCV co-infection remains
a widespread problem
associated with high morbidity and mortality
HIV/HCV epidemiology and natural
history
Updated guidelines state that HIV/HCV co-infection should be treated the same as HCV mono-infection, DDIs should always be appropriately monitored and HIV/HCV co-
infected patients should be prioritised for treatment
DDIs are relatively
common in HIV/HCV co-
infected patients but they are
typically manageable and
resources are available
Effective treatments are
now available to cure the HCV in
the great majority of patients
including those with HIV/HCV
Renal disease is more prevalent in
HIV/HCV co-infected patients than uninfected
patients but effective HCV
treatments are becoming available
Treatment Co-morbidities DDIs


![Elizabeth Sherman, PharmD, AAHIVPhivaidsinstitute.med.miami.edu/documents/...HIV-HCV...• SVR rates similar to HCV monoinfected [1,2] • In HCV/HIV coinfection, treat HCV as though](https://static.fdocuments.net/doc/165x107/5fbc30e57653e03e261e9924/elizabeth-sherman-pharmd-aa-a-svr-rates-similar-to-hcv-monoinfected-12.jpg)