ADVANCES IN ATMOSPHERIC SCIENCES, VOL. 36, SEPTEMBER...
17
Transcript of ADVANCES IN ATMOSPHERIC SCIENCES, VOL. 36, SEPTEMBER...


ADVANCES IN ATMOSPHERIC SCIENCES, VOL. 36, SEPTEMBER 2019, 922–937
• Review •
Progress in Semi-arid Climate Change Studies in China
Jianping HUANG∗1, Jieru MA1, Xiaodan GUAN1, Yue LI2, and Yongli HE1
1Key Laboratory for Semi-Arid Climate Change of the Ministry of Education, College of Atmospheric Sciences,
Lanzhou University, Lanzhou 730000, China2Agronomy College, Shenyang Agricultural University, Shenyang 110866, China
(Received 30 September 2018; revised 13 December 2018; accepted 20 December 2018)
ABSTRACT
This article reviews recent progress in semi-arid climate change research in China. Results indicate that the areas of semi-arid regions have increased rapidly during recent years in China, with an increase of 33% during 1994–2008 compared to1948–62. Studies have found that the expansion rate of semi-arid areas over China is nearly 10 times higher than that of aridand sub-humid areas, and is mainly transformed from sub-humid/humid regions. Meanwhile, the greatest warming duringthe past 100 years has been observed over semi-arid regions in China, and mainly induced by radiatively forced processes.The intensity of the regional temperature response over semi-arid regions has been amplified by land–atmosphere interactionsand human activities. The decadal climate variation in semi-arid regions is modulated by oceanic oscillations, which induceland–sea and north–south thermal contrasts and affect the intensities of westerlies, planetary waves and blocking frequencies.In addition, the drier climates in semi-arid regions across China are also associated with the weakened East Asian summermonsoon in recent years. Moreover, dust aerosols in semi-arid regions may have altered precipitation by affecting the localenergy and hydrological cycles. Finally, semi-arid regions in China are projected to continuously expand in the 21st century,which will increase the risk of desertification in the near future.
Key words: semi-arid regions, drying, expansion, warming, dynamics
Citation: Huang, J. P., J. R. Ma, X. D. Guan, Y. Li, and Y. L. He, 2019: Progress in semi-arid climate change studies inChina. Adv. Atmos. Sci., 36(9), 922–937, https://doi.org/10.1007/s00376-018-8200-9.
Article Highlights:
• Semi-arid regions in northern China have experienced significant expansion and the largest warming during the past 100years.• Semi-arid climate change is affected by land–atmosphere, ocean–atmosphere and dust–cloud–precipitation interactions as
well as human activities.• The warming and expansion in semi-arid regions increases the challenges in dealing with desertification, food security and
water supply.
1. Introduction
With the characteristics of low nutrition content, low veg-etation cover, and low water conservation capacity in thesoil, semi-arid regions in China are very sensitive to globalchanges and human activities (e.g., Ma and Fu, 2006, 2007;Fu and Ma, 2008; Huang et al., 2016a). Because of theirfragile ecosystems, semi-arid regions are also vulnerable todrought and degradation (e.g., Reed et al., 2012). Semi-aridregions covered ∼15% of the Earth’s land surface and sup-ported 14.4% of the global population in 2000 (Safriel andAdeel, 2005; Wang et al., 2012). China has the largest pop-ulation in the world, and the semi-arid regions in China are
∗ Corresponding author: Jianping HUANGEmail: [email protected]
one of the major semi-arid regions in East Asia and even theworld (Piao et al., 2010). However, the areas of semi-arid re-gions in China have expanded during the last 60 years, andnortheastern China has suffered from drought, while regionsof northwestern China have experienced less-severe droughts(Li et al., 2015). Studies have indicated that drying trendsmay occur most significantly in semi-arid regions in terms ofprecipitation (P), soil moisture, and drought frequency as aresult of global warming, which leads to the intensification ofthe hydrological cycle (e.g., Chou et al., 2009). Zhang et al.(2003a) found that decreased P and drought that occur overNorth China are also related to general circulation anomalies.Moreover, the increase in greenhouse gas (GHG) emissionsclosely associated with human activities and aerosols hascontributed to the enhancement of terrestrial aridity and ex-pansion of semi-arid regions across East Asia (Fu and Feng,
© Institute of Atmospheric Physics/Chinese Academy of Sciences, and Science Press and Springer-Verlag GmbH Germany, part of Springer Nature 2019

SEPTEMBER 2019 HUANG ET AL. 923
2014; Guan et al., 2015; Zhao et al., 2017). Semi-arid regionsdominate the coverage of drylands, and its climate change isa major contributor to the terrestrial climate. Therefore, im-proving our understanding of climate change in semi-arid re-gions and its mechanisms, especially in recent years, is a toppriority for climate research in China (Huang et al., 2017c).
Recently, semi-arid climate change in China has variedsignificantly. For instance, Huang et al. (2012) found thatthe largest warming in China during the past 100 years hasoccurred over semi-arid regions and has been more signifi-cant in winter (Ma and Fu, 2003; Ji et al., 2014). Meanwhile,P over the semi-arid regions in China has shown a “wet-west–dry-east” pattern, but has only experienced a slight in-crease over western semi-arid regions and has not clearly mit-igated the drought stress (Gong et al., 2004; Zhang et al.,2011; Li et al., 2015). Moreover, the climate has becomedrier in northeastern China (Huang et al., 2016a). The pop-ulation of semi-arid regions in China mainly relies on rainfedagriculture for their livelihood; therefore, climate fluctuationsgreatly affect the availability of surface water resources (Liuand Xia, 2004). Moreover, drought in semi-arid regions hasbeen one of the most severe manifestations of climate vari-ability in China over the past six decades (Piao et al., 2010).Ma and Fu (2003) suggested that the drought in semi-aridregions of northern China mainly results from the decreasein P and increase in evaporation. Conversely, semi-arid cli-mate change strongly influences the economy and society andincreases the challenges related to food security and watersupply in China (Charney, 1975; Huang et al., 2010; Piao etal., 2010; Li et al., 2015). Climate scientists have achievedmany outstanding achievements regarding semi-arid climatechange in China. To develop appropriate strategies to copewith significant semi-arid climate change and maintain sus-tainable development in these regions, it is necessary to re-view and comment on the latest progress in semi-arid climatechange and its dynamic mechanisms. Therefore, by focusingon semi-arid climate change against the background of con-temporary climate and global change, this article summarizesthe characteristics of semi-arid climate change and its dy-namic mechanisms in terms of land–atmosphere interactions,ocean–atmosphere interactions, dust–cloud interactions, andhuman activities. Finally, the projection of aridity in theseregions in the future is reviewed and discussed.
2. Distribution and expansion of semi-arid re-
gions
Different from the semi-arid regions adjacent to globaloceans, semi-arid regions in China lie inland in northernChina between 20◦N and 40◦N, with less water vapor alonga zonal band from middle-west to northeast, which includessome areas of the Tibetan Plateau (TP), where the climate isone of the most unique, dry global midlatitude climates. Theformation of a semi-arid climate zone in China with a uniquelocation is mainly caused by TP topography, subsidence ofthe Hardley circulation, Asian monsoons, westerly belts, ur-
banization and land-use changes (e.g., Fu, 1994; Qian et al.,2009; Liu et al., 2015; Huang et al., 2017a). The uplift inthe TP topography blocks the moisture from oceans and in-creases the effects of the TP as a heat source in summer andheat sink in winter, which amplifies the seasonal land–oceancontrast and alters the atmospheric circulation (e.g., Liu et al.,2015). Continuous warming has occurred in the TP duringthe past 30 years and even the hiatus period (Duan and Xiao,2015; Ma et al., 2017). Meanwhile, descending air inducedby stationary waves and dynamic divergent flows due to TPtopography compensate for the rising air caused by heating insummer around the TP. Therefore, the uplift of the TP playsan important role in the evolution of the semi-arid climate inChina (Chen et al., 2013; An et al., 2014). Furthermore, Asianmonsoons can induce Rossby waves and interact with wester-lies, resulting in an adiabatic descent that contributes to semi-arid climate. In general, the regional TP climate effects inter-act with large-scale atmospheric circulations and synoptic-scale and mesoscale systems, which all contribute to the for-mation of a semi-arid climate. Wu et al. (2009) found that thesummertime subtropical desert/monsoon climate is formed inresponse to the combined effects of continental-scale forcing,local-scale coastal sea-breeze forcing, regional-scale TP forc-ing, and the positive feedback between diabatic heating andvorticity generation. However, some studies have consideredthat the retreat and closing of the Tethys Sea and the associ-ated changes in land–ocean distribution patterns contributedto the aridification of Asia (Zhang et al., 2007).
To define the semi-arid regions of drylands and studysemi-arid climate change, aridity is the main term usedto measure the degree of dryness or water deficiency in aregion, as it implies that the permanent water deficiencyis closely related to strong insolation, elevated tempera-ture, strong evapotranspiration and low humidity (Mainguet,1999). Different criteria and climate classification schemeshave been proposed for quantifying the degree of aridity ata given location (e.g., Koppen, 1884; Penman, 1948; Thorn-thwaite, 1948). For example, Palmer (1965) created the orig-inal Palmer Drought Severity Index (PDSI) that depends onP, soil moisture, streamflow and potential evapotranspiration(PET), which are mainly used in monitoring and researchingdrought; however, the PDSI has been criticized for its lack ofcomparability among diverse climatological regions owing tothe empirical parameters used by Palmer in the United States.To make the PDSI usable in China, An and Xing (1986) andLiu et al. (2004) modified the PDSI (denoted by PDSI CN)with revised weightings and duration factors. Wells et al.(2004) proposed the self-calibrating PDSI (scPDSI) via cali-bration by using local conditions to calculate the weightingsand duration factors, which improved spatial comparability.In addition, the Standardized Precipitation Index (SPI) andStandardized Precipitation Evapotranspiration Index (SPEI)have been applied widely to monitor moisture conditions(Vicente-Serrano et al., 2010). Meanwhile, the Surface Wet-ness Index can be used to define drylands and track meteo-rological drought (Hulme et al., 1992), but it is restricted bythe scarcity of station observations and problematic results

924 SEMIARID CLIMATE CHANGE VOLUME 36
derived from remote sensing (Kerr, 2007). In addition, theAridity Index (AI), which is defined by the ratio of annual Pto annual PET, is also considered as a measure of terrestrialaridity and is widely used for defining drylands and studyingdryland climate change (e.g., Penman, 1948; Hulme, 1996;Feng and Fu, 2013; Huang et al., 2017a).
By evaluating the regional applicability of these schemesin China, Yang et al. (2017a) found that the scPDSI is moreappropriate for China but reduces the value range slightlycompared to the PDSI and modified PDSI (PDSI CN); thus,the classification of aridity should be adjusted accordingly.The SPI and SPEI are more appropriate for humid areas thanarid and semi-arid areas because the contributions of temper-ature change to drought are neglected in the SPI but overesti-mated in the SPEI when the PET is estimated by the Thorn-thwaite method instead of the Penman–Monteith algorithm.Meanwhile, Huang et al. (2016a) found that P alone inaccu-rately defines drylands because it ignores the effect of temper-ature and PET, while the Koppen–Geiger climate classifica-tion underestimates the total drylands. Overall, using the AIto identify drylands and aridity produces the most reasonableand reliable results among these three methods. Currently,more researchers have generally divided the climate classi-fication of drylands using AI criteria and considered that thePET estimated by the common Penman–Monteith equationis closer to the real-world conditions under all climates (Anet al., 2014; Qian et al., 2017; Yang et al., 2017a). However,reconciling different measures of terrestrial aridity to addressvarious environmental issues in semi-arid climate change isan important issue that should be addressed in future research(Fu et al., 2016).
Using the AI criteria, drylands are defined as areas withan AI (P/PET) less than 0.65, which can be further classifiedinto hyper-arid (AI < 0.05), arid (0.05 � AI < 0.2), semi-arid(0.2 �AI < 0.5) and dry sub-humid (0.5 �AI < 0.65) regions(e.g., Feng and Fu, 2013). Meanwhile, drylands using a P-based definition can be divided into hyper-arid (annual P< 50mm), arid (50 mm � annual P< 200 mm), semi-arid (200 mm� annual P < 400 mm) and dry sub-humid (400 mm � annualP < 600 mm) regions. Based on the AI and annual P, Liet al. (2015) showed the climatological distribution of semi-arid regions of Chinese drylands for the period 1961–90, asshown in Fig. 1. The areas of semi-arid and dry sub-humidregions defined by the AI (Fig. 1a) are smaller than those de-fined by P (Fig. 1b), and the semi-arid regions of China aremainly distributed in a zonal band from midwest to northeast,with arid and hyper-arid regions to the northwest and drysub-humid regions to the southeast. The spatial distributionof semi-arid regions based on the AI (Fig. 1a) also matcheswell with the grasslands of surface vegetation types in Chinafrom Moderate Resolution Imaging Spectroradiometer obser-vations (Fig. 1c). In general, the total area of semi-arid re-gions is 2.14× 10⁶ km2, while the areas of hyper-arid, aridand dry sub-humid regions are 1.06 × 10⁶, 1.42 × 10⁶ and1.00 × 106 km2, respectively, suggesting that semi-arid re-gions dominate the coverage of drylands (Fig. 1a). The semi-arid region of northern China is a transitional zone of insta-
bility between the inland arid regions in northwestern Chinaand the humid monsoon areas of southeastern China, whichis related to strong climate gradients and biological variables,and vegetation growth in these regions is relatively unstable(e.g., Fu and Wen, 2002; Dai et al., 2004). Moreover, the in-teractions between the East Asian summer monsoon (Huanget al., 2016a), westerlies and mixed agricultural–pastoral ac-tivities make these regions highly vulnerable to natural dis-asters (Shi et al., 1994), climate change and human activ-ities (Fu and Wen, 2002). For example, both the front andrear edges of Transitional Climate Zone (TCZ) exhibit wideyear-to-year shifts historically, and the interannual variabilityof TCZ is mainly affected by P fluctuation while the long-term trend of TCZ is dominated by potential evaporation(Wang et al., 2017). Meanwhile, the most significant expan-sion and enhanced warming has occurred over the TCZ ofsemi-arid regions in the last century (Huang et al., 2012; Jiet al., 2014; Guan et al., 2015). The results from Zhang et al.(2003b) also show that the vegetation-cover change is sen-sitive to the variation in regional P in the eastern semi-aridregions.
Fig. 1. Climatological distribution of Chinese drylands for theperiod 1961–90 using the definition of (a) AI [semi-arid re-gions (0.2 � AI < 0.5)] and (b) annual P [semi-arid regions(200 � P < 400)] (units: mm). (c) Corresponding surface vege-tation types from MODIS observations. [Reprinted from (Li etal., 2015). With permission of Springer Nature.]
SEPTEMBER 2019 HUANG ET AL. 925
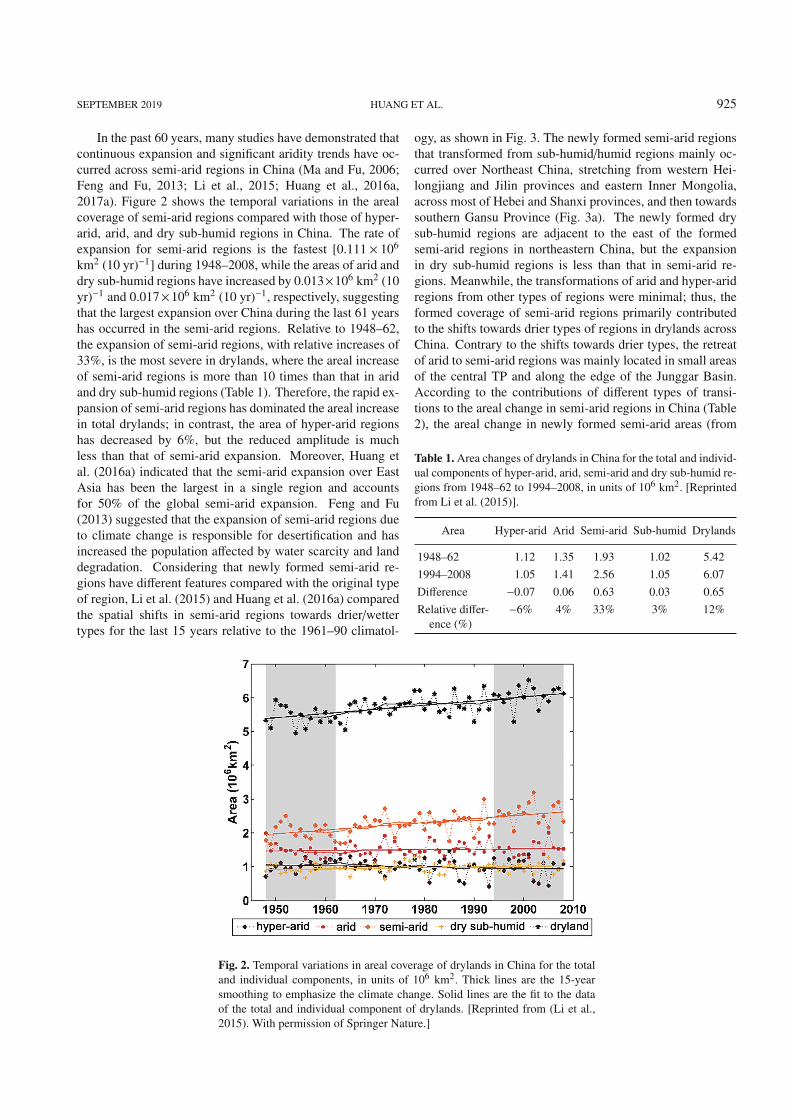
In the past 60 years, many studies have demonstrated thatcontinuous expansion and significant aridity trends have oc-curred across semi-arid regions in China (Ma and Fu, 2006;Feng and Fu, 2013; Li et al., 2015; Huang et al., 2016a,2017a). Figure 2 shows the temporal variations in the arealcoverage of semi-arid regions compared with those of hyper-arid, arid, and dry sub-humid regions in China. The rate ofexpansion for semi-arid regions is the fastest [0.111 × 10⁶
km2 (10 yr)−1] during 1948–2008, while the areas of arid anddry sub-humid regions have increased by 0.013×10⁶ km2 (10yr)−1 and 0.017×10⁶ km2 (10 yr)−1, respectively, suggestingthat the largest expansion over China during the last 61 yearshas occurred in the semi-arid regions. Relative to 1948–62,the expansion of semi-arid regions, with relative increases of33%, is the most severe in drylands, where the areal increaseof semi-arid regions is more than 10 times than that in aridand dry sub-humid regions (Table 1). Therefore, the rapid ex-pansion of semi-arid regions has dominated the areal increasein total drylands; in contrast, the area of hyper-arid regionshas decreased by 6%, but the reduced amplitude is muchless than that of semi-arid expansion. Moreover, Huang etal. (2016a) indicated that the semi-arid expansion over EastAsia has been the largest in a single region and accountsfor 50% of the global semi-arid expansion. Feng and Fu(2013) suggested that the expansion of semi-arid regions dueto climate change is responsible for desertification and hasincreased the population affected by water scarcity and landdegradation. Considering that newly formed semi-arid re-gions have different features compared with the original typeof region, Li et al. (2015) and Huang et al. (2016a) comparedthe spatial shifts in semi-arid regions towards drier/wettertypes for the last 15 years relative to the 1961–90 climatol-
ogy, as shown in Fig. 3. The newly formed semi-arid regionsthat transformed from sub-humid/humid regions mainly oc-curred over Northeast China, stretching from western Hei-longjiang and Jilin provinces and eastern Inner Mongolia,across most of Hebei and Shanxi provinces, and then towardssouthern Gansu Province (Fig. 3a). The newly formed drysub-humid regions are adjacent to the east of the formedsemi-arid regions in northeastern China, but the expansionin dry sub-humid regions is less than that in semi-arid re-gions. Meanwhile, the transformations of arid and hyper-aridregions from other types of regions were minimal; thus, theformed coverage of semi-arid regions primarily contributedto the shifts towards drier types of regions in drylands acrossChina. Contrary to the shifts towards drier types, the retreatof arid to semi-arid regions was mainly located in small areasof the central TP and along the edge of the Junggar Basin.According to the contributions of different types of transi-tions to the areal change in semi-arid regions in China (Table2), the areal change in newly formed semi-arid areas (from
Table 1. Area changes of drylands in China for the total and individ-ual components of hyper-arid, arid, semi-arid and dry sub-humid re-gions from 1948–62 to 1994–2008, in units of 106 km2. [Reprintedfrom Li et al. (2015)].
Area Hyper-arid Arid Semi-arid Sub-humid Drylands
1948–62 1.12 1.35 1.93 1.02 5.421994–2008 1.05 1.41 2.56 1.05 6.07Difference −0.07 0.06 0.63 0.03 0.65Relative differ-
ence (%)−6% 4% 33% 3% 12%
Fig. 2. Temporal variations in areal coverage of drylands in China for the totaland individual components, in units of 106 km2. Thick lines are the 15-yearsmoothing to emphasize the climate change. Solid lines are the fit to the dataof the total and individual component of drylands. [Reprinted from (Li et al.,2015). With permission of Springer Nature.]

926 SEMIARID CLIMATE CHANGE VOLUME 36
Table 2. The contributions of different type transitions to the areal change in the last 15 years (1994–2008), relative to 1948–62, in units of106 km2. [Reprinted from Li et al. (2015)].
Area (106 km2)
Arid to hyper-arid Semi-arid to arid Sub-humid/humid to semi-arid Humid to sub-humid Drier land0.049 0.084 0.638 0.606 1.377
Hyper-arid to arid Arid to semi-arid Semi-arid to sub-humid Sub-humid to humid Wetter land0.114 0.092 0.021 0.047 0.274
Fig. 3. Changes in coverage to (a) drier types and (b) wettertypes for 1994–2008 relative to 1961–90. H, SH, SA, A, HArepresent humid, sub-humid, semi-arid, arid, and hyper-arid, re-spectively. [Reprinted from (Li et al., 2015). With permissionof Springer Nature.]
other types to semi-arid regions, 0.73×10⁶ km2) is six timeslarger than that in semi-arid decreasing areas (from semi-arid regions to other types, 0.105 × 10⁶ km2). Meanwhile,the areas of semi-arid regions with intensified aridity (dry-ing) are much larger than those with decreased aridity (wet-ting), indicating that the expansion of semi-arid regions ismost severe in northern China, and the newly formed semi-arid regions primarily originated from sub-humid and humidregions; thus, more semi-arid regions become drier, and thearidity has intensified dramatically, especially in the newlyformed semi-arid regions. Huang et al. (2016a) also com-pared the transformation types over East Asia with those ofother regions in the world and found that the semi-arid expan-sion in East Asia is the largest. Many studies have reportedthat semi-arid expansion associated with an increase in arid-ity is the result of global warming (Feng and Fu, 2013; Huanget al., 2017b).
3. Semi-arid climate change
Climate change associated with changes in P and PETlead to semi-arid areal expansion and aridity changes, and
many studies have examined climate changes over semi-aridregions in China (e.g., Gong et al., 2004; Zhai et al., 2005;Chen et al., 2011; Wang et al., 2013, 2017; Li et al., 2015;Huang et al., 2016a). For example, in the western semi-aridregions of China, the temperature increased from 1901–2003(Chen et al., 2009), while P generally increased from 1930–2009 (Chen et al., 2011), which was supported by the increasein moisture from the reconstructed PDSI (Li et al., 2006).Figure 4 shows the linear trends of AI, P, PET and surfaceair temperature (SAT) in semi-arid regions over China, whichimply that the AI has had a significant drying trend in north-eastern China and a wetting trend in the midwestern China.The patterns of the changes in P are consistent with thosein the AI, with a decrease in the east and an increase in thewest over semi-arid regions, but the amplitude of drying ineastern China is much larger than that of wetting in westernChina, suggesting that the semi-arid climate is obviously dryin the east but slightly wet in the west. The intensified arid-ity (drying trend) over the past 60 years across semi-arid re-gions in China is strongly associated with the weakened EastAsian summer monsoon (e.g., Qian et al., 2009; Huang et al.,2016a). In addition, the PET pattern is opposite to that of theAI; the SAT warms in all semi-arid regions (except for a smallarea of the eastern TP), and the increasing trend in the SAT ismore obvious in the northeast of the semi-arid regions. Theinconsistency in the trends between the PET and SAT in semi-arid regions implies that the SAT is not the only factor con-trolling the PET (Donohue et al., 2010), and the PET is alsoaffected by factors such as net radiation, wind and humid-ity. Furthermore, Huang et al. (2016a) compared the newlyformed semi-arid regions with old semi-arid regions in Chinaand East Asia because of their different climate characteris-tics; the study found that the variations in P, PET, and AI inthe newly formed semi-arid regions were much stronger thanthose in old semi-arid regions across China, indicating thatthe decrease in the AI in newly formed semi-arid regions pri-marily contributes to the drying trend in all semi-arid regionsacross China. The intensified aridity results from decreasingP and increasing temperature in most of the areas in northernChina, which leads to semi-arid expansion.
Recently, some studies have shown that global warmingis nonuniform, and the warming of semi-arid regions over thelast century has been more significant (Huang et al., 2012; Jiet al., 2014; Guan et al., 2015), especially during the coldseason (November to March). The contribution of semi-aridregions in Northern Hemisphere (NH) midlatitudes to con-tinental warming reaches approximately 50% (Huang et al.,2012; Ji et al., 2014); in particular, semi-arid warming in Asia

SEPTEMBER 2019 HUANG ET AL. 927
Fig. 4. Spatial distributions of the linear trends in the (a) AI [(10yr)−1], (b) P [mm (10yr)−1], (c) PET [mm (10yr)−1],and (d) SAT [◦C (10yr)−1] in semi-arid regions in China from 1948 to 2008. [Reprinted from (Huang et al., 2016a).With permission of Springer Nature.]
is most remarkable. Similarly, many studies have found thatclimate warming in the past 100 years is evident in North-east, North and Northwest China, which are mainly coveredby semi-arid regions (IPCC, 2007; Tang et al., 2010). Li etal. (2015) also showed that warming has enhanced in semi-arid regions in China, especially in northeastern China (Fig.4b). Guan et al. (2015) investigated the driving factors be-hind the enhanced semi-arid warming (ESAW) in East Asiaby using a recently developed dynamical adjustment method;the results implied that the ESAW over East Asia is inducedby regional anthropogenic forcing, which may be closely re-lated to local human activities (Fig. 5). Moreover, Zhou etal. (2016) reproduced the ESAW in historical simulations us-ing anthropogenic and natural forcings, but the ESAW disap-peared when only natural forcing was considered, suggestingnew potential footprints for anthropogenic warming. On theother hand, some studies consider that the increase in wa-ter vapor is the main reason for desert amplification (Zhou,2016), which further demonstrates that the water vapor in thesemi-arid regions is likely controlled by water vapor origi-nated from ocean or sea surface temperature (SST). However,in phase 5 of the Coupled Model Intercomparison Project(CMIP5) simulations, the SAT trend is underestimated insemi-arid areas and overestimated in humid areas, indicatingthat the CMIP5 simulations have large uncertainties in theirresponse of SAT to global warming (Huang et al., 2016b). Inaddition, the ESAW may accelerate in the context of a warm-ing climate and, thus, has important societal and economicconsequences (Zhou et al., 2016).
4. The dynamics of semi-arid climate change
Land–atmosphere feedbacks respond to climate changesand substantially amplify the aridity response (Berg et al.,2016), and these interactions control the energy balance,
Fig. 5. Regionally averaged cold-season mean-temperaturetrend as a function of annual P for raw (black), dynamicallyinduced (blue), and radiatively forced (red) temperatures (units:◦C yr−1) in the cold season from 1902 to 2011 over East Asia.[Reprinted from (Guan et al., 2015).]
water cycle and carbon cycle through turbulent flux at the at-mospheric boundary layer, which plays an important role insemi-arid climate change (e.g., Wu et al., 2009; Huang et al.,2017a). Global climate variations affect the characteristics ofthe land surface in semi-arid regions, such as the distributionof soil moisture, albedo, vegetation, and watershed hydrol-ogy. In turn, changes in land surface parameters alter atmo-spheric variations via the fluxes of energy, water, carbon andmomentum, creating feedback that further affects the semi-arid climate (Maestre et al., 2013; Cheng et al., 2015; Berg etal., 2016; Xiao and Duan, 2016; Duan et al., 2017; Huang etal., 2017a). Liu et al. (2006) found a positive feedback of veg-etation greenness with SAT and P from observations, indicat-ing the important interactions among soil moisture, vegeta-tion, surface albedo, and climate in semi-arid regions. Fromthe perspective of energy, the available energy is theoretically

928 SEMIARID CLIMATE CHANGE VOLUME 36
balanced by the sensible heat flux (SH) and latent heat flux(LH), and the SH comprises a higher proportion of the avail-able energy due to the LH being limited by the soil water sup-ply over semi-arid regions. Soil moisture, as a factor in land–atmosphere feedbacks, controls the near-surface temperatureand evapotranspiration, and a low soil moisture content andP over semi-arid regions limits the evaporation and transpira-tion of vegetation cover, which leads to a low mean LH oversemi-arid regions (Huang et al., 2017b). Heating from solarand infrared radiation is primarily released through SH oversemi-arid regions, while extra heating can be used for evapo-transpiration over humid regions; thus, surface temperaturesover semi-arid regions rise sharply to create a large land–airtemperature gradient (Fig. 6). Therefore, a lack of evapotran-spiration due to limited soil moisture and vegetation coverleads to the high sensitivity of surface temperatures to ex-tra energy from increased GHGs over semi-arid regions (e.g.,Yin et al., 2014; Cheng et al., 2015; Cheng and Huang, 2016;Huang et al., 2017b).
In terms of the water cycle, semi-arid regions have be-come drier in northeastern China during recent years, ac-companied by soil drying caused by decreasing P and en-hanced warming. At the same time, soil suction has increasedwith drying soil, and the remaining soil moisture has be-come less absorbable for plant roots; thus, evapotranspira-tion and P may be reduced, leading to an increase in SHand temperature. Moreover, the increased temperature canfurther decrease the soil moisture and P, which could en-hance the drying trends and make the regions even drier. Thesoil water loss, decreased evapotranspiration, and increasedtemperature form a positive feedback loop, which can con-tinue until the soil is completely dry, resulting in desertifica-tion (Seneviratne et al., 2010). Furthermore, soil moisture–carbon–temperature feedbacks also play an important role inlocal land–atmosphere interactions and the carbon cycle. Ex-cluding the recipients of climate changes induced by increas-ing carbon dioxide (CO2) (Huang et al., 2016b), semi-aridregions are the largest contributors to the trends and inter-annual variabilities in the terrestrial carbon sink (Poulter et
al., 2014). Semi-arid expansion against the background ofglobal warming reduces the capacity of soil organic carbonstorage; thus, soils store less carbon and emit more CO2 intothe atmosphere, which aggravates warming and causes a pos-itive feedback cycle, where drying and warming both inten-sify (Huang et al., 2017a, b). However, these feedbacks aredifficult to constrain in a defined area due to their impacts oneach other and are still less documented in semi-arid regionsin China. To improve our understanding of the role of land–atmosphere interactions over semi-arid regions in China, thetemporal- and spatial-scale effects, as well as multiple feed-back processes, need to be considered.
Wu et al. (2009) indicated that ocean–atmosphere forc-ing contributes to the formation of climate systems, includingdeserts and monsoons, in the summertime subtropics. Manystudies have shown that oceanic oscillations, as factors inocean–atmosphere feedbacks, modulate the decadal climatevariations in semi-arid regions across China (e.g., Ma and Fu,2006; Wang et al., 2008; Qian and Zhou, 2014). For example,Yang et al. (2017b) suggested that the Pacific SST patternplays a dominant role in the anomalies of annual P and as-sociated atmospheric circulation over eastern China, whereasthe Atlantic SSTs contribute to a lesser degree. During thewarm phase of the Pacific SST pattern, the semi-arid regionsin northeastern China are prone to drought by inducing north-westerly wind anomalies and pushing the monsoons to thesouth (Ma and Shao, 2006; Ma and Fu, 2007), which ex-plains the robust drying trend in northeastern China (Ma andFu, 2003; Ma and Dan, 2005). Yang et al. (2017c) indicatedthat the Pacific Decadal Oscillation (PDO) affects East ChinaP patterns by modulating the large-scale circulation patternon both the interannual and intraseasonal scales. Lin et al.(2017) found that the negative phase of the PDO is associatedwith strong southerly summer monsoons, which are favorablefor increasing the occurrence of local extreme rainfall overNorth China. Furthermore, the interdecadal variability in thePDO can exert a modulating effect on El Nino–Southern Os-cillation (ENSO) teleconnections over East Asia (Wang et al.,2014; Dong and Dai, 2015). In semi-arid regions over China,
Schematic diagram
Fig. 6. Schematic diagram of local thermodynamic processes in drylands and humid lands. [Reprinted from (Huang etal., 2017b).]

SEPTEMBER 2019 HUANG ET AL. 929
ENSO-induced drying trends are magnified when ENSO is inphase with the PDO, while the dry variations weaken or evendisappear when ENSO is out of phase with the PDO (Wang etal., 2014). Moreover, the response of the Hadley cell expan-sion to ocean–atmosphere feedbacks during recent decadeshas been responsible for enhanced aridity and water shortagechanges in semi-arid regions of the NH (Seager et al., 2007).
Meanwhile, disturbances in monsoons and westerlywinds are also important factors in semi-arid climate changein China (Qian et al., 2009), as they are closely associatedwith the land–sea thermal contrast. As suggested by Wallaceet al. (1995) and He et al. (2014), the land–sea thermal con-trast can induce feedbacks between ocean and atmosphericcirculations. Both the zonal and meridional land–sea ther-mal contrast contribute to inducing an abrupt shift in ther-mally forced atmospheric circulations, such as asymmetriczonal and meridional thermal forcing (ZTF and MTF, respec-tively), which affects the intensity of westerlies, planetarywaves, monsoons, and blocking frequencies and further af-fects the climate changes over NH continents, including the
semi-arid climate change in China (He et al., 2014; Huanget al., 2017a, c). Semi-arid regions are largely influenced byblocking, especially in winter. He et al. (2014) found that theESAW is accompanied by a decrease in blocking frequen-cies. As shown in Fig. 7, when surface thermal forcing inthe NH follows the cold-ocean–warm-land pattern due to theCO2 greenhouse effect, the ZTF decreases and reduces theblocking frequencies by modulating planetary waves. In con-trast, the westerly wind is weakened, and topographic forcingis enhanced when surface forcing follows the warm-ocean–cold-land pattern, which is favorable for the persistence ofblocking and cooling. Huang et al. (2017c) indicated that theinternal climate variability associated with oceanic oscilla-tions and Arctic amplifications, by altering the ZTF and MTF,can enable a decadal modulated oscillation (DMO), whichinfluences the terrestrial temperature in semi-arid regions ondecadal to multidecadal time scales. The upward DMO con-tributes to accelerated warming, similar to that during thelast 20 years of the 20th century, while the downward DMOsuppresses the long-term warming trend, which resulted in a
Fig. 7. Composite SAT anomaly fields (units: ◦C) in winter (December–February) for (a) posi-tive and (b) negative phases of land–sea thermal contrast. Contour intervals: 0.5 ◦C. [Reprintedfrom (He et al., 2014).]

930 SEMIARID CLIMATE CHANGE VOLUME 36
cooling trend over Eurasia during the recent warming hiatusperiod.
Based on satellite observations, ground-based measure-ments, and model simulations (Huang et al., 2007; Wanget al., 2010a; Bi et al., 2011; Chen et al., 2013), the largeamounts of dust particles in East Asia emitted from arid andsemi-arid regions are also considered significant factors af-fecting semi-arid climate change over China, through theirdirect effects on solar and thermal radiation (e.g. Li, 2004;Huang et al., 2014) and indirect/semi-direct effects on cloudsand P (e.g., Twomey, 1977; Albrecht, 1989; Huang et al.,2006a, b, c, 2009). East Asia is one of the major sourcesof dust aerosols in the NH, and dust from deserts in Chinaincreased most obviously from 1970 to 2000 but has gener-ally decreased since 2000, with oscillations in recent years(e.g., Xia et al., 2016). Huang et al. (2008) indicated thatdust in China often originates from the Taklimakan and Gobideserts, with more frequent dust storms occurring in the Tak-limakan Desert than the Gobi Desert, which can be trans-ported long distances by prevailing westerlies (Fig. 8). Mean-while, because of the unique TP topography, with dynami-cal and thermal forcing, dust aerosols from the TaklimakanDesert compared to African dust emissions could be trans-ported to the TP and even eastern China via upper tropo-spheric westerly jets (Huang et al., 2007, 2008; Ge et al.,2014), which could alter atmospheric stability and circula-tion (Huang et al., 2007; Zhao et al., 2015; Li et al., 2016b).Moreover, dust outbreaks are sensitive to changes in land-surface conditions, such as moisture and vegetation growth,over East Asia (Kurosaki et al., 2011).
In addition, dust aerosols in East Asia have an impor-tant impact on the microphysical properties and formation
of clouds, by acting as cloud condensation nuclei and icenuclei (first/second indirect effect and invigoration effect)and altering the relative humidity and stability of the atmo-sphere (semidirect effect) (Li et al., 2010, 2011). Moreover,the effects of dust also interact with cloud properties to alterthe atmospheric dynamics, surface energy budget, and hy-drological cycle, which further influences semi-arid climatechange. Huang et al. (2006a, b, 2010) compared cloud prop-erties under dusty and dust-free conditions over semi-arid re-gions in Asia and found that dust aerosols decreased the ice-cloud effective particle size and optical depth of cirrus clouds(Kawamoto et al., 2004; Su et al., 2008; Wang et al., 2010b).Dust aerosols over Asian semi-arid regions have a near warm-ing effect at the top of the atmosphere but a cooling effect atthe surface, while a warming effect occurs within the atmo-sphere (Huang et al., 2014). Furthermore, dust–cloud interac-tions can enhance or suppress semi-arid P due to the spatialdistributions of dust aerosols, TP topography, cloud types, lo-cal humidity, and atmospheric circulation. Han et al. (2013)indicated using a climate–chemistry–aerosol model that dustradiative forcing decreased the P over the Yangtze River re-gion and large areas of northeastern China. There is a pos-itive feedback loop in the dust aerosol–cloud–P interactionsover semi-arid regions (Huang et al., 2014, 2017a); for in-stance, a decrease in rainfall and subsequent deficit in soilmoisture contribute to increasing dust storms, which furtherreduces the low-cloud cover and water vapor and increasesthe high-cloud cover, resulting in suppressed P and increaseddust storms. Therefore, more dust storms occur in arid andsemi-arid regions under feedback conditions, which furthercontributes to the desertification observed in recent decadesand accelerated aridity over semi-arid regions in Asia (Huang
Fig. 8. Dust event vertical structure from CALIPSO observations over the Taklamakan Desert(80◦E), Gobi Desert (102◦E), eastern China (124◦E), Yellow Sea (146◦E), and the Pacific Ocean(168◦E) superimposed on a regional map. Coloring on the right represents the dust event fre-quency of occurrence in percent. [Reprinted from (Huang et al., 2008).]

SEPTEMBER 2019 HUANG ET AL. 931
et al., 2014).With rapid economic development, more GHGs and pol-
lutants, such as aerosols, have been emitted, which are keyforcing agents associated with human activities (Huang et al.,2017a). Desertification, which is the loss of biodiversity andother forms of environmental deterioration, is partially the re-sult of human activities (Huang et al., 2016a, b). Many stud-ies have indicated that human activities, such as increasedCO2 emissions, anthropogenic aerosols, land use and urban-ization, play an important role in semi-arid climate changeover China (e.g., Dai, 2013; Guan et al., 2015; Lin et al.,2015; Fu et al., 2016; Huang et al., 2017a; Xu and Yang,2017; Zhang et al., 2017). For instance, under high CO2emissions, projected drying trends exist over semi-arid re-gions during the 21st century (Feng and Fu, 2013; Huanget al., 2016b). Zhao et al. (2017) found that the increase inanthropogenic aerosols in the atmosphere enhanced the ter-restrial aridity and resulted in semi-arid expansion over EastAsia. Lin et al. (2015, 2016) examined the changes in AIforced by CO2 and aerosols over China using CommunityEarth System Model simulations and found that GHGs andaerosols can significantly affect regional AI, and the AI re-sponse to CO2 decreased (drying) in almost all semi-arid re-gions in China, while the AI response to aerosols (black car-bon and sulfate) increased (wetting) to the west and north-east but decreased (drying) in central areas across semi-aridregions of China (Fig. 9). Li et al. (2016a) investigated theeffects of anthropogenic aerosols on temperature variabilityin semi-arid regions over China using CMIP5 models andfound that anthropogenic aerosols reduced the temperaturein the region. Moreover, Zhao et al. (2015) found that dustaerosols can cause surface cooling and reduced P over semi-
arid regions in the NH, based on aerosol–climate coupledsimulations. Guan et al. (2016) found that population den-sity/change was correlated with anthropogenic dust aerosolsin the semi-arid regions of East China, which further aggra-vated drought, indicating that human activities affect semi-arid climate change (Huang et al., 2014, 2015).
In addition, natural and human activities have modifiedland-use and cover change (LUCC), which interacts withthe environment, has significant effects on the ecosystemsof semi-arid regions and, consequently, directly or indirectlyexerts significant influence on climate change (Deng et al.,2013). Negative LUCC may dry the local climate, leadingto degradation, especially in semi-arid regions (Fu and Wei,1993; Fu et al., 2016). The land cover degradation in north-ern China has accelerated in the last five decades, and theremaining grassland area in Inner Mongolia has significantlydegraded (Wang et al., 2004), which could lead to a decreasein P and an increase in surface temperature in semi-arid re-gions by altering various physical characteristics of the landsurface, such as albedo, surface roughness, soil water andthermal variables (Zhang and Zhang, 2005; Zhang et al.,2009; Yu and Xie, 2013). Using a regional climate model,Chen et al. (2017) indicated that net radiation and evapora-tion reduced within degraded areas after simulating vegeta-tion degradation over the semi-arid regions of China. Li et al.(2017) indicated that the observed warming trend over semi-arid regions in northern China during 1946–2005 could belargely attributable to anthropogenic forcings, while the inter-nal variability is still larger than the forced variation in semi-arid P. To better understand and quantify the contributionsof human activities to semi-arid climate change, additionalstudies are needed.
Fig. 9. Changes (units: % ◦C−1) in P, PET and AI due to black carbon (BC) and sulfate (SO4) aerosols (left-hand and middlepanels) and CO2 (right-hand panels), scaled by global-mean SAT changes. Gray regions do not have statistically significantchanges based on a 95% confidence interval from a two-sided t-test. [Reprinted from (Lin et al., 2016).]

932 SEMIARID CLIMATE CHANGE VOLUME 36
5. Projection of semi-arid climate
Semi-arid expansion over China that has mainly trans-formed from the sub-humid/humid regions is most remark-able during the past 60 years, and intensified aridity hasprimarily occurred in northeastern semi-arid regions (Li etal., 2015; Guan et al., 2016; Huang et al., 2016a). Basedon the observations of semi-arid expansion in the past, manystudies have forecast future semi-arid expansion in Chinaand other regions, but there are substantial uncertainties inestimating recent drought changes both in terms of histor-ical changes and future projections (Dai and Zhao, 2017).Using climate model simulations from CMIP5, Feng and Fu(2013) found that semi-arid regions over China at the endof the 21st century (2071–2100), under Representative Con-centration Pathway 8.5 (RCP8.5), are projected to be largerthan those in the historical period (1961–90), and mainly oc-cur in the regions of central and southern China. However,many studies have indicated that the CMIP5 simulationsdo not perform well in capturing semi-arid expansion andclimate change in the historical period (1948–2005), withsemi-arid regions in China underestimated on the basis ofobservations (Ji et al., 2015; Huang et al., 2016b; Zhao andDai., 2015, 2017). For example, Ji et al. (2015) found thatthe simulated global expansion of semi-arid regions during1991–2005 was far less than the observed expansion, andthe semi-arid expansion in China was underestimated due tooverestimated P and underestimated SAT. Therefore, Huanget al. (2016b) used observational data to correct the CMIP5projections and investigated coverage changes in semi-aridand other subtype regions of drylands under RCP8.5 emissionscenarios. The results showed that, in the future, the semi-arid areas of China will continue to expand, and increasedsemi-arid regions will mainly be distributed in northeasternChina (Fig. 10). Continuous expansion in semi-arid regionsmay have consequences regarding desertification, food se-curity and water supply; therefore, the semi-arid regions in
Fig. 10. Area changes in semi-arid and other subtype regions ofdrylands in East Asia from the corrected CMIP5 and RCP8.5relative to the baseline (1961–90) for the future period of 2096–2100. The gray shading denotes the baseline drylands presentin 1961–90. Changes include any transition from adjacent andnonadjacent subtypes. [Reprinted from (Huang et al., 2016b)]
northeastern China are the highest priority for strengtheningpolicy measures to adapt to climate change and reduce risksrelated to water resources (Xia et al., 2017).
6. Summary and discussion
In this article, based on recent research progress, we sys-tematically summarize the temporal and spatial characteris-tics of semi-arid regions and review semi-arid climate changein China over the last 60 years. Moreover, we discuss themajor dynamic processes affecting semi-arid climate changein terms of land–atmosphere interactions, ocean–atmosphereinteractions, dust–cloud–P interactions, and human activi-ties. Studies have found that semi-arid regions dominate thecoverage of drylands in northern China; however, semi-aridareas have continuously expanded during the last 60 yearsand are considered as the largest expansion for drylands inChina. The expanded semi-arid regions have mainly beentransformed from sub-humid/humid regions, where the cli-mate has become drier and warmer, particularly in the newlyformed semi-arid areas. Studies indicate that the drying trendin semi-arid regions over China during the last 60 years isstrongly associated with the weakened East Asian summermonsoon. Meanwhile, semi-arid regions have undergone thelargest degree of warming compared to other regions acrossChina during the past 100 years, mainly because of radia-tively forced processes.
During the process of climate change, land–atmosphereinteractions and human activities can influence the intensityof the regional temperature response in semi-arid regions, inwhich the effect of anthropogenic forcing is greater than thatof natural forcing. Ocean–atmosphere interactions may mod-ulate decadal climate change in semi-arid regions by alter-ing the intensities of westerlies, monsoons, planetary waves,and blocking frequencies. Moreover, dust–cloud–P interac-tions have a significant impact on P by affecting the localenergy and hydrological cycles in semi-arid regions acrossChina. However, current findings indicate that CMIP5 sim-ulations do not perform well in simulating semi-arid climatechange. After correcting the CMIP5 simulations based on his-torical data, semi-arid regions in China are projected to con-tinuously expand in the near future under a high emissionsscenario, which will increase the risk of land degradation andwater scarcity.
Although significant progress has been made in recentstudies on semi-arid climate change and its dynamics overChina, many unsolved issues remain to be further investi-gated in future studies. For instance:
(1) There is still a lack of high-quality datasets for study-ing and forecasting semi-arid climate change over China.Future studies should combine various datasets based onground-based measurements, satellite observations, and cli-mate reconstructions to study semi-arid climate change onmultiple time scales and further compare the regional char-acteristics and correlations within different semi-arid regionsacross China and other regions of the world.

SEPTEMBER 2019 HUANG ET AL. 933
(2) Previous studies have mainly focused on the regionalmeans of climatic factors in semi-arid regions across China,but few studies have focused on typical underlying surfacesin different semi-arid regions to examine climate change anddynamics in these regions. Meanwhile, the semi-arid regionsacross China are some of the major semi-arid regions in EastAsia, and further studies need to analyze typical semi-aridclimate change in China.
(3) The mechanisms of semi-arid climate change are stillnot well understood, and there is still a lack of robust researchon the mechanisms and numerical simulations of semi-aridclimate change in the context of global change. Moreover,the attributions of human-induced perturbations and naturalforcings to semi-arid climate change should be further quan-tified and evaluated.
(4) Climate models have not performed well in the sim-ulation and prediction of semi-arid climate change acrossChina; thus, the ability to simulate aridity and climate changein semi-arid regions should be further improved in future cli-mate models.
Acknowledgements. This work was supported by the NationalScience Foundation of China (Grant Nos. 41521004, 41722502 and91637312) and the China University Research Talents RecruitmentProgram (111 project, B13045). All of the data in this article werefrom the cited references.
REFERENCES
Albrecht, B. A., 1989: Aerosols, cloud microphysics, and frac-tional cloudiness. Science, 245(4923), 1227–1230, https://doi.org/10.1126/science.245.4923.1227.
An, L. J., F. M. Ren, Y. J. Li, and Y. P. Li, 2014: Study on char-acteristics of regional drought events over north China dur-ing the past 50 years. Meteorological Monthly, 40, 1097–1105, https://doi.org/10.7519/j.issn.1000-0526.2014.09.007.(in Chinese with English abstract)
An, S. Q., and J. X. Xing, 1986: A modified Palmer’s Drought In-dex. J. Acad. Meteorol. Sci. China, 1, 75–82. (in Chinese withEnglish abstract)
Berg, A., and Coauthors, 2016: Land-atmosphere feedbacks am-plify aridity increase over land under global warming. Nat.Clim. Chang, 6, 869–874, https://doi.org/10.1038/nclimate3029.
Bi, J. R., J. P. Huang, Q. Fu, X. Wang, J. S. Shi, W. Zhang, Z.W. Huang, and B. D. Zhang, 2011: Toward characterizationof the aerosol optical properties over Loess Plateau of north-western China. Journal of Quantitative Spectroscopy andRadiative Transfer, 112, 346–360, https://doi.org/10.1016/j.jqsrt.2010.09.006.
Charney, J. G., 1975: Dynamics of deserts and drought in the Sa-hel. Q. J. R. Meteorol. Soc., 101, 193–202, https://doi.org/10.1016/qj.49710142802.
Chen, F., J. S. Wang, L. Y. Jin, Q. Zhang, J. Li, and J. H. Chen,2009: Rapid warming in mid-latitude central Asia for the past100 years. Frontiers of Earth Science in China, 3(1), 42–50,https://doi.org/10.1007/s11707-009-0013-9.
Chen, F. H., W. Huang, L. Y. Jin, J. H. Chen, and J. S. Wang,2011: Spatiotemporal precipitation variations in the arid Cen-
tral Asia in the context of global warming. Science ChinaEarth Sciences, 54(12), 1812–1821, https://doi.org/10.1007/s11430-011-4333-8.
Chen, L., Z. G. Ma, and T. B. Zhao, 2017: Modeling and analy-sis of the potential impacts on regional climate due to vege-tation degradation over arid and semi-arid regions of China.Climatic Change, 144, 461–473, https://doi.org/10.1007/s10584-016-1847-2.
Chen, S. Y., J. P. Huang, C. Zhao, Y. Qian, L. R. Leung, and B.Yang, 2013: Modeling the transport and radiative forcing ofTaklimakan dust over the Tibetan Plateau: A case study in thesummer of 2006. J. Geophys. Res., 118(2), 797–812, https://doi.org/10.1002/jgrd.50122.
Cheng, S. J., X. D. Guan, J. P. Huang, F. Ji, and R. X. Guo,2015: Long-term trend and variability of soil moisture overEast Asia. J. Geophys. Res., 120, 8658–8670, https://doi.org/10.1002/2015JD023206.
Cheng, S. J., and J. P. Huang, 2016: Enhanced soil moisturedrying in transitional regions under a warming climate. J.Geophys. Res., 121, 2542–2555, https://doi.org/10.1002/2015JD024559.
Chou, C., J. D. Neelin, C. A. Chen, and J. Y. Tu, 2009: Evaluat-ing the “rich-get-richer” mechanism in tropical precipitationchange under global warming. J. Climate, 22(8), 1982–2005,https://doi.org/10.1175/2008JCLI2471.1.
Dai, A. G., 2013: Increasing drought under global warming inobservations and models. Nat. Clim. Chang., 3(1), 52–58,https://doi.org/10.1038/nclimate1633.
Dai, A. G., and T. B. Zhao, 2017: Uncertainties in historicalchanges and future projections of drought. Part I: estimates ofhistorical drought changes. Climatic Change, 144, 519–533,https://doi.org/10.1007/s10584-016-1705-2.
Dai, A. G., K. E. Trenberth, and T. T. Qian, 2004: A global datasetof Palmer Drought Severity Index for 1870-2002: Relation-ship with soil moisture and effects of surface warming. Jour-nal of Hydrometeorology, 5(6), 1117–1130, https://doi.org/10.1175/JHM-386.1.
Deng, X. Z., C. H. Zhao, and H. M. Yan, 2013: Systematic model-ing of impacts of land use and land cover changes on regionalclimate: A review. Advances in Meteorology, 2013, 317678,https://doi.org/10.1155/2013/317678.
Dong, B., and A. G. Dai, 2015: The influence of the interdecadalPacific Oscillation on temperature and precipitation over theglobe. Climate Dyn., 45, 2667–2681, https://doi.org/10.1007/s00382-015-2500-x.
Donohue, R. J., T. R. McVicar, and M. L. Roderick, 2010: Assess-ing the ability of potential evaporation formulations to cap-ture the dynamics in evaporative demand within a changingclimate. J. Hydrol., 386, 186–197, https://doi.org/10.1016/j.jhydrol.2010.03.020.
Duan, A. M., and Z. X. Xiao, 2015: Does the climate warminghiatus exist over the Tibetan Plateau?. Scientific Reports, 5,13711, https://doi.org/10.1038/srep13711.
Duan, A. M., R. Z. Sun, and J. H. He, 2017: Impact of surface sen-sible heating over the Tibetan Plateau on the western Pacificsubtropical high: A land-air-sea interaction perspective. Adv.Atmos. Sci., 34(2), 157–168, https://doi.org/10.1007/s00376-016-6008-z.
Feng, S., and Q. Fu, 2013: Expansion of global drylandsunder a warming climate. Atmospheric Chemistry andPhysics, 13(19), 10 081–10 094, https://doi.org/10.5194/acp-13-10081-2013.

934 SEMIARID CLIMATE CHANGE VOLUME 36
Fu, C., and H. Wei, 1993: Study on sensitivity of meso-scalemodel in response to land cover classification over China.EOS, Transactions, American Geophysical Union, 74,172.
Fu, C. B., 1994: Studies on the observed abrupt climatic change.Scientia Atmospherica Sinica, 18(3), 373–384, https://doi.org/10.3878/j.issn.1006-9895.1994.03.14. (in Chinese withEnglish abstract)
Fu, C. B., and G. Wen, 2002: Several issues on aridification in thenorthern China. Climatic and Environmental Research, 7(1),22–29, https://doi.org/10.3878/j.issn.1006-9585.2002.01.03.(in Chinese with English abstract)
Fu, C. B., and Z. G. Ma, 2008: Global change and regional aridifi-cation. Chinese Journal of Atmospheric Sciences, 32(4), 752–760, https://doi.org/10.3878/j.issn.1006-9895.2008.04.05. (inChinese with English abstract)
Fu, Q., and S. Feng, 2014: Responses of terrestrial aridity to globalwarming. J. Geophys. Res., 119(13), 7863–7875, https://doi.org/10.1002/2014JD021608.
Fu, Q., L. Lin, J. P. Huang, S. Feng, and A. Gettelman, 2016:Changes in terrestrial aridity for the period 850–2080 fromthe community Earth system Model. J. Geophys. Res., 121(6),2857–2873, https://doi.org/10.1002/2015JD024075.
Ge, J. M., J. P. Huang, C. P. Xu, Y. L. Qi, and H. Y. Liu, 2014:Characteristics of Taklimakan dust emission and distribu-tion: A satellite and reanalysis field perspective. J. Geophys.Res., 119(20), 11 772–11 783, https://doi.org/10.1002/2014JD022280.
Gong, D. Y., P. J. Shi, and J. A. Wang, 2004: Daily precipitationchanges in the semi-arid region over northern China. Jour-nal of Arid Environments, 59(4), 771–784, https://doi.org/10.1016/j.jaridenv.2004.02.006.
Guan, X. D., J. P. Huang, R. X. Guo, H. P. Yu, P. Lin, and Y. T.Zhang, 2015: Role of radiatively forced temperature changesin enhanced semi-arid warming in the cold season over EastAsia. Atmospheric Chemistry and Physics, 15(23), 13 777–13786, https://doi.org/10.5194/acp-15-13777-2015.
Guan, X. D., P. J. Huang, T. Y. Zhang, K. Y. Xie, and J. J. Liu,2016: The relationship between anthropogenic dust and pop-ulation over global semi-arid regions. Atmospheric Chemistryand Physics, 16, 5159–5169, https://doi.org/10.5194/acp-16-5159-2016.
Han, Z. W., J. W. Li, W. D. Guo, Z. Xiong, and W. Zhang, 2013: Astudy of dust radiative feedback on dust cycle and meteorol-ogy over East Asia by a coupled regional climate-chemistry-aerosol model. Atmos. Environ., 68, 54–63, https://doi.org/10.1016/j.atmosenv.2012.11.032.
He, Y. L., J. P. Huang, and M. X. Ji, 2014: Impact of land-seathermal contrast on interdecadal variation in circulation andblocking. Climate Dyn., 43(12), 3267–3279, https://doi.org/10.1007/s00382-014-2103-y.
Huang, J., C. Zhang, and J. M. Prospero, 2009: Large-scale effectof aerosols on precipitation in the West African monsoon re-gion. Quart. J. Roy. Meteor. Soc., 135(640), 581–594, https://doi.org/10.1002/qj.391.
Huang, J. F., C. D. Zhang, and J. M. Prospero, 2010: African dustoutbreaks: A satellite perspective of temporal and spatial vari-ability over the tropical Atlantic Ocean. J. Geophys. Res., 115,D05202, https://doi.org/10.1029/2009JD012516.
Huang, J. P., B. Lin, P. Minnis, T. H. Wang, X. Wang, Y. X. Hu, Y.H. Yi, and J. K. Ayers, 2006a: Satellite-based assessment ofpossible dust aerosols semi-direct effect on cloud water pathover East Asia. Geophys. Res. Lett., 33(19), L19802, https://
doi.org/10.1029/2006GL026561.Huang, J. P., P. Minnis, B. Lin, T. H. Wang, Y. H. Yi, Y. X. Hu,
S. Sun-Mack, and K. Ayers, 2006b: Possible influences ofAsian dust aerosols on cloud properties and radiative forc-ing observed from MODIS and CERES. Geophys. Res. Lett.,33(6), L06824, https://doi.org/10.1029/2005GL024724.
Huang, J. P., Y. J. Wang, T. H. Wang, and Y. H. Yi, 2006c:Dusty cloud radiative forcing derived from satellite datafor middle latitude regions of East Asia. Progress in Nat-ural Science, 16(10), 1084–1089, https://doi.org/10.1080/10020070612330114.
Huang, J. P., and Coauthors, 2007: Summer dust aerosols detectedfrom CALIPSO over the Tibetan Plateau. Geophys. Res. Lett.,34(18), L18805, https://doi.org/10.1029/2007GL029938.
Huang, J. P., P. Minnis, B. Chen, Z. W. Huang, Z. Y. Liu, Q. Y.Zhao, Y. H. Yi, and J. K. Ayers, 2008: Long-range trans-port and vertical structure of Asian dust from CALIPSO andsurface measurements during PACDEX. J. Geophys. Res.,113(D23), D23212, https://doi.org/10.1029/2008JD010620.
Huang, J. P., X. D. Guan, and F. Ji, 2012: Enhanced cold-seasonwarming in semi-arid regions. Atmospheric Chemistry andPhysics, 12(12), 5391–5398, https://doi.org/10.5194/acp-12-5391-2012.
Huang, J. P., T. H. Wang, W. C. Wang, Z. Q. Li, and H. R. Yan,2014: Climate effects of dust aerosols over East Asian aridand semiarid regions. J. Geophys. Res., 119(19), 11 398–11416, https://doi.org/10.1002/2014JD021796.
Huang, J. P., J. J. Liu, B. Chen, and S. L. Nasiri, 2015: Detec-tion of anthropogenic dust using CALIPSO lidar measure-ments. Atmospheric Chemistry and Physics, 15, 11 653–11665, https://doi.org/10.5194/acp-15-11653-2015.
Huang, J. P., M. X. Ji, Y. K. Xie, S. S. Wang, Y. L. He, and J.T. Ran, 2016a: Global semi-arid climate change over last60 years. Climate Dyn., 46(3–4), 1131–1150, https://doi.org/10.1007/s00382-015-2636-8.
Huang, J. P., H. P. Yu, X. D. Guan, G. Y. Wang, and R. X. Guo,2016b: Accelerated dryland expansion under climate change.Nature Climate Change, 6(2), 166–171, https://doi.org/10.1038/nclimate2837.
Huang, J. P., and Coauthors, 2017a: Dryland climate change: Re-cent progress and challenges. Rev. Geophys., 55, 719–778,https://doi.org/10.1002/2016RG000550.
Huang, J. P., H. P. Yu, A. G. Dai, Y. Wei, and L. T. Kang, 2017b:Drylands face potential threat under 2 ◦C global warmingtarget. Nature Climate Change, 7, 417–422, https://doi.org/10.1038/nclimate3275.
Huang, J. P., Y. K. Xie, X. D. Guan, D. D. Li, and F. Ji, 2017c:The dynamics of the warming hiatus over the Northern Hemi-sphere. Climate Dyn., 48, 429–446, https://doi.org/10.1007/s00382-016-3085-8.
Hulme, M., 1996: Recent climatic change in the world’s drylands.Geophys. Res. Lett., 23(1), 61–64, https://doi.org/10.1029/95GL03586.
Hulme, M., R. Marsh, and P. D. Jones, 1992: Global changes in ahumidity index between 1931–60 and 1961–90. Climate Re-search, 2, 1–22, https://doi.org/10.3354/cr002001.
IPCC, 2007: Climate Change 2007: Mitigation of Climate Change.In: Contribution of Working Group III to the Fourth As-sessment Report of the Intergovernmental Panel on ClimateChange, S. Solomon et al., Eds., Cambridge Univ. Press,Cambridge, United Kingdom and New York, NY, USA, 996pp.

SEPTEMBER 2019 HUANG ET AL. 935
Ji, F., Z. H. Wu, J. P. Huang, and E. P. Chassignet, 2014: Evolutionof land surface air temperature trend. Nature Climate Change,4(6), 462–466, https://doi.org/10.1038/nclimate2223.
Ji, M. X., J. P. Huang, Y. K. Xie, and J. Liu, 2015: Comparisonof dryland climate change in observations and CMIP5 simu-lations. Adv. Atmos. Sci., 32(11), 1565–1574, https://doi.org/10.1007/s00376-015-4267-8.
Kawamoto, K., T. Hayasaka, T. Nakajima, D. Streets, and J. H.Woo, 2004: Examining the aerosol indirect effect over Chinausing an SO2 emission inventory. Atmospheric Research,72(1–4), 353–363, https://doi.org/10.1016/j.atmosres.2004.03.028.
Kerr, Y. H., 2007: Soil moisture from space: Where are we?.Hydrogeology Journal, 15, 117–120, https://doi.org/10.1007/s10040-006-0095-3.
Koppen, W., 1884: Die Warmezonen der Erde, nach der Dauer derheissen, gemassigten und kalten Zeit und nach der Wirkungder Warme auf die organische Welt betrachtet (The thermalzones of the earth according to the duration of hot, moder-ate and cold periods and to the impact of heat on the organicworld). Meteor. Z., 1, 215–226.
Kurosaki, Y., M. Shinoda, M. Mikami, and B. Nandintsetseg,2011: Effects of soil and land surface conditions in sum-mer on dust outbreaks in the following spring in a mongoliangrassland. Sola, 7(1), 69–72, https://doi.org/10.2151/sola.2011-018.
Li, C. X., T. B. Zhao, and K. R. Ying, 2016a: Effects of anthro-pogenic aerosols on temperature changes in China during thetwentieth century based on CMIP5 models. Theor. Appl. Cli-matol., 125(3–4), 529–540, https://doi.org/10.1007/s00704-015-1527-6.
Li, C. X., T. B. Zhao, and K. R. Ying, 2017: Quantifying the con-tributions of anthropogenic and natural forcings to climatechanges over arid-semiarid areas during 1946–2005. ClimaticChange, 144, 505–517, https://doi.org/10.1007/s10584-017-2028-7.
Li, J. B., X. H. Gou, E. R. Cook, and F. H. Chen, 2006: Tree-ring based drought reconstruction for the central Tien Shanarea in Northwest China. Geophys. Res. Lett., 33(7), L07715,https://doi.org/10.1029/2006GL025803.
Li, J. W., Z. F. Liu, C. Y. He, W. Tu, and Z. X. Sun, 2016b: Are thedrylands in northern china sustainable? A perspective fromecological footprint dynamics from 1990 to 2010. Science ofthe Total Environment, 553, 223–231, https://doi.org/10.1016/j.scitotenv.2016.02.088.
Li, Y., J. P. Huang, M. X. Ji, and J. J. Ran, 2015: Dryland expan-sion in northern China from 1948 to 2008. Adv. Atmos. Sci.,32(6), 870–876, https://doi.org/10.1007/s00376-014-4106-3.
Li, Z. Q., 2004: Aerosol and climate: A perspective over East Asia.In Observation, Theory, and Modeling of the AtmosphericVariability. X. Zhu, et al., Ed., World Sci. Co, https://doi.org/10.1142/9789812791139 0025.
Li, Z. Q., K. H. Lee, Y. S. Wang, J. Y. Xin, and W. M. Hao, 2010:First observation-based estimates of cloud-free aerosol radia-tive forcing across China. J. Geophys. Res., 115, D00K18,https://doi.org/10.1029/2009JD013306.
Li, Z. Q., F. Niu, J. W. Fan, Y. G. Liu, D. Rosenfeld, and Y. N.Ding, 2011: Long-term impacts of aerosols on the verticaldevelopment of clouds and precipitation. Nature Geoscience,4(12), 888–894, https://doi.org/10.1038/ngeo1313.
Lin, L., A. Gettelman, S. Feng, and Q. Fu, 2015: Simulated cli-matology and evolution of aridity in the 21st century. J. Geo-
phys. Res., 120(12), 5795–5815, https://doi.org/10.1002/2014JD022912.
Lin, L., A. Gettelman, Y. Xu, and Q. Fu, 2016: Simulated re-sponses of terrestrial aridity to black carbon and sulfateaerosols. J. Geophys. Res., 121(2), 785–794, https://doi.org/10.1002/2015JD024100.
Lin, P., J. J. Xia, Z. W. Yan, and H. Yang, 2017: Assessment of thePacific decadal oscillation’s contribution to the occurrence oflocal torrential rainfall in north China. Climatic Change, 144,391–403, https://doi.org/10.1007/s10584-016-1610-8.
Liu, C. M., and J. Xia, 2004: Water problems and hydrologicalresearch in the Yellow River and the Huai and Hai Riverbasins of China. Hydrological Processes, 18(12), 2197–2210,https://doi.org/10.1002/hyp.5524.
Liu, W. W., S. Q. An, G. S. Liu, and A. H. Guo, 2004: The farthermodification of Palmer drought severity model. Journal ofApplied Meteorological Science, 15, 207–216, https://doi.org/10.3969/j.issn.1001-7313.2004.02.009. (in Chinese with En-glish abstract)
Liu, X. D., Q. C. Guo, Z. T. Guo, Z. Y. Yin, B. W. Dong, and R.Smith, 2015: Where were the monsoon regions and arid zonesin Asia prior to the Tibetan Plateau uplift?. National ScienceReview, 2(4), 403–416, https://doi.org/10.1093/nsr/nwv068.
Liu, Z. Y., M. Notaro, J. Kutzbach, and N. Z. Liu, 2006: Assess-ing global vegetation-climate feedbacks from observations. J.Climate, 19, 787–814, https://doi.org/10.1175/JCLI3658.1.
Ma, J. R., X. D. Guan, R. X. Guo, Z. W. Gan, and Y. K. Xie, 2017:Mechanism of non-appearance of hiatus in Tibetan Plateau.Scientific Reports, 7, 4421, https://doi.org/10.1038/s41598-017-04615-7.
Ma, Z. G., 2007: The interdecadal trend and shift of dry/wet overthe central part of North China and their relationship to thePacific Decadal Oscillation (PDO). Chinese Science Bulletin,52, 2130–2139, https://doi.org/10.1007/s11434-007-0284-z.
Ma, Z. G., and C. B. Fu, 2003: Interannual characteristics of thesurface hydrological variables over the arid and semi-arid ar-eas of northern China. Global and Planetary Change, 37(3–4), 189–200, https://doi.org/10.1016/S0921-8181(02)00203-5.
Ma, Z. G., and L. Dan, 2005: Dry/wet variation and its rela-tionship with regional warming in arid-regions of North-ern China. Chinese Journal of Geophysics, 48, 1091–1099,https://doi.org/10.1002/cjg2.752.
Ma, Z. G., and C. B. Fu, 2006: Some evidence of drying trend overnorthern China from 1951 to 2004. Chinese Science Bulletin,51, 2913–2925, https://doi.org/10.1007/s11434-006-2159-0.
Ma, Z. G., and L. J. Shao, 2006: Relationship between dry/wetvariation and the Pacific Decade Oscillation (PDO) in North-ern China during the last 100 years. Chinese Journal of Atmo-spheric Sciences, 30, 464–474, https://doi.org/10.3878/j.issn.1006-9895.2006.03.10. (in Chinese with English abstract)
Ma, Z. G., and C. B. Fu, 2007: Global aridification in the secondhalf of the 20th century and its relationship to large-scale cli-mate background. Science in China Series D: Earth Sciences,50(5), 776–788, https://doi.org/10.1007/s11430-007-0036-6.
Maestre, F. T., and Coauthors, 2013: Changes in biocrust coverdrive carbon cycle responses to climate change in drylands.Global Change Biology, 19(12), 3835–3847, https://doi.org/10.1111/gcb.12306.
Mainguet, M., 1999: Aridity-Droughts and Human Development.Springer, 302 pp, https://doi.org/10.1007/978-3-662-03906-9.
Palmer, W. C., 1965: Meteorological drought research paper 45,

936 SEMIARID CLIMATE CHANGE VOLUME 36
Washington D C, US Department of Commerce Weather Bu-reau.
Penman, H. L., 1948: Natural evaporation from open water, haresoil and grass. Proc. Roy. Soc. London, 193, 120–145.
Piao, S. L., and Coauthors, 2010: The impacts of climate change onwater resources and agriculture in China. Nature, 467(7311),43–51, https://doi.org/10.1038/nature09364.
Poulter, B. J., and Coauthors, 2014: Contribution of semi-aridecosystems to interannual variability of the global carboncycle. Nature, 509, 600–603, https://doi.org/10.1038/nature13376.
Qian, C., and T. J. Zhou, 2014: Multidecadal variability of NorthChina aridity and its relationship to PDO during 1900–2010.J. Climate, 27(3), 1210–1222, https://doi.org/10.1175/JCLI-D-13-00235.1.
Qian, W. H., T. Ding, H. R. Hu, X. Lin, and A. M. Qin, 2009:An overview of dry-wet climate variability among monsoon-westerly regions and the monsoon northernmost marginal ac-tive zone in China. Adv. Atmos. Sci., 26, 630–641, https://doi.org/10.1007/s00376-009-8213-5.
Qian, Z. A., M. H. Song, T. W. Wu, and Y. Cai, 2017: Re-view of advances in world dryland climate research (II):Main investigation progress. Plateau Meteorology, 36, 1457–1476, https://doi.org/10.7522/j.issn.1000-0534.2017.00076.(in Chinese with English abstract)
Reed, S. C., K. K. Coe, J. P. Sparks, D. C. Housman, T. J. Zelikova,and J. Belnap, 2012: Changes to dryland rainfall result inrapid moss mortality and altered soil fertility. Nature ClimateChange, 2, 752–755, https://doi.org/10.1038/nclimate1596.
Safriel, U., and Z. Adeel, 2005: Dryland systems. Ecosystems andHuman Well-being, Current State and Trends, R. Hassan etal., Eds., Island Press, 623–662.
Seager, R., and Coauthors, 2007: Model projections of an immi-nent transition to a more arid climate in southwestern NorthAmerica. Science, 316(5828), 1181–1184, https://doi.org/10.1126/science.1139601.
Seneviratne, S. I., T. Corti, E. L. Davin, M. Hirschi, E. B. Jaeger,I. Lehner, B. Orlowsky, and A. J. Teuling, 2010: Investi-gating soil moisture-climate interactions in a changing cli-mate: A review. Earth-Science Reviews, 99(3–4), 125–161,https://doi.org/10.1016/j.earscirev.2010.02.004.
Shi, Z. T., L. Y. Zhang, and G. W. Sui, 1994: Natural disasters andtheir formation causes on Chinese monsoon marginal belt.Journal of Catastrophology, 9(4), 59–64. (in Chinese withEnglish abstract)
Su, J., J. P. Huang, Q. Fu, P. Minnis, J. M. Ge, and J. R. Bi, 2008:Estimation of Asian dust aerosol effect on cloud radiationforcing using Fu-Liou radiative model and CERES measure-ments. Atmospheric Chemistry and Physics, 8, 2763–2771,https://doi.org/10.5194/acp-8-2763-2008.
Tang, G. L., Y. H. Ding, S. W. Wang, G. Y. Ren, H. B. Liu, andL. Zhang, 2010: Comparative analysis of China surface airtemperature series for the past 100 years. Advance in ClimateChange Research, 1(1), 11–19, https://doi.org/10.3724/SP.J.1248.2010.00011.
Thornthwaite, C. W., 1948: An approach toward a rational classifi-cation of climate. Geographical Review, 38(1), 55–94, https://doi.org/10.2307/210739.
Twomey, S., 1977: The influence of pollution on the shortwavealbedo of clouds. J. Atmos. Sci., 34, 1149–1154, https://doi.org/10.1175/1520-0469(1977)034<1149:TIOPOT>2.0.CO;2.
Vicente-Serrano, S. M., S. Beguerıa, J. I. Lopez-Moreno, M. An-
gulo, and A. El Kenawy, 2010: A new global 0.5◦ griddeddataset (1901–2006) of a multiscalar drought index: Compar-ison with current drought index datasets based on the Palmerdrought severity index. Journal of Hydrometeorology, 11,1033–1043, https://doi.org/10.1175/2010JHM1224.1.
Wallace, J. M., Y. Zhang, and J. A. Renwick, 1995: Dynamic con-tribution to hemispheric mean temperature trends. Science,270(5237), 780–783, https://doi.org/10.1126/science.270.5237.780.
Wang, G. Y., J. P. Huang, W. D. Guo, J. Q. Zuo, J. M. Wang, J.R. Bi, Z. W. Huang, and J. S. Shi, 2010a: Observation anal-ysis of land-atmosphere interactions over the Loess Plateauof Northwest China. J. Geophys. Res., 115, D00K17, https://doi.org/10.1029/2009jd013372.
Wang, H. J., Y. N. Chen, and Z. S. Chen, 2013: Spatial distribu-tion and temporal trends of mean precipitation and extremesin the arid region, northwest of China, during 1960–2010.Hydrological Processes, 27(12), 1807–1818, https://doi.org/10.1002/hyp.9339.
Wang, L., W. Chen, and R. H. Huang, 2008: Interdecadal mod-ulation of PDO on the impact of ENSO on the East Asianwinter monsoon. Geophys. Res. Lett., 35(20), L20702, https://doi.org/10.1029/2008GL035287.
Wang, L., P. D’Odorico, J. P. Evans, D. J. Eldridge, M. F. Mc-Cabe, K. K. Caylor, and E. G. King, 2012: Dryland ecohy-drology and climate change: Critical issues and technical ad-vances. Hydrology and Earth System Sciences, 16(8), 2585–2603, https://doi.org/10.5194/hess-16-2585-2012.
Wang, L., W. Chen, G. Huang, and G. Zeng, 2017: Changes of thetransitional climate zone in East Asia: Past and future. Cli-mate Dyn., 49, 1463–1477, https://doi.org/10.1007/s00382-016-3400-4.
Wang, S. S., J. P. Huang, Y. L. He, and Y. P. Guan, 2014: Com-bined effects of the Pacific Decadal Oscillation and El Nino-Southern Oscillation on global land dry-wet changes. Scien-tific Reports, 4, 6651, https://doi.org/10.1038/srep06651.
Wang, T., W. Wu, X. Xue, Q. W. Sun, W. M. Zhang, and Z.W. Han, 2004: Spatial-temporal changes of sandy desertifiedland during last 5 decades in Northern China. Acta Geograph-ica Sinica, 59, 203–212, https://doi.org/10.3321/j.issn:0375-5444.2004.02.006. (in Chinesewith English abstract)
Wang, W. C., J. P. Huang, P. Minnis, Y. X. Hu, J. M. Li, Z. W.Huang, J. K. Ayers, and T. H. Wang, 2010b: Dusty cloudproperties and radiative forcing over dust source and down-wind regions derived from A-Train data during the Pacificdust experiment. J. Geophys. Res., 115, D00H35, https://doi.org/10.1029/2010JD014109.
Wells, N., S. Goddard, and M. J. Hayes, 2004: A self-calibratingPalmer drought severity index. J. Climate, 17, 2335–2351,https://doi.org/10.1175/1520-0442(2004)017<2335:ASPDSI>2.0.CO;2.
Wu, G. X., Y. M. Liu, X. Zhu, W. Li, R. Ren, A. M. Duan, andX. Liang, 2009: Multi-scale forcing and the formation ofsubtropical desert and monsoon. Annales Geophysicae, 27,3631–3644, https://doi.org/10.5194/angeo-27-3631-2009.
Xia, J., L. K. Ning, Q. Wang, J. X. Chen, L. Wan, and S. Hong,2017: Vulnerability of and risk to water resources in aridand semi-arid regions of West China under a scenario of cli-mate change. Climatic Change, 144, 549–563, https://doi.org/10.1007/s10584-016-1709-y.
Xia, X., and Coauthors, 2016: Ground-based remote sensing ofaerosol climatology in China: Aerosol optical properties, di-
SEPTEMBER 2019 HUANG ET AL. 937
rect radiative effect and its parameterization. Atmos. Envi-ron., 124, 243–251, https://doi.org/10.1016/j.atmosenv.2015.05.071.
Xiao, Z. X., and A. M. Duan, 2016: Impacts of Tibetan Plateausnow cover on the interannual variability of the East Asiansummer monsoon. J. Climate, 29(23), 8495–8514, https://doi.org/10.1175/JCLI-D-16-0029.1.
Xu, Z. F., and Z. L. Yang, 2017: Relative impacts of increasedgreenhouse gas concentrations and land cover change onthe surface climate in arid and semi-arid regions of China.Climatic Change, 144, 491–503, https://doi.org/10.1007/s10584-017-2025-x.
Yang, Q., M. X. Li, Z. Y. Zheng, and Z. G. Ma, 2017a: Re-gional applicability of seven meteorological drought indicesin China. Science China Earth Sciences, 60, 745–760, https://doi.org/10.1007/s11430-016-5133-5.
Yang, Q., Z. G. Ma, X. A. Fan, Z. L. Yang, Z. F. Xu, and P.L. Wu, 2017b: Decadal modulation of precipitation patternsover eastern China by sea surface temperature anomalies. J.Climate, 30, 7017–7033, https://doi.org/10.1175/JCLI-D-16-0793.1.
Yang, Q., Z. G. Ma, and B. L. Xu, 2017c: Modulation of monthlyprecipitation patterns over East China by the Pacific DecadalOscillation. Climatic Change, 144, 405–417, https://doi.org/10.1007/s10584-016-1662-9.
Yin, D. Q., M. L. Roderick, G. Leech, F. B. Sun, and Y. F. Huang,2014: The contribution of reduction in evaporative coolingto higher surface air temperatures during drought. Geophys.Res. Lett., 41(22), 7891–7897, https://doi.org/10.1002/2014GL062039.
Yu, Y., and Z. H. Xie, 2013: A simulation study on climatic effectsof land cover change in China. Advances in Climate ChangeResearch, 4, 117–126, https://doi.org/10.3724/SP.J.1248.2013.117.
Zhai, P. M., X. B. Zhang, H. Wan, and X. H. Pan, 2005: Trendsin total precipitation and frequency of daily precipitation ex-tremes over China. J. Climate, 18(7), 1096–1108, https://doi.org/10.1175/JCLI-3318.1.
Zhang, H. Q., X. J. Gao, and Y. H. Li, 2009: Climate impactsof land-use change in China and its uncertainty in a globalmodel simulation. Climate Dyn., 32, 473–494, https://doi.org/10.1007/s00382-008-0388-4.
Zhang, J. Y., W. J. Dong, C. B. Fu, and L. Y. Wu, 2003b: The in-fluence of vegetation cover on summer precipitation in China:A statistical analysis of NDVI and climate data. Adv. Atmos.Sci, 20(6), 1002–1006, https://doi.org/10.1007/BF02915523.
Zhang, Q., C. Y. Xu, X. H. Chen, and Z. X. Zhang, 2011:
Statistical behaviours of precipitation regimes in China andtheir links with atmospheric circulation 1960–2005. Interna-tional Journal of Climatology, 31, 1665–1678, https://doi.org/10.1002/joc.2193.
Zhang, Q. Y., J. Wei, and S. Y. Tao, 2003a: The decadal and in-terannual variations of drought in the northern China and as-sociation with the circulations. Climatic and EnvironmentalResearch, 8(3), 307–318, https://doi.org/10.3878/j.issn.1006-9585.2003.03.05. (in Chinese English abstract)
Zhang, Y. C., and L. J. Zhang, 2005: Precipitation and tempera-ture probability characteristics in climatic and ecological tran-sition zone of Northeast China in recent 50 years. ScientiaGeographica Sinica, 25(5), 561–566, https://doi.org/10.3969/j.issn.1000-0690.2005.05.008. (in Chinese English abstract)
Zhang, Y. T., X. D. Guan, P. Y. Yu, K. Y. Xie, and C. H. Jin, 2017:Contributions of radiative factors to enhanced dryland warm-ing over East Asia. J. Geophys. Res., 122, 7723–7736, https://doi.org/10.1002/2017JD026506.
Zhang, Z. S., H. J. Wang, Z. T. Guo, and D. B. Jiang, 2007:What triggers the transition of palaeoenvironmental patternsin China, the Tibetan Plateau uplift or the Paratethys Sea re-treat?. Palaeogeography, Palaeoclimatology, Palaeoecology,245, 317–331, https://doi.org/10.1016/j.palaeo.2006.08.003.
Zhao, S. Y., H. Zhang, S. Feng, and Q. Fu, 2015: Simulating di-rect effects of dust aerosol on arid and semi-arid regions us-ing an aerosol-climate coupled system. International Journalof Climatology, 35(8), 1858–1866, https://doi.org/10.1002/joc.4093.
Zhao, S. Y., H. Zhang, Z. L. Wang, and X. W. Jing, 2017: Simu-lating the effects of anthropogenic aerosols on terrestrial arid-ity using an aerosol-climate coupled model. J. Climate, 30,7451–7463, https://doi.org/10.1175/JCLI-D-16-0407.1.
Zhao, T. B., and A. G. Dai., 2015: The magnitude and causes ofglobal drought changes in the twenty-first century under alow–moderate emissions scenario. J. Climate, 28, 4490–4512,https://doi.org/10.1175/JCLI-D-14-00363.1.
Zhao, T. B., and A. G. Dai, 2017: Uncertainties in historicalchanges and future projections of drought. Part II: model-simulated historical and future drought changes. ClimaticChange, 144, 535–548, https://doi.org/10.1007/s10584-016-1742-x.
Zhou, L. M., 2016: Desert amplification in a warming climate. Sci-entific Reports, 6, 31065, https://doi.org/10.1038/srep31065.
Zhou, L. M., H. S. Chen, W. J. Hua, Y. J. Dai, and N. Wei,2016: Mechanisms for stronger warming over drier ecore-gions observed since 1979. Climate Dyn., 47(9–10), 2955–2974, https://doi.org/10.1007/s00382-016-3007-9.