Advanced tractor-trailer efficiency technology potential ... · advanced tractor-trailer efficiency...
66
www.theicct.org APRIL 2015 WHITE PAPER [email protected] BERLIN | BRUSSELS | SAN FRANCISCO | WASHINGTON ADVANCED TRACTOR-TRAILER EFFICIENCY TECHNOLOGY POTENTIAL IN THE 2020-2030 TIMEFRAME OSCAR DELGADO, NIC LUTSEY
Transcript of Advanced tractor-trailer efficiency technology potential ... · advanced tractor-trailer efficiency...

www.theicct.org
APRIL 2015WHITE PAPER
B E R L I N | B R U SS E L S | SA N F R A N C I S CO | WAS H I N GTO N
ADVANCED TRACTOR-TRAILER EFFICIENCY TECHNOLOGY POTENTIAL IN THE 2020-2030 TIMEFRAME OSCAR DELGADO, NIC LUTSEY

ACKNOWLEDGEMENTS
This project was supported by the ClimateWorks Foundation and the Energy Foundation. The authors thank Arvind Thiruvengadam, Pragalath Thiruvengadam, Saroj Pradhan, Marc Besch, and Daniel Carder at West Virginia University for their contributions to diesel engine testing utilized in this project. The authors also thank Arvind Thiruvengadam, Marc Besch, Nigel Clark, Ronald Graves, Rachel Muncrief, Ben Sharpe, Fanta Kamakaté, and Drew Kodjak for their critical input and reviews of the report.
© 2014 International Council on Clean Transportation
1225 I Street NW, Suite 900, Washington DC 20005
www.theicct.org | [email protected]

i
TABLE OF CONTENTS
Executive Summary ....................................................................................................................1
I. Introduction ...........................................................................................................................4
Background ................................................................................................................................................4
Overview ..................................................................................................................................................... 8
II. Vehicle simulation modeling development .................................................................... 10
Engine data and modeling ................................................................................................................. 10
Engine fuel consumption maps .............................................................................................. 10
Engine energy audit ......................................................................................................................12
Autonomie-based tractor-trailer modeling ..................................................................................15
Engine technology .........................................................................................................................17
Engine technology packages .....................................................................................................21
Transmission technology ............................................................................................................22
Tractor-trailer technology ..........................................................................................................24
Summary calibration of baseline engine and tractor-trailer ........................................25
Summary calibration of 2017 compliant engine and tractor-trailer ..........................29
Advanced Truck Technology Efficiency Simulation Tool (ATTEST) ....................................31
Lumped parameter modeling development ........................................................................31
Incorporation of individual technologies ..............................................................................36
Modeling technology package synergies ............................................................................37
III. Analysis of technology potential ....................................................................................42
Individual technologies ......................................................................................................................42
Technology package results ............................................................................................................. 44
IV. Conclusions .........................................................................................................................51
Tractor-trailer simulation modeling .................................................................................................51
Advanced efficiency technology findings ....................................................................................52
Policy discussion and recommendations .....................................................................................55
References ...............................................................................................................................58

ii
ICCT WHITE PAPER
LIST OF FIGURES
Figure ES-1. Potential fuel consumption reduction from selected tractor-trailer efficiency technologies in the 2020-2030 timeframe over the HHDDT65 cycle ................... 2
Figure 1. Distribution of certified model year 2012-2014 heavy-duty on-road diesel engines brake thermal efficiency (Based on US EPA, 2014a) ........................................... 5
Figure 2. Average SmartWay carrier fuel economy (Based on US EPA, 2014b) ...................6
Figure 3. Stakeholder workshop findings regarding technologies’ percent fuel consumption benefits in representative line-haul Class 8 trucks. ...................................... 8
Figure 4. Illustration of the relative fuel consumption rate for reference 2010 engine (Thiruvengadam et al, 2014) ............................................................................................11
Figure 5. Engine energy flows, fuel input, and brake-specific fuel efficiency ........................13
Figure 6. Energy distribution of reference and efficient engines over the SET cycle .......15
Figure 7. Vehicle propulsion architecture for Class 8 tractor-trailer in Autonomie .............16
Figure 8. Energy losses and loads for tractor-trailer from various sources ...........................29
Figure 9. Tractor-trailer duty cycles modeled in ATTEST and Autonomie ............................32
Figure 10. Percent energy audit of baseline tractor-trailer by ten energy loss categories ...............................................................................................................................................33
Figure 11. Illustration of ATTEST model, highlighting structure, inputs, and outputs. .......35
Figure 12. Comparison of technology packages in Autonomie and ATTEST .......................38
Figure 13. Illustration of operational locus shift for tractor-trailer on three drive cycles without and with engine downspeeding ..................................................................40
Figure 14. Fuel consumption reduction as a function of vehicle, transmission, and engine parameters (HHDDT65 cycle) ........................................................................................ 44
Figure 15. Braking losses as a percent of total fuel energy for different vehicle road load reduction packages ................................................................................................................ 49
Figure 16. Potential fuel consumption reduction from tractor-trailer efficiency technologies in the 2020-2030 timeframe over the HHDDT65 cycle ......................................53
Figure 17. Potential fuel consumption reduction from tractor-trailer efficiency technologies in the 2020-2030 timeframe over the real world highway cycle with grade ........................................................................................................................................................53
Figure 18. Engine and non-engine related technology contribution to selected tractor-trailer efficiency packages over the HHDDT65 cycle ..................................................... 54

iii
ADVANCED TRACTOR-TRAILER EFFICIENCY TECHNOLOGY POTENTIAL IN THE 2020-2030 TIMEFRAME
LIST OF TABLES
Table 1. Comparison of baseline tractor-trailers for this study and the US regulation ..... 27
Table 2. Comparison of 2017 tractor-trailers for this study and the US regulation ...........30
Table 3. Performance criteria for tractor-trailer technology packages ................................... 41
Table 4. Percent fuel consumption from efficiency technologies for 2015-2030 Class 8 line-haul applications from 2010 baseline...........................................................................42
Table 5. Definitions for engine, transmission, and road load reduction technologies applied in efficiency technology packages .......................................................................................45
Table 6. Technology package fuel consumption results ..............................................................46
Table 7. Maximum feasible engine downsizing level for combinations of road load reduction and downspeeding levels. .........................................................................................48

1
ICCT WHITE PAPER
EXECUTIVE SUMMARY
In the United States, combination tractor-trailers’ average fuel economy has remained at approximately six miles per gallon for nearly two decades. These tractor-trailers, though less than 2% of US vehicles, represent about 20% of on-road transportation oil use and climate emissions. The first phase of heavy-duty vehicle efficiency standards, adopted in 2011, require relatively modest improvements in tractor-trailer efficiency by model year 2017. With the US government set to establish new heavy-duty vehicle standards for 2020 and beyond, this research targets an improved understanding of how available and emerging advanced technologies might increase tractor-trailer efficiency for 2020 and beyond.
The original research described in this report contributes to the dialogue on tractor-trailer efficiency in several ways. Foremost, this research incorporates a new 2010-emissions-compliant engine map and its detailed energy audit as the basis for the modeling of tractor-trailer technology. This work utilizes new engine map input data to augment the state-of-the-art Autonomie vehicle simulation model to assess how various efficiency technologies separately and cumulatively interact to impact tractor-trailer efficiency in line-haul applications. The modeling also evaluates emerging advanced integrated powertrain technologies that manufacturers and suppliers are developing, for example, engine downspeeding and downsizing with automated transmissions. Finally, this work also includes an evaluation of additional efficiency gains and interactions related to advanced vehicle load reduction technologies like aerodynamics, tires, and weight reduction.
The findings indicate that there is the potential to substantially increase tractor-trailer efficiency. Figure ES-1 summarizes results on the efficiency potential of tractor-trailer technology packages in the 2020-2030 timeframe. The results shown in the figure are for the fuel consumption (in gallons of diesel fuel per ton of payload per 1000 miles traveled) in a Class 8 line-haul tractor-trailer with 19 tons of payload over the heavy heavy-duty diesel truck 65 miles-per-hour (HHDDT65) cycle. As shown, the reference 2010 tractor-trailer with 9.5 gal/1000 ton-mi, and 5.5 miles per gallon (mpg), could see substantially reduced fuel consumption. In descending order in the figure is a progres-sion of efficiency technology packages with increasingly advanced technology and reduced fuel consumption. Going beyond compliance with the adopted 2017 standards, integrated transmission technologies could increase efficiency to about 7 mpg. Load-reduction technologies—like mass reduction, aerodynamic and tire efficiency improve-ments in trailers—and integrated powertrains with downspeeding could further increase efficiency to about 8 mpg. Additional tractor-trailer load reduction, engine downsizing, and engine waste heat recovery could increase fuel efficiency well above 9 mpg. Long-term improvements in engine and vehicle, plus hybridization or road load management could increase tractor-trailer efficiency to above 11 mpg.

2
ADVANCED TRACTOR-TRAILER EFFICIENCY TECHNOLOGY POTENTIAL IN THE 2020-2030 TIMEFRAME
012345678910
Reference 2010 tractor-trailer
+ Incremental engine efficiency (2017 engine compliance)
+ Tractor road load technology (2017 tractor compliance)
+ Moderate integrated powertrain (Automated manual, 6x2)
+ Moderate tractor-trailer road load technology (-20% Cd aerodynamics, -16% Crr tires, -7% mass)
+ Advanced integrated powertrain ( 2020+ engine (48% BTE), dual-clutch)
+ Advanced tractor-trailer road load technology (-30% Cd aerodynamics, -30% Crr tires, -14% mass)
+ Engine downsizing (10%)
+ Engine waste heat recovery (52% BTE)
+ Long-term tractor-trailer road load technology (-50% Cd aerodynamics, -35% Crr tires, -17% mass)
+ Long-term engine technology (55% BTE)
+ Hybrid system (60% braking regeneration efficiency)
Fuel consumption (gal/1000 ton-mi)
5.5 mpg
9.1 mpg
6.7 mpg
6.0 mpg
6.9 mpg
7.3 mpg
8.0 mpg
8.9 mpg
9.5 mpg
11.1 mpg
12.0 mpg
12.3 mpg
Figure ES-1. Potential fuel consumption reduction from selected tractor-trailer efficiency technologies in the 2020-2030 timeframe over the HHDDT65 cycle
The findings from this analysis, in turn, point to several policy implications for the in-development US heavy-duty vehicle greenhouse gas emission and efficiency standards for 2020 and beyond.
(1) Technology potential in the mid-term—The findings indicate that available tractor-trailer efficiency technologies can reduce fuel use per ton-mile by 39% from the baseline 2010 technology, and by 27% from 2017, the final year of the already adopted standards. Achieving these efficiency levels by 2024 would amount to over 4%-per-year fuel consumption improvement for new tractor-trailers from 2017-2024.
(2) Technology potential in the long-term—The findings indicate that technology packages with emerging load-reduction and powertrain technologies can achieve at least a 50% reduction from baseline 2010 technology, or about a 40% reduction from 2017, in the 2025-2030 timeframe. For the regulation to be technology-forcing, it would need to ensure these levels of fuel consumption reduction and it would be important that standards provide sufficiently long lead-time to promote all the promising advanced efficiency technologies, increase investment security, and help drive technology innovation.
(3) Diverse technology approaches—Technology packages with advanced load-reduction and engine energy recovery approaches can achieve similar efficiency results, but do so with varying relative contributions from aerodynamic, powertrain, and other improvements. Regulations and the regulatory structure would ideally ensure that all available technologies from engines to trailers that are cost-effective are strongly promoted.

3
ICCT WHITE PAPER
(4) Engine efficiency potential—The analysis of technology packages indicates that about one-third to one-half of the overall potential tractor-trailer efficiency benefits come from engine efficiency improvements (from baseline 2010 technology). Specifically looking at expected technology improvements from 2018-2030, the analysis indicates that engine efficiency improvements would amount to up to a 13% fuel consumption reduction by 2024 and 16% fuel consumption reduction over the long term. Without sufficient engine-specific regulatory requirements, these engine efficiency technologies appear unlikely to be commercialized in the 2030 timeframe.
(5) Regulatory procedure changes—The work suggests that several regulatory procedure changes are warranted. For example, direct use of engine map data in regulatory accounting of engine efficiency in integrated full-vehicle simulation is critical to ap-propriately evaluate real-world tractor-trailer efficiency technologies. Also, inclusion of grade in test cycles that better reflect real-world driving, streamlined procedures that promote emerging integrated engine-powertrain options, and requirements for trailer efficiency will all help promote applicable and promising technologies according to their real-world benefits. Moreover, some accessory loads are not measured over the engine dynamometer procedure. It is important that the simulation model provides ways to promote technologies that reduce these accessory loads.
A number of research questions remains beyond the scope of this research. The research is focused on efficiency advancement from a particular tractor-trailer in particular condi-tions, but the methodology could flexibly be used to model technology improvements from other baseline vehicle models, whole fleets of vehicles, and other duty cycles. Another key question is how the modeling of the technology potential for tractor-trailers would differ for other major vehicle markets that are on the verge of future standards, as this would involve tailoring the work to their particular baseline fleet vehicle character-istics. Another unexplored question relates to how the technology modeling approach could be applied to other vehicle segments (e.g., delivery vans, medium-duty work trucks, and buses). Also, this investigation of advanced efficiency technologies does not assess the potential to simultaneously reduce local air pollutant emissions. Finally, other questions that are beyond the scope of this work include assessment of the cost, payback period, and relative cost-effectiveness of the various individual technologies.
The implications of the work are more widespread than the immediate US dialogue toward 2020-and-beyond heavy-duty vehicle standards. Many countries are actively investigating heavy-duty vehicle efficiency policy for their fleets. Similar to the US, Japan, Canada, and China have already adopted some form of fuel efficiency or green-house gas standard for heavy-duty vehicles and are working toward the next phase of their regulations. Other areas, such as India, Brazil, Mexico, South Korea, and the Euro-pean Union are also investigating new heavy-duty vehicle efficiency policies. The US is poised to potentially stake a policy and technology leadership position on tractor-trailer efficiency. Technology assessments like this that utilize state-of-the-art modeling tools are a key input to these processes, helping to inform on the potential efficiency gains in heavy-duty vehicles.
4
ADVANCED TRACTOR-TRAILER EFFICIENCY TECHNOLOGY POTENTIAL IN THE 2020-2030 TIMEFRAME
I. INTRODUCTION
Diesel-fueled combination tractor-trailers are the prime freight movers for manufactured goods throughout world economies. These vehicles have made many technical advances over the years in safety and air quality-related emissions. However, until recent efficiency regulations, relatively little had been done to increase their fuel economy. In the United States tractor-trailers’ average fuel economy has remained at approximately six miles per gallon (mpg) diesel for nearly two decades (Davis et al, 2013). Combination tractor-trailers represent a relatively small count of vehicles (i.e., less than 2% of overall US on-road vehicle sales and stock), but represent about 20% of all on-road transportation oil use and climate emissions (US EIA, 2013). Tractor-trailers’ overall fuel consumption was about 2 million barrels per day (mbd) in 2013 and is projected to grow to over 2.4 mbd by 2030, representing over two-thirds of heavy-duty vehicle fuel consumption (US EIA, 2013). Tractor-trailers’ substantial contribution to oil use, their associated carbon emissions, and their potential to increase efficiency with advanced technology each make them a prime target for increased efficiency.
The 2011 adoption of heavy-duty vehicle efficiency and greenhouse gas (GHG) emission standards by the US Environmental Protection Agency (US EPA) and the National Highway Traffic Safety Administration (NHTSA) placed significant new requirements on engine and truck manufacturers to increase the efficiency of their products through 2018. The initial standards provide a foundation and regulatory framework to categorize vehicle types and account for varied technology improvements through a combination of direct testing of engines and vehicle simulation modeling to account for the myriad of vehicle permutations. Building on this first phase of standards, the federal government has initiated proceedings for a proposed second phase of heavy-duty vehicle efficiency standards for 2019 and beyond; the established rulemaking timetable includes proposed standards in 2015 and finalized regulations in 2016 (White House, 2014).
Among the more critical questions for the “Phase 2” regulations are what emerging efficiency technologies are available in the rule’s timeframe, how would the technologies interact as integrated technology packages to deliver future efficiency gains, and how adequately can the current test procedures account for their effectiveness. Another key question is how much technology potential is available across the various component parts of the tractor-trailer. For example, efficiency improvements from the engine, transmission, low rolling resistance tires, and trailer aerodynamics could all potentially play an important role in future trucks. This assessment seeks to help inform on technol-ogy availability, technology effectiveness, and the relative impacts from tractor-trailer areas using state-of-the-art vehicle simulation modeling. This study does not include analysis regarding cost.
BACKGROUNDLeading up to the original US heavy-duty efficiency rulemaking, a number of technical analyses informed on applicable technologies and their potential to reduce fuel con-sumption in engines and vehicles. Most prominently, there were three studies—NESCCAF (Cooper et al., 2009); TIAX (Kromer et al., 2009); and National Research Council (NRC, 2010)—that provided technology descriptions, estimations of technology-specific fuel consumption reduction, and expert assessments on the viability of heavy-duty vehicle technologies that could increase efficiency. These studies highlighted engine, transmis-sion, and road load reduction technologies that were available and emerging primarily in

5
ICCT WHITE PAPER
the 2010-2020 timeframe. Generally, these studies show how the Class 8 tractor-trailer segment has the largest potential efficiency improvements among the heavy-duty vehicle classes. The studies tend to show that Class 8 tractor-trailers have high potential, of up to 30-40% fuel consumption reduction, from available low-cost technologies with relatively quick payback periods.
The regulatory assessment by US EPA and NHTSA toward the 2014-2018 standards built upon the technical work of the NESCCAF, TIAX, and NRC work with extensive com-munication with vehicle manufacturers and technology suppliers. Ultimately, the new standards would require a 6% reduction in heavy-duty diesel engine fuel use and an ap-proximate overall 9-23% fuel consumption reduction from Class 7 and 8 tractor-trailers (ICCT, 2012). The US EPA and NHTSA regulatory assessment indicates that probable technology paths for compliance include the deployment of engine friction reduction, combustion optimization, turbocharging system improvements, tractor aerodynamic drag improvements, tractor tire rolling resistance improvements, a small amount of tractor weight reduction, and idle reduction technology (US EPA and NHTSA, 2011b). Although efficiency technologies were identified in areas of trailer aerodynamics, trailer tires, advanced transmissions, and hybridization, the agencies did not target specific reductions in these areas within the regulation.
Since the adoption of the first phase of standards, newly available data help provide the full vehicle context on the baseline, fleet distribution, and trends in diesel engine and tractor-trailer efficiency. Figure 1 shows the distribution of the brake thermal efficiency (BTE) as evaluated at peak torque for certified diesel engines from model years 2012-2014 of at least 400 horsepower. Diesel engines in long haul duty cycles tend to exhibit relatively high efficiency due to sustained higher operational loads (e.g., consistent high-way speeds of 60-65 miles per hour, with limited braking and acceleration). The peak efficiency of heavy-duty engines in converting diesel fuel energy to engine brake power is generally reported as approximately 42% (See, e.g., NRC, 2008, 2012). Recent diesel engine certification data from US EPA indicates that diesel engines are incrementally getting more efficient. As shown in the figure, the engine certification data, although not sales-weighted, shifts from 2012, when the most prevalent engines achieved 41% BTE, to 2014, when most engines are 43-44% BTE (based on US EPA, 2014a). Although the efficiency data are shown for peak torque, highway driving torque demands are usually lower than peak torque so actual operational BTE could be several percentage points lower than BTE at peak torque.
0%
20%
40%
60%
<39% 39% 40% 41% 42% 43% 44% 45% >46%
Per
cent
of
eng
ines
MY2012 MY2013 MY2014
Figure 1. Distribution of certified model year 2012-2014 heavy-duty on-road diesel engines brake
thermal efficiency (Based on US EPA, 2014a)

6
ADVANCED TRACTOR-TRAILER EFFICIENCY TECHNOLOGY POTENTIAL IN THE 2020-2030 TIMEFRAME
Along with the variation in diesel engine efficiency technology, there are also some available data regarding the fuel efficiency of heavy-duty vehicles in the fleet. As cited above from (Davis et al., 2013), the reported aggregated fuel economy of heavy-duty vehicles is approximately 6 mpg. Data from US EPA (2014b) on SmartWay carriers’ fleets indicates the same approximate fleet-wide heavy-duty vehicle fuel economy, and also shows the approximate range. Figure 2 shows the distribution of the average company fuel economy for 2,393 participating SmartWay carrier companies. The data shown in the figure excludes SmartWay’s multi-modal, logistics, expedited, and pack-age delivery trucks in order to best approximate the US heavy-duty fleet as applicable to this assessment on heavy-duty tractor-trailers. The harmonic average of the com-panies’ average fuel economy is 6.0 mpg, and 93% of carriers are averaging between 5.2 and 6.8 mpg. Other corresponding average attributes for the same dataset on companies’ carriers include 1,705 grams CO2 emissions per mile (gCO2/mile), average payload of 18.4 tons, and 9.1 gallons of diesel consumed per 1000 ton-miles of freight movement (gal/1,000 ton-mile). The fuel consumption metric (gal/1,000 ton-mile) is more relevant for freight-moving vehicles due to its inclusion of payload in the denominator, yet fuel economy in miles per gallon is reported in parallel in many places in this report due its more common usage. These data, although they include a mix of new and old trucks, provides broader context for real-world variation of heavy-duty vehicle fuel efficiency in fleet operation.
0
200
400
600
800
<=4.4
4.4 < X <= 4.8
4.8 < X <= 5.2
5.2 < X <= 5.6
5.6 < X <= 6
6 < X <= 6.4
6.4 < X <= 6.8
6.8 < X <= 7.2
>=7.2
Num
ber
of
com
pan
ies
Average company fuel economy (mpg)
Figure 2. Average SmartWay carrier fuel economy (Based on US EPA, 2014b)
Data from a number of studies and on-going projects have begun to update the knowledge base on what heavy-duty vehicle efficiency technologies are available, their associated fuel consumption reduction, and the potential viability in the 2015-2030 timeframe. A recent paper by Stanton (2013) illustrated a powertrain technology path with engine downspeeding, aftertreatment, turbomachinery, auxiliary, exhaust gas recirculation, friction, heat transfer, waste heat recovery and optimization technologies that can deliver greater than 20% fuel consumption reduction. The recent SuperTruck program results from the Cummins-Peterbilt, Daimler, and Volvo teams are demon-strating 15-22% engine efficiency improvements and are on track to meet their goals to increase brake thermal efficiency to over 50% and increase vehicle freight efficiency (in ton-mpg units) by over 50% over typical highway cruise conditions (Delgado and Lutsey, 2014). A recent Calstart study indicated that increasingly the SuperTruck

7
ICCT WHITE PAPER
technologies are beginning to be commercialized (Bloch-Rubin and Gallo, 2014). Moreover, particular to trailer technologies, the adoption of technologies like those within the US SmartWay and California’s tractor-trailer GHG rule for aerodynamics and tire improvement have the potential to increase efficiency by 10-12% (Sharpe et al., 2014a). Simulation work for the Department of Energy on its SuperTruck technologies indicates the potential to deliver tractor-trailers that achieve over 10 miles per gallon (TA Engineering, 2011).
In 2013-2014, the discussions among industry leaders have further improved the understanding about which technologies are available, which technologies are already being widely deployed or planned to be deployed within the next several years (i.e., within the 2014-2018 timeframe), and which technologies might have the greatest potential for widespread deployment for 2020 and later. A summary report to a recent industry and stakeholder workshop “Emerging Technologies for Heavy-Duty Vehicle Fuel Efficiency” highlighted the technologies, their estimated low and high fuel consumption potential in line-haul applications, and their expected applicability in the 2020-2030 timeframe. The workshop included presentations from Daimler, Volvo, Cummins, Eaton, Wabash, and SmartTruck and a presentation from US EPA and NHTSA on their approach to evaluate technologies in their regulatory development. A summary of the presentations and the technical exchange between the various suppliers, original equipment manufacturers, government officials, non-government organizations, and research groups provides an update on the “conventional wisdom” on potential tractor-trailer technologies (Lutsey et al., 2014).
Figure 3 shows a summary of the findings from the July 2014 heavy-duty vehicle stakeholder workshop regarding potential fuel consumption reduction (from a 2010 baseline) for various efficiency technologies. The low and high error bars indicate the range of values from data sources and survey respondents. As shown in the figure, there are many technologies throughout the engine, transmission, and vehicle areas that offer substantial efficiency gains. Due to systems’ interactions, the fuel consump-tion benefits are not directly additive when more than one technology is applied. This study uses the technology list as a starting point for the modeling of tractor-trailer technologies. Also shown in the figure are expectations on technology timing. Ef-ficiency technologies that are expected to largely phase into the new heavy-duty fleet at greater than 50% penetration within Phase 1 (i.e., within the model year 2018 timeframe) are delineated in the chart from those with greater 2020-2030 potential (i.e., post 2018 potential).

8
ADVANCED TRACTOR-TRAILER EFFICIENCY TECHNOLOGY POTENTIAL IN THE 2020-2030 TIMEFRAME
0% 2% 4% 6% 8% 10% 12%
Engine friction reduction
On-demand accessories
Combustion optimization
Turbo improvements
Engine controls
Aftertreatment improvement
Engine downsizing
Turbocompounding
Waste heat recovery
Transmission e�ciency
Single drive axle (6x2)
Automated manual (downspeeding)
Stop-start
Dual clutch (adv. downspeeding)
Hybrid
Tractor LRR tires
Tractor aerodynamics
Automatic tire inflation
Trailer LRR tires
Weight reduction
Driver feedback/optimization
Idle reduction technology
Trailer aerodynamics
Eng
ine
Tra
nsm
issi
on
Tra
cto
r-tr
aile
r
Fuel consumption reduction in representativereal-world line-haul highway operation
High pre-2018 deployment Post-2018 potential
Figure 3. Stakeholder workshop findings regarding technologies’ percent fuel consumption benefits
in representative line-haul Class 8 trucks.
The stakeholder workshop reveals that, going beyond the Phase 1 US regulatory require-ments, fuel consumption reduction by as much as 15% from advanced engine technol-ogy, 8% from integrated engine-transmission approaches with downspeeding, and 10-15% from trailer technologies appeared to be feasible in the 2020-2030 timeframe. One industry presenter remarked, “Our vehicle work and the engine work have given us a good foundation as we look to future efficiency improvements. When we think of future technologies, SuperTruck is our baseline.” One of the key workshop summary conclusions related to the importance of analyzing the technologies’ combined impact, as technology packages over relevant duty cycles, to better understand their interac-tions and synergies.
OVERVIEWThe primary objective of this report is to inform on the emerging technologies that are expected to be available to increase tractor-trailer efficiency in the new 2020-2030 fleet. The scope of the work is to analyze diesel engine, transmission, aerodynamic, tire, and rolling resistance technologies that impact fuel consumption in line-haul heavy-duty Class 8 tractor-trailer applications and can potentially be promoted within US regulatory standards. Therefore, technologies introduced above are the primary focus, whereas technologies and fleet practices that relate to tractor-trailer driver behavior, operations, and logistics improvements are excluded. This study does not include analysis of the associated costs of the efficiency technologies.

9
ICCT WHITE PAPER
This report is organized as follows. Following this introductory section, Section II describes the tractor-trailer simulation methodology, the data inputs, and the calibra-tion steps in the development of the tractor-trailer model. Section III builds from the development of the vehicle model to analyze the available and emerging technologies, including individually and as integrated to technology packages within tractor-trailers, and summarizes the results. Finally Section IV concludes with a summary of the findings, their potential implications, and policy recommendations.

10
ADVANCED TRACTOR-TRAILER EFFICIENCY TECHNOLOGY POTENTIAL IN THE 2020-2030 TIMEFRAME
II. VEHICLE SIMULATION MODELING DEVELOPMENT
This project entails the use of new engine dynamometer test data and tractor-trailer technology inputs to assess emerging efficiency improvements in a full vehicle simula-tion model. Vehicle simulation has become a dominant tool to design, engineer, analyze technology permutations, and now regulate heavy-duty vehicles. Vehicle simulation models like Powertrain Systems Analysis Toolkit (PSAT) and Autonomie (ANL, 2014) have been developed and used by university and industry research groups to assess diverse vehicle types on various drive cycles, as well as to estimate the effects of vehicle modifications on efficiency and emissions. These types of physics-based full-vehicle simulation modeling are widely recognized for their high value in assessing future technologies and their ability to incorporate complex technology interactions (see, e.g., NRC, 2010). Governments directly utilize heavy-duty vehicle simulation models in the development of regulations, and also as direct compliance tools within the regulations. Examples of government heavy-duty vehicle models are the US-based Greenhouse gas emission Model (GEM) and Europe’s Vehicle Energy Consumption calculation Tool (VECTO) (US EPA, 2011; Fontaras, 2013; JRC, 2014).
This section describes the methodology, the data inputs, and the calibration steps in the development of a novel tractor-trailer simulation model. The section is separated into three parts: (1) engine data, maps, and modeling; (2) full-vehicle simulation modeling of tractor-trailer efficiency technologies with Autonomie; and (3) tractor-trailer fuel consumption with the ICCT’s Advanced Truck Technology Efficiency Simulation Tool (ATTEST), a lumped parameter tool.
ENGINE DATA AND MODELINGA fundamental energy input to a tractor-trailer simulation model is the engine fuel consumption data. The primary way that such engine data is summarized is in the form of “engine maps” that, generally, include tens (up to hundreds) of unique data points for engine fuel consumption rates (amount of fuel mass per unit time) across various op-erating points (i.e., varying engine torque and speed). Such fuel consumption rates are usually measured at steady-state conditions, so the maps may not accurately represent transient efficiency. The critical importance of these engine maps to understand and quantify the performance of various companies’ diesel engine technologies generally makes them proprietary and difficult to obtain.
Few detailed data are publicly available to characterize modern diesel engine maps for line-haul tractor-trailer applications. The Autonomie vehicle simulation model (ANL, 2014) has several illustrative diesel engine maps for its heavy-duty vehicle models that are based on pre-2010 model year (i.e. without selective catalytic reduction (SCR) systems) Caterpillar and Detroit Diesel engine data. The US EPA created the Greenhouse gas Emission Model (GEM) as a regulatory tool, and the model includes a generic default engine map, based on data from several engines, that represents a 15-liter, 455 horsepower (hp) vehicle engine that complies with US model year 2010 engine emission standards (US EPA, 2012). In addition, there are proprietary engine models and engine maps that engineering consulting firms utilize in their research.
Engine fuel consumption maps In order to better characterize a modern diesel engine map and its energy losses, the ICCT partnered with West Virginia University (WVU). This ICCT assessment utilizes the associated diesel engine data collection and engine mapping analysis that is reported

11
ICCT WHITE PAPER
in the recent WVU report, Heavy-Duty Vehicle Diesel Engine Efficiency Evaluation and Energy Audit, by Thiruvengadam et al. (2014).
That WVU work includes novel laboratory testing, data collection, and engine mapping of a model year 2011, 12.8-liter Mack MP-8 engine, rated at 505 horsepower. The 12.8-liter engine was the most applicable available engine and is broadly representative of new heavy-duty vehicle engines. The engine is in compliance with modern US 2010 criteria pollutant emission standards and therefore is consistent with the reference engine utilized for US EPA and NHTSA regulatory development for the model year 2014-2018 efficiency standards. In addition, the engine is a popular and representative Class 8 engine, based on Polk calendar year 2012 data (R.L. Polk & Co., 2012). The 12.8-liter engine is nearly equivalent to the median engine size of 13.0 liters for all engines in new US Class 8 vehicle registrations in calendar year 2012. The Mack MP-8 and the closely related Volvo D13 engine are the fifth and seventh most popular engines in all of Class 8 trucks. In addition the Volvo D13 is the dominant engine in the Volvo VNL, which is the Class 8 tractor with the second highest 2012 registrations. The MP-8 is the dominant engine in Mack’s highest-selling Class 8, the CXU600.
The engine mapping testing procedure was performed on a 1065 CFR federal regulation-compliant engine dynamometer. In order to establish a reference engine with modern engine controls, exhaust gas recirculation, and aftertreatment systems, this research utilizes an engine that complies with model year 2010 US emission regulations. The after-treatment systems were installed and fully operational during testing. Figure 4 depicts the relative fuel consumption rate (fuel mass per unit time) at given engine torque and speed operating points of the 12.8-liter diesel engine. This figure shows the 53 data points from the laboratory testing under the darker maximum engine torque curve. The map illustrates the shape of the fuel consumption map through the various engine torque-speed points through a relative scale in which 100% (red) and 0% (green) represent maximum and minimum fuel consumption rate in grams per second units, respectively.
Figure 4. Illustration of the relative fuel consumption rate for reference 2010 engine (Thiruvengadam et al, 2014)

12
ADVANCED TRACTOR-TRAILER EFFICIENCY TECHNOLOGY POTENTIAL IN THE 2020-2030 TIMEFRAME
Engine energy auditAlong with the reference 2010 engine fuel map, this study also utilizes the WVU Thiru-vengadam et al. (2014) analysis of the underlying energy flows and loss mechanisms across its full range of operation. The WVU work includes the collection of in-cylinder pressure data to estimate indicated power, motoring tests to measure engine friction, flow and temperature measurements of relevant streams including intake air, coolant, exhaust, fuel, turbocharging system, charge air cooler (CAC) and exhaust gas recircula-tion (EGR) cooler. Analysis of these engine data was utilized to provide a detailed breakdown of the energy loss mechanisms of the engine over various torque and speed operating points.
Based upon WVU’s analysis of the various energy flows and losses through the engine, an “energy audit” was developed across the full engine map. Figure 5 shows the energy audit results in units of power (kW). Graphically these illustrate how the various energy loss mechanisms vary with respect to engine speed and torque output. As shown, brake work, exhaust enthalpy, cooling system, and pumping losses increase non-linearly with engine speed and torque. Engine friction and parasitic losses are found to increase with speed (but less so with torque). Ambient heat transfer is the only variable not analyzed directly, as it is based on the remaining loss mechanisms and the fuel energy input. Fuel energy input represents the steady-state fuel consumed at the various engine operating points, based on a lower heating value of 42.8 megajoule per kilogram diesel (MJ/kg) and a fuel density of 0.849 kilogram per liter (kg/L).
As shown in Figure 5, the tested engine brake thermal efficiency (i.e., the bottom right panel), defined as brake power divided by fuel energy input, varies from approximately 10-25% at low engine speeds and low torque, and up to 40% efficiency in its optimal operating region of engine speeds above 1000 rpm and torques above 1200 Nm.

13
ICCT WHITE PAPER
0500
10001500
2000
5001000
15002000
25000
200
400
600
Torque (N.m)
Brake Work
Speed (RPM)
Pow
er (k
W)
0500
10001500
2000
5001000
15002000
25000
100
200
300
400
500
Torque (N.m)
Exhaust Enthalpy
Speed (RPM)
Pow
er (k
W)
0500
10001500
2000
5001000
15002000
25000
100
200
300
Torque (N.m)
Cooling System
Speed (RPM)
Pow
er (k
W)
0500
10001500
2000
5001000
15002000
2500-20
0
20
40
60
80
Torque (N.m)
Ambient Heat Transfer
Speed (RPM)Po
wer
(kW
)
0500
10001500
2000
5001000
15002000
25000
5
10
15
20
25
Torque (N.m)
Pumping Losses
Speed (RPM)
Pow
er (k
W)
0500
10001500
2000
5001000
15002000
25000
20
40
60
80
Torque (N.m)
Friction and Parasitics
Speed (RPM)
Pow
er (k
W)
0500
10001500
2000
5001000
15002000
25000
500
1000
1500
Torque (N.m)
Fuel Input
Speed (RPM)
Pow
er (k
W)
0500
10001500
2000
5001000
15002000
25000
10
20
30
40
50
Torque (N.m)
Brake Thermal Efficiency
Speed (RPM)
BTE
(%)
Figure 5. Engine energy flows, fuel input, and brake-specific fuel efficiency
In addition to collecting detailed data on the reference diesel engine, the WVU study assesses the potential for future engine technologies to reduce the energy losses within the various energy loss mechanisms. Figure 6 illustrates the results from the WVU reference 2010 engine and three other estimated advanced technology engines. Examining the energy audit over the regulatory Supplemental Emissions Test (SET) cycle, the reference heavy-duty diesel engine converts 39% of its fuel energy to brake power, and it loses 36% as exhaust enthalpy, 17% through the cooling system (i.e.,

14
ADVANCED TRACTOR-TRAILER EFFICIENCY TECHNOLOGY POTENTIAL IN THE 2020-2030 TIMEFRAME
coolant and intercooler), 3% as heat to the surrounding ambient air, 3% to friction of engine components and parasitic loads, and 2% to engine pumping. WVU identified several engine technologies and estimated their potential effects in the different engine loss mechanisms. The “2017 engine” deploys several technologies to meet the heavy-duty vehicle GHG engine standards and the “2020+ engine” utilizes more advanced engine technologies. For further fuel consumption reduction, the effects of a waste heat recovery (WHR) system were evaluated in the “2020+ with WHR” engine map. The WVU engine estimations utilize a thermodynamic approach to project fuel consumption of future engine technologies by reducing individual loss categories by magnitudes identified by given technology pathways from the research literature. The emerging technologies to achieve the increased efficiency include improvements to combustion from increased compression ratio and peak in-cylinder pressures; reduction in pumping losses through low-pressure drop aftertreatment systems, low pressure drop EGR loops; reduced EGR; and improved turbocharging technology. The reduction in frictional parasitic losses is from advanced lubricants, engine material coatings that lower friction, and variable speed water and oil pumps. Finally, the “2020+ engine with WHR” includes a simulation of an Organic Rankine Cycle (ORC) WHR system. The aforementioned technologies were implemented by customizing the reference 2010 map by scaling down the energy audit loss mechanisms using factors from the available literature regarding their efficiency gains within each energy loss mechanism. The process of scaling a base engine map to reflect improvements from particular technologies differs from the actual engine calibration process in which the fueling optimization is performed locally, rather than uniformly across the engines speed and load domain. More sophisticated tools such as GT-Power can generate higher fidelity maps and are being used by others (See, e.g., Reinhart, 2014). In this work, the modeling and analysis here was designed to most closely match how engine map data might be integrated into a potential regulatory engine testing-and-simulation protocol (See further discussion from Sharpe et al, 2014b).

15
ICCT WHITE PAPER
0
50
100
150
200
Mack MP8reference
2017 2020+ 2020+ withWHR
Ene
rgy
dis
trib
utio
n (k
W-h
r)
Heat Transfer to Ambient
Intercooler Energy Out
Friction and Pumping
Coolant Energy
Exhaust Enthalpy
Brake work
Figure 6. Energy distribution of reference and efficient engines over the SET cycle
The advanced engine efficiency packages indicate significant reductions in energy use over the SET cycle, as shown in Figure 6. The estimated 2017 engine technology achieves a 7.9% fuel consumption reduction, the more advanced 2020+ engine achieves 18.3%, and the 2020+ with WHR achieves 21.5% fuel consumption reduction in compari-son to the reference heavy-duty engine. The measured peak BTE of the 2010 engine was 40%, while that of 2017 engine technology was projected to be about 44%, and that of the 2020+ without waste heat recovery was projected to be about 49%. The waste heat recovery simulation improved the BTE of the 2020+ technology to about 52%. These average engine characteristics are noted here; the associated detailed engine fuel consumption maps and energy audits across engine speed and torque for each engine are utilized in the vehicle simulation modeling as described below.
AUTONOMIE-BASED TRACTOR-TRAILER MODELINGThis research utilizes the Autonomie vehicle simulation platform to incorporate the abovementioned reference engine data, to upgrade the model for modern heavy-duty tractor-trailer characteristics, and to augment it to simulate additional efficiency tech-nologies over various duty cycles. Many similar vehicle simulation models (e.g., PSAT, CRUISE, ADVISOR, GT-Drive) have been developed. This work utilizes Autonomie (ANL, 2014), which was developed by Argonne National Laboratory, because it is state-of-the-art as a vehicle modeling tool, has the necessary structure and features to rigorously simulate emerging tractor-trailer efficiency technologies, is widely used by industry and researchers, is commercially available, and is readily modifiable for researchers.

16
ADVANCED TRACTOR-TRAILER EFFICIENCY TECHNOLOGY POTENTIAL IN THE 2020-2030 TIMEFRAME
Researchers have similarly demonstrated the suitability of Autonomie for modeling heavy-duty vehicles (see Rousseau et al 2010; Delorme et al, 2010). In addition, the Autonomie platform was chosen because it can be modified to closely align with the technologies, options, and features of regulatory heavy-duty vehicle simulation models like the US-based GEM (US EPA, 2011).
The overall Autonomie architecture involves a simulated driver model (which attempts to follow a prescribed vehicle speed-time trace), the environment (that includes the interface of the vehicle with atmospheric conditions), and a Vehicle Propulsion Control-ler. The Vehicle Propulsion Controller handles the high-level control over the vehicle’s shifting, propulsion and braking based on the speed and power demands imposed by the test cycle. The vehicle architecture includes the powertrain systems and their low-level controllers. Figure 7 shows the vehicle propulsion architecture for the Class 8 tractor-trailer selected for this study. As shown, the architecture includes modules for the starter, the engine, mechanical accessories, electrical accessories, clutch, transmis-sion, transfer case, and drive axles. The connections between components that are shown depict the energy transfer interactions between the simulated components. For further general details on the specific characteristics of the Autonomie model, please refer to ANL (2014).
Figure 7. Vehicle propulsion architecture for Class 8 tractor-trailer in Autonomie
The Autonomie-based modeling effort for this project consists of augmenting the data for many of the fundamental technology parameters that define tractor-trailers. No structural changes to the architecture of the model or the driver parameters were made. The “look-ahead” driver incorporates the future speed demand to determine the current power demand to more closely follow the speed-time trace. The engine, transmis-sion, driveline, aerodynamic load, tire rolling resistance, and vehicle mass areas were supplemented and modified in order to model the baseline tractor-trailer. The following sections describe these changes to define an updated reference tractor-trailer and ad-ditional efficiency technologies that are modeled, compare the reference tractor-trailer to other sources, and summarize baseline 2010 and 2017 tractor-trailer characteristics.

17
ICCT WHITE PAPER
Engine technologyThe first step in augmenting the Autonomie simulation model, to accommodate current and future tractor-trailer technologies for this project as introduced above, involves the introduction of a new reference engine. The default Autonomie model has several illustrative diesel engine maps for its heavy-duty vehicle models that are based on pre-2010 model year from various engine manufacturers. Because of the fundamental engine and aftertreatment modifications required to meet model year 2010 and later US EPA emissions regulations, utilizing an updated EPA 2010-compliant engine for an engine map and its underlying energy loss mechanisms was deemed critical.
From the WVU (i.e., Thiruvengadam et al., 2014) data collection on the model year 2011, 12.8-liter Mack MP-8 engine, an engine map was developed, processed, and introduced as a new engine option in Autonomie. Autonomie modeling tools were utilized to make the engine scalable in several dimensions. Recognizing the range in baseline BTE of heavy-duty diesel engines (i.e., generally from 41-44% for 2012-2014 engines, per US EPA [2014a] and Figure 1 above), the overall engine map fuel consumption was developed to be adaptable by the user. A scaling factor that shifts the engine’s fuel consumption several percent in either direction is seen as a valuable flexibility to tailor the baseline engine and any follow-on technology assessment (e.g., engine model-, model year-, company-, country-specific variations). In addition, the overall engine sizing can flexibly be modified for larger or smaller overall torque requirements allowing the analysis of engine downsizing effects.
For this assessment of the efficiency potential for US tractor-trailers, we define the reference 2010 engine to have a 42.8% peak BTE for several reasons. Our general interest is in having the most relevant, post-2010 (i.e., with modern NOx and particulate controls) and pre-2014 GHG regulation baseline for new engine certification. This scaling indexes our reference engine to multiple sources. First, the scaling matches the 2012-2014 certification baseline data mentioned above (US EPA, 2014a). Second, in regulatory documents in the initial GHG rulemaking, peak and cruise BTE values are approximately 42-44% (US EPA, 2011b). US DOE‘s 21st Century Truck and SuperTruck programs utilize 42% as a baseline (NRC, 2012; Delgado and Lutsey, 2014). Stanton (2013) indicates that a Cummins 15-liter engine operated at about 44% BTE at cruise. Based on all these engine data, the fuel consumption map from the WVU engine data is scaled, such that the peak BTE increases from 40.2% to 42.8%. The WVU laboratory data collection was performed on an engine with over 200,000 miles; the effects of age (e.g., engine, aftertreatment, heat exchanger), the exact fuel specifications, and other factors on the WVU results as compared to new certification engine data, are unknown. There is also further discussion of the baseline engine and tractor-trailer in the “Summary calibration of baseline engine and tractor-trailer” section (and in Table 1) below.
In addition to introducing a new reference engine, many options for enhanced efficiency features are introduced into this study’s enhancements of the Autonomie model. The technologies are defined to match the most common understanding and common version of the technologies as described in other analyses and stakeholder discussions (e.g., US EPA and NHTSA, 2011b; NRC, 2010; Lutsey et al., 2014). Descriptions of the engine efficiency technologies, their energy loss mechanisms, and how they are handled in ICCT’s Autonomie modeling, are provided below.
Engine friction reduction. Engine efficiency is affected by friction losses and lubricant oil churning in bearings, valve-trains, and piston-to-cylinder interfaces. As illustrated in

18
ADVANCED TRACTOR-TRAILER EFFICIENCY TECHNOLOGY POTENTIAL IN THE 2020-2030 TIMEFRAME
Figure 5, friction losses increase with engine speed and, to a lesser degree, with cylinder pressure (i.e. torque). Lubricant oil viscosity is a key factor since it should guarantee proper lubrication and engine protection (durability) without sacrificing fuel economy. Friction reduction provides direct brake work gains. Since friction losses leave the engine in the form of heat, friction reduction also reduces the amount of heat dissipated through the cooling system. Available and emerging efficiency technologies to reduce these losses include piston ring designs, low viscosity lubricants, and low friction coat-ings and surface finish. Based on the stakeholder workshop input and research literature, this technology can reduce fuel consumption by 0.5% to 2% in line-haul applications. This technology is incorporated into Autonomie with customized engine maps, where engine friction energy loss is reduced by factor of 15% and 25% (based on Thiruveng-adam et al., 2014).
On-demand engine accessories. Engine and vehicle accessories including the water pump, oil pump, fuel injection pump, air compressor, power steering, cooling fan, alternator, and air conditioning compressor are traditionally gear- or belt-driven by the engine. These “parasitic” losses, or auxiliary loads tend to increase with engine speed. Decoupling the accessories from the engine when their operation is not needed, and operating them at optimal speeds (i.e. exactly matching engine operational require-ments) can reduce these loads. Moreover, vehicle inertia (e.g., when going downhill) can be used to operate these devices and save fuel. Potential technologies include clutches to engage/disengage the accessories, variable speed electric motors, and variable flow pumps. Based on the stakeholder workshop input and research literature, this technol-ogy can reduce fuel consumption by 0.5% to 4% in line-haul applications. To incorporate this technology, customized engine maps are used, where the engine accessory loads are reduced by a constant factor of up to 10% (based on Thiruvengadam et al., 2014). Only oil and water pumps were part of the engine dynamometer setup, so the engine map only includes these two accessories. The unloaded air compressor was also part of the test and its losses were included in the engine friction loss mechanism. Other vehicle accessories can be separately incorporated in Autonomie as either electric or mechanical accessories. Inclusion of accessory loads in regulatory tests or simulations is necessary in order to appropriately recognize and promote fuel savings through accessory load reduction. For reference, Kies et al. (2013) analyzed options for integrat-ing fuel-saving technologies, including auxiliary systems such as engine cooling fan, air compressor, alternator, and steering pump, into the European Union CO2 reporting simulation tool VECTO. As discussed further below, the operation of accessory loads in regulatory tests, simulations, and the real world can differ and are an important aspect of evaluating the potential for fuel savings through accessory load reduction.
Combustion system optimization. Optimization of diesel fuel combustion, with improved injection and high-pressure systems, is in active development. Most of the losses within an engine correspond to the combustion process and are reflected in high exhaust enthalpy and heat transfer to the cooling system. Combustion optimization improves the work extraction from the combustion process and thus reduces the exhaust and heat transfer losses. Potential technologies include optimized fuel injection (e.g., with higher pressures, injection rate shaping, better atomization and distribution within the cylinder), increased compression ratios, optimized combustion chambers, insulation of ports and manifolds, increased coolant operational temperature, and improved thermal management. Based on the stakeholder workshop input and research literature, this technology can reduce fuel consumption by 2% to 4% in line-haul applications. An ORNL

19
ICCT WHITE PAPER
study on light-duty diesel engine efficiency (Edwards and Wagner, 2012) indicated stretch reduction goals of 30% and 20% for heat loss to coolant and exhaust loss respectively. Modeling is based on the WVU results, which indicated 15-40% exhaust loss reduction and 15-25% coolant system energy loss reduction for the 2017 and 2020+ engines (Thiruvengadam et al, 2014). These reductions not only represent combustion system improvements, but also advanced engine controls, aftertreatment improvements, and turbocharging system improvements. There are interactions among these engine technologies. Isolating the individual contributions of each technology to reductions in each loss mechanism is not deemed feasible without a detailed transient engine simulation model (e.g. GT-Power) and is outside the scope of this study. As a result, this and other engine-related technologies are not separately simulated in Autonomie but as part of an engine technology package, as described further below. However, these technologies are also incorporated separately in the lumped parameter tool based on stakeholder input and engineering estimates.
Advanced engine control. Improved engine controls are linked to various efficiency-related engine systems namely injection, air intake, EGR, auxiliaries, thermal manage-ment, and aftertreatment systems. As a clear indication of increasingly advanced engine controls, the number of independent calibration parameters is expected to increase from about 6 today to about 25 by 2030 (Atkinson, 2013). Model-based control for engine calibration with closed-loop controls allows real-time optimization of more engine (and potentially transmission and vehicle auxiliaries) parameters. Improvements in this technology area affect the losses in the other energy loss categories (e.g., exhaust, coolant, and pumping). This category is integrally linked to, and likely a prerequisite component of, many other technologies describe above and below. As a result, this technology is not separately modeled or evaluated in this analysis. Based on the stakeholder workshop input and research literature, this technology can reduce fuel consumption by 1% to 4% in line-haul applications.
Aftertreatment improvement. Several aftertreatment-related systems are directly con-nected to the energy loss characteristics of the engine. In a typical engine configuration with a variable geometry turbocharger (VGT), the pumping losses in the engine are increased when higher EGR rates are used for NOx control since higher exhaust backpres-sure is needed to drive the exhaust gases back to the cylinder intake. The diesel particulate filter also creates additional backpressure that increases with particulate soot loading. Improvements in aftertreatment technologies are interrelated with advanced controls and combustion optimization and could reduce pumping, exhaust, and coolant losses. For example, enhanced NOx aftertreatment systems allow for higher engine-out NOx levels, enabling efficiency increase through calibration of fuel timing and combustion parameters as well as through reduced EGR levels. Moreover, the reduced EGR levels have further advantages such as lower pumping losses, lower heat rejection, and lower particulate matter (PM) production. Based on the stakeholder workshop input and research literature, this technology can reduce fuel consumption by 2% to 4% in line-haul applications.
Turbocharger system improvement. Turbocharging technology utilizes exhaust energy to increase intake pressure and volumetric efficiency. Efficient turbocharging provides increased power density to the engine and efficient air and EGR delivery to the intake manifolds. New turbocharger system designs represent a step forward from the widely used VGT. The asymmetric turbocharger system is based on an asymmetric twin-scroll turbine in which one of the two turbine scrolls is sized to create an increased exhaust-gas flow backpressure effect to drive EGR from 3 cylinders, while the exhaust from the remain-

20
ADVANCED TRACTOR-TRAILER EFFICIENCY TECHNOLOGY POTENTIAL IN THE 2020-2030 TIMEFRAME
ing 3 cylinders is not recirculated and is dedicated to turbocharging purposes in a second, larger, turbine scroll, without being affected by the EGR (Chebli et al., 2013). Turbocharging systems have the ability to reduce pumping, exhaust, and coolant losses due to the increased combustion efficiency from the higher boost and improved operational range. Advanced turbocharging technologies are not simulated directly in Autonomie and their implementation is discussed in the engine packages chapter below. Based on the stake-holder workshop input and research literature, this technology can reduce fuel consump-tion by 1% to 5% in line-haul applications.
Turbocompounding. Turbocompounding technologies can be mechanically or electrically actuated. In mechanical turbocompounding, exhaust flow is used to spin a turbine that connects through a mechanical transmission directly to the crankshaft. This technology results in higher torque, higher brake power output, and lower exhaust energy losses for a given fuel input. In electrical versions, exhaust flow is used to spin a turbine that is connected to an electrical generator. The electricity can be stored and then used to power electric accessories or to provide torque assist to the engine through an electric motor (in hybrid powertrains). Potential caveats include increased backpressure and lower exhaust temperatures, which may impact aftertreatment systems. These technologies are not simulated directly in Autonomie and their implementation is discussed in the engine packages chapter below. Based on the stakeholder workshop input and research literature, this technology can reduce fuel consumption by 0.5% to 5% in line-haul applications
Waste heat recovery. Rankine cycle waste heat recovery systems convert heat that is typically wasted through the exhaust and engine cooling systems to useable mechanical energy. The extra mechanical power output could be fed to the crankshaft through a gearbox or can be used to generate electric power. As a result, linking such a Rankine cycle to an existing power cycle reduces the load and overall fuel input to the engine for a given system work output. This technology is in development by numerous suppliers, and it tends to include 5-25 kW overall recycled power capacity. Thiruvengadam et al. (2014) performed simulations of a WHR system that extract heat from EGR and coolant circuits, using the reference 2010 engine energy audit to estimate the waste heat available at different engine operational points. The results were incorporated into a separate engine map that is used into the Autonomie model. Based on the stakeholder workshop input and research literature, this technology can reduce fuel consumption by 2% to 8% in line-haul applications. Potential caveats include the incorporation of additional heat rejection needs for the engine due to the addition of a WHR condenser, safety issues related to the work-ing fluid selected for the application and additional weight and packaging issues of the added components. WHR is better suited for applications with high mileage and with large payloads and sustained loads, and therefore high waste heat availability.
Engine downsizing. Vehicle improvements that reduce the road load power requirements may shift the operational locus of an engine to lower efficiency regions. The engine down-sizing approach (i.e., replacing base engine with an engine with lower displacement, peak torque, and peak power) can force the engine to operate at higher loads where usually the optimal, high-efficiency (i.e., lowest brake-specific fuel consumption) engine region is located. A different downsizing approach involves offering lower displacement engines that (with technologies listed above and below) meet the same torque and power require-ments as the base engine (increased power density). The first approach was incorporated into Autonomie via engine scaling, where the engine map is scaled based on engine power, assuming no changes in engine efficiency. Checks on whether the tractor-trailer still meets the same functionality as the baseline (e.g. grade capability at a set speed) were also

21
ICCT WHITE PAPER
performed. Based on the stakeholder workshop input and research literature, this technol-ogy can reduce fuel consumption by 1% to 4.5% in line-haul applications. Engine downsiz-ing is facilitated by power shifting dual clutch transmissions where no torque loss occur during shifting, thus reducing the torque backup needed for smooth operation. Downsized engines are expected to increase their exhaust temperatures faster, which helps improve aftertreatment performance. Lower displacement engines have lower peak efficiency due to a less favorable surface-to-volume ratio that increases heat losses. Another potential caveat is that drivability may be compromised if the torque capabilities of the engine are not sufficient for certain applications that include driving over steep grades. A Frost & Sullivan (2012) indicated that Class 8 truck engines in the US would shrink in size by 2-3% on average by 2018 as OEMs and fleets seek ways to improve fuel economy and payload capacity simultaneously for tractor-trailers; the power density of the engines is expected to improve by 6-8% to help enable the downsizing trend.
Engine technology packagesFive different engine fuel maps, representing a baseline and four different technology levels are used in this study. Thiruvengadam et al. (2014) identified several engine technologies and estimated their potential effects in the different engine loss mechanisms. The strong interrelations between some engine technologies (as discussed above), and the difficulty to isolate the specific contribution of each technology among the different loss mechanisms make an “engine package approach” more suitable to the purpose of this study. The “2017 engine” deploys several technologies to meet the heavy-duty vehicle GHG engine standards, the “2020+ engine” utilizes more advanced technologies that are applicable from 2020 on, the “2020+ with WHR engine” incorporates the effects of a waste heat recovery (WHR) system, and the “long-term engine” represents US Department of Energy (US DOE) long-term engine objective of 55% BTE (NRC, 2012). Assumed reduction in the energy loss mechanisms and the potential technologies to achieve those reductions are as follows.
For the “2017 engine,” aftertreatment improvements on the SCR system, including closed-loop urea injection controls and thermal management, are widely expected to enable combustion optimization through use of advanced injection timing and higher in-cylinder pressures (higher combustion efficiency at the expense of higher engine-out NOx that is taken care of by the enhanced SCR system). New turbocharging system architectures such as asymmetric and dual-stage turbochargers are also being deployed that and can reduce pumping losses, and reduced- or no-EGR systems grant simpler designs for pressure man-agement. On-demand accessories are also included for the 2017 engine. Thiruvengadam et al. (2014) estimated a 2017 compliant engine with 15% reductions in exhaust, coolant and friction losses, 30% reduction in pumping losses, and 10% reduction in accessory loads. The 2017 engine package, by design, complies with 2017 standards but only represents one particular viable technology pathway. Different engine manufacturers are going to follow different technology pathways to achieve compliance.
For the “2020+ engine,” optimizing the integration of the different engine systems by use of advanced model-based controls are expected to enable further reductions across different loss mechanisms. Using turbocompounding technologies is included to reduce exhaust and cooling losses. These systems are expected to increase the power density of engines, providing opportunities for downsizing. Incremental steps in aftertreatment systems such as integrated DPF/SCR systems with reduced thermal inertia and backpressures may also be expected. Thiruvengadam et al. (2014) esti-mated a 2020+ engine with incremental (i.e. from 2017) 25% reductions in exhaust, 10%

22
ADVANCED TRACTOR-TRAILER EFFICIENCY TECHNOLOGY POTENTIAL IN THE 2020-2030 TIMEFRAME
reduction in cooling system losses, 10% reduction in friction losses, and 10% reduction in pumping losses. The “2020+ with WHR” engine package represents a 2020+ pack-age with the addition of a WHR system as described above. For the “long-term en-gine,” various strategies that include dual fuel and low temperature combustion (LTC) are being investigated within the SuperTruck program (Delgado and Lutsey, 2014). Relatedly, Wall (2014) presented a conventional diesel combustion path to achieving 55% peak BTE that includes reduced parasitic losses along with optimized combustion bowl, injector, heat transfer, and WHR turbine improvements. In addition, there is the potential for low NOx emissions requirements over the long-term to accelerate simul-taneous emission-and-efficiency technology developments beyond conventional diesel options, including LTC, dual-fuel, and natural gas engine technologies.
Transmission technologyMoving beyond the engine, the transmission and driveline have the potential to reduce tractor-trailer energy use in several ways. Increased efficiency reduces the frictional losses through the transmission and driveline components that connect the engine torque to propulsion at the wheels. More advanced technologies involving improved controls and integrated transmission-engine strategies can optimize the entire powertrain by increasing engine operation frequency near the highest efficiency torque-speed points. In addition, some transmission and driveline technologies also have secondary effects on reducing mass.
Transmission efficiency. There is the potential to incrementally reduce friction in the transmission, driveline shaft, differentials, and axles. Transmission component efficiency such as in-gear efficiency, dry sump, lubricants and bearing losses can reduce mechani-cal losses and provide about 2% fuel consumption reduction (Stoltz and Dorobantu, 2014). Smart lubrication systems reduce lubrication pump parasitic losses as part of dry sump systems. Direct-drive transmissions offer lower gear mesh and oil churning losses than overdrive transmissions. The assumed baseline Autonomie tractor-trailer already incorporates direct drive. The rotational inertia of the transmission shafts, axles, and wheels are unchanged from the Autonomie defaults. To model the potential for increased efficiency through the gearbox, transfer case, and axles their efficiencies were scaled in Autonomie. Based on the stakeholder workshop input and research literature, this technology can reduce fuel consumption by 0.5% to 2% in line-haul applications.
Single drive axle (6x2). Increased deployment of single-drive axle “6x2” drivelines is driven by their ability to cost-effectively increase efficiency and reduce weight. The 6x2 configuration increases driveline efficiency by greatly reducing the gearing-related energy losses by using only one drive axle (the second axle in the tandem is a non-pow-ered dead axle). In addition, the system results in a weight reduction of approximately 400 lb and allows the use of non-traction tires on the dead axle. To incorporate the 6x2 option in Autonomie, the second drive axle efficiency is increased to 100%, rotational inertia is halved, and the transfer case energy losses are reduced by 50%. Based on the stakeholder workshop input and research literature, this technology can reduce fuel consumption by 1% to 2.5% in line-haul applications. A review of ten different data sets of in-use 6x2 systems (NACFE, 2013) finds that a 6x2 axle configuration can, on average, improve Class 8 sleeper tractor fuel economy by 2.5% versus a traditional 6x4 setup. Potential caveats include increased drive tires wear and inferior traction capabilities. Automatic weight-transfer systems may help overcome the last issue by increasing the load on the drive axle during low traction events.

23
ICCT WHITE PAPER
Automated manual transmission. Available automated manual transmissions (AMTs) are standard manual transmissions with additional sensors and actuators that allow the transmission control module to take over the shifting activities of the driver. Fuel savings come from enabling of engine downspeeding (resulting in lower friction and pumping losses), optimization of shifting strategy (keep engine operation closest to its optimal high-efficiency region), and reduction in driver variability. Although there are already competitive AMT products, there is the potential to improve the technology with optimized gearing (e.g., smaller gear ratios in higher gears), and greater optimiza-tion with deep integration of engine and transmission controls. AMT products in 2014 reduce cruise speeds from approximately 1450 rpm to about 1250 rpm (Stanton, 2013). Downspeeding reduces friction and pumping losses in the engine but requires an increase in torque that is approximately equivalent to the speed reduction in order for the engine to keep the same power output. Downspeeding also requires more frequent transmission shifting, which increases the amount of engine transient events (power excursions occur while shifting since the engine torque demand goes to zero when the clutch is disengaged and then to the required torque after the gear shift has been completed) and reduces engine operational efficiency. AMT technology is incorporated in Autonomie via downspeeding through modification to a lower final drive axle ratio (FDR) (i.e. 2.64 to 2.38). Optimized shifting strategy is not simulated in Autonomie, since the default “look-ahead driver” module was not changed. Based on the stakeholder workshop input and research literature, this technology can reduce fuel consumption by 2% to 3% in line-haul applications.
Dual-clutch transmission. Dual-clutch transmission (DCT) technology is now mature in light-duty applications and is currently seeing its first heavy-duty vehicle market intro-duction in Europe. A DCT houses two separate clutches, one for odd and one for even gears, thus enabling fast shifting without power interruption. Fuel savings result from reduced power excursions in the engine, enabling of engine optimization by narrowing the operating band and reducing transients (turbo efficiency is sustained, avoids low BTE area), and enabling of further downspeeding (i.e., greater than AMT).
DCT-enabled downspeeding is expected to involve engine speeds of around 900-1000 rpm for typical highway speeds. Some changes to the engine would also be involved in deploying the DCT technology for its full potential efficiency benefit. For example, for this study reference 2010 engine, maximum torque (about 2500 N-m) is reached around 1200 and 1500 rpm. An engine optimized for those levels of downspeeding will have its maximum torque between 800-1200 rpm if the same performance (e.g. grade capability at a set speed) is expected. By producing the same power for lower speeds, the engine needs to operate at higher torques and in-cylinder pressures, and turbochargers would need to be matched for lower compressor speeds and higher mass flow requirements, which can present surging issues. Some other caveats include an increase in heat transfer (more time for the combustion process to happen), offset of friction losses due to increased torques (in-cylinder pressures), and torsional vibration isolation (Stanton, 2013). DCT technology is modeled in Autonomie, relatively simplistically with increased downspeeding through a lower drive axle ratio (a 2.11 ratio was selected based on the 2010 reference engine map, further downspeeding did not return fuel consumption benefits). Autonomie does not have a heavy-duty DCT component model. As with AMT, modeling an optimized shifting strategy for DCTs is not simulated in Autonomie. Moreover, the engine technology packages selected for this study do not assume any changes on the lug curve (maximum torque-speed) characteristics of the engines. Based

24
ADVANCED TRACTOR-TRAILER EFFICIENCY TECHNOLOGY POTENTIAL IN THE 2020-2030 TIMEFRAME
on the stakeholder workshop input and research literature, this technology can reduce fuel consumption by 3% to 8% in line-haul applications.
Hybridization. Many strategies for the use of hybrid internal combustion and electric power systems for vehicles are entering the market for light-duty and medium-duty vehicle applications. Heavy-duty long-haul hybrid system development is ongoing among many manufacturers and suppliers. The technology could offer features that include regenerative braking, stop-start and coasting (i.e., shutting off engine in stopping, downhill conditions), and torque assist for propulsion (with potential for downsizing of the engine if grade specifications are not dominant). Braking energy losses can be recovered with an electric or hydraulic system and returned to the vehicle as electricity for accessories or as torque assist with electric or hydraulic motors. Hybrid systems for long-haul applications have not been developed for Autonomie. Based on the stakeholder workshop input and research literature, this technology can reduce fuel consumption by 3% to 10% in line-haul applications depending on terrain and start-stop characteristics. In addition, future integrated hybridization approaches with greatly reduced road load reduction could have cost and efficiency synergies.
Tractor-trailer technologyThere are also a number of vehicle aspects (i.e., beyond the powertrain) that play a major role in dictating the fuel efficiency of tractor-trailers. All the energy that is converted from the fuel energy, to engine brake work, through the driveline, is necessary to overcome the ultimate road load of the tractor-trailer. The core components of the road load are the aerodynamic drag, the tire rolling resistance, the inertial acceleration, and additional work to overcome grade. As a result, managing and minimizing these road loads becomes a critical part of reducing the overall energy consumption of tractor-trailers.
Aerodynamic improvements. Many new aerodynamic drag reduction technologies have been introduced in the long-haul tractor-trailer market. Aerodynamic drag is particularly significant in long-haul heavy-duty vehicles due to the large amount of time these vehicles are operated at sustained, high highway speeds of 55-70 miles per hour (mph). At these relatively steady high speeds, aerodynamic drag power dissipation, which is proportional to speed cubed, greatly exceeds the other road load factors (i.e., rolling resistance, inertial acceleration, grade). The design of tractors and trailers, and the interaction between the two, contribute to the relative aerodynamics of tractor-trailers. There are a number of technologies like improved tractor design, integrated tractor-trailer design, tractor-trailer gap reduction, trailer skirts, trailer tails, trailer underbody devices that offer great potential to reduce tractor-trailer load, thereby reducing fuel consumption for a given unit of work (Sharpe et al, 2014a). Aerodynamic drag is typically measured as the coefficient of drag, Cd, times the frontal area. For modeling purposes the frontal area is treated as a given (since tractors match with trailer van size restrictions), and therefore only analyze changes in Cd. Many aerodynamic improvement technologies are at various stages—from in-development, to emerging, to widely available among competitive technology develop-ers. This study simulates a range of tractor-trailer aerodynamic drag coefficients from a nominal 2010 baseline of 0.7 to the U.S. DOE SuperTruck teams’ targets of approximately 0.35 (Delgado and Lutsey, 2014). Based on the stakeholder workshop input and research literature, aerodynamic improvements to the tractor and trailer can reduce fuel consump-tion by 15% to 20% in line-haul applications.
Low rolling resistance tires. The rolling resistance of tires represents a significant con-tributor to overall road load power and fuel use. The dissipation of energy (from flexing

25
ICCT WHITE PAPER
of tire sidewalls and heat generation during each revolution) is proportional to both tractor-trailer weight and speed. There are many suppliers and developers of heavy-duty vehicle tires with increasingly low rolling resistance. There is the potential to reduce tires’ rolling resistance by approximately 30-35% from 2010 baseline (NRC, 2012). In the Autonomie modeling, the steer, drive, and trailer tires are weighted at 18%, 30%, and 52%, respectively, based on their approximate shares of axle loads. A weighted average rolling resistance coefficient (RRc) can be calculated according to the steer, drive, and trailer contributions. For example, using (US EPA and NHTSA, 2011a) RRc values of 7.8 kg/tonne for steer tires, 8.2kg/tonne for drive tires, and 6.0 kg/tonne for trailer tires, the weighted average would be 7 kg/tonne. This study considers a range of average rolling resistance from a nominal 2010 baseline of 7 kg/tonne to 4.5 kg/tonne. Based on the stakeholder workshop input and research literature, this technology can reduce fuel consumption by 5% to 10% in line-haul applications.
Weight reduction. A tractor-trailer’s weight has several effects on efficiency. The mass of a tractor-trailer (generally from 32,000 lb unloaded to about 50,000-80,000 lb loaded) is directly proportional to the energy required to accelerate, overcome rolling resistance, and overcome road grades. Operationally, utilizing lightweight materials and design to reduce curb mass can impact efficiency in different ways. For vehicles that are already at their maximum allowable weight (i.e., generally 80,000 lb), lightweighting allows for an increase in their payload to the maximum loaded weight, the same fuel economy (in miles per gallon), and reduced load-specific fuel consumption (gallon per ton-mile). For tractor-trailers that “cube out” and therefore are volume-constrained, weight reduction will lead to higher fuel economy and lower payload-specific fuel consumption (but the same payload). There are many examples of lightweighting technology. For example, as mentioned above, 6x2 driveline configurations can lead to approximately 400 lb in weight reduction. A presentation by a trailer manufacturer outlined over 2,000 lb in weight reduction options in the trailer (Lutsey et al, 2014). The SuperTruck teams have achieved net weight reductions of around 1,500 lb, and three out of four teams explored engine downsizing in their technology packages, acknowledging that there are significant synergies between powertrain component sizing and weight reduction. The reference tractor-trailer for this assessment has a total test weight of 70,500 lb, based on the regulatory assumption for a Class 8 high-roof sleeper cab (US EPA and NHTSA, 2011b). A research concept tractor-trailer by Walmart demonstrated the potential to reduce weight by approximately 4,000 lb (Walmart, 2014). In Autonomie, any level of lightweighting technology can be applied; the maximum mass reduction analyzed in this study corresponds to about 18% of tractor-trailer curb weight, a 2030 target weight reduction for heavy-duty trucks (US DOE, 2013). Based on the stakeholder workshop input and research literature, this technology can reduce fuel consumption by 2% to 5% in line-haul applications.
Summary calibration of baseline engine and tractor-trailer A reference baseline tractor-trailer was defined prior to analyzing advanced efficiency technology packages, which are presented in the following section. The baseline tractor-trailer is established to closely match common vehicle characteristics from other analyses and stakeholder discussions (e.g., US EPA and NHTSA, 2011b; NRC, 2008, 2010, 2012; Lutsey et al, 2014). The ICCT baseline technology is defined as being equipped with post-2010 US EPA emission control technology, but is pre-2014 US EPA and NHTSA efficiency regulation for tractor-trailers. In essence, the baseline can be considered a model year 2010-2013 tractor-trailer. Model year 2014 will be the first

26
ADVANCED TRACTOR-TRAILER EFFICIENCY TECHNOLOGY POTENTIAL IN THE 2020-2030 TIMEFRAME
possible average accounting of the sales-weighted average tractor-trailer efficiency, based on certification data for the GHG and fuel consumption regulations. As a result, there is no definitive sales-weighted average for new tractor-trailer attributes, GHG emissions, or average fuel consumption to more rigorously pinpoint an exact average baseline tractor-trailer for 2010-2013.
Table 1 shows a summary of major input parameters and key efficiency characteristics for the ICCT nominal 2010-2013 Class 8 tractor-trailer baseline, as compared to the comparable baseline regulatory parameters. Many sources have been considered, as described below and above, but the detailed specifications for the ICCT baseline vehicle attributes primarily utilize the US rulemaking assessment’s high-roof sleeper cab tractor-trailer baseline characteristics. The baseline parameters are chosen to represent, to the best extent possible, the baseline Class 8 high-roof sleeper cab truck in the heavy-duty vehicle greenhouse gas emission rulemaking development from US EPA and NHTSA (2011b). Although a specific tractor-trailer is chosen for a baseline, the modeling allows for nearly all the specifications to be modified for other tractor-trailer permutations.

27
ICCT WHITE PAPER
Table 1. Comparison of baseline tractor-trailers for this study and the US regulation
Component Parameter ICCT baseline U.S. EPA and NHTSAa
Chassis
Loaded weight (kg) 31,978 31,978
Curb weight (kg) 14,741 14,741
Payload (kg) 17,237 17,237
Aerodynamic drag coefficient (-) 0.70 0.70
Frontal area (m2) 10.4 10.4
Transmission
Type Manual Manual
Number of gears 10 10
Gear ratios [14.8, 10.95, 8.09, 5.97, 4.46, 3.32, 2.45, 1.81, 1.35, 1.00]
[14.8, 10.95, 8.09, 5.97, 4.46, 3.32, 2.45, 1.81, 1.35, 1.00]
Gear max. efficiency [0.96, 0.96, 0.96, 0.96, 0.98, 0.98, 0.98, 0.98, 0.98, 0.99 b]
[0.96, 0.96, 0.96, 0.96, 0.98, 0.98, 0.98, 0.98, 0.98, 0.98]
AccessoryElectrical power (kW) 0.35 0.35
Mechanical power (kW) 1 1
Final drive Final drive ratio (-) 2.64 2.64
Wheel Axle
Drive tire RRc (kg/tonne) 8.2 8.2
Steer tire RRc (kg/tonne) 7.8 7.8
Trailer tire RRc (kg/tonne) 6 6
Wheel radius (m) 0.489 0.489
Engine
Engine 2011 Mack 12.8-liter 505 hp Generic 15-liter 455 hp
Peak BTE (%) 42.8 44.8 c
65mph BTE (%) 41.4 41.8 c
SET (gCO2/bhp-hr) 492 490 c
Tractor-trailer fuel economy (mpg)
ARB transient 4.0 3.6 c
55 mph 6.8 7.3 c
65 mph 5.7 6.0 c
Weighted ARB-55-65 5.7 6.0 c
Tractor-trailer fuel consumption (gal/1000 ton-mi)
ARB transient 13.2 14.6 d
55 mph 7.7 7.2 d
65 mph 9.2 8.7 d
Weighted ARB-55-65 9.2 8.7 d
a Based on high-roof sleeper cab tractor-trailer US EPA and NHTSA, 2011bb Modified to reflect higher transmission efficiency at direct drive.c Based on 15L 455hp engine map in GEMv1.0d Based on GEM v1.0 simulation results
As shown in Table 1, many of the ICCT baseline parameters are set to match those of the regulatory reference tractor-trailer. For example, the curb weight, payload, aerodynamic drag coefficient, frontal area, tire rolling resistance coefficient, transmission gear ratios, final drive ratio, wheel radius, and electrical and mechanical accessories power demand of this study’s baseline and the regulatory baseline are identical. Autonomie default values for mass and rotational inertia of tires, axles, differentials, transmission, and engine models have been selected. The specific engine characteristics differ in small ways. In order to utilize the new engine map and its energy loss mechanisms, Autonomie
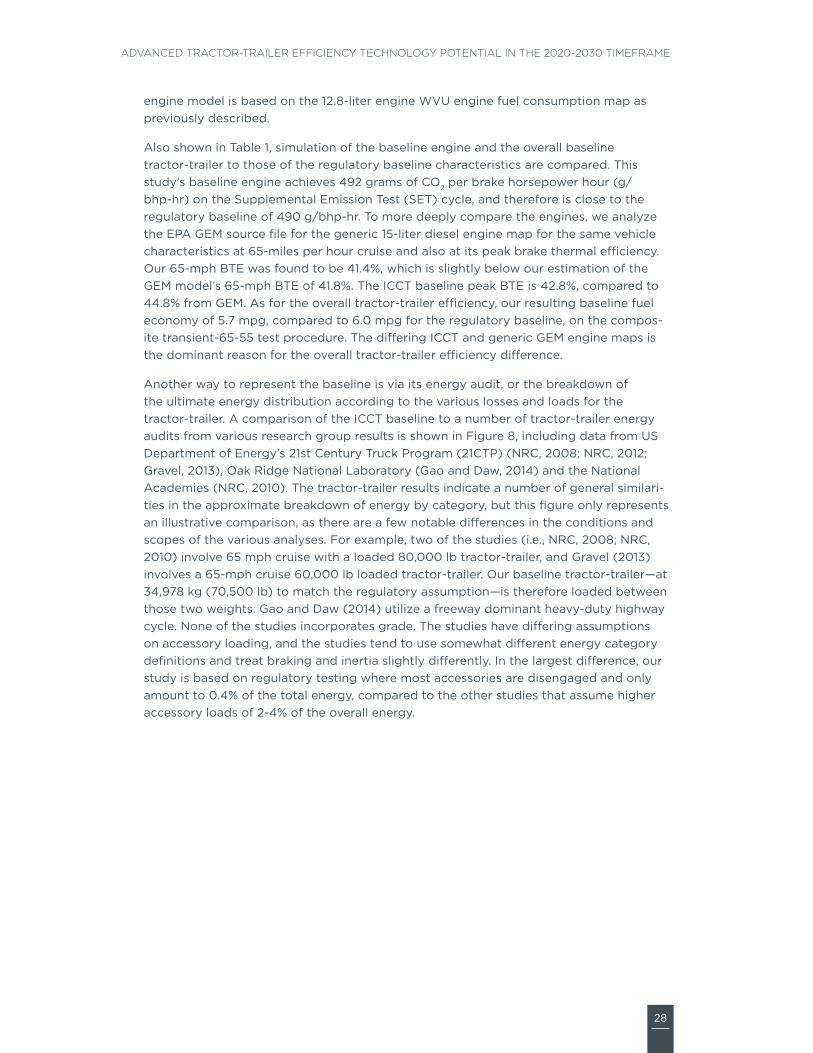
28
ADVANCED TRACTOR-TRAILER EFFICIENCY TECHNOLOGY POTENTIAL IN THE 2020-2030 TIMEFRAME
engine model is based on the 12.8-liter engine WVU engine fuel consumption map as previously described.
Also shown in Table 1, simulation of the baseline engine and the overall baseline tractor-trailer to those of the regulatory baseline characteristics are compared. This study’s baseline engine achieves 492 grams of CO2 per brake horsepower hour (g/bhp-hr) on the Supplemental Emission Test (SET) cycle, and therefore is close to the regulatory baseline of 490 g/bhp-hr. To more deeply compare the engines, we analyze the EPA GEM source file for the generic 15-liter diesel engine map for the same vehicle characteristics at 65-miles per hour cruise and also at its peak brake thermal efficiency. Our 65-mph BTE was found to be 41.4%, which is slightly below our estimation of the GEM model’s 65-mph BTE of 41.8%. The ICCT baseline peak BTE is 42.8%, compared to 44.8% from GEM. As for the overall tractor-trailer efficiency, our resulting baseline fuel economy of 5.7 mpg, compared to 6.0 mpg for the regulatory baseline, on the compos-ite transient-65-55 test procedure. The differing ICCT and generic GEM engine maps is the dominant reason for the overall tractor-trailer efficiency difference.
Another way to represent the baseline is via its energy audit, or the breakdown of the ultimate energy distribution according to the various losses and loads for the tractor-trailer. A comparison of the ICCT baseline to a number of tractor-trailer energy audits from various research group results is shown in Figure 8, including data from US Department of Energy’s 21st Century Truck Program (21CTP) (NRC, 2008; NRC, 2012; Gravel, 2013), Oak Ridge National Laboratory (Gao and Daw, 2014) and the National Academies (NRC, 2010). The tractor-trailer results indicate a number of general similari-ties in the approximate breakdown of energy by category, but this figure only represents an illustrative comparison, as there are a few notable differences in the conditions and scopes of the various analyses. For example, two of the studies (i.e., NRC, 2008; NRC, 2010) involve 65 mph cruise with a loaded 80,000 lb tractor-trailer, and Gravel (2013) involves a 65-mph cruise 60,000 lb loaded tractor-trailer. Our baseline tractor-trailer—at 34,978 kg (70,500 lb) to match the regulatory assumption—is therefore loaded between those two weights. Gao and Daw (2014) utilize a freeway dominant heavy-duty highway cycle. None of the studies incorporates grade. The studies have differing assumptions on accessory loading, and the studies tend to use somewhat different energy category definitions and treat braking and inertia slightly differently. In the largest difference, our study is based on regulatory testing where most accessories are disengaged and only amount to 0.4% of the total energy, compared to the other studies that assume higher accessory loads of 2-4% of the overall energy.

29
ICCT WHITE PAPER
60%
2.3%1.8%
12%
21%
3%0%
58%
3.9%2.4%
13%
22%
0%0%
56%
4.4%2.9%
13%
18%
5%1%
60%
3.8%2.3%
13%
21%
0%0%
60%
0.4%2.1%
14%
21%
2%0%
0%
20%
40%
60%
80%
100%
ORNL(Gao and
Daw, 2014)
21CTP(NRC, 2008)
21CTP(NRC, 2012)
NRC,2011
ICCTbaseline
Ene
rgy
dis
trib
utio
n
Other
Braking/Inertia
Aerodynamic Load
Rolling Resistance DrivetrainAccessories
Engine Losses
Figure 8. Energy losses and loads for tractor-trailer from various sources
Summary calibration of 2017 compliant engine and tractor-trailer Table 2 shows a summary of input parameters and key efficiency characteristics for this study’s 2017-compliant reference engine and tractor-trailer. The regulatory agencies projected a 2017 engine map that includes reductions in parasitic and friction losses, advanced combustion, higher efficiency air and EGR handling, aftertreatment system and turbocompounding (US EPA and NHTSA, 2011b). As mentioned above, the ICCT 2017 engine package does not include turbocompounding. Based on the background research and stakeholder research (see Lutsey et al, 2014) there are more immediate opportunities in aftertreatment, combustion, and turbocharging architecture. In terms of road load reduction technologies, the agencies assumed 16% reduction in aerodynamic drag coefficient and 10% reduction in average rolling resistance coefficient for their 2017 tractor. Also, 400 lb of lightweighting was assumed in the regulatory assessment and this analysis’ modeling of the 2017 tractor. We note that the Autonomie and GEM weightings for axle loads and therefore the weighting of the rolling resistance coef-ficients differed slightly. Autonomie axles loads are 18%, 30%, 52%, and GEM weightings are 20%, 40%, 40% for the steer, drive, and tire axles, respectively.

30
ADVANCED TRACTOR-TRAILER EFFICIENCY TECHNOLOGY POTENTIAL IN THE 2020-2030 TIMEFRAME
Table 2. Comparison of 2017 tractor-trailers for this study and the US regulation
Component Parameter ICCT U.S. EPA and NHTSAa
Chassis
Loaded weight (kg) 31,978 31,978
Curb weight (kg) 14,560 14,560
Payload (kg) 17,237 17,237
Aerodynamic drag coefficient (-) 0.59 0.59
Frontal area (m2) 10.4 10.4
Transmission
Type Manual Manual
Number of gears 10 10
Gear ratios [14.8, 10.95, 8.09, 5.97, 4.46, 3.32, 2.45, 1.81, 1.35, 1.00]
[14.8, 10.95, 8.09, 5.97, 4.46, 3.32, 2.45, 1.81, 1.35, 1.00]
Gear max. efficiency [0.96, 0.96, 0.96, 0.96, 0.98, 0.98, 0.98, 0.98, 0.98, 0.99 b]
[0.96, 0.96, 0.96, 0.96, 0.98, 0.98, 0.98, 0.98, 0.98, 0.98]
AccessoryElectrical power (kW) 0.35 0.35
Mechanical power (kW) 1 1
Final drive Final drive ratio (-) 2.64 2.64
Wheel Axle
Drive tire RRc (kg/tonne) 6.92 6.92
Steer tire RRc (kg/tonne) 6.54 6.54
Trailer tire RRc (kg/tonne) 6 6
Wheel radius (m) 0.489 0.489
Engine
Engine 2017 engine (WVU) 15-liter 455 hp 2017 (GEM)
Peak BTE (%) 45.8 48.2 c
65mph BTE (%) 43.9 45.3 c
SET (gCO2 /bhp-hr) 458 460 c
Tractor-trailer fuel economy (mpg)
ARB transient 4.7 3.7 c
55 mph 8.3 8.4 c
65 mph 6.9 7.1 c
Weighted ARB-55-65 6.9 7.1 c
Tractor-trailer fuel consumption (gal/1000 ton-mi)
ARB transient 11.2 14.2 d
55 mph 6.3 6.3 d
65 mph 7.6 7.4 d
Weighted ARB-55-65 7.6 7.4 d
a Based on 2017 standard for high-roof sleeper cab tractor-trailer US EPA and NHTSA, 2011bb Modified to reflect higher transmission efficiency at direct drive.c Based on 15L 455hp 2017 engine map in GEMv1.0d Based on GEM v1.0 simulation results

31
ICCT WHITE PAPER
ADVANCED TRUCK TECHNOLOGY EFFICIENCY SIMULATION TOOL (ATTEST)The above engine maps, energy audits, technology assessment, and Autonomie vehicle simulation modeling are all brought together in the development of the Advanced Truck Technology Efficiency Simulation Tool (ATTEST) model. Physics-based full vehicle mod-eling frameworks like Autonomie are ideal for simulating many technology packages and incorporating complex technology interactions in a rigorous and well-established approach. The authors sought to also develop an additional accompanying lumped parameter model that utilizes the Autonomie findings to analyze far more technology packages, more quickly, and more flexibly.
The rationale for simultaneously developing such a lumped parameter model is three-fold. First, the tool is an efficient way of using the full vehicle simulation to model far more permutations of technologies that fall within the technology packages modeled in Autonomie. As described further below, we model over 40 unique future vehicle technol-ogy packages. Second, this type of modeling is critical in analyzing a fleet of heavy-duty vehicle models that have many different characteristics (e.g., aerodynamic drag, engine efficiency, final drive ratio). Such varying fleet specifications can greatly multiply the time and resources requirements by orders of magnitude due, to all the hundreds of unique engine, transmission, and vehicle body combinations. An example of this fleet modeling application is the US EPA light-duty vehicle modeling approach, which utilized the Ricardo full-vehicle simulation modeling results, to develop US EPA’s Lumped Parameter Model, to thereby model the light-duty vehicle fleet’s potential adoption of efficiency packages to comply with GHG standards for 2012-2016 and 2017-2025 regulatory development analyses (e.g., see US EPA, 2012; Ricardo, 2011). Third, the ICCT expects to use this model-ing framework in other applications outside of this particular US tractor-trailer application (potentially for other segments, other countries, and other duty cycles) and the lumped parameter framework could be a highly useful format for such assessments.
The following sections explain the basic steps in the construction and layout of the ATTEST model, the incorporation of individual technologies, the capturing of multiple-technology synergies, and validation of the ATTEST against the full-systems simulation Autonomie model. Although some initial modeling results from technology packages are introduced within this section’s description of the model development, the efficiency technology package analysis results are shown in the following Section III.
Lumped parameter modeling developmentThe ATTEST lumped parameter model is developed as an Excel spreadsheet tool. Primarily, the ATTEST model incorporates (a) user-defined selection of technologies, (b) the Autonomie vehicle simulation results for the engine and tractor-trailer energy audits, and (c) the Autonomie efficiency technology impacts from the technologies within each energy loss category as inputs. The output of the model is the combined fuel consump-tion effect for user-defined technology package selections over a given duty cycle.
ATTEST is tailored to a particular vehicle and particular duty cycles. In this case, the AT-TEST model and this analysis are for Class 8 heavy-duty tractor-trailers on five duty cycles. Figure 9 summarizes the five duty cycles that are used in the development of, and analysis from, the ATTEST modeling. The five duty cycles that are used in this analysis are the three cycles used in the first phase of US efficiency regulations (i.e., constant 55-mph, constant 65-mph, and California Air Resources Board transient, a 65-mph cycle with variable speed

32
ADVANCED TRACTOR-TRAILER EFFICIENCY TECHNOLOGY POTENTIAL IN THE 2020-2030 TIMEFRAME
(HHDDT65), and a “real-world highway” cycle with grade, developed for this work. The heavy heavy-duty diesel truck (HHDDT) is a chassis dynamometer test that consists of four modes, namely idle, creep, transient, and cruise. A fifth mode, also known as the high speed cruise HHDDT65 cycle represents higher speed freeway operation at 65 mph and combines elements of each of these modes. The HHDDT65 cycle has a maximum speed of 67 mph, an average speed of 50 mph and a length of 26.4 miles and is utilized in the modeling below. Finally, the “real-world highway” cycle is utilized to realistically include grade fluctuations and their consequent speed fluctuations as an additional quantification of fuel consumption characteristics and a real-world viability check. It is based on about 120 miles of long-haul interstate travel from Wheeling, West Virginia to Columbus, Ohio. (Based on Kappanna et al., 2013). Figure 9 shows their respective speed-time (or speed-grade-time) traces.
EPA and NHTSA Phase I rule cycles
ARB high-speed cruise (HHDDT65)
Real world highway cycle
Figure 9. Tractor-trailer duty cycles modeled in ATTEST and Autonomie

33
ICCT WHITE PAPER
Figure 10 shows the baseline energy consumption as a percent of total fuel input energy, according to ATTEST’s ten energy loss categories for the five duty cycles. As shown, there are many approximate similarities between how and where the overall energy is consumed over the five cycles, but there are several small differences. Most notably among the differences, is the ARB transient cycle, which is has proportionally more braking, and less aerodynamic load, than the others. The ARB cycle energy consumption from braking is about 15%, compared with 2-3% for the other four cycles. Conversely the ARB transient cycle, due to its lesser time at highway speeds shows only 3% aerody-namic energy load, versus 18-22% for the other four cycles.
0%
10%
20%
30%
40%
50%
60%
70%
80%
90%
100%
65 mph 55 mph ARBtransient
HHDDT65 Real-world
Ene
rgy
cons
ump
tio
n (%
)
Braking
Tires
Aerodynamic
DrivelineAccessoriesFriction and ParasiticsPumping Heat Transfer
Cooling System
Exhaust
Figure 10. Percent energy audit of baseline tractor-trailer by ten energy loss categories
The following steps are made in the development of ATTEST for a particular baseline vehicle and cycle combination. In the first step, the fuel consumption and the full energy audit for the baseline case is obtained using Autonomie and stored in the ATTEST tool. The energy audit includes ten tractor-trailer energy loss mechanisms (See Figure 10 above for losses among the five cycles). Next, the Autonomie simula-tion results for individual technologies (i.e., baseline plus each individual technology) are loaded directly into the ATTEST model. This step entails inserting the precise changes in each loss mechanism from each technology. Some technologies may mainly affect only one loss mechanism, while others create synergies and interac-tions that affect more than one mechanism. In general, engine technologies only have an effect on engine loss mechanisms, road load reduction technologies cascade throughout the vehicle to reduce both vehicle and engine losses (i.e., for a given engine efficiency, lower load road also means lower engine losses), and transmission technologies have an effect on both road load and how the engine operates. The tool then estimates the fuel consumption benefit of any combination of technologies, or “technology packages,” via a multiplicative aggregation of the percent changes within each loss category.
Figure 11 shows the structure of the ATTEST model, for the particular case of the HHDDT65 duty cycle. As shown in the illustration, the baseline energy audit across the

34
ADVANCED TRACTOR-TRAILER EFFICIENCY TECHNOLOGY POTENTIAL IN THE 2020-2030 TIMEFRAME
ten energy loss categories is shown at the top of ATTEST, and the efficiency technolo-gies run down the left side of the tool. Various aspects of the tool are highlighted in different colors for illustrative purposes. The user defines the technology package with discrete technology choices on the right hand side, highlighted in green. The user can also define the level of application of some technologies by direct input of engine peak BTE, rear axle ratio, aerodynamic drag coefficient, weighted average rolling resistance coefficient, and mass reduction. The model also allows the user to apply full engine map adjustments instead of entering the particular technologies in two ways: entering a peak BTE to which to scale the entire 42.8% peak BTE baseline engine, or choosing one of the pre-defined 2017, 2020+, and 2020+ with WHR maps per Thiruvengadam et al (2014) and above discussion. All the inputs that come directly from Autonomie (namely the baseline energy audit, and the technology-specific efficiency improvements) are shown in light orange. The multiplicative aggregation of the energy reduction within each category, for the user-chosen technologies, is shown in darker orange. Finally, the overall tractor-trailer results for the chosen efficiency technology package in terms of the energy audit, fuel consumption, fuel economy, CO2 emissions, and the percent changes from the baseline, are highlighted in yellow. In the particular (illustrative) example that is shown in the figure, four technologies: engine peak BTE of 46%, single drive-axle (6x2), aerodynamic drag coefficient of 0.61, and a hybrid system that recovers 60% of the braking losses are selected by the user, and the net result is that the technology pack-age results in a 15.5% fuel consumption reduction from the baseline tractor-trailer.

35
ICCT WHITE PAPER
Advanced Truck Technology Efficiency Simulation Tool (ATTEST)
Energy Audit
Fuel Energy (100%)
TOTAL
Engine Losses Engine Brake Work
ExhaustCooling System
Heat Transfer Pumping
Friction and Parasitics Accessories Driveline Aero Tires Braking
Baseline Energy Audit (MJ) 209.1 109.2 15.3 10.3 48.1 2.7 13.3 140.9 93.1 13.6 655.6
Baseline Percent of Fuel Energy (%) 32% 17% 2% 2% 7% 0% 2% 21% 14% 2% 100.0%
Percent Change (%) -18.7% -18.8% -20.8% -18.4% -10.6% 0.0% -44.2% -12.8% 0.0% -58.9% -15.5%
NEW Energy Audit (MJ) 170.0 88.7 12.1 8.4 43.0 2.7 7.4 122.9 93.2 5.6 554.1
NEW Percent of Fuel Energy 31% 16% 2% 2% 8% 0% 1% 22% 17% 1% 100.0%
Results Baseline Change NEW
Fuel Consumption (L/100km) 42.3 -15.5% 35.8
Fuel Economy (mpg) 5.6 18.3% 6.6
Payload (kg) 17237 0.0% 17237
LSFC (gal/1,000 ton-mile) 9.5 -15.5% 8.0
CO2 (gCO2 /ton-mile) 96.4 -15.5% 81.4
Are
a
Technology
Implementation into estimator (% change per loss category)USER
PICKLIST (0/1)
USER INPUT PARAMETERSExhaust
Cooling System
Heat Transfer Pumping
Friction and Parasitics Accessories Driveline Aero Tires Braking
Eng
ine
Choose engine peak BTE (%) -11.6% -11.6% -11.6% -11.6% -11.6% 0.0% 0.0% 0.0% 0.0% 0.0% 1 0.46
2017 engine package - - - - - - - - - - 0
2020+ engine package - - - - - - - - - - 0
2020+ WHR package - - - - - - - - - - 0
Engine friction reduction (15%) - - - - - - - - - - 0
Engine friction reduction (25%) - - - - - - - - - - 0
Accessories electrification - - - - - - - - - - 0
Combustion optimization - - - - - - - - - - 0
Model-based controls - - - - - - - - - - 0
Aftertreatment improvement - - - - - - - - - - 0
Turbocharging efficiency - - - - - - - - - - 0
Mechanical turbocompounding - - - - - - - - - - 0
Waste heat recovery - - - - - - - - - - 0
Engine downsizing (10%) - - - - - - - - - - 0
Engine downsizing (15%) - - - - - - - - - - 0
Tran
smis
sio
n
Transmission efficiency - - - - - - - - - - 0
Single drive axle (6x2) -1.7% -1.8% -2.1% -1.7% -0.1% 0.0% -40.2% 0.1% 0.0% 0.3% 1
AMT - - - - - - - - - - 0
DCT - - - - - - - - - - 0
Downspeeding - - - - - - - - - - 0 2.11
Hybrid (60% efficiency) 0.0% 0.0% 0.0% 0.0% 0.0% 0.0% 0.0% 0.0% 0.0% -60.0% 1
Veh
icle
Aerodynamic drag reduction -6.3% -6.4% -8.5% -6.0% 1.2% 0.0% -6.6% -12.8% 0.0% 2.5% 1 0.61
Tires rolling resistance reduction - - - - - - - - - - 0 4.5
Weight reduction - - - - - - - - - - 0 2000
TOTA
L
Applied % change per category -18.7% -18.8% -20.8% -18.4% -10.6% 0.0% -44.2% -12.8% 0.0% -58.9%
Theoretical max change per category -100.0% -100.0% -100.0% -100.0% -100.0% -100.0% -100.0% -100.0% -100.0% -100.0%
Actual applied -18.7% -18.8% -20.8% -18.4% -10.6% 0.0% -44.2% -12.8% 0.0% -58.9%
User input Autonomie simulation Multiplicative aggregation of reduction ATTEST Output
Figure 11. Illustration of ATTEST model, highlighting structure, inputs, and outputs.
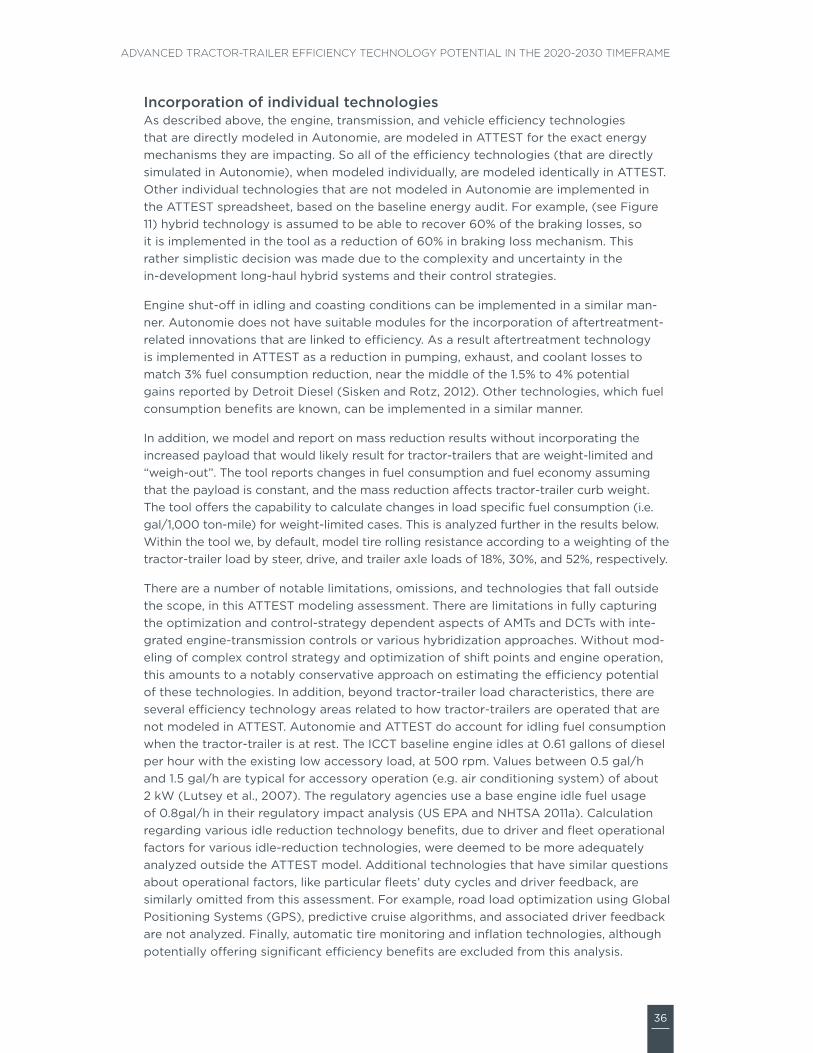
36
ADVANCED TRACTOR-TRAILER EFFICIENCY TECHNOLOGY POTENTIAL IN THE 2020-2030 TIMEFRAME
Incorporation of individual technologiesAs described above, the engine, transmission, and vehicle efficiency technologies that are directly modeled in Autonomie, are modeled in ATTEST for the exact energy mechanisms they are impacting. So all of the efficiency technologies (that are directly simulated in Autonomie), when modeled individually, are modeled identically in ATTEST. Other individual technologies that are not modeled in Autonomie are implemented in the ATTEST spreadsheet, based on the baseline energy audit. For example, (see Figure 11) hybrid technology is assumed to be able to recover 60% of the braking losses, so it is implemented in the tool as a reduction of 60% in braking loss mechanism. This rather simplistic decision was made due to the complexity and uncertainty in the in-development long-haul hybrid systems and their control strategies.
Engine shut-off in idling and coasting conditions can be implemented in a similar man-ner. Autonomie does not have suitable modules for the incorporation of aftertreatment-related innovations that are linked to efficiency. As a result aftertreatment technology is implemented in ATTEST as a reduction in pumping, exhaust, and coolant losses to match 3% fuel consumption reduction, near the middle of the 1.5% to 4% potential gains reported by Detroit Diesel (Sisken and Rotz, 2012). Other technologies, which fuel consumption benefits are known, can be implemented in a similar manner.
In addition, we model and report on mass reduction results without incorporating the increased payload that would likely result for tractor-trailers that are weight-limited and “weigh-out”. The tool reports changes in fuel consumption and fuel economy assuming that the payload is constant, and the mass reduction affects tractor-trailer curb weight. The tool offers the capability to calculate changes in load specific fuel consumption (i.e. gal/1,000 ton-mile) for weight-limited cases. This is analyzed further in the results below. Within the tool we, by default, model tire rolling resistance according to a weighting of the tractor-trailer load by steer, drive, and trailer axle loads of 18%, 30%, and 52%, respectively.
There are a number of notable limitations, omissions, and technologies that fall outside the scope, in this ATTEST modeling assessment. There are limitations in fully capturing the optimization and control-strategy dependent aspects of AMTs and DCTs with inte-grated engine-transmission controls or various hybridization approaches. Without mod-eling of complex control strategy and optimization of shift points and engine operation, this amounts to a notably conservative approach on estimating the efficiency potential of these technologies. In addition, beyond tractor-trailer load characteristics, there are several efficiency technology areas related to how tractor-trailers are operated that are not modeled in ATTEST. Autonomie and ATTEST do account for idling fuel consumption when the tractor-trailer is at rest. The ICCT baseline engine idles at 0.61 gallons of diesel per hour with the existing low accessory load, at 500 rpm. Values between 0.5 gal/h and 1.5 gal/h are typical for accessory operation (e.g. air conditioning system) of about 2 kW (Lutsey et al., 2007). The regulatory agencies use a base engine idle fuel usage of 0.8gal/h in their regulatory impact analysis (US EPA and NHTSA 2011a). Calculation regarding various idle reduction technology benefits, due to driver and fleet operational factors for various idle-reduction technologies, were deemed to be more adequately analyzed outside the ATTEST model. Additional technologies that have similar questions about operational factors, like particular fleets’ duty cycles and driver feedback, are similarly omitted from this assessment. For example, road load optimization using Global Positioning Systems (GPS), predictive cruise algorithms, and associated driver feedback are not analyzed. Finally, automatic tire monitoring and inflation technologies, although potentially offering significant efficiency benefits are excluded from this analysis.

37
ICCT WHITE PAPER
Modeling technology package synergies The primary objective of the ATTEST lumped parameter tool is to develop valid estima-tions of the heavy-duty vehicle efficiency technology package benefits. A critical part of this tool development is creating a method that analyzes the interactions between the technologies in a rigorous and accurate manner. The incorporation of the technol-ogy interactions is handled primarily via inputs from the Autonomie modeling that disaggregate the technology efficiency impacts by the energy loss mechanisms. The technologies then are brought together in the ATTEST lumped parameter tool with a multiplicative aggregation method, and finally the ATTEST evaluation is validated against the Autonomie results.
When two or more technologies are added to a particular vehicle, the resultant fuel consumption reduction may be higher or lower than the product of the individual effec-tiveness values for those technologies. This can occur when the efficiency technologies address the same loss mechanism or if one technology directly affects how the second technology operates. There are several examples of potential such interactions. In com-bustion optimization strategies, there could be significant reductions in heat losses from the combustion chamber and exhaust. This therefore reduces the efficiency potential for waste heat recovery systems after other engine technologies are included. Waste heat recovery and aftertreatment thermal management strategies can affect the operation of the cooling system fan and other engine accessories. In the absence of a more complex engine model, jointly modeling engine technologies and handling their effect simultane-ously in a modified engine map in full-vehicle simulation modeling, best handles these types of interactions. Another interaction occurs when engine downspeeding shifts the operational locus of the engine. This changes the effect of other engine efficiency technologies, by moving engine operation to points in the engine map to where those technologies may have more or less impact. Vehicle simulation accurately captures these positive and negative synergies. However, a lumped parameter model, without validation with a full-vehicle systems model, has potential difficulties in trying to incorporate these types of technology interactions (see, e.g., Sovran and Blaser, 2003).
The use of lumped parameter and similar partial discrete approximation techniques have the benefit of efficiently modeling discrete technologies’ cumulative impact against a baseline vehicle configuration; however, these techniques do have potential disadvan-tages. The chief disadvantage of such partial disaggregation methods is that it is empiri-cally based and therefore does not explicitly represent the interactions among the set of technologies (NRC, 2011). As a result, some researchers have ultimately utilized adjust-ment factors in instances when the interaction modeling yields unsatisfactory results.
In an effort to better capture technology interactions, ATTEST was created using a lumped parameter methodology involving a highly detailed multiplicative aggregation. This method has a key difference over previous methods by aggregating the individual technologies’ effects over the ten different energy loss mechanisms obtained from full vehicle simulation. As introduced in Figure 10 and Figure 11 above, based on the engine data collection and the full-vehicle simulation we are utilizing the following ten energy loss mechanisms: engine exhaust, engine coolant, engine ambient heat transfer, engine pumping, engine friction and auxiliaries, vehicle aerodynamic, vehicle rolling resistance, vehicle braking, vehicle driveline, and vehicle accessories. This procedure provides an additional level of detail into the energy loss mechanisms, as compared to previous multiplicative-type modeling (e.g., in Cooper et al, 2009; Kromer et al, 2009; US EPA, 2012).

38
ADVANCED TRACTOR-TRAILER EFFICIENCY TECHNOLOGY POTENTIAL IN THE 2020-2030 TIMEFRAME
In order to test the validity of the ATTEST lumped parameter modeling against the Autonomie full-vehicle results, we compared more than forty technology packages over the HHDDT65 and real world highway cycles. These packages are described below in the document and represent different combinations of engine, transmission, and vehicle technologies. Figure 12 shows a comparison of fuel consumption results between Autonomie simulation model and ICCT’s ATTEST tool for a range of technology package options. Each dot represents the results for a given technology package. Dots located on the parity line represent a perfect agreement between Autonomie and ATTEST, points above the line represents packages which fuel consumption is overestimated by ATTEST and points below the line represent packages which fuel consumption is underestimated by ATTEST. Dotted lines represent 5% deviation, which is deemed here to be an acceptable confidence limit. The figure shows that ATTEST results match those of Autonomie within 5%. Also shown in the figure, the ATTEST fuel consumption results tend to be conservative (i.e., savings are generally underestimated rather than overestimated) since most of the points are located above the parity line. We note that the ATTEST method results are independent of the order in which the user adds technologies. Based on this comparison, the ATTEST model offers a valid, albeit slightly conservative, estimate of the technology interactions as compared to the Autonomie full-vehicle simulation.
4.0
5.0
6.0
7.0
8.0
9.0
10.0
4.0 5.0 6.0 7.0 8.0 9.0 10.0
AT
TE
ST f
uel c
ons
ump
tio
n (g
al/1
,00
0 t
on-
mile
)
Autonomie fuel consumption (gal/1,000 ton-mile)
Parity line+5% / -5%HHDDT65 Real world highway
Figure 12. Comparison of technology packages in Autonomie and ATTEST
In addition to ensuring that the advanced efficiency technology packages results accurately reflect state-of-the-art full-vehicle simulation, we also perform several checks on the technology packages in order to confirm that utility is not compromised. This is

39
ICCT WHITE PAPER
meant as a check on technology viability, considering that the various powertrain and vehicle load technology packages need to be just as capable in the real world. Tractor-trailers are subject to minimum performance criteria, including acceleration, and grade capability. Grade capability, or “gradeability” is defined and evaluated as the maximum percent grade in which the vehicle can sustain a given speed. The ability to meet these criteria can be compromised when the torque reserve (i.e., difference between the maximum torque of the engine and the torque requirements at cruise speed on level road) is decreased. The torque reserve increases when applying road load reduction technologies, but decreases when downspeeding and/or downsizing the engine.
To further understand the impact of duty cycle and screen the technology package results, we examine the tractor-trailer energy use across the operational torque and speed points. Figure 13, with energy density plots, illustrates the torque and engine speed points that are responsible for the greatest fuel consumption for various drive cycles. The figure illustrates the shift in operational locus when different cycles are applied (rows), and when downspeeding is applied (columns). Three cycles, with increasing operational road load are shown in the rows of the figure. If a vehicle is simulated over the GEM 65 mph cruise cycle, the engine operates mainly at a single point, which is unrealistic and makes the simulation very sensitive to that particular operational location. Based on the discrete nature of transmission gearing, one can modify the simulation parameters to make the engine operate in its peak efficiency point. If the duty cycle includes speed variation as in the HHDDT65, the maximum torque of the engine is not utilized most of the time, which could mean that the engine is oversized for the application, and may not not run in its most efficient zone most of the time. If the cycle includes road grade, as is the case for the real-world highway cycle that is analyzed here, the maximum torque capabilities of the engine are utilized. The second column of the plot shows how downspeeding shifts the operational locus to lower speeds and higher torques, where higher engine brake thermal efficiency zones are usually located. However, higher torques will reduce the torque reserve. Vehicle manufacturers have specification tools in place to help their customers to select appropriate engines, transmissions, and axle ratios to match their particular fleets’ applications and driving patterns.
Figure 13 helps illustrate that when not having enough torque in reserve, the engine’s ability to climb hills at sustained high speeds can be compromised, and the vehicle would, in such cases, show a deviation from target and actual speed-time traces. For example, for the real world highway cycle with 20% downspeeding shown, as a result of operating at close to maximum engine torque capabilities, deviated more than 2mph from the trace about 14% of the time. The simulated vehicle in that case is not performing the same duty cycle as a capable vehicle (i.e., one that is able to follow the speed trace). In order to account for this issue, utility factors or performance criteria are needed, and are discussed below. We note that application of road load reduction technologies (aerodynamics, low rolling resistance tires, and lightweighting) will shift back the operational locus to lower torques, thus enabling downspeeding and poten-tially downsizing of the engine. In addition to assisting in understanding the limits and checking the validity of each technology package, this exercise also helps illustrate the importance of incorporating valid engine fuel consumption maps and representative test cycles in vehicle simulation modeling. Any particular engine has precise torque-speed fuel consumption characteristics. For example, the location of the high-efficiency “sweet spot” can differ from engine to engine. Use of a generic fuel consumption map, as was the case for the first phase of regulations, would make the simulation model to produce

40
ADVANCED TRACTOR-TRAILER EFFICIENCY TECHNOLOGY POTENTIAL IN THE 2020-2030 TIMEFRAME
results that are not representative of particular engine’s operation. Figure 13 also shows that first phase 65 mph regulatory cycle doesn’t exercise the simulated engine over its expected operational locus but only over a single torque-speed point.
No downspeeding 20 % downspeeding
Phase I 65mph cruise (constant speed, no grade)
1000 1200 1400 1600 1800 2000 22000
500
1000
1500
2000
2500
Engine Speed (RPM)
Torq
ue (N
.m)
% of total energy
10
20
30
40
50
60
70
1000 1200 1400 1600 1800 2000 22000
500
1000
1500
2000
2500
Engine Speed (RPM)
Torq
ue (N
.m)
% of total energy
10
20
30
40
50
60
70
HHDDT65 (variable speed, no grade)
1000 1200 1400 1600 1800 2000 22000
500
1000
1500
2000
2500
Engine Speed (RPM)
Torq
ue (N
.m)
% of total energy
2
4
6
8
10
12
1000 1200 1400 1600 1800 2000 22000
500
1000
1500
2000
2500
Engine Speed (RPM)
Torq
ue (N
.m)
% of total energy
1
2
3
4
5
6
7
8
9
10
Real world highway (variable speed and grade)
1000 1200 1400 1600 1800 2000 22000
500
1000
1500
2000
2500
Engine Speed (RPM)
Torq
ue (N
.m)
% of total energy
0.5
1
1.5
2
2.5
3
3.5
4
1000 1200 1400 1600 1800 2000 22000
500
1000
1500
2000
2500
Engine Speed (RPM)
Torq
ue (N
.m)
% of total energy
1
2
3
4
5
6
7
8
9
Figure 13. Illustration of operational locus shift for tractor-trailer on three drive cycles without and with engine downspeeding
Table 3 shows the basic utility factors for several tractor-trailer configurations, with the addition of more advanced tractor-trailer technologies. Trace following is an important criterion to discern among valid tractor-trailer configurations. If a simulated vehicle is capable of following the speed-trace within 2 mph for more than 90% of cycle time, it is deemed valid for the given cycle. As discussed below, tractor-trailer technology pack-ages are checked for their trace following on the regulatory cycles, the HHDDT65 cycle, and the real-world highway with grade cycle. Non-compliance with this trace-following

41
ICCT WHITE PAPER
criterion also means that the vehicle does not have similar grade capability as the ICCT 2010 reference tractor-trailer. Acceleration times are similar among the configurations as they are dependent on lug curve, transmission gear ratios, and driver model (which were unchanged for the different configurations). Lower tractor-trailer road load attributes do not have a large effect on simulated acceleration times. In essence, these checks only became important when considering multiple combinations of engine downsizing with road-load reduction, where downsizing was limited to the extent that tractor-trailers would not see degraded performance. Table 3 shows that a 2017 compliant vehicle, and a 2017 compliant with mild downspeeding satisfy performance parameters. However, further downspeeding makes that configuration invalid (i.e., below than the 90% trace-following criterion). Implementation of advanced road load reduction technologies makes the configuration valid again. The last column represents a downsizing example, whereby a tractor-trailer with advanced road load reduction and a 10% downsized engine satisfies our performance criteria.
Table 3. Performance criteria for tractor-trailer technology packages
Performance criterion
2010 Reference
vehicle
2017 Compliant
vehicle
2017 Compliant vehicle with 10% downspeeding
2017 Compliant vehicle with 20% downspeeding
Advanced road load technology
and 20% downspeeding
Advanced road load
technology, 20% downspeeding, and 15% engine
downsizing
Trace following (percent time within 2 mph)
97.6 98.0 95.2 89.9 95.0 92.9
Gradeability at 55mph (percent) 2.4 2.6 2.2 1.4 1.8 1.6
Gradeability at 65mph (percent) 1.8 2.2 2.0 1.4 2 1.8
Acceleration time 0-30mph (s) 16.5 16.4 16.0 15.8 15 16.5
Acceleration time 0–60mph (s) 57.4 54.9 55.9 53.4 48.0 57.2
Notes: “Advanced road load technology” refers to 30% reduction in aerodynamic drag, 30% reduction in rolling resistance, and 14% reduction in tractor-trailer curb mass. See below for further details on the technology packages.

42
ADVANCED TRACTOR-TRAILER EFFICIENCY TECHNOLOGY POTENTIAL IN THE 2020-2030 TIMEFRAME
III. ANALYSIS OF TECHNOLOGY POTENTIAL
This section reports on the final results from this analysis on tractor-trailer efficiency technologies from the ATTEST lumped parameter modeling. The results are separated into three parts: (a) fuel consumption results of the various individual advanced ef-ficiency technologies, (b) fuel consumption results of packages of multiple powertrain and road load efficiency technologies together, and (c) a comparison to various other related tractor-trailer efficiency research.
INDIVIDUAL TECHNOLOGIES Table 4 summarizes the individual technologies’ fuel consumption results from this work along side the “conventional wisdom” ranges for the various efficiency technologies. This analysis’ individual technology results for the percent fuel consumption reduction on the HHDDT65 and real world highway cycles are shown in the table. As shown, the benefits from this assessment are primarily within the ranges of the previous reports on the individual efficiency technologies. The efficiency technology assumptions and descriptions are above in Section II.
Table 4. Percent fuel consumption from efficiency technologies for 2015-2030 Class 8 line-haul applications from 2010 baseline
Technology
Range from workshop* This study
Low High HHDDT65Real-world Highway
Eng
ine
Engine friction reduction 0.5% 2% 1.5% 1.3%
On-demand accessories 0.5% 4% 0.4% 0.3%
Combustion optimization 2% 4% 3.4% 3.3%
Advanced engine control 1% 4% 3.5% 3.5%
Aftertreatment improvement 2% 4% 1.9% 1.9%
Turbocharging system improvements 1% 5% 1.7% 1.7%
Mechanical turbocompounding 0.5% 4% 3.0% 3.0%
Waste heat recovery 2% 8% 3.7% 4.5%
Engine downsizing 1% 4.5% 1.8% 3.3%
Tran
smis
sio
n Efficiency (friction reduction, direct drive) 0.5% 2.0% 0.4% 0.4%
Single drive axle (6x2) 1% 2.5% 1.7% 1.8%
Automated manual (with downspeeding) 2% 3% 1.7% 1.5%
Dual-clutch transmission (with downspeeding) 3% 8% 3.0% 2.6%
Hybrid (regen. braking, coasting, torque assist) 3% 5% 1.2% 1.6%
Trac
tor-
trai
ler
Aerodynamics (tractor) 3% 9% 7.5% 6.7%
Aerodynamics (trailer) 8% 13% 18.2% 16.4%
Aerodynamics (tractor-trailer) 10% 20% 24.8% 22.2%
Low rolling resistance tires (tractor) 2% 6% 6.1% 5.3%
Low rolling resistance tires (trailer) 2% 4% 4.3% 3.8%
Low rolling resistance tires (tractor-trailer) 4% 10% 10.9% 9.6%
Weight reduction (chassis, trailer optimization) 2% 5% 2.4% 3.5%
* Based on Lutsey et al, 2014. Percent values are in fuel consumption reduction per ton-mile, from representative 2010 engine and tractor-trailer baseline in representative real-world long-haul operation; fuel consumption reduction percent values are not simply additive.

43
ICCT WHITE PAPER
These results for the various individual efficiency technologies areas are generally consistent with the technology-specific statements made by the technology developers at original equipment manufacturing and supplier companies. On the engine side, Cum-mins (Stanton, 2013; Salemme, 2014) indicate 9-15% fuel consumption reduction poten-tial from 2017 standards (14-20% from 2010 reference) based on advanced combustion strategies, turbocharger and EGR air handling, friction and parasitic losses reduction, high efficiency aftertreatment, heat transfer management, and waste heat recovery.
On the transmission side, Cummins (Salemme, 2014) indicates a 3-5% fuel consumption reduction potential from 2017 standards (9-11% from 2010 reference) based on powertrain integration that includes shift optimization, cycle efficiency management, and hybrid technology. Eaton (Stoltz and Dorobantu, 2014) indicates 4.5-8% from advanced transmis-sion, including minimization of mechanical losses, lightweighting, powertrain integration, optimization of gear ratios, enabling of downspeeding and downsizing and reducing engine transient excursions. Table 4 only shows the expected fuel consumption reductions from downspeeding of the engine, without any other consideration to deep powertrain integra-tion or potential engine optimization for downspeeding (higher torques at lower rpm).
On the vehicle side, Navistar (Golsch, 2013) suggest 25% fuel savings are achievable from aerodynamics, which translates to an aerodynamic drag reduction of about 53% (Cd=0.33). Daimler SuperTruck achieved 54% aerodynamic drag coefficient reduction, attributed 39% to the trailer and 15% to the tractor (Rotz, 2014). Cummins-Peterbilt SuperTruck team achieved about 20% fuel consumption reduction from aerodynamics (Damon, 2014), and the Volvo SuperTruck target is 40% reduction in aerodynamic drag and has achieved 30% thus far (Amar, 2013). Tire companies have not been forthcoming on potential tire rolling resistance reductions, but DOE’s goal of 35% RRc reduction (NRC, 2008, 2012) equates to a 10.5% fuel consumption reduction. Reducing tractor-trailer curb weight by 2500-4000 lb. (Scarcelli, 2014; US DOE, 2013; Walmart, 2014) equates to a 7.7-12.3% weight reduction. This results in 1.4-2.2% fuel consumption per mile reduction for cubed-out tractor-trailers, and 6.6-10.6% fuel consumption per ton-mile for weighed-out tractor-trailers that would be able to haul more freight.
We make several notes here on individual technologies, and their comparison to the stakeholder workshop findings on fuel consumption reduction. First, the modeling of on-demand accessory improvements indicated considerably lower potential fuel consumption benefit than the stakeholder group indicated. This was also alluded to above in Figure 8, whereby in-use accessories and pumps are largely disengaged in dynamometer testing and regulatory certification modeling. Second, transmission efficiency benefits were estimated close to the lower end of the range indicated by the stakeholder group. This is due to the tractor-trailer model being already a direct drive transmission. Transmission efficiency at top gear was increased from 0.98 assumed per Phase 1 rule documentation (US EPA and NHTSA, 2011b), to 0.99 in order to represent higher efficiency in direct drive.
As an additional step to examine the relative effects of each technology area, as modeled in isolation, we analyze the contributions of road load, downspeeding, and engine effi-ciency to tractor-trailer fuel consumption (i.e., fuel per ton-mile). Figure 14 shows ATTEST percent fuel consumption reductions from ICCT 2010 reference vehicle over the HHDDT65 cycle as a function of percent changes on engine, transmission, and road load parameters. Return factors, or elasticities (i.e., ratio of fuel consumption reduction percentage to percentage change in a given parameter), are represented by the slopes of the lines.

44
ADVANCED TRACTOR-TRAILER EFFICIENCY TECHNOLOGY POTENTIAL IN THE 2020-2030 TIMEFRAME
Aerodynamic drag coefficient reduction has a return factor of 0.47 and rolling resistance coefficient reduction has a return factor of 0.3. Lightweighting of the tractor-trailer has a return factor of 0.18 if the vehicle cubes-out (i.e., curb weight is reduced but payload is unchanged) and 0.86 if the vehicle weighs-out (i.e., curb weight reduction increases payload). Fuel consumption reduction does not vary linearly with engine efficiency increase or final drive ratio reduction so these return factors are not calculated.
0%
5%
10%
15%
20%
25%
0% 5% 10% 15% 20% 25% 30% 35% 40% 45% 50%
Fue
l co
nsum
pti
on
red
ucti
on
(%)
Parameter change (%)
BTE increase
Curb mass reduction,weigh-out
Cd reduction
RRc reduction
Curb mass reduction, cube-out
Final drive ratio reduction
Figure 14. Fuel consumption reduction as a function of vehicle, transmission, and engine parameters (HHDDT65 cycle)
TECHNOLOGY PACKAGE RESULTSSeveral technology packages are analyzed, that include permutations over five different levels of engine-related, vehicle-related, and transmission-related technology. These technologies are modeled on a continuum across the various metrics in Autonomie, but they are, for the sake of presentation of results from discrete technologies, segmented into five technology steps. Table 5 summarizes the different levels for each technology area. As shown, engine technologies range from the 42.8% peak BTE 2010 reference to the 45.8% peak BTE 2017 reference through the US DOE SuperTruck goal of a peak BTE of 55%. The transmission packages include AMT with 10% downspeeding, dual-clutch with 20% downspeeding, and dual-clutch up to 15% downsizing. The following terms indicate the vari-ous levels of technology: “moderate” for technologies that are commercially available in the marketplace; “advanced” for technologies that are available, well understood by companies, and are likely to be further developed and introduced in the relative near-term; and “long term” for technologies that exist and are being analyzed in engine, tractor, transmission, and tire laboratories of companies, government agencies, and universities. The tractor-trailer road load reduction technology packages include progressively lower road loads in vehicle mass, aerodynamics, and tire rolling resistance from the baseline to the long-term targets indicated by US DOE and other groups. We note that the “2017 engine” and the “Phase 1” tractor-trailer together represent a technology package that is consistent with compliance with the existing Phase 1 US heavy-duty vehicle engine and tractor standards.

45
ICCT WHITE PAPER
Table 5. Definitions for engine, transmission, and road load reduction technologies applied in efficiency technology packages
Area Name Description
Enginea
2010 reference 42.8% peak BTE
2017 45.8% peak BTE
2020+ 49% peak BTE
2020+WHR 52% peak BTE
Long Term 55% peak BTE
Transmission
Manual Baseline transmission
AMT 10% downspeeding
DCT 20% downspeeding
DCT+ds10 20% downspeeding, 10% downsizing
DCT+ds15 20% downspeeding, 15% downsizing
Tractor-trailer road load reduction package
2010 reference 14,741 kg, 0.7 Cd b, 7 RRc c
Phase 1 -2% mass, -16% Cd, -9% RRc
Moderate -7% mass, -20% Cd, -16% RRc
Advanced -14% mass, -30% Cd, -30% RRc
Long Term -17% mass, -50% Cd, -35% RRc
a BTE = Engine brake thermal efficiencyb Cd = Coefficient of aerodynamic dragc RRc = Rolling resistance coefficient (in kg/tonne) weighted over steer, drive, and trailer axles
Table 6 summarizes a selection of the ATTEST fuel consumption modeling results for 46 technology packages over the HHDDT65 and real world highway cycle. These efficiency technology packages are also shown above in Figure 12 in the comparison of the Au-tonomie and ATTEST results. The table, from top to bottom, shows results from higher to lower fuel consumption with the addition of more advanced tractor-trailer, engine, and transmission technologies. The two cycles shown, the HHDDT65 and the real world highway cycle, are presented because they reflect realistic fuel consumption from vari-able highway driving, with and without grade respectively. The overall progression from the 2010 baseline (i.e., the first package) to the most advanced technology package (i.e., 55% engine efficiency, long-term tractor-trailer package, 15% engine downsizing, dual clutch transmission with downspeeding) represent a potential for a 50% reduction in fuel consumption on the HHDDT65 cycle (and a 40% reduction from the 2017 Phase 1 reference). As indicated in the table, the absolute fuel consumption of the packages on the real-world highway with grade is generally 4-12% higher than those of the HHDDT65.

46
ADVANCED TRACTOR-TRAILER EFFICIENCY TECHNOLOGY POTENTIAL IN THE 2020-2030 TIMEFRAME
Table 6. Technology package fuel consumption results
Tractor-trailer Engine Transmissiona
HHDDT65 fuel consumption
(gal/1000 ton-mi)
Real world highway fuel consumption (gal/1000 ton-mi)
HHDDT change in fuel consumption
from 2010
Real world highway change in fuel consumption
from 2010
1 2010 ref. 2010 ref. Manual 9.5 9.9 0% 0%
2 2010 ref. 2017 Manual 8.7 9.1 -8% -8%
3b Phase 1 2017 Manual 7.8 8.3 -16% -16%
4 Moderate 2017 Manual 7.4 7.9 -20% -20%
5 Moderate 2017 AMT 7.3 7.8 -21% -21%
6 Phase 1 2020+ Manual 7.3 7.8 -21% -21%
7 Phase 1 2020+ AMT 7.2 7.7 -22% -21%
8 Moderate 2017 DCT 7.2 7.6 -23% -21%
9c Phase 1 2020+ DCT 7.1 7.6 -23% -22%
10 Phase 1 2020+WHR Manual 7.1 7.5 -25% -25%
11 Phase 1 2020+WHR AMT 7.0 7.4 -25% -25%
12 Moderate 2020+ Manual 6.9 7.4 -25% -25%
13c Phase 1 2020+WHR DCT 6.9 7.3 -26% -25%
14 Moderate 2020+ AMT 6.8 7.3 -26% -26%
15 Moderate 2020+ DCT 6.7 7.2 -27% -26%
16 Moderate 2020+WHR Manual 6.7 7.1 -29% -29%
17 Moderate 2020+WHR AMT 6.6 7.0 -29% -29%
18 Advanced 2017 Manual 6.6 7.1 -29% -29%
19 Moderate 2020+WHR DCT 6.5 6.9 -30% -29%
20 Advanced 2017 AMT 6.5 7.0 -29% -29%
21 Advanced 2017 DCT 6.4 6.9 -31% -29%
22c Advanced 2017 DCT+ds10 6.3 6.7 -32% -30%
23c Advanced 2017 DCT+ds15 6.3 6.6 -33% -33%
24 Advanced 2020+ Manual 6.1 6.6 -33% -33%
25 Advanced 2020+ AMT 6.0 6.6 -34% -34%
26 Advanced 2020+ DCT 5.9 6.4 -35% -35%
27 Advanced 2020+WHR Manual 5.9 6.3 -36% -36%
28 Advanced 2020+ DCT+ds10 5.9 6.3 -36% -36%
29 Advanced 2020+WHR AMT 5.8 6.3 -36% -36%
30 Advanced 2020+ DCT+ds15 5.8 6.2 -37% -37%
31 Advanced 2020+WHR DCT 5.8 6.2 -38% -38%
32 Advanced 2020+WHR DCT+ds10 5.7 6.0 -39% -38%
33 Long Term 2017 Manual 5.6 6.2 -38% -38%
34 Advanced 2020+WHR DCT+ds15 5.6 6.0 -40% -40%
35 Long Term 2017 AMT 5.5 6.1 -38% -42%
36 Long Term 2017 DCT 5.4 6.0 -40% -42%
37 Long Term 2020+ Manual 5.2 5.8 -42% -42%
38 Long Term 2020+ AMT 5.2 5.7 -42% -44%
39 Long Term 2020+WHR Manual 5.1 5.5 -44% -44%
40 Long Term 2020+WHR AMT 5.0 5.5 -45% -45%
41 Long Term 2020+ DCT 5.0 5.6 -44% -45%
42 Long Term 2020+WHR DCT 4.9 5.3 -46% -46%
43 Long Term 2030+ DCT 4.5 5.0 -50% -48%
44 Long Term 2030+ DCT+ds10 4.5 4.9 -51% -49%
45 Long Term 2030+ DCT+ds15 4.5 4.8 -51% -50%
46 Long Term 2030+ DCT+ds15+hyb 4.3 4.6 -54% -52%
a Transmission packages with “ds10” and “ds15” include downspeeding of 10% and 15% respectivelyb Package 3 represents an engine and tractor-trailer that complies with the 2017 Phase 1 regulation.c Simulation run did not pass performance criteria (trace following >= 90%); performance criteria (gradeability, trace-following, acceleration) for all other technologies packages were achieved
d Hybrid technology with 60% braking energy regeneration efficiency.

47
ICCT WHITE PAPER
Based on the results from the above technology packages we summarize several results of interest. First, within engines, the findings indicate that there is considerable technical potential to increase the diesel engine efficiency to reduce tractor-trailer fuel consump-tion. Another 10-16% fuel consumption reduction exists beyond the 2017-required engine requirements. In addition, the findings indicate that greater engine-specific fuel use reductions of 2-4% are possible when load reduction synergies are included that allow downsizing of the engine. The findings indicate that the various road load technologies offer major potential for tractor-trailer fuel consumption reduction. Aerodynamics, in particular, are a critical part of the overall technology potential as they directly pertain to tractors, trailers, and indirectly to powertrain sizing. Aerodynamic improvements alone are found to deliver up to 25% fuel use reduction based on their long-term potential. Because tractor-specific road load improvements are expected to be deployed to deliver about a third of that overall aerodynamic improvement by model year 2018, most of the post-2020 aerodynamic technology potential will likely be in trailer technologies (e.g., side skirts, gap reducers, and boat tails).
Overall, we find many advanced technology packages that combine powertrain and road load technologies to deliver about 40-46% fuel consumption reduction from 2010 levels. Technology packages 35 through 46 show a variety of technology packages that achieve over a 40% fuel consumption reduction on the HHDDT65 cycle. These packages generally include technology enhancements in the engine, transmission, and road load, but do so to differing degrees. For example, this level of fuel consumption reduction is achieved in these packages with the advanced or long-term engine efficiency with (or without) waste heat recovery), with the advanced or long-term road-load packages (i.e., differing aerodynamic, tire, and weight reduction), and with differing powertrain technology (including transmission, downspeeding, and downsizing). If most advanced technology packages that are akin to the targets for US DOE SuperTruck engines and road load characteristics are considered, the potential fuel consumption reduction reaches 48-52%. Also shown in the table, in the right-most column, the amount of efficiency potential that might be available from the technology packages after account-ing for likely 2017 Phase 1 compliance. From 2018 on, we find that there still remains up to a maximum of 43% in fuel consumption reduction for post-Phase 1 tractor-trailer heavy-duty vehicle, corresponding to long-term technologies investigated in this report.
Beyond the overall technology fuel consumption potential results, several more detailed results from the modeling related to engine size, lightweighting, accessory loads, and braking losses are discussed.
The technology package modeling leads to several observations related to engine size. Analysis over the real world highway cycle indicates the potential for downsizing of engine power over different levels of road load reduction and downspeeding. Table 7 summarizes the Autonomie simulation results of a parametric analysis in which the engine was downsized up to 30% in 5% increments to understand the maximum level of downsizing that can be applied while still complying with our 90% trace-following criterion. The table shows that absent downspeeding (i.e., with a baseline manual trans-mission) engine downsizing above 10% is feasible (without loss of performance over the real world highway cycle) for all the road load reduction packages in this study. In the case of 10% downspeeding with an AMT transmission, the engine can be downsized by up to 15%, 20%, and 30%, respectively, for the moderate, advanced, and long-term road load reduction packages. However, in the case of 20% downspeeding with a dual clutch transmission, the advanced and long term road load reduction packages present feasible
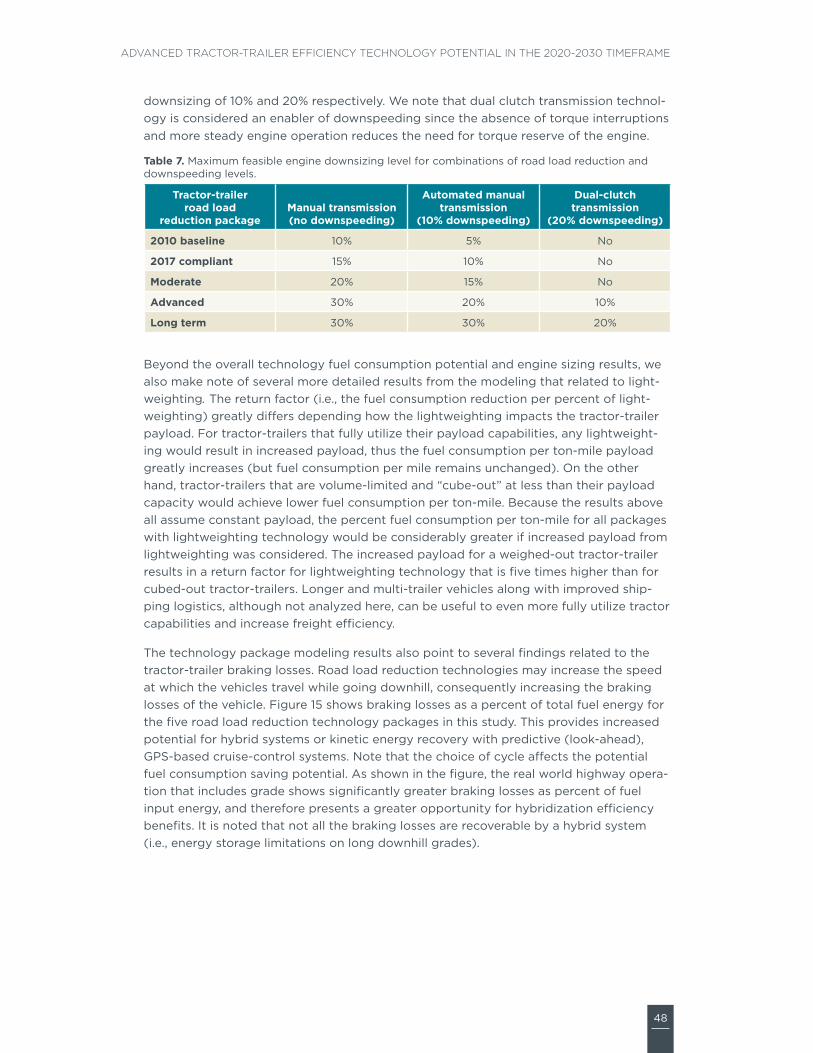
48
ADVANCED TRACTOR-TRAILER EFFICIENCY TECHNOLOGY POTENTIAL IN THE 2020-2030 TIMEFRAME
downsizing of 10% and 20% respectively. We note that dual clutch transmission technol-ogy is considered an enabler of downspeeding since the absence of torque interruptions and more steady engine operation reduces the need for torque reserve of the engine.
Table 7. Maximum feasible engine downsizing level for combinations of road load reduction and downspeeding levels.
Tractor-trailer road load
reduction packageManual transmission (no downspeeding)
Automated manual transmission
(10% downspeeding)
Dual-clutch transmission
(20% downspeeding)
2010 baseline 10% 5% No
2017 compliant 15% 10% No
Moderate 20% 15% No
Advanced 30% 20% 10%
Long term 30% 30% 20%
Beyond the overall technology fuel consumption potential and engine sizing results, we also make note of several more detailed results from the modeling that related to light-weighting. The return factor (i.e., the fuel consumption reduction per percent of light-weighting) greatly differs depending how the lightweighting impacts the tractor-trailer payload. For tractor-trailers that fully utilize their payload capabilities, any lightweight-ing would result in increased payload, thus the fuel consumption per ton-mile payload greatly increases (but fuel consumption per mile remains unchanged). On the other hand, tractor-trailers that are volume-limited and “cube-out” at less than their payload capacity would achieve lower fuel consumption per ton-mile. Because the results above all assume constant payload, the percent fuel consumption per ton-mile for all packages with lightweighting technology would be considerably greater if increased payload from lightweighting was considered. The increased payload for a weighed-out tractor-trailer results in a return factor for lightweighting technology that is five times higher than for cubed-out tractor-trailers. Longer and multi-trailer vehicles along with improved ship-ping logistics, although not analyzed here, can be useful to even more fully utilize tractor capabilities and increase freight efficiency.
The technology package modeling results also point to several findings related to the tractor-trailer braking losses. Road load reduction technologies may increase the speed at which the vehicles travel while going downhill, consequently increasing the braking losses of the vehicle. Figure 15 shows braking losses as a percent of total fuel energy for the five road load reduction technology packages in this study. This provides increased potential for hybrid systems or kinetic energy recovery with predictive (look-ahead), GPS-based cruise-control systems. Note that the choice of cycle affects the potential fuel consumption saving potential. As shown in the figure, the real world highway opera-tion that includes grade shows significantly greater braking losses as percent of fuel input energy, and therefore presents a greater opportunity for hybridization efficiency benefits. It is noted that not all the braking losses are recoverable by a hybrid system (i.e., energy storage limitations on long downhill grades).

49
ICCT WHITE PAPER
0.0%
1.0%
2.0%
3.0%
4.0%
5.0%
6.0%
7.0%
8.0%
Bra
king
loss
es (
% o
f to
tal f
uel e
nerg
y)
HHDDT65
Real world highway
2010 2010 Moderate Advanced Long term
Figure 15. Braking losses as a percent of total fuel energy for different vehicle road load reduction packages
The modeling also lead to several results related to test procedures. The work suggests that several regulatory procedure changes are warranted. For example, direct use of engine map data in regulatory accounting of engine efficiency in integrated full-vehicle simulation is critical to appropriately evaluate real-world tractor-trailer efficiency tech-nologies. Also, inclusion of grade in test cycles that better reflect real-world driving, streamlined procedures that promote emerging integrated engine-powertrain options, and requirements for trailer efficiency will all help promote applicable and promising technologies according to their real-world benefits. Moreover, some accessory loads are not measured over the engine dynamometer procedure. In addition, increasing accessory load by 10 kW increases the fuel consumption of the 2010 reference vehicle by about 5%. It is important that regulatory procedures recognize the potential fuel saving opportunities in real-world vehicle accessories. This is noted here, as above, as regulatory and testing cycles and GEM accounting do not account for the full extent of real-world accessory loads and their potential improvements.
The modeling had several limitations that led to somewhat conservative assumptions in terms of quantifying the full efficiency potential for some of the technologies analyzed here. The modeling limitations led to relatively conservative assumptions in several areas such as engine and vehicle accessories, transmission efficiency, and automated manual transmissions. For example, advanced engine control strategies were not simulated in Autonomie. In addition, as mentioned, real-world accessory loads and potential benefits would be greater than those shown here for the chosen vehicle test cycles. In the transmission area, we were unable to fully model control and shift strategies to fully optimize automated manual and dual clutch transmissions; as a result, their modeled fuel consumption benefits are lower than some leading suppliers are indicating. The modeling decision to incorporate technology packages in particular percent increments (e.g., on engine downspeeding and downsizing, road load reduc-tions) forgoes some level of optimization that would result in greater fuel consumption benefits under a fuller more comprehensive optimization to perfectly match the design criteria. Also, as discussed above, lightweighting has significantly more benefits in fuel consumption per ton-mile, if results are shown for weighed-out tractor-trailer that utilizes the lightweighting-enabled cargo capacity to haul more freight. Also, as noted

50
ADVANCED TRACTOR-TRAILER EFFICIENCY TECHNOLOGY POTENTIAL IN THE 2020-2030 TIMEFRAME
above in describing the Figure 12 results, the particular modeling methodology gener-ally had ATTEST technology packages results that were higher fuel consumption than the Autonomie simulation results.

51
ICCT WHITE PAPER
IV. CONCLUSIONS
This assessment is focused on evaluating the potential to increase US heavy-duty tractor-trailer fuel efficiency in the 2020-2030 timeframe. The scope includes analysis on the leading powertrain and road load technologies, technology modeling using state-of-the-art vehicle simulation techniques, and reporting on the associated potential to reduce fuel consumption and greenhouse gas emissions from tractor-trailers. Based on this work, we conclude with some final remarks on the tractor-trailer simulation methods, a summary of the technology findings, and a discussion of the policy implica-tions of the work.
TRACTOR-TRAILER SIMULATION MODELINGThis research provides a novel addition to the dialogue on tractor-trailer efficiency in several ways. Foremost, this research is a first to incorporate a new 2010-emissions-compliant engine map and its detailed energy audit as the basis for full tractor-trailer modeling. This work utilizes new engine map input data to augment the state-of-the-art Autonomie vehicle simulation model to assess how various technologies uniquely and cumulatively interact to impact tractor-trailer efficiency in line-haul applications. The modeling also evaluates integrated powertrain technologies that manufacturers and suppliers are commercializing and further developing, for example, advanced engine downspeeding and downsizing with dual-clutch transmissions. Finally, this work also includes the evaluation of additional efficiency gains and interactions related to in-development vehicle load reduction technologies like aerodynamics, tires, and weight reduction.
Beyond the updated tractor-trailer modeling in Autonomie, this project also develops a new lumped parameter tool that improves upon past attempts at modeling tractor-trailer technology interactions. The Advanced Truck Technology Efficiency Simulation Tool (ATTEST) improves upon previous lumped parameter tools in its robust and detailed accounting of multiple technologies simultaneously. The incorporation of technology synergies is handled in several ways. First, the lumped parameter tool utilizes multiplicative accounting according to the ten energy loss mechanisms (i.e., engine exhaust, engine coolant, engine ambient heat transfer, engine pumping, engine friction and auxiliaries, vehicle aerodynamic, vehicle rolling resistance, vehicle braking, vehicle driveline, and vehicle accessories). This offers a highly detailed breakdown of fundamental physical energy loss categories to ensure that energy losses are not double-accounted and synergies are accurately reflected. Also, the ATTEST model is validated to within 5% of the full-vehicle simulation model Autonomie results across a wide range of advanced efficiency technologies for their fuel consumption and CO2 emission rates. As a result, ATTEST enables robust modeling in a flexible tool that accurately evaluates synergies between powertrain and vehicle technologies.
A number of areas for potential follow-on work were beyond this research’s scope. The research focused on efficiency advancement from a particular tractor-trailer in particular conditions, but the modeling could flexibly be used to model technology improvements from other baseline vehicle models, whole fleets of vehicles, and other duty cycles. Another key question is to how the modeling of the technology potential for tractor-trailers would differ for other major vehicle markets that are considering future standards (e.g., Europe, China), as this would involve tailoring the work to the particular baseline fleet vehicle characteristics. Another unexplored question relates to

52
ADVANCED TRACTOR-TRAILER EFFICIENCY TECHNOLOGY POTENTIAL IN THE 2020-2030 TIMEFRAME
how the technology modeling approach would be applied to other vehicle segments (e.g., Class 4-6 delivery vans, various medium-duty work trucks, and buses). We also note that this investigation of advanced efficiency technologies does not assess the potential to simultaneously reduce local air pollutant emissions. Finally, another critical question that was outside the scope of this work is how the various individual technologies compare in terms of cost-effectiveness.
ADVANCED EFFICIENCY TECHNOLOGY FINDINGSThe tractor-trailer modeling resulted in over forty advanced efficiency technology packages that combined engine, transmission, aerodynamics, tire, and lightweighting technologies with expected 2020-2030 timeframe commercialization. In this section, we summarize the analytical results, including findings within each technology area, the extent to which the efficiency benefits are likely to be post-Phase 1 regulation, and the overall potential fuel consumption reduction.
Figure 16 and Figure 17 show results for a progression of tractor-trailer efficiency technology packages over the HHDDT65 and the real world highway (i.e., with grade) drive cycles, respectively. The sequencing of the packages in the figure conveys the general timing of technology availability and the applicability of new technologies that build upon another to address the prevailing energy losses and loads. The results shown are for the fuel consumption (in gallons of diesel fuel per ton of payload per 1000 miles traveled) in a Class 8 line-haul tractor-trailer with 19 tons of payload. As shown in Figure 16, the reference 2010 tractor-trailer with 9.5 gal/1000 ton-mi, and 5.5 miles per gallon (mpg) over the HHDDT65 cycle, could see substantially reduced fuel consumption with increasingly advanced technology. Going beyond compli-ance with the adopted 2017 standards, integrated transmission technologies could increase efficiency to about 7 mpg. Load-reduction technologies—like mass reduction, aerodynamic and tire efficiency improvements in trailers—and advanced integrated powertrains could increase efficiency to about 8 mpg. Further load reduction, engine downsizing, and engine waste heat recovery could increase fuel efficiency well above 9 mpg. Long-term improvements in engine and vehicle, plus hybridization or road load optimization could increase tractor-trailer efficiency to above 11 mpg. The “Moder-ate” technologies are those that are commercially available in the marketplace. The “Advanced” technologies in the figure are available, are well understood by companies, and are likely to be further developed and introduced in the relative near-term. The “Long-term” technologies exist and are being analyzed in engine, tractor, transmission, and tire laboratories of companies, government agencies, and universities. Figure 17 illustrates the comparable progression of the same efficiency technology over the real world duty cycle that includes simulated highway grade fluctuations.

53
ICCT WHITE PAPER
012345678910
Reference 2010 tractor-trailer
+ Incremental engine efficiency (2017 engine compliance)
+ Tractor road load technology (2017 tractor compliance)
+ Moderate integrated powertrain (Automated manual, 6x2)
+ Moderate tractor-trailer road load technology (-20% Cd aerodynamics, -16% Crr tires, -7% mass)
+ Advanced integrated powertrain ( 2020+ engine (48% BTE), dual-clutch)
+ Advanced tractor-trailer road load technology (-30% Cd aerodynamics, -30% Crr tires, -14% mass)
+ Engine downsizing (10%)
+ Engine waste heat recovery (52% BTE)
+ Long-term tractor-trailer road load technology (-50% Cd aerodynamics, -35% Crr tires, -17% mass)
+ Long-term engine technology (55% BTE)
+ Hybrid system (60% braking regeneration efficiency)
Fuel consumption (gal/1000 ton-mi)
5.5 mpg
9.1 mpg
6.7 mpg
6.0 mpg
6.9 mpg
7.3 mpg
8.0 mpg
8.9 mpg
9.5 mpg
11.1 mpg
12.0 mpg
12.3 mpg
Figure 16. Potential fuel consumption reduction from tractor-trailer efficiency technologies in the 2020-2030 timeframe over the HHDDT65 cycle
012345678910
Reference 2010 tractor-trailer
+ Incremental engine efficiency (2017 engine compliance)
+ Tractor road load technology (2017 tractor compliance)
+ Moderate integrated powertrain (Automated manual, 6x2)
+ Moderate tractor-trailer road load technology (-20% Cd aerodynamics, -16% Crr tires, -7% mass)
+ Advanced integrated powertrain ( 2020+ engine (48% BTE), dual-clutch)
+ Advanced tractor-trailer road load technology (-30% Cd aerodynamics, -30% Crr tires, -14% mass)
+ Engine downsizing (10%)
+ Engine waste heat recovery (52% BTE)
+ Long-term tractor-trailer road load technology (-50% Cd aerodynamics, -35% Crr tires, -17% mass)
+ Long-term engine technology (55% BTE)
+ Hybrid system (60% braking regeneration efficiency)
Fuel consumption (gal/1000 ton-mi)
5.3 mpg
8.5 mpg
6.4 mpg
5.8 mpg
6.6 mpg
6.9 mpg
7.5 mpg
8.4 mpg
8.9 mpg
10.2 mpg
11.0 mpg
11.6 mpg
Figure 17. Potential fuel consumption reduction from tractor-trailer efficiency technologies in the 2020-2030 timeframe over the real world highway cycle with grade

54
ADVANCED TRACTOR-TRAILER EFFICIENCY TECHNOLOGY POTENTIAL IN THE 2020-2030 TIMEFRAME
Considering all the tractor-trailer efficiency technologies, we find several available technology packages that combine powertrain and road load technologies to deliver about 30-40% fuel consumption reduction from 2010 levels. In particular, including technologies moving down in Figure 16 and Figure 17 through engine downsizing, avail-able technologies could reduce fuel consumption by 39% (over the HHDDT cycle) and 38% (over the real world cycle with grade) as compared to 2010 fuel consumption levels. This level of technology equates to a 25-27% fuel consumption reduction from a Phase 1 2017 tractor-trailer. If more advanced emerging technologies, like those being utilized in the SuperTruck program, were successfully developed and commercialized, this could push new tractor-trailer fuel consumption reduction to at least 50% on representative line-haul driving cycles. Considering only the efficiency potential that is expected to be available after 2017, we find that there still remains over 40% in fuel consumption reduction for post-Phase 1 tractor-trailer heavy-duty vehicles.
Examining the findings of the tractor-trailer simulation modeling within particular technology areas provides further insights. The findings indicate that there is still great technical potential remaining to increase diesel engine efficiency. Another 10-16% fuel consumption reduction exists beyond the 2017-required engine requirements. Greater engine-specific fuel use reductions are possible when load reduction and transmission-related synergies are included that allow optimal shifting, downsizing and downspeeding of the engine. Figure 18 shows the relative contribution of engine-related, and non-engine-related technologies to selected 2020-2030 efficiency packages. From a 2010 baseline, the engine efficiency amounts to about one third to almost one half of all potential fuel consumption benefits. Road load reductions, including aerodynamics, tires, and lightweighting, are a critical part of the overall technology potential, and particularly to engine development. These technologies directly pertain to tractors, trailers, and indirectly to powertrain sizing. Aerodynamic improvements alone are found to deliver about a 13-15% fuel consumption reduction. Because tractor-specific road load reduction technologies are expected to be deployed to deliver about one-third of that by model year 2018, most of the post-2020 aerodynamic technology potential will likely be in trailer technologies (e.g., side skirts, gap reducers, etc.)
0% 10% 20% 30% 40% 50% 60%
+ Advanced integrated powertrain (2020+ engine (48% BTE), dual-clutch)
+ Advanced tractor-trailer road load technology (-30% Cd aerodynamics, -30% Crr tires, -14% mass)
+ Engine downsizing (10%)
+ Engine waste heat recovery (52% BTE)
+ Long-term tractor-trailer road load technology (-50% Cd aerodynamics, -35% Crr tires, -17% mass)
+ Long-term engine technology (55% BTE)
+ Hybrid system (60% braking regeneration e�ciency)
Fuel consumption reduction from 2010 baseline
Engine Non-engine
Figure 18. Engine and non-engine related technology contribution to selected tractor-trailer efficiency packages over the HHDDT65 cycle

55
ICCT WHITE PAPER
POLICY DISCUSSION AND RECOMMENDATIONSA key aspect of the consideration of the technologies analyzed in this report in the US regulatory context is the timeframe under which they are considered. Any regulation’s timeframe sets the lead-time for companies to develop and commercialize the technolo-gies for compliance, and thus is integrally linked to the regulatory stringency. Various regulations can be “technology-tracking” if they are largely locking in business-as-usual industry trends by promoting off-the-shelf technologies are already commercialized and widely available. Conversely regulations could be considered “technology-forcing” if they require emerging technologies to be brought to market. The National Research Council defined this distinction: “ ‘Technology forcing’ refers to the establishment by a regulatory agency of a requirement to achieve an emissions limit, within a specified time frame, that can be reached through use of unspecified technology or technologies that have not yet been developed for widespread commercial applications and have been shown to be feasible on an experimental or pilot-demonstration basis” (NRC, 2006).
In the context of this analysis on 2020-2030 efficiency technologies, some of the tech-nologies are widely understood, tested and utilized in the fleet, whereas others have only been researched, tested, and been involved in early demonstrations. Many of the efficiency technologies, such as engine friction reduction, turbocharger improvements, automated manual transmissions, dual-clutch transmissions with downspeeding, tire rolling resistance, trailer aerodynamic improvements are commercially available in the near-term and the will surely incrementally improve further. However, technologies like those in the long-term road load technology package, engine advances to a 52% peak brake thermal efficiency with waste heat recovery, further engine advances to 55% peak brake thermal efficiency, and line-haul hybrid systems are not likely to be widely commercialized without a long-term regulatory signal that provides a sufficient motivation for the necessarily large investments. As such, regulatory stringency levels that are predicated upon these more advanced technologies would reasonably be dubbed “technology forcing.” Many of the efficiency technologies analyzed here could be readily deployed across new line-haul tractor-trailers with technology-tracking standards through the early 2020s. The most advanced technologies would be applicable for regulatory consideration in the 2025-2030 timeframe with technology-forcing standards that acknowledge the inherent investment, lead-time, and market development steps.
The technology potential findings indicate that there is the potential to substantially increase tractor-trailer energy efficiency. Further, there appears to be substantial oppor-tunity to greatly increase tractor-trailer efficiency well beyond the initial “Phase 1” heavy-duty vehicle rulemaking that applies to model year 2014-2018 vehicles and engines. With the US government set to establish heavy-duty vehicle standards for 2020 and beyond, this research improves the understanding of how available and emerging advanced technologies might increase tractor-trailer efficiency. To help realize these efficiency gains, the findings from this analysis point to several policy implications for the in-development US greenhouse gas emission and efficiency standards for 2020 and beyond.
(1) Technology potential in the mid-term—The findings indicate that available tractor-trailer efficiency technologies can reduce fuel use per ton-mile by 39% from the baseline 2010 technology, and by 27% from 2017, the final year of the already adopted standards. Achieving these efficiency levels by 2024 would amount to over 4%-per-year fuel consumption improvement for new tractor-trailers from 2017-2024.

56
ADVANCED TRACTOR-TRAILER EFFICIENCY TECHNOLOGY POTENTIAL IN THE 2020-2030 TIMEFRAME
(2) Technology potential in the long-term—The findings indicate that technology packages with emerging load-reduction and powertrain technologies can achieve at least a 50% reduction from baseline 2010 technology, or about a 40% reduction from 2017, in the 2025-2030 timeframe. For the regulation to be technology-forcing, it would need to ensure these levels of fuel consumption reduction and it would be important that standards provide sufficiently long lead-time to promote all the promising advanced efficiency technologies, increase investment security, and help drive technology innovation.
(3) Diverse technology approaches—Technology packages with advanced load-reduction and engine energy recovery approaches can achieve similar efficiency results, but do so with varying relative contributions from aerodynamic, powertrain, and other improvements. Regulations and the regulatory structure would ideally ensure that all available technologies from engines to trailers that are cost-effective are strongly promoted.
(4) Engine efficiency potential—The analysis of technology packages indicates that about one-third to one-half of the overall potential tractor-trailer efficiency benefits come from engine efficiency improvements (from baseline 2010 technology). Specifically looking at expected technology improvements from 2018-2030, the analysis indicates that engine efficiency improvements would amount to up to a 13% fuel consumption reduction by 2024 and 16% fuel consumption reduction over the long term. Without sufficient engine-specific regulatory requirements (see e.g., Sharpe et al, 2014b), these engine efficiency technologies appear unlikely to be commercialized in the 2030 timeframe.
(5) Regulatory procedure changes—The work suggests that several regulatory procedure changes are warranted. For example, direct use of engine map data in regulatory accounting of engine efficiency in integrated full-vehicle simulation is critical to ap-propriately evaluate real-world tractor-trailer efficiency technologies. Also, inclusion of grade in test cycles that better reflect real-world driving, streamlined procedures that promote emerging integrated engine-powertrain options, and requirements for trailer efficiency will all help promote applicable and promising technologies according to their real-world benefits. Moreover, some accessory loads are not measured over the engine dynamometer procedure. It is important that the simulation model provides ways to promote technologies that reduce these accessory loads.
A number of research questions remain beyond the scope of this research. The research is focused on efficiency advancement from a particular tractor-trailer in particular condi-tions, but the methodology could flexibly be used to model technology improvements from other baseline vehicle models, whole fleets of vehicles, and other duty cycles. Another key question is how the modeling of the technology potential for tractor-trailers would differ for other major vehicle markets that are on the verge of future standards (e.g., Europe, China), as this would involve tailoring the work to their particular baseline fleet vehicle characteristics. Another unexplored question relates to how the technology modeling approach could be applied to other vehicle segments (e.g., delivery vans, medium-duty work trucks, and buses). We also note that many of the technologies investigated could have differing effects on engine-out NOx, exhaust temperature, and aftertreatment operation. This investigation does not assess the potential to simultane-ously reduce local air pollutant emissions. Finally, another critical question that is outside the scope of this work is how the various individual technologies compare in terms of cost-effectiveness.

57
ICCT WHITE PAPER
As mentioned in the introduction, US combination tractor-trailer average fuel economy has remained at about six miles per gallon for nearly two decades. Tractor-trailers, though less than 2% of US vehicles, represent about 20% of on-road transportation oil use and climate emissions (and over two-thirds of heavy-duty vehicle fuel consumption). Heavy-duty vehicles represent an even greater share of the transportation oil use and CO2 emissions outside the US. As illustrated here, there is the potential to greatly reduce tractor-trailer fuel consumption. The implications of the work are more widespread than the immediate US dialogue toward 2020-and-beyond heavy-duty vehicle standards. Many countries are actively investigating heavy-duty vehicle efficiency policy for their fleets. Similar to the US, Japan, Canada, and China have already adopted some form of fuel efficiency or greenhouse gas standard for heavy-duty vehicles and are working toward the next phase of their regulations. Other areas, such as India, Brazil, Mexico, South Korea, and the European Union are also investigating new heavy-duty vehicle efficiency policies. Technology assessments like this that utilize state-of-the-art model-ing tools are a key input to these processes, helping to inform on the potential efficiency gains in heavy-duty vehicles.

58
ADVANCED TRACTOR-TRAILER EFFICIENCY TECHNOLOGY POTENTIAL IN THE 2020-2030 TIMEFRAME
REFERENCES
Amar, P. (2014) “SuperTruck. Development and demonstration of a fuel-efficient Class 8 highway vehicle. Vehicle systems” Presented at the U.S. Department of Energy Vehicle Technologies Office Annual Merit Review and Peer Evaluation Meeting. Project ID: VSS081. Washington D.C., June 2014.
Argonne National Laboratory (ANL). (2014) Autonomie. http://www.autonomie.net
Atkinson, C. (2013) Transient optimization of control and calibration for high efficiency engines. SAE Heavy Duty Vehicles Symposium, Technologies for High Efficiency and Fuel Economy, Rosemont, IL. September 29-30.
Bloch-Rubin, T., Gallo, J-B (2014) Transitioning SuperTruck technologies to commercial and military applications. High-Efficiency Truck Users Forum Webinar Series, June 24, 2014. http://www.calstart.org/projects/htuf/HTUF-Webinar-Series-Announcement/Transitioning-SuperTruck-Tech.aspx
Chebli E., Muller, M., Leweux, J., and Gorbach, A. (2013) Development of an exhaust-gas turbocharger for HD Daimler CV Engines. MTZ Worldwide, 74, 24-29.
Cooper, C., Kamakaté, F., Reinhart, T., Kromer, M., and Wilson, R. (2009) Reducing Heavy-Duty Long Haul Combination Truck Fuel Consumption and CO2 Emissions. Northeast States Center for a Clean Air Future, International Council on Clean Transportation, Southwest Research Institute, and TIAX. October.
Damon, K. and Koeberlain, D. (2014) DOE SuperTruck Program. Technology and system level demonstration of highly efficient and clean, diesel powered Class 8 trucks.” Presented at the U.S. Department of Energy Vehicle Technologies Office Annual Merit Review and Peer Evaluation Meeting. Project ID: ARRAVT081. Washington D.C. June 2014.
Davis, S.C., Diegel, S.W., and Boundy, R.G. (2013) Transportation Energy Data Book: Edition 32. Oak Ridge National Laboratory, U.S. Department of Energy. July.
Delgado, O. and Lutsey, N. (2014) The U.S. SuperTruck program: Expediting the develop-ment of advanced heavy-duty vehicle efficiency technologies. http://www.theicct.org/us-supertruck-program-expediting-development-advanced-hdv-efficiency-technologies.
Delorme, A., Karbowski, D., Vijayagopal, R., and Rousseau, A. (2010) Fuel consumption potential of medium- and heavy-duty applications. 25th World Battery, Hybrid and Fuel Cell Electric Vehicle Symposium & Exhibition. Shenzen, China. Novemeber 5-9.
Edwards, K.D. and Wagner, R.M. (2012) High-efficiency engine systems development and evaluation. U.S. Department of Energy Annual Merit Review. Crystal City, VA. May 16.
Fontaras, G. (2013) CO2 Emissions from heavy duty vehicles overview of VECTO’s inputs. http://www.theicct.org/events/hdv-efficiency-aligning-standards-internationally-part-i
Frost & Sullivan (2012) Strategic analysis of engine downsizing trends of North American heavy-duty truck manufacturers. Report NAAF-01. http://www.frost.com/prod/servlet/report-brochure.pag?id=NAAF-01-00-00-00
Gao, Z. and Daw, C.S. (2014) Advanced heavy-duty engine systems and emissions control modeling and analysis. U.S. Department of Energy Annual Merit Review. Washington, DC. June 16-20.
Gravel, R. (2013) SuperTruck: An opportunity to reduce GHG emissions while meeting service demands. Asilomar Biennial Conference. Pacific Grove, CA. August 6-9. www.its.ucdavis.edu/files/general/pdf/2013-08-21_Asilomar-2013-Gravel.pdf.

59
ICCT WHITE PAPER
Golsch, K. (2013) GHG Phase II regulation medium and heavy-duty vehicles. Duty cycle definition and driver modeling. Washington, DC. July 24.
Kappanna, H., Besch, M., Thiruvengadam, A., Delgado, O. et al. (2013) Greenhouse gas emissions of MY 2010 advanced heavy duty diesel engine measured over a cross-continental trip of USA. SAE Technical Paper 2013-24-0170.
Kies, A., Rexeis, M., Silberholz, G., Luz, R., and Hausberger, S. (2013) Options to consider future advanced fuel-saving technologies in the CO2 test procedure for HDV. http://www.theicct.org/implementing-fuel-saving-technologies-vecto-options-and-estimated-gains
Kromer, M.A., Bockholt, W.W., and Jackson, M.D. (2009) Assessment of fuel economy technologies for medium- and heavy-duty vehicles. TIAX, LLC Report. Cupertino, CA. July 31.
Lutsey, N. and Delgado, O. (2014) Advanced tractor-trailer efficiency technologies: Progress from the US SuperTruck program. 5th International CTI Conference. Troy, MI. September 10.
Lutsey, N., Langer, T., and Khan, S. (2014) Stakeholder workshop report on tractor-trailer efficiency technology in the 2015-2030 timeframe. Washington, DC. August. http://theicct.org/stakeholder-workshop-report-tractor-trailer-efficiency-technol-ogy-2015-2030
Lutsey, N., Brodrick, C., and Lipman, T. (2007) Analysis of potential fuel consumption and emissions reductions from fuel cell auxiliary power units (APUs) in long-haul trucks. Energy, 32, 12, 2428-2438.
National Research Council (NRC) (2012) Review of the 21st Century Truck Partnership, second report. The National Academies Press. Washington, D.C.
National Research Council (NRC) (2011) Assessment of fuel economy technologies for light-duty vehicles. The National Academies Press. Washington, D.C.
National Research Council (NRC) (2010) Technologies and approaches to reducing the fuel consumption of medium- and heavy-duty vehicles. The National Academies Press. Washington, D.C.
National Research Council (NRC) (2008) Review of the 21st Century Truck Partnership. The National Academies Press. Washington, D.C.
National Research Council (NRC) (2006) State and federal standards for mobile-sources emissions. Washington D.C.: National Academies Press.
North American Council for Freight Efficiency (NACFE) (2013) Confidence findings on the potential of 6x2 axles. http://nacfe.org/wp-content/uploads/2014/01/Trucking-Efficiency-6x2-Confidence-Report-FINAL-011314.pdf
R.L Polk & Co. (2013) 2012 US new commercial Class 3-8 heavy-duty vehicle registra-tions. Southfield, MI.
Reinhart, T. (2014) Technologies for MD/HD GHG and fuel efficiency. Presented at the National Academies of Science, Committee for Assessment of Technologies and Approaches for Reducing the Fuel Consumption of Medium- and Heavy-Duty Vehicles, Phase 2. April 2014.
Ricardo, Inc. (2011) Computer simulation of light-duty vehicle technologies for green-house gas emission reduction in the 2020-2025 timeframe. EPA-420-R-11-020. http://www.epa.gov/otaq/climate/documents/420r11020.pdf.

60
ADVANCED TRACTOR-TRAILER EFFICIENCY TECHNOLOGY POTENTIAL IN THE 2020-2030 TIMEFRAME
Rotz, D. and Ziegler, M. (2014) “SuperTruck Program. Vehicle project review. Class 8 truck freight efficiency improvement project.” Presented at the U.S. Department of Energy Vehicle Technologies Office Annual Merit Review and Peer Evaluation Meeting. Project ID: ARRAVT080. Washington D.C., June 2014.
Rousseau, A., Sharer, P., and Halbach, S. (2010) Using modeling and simulation to sup-port future medium and heavy duty regulations. 25th World Battery, Hybrid and Fuel Cell Electric Vehicle Symposium & Exhibition. Shenzen, China. November 5-9.
Scarcelli, J. (2014) Fuel efficiency for trailers. ACEEE/ICCT Workshop. Emerging tech-nologies for heavy-duty vehicle fuel efficiency. Washington DC. July 22.
Sharpe, B., Delgado, O., and Lutsey, N. (2014a). Benefit-cost analysis of integrating trailers into the Phase 2 heavy-duty vehicle efficiency regulation. http://www.theicct.org/integrating-trailers-hdv-regulation-benefit-cost-analysis.
Sharpe, B., Delgado, O., and Muncrief, R. (2014b). Comparative assessment of heavy-duty vehicle regulatory design options for U.S. greenhouse gas and efficiency regulation. http://www.theicct.org/us-phase2-hdv-regulation-design-options.
Sisken, K.and Rotz, D. (2012) Super Truck program: engine project review. Class 8 truck freight efficiency improvement project. DOE Merit Review. May 12.
Sovran, G. and Blaser, D. (2003) A contribution to understanding automotive fuel economy and its limits. Society of Automotive Engineers. 2003-01-2070.
Stanton, D.W. (2013) Systematic development of highly efficient and clean engines to meet future commercial vehicle greenhouse gas regulations. SAE Technical Paper 2013-01-2421.
Stoltz, T. and Dorobantu, M. (2014) Transmission potential to contribute to CO2 reduc-tion. 2020 and beyond line haul perspective. ACEEE/ICCT Workshop on emerging technologies for heavy-duty fuel efficiency. Washington, DC. July 22.
TA Engineering (2012) DOE SuperTruck program benefits analysis. Prepared for US Department of Energy and Argonne National Laboratory. December.
Thiruvengadam, A., Thiruvengadam, P., Pradhan, S., Besch, M., Carder, D., and Delgado, O. (2014) Heavy-duty vehicle diesel engine efficiency evaluation and energy audit. West Virginia University http://www.theicct.org/heavy-duty-vehicle-diesel-engine-efficiency-evaluation-and-energy-audit
US Department of Energy (US DOE) (2013) Trucks and heavy-duty vehicles technical requirements and gaps for lightweight and propulsion materials. Workshop report. Vehicle Technologies Office. February.
US Energy Information Administration (US EIA) (2013) Annual Energy Outlook 2013. http://www.eia.gov/forecasts/aeo/
US Environmental Protection Agency (US EPA) (2011) Greenhouse gas Emission Model (GEM) for medium- and heavy-duty vehicles. http://www.epa.gov/otaq/climate/gem.htm
US Environmental Protection Agency (US EPA) (2012) Regulatory impact analysis: Final rulemaking for 2017-2025 light-duty vehicle greenhouse gas emission standards and corporate average fuel economy standards. EPA-420-R-12-016. http://www.epa.gov/otaq/climate/documents/420r12016.pdf
US Environmental Protection Agency (US EPA) (2014a) Engine certification data. http://www.epa.gov/otaq/certdata.htm

61
ICCT WHITE PAPER
US Environmental Protection Agency (2014b) SmartWay carrier performance rankings. http://www.epa.gov/smartway/forpartners/performance.htm
US Environmental Protection Agency and National Highway Traffic Safety Administration (US EPA and NHTSA) (2011a) Greenhouse gas emissions standards and fuel efficiency standards for medium- and heavy-duty engines and vehicles. Federal Register, Vol. 76, No. 179, September 15.
US Environmental Protection Agency and National Highway Traffic Safety Administra-tion (US EPA and NHTSA) (2011b) Final rulemaking to establish greenhouse gas emissions standards and fuel efficiency standards for medium- and heavy-duty engines and vehicles. Regulatory impact analysis. EPA-420-R-11-901. August.
Wall, J. (2014) Cummins technologies for low emissions—Past and future. ASME 2014 Internal Combustion Engine Division Fall Technical Conference. Columbus, IN. October 20, 2014.
Walmart (2014) Truck Fleet. http://corporate.walmart.com/global-responsibility/environment-sustainability/truck-fleet
White House (2014) Remarks by the President on fuel efficiency standards of medium and heavy-duty vehicles. http://www.whitehouse.gov/the-press-office/2014/02/18/remarks-president-fuel-efficiency-standards-medium-and-heavy-duty-vehicl. February 18.