Remediation of Hydrocarbon Contaminated Soils - Oil&Gas Portal

Advanced Stripper Gas Produced Water Remediation
Quarterly Technical Report for the Period Ending 12/31/2002
Western SynCoal, LLC
Harry Bonner Roger Malmquist
January 2003
Grant DE-FG26-00NT40965
Western SynCoal, LLC 120 North Parkmont
Butte, MT 59701

TABLE OF CONTENTS
Disclaimer ...................................................................................................................1
Abstract .......................................................................................................................1
Executive Summary....................................................................................................2
Experimental ...............................................................................................................2 8/31/00 – 12/31/00 ..........................................................................................2 1/01/01 – 3/31/01 ............................................................................................4 4/1/01 – 6/30/01 ..............................................................................................7 7/1/01 – 9/30/01 ..............................................................................................7 Results and Discussion ...............................................................................................8
Conclusions.................................................................................................................9
Photographs...............................................................................................................11
LIST OF TABLES AND FIGURES
Preliminary Column Test ............................................................................................4
Second Test Series Summary Results.........................................................................5
Sparging Test Results .................................................................................................5
Sparging BTEX Removal ...........................................................................................5
Lifetime Efficiency of the Initial Test Column...........................................................6
Oil/Grease Composite Sampling Results....................................................................8
Trace Metal Reduction................................................................................................8
APPENDIX
Initial Column Test Notes and Results .....................................................................12
Preliminary Laboratory Results ................................................................................13
Second Test Series Results Using Initial Column Filters .........................................15
Second Test Series Results Comparison...................................................................16
Analyses for Samples Gathered July 18, 2001 .........................................................16
Disclaimer This report was prepared as an account of work sponsored by an agency of the United States Government. Neither the United States Government nor any agency thereof, nor any of their employees, makes any warranty, express or implied, or assumes any legal liability or responsibility for the accuracy, completeness, or usefulness of any information, apparatus, product, or process disclosed, or represents that its use would not infringe privately owned rights. Reference herein to any specific commercial product, process, or service by trade name, trademark, manufacturer, or otherwise does not constitute or imply its endorsement, recommendation, or favoring by the United States Government or any agency thereof. The views of authors expressed herein do not necessarily state or reflect those of the United States Government or any agency thereof. Abstract Natural gas and oil production from stripper wells also produces water contaminated with hydrocarbons, and in most locations, salts and trace elements. The hydrocarbons are not generally present in concentrations that allow the operator to economically recover these liquids. Produced liquids, (Stripper Gas Water) which are predominately water, present the operator with two options; purify the water to acceptable levels of contaminates, or pay for the disposal of the water. The project scope involves testing SynCoal as a sorbent to reduce the levels of contamination in stripper gas well produced water to a level that the water can be put to a productive use. Produced water is to be filtered with SynCoal, a processed sub-bituminous coal. It is expected that the surface area of and in the SynCoal would sorb the hydrocarbons and other contaminates and the effluent would be usable for agricultural purposes.
Test plan anticipates using two well locations described as being disparate in the level and type of contaminates present. The loading capacity and the rate of loading for the sorbent should be quantified in field testing situations which include unregulated and widely varying liquid flow rates. This will require significant flexibility in the initial stages of the investigation. The scope of work outlined below serves as the guidelines for the testing of SynCoal carbon product as a sorbent to remove hydrocarbons and other contaminants from the produced waters of natural gas wells. A maximum ratio of 1 lb carbon to 100 lbs water treated is the initial basis for economic design. While the levels of contaminants directly impact this ratio, the ultimate economics will be dictated by the filter servicing requirements. This experimental program is intended to identify those treatment parameters that yield the best technological practice for a given set of operating conditions. The goal of this research is to determine appropriate guidelines for field trials by accurately characterizing the performance of SynCoal over a full range of operating conditions.
Technical Report Period Ending December 31, 2002 1
Executive Summary Due to a number of factors including the sale of Western SynCoal’s parent company and continued transition efforts at NARCo related to its sale to Pan Canadian, no additional experimentation was completed during this period. The project team did meet, reviewed the data collected to date and developed a plan for the next phase of testing. Work on the project has been hampered by the transition of both NARCo and Western SynCoal into their new organizations after their respective divestiture from Montana Power’s group of companies. The overall program is achieving the desired removal of oils and greases from the produced waters but is suffering from inconsistent results leaving questions about the sampling and/or analyses. Work completed in during the first quarter of 2001 included a second series of filtration tests and air sparging of the filtered produced water to test the ability to further reduce lighter weight hydrocarbon contents. The actual filtration tests were run on twelve (12) selected days between February 1 and 20. The filtering process was typically operated for 6-8 hour period during each day with samples taken near the end of the processing period. These tests used the same SynCoal column that was originally employed in the November testing. The column pressure remained constant throughout the test and the flowrate was held steady at a little over two gallons per minute. Analyses indicated that the hydrocarbon retention was reduced substantially from the initial test although the water clarity
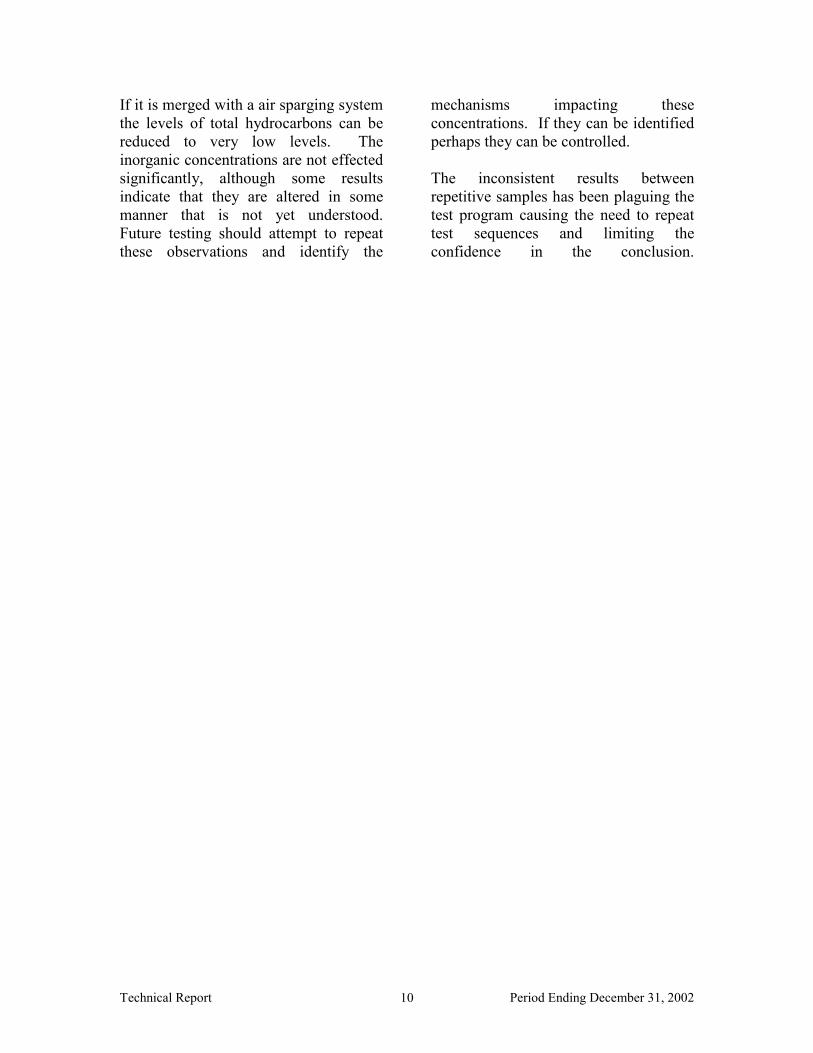
continued to appear greatly improved at the column discharge. Major ions and trace metals were largely unaffected during the testing. Air sparging of the filtered water showed remarkable removal of BTEX constituents and appears to be promising. Work completed from August 31, 2000 through December 31, 2000 included construction of test columns and support facilities to conduct the preliminary scoping trials to process produced water with SynCoal. The construction, installation, column packing and acquisition of water to be treated required three weeks of effort. The actual test runs ran two consecutive days of constant flow at a rate of approximately three gallons per minute. Three gallons per minute is similar to the rate of water production from the majority of wells in the Denver-Julesberg (D-J) basin. A single SynCoal column with 104 lbs of media was employed for this preliminary test. The column pressure remained constant throughout the test period. Analysis indicated good hydrocarbon retention on the SynCoal averaging 90% or better removal from the produced water. Water clarity was observed to be greatly improved at the column discharge. Major ions and trace metals were largely unaffected by exposure to SynCoal. Experimental 08/31/2000 through 12/31/2000 After a prototype “filter canister” was designed and fabricated from steel pipe, the project team decided to construct the test units from six inch PVC pipe and fittings and mount them on portable
Technical Report Period Ending December 31, 2002 2

angle iron skid mounted stands to simplify construction, modification and installation. NARCo’s Wattenberg shop and lab buildings were cleaned out to provide work space near the production field. In October 2000, fabrication of a two stage filter unit constructed of schedule 40 PVC pipe and related fittings was completed. Initially, some difficulty was encountered in preventing the migration of coal particles from the canister but after trying several screen / packing materials the filter retained the coal without losing particles with the water flow. The filter unit is mounted in an angle iron frame which can be easily be modified to provide an insulated shed around the filter unit with an access door in front. With the filter unit housed in an insulated structure coupled with a small catalytic heater, this unit should prove to be functional in winter as well as summer. The filter unit was installed into a single state separator at the Ione #11 production battery in an effort to evaluate the functionality of the unit under field conditions. While the unit was determined to be of the correct design for generic connection to a separator unit, the surge discharge pressure of the single stage unit at the Ione battery was greater than anticipated (+ 200 psig). In order to use the PVC
filter unit on locations with pressures in excess of 50 psig, a surge tank is needed to control the impact force of the water discharged to the filter unit. The filter unit was moved back to the Wattenberg location where it was installed with a surge feed tank, a pump to supply a steady flow to the filter and a “clean” water tank to characterize the filter. The initial testing was conducted on November 1 and 2, 2000 with water flowing through the filter for approximately 12 hours at a 3.0 to 3.5 gpm rate. Pre-treatment and post- treatment water samples were collected and analyzed. It appeared from visual observation of the pre-treatment and post-treatment water samples that the filter unit is removing insoluble and colloidal particulates in the produced water being treated. The analyses indicated that the oil and grease content was reduced from an average of over 36.8 mg/l to under 2.4 mg/l, approximately 93 percent reduction. Total suspended solids were reduced from 59 mg/l in the initial sample to under 20 mg/l on average. Copper and silver concentrations appeared to be reduced as well. Unfortunately, the sodium, calcium, magnesium and potassium concentrations did not appear to be affected.
Technical Report Period Ending December 31, 2002 3
Preliminary Column Test
0
10
20
30
40
50
60
70
0.00 2.00 4.00 6.00 8.00 10.00 12.00
Process Run Time
Oil & Grease Initial
Oil & Grease Filtered
TSS Initial
TSS Filtered
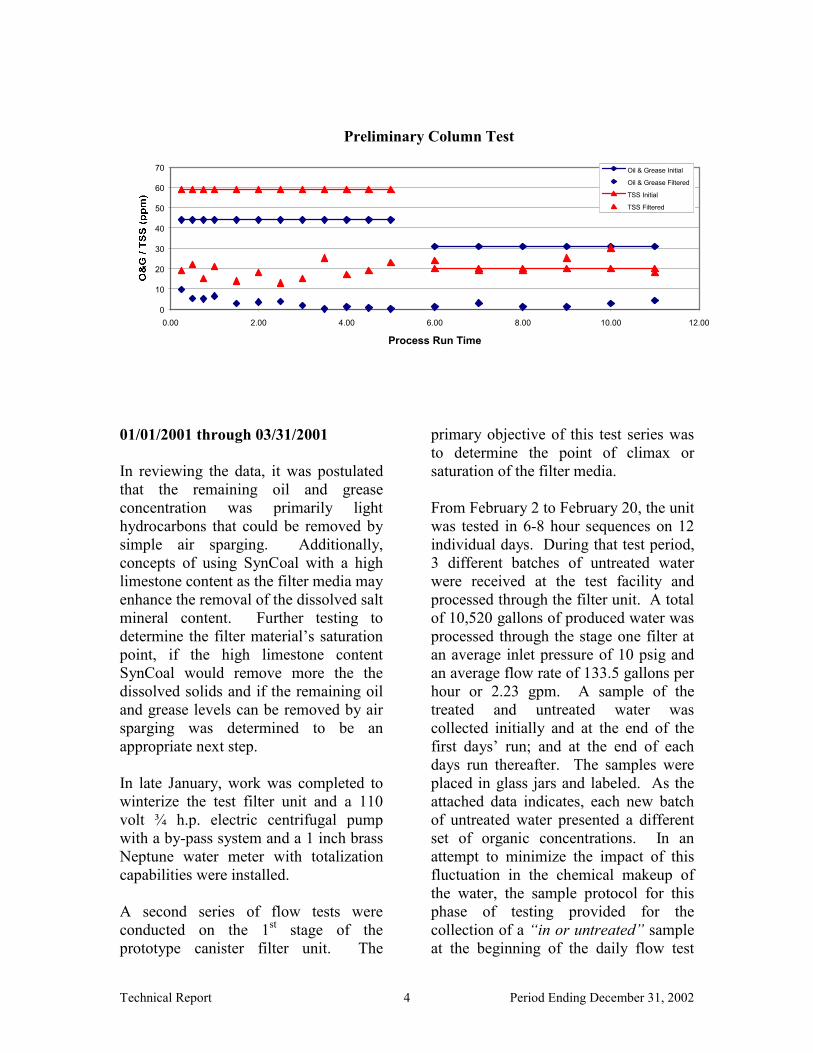
01/01/2001 through 03/31/2001 In reviewing the data, it was postulated that the remaining oil and grease concentration was primarily light hydrocarbons that could be removed by simple air sparging. Additionally, concepts of using SynCoal with a high limestone content as the filter media may enhance the removal of the dissolved salt mineral content. Further testing to determine the filter material’s saturation point, if the high limestone content SynCoal would remove more the the dissolved solids and if the remaining oil and grease levels can be removed by air sparging was determined to be an appropriate next step. In late January, work was completed to winterize the test filter unit and a 110 volt ¾ h.p. electric centrifugal pump with a by-pass system and a 1 inch brass Neptune water meter with totalization capabilities were installed. A second series of flow tests were conducted on the 1st stage of the prototype canister filter unit. The
primary objective of this test series was to determine the point of climax or saturation of the filter media. From February 2 to February 20, the unit was tested in 6-8 hour sequences on 12 individual days. During that test period, 3 different batches of untreated water were received at the test facility and processed through the filter unit. A total of 10,520 gallons of produced water was processed through the stage one filter at an average inlet pressure of 10 psig and an average flow rate of 133.5 gallons per hour or 2.23 gpm. A sample of the treated and untreated water was collected initially and at the end of the first days’ run; and at the end of each days run thereafter. The samples were placed in glass jars and labeled. As the attached data indicates, each new batch of untreated water presented a different set of organic concentrations. In an attempt to minimize the impact of this fluctuation in the chemical makeup of the water, the sample protocol for this phase of testing provided for the collection of a “in or untreated” sample at the beginning of the daily flow test
Technical Report Period Ending December 31, 2002 4
and an “out or treated” sample at the ending of the daily flow test. The water quality changed with each new batch of untreated water. The following is a brief summary of the organic concentration. As part of the second stage testing protocol, the treated water from the filter unit was placed in a 100 barrel steel
water tank recently removed from an operating production facility. The tank was not cleaned prior to use in this test in an effort to maintain realistic field conditions. An air sparging unit was fabricated and air at 20 psig continuous flow was sparged through approximately 80 barrels of treated water.
Second Test Series Summary Results
Sample ID Untreated Oil
& Grease ppm
Treated Oil & Grease
ppm
Removal Efficiency
Untreated BTEX ppm
Treated BTEX ppm
Removal Efficiency
Batch 1 Ave 126.5 63.5 50% 1055 908 14% Batch 2 Ave 228.6 234.8 -3% 2071 1685 19% Batch 3 Ave 5.6 7.9 -41% 4462 4820 -8%
Sparging Test Results
Sample ID Benzene (ppb)
Toluene (ppb)
Ethylbenzene (ppb)
m.p Xylene (ppb)
o-xylene (ppb)
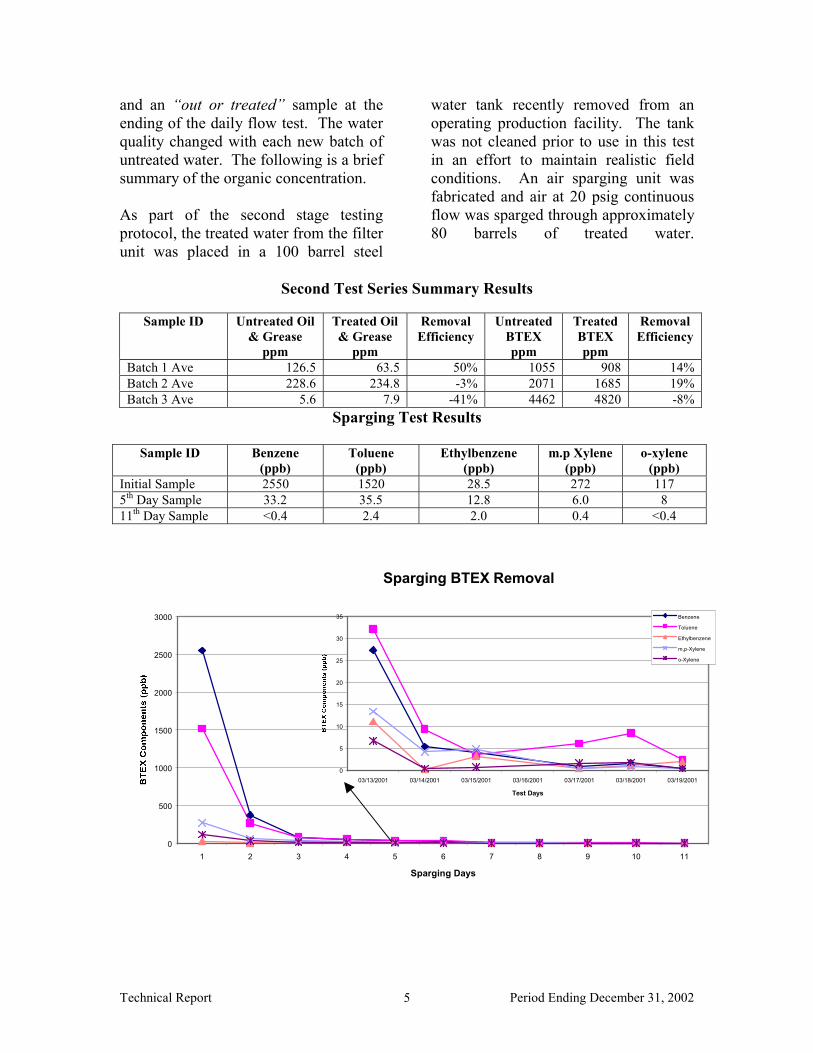
Initial Sample 2550 1520 28.5 272 117 5th Day Sample 33.2 35.5 12.8 6.0 8 11th Day Sample <0.4 2.4 2.0 0.4 <0.4
Sparging BTEX Removal
0
500
1000
1500
2000
2500
3000
1 2 3 4 5 6 7 8 9 10 11
Sparging Days
0
5
10
15
20
25
30
35
03/13/2001 03/14/2001 03/15/2001 03/16/2001 03/17/2001 03/18/2001 03/19/2001
Test Days
Benzene
Toluene
Ethylbenzene
m,p-Xylene
o-Xylene
Technical Report Period Ending December 31, 2002 5
This data indicates a dramatic decrease in the BTEX concentration of the treated water in a very short period of time and under less than ideal conditions (cold temperatures and limited venting of the tank). Air sparging was conducted from the morning of February 27 through the evening of March 3 when the air sparging operation was suspended after the 5th day pending test results. After receiving the data, the air sparging tests were continued beginning March 13, 2001 and concluding March 19, 2001. The second series of BTEX analysis on the 80 barrel batch of filtered and sparged produced water was completed and the results indicate that air sparging of the water filtered by a single stage of the test filter unit has removed all of the
enzene and o-xylene with only a trace of the toluene, ethylbenzene, and m,p,-xylene all concentrations of which are well below any action levels. The inorganic test data is confusing with regard to the effects the filtering process has on the inorganics in the water sampled. Of the salts, the sodium and potassium numbers are significant and appear to increase. Heavier metal seems to be decreased. The remaining inorganic numbers are insignificant. This raises the possibility that the treated water, once subject to air sparging to remove the VOC’s could be recycled as makeup water for frac jobs or drilling fluids.
Lifetime Efficiency of the Initial Test Column
Percent Oil Removal vs Gallons Treated
-60%
-40%
-20%
0%
20%
40%
60%
80%
100%
120%
0 2000 4000 6000 8000 10000 12000
Gallons Processed
Technical Report Period Ending December 31, 2002 6
4/1/2001 through 6/30/2001 Due to a number of factors including the sale of Western SynCoal’s parent company and continued transition efforts at NARCo related to its sale to Pan Canadian, no additional experimentation was completed during this period. The project team did meet and evaluate results to date. These efforts resulted in a plan for the next phase of testing which is anticipated to involve the following tasks: 1) Reloading the twin filter canisters
with SynCoal in the first stage canister and dolomitic SynCoal in the second stage canister.
2) The air sparge tank will be steam
cleaned to remove any historical oil/grease residues.
3) The produced water from a single
well unit will be used in this test protocol.
4) An initial water sample of the
untreated produced water will be collected and analyzed for inorganics, organics, TRPH, and BTEX concentrations.
5) The filter/sparge system will be set
up on a timer to operate 4 hours per 24 hour period. The flow rate will be established at 2 gallons/minute or 120 gallons/hr, or 480 gallons/day. Assuming an initial untreated volume of 80 bbls, the test will run for approximately 7 days.
6) At the end of the batch testing
period, the same analysis profile as is listed in “4” above will be run to
provide the treated numbers for each batch.
7) The test protocol will be repeated
with each 80 bbl. Batch of water taken from the designated well unit in an effort to determine the saturation point of the filter units. The marker to be used to determine the saturation point will be the TRPH analysis.
7/01/01 to 9/31/01 Test work this quarter focused on both sampling technique and preliminary evaluation of SynCoal tailings material to address inorganic contaminant reduction. A two column test apparatus was configured with 110 lbs of SynCoal Product in the first column and 120 lbs of SynCoal tails in the second column. SynCoal tailings contain partially calcined dolomites and stable massive pyrite, previously tested in weathering tests to exhibit a buffering capacity towards both pH and trace metals. Composite sampling was attempted to reduce the risk of previously encountered inconsistent results. The duration of the test was 6 hours at a feed rate of 3 gpm. The following graph shows the results from this sampling.
Technical Report Period Ending December 31, 2002 7
Oil/Grease Composite Sampling Results
020406080
100120140160180200
RunComp
1stHalf
2ndHalf
Oil/
Gre
ase,
ppm
FeedColumn 1Column 2
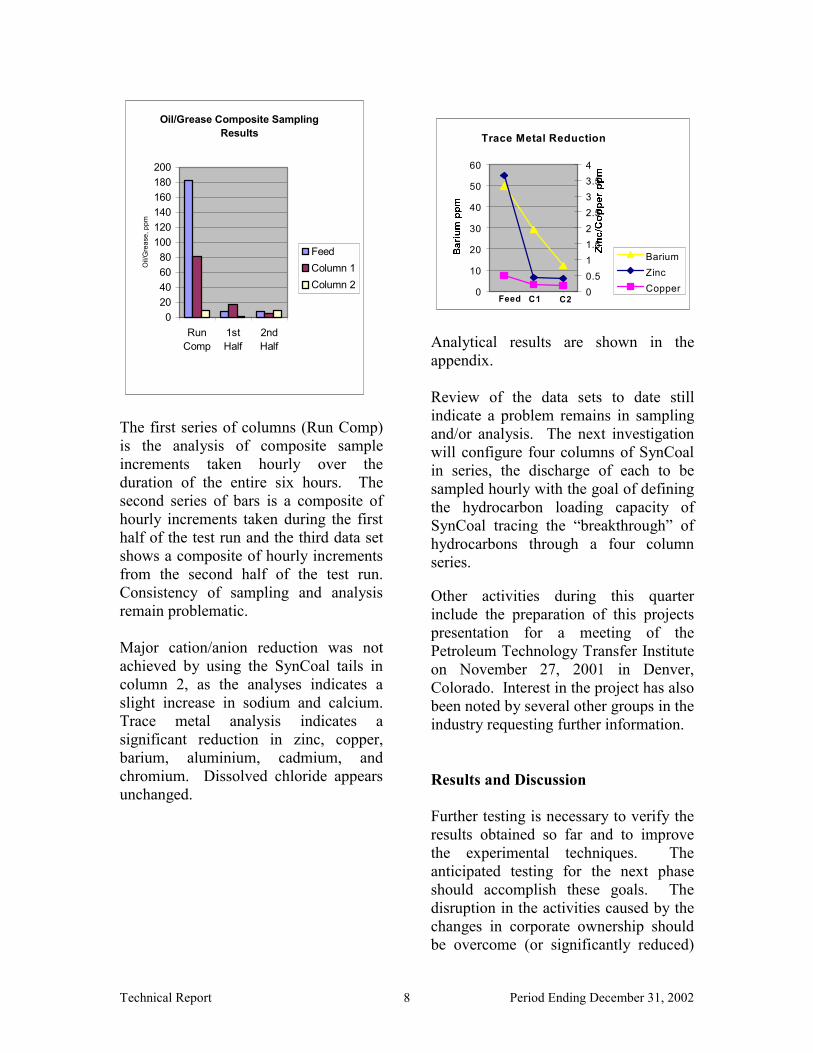
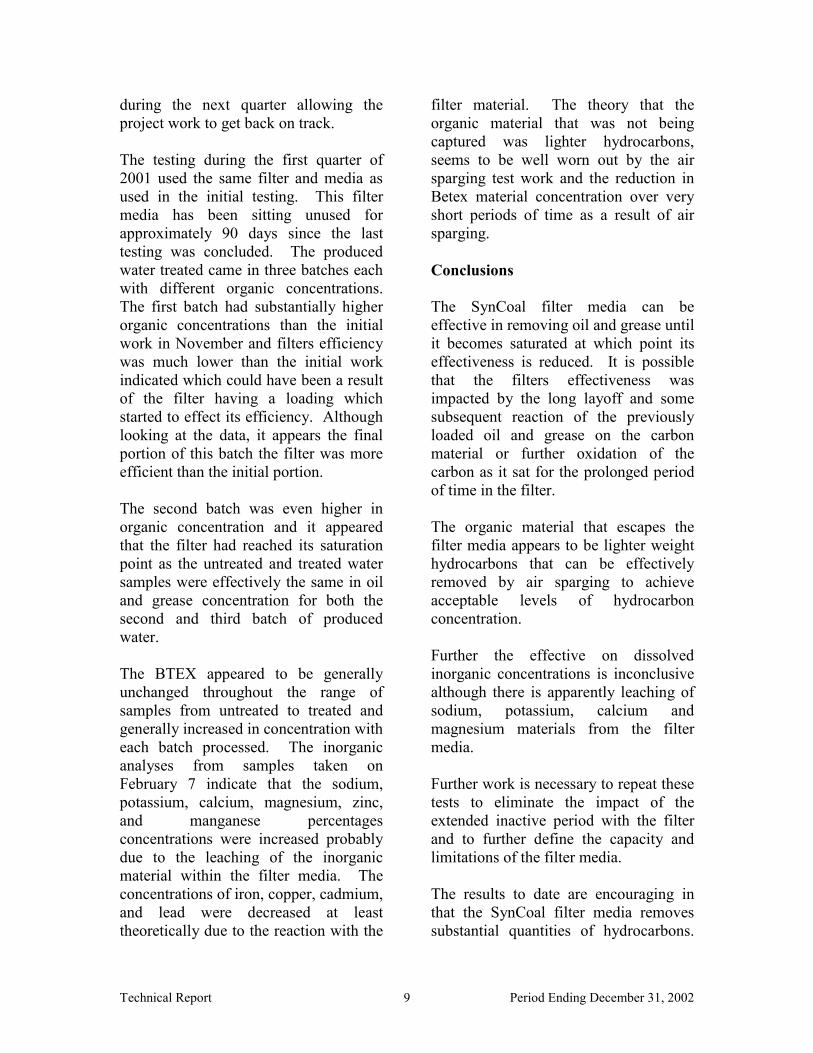
The first series of columns (Run Comp) is the analysis of composite sample increments taken hourly over the duration of the entire six hours. The second series of bars is a composite of hourly increments taken during the first half of the test run and the third data set shows a composite of hourly increments from the second half of the test run. Consistency of sampling and analysis remain problematic. Major cation/anion reduction was not achieved by using the SynCoal tails in column 2, as the analyses indicates a slight increase in sodium and calcium. Trace metal analysis indicates a significant reduction in zinc, copper, barium, aluminium, cadmium, and chromium. Dissolved chloride appears unchanged.
Trace Metal Reduction
0
10
20
30
40
50
60
1 2 3 00.511.522.533.54
BariumZincCopper
Feed C1 C2
Analytical results are shown in the appendix. Review of the data sets to date still indicate a problem remains in sampling and/or analysis. The next investigation will configure four columns of SynCoal in series, the discharge of each to be sampled hourly with the goal of defining the hydrocarbon loading capacity of SynCoal tracing the “breakthrough” of hydrocarbons through a four column series. Other activities during this quarter include the preparation of this projects presentation for a meeting of the Petroleum Technology Transfer Institute on November 27, 2001 in Denver, Colorado. Interest in the project has also been noted by several other groups in the industry requesting further information. Results and Discussion Further testing is necessary to verify the results obtained so far and to improve the experimental techniques. The anticipated testing for the next phase should accomplish these goals. The disruption in the activities caused by the changes in corporate ownership should be overcome (or significantly reduced)
Technical Report Period Ending December 31, 2002 8
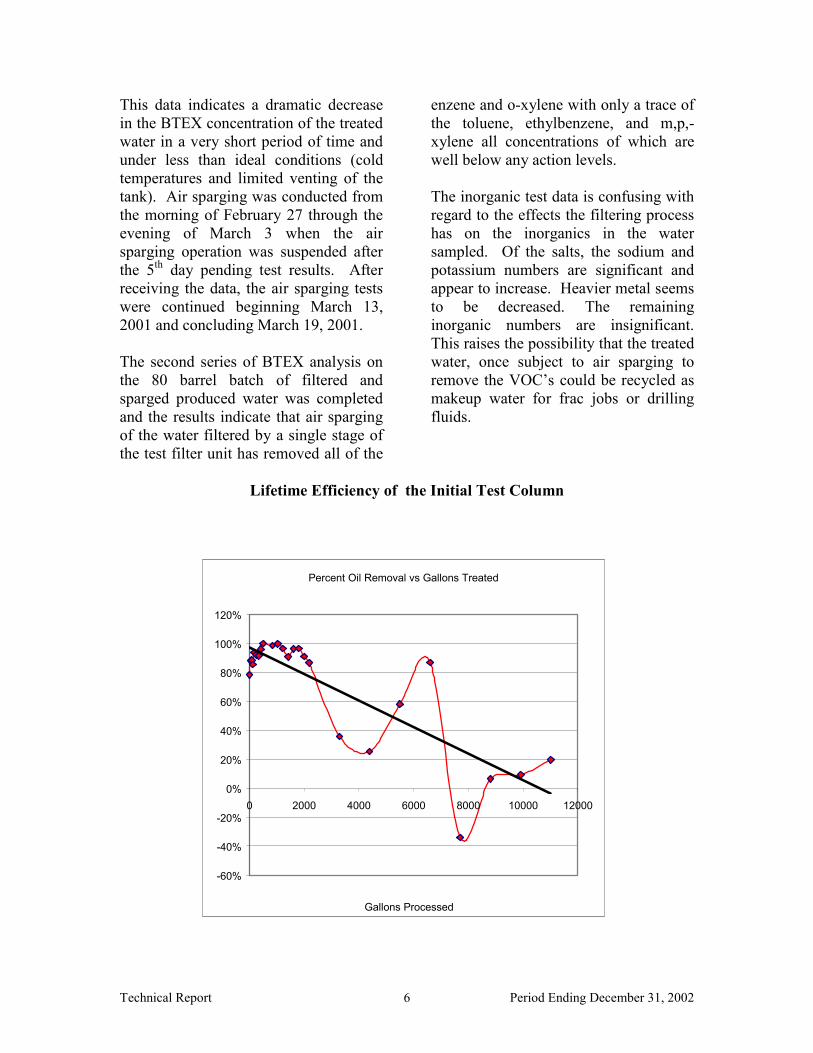
during the next quarter allowing the project work to get back on track. The testing during the first quarter of 2001 used the same filter and media as used in the initial testing. This filter media has been sitting unused for approximately 90 days since the last testing was concluded. The produced water treated came in three batches each with different organic concentrations. The first batch had substantially higher organic concentrations than the initial work in November and filters efficiency was much lower than the initial work indicated which could have been a result of the filter having a loading which started to effect its efficiency. Although looking at the data, it appears the final portion of this batch the filter was more efficient than the initial portion. The second batch was even higher in organic concentration and it appeared that the filter had reached its saturation point as the untreated and treated water samples were effectively the same in oil and grease concentration for both the second and third batch of produced water. The BTEX appeared to be generally unchanged throughout the range of samples from untreated to treated and generally increased in concentration with each batch processed. The inorganic analyses from samples taken on February 7 indicate that the sodium, potassium, calcium, magnesium, zinc, and manganese percentages concentrations were increased probably due to the leaching of the inorganic material within the filter media. The concentrations of iron, copper, cadmium, and lead were decreased at least theoretically due to the reaction with the
filter material. The theory that the organic material that was not being captured was lighter hydrocarbons, seems to be well worn out by the air sparging test work and the reduction in Betex material concentration over very short periods of time as a result of air sparging. Conclusions The SynCoal filter media can be effective in removing oil and grease until it becomes saturated at which point its effectiveness is reduced. It is possible that the filters effectiveness was impacted by the long layoff and some subsequent reaction of the previously loaded oil and grease on the carbon material or further oxidation of the carbon as it sat for the prolonged period of time in the filter. The organic material that escapes the filter media appears to be lighter weight hydrocarbons that can be effectively removed by air sparging to achieve acceptable levels of hydrocarbon concentration. Further the effective on dissolved inorganic concentrations is inconclusive although there is apparently leaching of sodium, potassium, calcium and magnesium materials from the filter media. Further work is necessary to repeat these tests to eliminate the impact of the extended inactive period with the filter and to further define the capacity and limitations of the filter media. The results to date are encouraging in that the SynCoal filter media removes substantial quantities of hydrocarbons.
Technical Report Period Ending December 31, 2002 9
If it is merged with a air sparging system the levels of total hydrocarbons can be reduced to very low levels. The inorganic concentrations are not effected significantly, although some results indicate that they are altered in some manner that is not yet understood. Future testing should attempt to repeat these observations and identify the
mechanisms impacting these concentrations. If they can be identified perhaps they can be controlled. The inconsistent results between repetitive samples has been plaguing the test program causing the need to repeat test sequences and limiting the confidence in the conclusion.
Technical Report Period Ending December 31, 2002 10
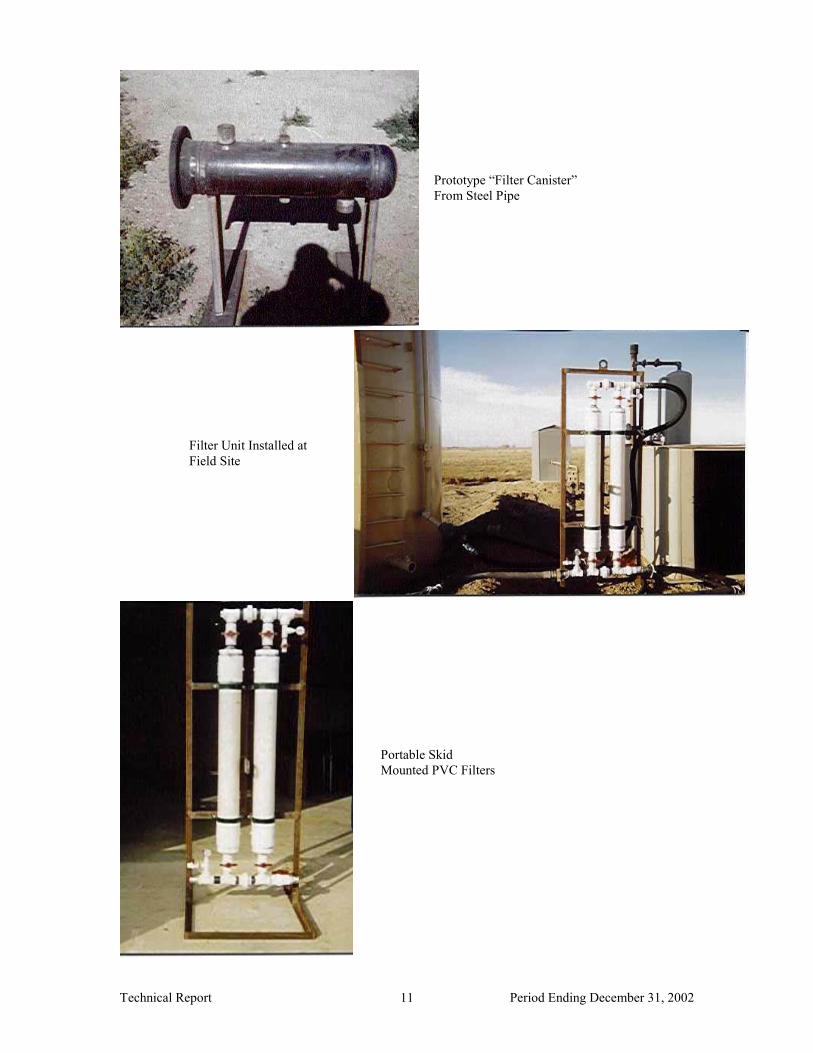
Prototype “Filter Canister” From Steel Pipe
Filter Unit Installed at Field Site
Portable Skid Mounted PVC Filters
Technical Report Period Ending December 31, 2002 11

Initial Column Test Notes & Results
Wattenburg Location SynCoal Water Treatment Test Series 1 Nov. 1, 00 Sample Log R Malmquist ID Interval Time pH Cond, ms/cmNotes NA-001A 0.00 11:30 6.5 2.84 Flow adjusted to 3.3gpm, inlet = 11psi NA-001B 0.00 6.5 Outlet = <3psi NA-001C 0.00 6.5 NA-002A 0.25 11:45 6.5 2.08 NA-002B 0.25 6.5 NA-002C 0.25 6.5 NA-003A 0.50 12:00 6.5 2.30 Flow 3.3gpm NA-003B 0.50 6.5 NA-003C 0.50 6.5 NA-004A 0.75 12:18 6.5 2.27 NA-004B 0.75 6.5 NA-004C 0.75 6.5 NA-005A 1.00 12:32 6.5 2.26 Inlet = 12.5psi Flow = 3.5gpm NA-005B 1.00 6.5 Outlet = <3psi NA-005C 1.00 6.5 NA-006A 1.50 13:00 6.5 2.27 NA-006B 1.50 6.5 NA-006C 1.50 6.5 NA-007A 2.00 13:35 6.5 2.25 NA-007B 2.00 6.5 NA-007C 2.00 6.5 NA-008A 2.50 14:00 6.5 2.30 Inlet = 15 psi NA-008B 2.50 6.5 Outlet = <3psi NA-008C 2.50 6.5 NA-009A 3.00 14:30 6.5 2.30 NA-009B 3.00 6.5 inlet = 16psi NA-009C 3.00 6.5 Flow = 2.1gpm NA-010A 3.50 15:00 6.5 2.39 SAMPLES: NA-010B 3.50 6.5 NA-010C 3.50 6.5 A: Preserved w/5ml HCl for Oil & Grease, NA-011A 4.00 15:30 6.5 2.32 1 liter sample NA-011B 4.00 6.5 B: Preserved w/1ml HNO3, filtered through NA-011C 4.00 6.5 0.45 micron filter for trace metal NA-012A 4.50 16:00 6.5 2.39 analysis. 250ml sample NA-012B 4.50 6.5 C: Unpreserved sample for TSS, cation NA-012C 4.50 6.5 anion balance, pH, Cond. 500ml NA-013A 5.00 16:30 6.5 2.39 NA-013B 5.00 6.5 Estimated gallons treated = 925NA-013C 5.00 6.5 Wattenburg Location SynCoal Water Treatment Test Series 1 Nov. 2, 00 NA-014A 0.00 10:00 6.5 2.42 NA-014A,B,C IS INFEED SAMPLE NA-014B 0.00 NA-014C 0.00 flow 3.0gpm
Technical Report Period Ending December 31, 2002 12

NA-015A 1.00 11:00 6.5 2.35 inlet 17psi NA-015B 1.00 NA-015C 1.00 NA-016A 2.00 12:00 6.5 2.30 flow 3.3gpm NA-016B 2.00 NA-016C 2.00 NA-017A 3.00 13:02 6.5 2.33 inlet 17psi NA-017B 3.00 NA-017C 3.00 NA-018A 4.00 14:00 6.5 2.34 NA-018B 4.00 NA-018C 4.00 inlet 17psi NA-019A 5.00 15:00 6.5 2.36 flow 3.3gpm NA-019B 5.00 NA-019C 5.00 NA-020A 6.00 16:00 Gallons Treated = 1152NA-020B 6.00 Previous day 925NA-020C 6.00 Total for single column to date = 2077
Preliminary Laboratory Results Lab Results Weld Laboratories, Inc. Lab No: 4287 Oil/Grease Ca Na Mg K SO4 Cl NA-001 FEED 44.0 231 5480 38.6 38.0 <1.0 4550NA-002 9.6 241 5380 30.0 36.0 <1.0 4550NA-003 5.3 239 5460 28.8 42.0 <1.0 4640NA-004 5.1 242 5610 112.6 40.8 <1.0 4290NA-005 6.4 223 5360 38.6 41.8 <1.0 4730NA-006 2.8 239 5570 29.0 47.8 <1.0 4640NA-007 3.5 238 5540 43.7 49.3 <1.0 4550NA-008 3.8 241 5330 31.1 45.3 <1.0 4550NA-009 1.8 246 5570 41.0 47.3 <1.0 4460NA-010 <0.1 238 5310 32.3 51.3 <1.0 4640NA-011 1.1 243 5230 35.1 48.5 <1.0 4640NA-012 0.7 250 5230 27.7 48.3 <1.0 4550NA-013 <0.1 245 5000 27.9 46.0 <1.0 4550NA-014 FEED 30.8 245 5040 25.8 48.5 <1.0 4460NA-015 1.1 245 5040 47.3 44.8 <1.0 4640NA-016 2.9 246 5120 89.3 51.0 <1.0 4460NA-017 1.2 242 5100 49.6 46.3 <1.0 4550NA-018 1.1 240 5020 36.5 48.5 <1.0 4550NA-019 2.8 245 5100 48.7 51.0 <1.0 4640NA-020 4.2 237 5120 59.2 48.0 <1.0 4550
Technical Report Period Ending December 31, 2002 13
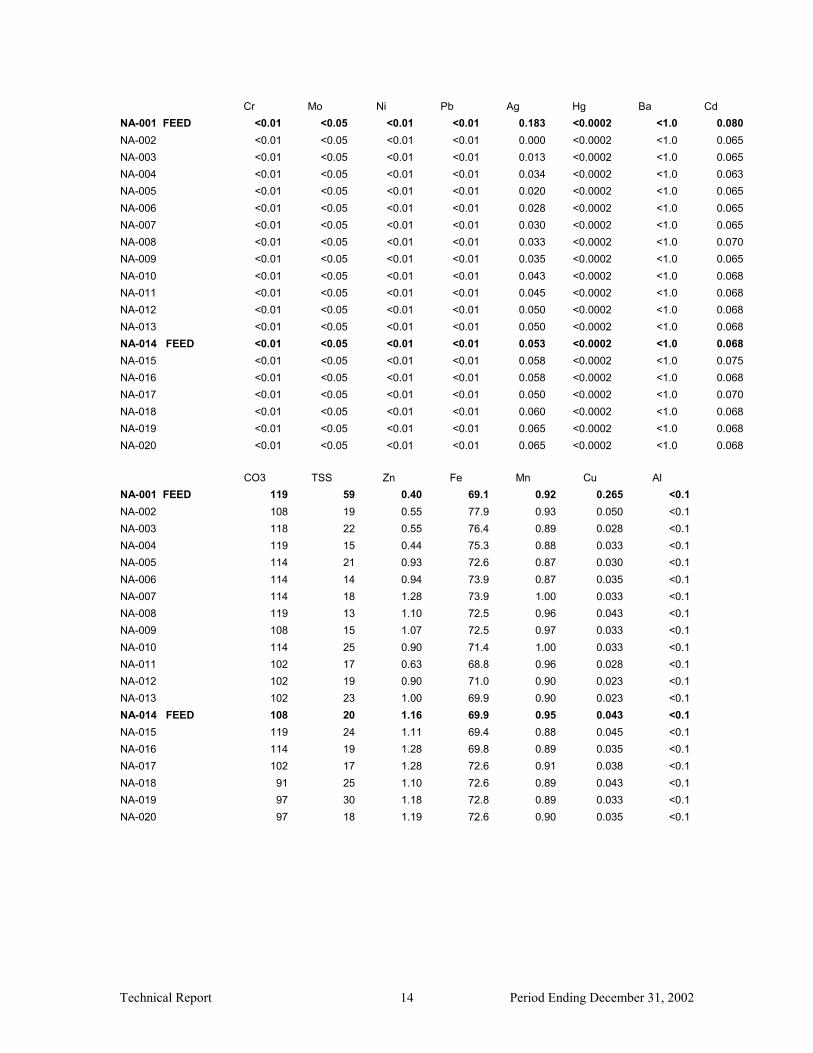
Cr Mo Ni Pb Ag Hg Ba Cd NA-001 FEED <0.01 <0.05 <0.01 <0.01 0.183 <0.0002 <1.0 0.080NA-002 <0.01 <0.05 <0.01 <0.01 0.000 <0.0002 <1.0 0.065NA-003 <0.01 <0.05 <0.01 <0.01 0.013 <0.0002 <1.0 0.065NA-004 <0.01 <0.05 <0.01 <0.01 0.034 <0.0002 <1.0 0.063NA-005 <0.01 <0.05 <0.01 <0.01 0.020 <0.0002 <1.0 0.065NA-006 <0.01 <0.05 <0.01 <0.01 0.028 <0.0002 <1.0 0.065NA-007 <0.01 <0.05 <0.01 <0.01 0.030 <0.0002 <1.0 0.065NA-008 <0.01 <0.05 <0.01 <0.01 0.033 <0.0002 <1.0 0.070NA-009 <0.01 <0.05 <0.01 <0.01 0.035 <0.0002 <1.0 0.065NA-010 <0.01 <0.05 <0.01 <0.01 0.043 <0.0002 <1.0 0.068NA-011 <0.01 <0.05 <0.01 <0.01 0.045 <0.0002 <1.0 0.068NA-012 <0.01 <0.05 <0.01 <0.01 0.050 <0.0002 <1.0 0.068NA-013 <0.01 <0.05 <0.01 <0.01 0.050 <0.0002 <1.0 0.068NA-014 FEED <0.01 <0.05 <0.01 <0.01 0.053 <0.0002 <1.0 0.068NA-015 <0.01 <0.05 <0.01 <0.01 0.058 <0.0002 <1.0 0.075NA-016 <0.01 <0.05 <0.01 <0.01 0.058 <0.0002 <1.0 0.068NA-017 <0.01 <0.05 <0.01 <0.01 0.050 <0.0002 <1.0 0.070NA-018 <0.01 <0.05 <0.01 <0.01 0.060 <0.0002 <1.0 0.068NA-019 <0.01 <0.05 <0.01 <0.01 0.065 <0.0002 <1.0 0.068NA-020 <0.01 <0.05 <0.01 <0.01 0.065 <0.0002 <1.0 0.068 CO3 TSS Zn Fe Mn Cu Al NA-001 FEED 119 59 0.40 69.1 0.92 0.265 <0.1NA-002 108 19 0.55 77.9 0.93 0.050 <0.1NA-003 118 22 0.55 76.4 0.89 0.028 <0.1NA-004 119 15 0.44 75.3 0.88 0.033 <0.1NA-005 114 21 0.93 72.6 0.87 0.030 <0.1NA-006 114 14 0.94 73.9 0.87 0.035 <0.1NA-007 114 18 1.28 73.9 1.00 0.033 <0.1NA-008 119 13 1.10 72.5 0.96 0.043 <0.1NA-009 108 15 1.07 72.5 0.97 0.033 <0.1NA-010 114 25 0.90 71.4 1.00 0.033 <0.1NA-011 102 17 0.63 68.8 0.96 0.028 <0.1NA-012 102 19 0.90 71.0 0.90 0.023 <0.1NA-013 102 23 1.00 69.9 0.90 0.023 <0.1NA-014 FEED 108 20 1.16 69.9 0.95 0.043 <0.1NA-015 119 24 1.11 69.4 0.88 0.045 <0.1NA-016 114 19 1.28 69.8 0.89 0.035 <0.1NA-017 102 17 1.28 72.6 0.91 0.038 <0.1NA-018 91 25 1.10 72.6 0.89 0.043 <0.1NA-019 97 30 1.18 72.8 0.89 0.033 <0.1NA-020 97 18 1.19 72.6 0.90 0.035 <0.1
Technical Report Period Ending December 31, 2002 14

Second Test Series Results Using Initial Column Filters Laboratory No. 4372 First Batch Of Produced Water Date Sampled: 2/1-7/2001 Date Received: 2/13/01
ppb ppm Sample ID Benzene Toluene Ethylbenzene M,p-Xylene o-Xylene Oil & Grease
01-Feb I 100 121 4.5 23.4 12.3 18201-Feb O 35.5 46.2 6.5 8 2.4 11702-Feb I 404 583 8.7 118 50.9 10602-Feb O 603 707 7.6 109 48.9 79.205-Feb I 499 602 7.4 101 45.4 10005-Feb O 517 501 55.2 69 35.1 4206-Feb I 651 723 8.5 107 49.8 11806-Feb O 357 414 4.5 70.8 34.2 15.7
Laboratory No. 4372 Second Batch Of Produced Water Date Sampled: 2/7-12/2001 Date Received: 2/13/01
ppb ppm Sample ID Benzene Toluene Ethylbenzene M,p-Xylene o-Xylene Oil & Grease
07-Feb I 448 368 24.1 174 81.8 25807-Feb O 362 225 6.6 51.6 25.4 40307-Feb I 493 429 26.2 186 79.6 17907-Feb O 466 296 10.6 73.6 37.2 14008-Feb I 1530 1140 63.4 302 126 25508-Feb O 916 670 32.7 201 87.6 23909-Feb I 624 360 14 87.8 42.8 27609-Feb O 1350 865 30.2 189 87.9 25112-Feb I 2010 1260 47.2 306 134 17512-Feb O 1300 847 28.4 182 83.4 141
Laboratory No. 4383 Third Batch Of Produced Water Date Sampled: 2/13-20/2001 Date Received: 2/22/01
ppb ppm Sample ID Benzene Toluene Ethylbenzene M,p-Xylene o-Xylene Oil & Grease
13-Feb I 1260 424 9.9 66.8 35.6 12.613-Feb O 1330 538 8.9 66.6 32.8 17.113-Feb I 1950 832 13.6 111 51.9 4.113-Feb O 1890 745 10.9 85.2 41.7 8.314-Feb I 1470 617 10.5 81.4 39.1 4.214-Feb O 2740 1280 22.2 172 78.6 3.819-Feb I 4150 2720 55.7 471 190 4.319-Feb O 4560 2640 50.1 422 181 8.220-Feb I 4240 2770 57.9 484 197 2.820-Feb O 4010 2540 50.5 424 178 2
Technical Report Period Ending December 31, 2002 15
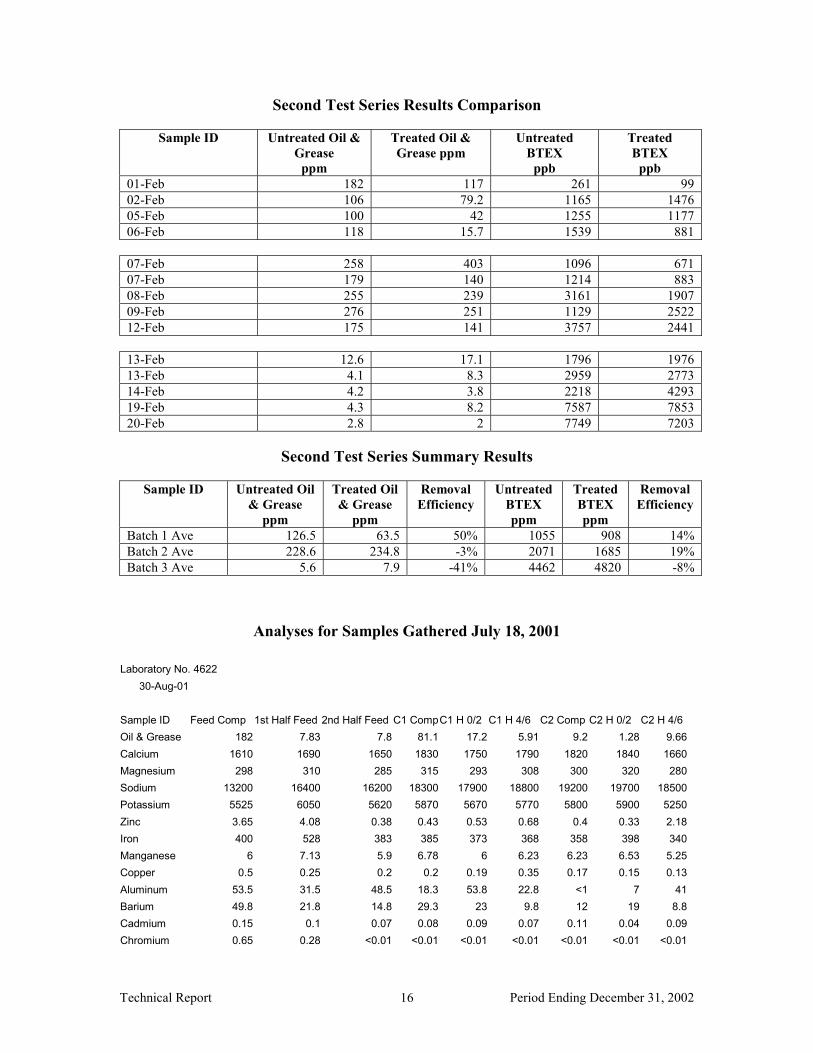
Second Test Series Results Comparison
Sample ID Untreated Oil & Grease
ppm
Treated Oil & Grease ppm
Untreated BTEX
ppb
Treated BTEX
ppb 01-Feb 182 117 261 99 02-Feb 106 79.2 1165 1476 05-Feb 100 42 1255 1177 06-Feb 118 15.7 1539 881 07-Feb 258 403 1096 671 07-Feb 179 140 1214 883 08-Feb 255 239 3161 1907 09-Feb 276 251 1129 2522 12-Feb 175 141 3757 2441 13-Feb 12.6 17.1 1796 1976 13-Feb 4.1 8.3 2959 2773 14-Feb 4.2 3.8 2218 4293 19-Feb 4.3 8.2 7587 7853 20-Feb 2.8 2 7749 7203
Second Test Series Summary Results
Sample ID Untreated Oil
& Grease ppm
Treated Oil & Grease
ppm
Removal Efficiency
Untreated BTEX ppm
Treated BTEX ppm
Removal Efficiency
Batch 1 Ave 126.5 63.5 50% 1055 908 14% Batch 2 Ave 228.6 234.8 -3% 2071 1685 19% Batch 3 Ave 5.6 7.9 -41% 4462 4820 -8%
Analyses for Samples Gathered July 18, 2001 Laboratory No. 4622
30-Aug-01 Sample ID Feed Comp 1st Half Feed 2nd Half Feed C1 CompC1 H 0/2 C1 H 4/6 C2 Comp C2 H 0/2 C2 H 4/6 Oil & Grease 182 7.83 7.8 81.1 17.2 5.91 9.2 1.28 9.66Calcium 1610 1690 1650 1830 1750 1790 1820 1840 1660Magnesium 298 310 285 315 293 308 300 320 280Sodium 13200 16400 16200 18300 17900 18800 19200 19700 18500Potassium 5525 6050 5620 5870 5670 5770 5800 5900 5250Zinc 3.65 4.08 0.38 0.43 0.53 0.68 0.4 0.33 2.18Iron 400 528 383 385 373 368 358 398 340Manganese 6 7.13 5.9 6.78 6 6.23 6.23 6.53 5.25Copper 0.5 0.25 0.2 0.2 0.19 0.35 0.17 0.15 0.13Aluminum 53.5 31.5 48.5 18.3 53.8 22.8 <1 7 41Barium 49.8 21.8 14.8 29.3 23 9.8 12 19 8.8Cadmium 0.15 0.1 0.07 0.08 0.09 0.07 0.11 0.04 0.09Chromium 0.65 0.28 <0.01 <0.01 <0.01 <0.01 <0.01 <0.01 <0.01
Technical Report Period Ending December 31, 2002 16

Molybdenum <0.05 <0.05 <0.05 <0.05 <0.05 <0.05 <0.05 <0.05 <0.05Nickel 1.38 1.43 1.25 1.3 1.23 1.1 1.08 1.13 1.13Lead <0.01 <0.01 <0.01 <0.01 <0.01 <0.01 <0.01 <0.01 <0.01Silver 0.063 0.065 <0.01 <0.01 <0.01 <0.01 <0.01 <0.01 <0.01Mercury <0.0002 <0.0002 <0.0002 <0.0002 <0.0002 <0.0002 <0.0002 <0.0002 <0.0002Chloride 13500 13200 12300 13200 12900 13800 12900 13200 14700
Technical Report Period Ending December 31, 2002 17