
Advanced Statistics · Advanced Statistics Basics/Descriptive Statistics Scales of measurement...
40
Advanced Statistics Advanced Statistics Janette Walde [email protected] Department of Statistics University of Innsbruck
Transcript of Advanced Statistics · Advanced Statistics Basics/Descriptive Statistics Scales of measurement...
Advanced Statistics
Advanced Statistics
Janette Walde
Department of StatisticsUniversity of Innsbruck
Advanced Statistics
ContentsIntroduction
Basics/Descriptive StatisticsScales of measurementGraphical exploration of dataDescriptive characteristics for a variable
EstimationCharacteristics of an estimatorConfidence interval
Statistical hypothesis testingStatistical testing principleTesting errorsPower analysis
Why multivariate analysis?
Advanced Statistics
Introduction
“We are pattern-seeking story-telling animals.”(Edward Leamer)
”Statistics does not hand truth to the user on asilver platter. However, statistics confinesarbitrariness and provides comprehensibleconclusions.”
“Es gibt keine Tatsachen, es gibt nur
Interpretationen.” (Friedrich Nietzsche)
Advanced Statistics
Introduction
Preliminary comments1. You will learn to apply statistical tools correctly,
interpret the findings appropriately and get anidea about the possibilities of analyzingresearch questions employing statistics.
2. It is not possible and not worthwhile to learnall statistical methods in such a course.However, this course is successful if it enablesyou to improve your knowledge in statisticalmethods on your own. Therefore this coursegives you profound knowledge about somestatistical analyzing tools and shows you thecorrect application of them.
Advanced Statistics
Introduction
Preliminary comments
3. Although knowing the most sophisticatedanalyzing instruments one may be confrontedwith limits in getting results or findingappropriate interpretations or applying tools inthe given framework. This has to be accepted(“If we torture the data long enough, they will
confess.”).
4. Be aware: Never confuse statistical significancewith biological significance.
Advanced Statistics
Basics/Descriptive Statistics
Scales of measurement
Scales of measurement1. Nominal Scale. Nominal data are attributes like
sex or species, and represent measurement atits weakest level. We can determine if oneobject is different from another, and the onlyformal property of nominal scale data isequivalence.
2. Ranking Scale. Some biological variablescannot be measured on a numerical scale, butindividuals can be ranked in relation to oneanother. Two formal properties occur inranking data: equivalence and greater than.

Advanced Statistics
Basics/Descriptive Statistics
Scales of measurement
Scales of measurement
3. Interval and Ratio Scales. Interval and ratioscales have all the characteristics of the rankingscale, but we know the distances between theclasses. If we have a true zero point, we have aratio scale of measurement.
Advanced Statistics
Basics/Descriptive Statistics
Graphical exploration of data
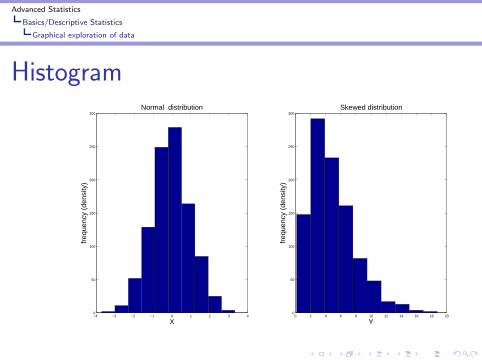
Histogram
−4 −3 −2 −1 0 1 2 3 40
50
100
150
200
250
300
X
Normal distribution
freq
uenc
y (d
ensi
ty)
0 2 4 6 8 10 12 14 16 18 200
50
100
150
200
250
300
Y
Skewed distribution
freq
uenc
y (d
ensi
ty)
Advanced Statistics
Basics/Descriptive Statistics
Graphical exploration of data
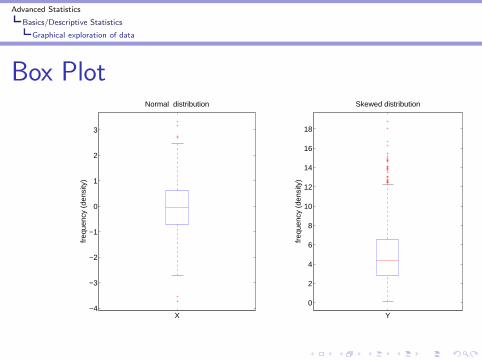
Box Plot
X−4
−3
−2
−1
0
1
2
3
Normal distribution
freq
uenc
y (d
ensi
ty)
Y
0
2
4
6
8
10
12
14
16
18
Skewed distribution
freq
uenc
y (d
ensi
ty)
Advanced Statistics
Basics/Descriptive Statistics
Graphical exploration of data
Q-Q Plot
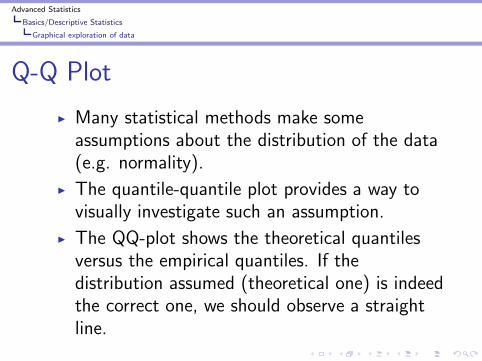
I Many statistical methods make someassumptions about the distribution of the data(e.g. normality).
I The quantile-quantile plot provides a way tovisually investigate such an assumption.
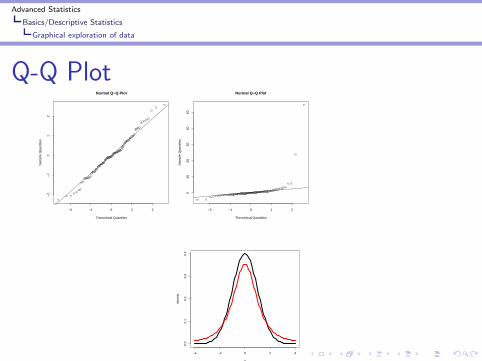
I The QQ-plot shows the theoretical quantilesversus the empirical quantiles. If thedistribution assumed (theoretical one) is indeedthe correct one, we should observe a straightline.
Advanced Statistics
Basics/Descriptive Statistics
Graphical exploration of data
Q-Q Plot
−2 −1 0 1 2
−2
−1
01
2
Normal Q−Q Plot
Theoretical Quantiles
Sam
ple
Qua
ntile
s
−2 −1 0 1 2
010
2030
4050
Normal Q−Q Plot
Theoretical Quantiles
Sam
ple
Qua
ntile
s
−4 −2 0 2 4
0.0
0.1
0.2
0.3
0.4
x
dens
ity
Advanced Statistics
Basics/Descriptive Statistics
Descriptive characteristics for a variable
Summary Statistic
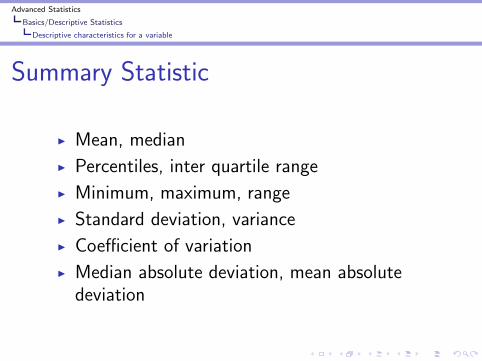
I Mean, median
I Percentiles, inter quartile range
I Minimum, maximum, range
I Standard deviation, variance
I Coefficient of variation
I Median absolute deviation, mean absolutedeviation
Advanced Statistics
Estimation
Fundamental concepts
Populations must be defined at the start of anystudy and this definition should include the spatialand temporal limits to the inference. The formalstatistical inference is restricted to these limits.
Possibility of drawing samples randomly.
Population parameters are considered to be fixedbut unknown values (in contrast to the Bayesianapproach).
Advanced Statistics
Estimation
Characteristics of an estimator
Characteristics of an estimatorA good estimator of a population parameter shouldhave the following characteristics:
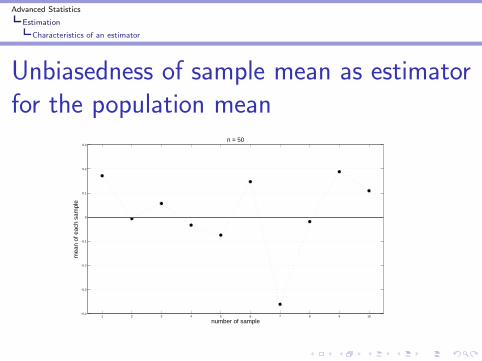
I The estimator should be unbiased, meaningthat the expected value of the sample statistic(the mean of its probability distribution) shouldequal the parameter.
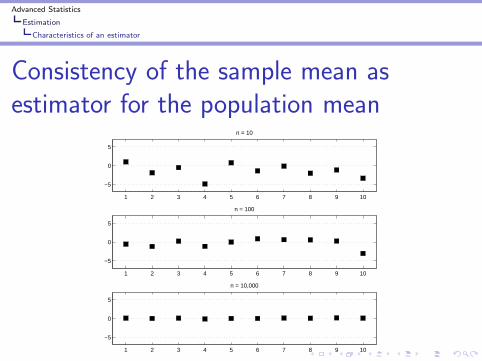
I It should be consistent so as the sample sizeincreases then the estimator will get closer tothe population parameter.
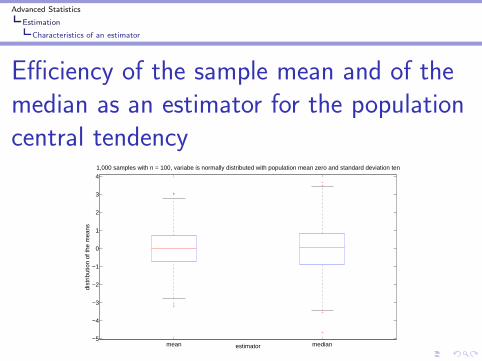
I It should be efficient, meaning it has the lowestvariance among all competing estimators.
Advanced Statistics
Estimation
Characteristics of an estimator
Unbiasedness of sample mean as estimatorfor the population mean
1 2 3 4 5 6 7 8 9 10−0.4
−0.3
−0.2
−0.1
0
0.1
0.2
0.3
number of sample
mea
n of
eac
h sa
mpl
e
n = 50
Advanced Statistics
Estimation
Characteristics of an estimator
Consistency of the sample mean asestimator for the population mean
1 2 3 4 5 6 7 8 9 10
−5
0
5
n = 10
1 2 3 4 5 6 7 8 9 10
−5
0
5
n = 100
1 2 3 4 5 6 7 8 9 10
−5
0
5
n = 10,000
Advanced Statistics
Estimation
Characteristics of an estimator
Efficiency of the sample mean and of themedian as an estimator for the populationcentral tendency
mean median−5
−4
−3
−2
−1
0
1
2
3
4
estimator
dist
ribut
ion
of th
e m
eans
1,000 samples with n = 100, variabe is normally distributed with population mean zero and standard deviation ten
Advanced Statistics
Estimation
Confidence interval
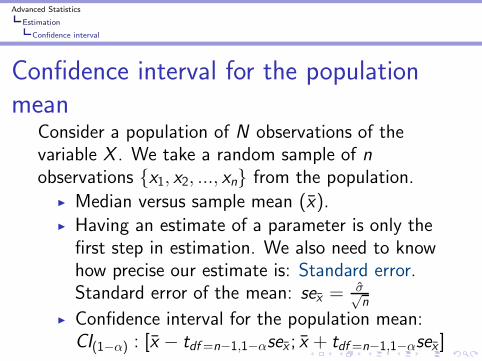
Confidence interval for the populationmean
Consider a population of N observations of thevariable X . We take a random sample of nobservations {x1, x2, ..., xn} from the population.
I Median versus sample mean (x̄).I Having an estimate of a parameter is only thefirst step in estimation. We also need to knowhow precise our estimate is: Standard error.Standard error of the mean: sex̄ =
σ̂√n
I Confidence interval for the population mean:CI(1−α) : [x̄ − tdf=n−1,1−αsex̄ ; x̄ + tdf=n−1,1−αsex̄ ]
Advanced Statistics
Estimation
Confidence interval
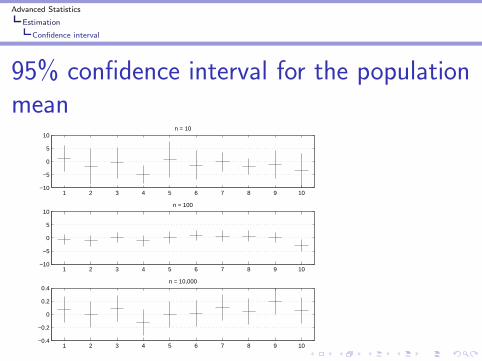
95% confidence interval for the populationmean
1 2 3 4 5 6 7 8 9 10−10
−5
0
5
10n = 10
1 2 3 4 5 6 7 8 9 10−10
−5
0
5
10n = 100
1 2 3 4 5 6 7 8 9 10−0.4
−0.2
0
0.2
0.4n = 10,000
Advanced Statistics
Statistical hypothesis testing
Statistical testing principle
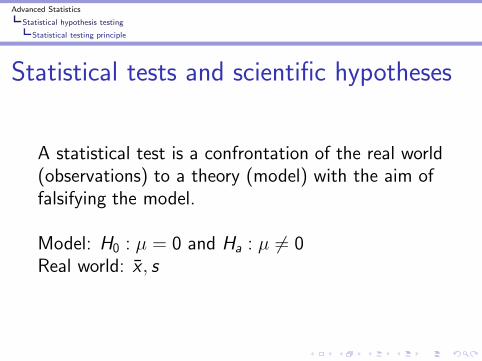
Statistical tests and scientific hypotheses
A statistical test is a confrontation of the real world(observations) to a theory (model) with the aim offalsifying the model.
Model: H0 : µ = 0 and Ha : µ 6= 0Real world: x̄ , s
Advanced Statistics
Statistical hypothesis testing
Statistical testing principle
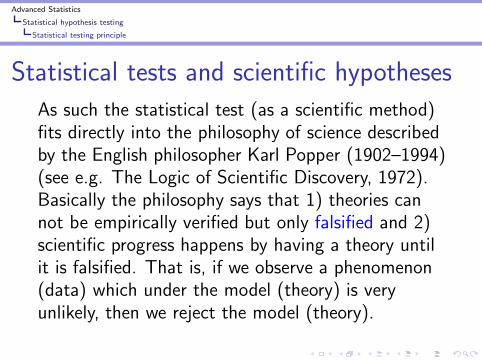
Statistical tests and scientific hypotheses
As such the statistical test (as a scientific method)fits directly into the philosophy of science describedby the English philosopher Karl Popper (1902–1994)(see e.g. The Logic of Scientific Discovery, 1972).Basically the philosophy says that 1) theories cannot be empirically verified but only falsified and 2)scientific progress happens by having a theory untilit is falsified. That is, if we observe a phenomenon(data) which under the model (theory) is veryunlikely, then we reject the model (theory).
Advanced Statistics
Statistical hypothesis testing
Statistical testing principle
Statistical tests and scientific hypotheses”No amount of experimentation can ever prove me right; a
single experiment can prove me wrong.” (Albert Einstein)
In other words, experiments can mainly be used forfalsifying a scientific hypothesis – never for provingit! When we have a scientific theory, we conduct anexperiment in order to falsify it. Therefore, thestrong conclusion arising from an experiment iswhen a hypothesis is rejected. Accepting (moreprecisely – not rejecting) a hypothesis is not a verystrong conclusion (maybe acceptance is simply dueto that the experiment is too small).
Advanced Statistics
Statistical hypothesis testing
Statistical testing principle
ExampleSuppose we have a coin, and that our hypothesis isthat the coin is fair, i.e. that P(head) = P(tail) =1/2. Suppose we toss a coin n = 25 times andobserve 21 heads. The probability of actuallyobserving these data under the model is P(21 heads,4 tails) = 0.0004. It is a very unlikely (but possible)event to see such data if the model is true. In thisfalsification process we employ the interpretationprinciple of statistics:
Unlikely events do not occur...
Advanced Statistics
Statistical hypothesis testing
Statistical testing principle
Statistical tests and scientific hypotheses
If we do not employ this principle we can never sayanything at all on the basis of statistics(observations): An opponent can always claim thatthe present observations just are “an unfortunateoutcome” which - no matter how unlikely they are -are possible.
Advanced Statistics
Statistical hypothesis testing
Statistical testing principle
Statistical tests and scientific hypotheses
In practice the statistical interpretation principleneeds more structure:
I In a large sample space, all possible outcomeswill have a very small probability, so it will beunlikely to have the data one has.
I In addition there is also the question abouthow small a probability is needed in order toclassify data as being unlikely.
I Concepts of p-value and significance level α.
Advanced Statistics
Statistical hypothesis testing
Testing errors
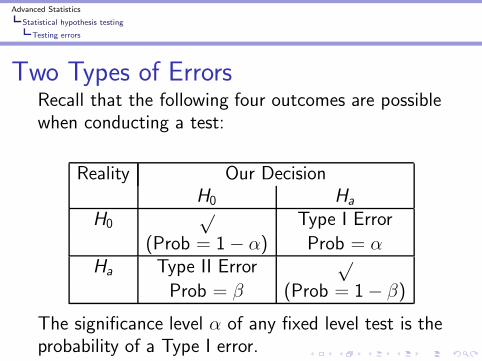
Two Types of ErrorsRecall that the following four outcomes are possiblewhen conducting a test:
Reality Our DecisionH0 Ha
H0√
Type I Error
(Prob = 1− α) Prob = αHa Type II Error
√Prob = β (Prob = 1− β)
The significance level α of any fixed level test is theprobability of a Type I error.
Advanced Statistics
Statistical hypothesis testing
Testing errors
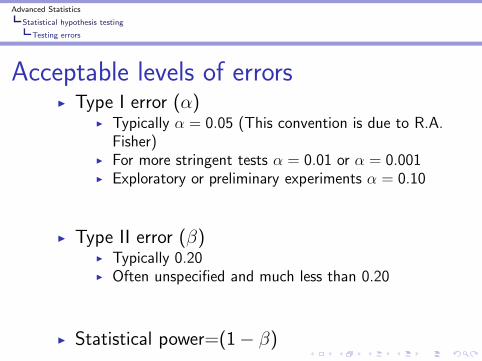
Acceptable levels of errorsI Type I error (α)
I Typically α = 0.05 (This convention is due to R.A.Fisher)
I For more stringent tests α = 0.01 or α = 0.001I Exploratory or preliminary experiments α = 0.10
I Type II error (β)I Typically 0.20I Often unspecified and much less than 0.20
I Statistical power=(1− β)
Advanced Statistics
Statistical hypothesis testing
Power analysis
The power of a statistical test
The power of a significance test measures its abilityto detect an alternative hypothesis.The power against a specific alternative iscalculated as the probability that the test will rejectH0 when that specific alternative is true.
Advanced Statistics
Statistical hypothesis testing
Power analysis
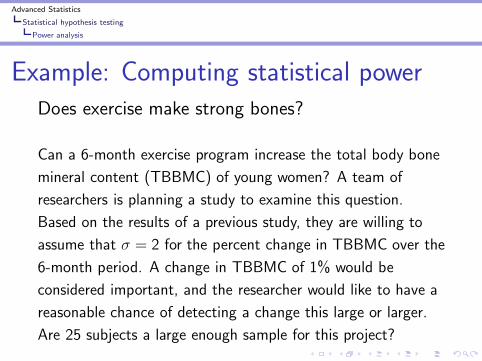
Example: Computing statistical powerDoes exercise make strong bones?
Can a 6-month exercise program increase the total body bone
mineral content (TBBMC) of young women? A team of
researchers is planning a study to examine this question.
Based on the results of a previous study, they are willing to
assume that σ = 2 for the percent change in TBBMC over the
6-month period. A change in TBBMC of 1% would be
considered important, and the researcher would like to have a
reasonable chance of detecting a change this large or larger.
Are 25 subjects a large enough sample for this project?
Advanced Statistics
Statistical hypothesis testing
Power analysis
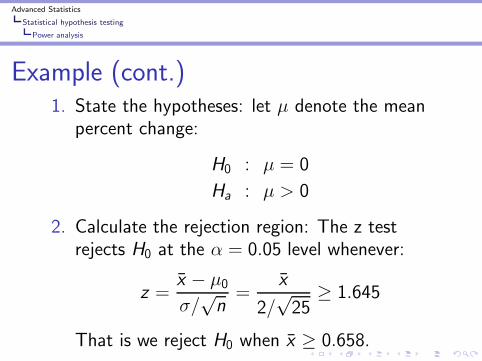
Example (cont.)1. State the hypotheses: let µ denote the mean
percent change:
H0 : µ = 0
Ha : µ > 0
2. Calculate the rejection region: The z testrejects H0 at the α = 0.05 level whenever:
z =x̄ − µ0
σ/√n
=x̄
2/√25
≥ 1.645
That is we reject H0 when x̄ ≥ 0.658.
Advanced Statistics
Statistical hypothesis testing
Power analysis
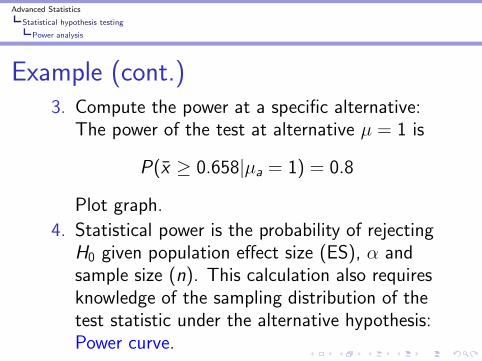
Example (cont.)3. Compute the power at a specific alternative:
The power of the test at alternative µ = 1 is
P(x̄ ≥ 0.658|µa = 1) = 0.8
Plot graph.
4. Statistical power is the probability of rejectingH0 given population effect size (ES), α andsample size (n). This calculation also requiresknowledge of the sampling distribution of thetest statistic under the alternative hypothesis:Power curve.
Advanced Statistics
Statistical hypothesis testing
Power analysis
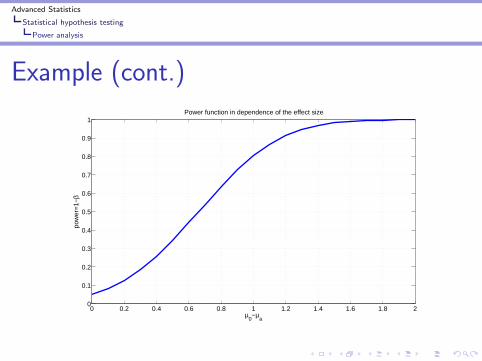
Example (cont.)
0 0.2 0.4 0.6 0.8 1 1.2 1.4 1.6 1.8 20
0.1
0.2
0.3
0.4
0.5
0.6
0.7
0.8
0.9
1
µ0−µ
a
pow
er=
1−β
Power function in dependence of the effect size
Advanced Statistics
Statistical hypothesis testing
Power analysis
Ways to increase powerI Increase α. A 5% test of significance will havea greater chance of rejecting the alternativethan a 1% test because the strength ofevidence required for rejection is less.
I Consider a particular alternative that is fartheraway from µ0. Values of µ that are in Ha butlie close to the hypothesized value µ0 are harderto detect than values of µ that are far from µ0.
I Increase the sample size. More data willprovide more information about x̄ so we have abetter chance of distinguishing values of µ.
Advanced Statistics
Statistical hypothesis testing
Power analysis
Ways to increase power
I Decrease σ. This has the same effect asincreasing the sample size: it provides moreinformation about µ. Improving themeasurement process and restricting attentionto a subpopulation are two common ways todecrease σ.
Advanced Statistics
Statistical hypothesis testing
Power analysis
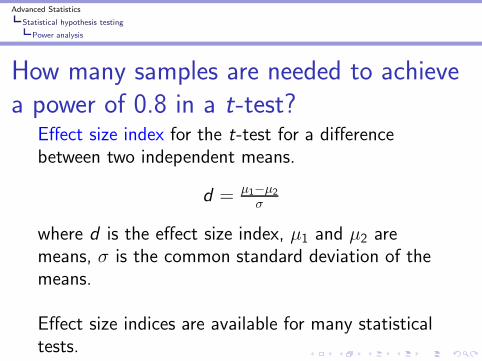
How many samples are needed to achievea power of 0.8 in a t-test?
Effect size index for the t-test for a differencebetween two independent means.
d = µ1−µ2
σ
where d is the effect size index, µ1 and µ2 aremeans, σ is the common standard deviation of themeans.
Effect size indices are available for many statisticaltests.
Advanced Statistics
Statistical hypothesis testing
Power analysis
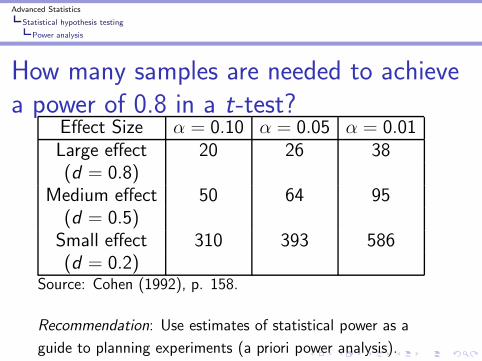
How many samples are needed to achievea power of 0.8 in a t-test?
Effect Size α = 0.10 α = 0.05 α = 0.01Large effect 20 26 38(d = 0.8)
Medium effect 50 64 95(d = 0.5)Small effect 310 393 586(d = 0.2)
Source: Cohen (1992), p. 158.
Recommendation: Use estimates of statistical power as a
guide to planning experiments (a priori power analysis).
Advanced Statistics
Statistical hypothesis testing
Power analysis
Is lack of statistical power a widespreadproblem?
”We estimated the statistical power of the first and last
statistical test presented in 697 papers from 10 behavioral
journals ... On average statistical power was 13-16% to detect
a small effect and 40-47% to detect a medium effect. This is
far lower than the general recommendation of a power of 80%.
By this criterion, only 2-3%, 13-21%, and 37-50% of the tests
examined had a requisite power to detect a small, medium, or
large effect, respectively.”
Jennions, M.D., and A.P. Moeller 2003. Behavioral Ecology
14, 438-455.
Advanced Statistics
Statistical hypothesis testing
Power analysis
Further readingsCohen, J. 1992. A power primer. PsychologicalBulletin 112: 155-159.
Jennions, M.D., and A.P. Moeller 2003. A survey ofthe statistical power of research in behavioralecology and animal behavior. Behavioral Ecology14: 438-455.
Hoenig, J.M., and D.M. Heisey 2001. The abuse ofpower: the pervasive fallacy of power calculationsfor data analysis. American Statistician 55: 19-24.
Advanced Statistics
Why multivariate analysis?
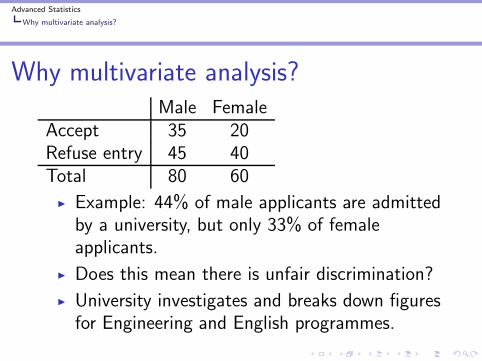
Why multivariate analysis?Male Female
Accept 35 20Refuse entry 45 40Total 80 60
I Example: 44% of male applicants are admittedby a university, but only 33% of femaleapplicants.
I Does this mean there is unfair discrimination?
I University investigates and breaks down figuresfor Engineering and English programmes.
Advanced Statistics
Why multivariate analysis?
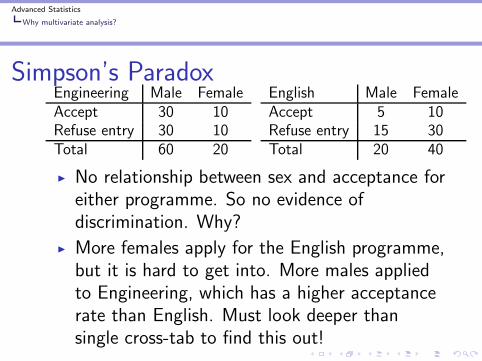
Simpson’s ParadoxEngineering Male FemaleAccept 30 10Refuse entry 30 10Total 60 20
English Male FemaleAccept 5 10Refuse entry 15 30Total 20 40
I No relationship between sex and acceptance foreither programme. So no evidence ofdiscrimination. Why?
I More females apply for the English programme,but it is hard to get into. More males appliedto Engineering, which has a higher acceptancerate than English. Must look deeper thansingle cross-tab to find this out!


