Advanced SIPS using PMU and SCADA data - EPCC … · PMU: Phasor Measurement Unit, PDC: Phasor Data...
18
© Hitachi, Ltd. 2013. All rights reserved. Yutaka Kokai Hitachi America, Ltd. Advanced SIPS using PMU and SCADA data June 3, 2013
Transcript of Advanced SIPS using PMU and SCADA data - EPCC … · PMU: Phasor Measurement Unit, PDC: Phasor Data...

© Hitachi, Ltd. 2013. All rights reserved.
Yutaka Kokai
Hitachi America, Ltd.
Advanced SIPS using PMU
and SCADA data
June 3, 2013

Copy Right © Hitachi, Ltd. 2013. All rights reserved.
Hitachi Group’s Industry Segments

Copy Right © Hitachi, Ltd. 2013. All rights reserved.
Key Strategy of Hitachi Group
2

Copy Right © Hitachi, Ltd. 2013. All rights reserved.
Hitachi’s Smart Grid Technology and Solutions
変換用変圧器 変換器建屋
STATCOM HVDC
Advanced SCADA/DMS HEMS, Demand Response
STATCOM for Distribution
Wide Area Protection System
Energy Storage System
EV Charging System
MDMシステム
検針値収集
システム監視 開閉器制御
検針値保存 業務連携
AMI, MDM system
Generation T&D
Customer
Copy Right © Hitachi, Ltd. 2013. All rights reserved.
Transmission Network Distribution Network
Wind farm
Thermal power plant Solar power plant
Substation
Decides countermeasures
Central Simulation Server
Stabilizing command
Battery Storage (10s MW) Substation
Central control unit
ASPS(Adjustable-Speed Pumped-Storage system) (100s MW)
Countermeasure downloading (Periodically)
Real-time monitoring of data
Dynamics simulations
Distribution substation
PMU
PMU PMU
PDC
PMU
変換用変圧器 変換器建屋
STATCOM (10s-100s MVar)
PMU
Substation
PMU
PDC
V
P
Rotor angle
5 (S) 0
Next-generation SIPS by IT & FACTS technologies
Preventing large-scale power blackout More reliable and more flexible network operation available
PMU: Phasor Measurement Unit, PDC: Phasor Data Concentrator
Copy Right © Hitachi, Ltd. 2013. All rights reserved. 5
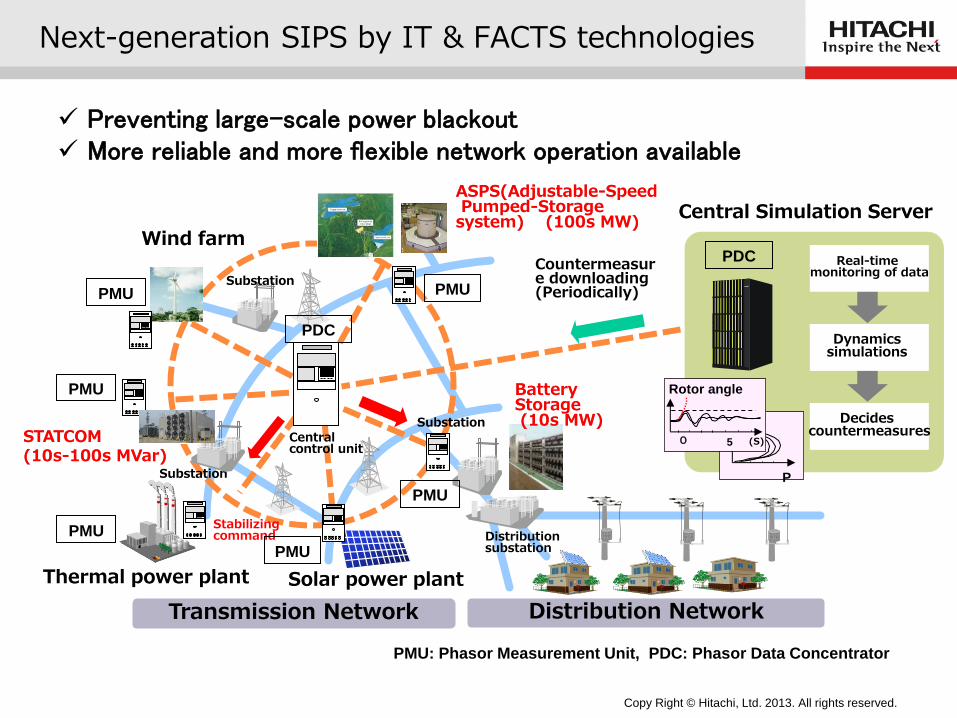
TTC before SIPS applied
Po
wer
Flo
w
Voltage
Thermal limit
TTC
Stability limit
TTC after SIPS applied P
ow
er
Flo
w
Thermal limit
TTC
Stability limit
Transient
Transient
Stability limit Voltage
Stability limit
Increased TTC (Total Transfer Capability)

Copy Right © Hitachi, Ltd. 2013. All rights reserved. 6
On-line TSC and ISC developed by
Chubu Electric Power Company, Hitachi, Toshiba and Mitsubishi
Source: A. Takeuchi, Y. Niwa, M. Nakane, T. Miura, "Performance Evaluation of the On-line Transient Stability Control System (On-line TSC System) ", IEEE, 2006
K. Anzai, H. Ito, M. Yatsu, Y. Hara, H. Horii, "Development of New SPS with Online DSA Function and Its Verification Technique Using RTDS ", PSCC, August, 2011
Recent SIPS in Japan

Copy Right © Hitachi, Ltd. 2013. All rights reserved. 7
Configuration of On-line TSC
State estimation for on-line data
Transient stability calculation for contingencies
Selection of shedding generator
based on its acceleration
Preset data (generators to be shed vs. a fault)
Trip signal to generator
main CB
Protective relay for bus fault or line fault
Generator
shedding
Pre-Processing
Emergency Control (within 150ms) Fault
Fault
Report
Protective relay
for generator
(functions as fail-
safe relay)
Calculation (every 30s)
X 1 X 14 X 44
TSC-P TSC-C TSC-T
EMS/ SCADA
DB (Impedance,
SV/TM position
etc. ) is converted
for maintenance.

Copy Right © Hitachi, Ltd. 2013. All rights reserved. 8
500kV double-circuit Line
Line monitored by on-line TSC system
Substation
Switching Station Power Station
Frequency Converter Station
Trunk Power System
Shin-mikawa Power Source System
Pacific Ocean
BTB
TSC-P (Parent) : 1
TSC-C(Child): 14
TSC-T(Terminal): 44
Tobu Power Source System
Seibu Power Source System
Tokyo EPCO
Tokyo EPCO
Kansai EPCO
275kV double-circuit Line
0 100 SCALE OF MILES
On-line TSC covers bulk transmission areas
Maximum demand of CEPCO: 28 GW

Copy Right © Hitachi, Ltd. 2013. All rights reserved. 9
Increase of TTC of the transmission lines for high efficiency
combined cycle generators gives CEPCO 800k$ benefit a day.
TTC before on-line TSC applied -
Actual Power Flow
0
500
1,000
1,500
2,000
2,500
3,000
3,500
4,000
0 3 6 9 12 15 18 21 0 Time (hour)
Po
wer
Flo
w (
MW
)
TTC after on-line TSC applied
Actual Result of Increased TTC

Copy Right © Hitachi, Ltd. 2013. All rights reserved. 10
Correlation between the Line Flow and the
Required Generation Shedding Amount
Since the required
shedding amount
changes greatly,
on-line transient
simulation is
indispensable to
keep the stability.
0
200
400
600
800
1000
1200
1400
1600
1800
2000
3000
Am
ou
nt
of
Gen
erati
on
Sh
edd
ing
(M
W)
3200 3400 3600 Power Flow (MW)
1100MW
3800 4000
Assumed fault: 3-phase 4-line-to-ground fault on 275kV double circuit transmission line with fast reclosing at 400 ms on a circuit

Copy Right © Hitachi, Ltd. 2013. All rights reserved. 11
ISC(Integrated Stability Control ) System
500kV transmission line
275kV transmission line
ISC-P ISC-Parent equipment
ISC-C ISC-Child equipment
ISC-T ISC-Terminal equipment
Note
500kV bulk power system
ISC-T
ISC-P
ISC-T
ISC-T ISC-TISC-TISC-TISC-T
ISC-T
about 300km
STATCOM 450MVA(150MVA*3systems)
ST
AT
CO
M
Large-scale thermal power plant2380MW (595MW*4units)First unit to be operated in July, 2012
Pre-calculation results
Control outputs
ISC-C
G
500kV transmission line
275kV transmission line
ISC-P ISC-Parent equipment
ISC-C ISC-Child equipment
ISC-T ISC-Terminal equipment
Note
500kV transmission line
275kV transmission line
ISC-P ISC-Parent equipment
ISC-C ISC-Child equipment
ISC-T ISC-Terminal equipment
Note
500kV bulk power system
ISC-T
ISC-P
ISC-T
ISC-T ISC-TISC-TISC-TISC-T
ISC-T
about 300km
STATCOM 450MVA(150MVA*3systems)
ST
AT
CO
M
Large-scale thermal power plant2380MW (595MW*4units)First unit to be operated in July, 2012
Pre-calculation results
Control outputs
ISC-C
GG
Transient stability
Voltage control
Frequency control

Copy Right © Hitachi, Ltd. 2013. All rights reserved. 12
Voltage control after generator shedding
Generator shedding in order to
maintain transient stability
Generator shedding and switching control of reactive
power sources in order to maintain transient stability
and restrain oscillation
1
1 1 1 1
2
2 2 2 23
3 3 3 3
4
4 4 4 4
5
5 5 5 56
6 6 6 6
0.60
0.80
1.00
1.20
0.0 1.0 2.0 3.0 4.02.00.0 3.01.0[s]
1.2
1.0
0.8
[p.u.]
0.6-1.0
1
1
1
1
1
22
22
3
3
3
33
4
4
4
44
5
5
5
55
6
6
6
66
0.60
0.80
1.00
1.20
0.0 1.0 2.0 3.0 4.02.00.0 3.01.0[s]
1.2
[p.u.]
0.6-1.0
Voltage rise
Voltage drop
1.0
0.8
Voltage rise and drop
restrainedFault Fault
1
1 1 1 1
2
2 2 2 23
3 3 3 3
4
4 4 4 4
5
5 5 5 56
6 6 6 6
0.60
0.80
1.00
1.20
0.0 1.0 2.0 3.0 4.02.00.0 3.01.0[s]
1.2
1.0
0.8
[p.u.]
0.6-1.0
1
1
1
1
1
22
22
3
3
3
33
4
4
4
44
5
5
5
55
6
6
6
66
0.60
0.80
1.00
1.20
0.0 1.0 2.0 3.0 4.02.00.0 3.01.0[s]
1.2
[p.u.]
0.6-1.0
Voltage rise
Voltage drop
1.0
0.8
Voltage rise and drop
restrainedFault Fault
Generator shedding
Generator shedding and switching control of reactive power sources

Copy Right © Hitachi, Ltd. 2013. All rights reserved. 13
Increased TTC by ISC & STATCOM
<No measure>
2400MW
1100MW
2000MW
TTC
Current capacity
of transmission line
Transient stability limit
Steady-state stability limit
<ISC>
TTC
Enhancement of TTC almost double
<ISC & STATCOM>
This system began its operation in May 2012, corresponding with the start of operation of a large-scale thermal power plant.

Copy Right © Hitachi, Ltd. 2013. All rights reserved.
Load PL
G1
WT
Tr
500kV
230kV
20kV
14
Fault Fault Clear
Load PL
PV Output
Time(s)
Rotor angles of G1, G2,G3
5 (S) 0
Case A
Case B
3 cycles
Difference of DER dynamics upon a fault may affect the transient stability of generators. Maximum swing of rotor angles changes (1st peak,1st bottom, 2nd peak and 2nd bottom).
PV, WT and load PL dynamics should be monitored and analyzed on-line.
Future Issue: DERs affect transient stability and voltage stability
PV
Main Grid
Fault
Case A
Case B
Voltage
Copy Right © Hitachi, Ltd. 2013. All rights reserved.
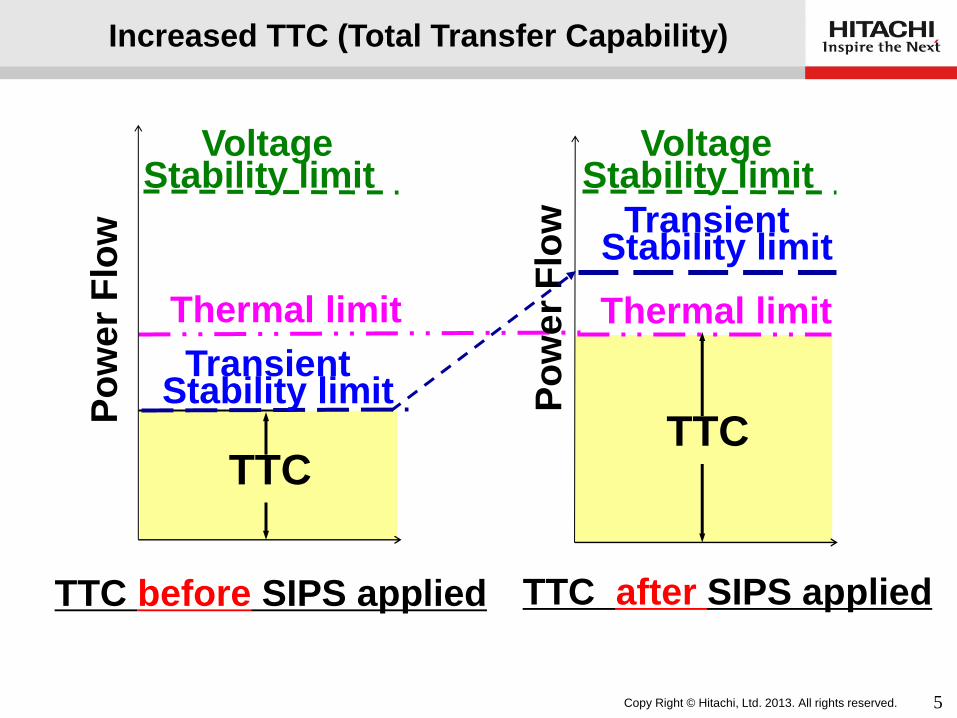
Challenges to Next-generation SIPS
Off-line SIPS
Static Parameter Setting (Conventional technology)
Protective relays
Calculate parameter of
protective relay off-line
Set parameters
manually at sites
On-line SIPS
Dynamic Parameter Setting (Emerging technology)
Periodical
download of
parameters
Calculate parameter of
protective relay on-line
Protective relays
Synchrophasor
(Emerging technology)
PDC
PMU PMU PMU
Transient Stability
5 (S) 0
Voltage Stability
Rotor angle V
P
Small Signal Stability
30 (S) 0
Frequency
Intermittent output of Renewable Energy
60
PMU: Phasor Measurement Unit, PDC: Phasor Data Concentrator
Online simulation technology + Synchrophasor data use (Pre-event detailed analysis) (Pre-event & Post-event controls)

Copy Right © Hitachi, Ltd. 2013. All rights reserved.
Transmission Network Distribution Network
Wind farm
Thermal power plant Solar power plant
Substation
Decides countermeasures
Central Simulation Server
Stabilizing command
Battery Storage (10s MW)
Substation Central control unit
ASPS(Adjustable-Speed Pumped-Storage system) (100s MW)
Countermeasure downloading (Periodically)
Real-time monitoring of data
Dynamics simulations
Distribution substation
PMU
PMU PMU
PDC
PMU
変換用変圧器 変換器建屋STATCOM (10s-100s MVar)
PMU
Substation
PMU
PDC
V
P
Rotor angle
5 (S) 0
Next-generation SIPS by IT & FACTS technologies
Preventing large-scale power blackout More reliable and more flexible network operation available
PMU: Phasor Measurement Unit, PDC: Phasor Data Concentrator

Copy Right © Hitachi, Ltd. 2013. All rights reserved. 17