advanced research paper draft complete-3
14
A Comparative Analysis of Snags and Dead Woody Debris in the Kifer Plots By Chris Benston Winter 2016
-
Upload
chris-benston -
Category
Documents
-
view
161 -
download
5
Transcript of advanced research paper draft complete-3

A Comparative Analysis of Snags and Dead Woody Debris in the Kifer Plots
By Chris Benston
Winter 2016

Abstract
The Evergreen Forest are temperate rainforests which have been logged in the recent past. However, no large scale harvesting operations have occurred within these forests since 1968. This has
allowed the forest the opportunity to recover and it is now approaching old growth stage. The Evergreen forest consists of forty-four plots known as the EEON Plots. An Additional twenty much older
plots exist on campus these are known as the Kifer Plots. These plots provide crucial habitat for numerous species of wildlife such as woodpeckers, Pacific Wrens, Brown Creepers and various species of raptors. The Kifer plots provide student and faculty researchers with the opportunity to study the
succession of the Evergreen Forest.
The Kifer plots are named for their former owner and tree farmer, Ben Kifer. This land would which eventually become part of the Kifer plots is just under seventy-two acres in size. The tree stand
structure found within the Kifer plots varies significantly when compared to the other plots found within the Evergreen Forest. Prior to the college acquiring the land which the Kifer plots now sit on, this land was managed as a tree farm. Between the years of 1923 and 1924 this land was clear cut. From this
point on this land was managed as a tree farm until it’s purchase by the college in 1968. The management practices utilized by this tree farm included but was not limited to selective thinning and controlled burns. In the year 1963, the following tree species were removed Big Leaf Maple, Red Alder, and Grand Fir. The harvested timber was cut into smaller pieces and managed to produce 250 cords of wood. In the following year, a grand total of seventy -thousand board feet of diseased Douglas Fir was
harvested. Prior to this land being sold to the college, all marketable Grand and Douglas Fir was harvested and sold. (Hall, Preffier-Hoyt et al. 1977).
The research plots as we know them today were established in 1971 by students interested in ecological forestry. In order to conduct their study a total of forty-two plots were established out of these forty-two plots only twenty of them were to be permanent. Today out of these original forty-two plots only twenty plots remain. Since these plots were established in 1977, sampling has taken place within these plots every ten years. (Hall, Preffier-Hoyt et al. 1977). However, prior to winter of 2015 regular maintenance of these plots was not taking place. This ill-regular maintenance resulted in poorly placed plot centers, difficult to find tree tags, and increasing numbers of untagged dead woody debris and trees. This made conducting any surveys a difficult if not impossible task especially considering any data collected would be extremely flawed. In winter of 2015, a survey was conducted to re-establish the location of the permanent plots and to determine which plots needed the largest amount of maintenance.
Dead woody debris and snags provide crucial habitat for numerous species of animals. Over a third of all species of animals rely on down woody debris for preservation and longevity. Snags which are trees that have died but have yet to fall, provide nesting habitats for more than sixty mammals and bird which are cavity nesters. Which means they create cavities in dead trees and build their nests in these cavities. Two of the most commonly thought of cavity nesters are woodpeckers and flickers. However, it should be noted that not all cavity nesters make their own cavities. Secondary cavity nesters rely on the
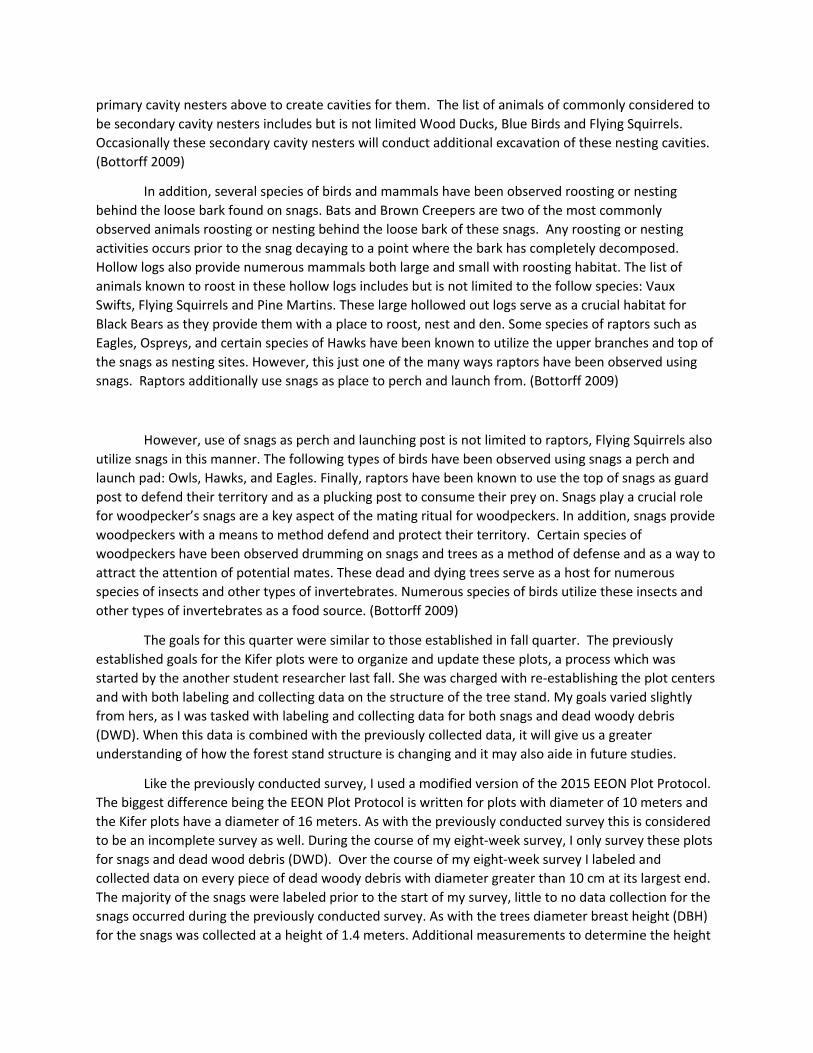
primary cavity nesters above to create cavities for them. The list of animals of commonly considered to be secondary cavity nesters includes but is not limited Wood Ducks, Blue Birds and Flying Squirrels. Occasionally these secondary cavity nesters will conduct additional excavation of these nesting cavities. (Bottorff 2009)
In addition, several species of birds and mammals have been observed roosting or nesting behind the loose bark found on snags. Bats and Brown Creepers are two of the most commonly observed animals roosting or nesting behind the loose bark of these snags. Any roosting or nesting activities occurs prior to the snag decaying to a point where the bark has completely decomposed. Hollow logs also provide numerous mammals both large and small with roosting habitat. The list of animals known to roost in these hollow logs includes but is not limited to the follow species: Vaux Swifts, Flying Squirrels and Pine Martins. These large hollowed out logs serve as a crucial habitat for Black Bears as they provide them with a place to roost, nest and den. Some species of raptors such as Eagles, Ospreys, and certain species of Hawks have been known to utilize the upper branches and top of the snags as nesting sites. However, this just one of the many ways raptors have been observed using snags. Raptors additionally use snags as place to perch and launch from. (Bottorff 2009)
However, use of snags as perch and launching post is not limited to raptors, Flying Squirrels also utilize snags in this manner. The following types of birds have been observed using snags a perch and launch pad: Owls, Hawks, and Eagles. Finally, raptors have been known to use the top of snags as guard post to defend their territory and as a plucking post to consume their prey on. Snags play a crucial role for woodpecker’s snags are a key aspect of the mating ritual for woodpeckers. In addition, snags provide woodpeckers with a means to method defend and protect their territory. Certain species of woodpeckers have been observed drumming on snags and trees as a method of defense and as a way to attract the attention of potential mates. These dead and dying trees serve as a host for numerous species of insects and other types of invertebrates. Numerous species of birds utilize these insects and other types of invertebrates as a food source. (Bottorff 2009)
The goals for this quarter were similar to those established in fall quarter. The previously established goals for the Kifer plots were to organize and update these plots, a process which was started by the another student researcher last fall. She was charged with re-establishing the plot centers and with both labeling and collecting data on the structure of the tree stand. My goals varied slightly from hers, as I was tasked with labeling and collecting data for both snags and dead woody debris (DWD). When this data is combined with the previously collected data, it will give us a greater understanding of how the forest stand structure is changing and it may also aide in future studies.
Like the previously conducted survey, I used a modified version of the 2015 EEON Plot Protocol. The biggest difference being the EEON Plot Protocol is written for plots with diameter of 10 meters and the Kifer plots have a diameter of 16 meters. As with the previously conducted survey this is considered to be an incomplete survey as well. During the course of my eight-week survey, I only survey these plots for snags and dead wood debris (DWD). Over the course of my eight-week survey I labeled and collected data on every piece of dead woody debris with diameter greater than 10 cm at its largest end. The majority of the snags were labeled prior to the start of my survey, little to no data collection for the snags occurred during the previously conducted survey. As with the trees diameter breast height (DBH) for the snags was collected at a height of 1.4 meters. Additional measurements to determine the height

of the snags were collected by using a fifty-meter tape to determine the distance and a clinometer to determine both up and down angles of the snag. By using trigonometry, we are able to take the distance and both of the angles to determine the height of our snags. In order to evaluate the condition of these snags, a scale of decay was used with a range of one to nine. On this decay scale a decay of stage one represented a live tree and a decay stage of nine represented a fallen stump.
Figure 2. Snag and log decomposition stages and classesfrom Kirk and Franklin, 2001
Figure 5. Measure directly above the root collaron recently fallen DWD (from FIA National Core Field Guide version 3.0).

The protocol used to measure the dead woody debris(DWD) varies slightly from the protocol used to measure snags and trees. As with the snags and trees data related to the species and decay class of the dead woody debris are taken. The decay class scale dead woody debris (dwd) varies significantly from the decay stage scale used for snags and trees. For the decay class scale there are five categories but with the decay stage scale there are nine categories. A decay class of one represents a recently fallen log and a decay class of five represents a fallen log which has almost completely rotted away and has started to turn powder. However, additional measurements are collected when sampling for dead woody debris. Only dead woody debris with a width greater than 4 inches or 10 cm at the largest end should be tagged. The width measurements are collected at three different locations. These locations where width measurements should be collected are both ends of and the middle of the dead woody debris. At any point if portion of dead woody debris leaves the plot the end is considered to be the point where the dead woody debris leaves the plot. The final measurement which is to be collected for the down woody debris is the overall the length, as with before if a portion of dwd leaves the plot it should be excluded from the overall length measurement. If there is a visible root collar all width and length measurements are to be collected above the root collar. If the piece of dead woody debris, you are measuring is broken it is important to note that the length is estimated and how many pieces the dead wood debris is broken into on the data sheet.

Log Characteristics
Class 1 Class 2 Class 3 Class 4 Class 5
Bark Intact Intact Trace Absent Absent
Twigs Present Absent Absent Absent Absent
Texture Intact Intact to soft Hard, large pieces
Small, soft blocky pieces
Soft and powdery
Shape Round Round Round Round to oval Oval
Color of wood Original Color
Original Color Original color to faded
Light brown to faded brown, yellowish.
Faded to light yellow or gray.
Portion of log on ground
Log elevated on support points.
Log elevated on support points, but sagging slightly.
Log is sagging near ground.
All of log on ground.
All of log on ground.
Table 1. LOG DECOMPOSITION CLASS
(from FIA National Core Field Guide version 3.0)

Table 2. LOG DECOMPOSITION CLASS Version 2 (FIA DWD methods)

Figure 3. DWD decomposition classes (fromFIA National Core Field Guide version 3.0).

The data for sum of estimated basal area (m2) for plots shows no significant correlation between elevation and increased coverage by dead wood debris. However, plot 2-5 can be considered the outlier among the data set. I will discuss the two most likely explanations for this discrepancy. The first explanation is snags in this plot are decaying at rate much faster than those located in the other plots. The data for the estimated basal area of snags (m2) seems to support this theory. The sum of estimated basal area coverage(m2) within this plot for snags and dead woody debris is not proportional. The basal coverage for snags within this plot is almost non-existent. When comparing the estimated basal area coverage of snags for plot 2-5 to the entire data set, we can see that this plot has the second lowest estimated basal area coverage for snags. The second theory is plot 2-5 is infected with a tree disease similar to laminated rot root. However, less evidence is available to support this theory. If this were the case, we should be seeing elevated levels of coverage by both snags and dead woody debris similar to what is occurring in plot 5-1.
As one can see the plots with the greatest sum of estimated basal area for dead woody debris tend to be those which are on flat level ground and most vulnerable to the wind. For the majority of these plots the data does not support the laminated root rot theory. The majority of the plots with increased levels of coverage by dead woody debris seem have to decreased coverage by snags. The same can be said for snags coverage within the plots, the plots with smaller areas of coverage by dead woody debris seems to have elevated levels of coverage for snags. This data trend leads to me believe that the changes being observed in these plots are not uniform. In fact, wide variations can be observed for plots which are part of the same transect and located only a few meters apart. This could be a result of the timber within forest being harvested by different times meaning the regrowth located within these plots are different ages.
If these plots were part of the initial earlier timber harvest the age and composition of tree stands within these plots will vary from the rest. This is most plausible explanation for the very sporadic changes in data for both snags and down woody debris currently being observed. The data shows that the majority of snags and pieces of dead woody debris within the plot fall into two categories. The categories are recently fallen snags and dead woody debris and the older more decayed snags and pieces of dead woody debris. A small portion of the estimated basal area according to data is provided by stages and classes of decay located between these two categories. Based on what the data is telling us we can conclude that drastic changes have occurred within the forest stand structure in the past. The data also tells us that up until recently little no to change has occurred within the forest stand structure. However, the data shows the forest stand may be currently undergoing another drastic change.
It should be noted that several plots have larger than average coverage of snags and dead woody debris. The most likely cause of this phenomena is the presence of laminated root rot within these plots. Laminated root rot directly attacks the roots of trees and will cause the infected trees to decline and die off at much faster rate. The effects of laminated root rot can be aggravated by commercial thinning and unequal management of forest stands based on age. (Hadfield and Johnson 1977, Hadfield et al. 1986)


It should be noted that the decay stage for snags with the largest estimated basal area coverage is decay stage eight. This decay stage represents fallen stumps which is mostly likely tied to the site’s past as a tree farm. The largest decay class according to basal area coverage across all plots is decay class five. Which represents the severally decayed pieces of down woody debris. The most likely explanation for this phenomena is the presence of laminated root rot in several of the plots. However, in order to reach any solid conclusions more long term research and studies should occur.
This survey worked to build on data previously collected from the Kifer plots and should work to any enhance any future surveys. While the data collected on the snags and dead woody debris works to enhance our preexisting knowledge of the Kifer plots, by no means is this a comprehensive survey. As of this paper being written a complete of survey of the Kifer plots has not been conducted for ground and canopy cover. Upon conclusion of this survey, I removed any flagging which I had placed and as well removing any additional flagging left over from prior surveys.

Citations
Hall, D.J., Hoyt, R.P., Rolnick, K., Rumberg, H.D., Western, S. 1977. A proposal for Ecological Forestry on a portion of The Evergreen State College Campus. Pages: 9-14.
Bottorff, J. 2009. Snags, Coarse Woody Debris, and Wildlife. Pages: 1-2. Washington State Department of Natural Resources.
Hadfield, J.S., Johnson, D.W.1977. Laminated Root Rot. USDA Forest Service- Pacific Northwest Region.
Hadfield, J.S., Goheen, J. Donald., Filip, M. G., Schmitt, L.C., Harvey, D.R. 1986. Root Diseases in Oregon and Washington Conifers. USDA Forest Service- Pacific Northwest Region.
2005. Forest Inventory and Analysis National Core Field Guide Volume 1: Field Data Collection Procedures for Phase 2 Plots Version 3.0. USDA Forest Service.
2005. Down Woody Materials 3 Field Guide Phase 3.0. USDA Forest Service.
Kirk and Franklin.2001. (unable to locate original source at this time).