Advanced reporting Settings -...
12
www.kinamu.com April 2010 KINAMU Reporter v1.5 Beta Page 16 of 40 © KINAMU Business Solutions AG. All rights reserved Advanced reporting Settings There are numerous advanced settings and options for the reporting that can be used to generate specific results. The Not Exists Selection Clause Within the Selection Clause you cannot only specify certain criteria but in the last column also specify if the selection should be “required” or “notexisting”. required which is the default settings treats this as a normal condition where the value is checked against a match. If you select notexisting the system selects only those entries where the related entry does not exist. This might be handy if you e.g. search for Customers that do not have a certain product or contacts without an email address or like in the following example Opportunities that do not have a call within a certain time period. As an Example we want to create a report on Opportunities that do not have a call Scheduled. To do that create a new report from the menu, name it “Opportunities without calls”, select Opportunities as the report module. Then open the related modules and select calls. Pick the “Start Date” from the Field list and add it to the root selection group. In our case we want to add it twice. For the first entry we specify the operator “within the last 3 month” (since the field is a date field certain date related options are offered) and for the second entry we select “current month”. For both entries select “notexisting” in the Required Column. Screenshot 16 - the notexists clause Got to the List Fields and select the Opportunity Name, the Sales Stage, the Amount as well as the last name, first name and user name of the assigned user to the opportunity. Hit save and look at the
Transcript of Advanced reporting Settings -...

www.kinamu.com April 2010
KINAMU Reporter v1.5 Beta Page 16 of 40 © KINAMU Business Solutions AG. All rights reserved
Advanced reporting Settings
There are numerous advanced settings and options for the reporting that can be used to generate
specific results.
The Not Exists Selection Clause
Within the Selection Clause you cannot only specify certain criteria but in the last column also specify
if the selection should be “required” or “notexisting”. required which is the default settings treats this
as a normal condition where the value is checked against a match. If you select notexisting the
system selects only those entries where the related entry does not exist. This might be handy if you
e.g. search for Customers that do not have a certain product or contacts without an email address or
like in the following example Opportunities that do not have a call within a certain time period.
As an Example we want to create a report on Opportunities that do not have a call Scheduled. To do
that create a new report from the menu, name it “Opportunities without calls”, select Opportunities
as the report module. Then open the related modules and select calls. Pick the “Start Date” from the
Field list and add it to the root selection group. In our case we want to add it twice. For the first entry
we specify the operator “within the last 3 month” (since the field is a date field certain date related
options are offered) and for the second entry we select “current month”. For both entries select
“notexisting” in the Required Column.
Screenshot 16 - the notexists clause
Got to the List Fields and select the Opportunity Name, the Sales Stage, the Amount as well as the
last name, first name and user name of the assigned user to the opportunity. Hit save and look at the

www.kinamu.com April 2010
KINAMU Reporter v1.5 Beta Page 17 of 40 © KINAMU Business Solutions AG. All rights reserved
Results which should show you a list of opportunities without a call in the last three month or in the
current month.
Basic Grouping of Results
In the List View Section you can Group Results. Depending on the Output Format you decide on the
Results will look different. Lets first cover basic Grouping using the Report we did use before on the
Opportunities without Calls.
The Result for our very basic report did look as follows.
Screenshot 17 - basic Reporting Results
Let’s assume we want to have a simple count of opportunities as well as the total amount per user
and Sales Stage in a list form. To manage such a request edit the report definitions an go to the List
Fields Definitions. The last two columns are Function and Group by. In our case we want to group by
User Name. To define this Grouping select the group by field and select Primary. Then select the
Sales Stage and select Yes as a Grouping Option. The differentiation of the primary and basic
grouping option will be required if we also want to have a grouped view which we will cover later.
To add the Count of Opportunities click the Function Colum for the Opportunity Name Field and
select the Function “COUNT”. For the total Amount in that Grouped View click the Function Column
for the Amount Field and select “SUM”.
To apply Grouping you will need to understand what you are doing. The System will not do any
checks for you but request that if you group you will most likely also need some functions to be
performed. With the Grouping option you can easily create reports that do not produce any or not

www.kinamu.com April 2010
KINAMU Reporter v1.5 Beta Page 18 of 40 © KINAMU Business Solutions AG. All rights reserved
meaningful results. On the other hand this is a powerful tool to analyze your data. In any case it will
be best if you understand a little bit of SQL since you are basically interactively creating an SQL
statement with the basic SQL Syntax for Grouping and some SQL Functions.
The List Definition screen should now Look as follows:
Screenshot 18 - Definition of Grouping and Functions
This will produce the following result. The list shows the Count of Opportunities as well as the total
Amount grouped by User and Sales Stage.

www.kinamu.com April 2010
KINAMU Reporter v1.5 Beta Page 19 of 40 © KINAMU Business Solutions AG. All rights reserved
Screenshot 19 - Grouped result with functions
Grouped views
A further Option for an enhanced Output is the option to specify different views for the Output. In
the List Fields Definition Window select a different Output in the List Type Drop Down Box. The
Options are “standard” for the normal Output, “grouped” for a normal grouped View or “grouped w.
summary” for a grouped view that also has a summary line for each group.
For our report above select “grouped” and view the results which will look as follows.
Screenshot 20 - grouped View
The List above groups the entries by the Field flagged as primary. The secondary Grouping is not
evaluated in this view (it might still be used in e.g. a Chart or other Report).

www.kinamu.com April 2010
KINAMU Reporter v1.5 Beta Page 20 of 40 © KINAMU Business Solutions AG. All rights reserved
Go back to the List Fields Definition and change the Option for the View to “grouped w. summary”.
Save the Report to see the Result which look similar but now also for the Fields with a Function
assigned that Function is evaluated as a summary for the group.
Screenshot 21 - grouped View with summary
Also in this case only the primary grouping is evaluated for the Display. The Option “plain HTML” is
not implemented yet but most likely will be in the Future to simply produce Output in form of an
HTML table.
Definition of Custom reporting Fields
Not All Fields you might want to use in Reporting are necessarily defined as such on the Database
within the SugarCRM Datamodel. The KINAMU reported allows for flexible Definition of custom
additional Fields that can be used e.g . will be calculated in the report. Examples might be the
concatenation of Fields e.g. Concatenate First Name and Last name into one Field or build a custom
address Field for an Address Report rather than listing all Fields individually. Other typical Fields are
e.g. a weighted Revenue for an Opportunity or a Field for the Quarter of the Opportunity to produce
a Report by Quarter.
To define such a custom field create a custom vardef file for the module you want to define the
Fields for. In our Example we want to add two reporting fields to the Opportunity Module to
represent the weighted amount of the opportunity and also the closing quarter so we can produce a
pipeline report on a quarterly basis.
For the weighted Amount create the following entry in a custom vardef file in
custom/extension/modules/Opportunities/Ext/Vardefs:
$dictionary['Opportunities']['fields']['weighted_amount'] =
array(
'name' => 'weighted_amount',
'vname' => 'LBL_WEIGHTED_AMOUNT',
'source' => 'non-db',
'type' => 'kreporter',
'eval' => '$.amount * $.probability / 100'
);

www.kinamu.com April 2010
KINAMU Reporter v1.5 Beta Page 21 of 40 © KINAMU Business Solutions AG. All rights reserved
To Translate the Label you will also need to create a custom language entry for
'LBL_WEIGHTED_AMOUNT' in our case since this will be the Label for the new reporter Field. The
important facts are to define the source as “non-db” since this will tell Sugar to not create the Field
on the Database when you hit repair after creating those Fields. The second important fact is to make
the type “kreporter” since this will tell the KINAMU reporter to evaluate the Field during running the
report. And last but not least the most important line the value “eval” in the Array. This is an SQL
function that will be evaluated. The “$” sign is a variable that will be replaced with the table name of
the modules table (or the respective join if it is part of a relation), the remainder are field names as
they are defined in the vardefs or resp. on the Database. So in this case during reporting the Report
will evaluate the weighted amount by calculating amount * probability / 100.
For the Closing Quarter as another example create an entry that looks as follows:
$dictionary['Opportunities']['fields']['expected_close_quarter'] =
array(
'name' => 'expected_close_quarter',
'vname' => 'LBL_CLOSING_QUARTER',
'source' => 'non-db',
'type' => 'kreporter',
'report_data_type' => 'varchar',
'eval' => 'CONCAT(YEAR($.date_closed),\'/Q\',QUARTER($.date_closed))'
);
In Addition you can also specify the “report_data_type” which will be used to determine the select
options or possible values (e.g. for an enum field). In the example above the date_closed Field in the
Opportunity is evaluated and the year is concatenated with a ‘/Q’ and then the quarter of the
date_closed.
If you repair the module and then create a new Report you will be able to select the Fields and run a
report. Create a simple report without selection criteria that list opportunities grouped by Quarter
with the count on names and the sum on unweighted and weighted amount. To do that create a List
Fields Definition that looks as follows.
Screenshot 22 - basic Opportunity report with Custom Fields
Save the Report and view the Results which look as follows:

www.kinamu.com April 2010
KINAMU Reporter v1.5 Beta Page 22 of 40 © KINAMU Business Solutions AG. All rights reserved
Screenshot 23 - grouped report with calculated custom fields
With execution of the Report the Closing Date is converted to the Closing Quarter and the Weighted
Amount is calculated. You can of course also use the custom fields in a selection clause.

www.kinamu.com April 2010
KINAMU Reporter v1.5 Beta Page 23 of 40 © KINAMU Business Solutions AG. All rights reserved
Adding Charts to Reports
The KINAMU Reporter also allows flexible definition of Charts to be used to visualize Report Results.
To add a Chart we will use the Report we just created for our custom fields but also add the Sales
Stage. So the List Fields Section should look as follows:
Screenshot 24 - Example Report Definitions for Charting
To add one or multiple Charts to your Report select the Chart Parameters tab in the Report Definition
Area.
www.kinamu.com April 2010
KINAMU Reporter v1.5 Beta Page 24 of 40 © KINAMU Business Solutions AG. All rights reserved
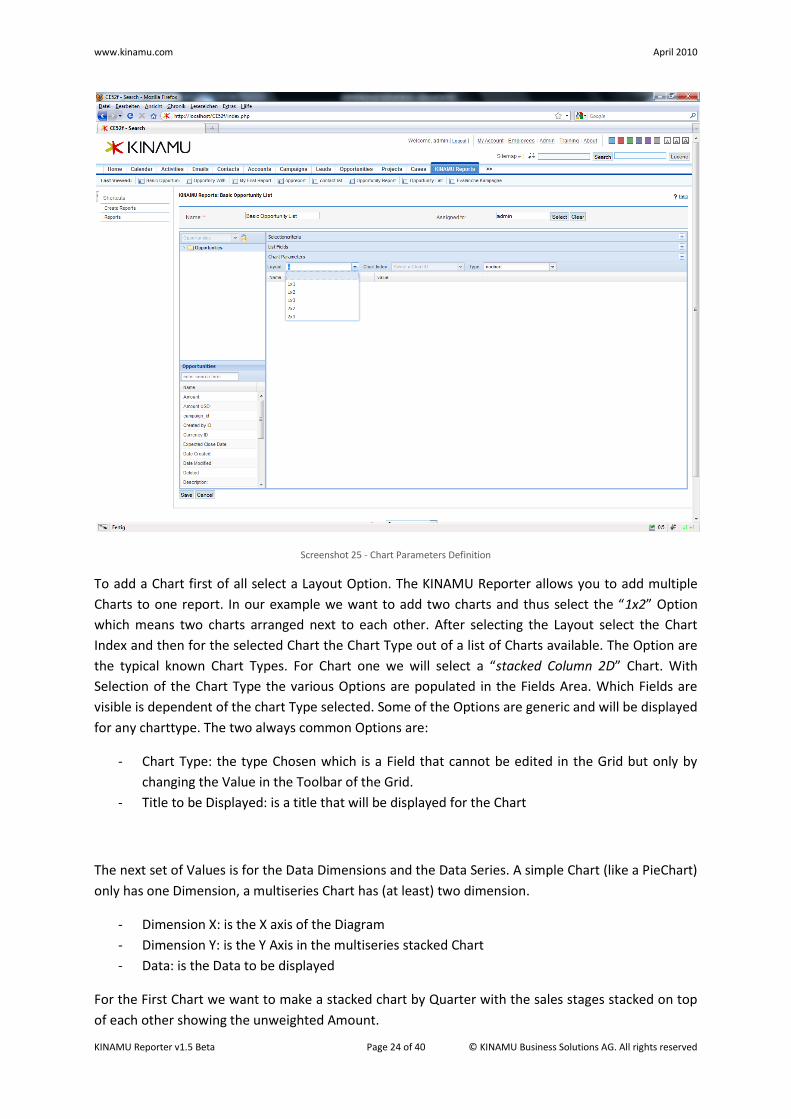
Screenshot 25 - Chart Parameters Definition
To add a Chart first of all select a Layout Option. The KINAMU Reporter allows you to add multiple
Charts to one report. In our example we want to add two charts and thus select the “1x2” Option
which means two charts arranged next to each other. After selecting the Layout select the Chart
Index and then for the selected Chart the Chart Type out of a list of Charts available. The Option are
the typical known Chart Types. For Chart one we will select a “stacked Column 2D” Chart. With
Selection of the Chart Type the various Options are populated in the Fields Area. Which Fields are
visible is dependent of the chart Type selected. Some of the Options are generic and will be displayed
for any charttype. The two always common Options are:
- Chart Type: the type Chosen which is a Field that cannot be edited in the Grid but only by
changing the Value in the Toolbar of the Grid.
- Title to be Displayed: is a title that will be displayed for the Chart
The next set of Values is for the Data Dimensions and the Data Series. A simple Chart (like a PieChart)
only has one Dimension, a multiseries Chart has (at least) two dimension.
- Dimension X: is the X axis of the Diagram
- Dimension Y: is the Y Axis in the multiseries stacked Chart
- Data: is the Data to be displayed
For the First Chart we want to make a stacked chart by Quarter with the sales stages stacked on top
of each other showing the unweighted Amount.
www.kinamu.com April 2010
KINAMU Reporter v1.5 Beta Page 25 of 40 © KINAMU Business Solutions AG. All rights reserved
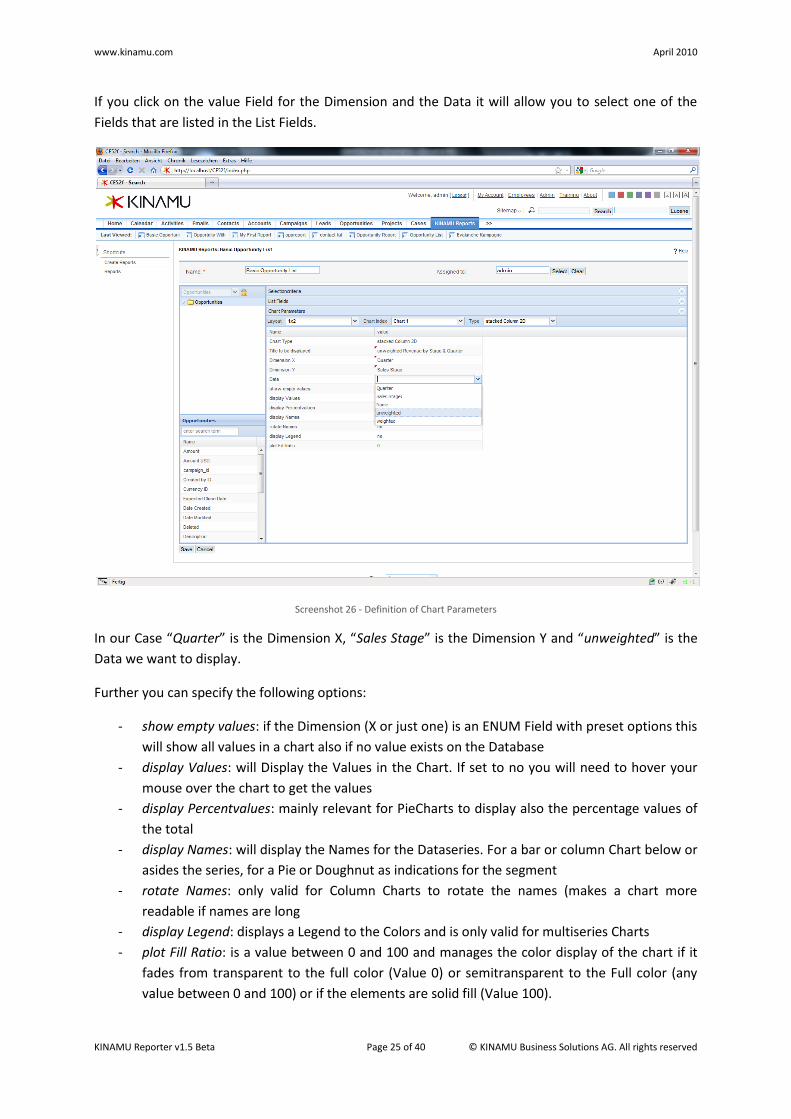
If you click on the value Field for the Dimension and the Data it will allow you to select one of the
Fields that are listed in the List Fields.
Screenshot 26 - Definition of Chart Parameters
In our Case “Quarter” is the Dimension X, “Sales Stage” is the Dimension Y and “unweighted” is the
Data we want to display.
Further you can specify the following options:
- show empty values: if the Dimension (X or just one) is an ENUM Field with preset options this
will show all values in a chart also if no value exists on the Database
- display Values: will Display the Values in the Chart. If set to no you will need to hover your
mouse over the chart to get the values
- display Percentvalues: mainly relevant for PieCharts to display also the percentage values of
the total
- display Names: will display the Names for the Dataseries. For a bar or column Chart below or
asides the series, for a Pie or Doughnut as indications for the segment
- rotate Names: only valid for Column Charts to rotate the names (makes a chart more
readable if names are long
- display Legend: displays a Legend to the Colors and is only valid for multiseries Charts
- plot Fill Ratio: is a value between 0 and 100 and manages the color display of the chart if it
fades from transparent to the full color (Value 0) or semitransparent to the Full color (any
value between 0 and 100) or if the elements are solid fill (Value 100).

www.kinamu.com April 2010
KINAMU Reporter v1.5 Beta Page 26 of 40 © KINAMU Business Solutions AG. All rights reserved
In our example we want to display Values and display Names and also show a Legend. Plot Fill Ratio
for the Chart we set to 100 to make it solid colors. So the Settings for Chart 1 should look as follows:
Screenshot 27 - Example Chart Parameters for multiseries Chart
Repeat the Steps for Chart 2 where we want to have a Doughnut for the weigthed revenue per
Quarter. Thus the Settings should be as follows:
Screenshot 28 - Example Chart Parameters for Doughnut Chart
Title is “weighted by Quarter”, Dimension is “Quarter” and Data is “weighted”. We want to display
Values and also display Names.
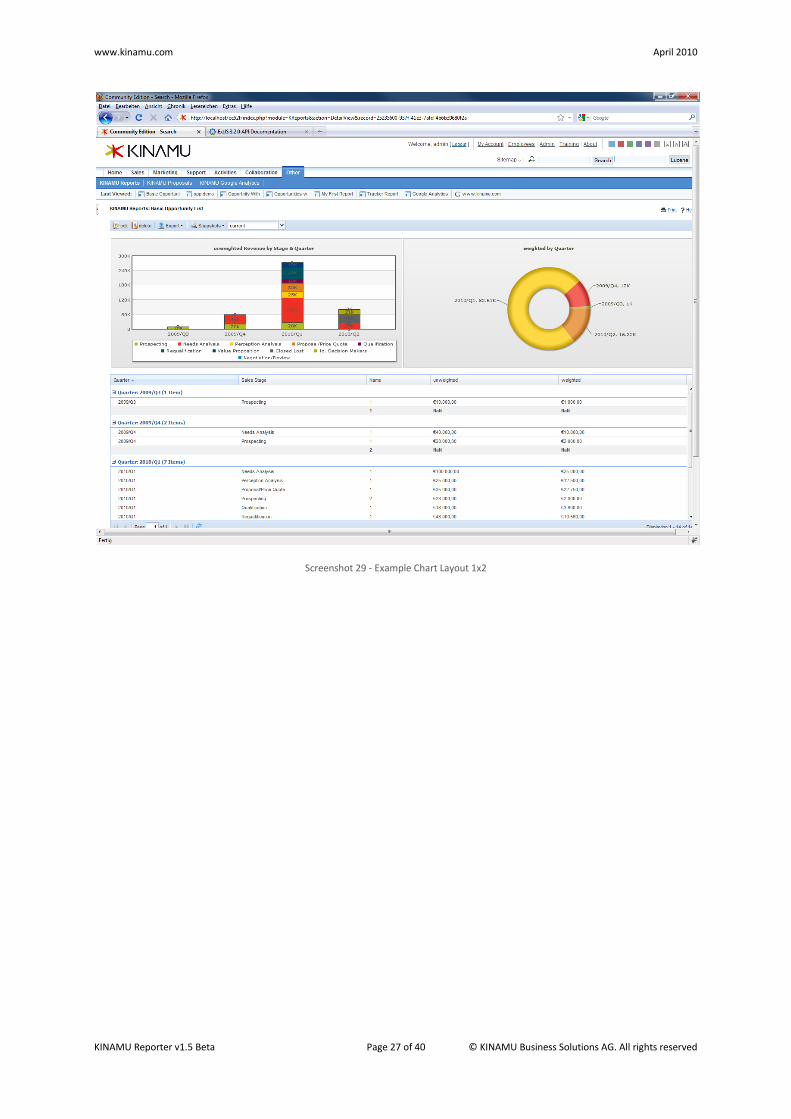
Press the Save Button and get the Result for the Charts you just have created.
www.kinamu.com April 2010
KINAMU Reporter v1.5 Beta Page 27 of 40 © KINAMU Business Solutions AG. All rights reserved
Screenshot 29 - Example Chart Layout 1x2


![MANUAL - Garmin · General settings and Training settings General settings In the menu left click on [Settings]. The General settings are for the general display. Language The standard](https://static.fdocuments.net/doc/165x107/5f9ad8bee7f94767a440344e/manual-garmin-general-settings-and-training-settings-general-settings-in-the-menu.jpg)