Advanced Network Planning Telefónicaand Accenture Case Study
22
Advanced Network Planning Telefónica and Accenture Case Study
Transcript of Advanced Network Planning Telefónicaand Accenture Case Study

Advanced Network Planning
Telefónica and Accenture
Case Study

Todays Presenters
2
Markus Beckmann
Network Analytics Offering Lead
Accenture
Anni-Albers Str.11
D-80807 München
Tel: +49 175 57 68467
Alemu Abate
Engineering Access & Transport
Mobile Access
Telefónica Germany GmbH & Co. OHG
Georg-Brauchle-Ring 23-25
80992 München
Tel: +49 176 2442 4816

Telefónica Project Motivation and Objective
Accenture Approach and Solution
Discussion with Q&A
Agenda
3

Telefónica Project Motivation and Objective
Accenture Approach and Solution
Discussion with Q&A
Agenda
4

Network Operator Challenges
Why advanced analytics for network planning?
Today's challenge• High percentage of Smartphones
• Introduction of multiple data services
• Dynamic behaviour of customer, device & application
• Rapid growth of data, while voice & SMS decreases
> Simple trending of existing traffic is no longer enough
5

Network Operator Objectives
What to do going forward?• Paradigm change required to manage network capacity
• Profiling of customers, devices & applications behaviour
• Identify drivers/ variables of capacity demand
• Optimise investment between technologies (3G vs. LTE)
• Define “What-if” scenarios to verify new business strategy
> Apply analytics (tools) to monetize data traffic
6

Telefónica Advanced Network Planning
Feedback Loop to
Fine Tune Model
Forecasting Engine
f(App, Device, user, Take
rate time,...)
Statistical Analysis
Data Crunching
/ Correction
Data Processing
& Forecasting
Network PerformanceD
ata
Service
Level
Perform.
Traffic
Trend
System
ResourceUsage
CQI
Distribution
Network Configuration
Site/Sector
Capacity
Iub-
Connectivity
2G/LTE
Collocation
Clutter/
Cluster Information
Network Strategy
LTE Off-
Loading Potential
2G/3G/LTE
Interworking
Small
Cells
...
Input from Business Unit
Subscriber
Forecast
Regional
Market Share
Customer
Segment
Tariff
Groups
DPI Analysis
RNC Trace
Device
Profiling
Service
Profiling
External Trends
Market
Trend Indicators
...
External Data
Site/ Sector Level Network Data
Analysis Result per Site/ Sector
Forecasted
Traffic Load (Offered Traffic)
Required
Upgrade Type (Radio,
Baseband,...)
Time to Trigger
Upgrade (Lead Time)
Daily/ Seasonal
Trend Variation
Clustering/
Profiling of Sites/Sectors
...
Aggregated Analysis
Volume of
Upgrade per Cluster/ City
Volume of
Upgrade per
Vendor
Type of
Upgrades
Interactive
“What if”
Analysis
...
Required Output
7

Telefónica Project Motivation and Objective
Accenture Approach and Solution
Discussion with Q&A
Agenda
8

• Node (Base Station) Clustering
• Real Capacity Diagnosis
• Traffic Demand Forecasting
Accenture Project OverviewRadio Access
Network
Data ETL
• Traffic and capacity analysis
• What-if scenario simulation
• Investment optimization
Scope
• 3G data services
• Region: two major cities
Data Extraction, Transformation and Loading
• Extraction, cleaning, profiling and data loading in staging area
• Data include CDRs, performance counters, user information
etc.
Back-End Analytics
• Demand forecasting model per each node in RAN
• Real capacity diagnosis per each node in RAN
• Multidimensional clustering of RAN nodes
Front-End Functionality
• Detailed analysis of historic & future traffic per node
and compare against available capacity
• Traffic decomposition per node
(device, application, user breakdown etc.)
• Interactive ad-hoc reports that implement what-if scenarios
• Investment optimization proposals
Internal &
External Data
Sources
9

Hardware utilization
information (hourly
counters)
Traffic Busy Hour Capacity
Diagnosis (per Cell)
Radio link quality
information (hourly
counters)
User Busy Hour Capacity
Diagnosis (per Node)
Daily or Busy Hour Traffic
Forecast (per Node)
Daily or Busy Hour User
Forecast (per Node)
Daily/Node to Busy
Hour/Cell Traffic Mapping
Daily/Node to Busy
Hour/Node User Mapping
Target threshold & what-if
modifiers
Probability to reach
traffic capacity threshold
Probability to reach user
capacity threshold
Target threshold & what-if
modifiers
Weighting and
Prioritization Rules
and Dimensioning
Goals
Prioritized
Node
Upgrade List
Node Clustering Insights
Pricing Information
Capacity Diagnosis Demand Forecasting Gap Analysis Investment Optimization
Upgrade List
End-to-End Approach
10

• Several attributes per node
used for profiling (daily
traffic, signal to traffic ratio,
2G to 3G ratio, traffic per
user, device decomposition,
busy hour distribution etc.)
• Bayesian hierarchical
clustering algorithm applied
• The Hierarchical tree and
associated statistical
measures are used to
determine the optimal
number of clusters
Multidimensional Node Clustering
• Cluster are homogenous
group of nodes
• Detailed profile per cluster to
reveal the predominant
attributes
• Business logic is applied to
leverage the clustering
insights in network upgrade
11

Capacity Diagnosis Methodology
Example:
Detecting saturation
on hardware resources
utilization
Example:
Analyzing the effect
of radio link
quality to cell’s
maximum throughput
The capacity for each individual base station is derived using a data
driven approach rather than relying on generic vendor’s specifications
Traffic Capacity Factors• Limitation on downlink traffic throughput per cell
• Capacity mainly depends on radio link quality but can also be
affected by other factors
• Radio link quality is reported by the user equipment through
the CQIs
• Node’s capacity increased by adding more cells
User Capacity Factors• Limitation on simultaneous users per cell either on downlink or
uplink directions
• Additional limitation on simultaneous users per node (across
cells) either on downlink or uplink direction
• Capacity depends on Node B’s available hardware resources
• Node’s capacity increased by adding
more hardware resources
12

Demand Forecasting Methodology
Model Output (per node)
Goodness of fit metrics (R2 etc.)
Component Decomposition
Coefficient & Significance per Component
Forecasts with Confidence Limits per Component
Forecast validation metrics (sMAPE etc.)
Model Input (per node)
Historic information over 2 years (traffic & user demand, capacity
upgrades, special events etc.) are provided as input to the model
Unobserved Component Model (UCM) has been selected for solving the
forecasting problem
• It estimates automatically deterministic or stochastic unobserved
components
• It provides forecasts through the application of Kalman filtering
• It incorporates both autoregressive and explanatory regression terms
Dimensioning
Model Training
Model Testing
Model Refresh
Model Forecast
13

Generated Insights & Business Value
Lack of granular data-driven predictive insights
prohibits legacy approaches to utilize network
capacity upgrade budget at maximum efficiency
• Over-investment: 66% of total upgrades were planned on
nodes with low saturation risk and low value
• Under-investment: 80% of nodes with high saturation risk
were not the planned for upgrades
In the case study example roughly 41% of the
planned CAPEX would have to be reallocated to
tackle the under-investment problem and an
additional 25% could be to deferred to limit
over-investment
Increased Quality of Experience for end
customers and maximized Return on Investment
for the network operator can be achieved at the
same time
Under-investment
Over-investment
14

Interactive
What-If
Simulation
Interactive
Investment
Prioritization
Advanced Network Planning ToolA powerful front-end offers ad hoc data exploration in a consolidated data-mart
and evaluation of custom “What-If” scenarios
Web-based frontend
for Network Planners
Strategic Planning
with Analytical
Insights
15

Telefónica Project Motivation and Objective
Accenture Approach and Solution
Discussion with Q&A
Agenda
16

Discussion
17

18
Annex
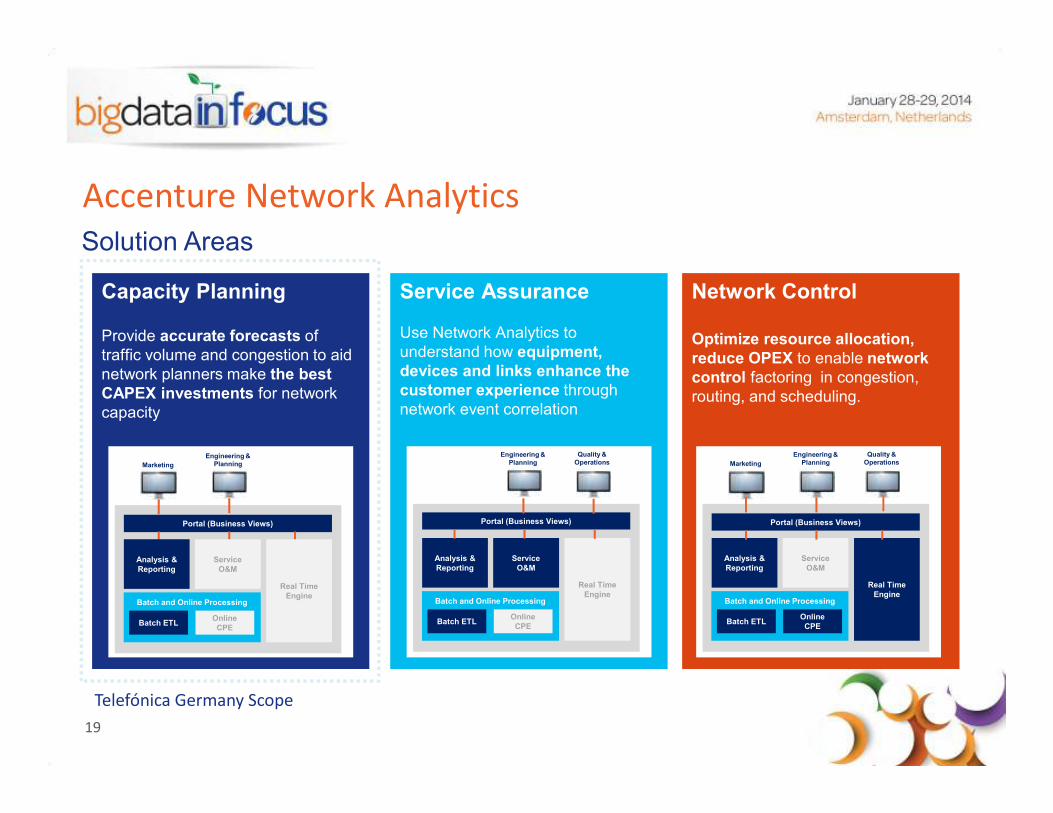
Accenture Network Analytics
Capacity Planning
Provide accurate forecasts of
traffic volume and congestion to aid
network planners make the best
CAPEX investments for network
capacity
Service Assurance
Use Network Analytics to
understand how equipment,
devices and links enhance the
customer experience through
network event correlation
Network Control
Optimize resource allocation,
reduce OPEX to enable network
control factoring in congestion,
routing, and scheduling.
Solution Areas
Marketing
Engineering &
Planning
Portal (Business Views)
Batch and Online Processing
Batch ETLOnline
CPE
Engineering &
Planning
Portal (Business Views)
Real Time
Engine
Service
O&M
Analysis &
Reporting
Batch and Online Processing
Batch ETLOnline
CPE
Quality &
Operations
Analysis &
Reporting
Service
O&M
Real Time
Engine
Marketing
Engineering &
Planning
Portal (Business Views)
Analysis &
Reporting
Service
O&M
Real Time
EngineBatch and Online Processing
Batch ETLOnline
CPE
Quality &
Operations
Telefónica Germany Scope
19

Demand Forecasting: How it works?
20

Demand Forecasting: How accurate is it?
In these
exemplary
nodes,
forecasts (red)
are very close
to actual
demand (blue)
despite the
noisy nature of
the data.
21

“We Speak Analytics”
Accenture provides Business Analytics Services around the globe with more than 13,000
dedicated resources and a strong set of industry-leading insights
Depending on the underlying business requirements,
Accenture leverages its experience from more than
13,000 resources worldwide, including areas like:
• 6,500 Business Intelligence
• 3,500 Business Function Insights
• 3,000 Data & Technology Management
Accenture
Analytics
Business
ValueSupply
Chain
Commercial Business
Intellig.
Organisation
& Talent
Big
Data
22To find out more, click here