Advanced Multi-Product Coal Utilization By-Product ... Library/Research/Coal/major... · Advanced...
49
Advanced Multi-Product Coal Utilization By-Product Processing Plant Final Report Principal Authors: Thomas Robl and John Groppo April 2007 U. S. Department of Energy Cooperative Agreement No. DE-FC26-05NT41781 Performance Period: November 8, 2004 - March 31, 2007 DOE Project Manager: Sai Gollakota Center for Applied Energy Research 2540 Research Park Drive University of Kentucky Lexington, KY 40511
Transcript of Advanced Multi-Product Coal Utilization By-Product ... Library/Research/Coal/major... · Advanced...

Advanced Multi-Product Coal Utilization By-Product Processing Plant
Final Report
Principal Authors: Thomas Robl and John Groppo
April 2007
U. S. Department of Energy Cooperative Agreement No. DE-FC26-05NT41781
Performance Period: November 8, 2004 - March 31, 2007
DOE Project Manager: Sai Gollakota
Center for Applied Energy Research
2540 Research Park Drive
University of Kentucky
Lexington, KY 40511

2
Disclaimer
This report was prepared as an account of work sponsored by an agency of the
United States Government. Neither the United States Government nor any agency
thereof, nor any employees, makes any warranty, expressed or implied, or assumes any
legal liability or responsibility for the accuracy, completeness, or usefulness of any
information, apparatus, product, or process disclosed, or represents that its use would not
infringe privately owned rights. Reference herein to any specific commercial product,
process, or service by trade name, trademark, manufacturer, or otherwise does not
necessarily constitute or imply its endorsement, recommendation, or favoring by the
United States Government or any agency thereof. The views and opinions of the authors
expressed herein do not necessarily state or reflect that of those of the United States
Government or any agency thereof.

3
Acknowledgement
This report was produced with the support of the U.S. DOE under Award No. DE-FC26-
05NT41781. This Cooperative Agreement was administered by the Office of Fossil
Energy‟s National Energy Technology Laboratory under the Clean Coal Power Initiative
during the period 08 November 2004 through 31 March 2007. CAER would like to
acknowledge the participation of E.ON U.S. Kentucky Utilities‟ Ghent Generating
Station where the pilot-scale field tests were conducted. Cemex U.S.A. participated in
the market assessment studies.

4
Abstract
The overall objective of this project is to design, construct, and operate an ash
beneficiation facility that will generate several products from coal combustion ash stored
in a utility ash pond. The site selected is LG&E‟s Ghent Station located in Carroll
County, Kentucky. The specific site under consideration is the lower ash pond at Ghent,
a closed landfill encompassing over 100 acres.
Coring activities revealed that the pond contains over 7 million tons of ash,
including over 1.5 million tons of coarse carbon and 1.8 million tons of fine (<10 µm)
glassy pozzolanic material. These potential products are primarily concentrated in the
lower end of the pond adjacent to the outlet.
A representative bulk sample was excavated for conducting laboratory-scale
process testing while a composite 150 ton sample was also excavated for demonstration-
scale testing at the Ghent site. A mobile demonstration plant with a design feed rate of
2.5 tph was constructed and hauled to the Ghent site to evaluate unit processes (i.e.
primary classification, froth flotation, spiral concentration, secondary classification, etc.)
on a continuous basis to determine appropriate scale-up data.
Unit processes were configured into four different flowsheets and operated at a
feed rate of 2.5 tph to verify continuous operating performance and generate bulk (1 to 2
tons) products for product testing. Cementitious products were evaluated for
performance in mortar and concrete as well as cement manufacture process addition. All
relevant data from the four flowsheets was compiled to compare product yields and
quality while preliminary flowsheet designs were generated to determine throughputs,
equipment size specifications and capital cost summaries.
A detailed market study was completed to evaluate the potential markets for
cementitious products. Results of the study revealed that the Ghent local fly ash market
is currently oversupplied by more than 500,000 tpy and distant markets (i.e. Florida) are
oversupplied as well. While the total US demand for ultrafine pozzolan is currently equal
to demand, there is no reason to expect a significant increase in demand.
Despite the technical merits identified in the pilot plant work with regard to
beneficiating the entire pond ash stream, market developments in the Ohio River Valley
area during 2006-2007 were not conducive to demonstrating the project at the scale
proposed in the Cooperative Agreement. As a result, Cemex withdrew from the project
in 2006 citing unfavorable local market conditions in the foreseeable future at the
demonstration site.
During the Budget Period 1 extensions provided by the DOE, CAER has
contacted several other companies, including cement producers and ash marketing
concerns for private cost share. Based on the prevailing demand-supply situation, these
companies had expressed interest only in limited product lines, rather than the entire ash
beneficiation product stream. Although CAER had generated interest in the technology,
a financial commitment to proceed to Budget Period 2 could not be obtained from private
companies. Furthermore, the prospects of any decisions being reached within a
reasonable time frame were dim. Thus, CAER concurred with the DOE to conclude the
project at the end of Budget Period 1, March 31, 2007. The activities presented in this
report were carried out during the Cooperative Agreement period 08 November 2004
through 31 March 2007.

5
Table of Contents
Section Page No.
Disclaimer…………………………………………………………………………………2
Acknowledgement ………………………………………………………………………3
Abstract……………………………………………………………………………………4
Table of Contents…………………………………………………………………………5
List of Figures………………………………………………………………......................6
List of Tables ……………………………………………………………………………6
List of Abbreviations… …………………………………………………………………7
Technical Progress by Task……………………………………………………………….8
Task 1. Project Definition ……………………………………………………….8
Subtask 1.1. Initial Sample Collection and Characterization…………………….8
Subtask 1.2. Pond Assessment..………………………………………………….8
Subtask 1.3. Bulk Sample Collection and Characterization..…………………….8
Subtask 1.4. Unit Process Evaluation…………………………………………….9
Subtask 1.5. Product Evaluation...………………………………………………15
Subtask 1.6. Market Survey and Business Plan…………………………………17
Subtask 1.7. Plant Location and Infrastructure………………………………….27
Task 2. Design………….……………………………………………………….27
Subtask 2.1. Preliminary Plant Design………………………………………….27
Conclusions………………………………………………………………………………47

6
List of Figures
Page No.
Figure 1. Process Flowsheet 1…………………………………...……………..……… 30
Figure 2. Process Flowsheet 2……………………………………………...…….……. 32
Figure 3. Process Flowsheet 3…………………………………………………………..34
Figure 4. Process Flowsheet 4………………………………………………………..…36
List of Tables
Page No.
Table 1. Competing Sources 100 Miles Radius from Ghent…….……………..……… 18
Table 2. Performance of Ultra Fine Pozzolans Compared to Cement Only. …..……… 23
Table 3. Summary of Process Flowsheets Evaluated, 50 tph Basis..…………..……… 26
Table 4. Determination of Equipment Installation Factors……...……………..……… 37
Table 5. Equipment List and Cost Estimate for Flowsheet 1…....……………..……… 38
Table 6. Equipment List and Cost Estimate for Flowsheet 2…………………..……… 40
Table 7. Equipment List and Cost Estimate for Flowsheet 3…………………..……… 42
Table 8. Equipment List and Cost Estimate for Flowsheet 4…………………..……… 44
Table 9. Summary of Installed Plant Costs and Products Produced …..……………… 46.

7
List of Abbreviations
AEA Air Entraining Admixture
ASTM American Society for Testing and Materials
Btu British Thermal Units
CAER Center for Applied Energy Research
EP Econosizer Product
ESP Electrostatic Precipitator
f.o.b. Free On Board
FP Flotation Product
FUFA Ultra-Fine Ash (with flotation)
FWAA Federal Highway Administration
GGBFS Groung Granulated Blast Furnace Slag
gpm Gallons per Minute
LG&E Louisville Gas and Electric Co.
LOI Loss on Ignition
MK Metakaolin
MW Molecular Weight
NRMCA National Ready Mix Concrete Association
NSF Naphthalene Sulfonate Formaldehyde Condensate
PAM Polyacrylamide
PEO Polyethylene Oxide
ppm Parts per Million
SAI Strength Activity Index
SPP Sulfonated Petroleum Product
tph Tons per Hour
tpy Tons per Year
TVA Tennessee Valley Authority
USDoE United States Department of Energy
UFA Ultra Fine Ash (without flotation)
UFFA Ultra Fine Fly Ash
USGS United States Geological Survey

8
Technical Progress by Task
Task 1. Project Definition
Subtask 1.1. Initial Sample Collection and Characterization
Status: Completed
Summary: The coal used by the Ghent power plant and the fly and bottom ashes
produced were sampled during the pre-award phase of the project. The fly ash was
collected from bins that were associated with the electrostatic precipitator collection
fields. The Ghent plant uses two-field ESP and the bulk of the ash is collected in the first
field. The samples were subjected to ultimate and proximate analysis utilizing standard
ASTM techniques. The samples were ashed and subjected to X-ray fluorescence analysis
for both major and trace elements using international ash and rock standards as
calibration. Mercury was analyzed on a LECO Hg analyzer on a raw sample basis
The ash produced by the plant was found to be highly variable as the plant
consumes high and low sulfur bituminous coal in Units 1 and 2, and a mixture of sub-
bituminous and bituminous coal in Units 3 and 4. The ash produced reflected this
consisting of an iron-rich (~24%, Fe2O3), aluminum rich (~29% Al2O3) and high calcium
(6% - 7%, CaO) ash, respectively. The LOI of the ash typically was in the range of 5.5%
to 6.5%, but individual samples ranged from 1% to almost 9%.
Subtask 1.2. Pond Assessment
Status: Completed
Summary: The lower pond at Ghent is a substantial body, covering more than
100 acres, with a volume that exceeds 200 million cubic feet. The sedimentation,
stratigraphy and resource assessment of the in-place ash was investigated with
vibracoring and three-dimensional, computer-modeling techniques. Thirteen cores to
depths reaching nearly 40 feet were retrieved, logged in the field, and transported to the
lab for a series of analyses for particle size, loss on ignition, petrography, x-ray
diffraction, and x-ray fluorescence.
Collected data were processed using ArcViewGIS, Rockware, and Microsoft
Excel to create three-dimensional, layered iso-grade maps, as well as stratigraphic
columns and profiles, and reserve estimations. The ash in the pond was projected to
exceed 7 million tons, and contain over 1.5 million tons of coarse carbon and 1.8 million
tons of fine (<10 µm) glassy pozzolanic material. The size, quality and consistency of
the ponded material suggests that it is the better feedstock for the beneficiation plant than
the ash that is currently produced.
Subtask 1.3. Bulk Sample Collection and Characterization
Status: Completed
Summary: Approximately 2 tons of pond ash was retrieved from the Ghent site
and processed at CAER in Lexington, KY. The specific sampling location was
determined from the data collected in Subtask 1.2 in order to obtain a bulk sample that
would be representative of the ash that would be processed by the proposed plant.
The bulk sample was processed using continuous pilot-scale equipment to
produce product streams that would be similar in characteristics and quality to what

9
would be produced in commercial operation. This was necessary to evaluate the
thickening and dewatering characteristics of the product slurries (Subtask 1.4).
Subtask 1.4. Unit Process Evaluation
Because of the significant amount of varied activities and effort involved in this
subtask, a brief summary will be provided for each in order to clarify the results and
status of specific activities.
1.4.1. Unit Process Testing of Fly Ash
The following Subtasks were completed using a mobile demonstration plant that was
constructed and operated at the Ghent site. The demonstration plant was a self-contained
facility with a feed rate of 2.5 tons/hr. In order to operate the demonstration plant with a
consistent, representative feed, approximately 150 tons of ash was excavated with a back
hoe from the same region of the pond used to complete Subtask 1.3. The entire 170 tons
was pre-screened to remove at 3/8 inch to remove vegetation and minor amounts of
bottom ash to prevent valve plugging during testing. Each of the unit processes was
evaluated using a variety of operating conditions to determine appropriate scale-up data
necessary to complete Task 2.
1.4.1.1 Hydraulic Classification
Status: Completed
Summary: The classification testing was conducted using a continuous
demonstration-scale primary classifier (4ft x 4 ft discharge area) that was operated at a
production rate of 1 to 6 tons/hr. The feed for all testing was prepared as a slurry by
transferring the -3/8” stockpiled ash into a 500 gallon primary mix tank with a conveyor
that was fed by a Bobcat loader. The tank was filled with the appropriate amount of
water and mixed by circulating with a centrifugal pump at a rate of 100 gpm. Once the
desired pulp density was achieved, the contents of the primary mix tank were diverted to
a second 500 gallon tank which served as the classification feed tank. As the slurry was
transferred into the classification feed tank, it was passed across an oversize screen (6
mesh) to remove coarse ash and vegetation. The -6 mesh slurry was circulated by a
centrifugal pump, again at a rate of 100 gpm, and agitated with a mechanical impeller.
To conduct classification testing, feed slurry was diverted into the primary
classifier at the desired rate which was monitored with an ultrasonic flowmeter. The feed
slurry enters the primary classifier through a constant-head feed box in order to minimize
fluctuations. The feed slurry enters near the base of the primary classifier and impinges
on an inclined plate to divert the particles upward. Fine particles remain in suspension
and overflow the device while coarse particles settle and are removed from the base of
the classifier by a variable speed pump. To ensure feed consistency, preliminary tests
were conducted by re-circulating the classifier products (overflow and underflow) back to
the classification feed tank, so as to operate in a closed slurry loop.
Tests were conducted by allowing the classifier to operate at the desired
conditions for a minimum of 30 minutes, regularly checking the flow rate of each product
stream (i.e., overflow, underflow and feed), and then obtaining representative samples of
10
each product. Samples were returned to the laboratory where they were weighed, filtered
and dried to determine percent solids and a detailed size distribution by a combination of
screening and laser diffraction. During testing, an additional set of slurry samples were
also taken in known volume containers to accurately determine the specific gravity of the
slurry so that an accurate mass balance for each test could be calculated.
Although good classification results were achieved under a variety of operating
conditions, coarse rejection efficiency decreased with increasing feed rate. It was
determined that the maximum feed rate to the primary classifier for efficient
classification should be 50 gpm of slurry at 15% solids with a throughput of 2.3 tons/hr.
Primary classification was shown to be effective for rejecting coarse (+100 mesh)
material from the pond ash while maintaining high recovery of -100 mesh and
particularly -5 µm ash. The classifier used was capable of efficiently providing this
separation under a variety of feed rates and pulp densities, but +100 mesh rejection
decreased with increasing feed rate. Operating the classifier at a feed rate of 40 to 50
gpm provided the primary classification desired to meet the project objectives.
In summary, the best results obtained with primary classification were met at a
feed rate of 40 to 60 gpm. Higher feed rate results in poor classification and poor
rejection of coarse solids while lower feed rate diminishes both yield and recovery of
ultrafines. In regards to feed solids, operating at high feed solids (i.e. 25%) provided
reduced rejection of +100 mesh solids when the feed rate was higher than 40 gpm.
1.4.1.2 Batch Flotation
Status: Completed
Summary: This Subtask was completed using laboratory flotation equipment to
assess the flotation characteristics of the Ghent pond ash. The feedstock used was from
the bulk sample obtained in Subtask 1.3. A composite, representative sub-sample was
obtained and classified to simulate primary classification to reject +100 mesh material.
The -100 mesh slurry was then evaluated using a release analysis, which is a series of
batch flotation rougher, cleaner, and scavenger stages. The release analysis is commonly
used in flotation evaluation to determine the limits of separation that can be achieved by
froth flotation.
Release analysis showed that froth flotation could effectively be used to reduce
the classified ash from 4.5% LOI to the target grade of 2.5% LOI with a yield as high as
90%. The corresponding froth product could have a grade as high as 20% LOI.
Although the froth grade achieved was lower than desired for a high-grade fuel product,
higher grade froth products could only be achieved by flotation with higher LOI tailings
grade. The only means of changing the results predicted by the release analysis would be
to change the liberation of un-burned carbon by grinding, an option not considered as
economically viable for this project since the froth product is not a primary product. The
role of froth flotation is simply to reduce the amount of unburned carbon in the flotation
tailings to enable its use as a pozzolan.
Addition batch flotation on classified ash showed that the desired tailings grade of
2.5% LOI could be achieved with 1.5 to 2 lbs of collector/ton and less than 0.8 lbs/ton of
frother. The collector used (SPP) was a mixture of 90% #2 fuel oil and 10% petroleum
sulfonate while the frother was Ciba F948, a water soluble mixed glycol product.

11
1.4.1.3 Pilot Plant Flotation
Status: Completed
Summary: Froth flotation testing was conducted on the primary classification
overflow slurry of the demonstration plant in order to assess the effectiveness of froth
flotation at reducing the LOI of the overflow slurry. During flotation testing, the feed
solids to primary classification were maintained at 12 to 15% solids and the underflow
withdrawal rate was maintained at 6% of the feed rate in order to achieve effective
rejection of coarse (+100 mesh) solids and effective recovery of -5 µm ash.
The primary classifier overflow flowed by gravity to a bank of 4 Denver
mechanical flotation cells (2‟x2‟x2‟ each). Individual cell froth height was adjusted by
means of gate valves and froth was removed by mechanical scrapers. Flotation reagents
(collector and frother) were metered into the air intake of the first flotation cell.
The froth product was collected in a launder which drained to a holding area
while the flotation tailings drained from the last cell into a similar drainage line. After
the cells were operating at equilibrium for a period of time equivalent to 3 times the
retention time, samples of the flotation feed, froth, and tailings were obtained for
laboratory analyses of % solids, LOI, and size distribution by sieving and laser
diffraction. An additional set of samples were taken in fixed volume containers to
determine the pulp specific gravity on site. This data, along with timed flow samples,
were tabulated to ensure an accurate mass balance for each test.
In order to reduce the LOI of the primary classifier overflow to below 3% LOI, a
minimum retention time of 6 minutes was required, using 1.2 lbs/ton collector and 0.23
lbs/ton frother. Reagent costs to provide acceptable grade tailings were 0.50 to 1.00 $/ton
of flotation feed and longer retention times did not provide any significant benefit in
terms of performance.
Increasing collector dosage reduced tailings LOI, but also reduced tailings yield
and correspondingly reduced froth grade. Increasing frother dosage effectively decreases
tailings LOI, however at higher frother dosages (>0.3 lbs/ton) the quantity of froth that is
generated is excessive and could potentially create handling challenges. Since higher
frother dosages do not provide significantly better tailings grade, it is highly
recommended that frother dosages be minimized from both a cost and handling
perspective.
All of the demonstration plant flotation data was consistent with predictive results
from the release analysis. The release analysis for the composite feed sample contained
3.8% LOI, which was reduced to 2.5% LOI with a yield of 90%. The corresponding
froth product (10% yield) contained 18% LOI. The release analysis also shows that the
tailings could be reduced to as low as 1.5% LOI with a yield of 62% and a
correspondingly lower froth grade (7% LOI). The close proximity of the flotation data to
the release analysis indicates that most of the results obtained in the demonstration plant
operation were quite close to the limits of separation that flotation could achieve. Further
testing to assess the effect of variables such as feed solids, froth depth, etc., would not
produce results that would be better than the release analysis shows. The only means of
changing the release analysis is to change the liberation of the carbon in the feed or
change the feed sample altogether.
In summary, froth flotation was evaluated to reduce the LOI of the primary
classifier overflow to below 3%. A minimum retention time of 6 minutes was required to

12
provide LOI reduction to 2.5% LOI using 1.2 lbs/ton collector and 0.23 lbs/ton frother.
Reagent costs to provide acceptable grade tailings were 0.50 to 1.00 $/ton of flotation
feed. Demonstration plant flotation results were consistent with release analysis results,
indicating that no further significant improvement in flotation performance could be
expected with additional testing.
1.4.1.4 Pozzolan Thickening/Filtration
Status: Completed
Summary: Testing was conducted with a variety of filter media samples in order
to assess the feasibility of using vacuum filtration with conventional media to recover the
ultrafine ash (UFA) product. This testing was conducted in response to recommendations
by technical representatives from several filter manufacturing companies. The filtration
media samples evaluated were a variety of monofilament, multifilament and combination
polypropylene fabrics.
The evaluation was conducted using commercial media samples mounted on a
batch filtration apparatus with 4 mesh media support. A suspension of UFA was filtered
through the media and rate was determined electronically. After filtration was
completed, cake moisture was determined and solids recovery was also determined by
filtering the solids in the filtrate with a Millipore filter (0.5 µm).
A total of 5 media candidates were evaluated. One multifilament candidate, 853F
was eliminated since the entire sample passed through media and no solids recovery
occurred. All of the media candidates tested provided essentially the same cake moisture
after a cycle time of 2 minutes (i.e. 28.5 to 29% moisture). The fastest filtration results
during cake formation were obtained with 901F multifilament with M929 monofilament
providing the slowest. In terms of solids capture, M929, 901F, and 950A recovered 97 to
99.5% of the feed solids in the cake while 950B provided 90.9% solids capture.
Based on the results obtained from batch filtration testing, it was determined that the
most suitable filter media for this substrate in terms of filtration rate, solids capture, and
cake moisture was 901F multifilament fabric.
Although the fabrics evaluated provided good results for filtering such fine
particulates, it was apparent that the filtration rate was inadequate for an industrial
process. Cake thickness was too small (<2 mm) to ensure cake removal. In order to
continuously dewater a significant amount of UFA with a reasonably sized filter, it would
be necessary to use flocculating agents.
A variety of flocculants (anionic, nonionic and cationic) and molecular weights (4
to 16 million) were screened using standard jar tests to determine the appropriate
chemistry that would provide effective floc formation. After the initial screening, it was
determined that two different chemistries would be appropriate; polyethylene oxide
(PEO) and polyacrylamide (PAM). A molecular weight series of PEO products was
obtained from Dow Chemical and a similar series of PAM products was obtained from
Cytec, Inc. Settling tests were conducted and it was determined that the lower molecular
weight products (i.e. 4 million MW) provided the most desirable floc structure. Higher
molecular weight flocculants, while providing faster setting rates, provided large, fluffy
flocs which would entrain moisture in the floc structure during filtration. In addition, the
fast settling rate provided poor clarity.

13
Settling tests were conducted in 1 liter glass cylinders. At a dosage of 1 ppm
PEO, the settling rate of the flocculated UFA was 4.5 inches/minute for the first 2
minutes and decreased to 3 inches/minute after 5 minutes. Essentially the same results
were obtained with a dosage of 5 ppm. A more desirable initial settling rate of 6
inches/minute was obtained with a dosage of 2.5 ppm PEO, while increasing the dosage
to 10 ppm was not advantageous at all. For effective thickener operation, an initial
settling rate of 4 to 12 inches/minute is desirable. This settling rate provides adequate
solids settling and compaction while maintaining overflow clarity.
The initial settling rate obtained with 5 ppm PAM was very high (22
inches/minute). While this may seem beneficial, it is in practice much too fast to
maintain consistent thickener operation in terms of both solids compaction and overflow
clarity. Based upon these results, it was determined that the most appropriate flocculant
treatment for UFA would be 5 ppm PEO.
In order to assess the filtration characteristics of flocculated UFA, a series of
batch filtration tests was conducted on a UFA slurry produced using laboratory pilot-
scale equipment under conditions that would be anticipated during commercial operation.
The slurry (5% solids w/w) was flocculated with 5 ppm PEO and the settled solids (25%
solids w/w) were recovered for filtering using F901 media. At a cake thickness of 4.3
mm, cake formation occurred at 30 seconds and the resulting cake moisture after 2.5
minutes was 32.1% moisture. Increasing the cake thickness to 5.8 mm increased the cake
formation time to 45 seconds and provided a cake with 31.0% moisture. Further
increasing the cake thickness to 7.3 mm increased cake formation to 53 seconds and cake
moisture was 31.8%. For comparison, when no flocculant was used, cake formation
occurred at 90 seconds (1 mm cake thickness) and the final cake moisture was 29.0%.
A series of test were conducted during filed demonstration testing to evaluate
continuous filter performance. These tests were conducted using an Eimco vacuum drum
filter (12” wide x 18” diameter drum) with 901F media.
Flocculated (5 ppm PEO) UFA (25% solids w/w) was pumped into the vacuum
filter tub. The slurry feed rate was adjusted to maintain a constant tub level and the filter
was allowed to operate under fixed conditions for 15 minutes. Timed samples of the
discharged filter cake and filtrate were simultaneously taken and analyzed. The
procedure was repeated for different cycle times. Maximum throughput (115 lb/hr) and
dry cake rate (25 lb/ft2/hr) were achieved at a cycle time of 1.25 minutes. Under these
conditions the cake moisture was 30.5% with 85% solids capture. Increasing cycle time
not did not reduce cake moisture but did reduce the dry cake rate and throughput. The
longer cake formation time during the longer cycle time did not provide additional cake
deposition, suggesting that the cake resistance is quite high. At shorter cake formation
time (i.e. shorter cycle time), dry cake rate and throughput also were diminished with a
modest reduction in moisture. These results indicate that there is an optimum cake
thickness and it is achieved at a cycle time of 1.25 minutes with this filter.
In summary, the proper flocculant to provide satisfactory thickening and clarity
results on the UFA product is PEO at a dosage of 5 ppm on a slurry basis. These
conditions provide a settling rate of 6 inches/minute and settled solids concentrations of
over 50% solids by weight. PEO has been used in numerous concrete applications as a
viscosity reducer and will not present any adverse effects to cement chemistry,
particularly when used at such a minimal dosage. Continuous vacuum filtration (1.25

14
minute cycle time) with the proper filter medium provided a product with sufficient
moisture reduction to enable direct use in concrete (30% moisture).
1.4.1.5 Froth Filtration Analysis
Status: Completed
Summary: Filtration evaluation of the froth product has been completed using
batch and continuous vacuum filtration approaches described in Subtask 1.4.1.4. For
each of the evaluations, a representative composite froth product generated during
demonstration testing was used. No addition media evaluations were conducted and the
same media (multifilament 901F) was used.
Cake moisture with 2 minute cycle time was 39.4% moisture and the filtration
rate was 24 lb/hr/ft2. The low filtration rate is attributed to the dilute pulp density of the
froth product (10% solids) while the high cake moisture is caused by the poor froth grade
(21% LOI) and the porous nature of the unburned carbon. The addition of flocculant (5
ppm) did not improve cake moisture or throughput.
Although the cake moisture of the filtered froth product is high, most of the
remaining water was within the pore structure of the carbon and the cake did not present
unusual handling difficulties. Nevertheless, dewatering the froth product presents several
technical challenges because the froth grade may be too low (2700 Btu/lb) to justify the
expense of a more complex dewatering circuit, such as the installation of a thickener in
order to reduce the volume of water that must be removed by filtration.
One other option would be to combine the coarse carbon from the spiral circuit
with the froth product. The addition of 2.5 wt% coarse carbon did not reduce cake
moisture, but more than doubled the filtration rate to 58.5 lb/hr/ft2. Further increasing the
amount of coarse carbon to 8.6% by weight further increased throughput to 97.8 lb/hr/ft2
at the same moisture content.
One additional option worthy of consideration would be collecting the froth
product in a lined drainage area until sufficient quantity was accumulated to warrant
excavation and stockpiling onto a drainage pad. This would effectively eliminate the
need for froth filtration while producing a product with similar moisture content and
handling properties.
1.4.1.6 Dryer Evaluation
Status: Completed
Summary: Dryer evaluations were conducted in consultation with thermal dryer
manufacturers familiar with the application and product end use. To produce a dry
product, fuel requirement will be 1100 Btu to evaporate 1 pound of water. Considering
the scale of the proposed operation and volatility of fuel prices, the use of thermal drying
presents a serious economic impediment to the successful completion of this project. An
even greater challenge is the air permits required to construct and operate a dryer at the
proposed facility.
Since the intended use of the pozzolan and UFA is in concrete, and water must be
added, evaluations were completed to prepare these products as stable slurries containing
65 to 70 wt% solids. With this scenario, the UFA product would be recovered from the
vacuum filter as a cake containing 70% solids. The cake would be sheared in a high-
shear mixer to prepare a pumpable slurry. Several dispersants are being evaluated to

15
promote slurry stability. At 60% solids, these slurries exhibit a viscosity of 2.3 Pa-sec
after 24 hours which remains essentially unchanged for 7 days. Although using this
approach would incur the additional cost of transporting water, the cost of thermal drying
would be eliminated. In addition, the necessity of dry particulate collection and storage
silos would be replaced by pumps and slurry tanks.
1.4.2 Unit Process Testing of Bottom Ash
Status: Completed
Summary: The process stream enriched in bottom ash reports to the reject stream
of the primary classifier. Examination of this product revealed a significant proportion of
unburned coal, an ash contaminant that would likely preclude the use of bottom ash as an
aggregate. Unburned coal is commonly rejected from coal pulverizers and frequently
contains pyrite. Spiral concentration effectively rejects pyrite, but not binary particles of
coal and pyrite, which exhibit a specific gravity similar to that of porous bottom ash. As
such, complete elimination of pyrite from bottom ash at the Ghent site is not likely and
any lightweight aggregate produced may present the potential to develop iron stains in
the finished product. However, if bottom ash currently produced at Ghent can be isolated
from mill rejects, the potential to produce a marketable lightweight aggregate certainly
exists.
Spiral concentration testing of the primary classifier underflow produced a
marketable fuel product containing 5800 Btu/lb. This product reports to the outside race
of the concentrating spirals along with most of the water and misplaced fines in the spiral
circuit. Dewatering is accomplished with a vibrating dewatering screen that effectively
removes water and misplaces fine ash.
An additional product stream may be generated from spiral concentration since
spherical magnetic particles are readily concentrated on the inside spiral race. This
product was not considered in this evaluation and the addition of a rotary magnet would
be necessary to produce a heavy media grade magnetic product.
Subtask 1.5. Product Evaluation
1.5.1 Pozzolan Testing
Status: Completed
Summary: Product evaluations of the UFA and pozzolan products in masonry and
concrete have been completed. These evaluations were conducted using bulk composite
products produced from demonstration plant operation. A brief summary of each phase
of product testing follows.
Product Evaluations in Mortar: As expected, flowsheets not incorporating secondary
classification produced products that were coarser. As such, the levels of water reduction
achieved by these coarser products were also lower. The primary classification product
(EP) product achieved a Strength Activity Index (SAI) of 85% of control strength in 7
days, 100% in 28 days and 130% in 56 days. The froth flotation product (FP) product
performed similarly after 7 and 28 days, but achieved only 103% of control in 56 days.
The highest strengths were obtained with the finer products produced by secondary
classification with (FUFA) and without (UFA) flotation. Several bulk products were

16
produced under a variety of operating conditions, with the finest products producing the
higher strengths. Both UFA and FUFA products provided SAI of 102 to 110% of control
in 7 days and 126 to 140% of control in 56 days. The higher dosages of air entraining
admixture (AEA) to achieve constant air for the finer products is attributed primarily to
increased fineness.
Product Evaluations in Concrete: Concrete testing was conducted using a Kentucky
Transportation Pavement Mix design and substituting Trimble ash or UFA at a
substitution rate of 20%. The Trimble ash achieved 87% of control strength after 7 days
and increased to 102% after 56 days. Two series of tests were conducted with UFA and
although there were some differences particularly for the early strengths, the UFA
outperformed the Trimble ash with 87-90.5% of control after 7 days, 105 to 107% after
28 days and 109.5 to 112% after 56 days.
Another series of concrete cylinders were poured using a Kentucky
Transportation Cabinet High Performance Mix Design (MA designation). The UFA
cylinders showed an expected delay in strength development during the early stages of
curing and outperformed the control after approximately 20 days.
At 5% UFA substitution, SAI was 101% after 1 and 7 days and increased to 106%
after 28 days. At 15% substitution, SAI decreased to 89.5% after 1 day and 98% after 7
days, but the longer term strength gains were apparent after 28 days as a SAI of 113%
was attained. At 25% substitution, early strengths were diminished and again, a SAI of
119.5% was achieved after 28 days. At the highest substitution level tested (35%), early
strengths were the lowest and SAI increased to 105% after 28 days. These results
illustrate that higher substitution levels certainly delay early strength development, but
surpass control strength after 28 days while lower substitution levels provide both early
and longer term strength.
One of the most significant benefits provided by using UFA in concrete mix
designs is the improved resistance to chloride permeability. While it has been known for
some time that using fly ash in concrete reduces permeability, using finer ash provides a
significant improvement in this criterion. Chloride permeability testing was conducted
using four different concrete mixes: control, 20% Trimble ash, 20% UFA, and 40%
UFA. Chloride permeability was improved when Trimble ash was used. Significant
further reductions were demonstrated when UFA was used, achieving an ASTM Chloride
Rating of Very Low.
The effect of Trimble ash and UFA on concrete flexural and tensile strength were
also evaluated. Results showed that marginal improvements in flexural strength were
realized with Trimble ash and were somewhat higher when UFA was used in the mix
design. Tensile strength was essentially unchanged when UFA was used and decreased
for the Trimble ash.
1.5.2 Specialized Cement Additive Evaluations
Status: Completed
Summary: While the traditional approach to using fly ash in concrete is to utilize
the ash as a direct replacement for Portland cement in concrete, an alternative approach
was considered, namely as a process addition in the production of cement clinker. This
approach offers several potential advantages for the cement kiln. Most notably,

17
production capacity can be increased with minor capital investment by essentially
extending the clinker by incorporating low levels (2.5 to 5%) of UFA into the clinker
itself. This alternative would be lower in cost to the more traditional approach of using
ground granulated blast furnace slag (GGBFS) at the same levels. Results show that
early and ultimate strengths can be improved, particularly at the 2.5% substitution level,
while offering the advantage of improved grinding efficiency since the UFA is fine
enough to preclude the necessity of further size reduction. A further benefit would be
increased clinker production without increased CO2 generation. The advantages to the
project are that the need for a thermal dryer would be eliminated and initial marketing of
the UFA during the early stages of the commercial phase would be simplified.
To evaluate this approach, a series of laboratory scale evaluations were conducted
using UFA produced as a stable, pumpable slurry (70% solids w/w) and the following
solids properties: d50 3-5 µm, density 2.41 g/cm3, 3.0% LOI, and 1.5% C. For
comparison, 6 µm Grade 120 GGBFS was also used. Mortar cubes were produced with
either UFA or GGBFS at 2.5% and 5% substitution levels. The results are shown in
Figure 4 and indicate that GGBFS and UFA slightly improved the 1 day strength activity
at 2.5% substitution; at 5%, strength was 94 – 96% relative to control. UFA consistently
exhibited higher 1 day strength activity relative to GGBFS at 2.5% and 5%, while
GGBFS and UFA showed similar 28 day strength activity at 5%, which ranged between
104 – 107%. At 2.5%, 28 day strength activity was higher for GGBFS (113%) than for
UFA (99%).
Based upon these results and the potentially significant benefits that are offered
by using UFA as a process addition, it is recommended that an industrial trial be
conducted using 2.5% UFA in accordance with ASTM C465. It is also recommended
that mortar and concrete testing of industrially ground cement be conducted by CAER
and Cemex.
Subtask 1.6. Market Survey and Business Plan
1.6.1 Market Assessment
Status: Completed
Summary:
GHENT LOCAL MARKET
The local pozzolan Fly Ash market (fly ash used as a partial replacement for Portland
Cement) has 500,000 tpy more supply than the current demand and Unit 2 at Trimble
County will add about 125,000 additional tons to that surplus supply in 2008. The
local price is $10 to $14 per ton. The main competition for Ghent would be the
LG&E Trimble County Station.
DISTANT MARKETS
The export or distant pozzolan market also has a supply that exceeds demand in most
of the locations. There are no existing barge terminals for fly ash in the markets
identified. Most of the distant supplies into these markets are provided to the
marketer at about no cost.
ULTRAFINE POZZOLAN MARKET

18
The total demand in the United States for ultra fine pozzolans is in the range of
100,000 tpy, and that is currently equal to the supply. The current price for ultra fine
pozzolans including UFFA is in the range of $200 to $300 per ton. There is no reason
to expect demand to depart from its historical relationship to Portland cement
demand.
A more detailed evaluation of the market assessment follows.
Local Market This study considers a local market an area that is financially attractive when
shipping by truck. This includes the cost of shipping and the competitive supply and
demand situation in the market area. Since the Ghent site is in the Ohio River Valley
which contains numerous other sources, the local market for each source is relatively
close to the source. Sources and markets within 100 miles of the Ghent Station have
been considered in this market study. Competing fly ash sources within this radius are
shown in Table 1.
TABLE 1
COMPETING SOURCES
100 MILE RADIUS FROM GHENT
PLANT CITY STATE TONS/YR CLASS PRICE1
CLIFTY CREEK MADISON IN 177,000 C $21.00
MILL CREEK LOUISVILLE KY 200,000 F $14.00
TRIMBLE COUNTY BEDFORD KY 120,000 F $14.00
MIAMI FORT NORTH BEND OH 70,000 F $10.00
ZIMMER MOSCOW OH 335,000 F $10.00
LAFARGE TERMINAL INDIANAPOLIS IN 0 C $28.20
TOTAL 902,000 1 $/ton fob source
Table 1 indicated the total supply of fly ash in the local market is about 900,000
tpy. The population in the local market area is about 7,500,000 and the per capita cement
consumption is about 0.38 tons per capita per year based on USGS cement consumption
data and US Census population data. This study assumes fly ash is used in 70 % of all
Portland cement applications with a 20 % substitution ratio. The fly ash demand is
therefore estimated to be about 400,000 tons/yr in the local market. Consequently there
is a surplus of 500,000 tons/yr of fly ash in the local market.
Fly ash replaces cement in concrete on about a 1:1 basis in concrete, and the price
of cement is about $100 per ton. Therefore, if the demand for fly ash was equal to or
higher than the supply, the price should be in that range. In states where demand exceeds
supply the price of fly ash is in the range of $70/ton. The low price of fly ash in the local

19
market as shown in Table 1 indicates the fly ash supply far exceeds the demand in the
local market.
Trimble County and Clifty Creek are within 50 miles of the Ghent station and
Mill Creek Miami Fort and Zimmer are within 100 miles. All of these sources are
competitive in at least one, and in some cases two, of the local major markets which
include Cincinnati, Louisville, Lexington, Indianapolis, and Dayton.
LG&E‟s Trimble County Station would be the primary competitive source with
pozzolan fly ash from Ghent. The Trimble County Station typically sells about 20,000
tpy in the local market at about $14 per ton. In the near term, this 20,000 tpy is the
maximum local market demand and price for pozzolan fly ash from Ghent. Demand is
expected to grow very slowly over the 10 year economic life for the proposed plant
investment and prices are not expected to increase significantly. The reasons for this are:
Miami Fort and Zimmer have a freight advantage to the Cincinnati, Northern
Kentucky, and Dayton markets,
Indianapolis is nearly 100 % a Class C market due to existing fly ash supply and is
over 100 road miles away from Ghent
Much of Louisville is a Class C market and LG&E‟s Mill Creek Station supplies the
Class F for this market.
Construction of the Ghent pozzolan fly ash plant would add significantly to the
local market supply and the forecast price is less than estimated operating costs. Finally,
the fly ash production at Trimble County is scheduled to double by 2008 when Unit 2
comes on line further adding to the oversupply. Therefore, the demand and price for
Pozzolan Fly Ash produced at Ghent would both be very low in the local market.
Export Markets
In the contract documents export markets were defined as “distant” markets that
could be reached by river barge or rail. Examples of distant markets given were Florida
and the major cities along the Ohio and Mississippi Rivers. All of these markets except
Miami, Florida have local fly ash sources and some have terminals for receiving and
distribution of fly ash from distant sources. All fly ash terminals in these markets are rail
served; none are river barge served. Though river transport is less costly per mile this
mode requires significantly higher investment in larger silos and sophisticated unloading
machinery compared to rail terminals. If barge transportation were economically
attractive it would be utilized for supplying the existing demand.
None of the fly ash supplied to the distant markets is beneficiated. All of this fly
ash comes from oversupplied markets in Texas and the Ohio River Valley. In these
markets utilities offer these fly ashes at very low price or with a freight subsidy to
encourage beneficial use rather than landfilling. The cost of beneficiating the Ghent fly
ash is a significant disadvantage in comparison to these competing sources. Many of the
distant sources selling non beneficiated fly ash in the studied distant markets have
additional volume available to meet the demand growth forecast over the economic life
of this plant project.
Following is a detailed assessment of the Florida and Ohio and Mississippi River
market areas.

20
Florida
Florida can be reached by rail. The major markets are Tallahassee, Jacksonville,
Orlando, Tampa Bay, and Miami.
Fly ash is currently being railed into Florida from the Ohio River Valley and
Texas.
Fly ash from LG&E‟s Mill Creek station is currently being railed into Florida and
that station has much more high quality fly ash available to meet demand growth.
Following is a review of the fly ash market in each of the Florida markets.
Tallahassee
This market is currently supplied by a beneficiated fly ash from Jacksonville,
some Georgia fly ash with high trucking costs, and a distant fly ash from another
Ohio River Valley source.
Jacksonville
This market is primarily supplied by a beneficiated fly ash from Jacksonville.
Orlando
This market is currently supplied by fly ash from the local municipal power
station, and from a power plant in Crystal River. Ground granulated blast furnace
slag (GGBFS) is also produced in this market and competes with fly ash.
Tampa Bay
This market is currently supplied by power plants in Crystal River and Tampa.
Tampa Electric Company has announced plans to beneficiate all Big Bend Station
fly ash adding over 200,000 tpy supply to this market.
The southern portion of this market area is currently supplied by a terminal in
Punta Gorda which distributes fly ash from Texas.
Miami
This market currently uses imported GGBFS and Texas fly ash from the Punta
Gorda terminal.
A major ready mix company is supplied with fly ash directly from Texas.
Ohio and Mississippi River Valleys
Cincinnati and Louisville are part of the local market for Ghent product.
The major markets on the Ohio and Mississippi River systems are Pittsburgh,
Huntington-Ashland, Evansville, St Louis, Chicago, Quad Cities, Minneapolis,
Memphis, Baton Rouge, and New Orleans.
There are numerous coal-fired power stations along the Ohio, Illinois, and upper
Mississippi Rivers creating an over supply of fly ash in most of these markets.
In summary, the demand in nearly all of these markets is being met with local fly
ash sources or with distant sources that have fly ash prices near $0 per ton fob the source.

21
Therefore, the export markets have insufficient demand and value compared with the
higher cost to produce pozzolan fly ash at Ghent.
A detailed review of each market follows.
Pittsburgh
This Class F market is currently supplied by power plants within the local market
by sources in western Pennsylvania and eastern Ohio.
Huntington-Ashland
This Class F market is currently supplied by power plants within the local market
by sources in western West Virginia and eastern Ohio.
Evansville
This Class F market is currently supplied by power plants within the local market
by sources at Petersburg, Indiana and Owensboro, Kentucky.
St Louis
This Class C market is currently supplied by power plants within the local market
including Labadie and Festus, Missouri and two plants in western Illinois.
Chicago
This Class C market is currently supplied by numerous power plants along the
Illinois River in the local market plus additional power plants and a rail terminal
in southern Wisconsin.
For a few years a river barge terminal in Calumet City supplied Class C fly ash to
southern Chicago, but this operation has stopped. It is unlikely that this terminal
would be economically attractive.
Quad Cities
This Class C market is currently supplied by power plants along the Mississippi
within the local market.
Minneapolis
This Class C market is currently supplied by power plants within the local market.
Memphis
This Class C market is currently supplied by a power plant within the local
market, plus others in Missouri and Illinois.
The TVA Cumberland station, a very large, high quality, Class F source, is within
150 miles
Baton Rouge and New Orleans
This Class F market is currently supplied with beneficiated fly ash from a power
plant in Hattiesburg, Mississippi. Future demand growth is projected to be
accommodated by existing sources with excess supply capacity.

22
ULTRA FINE FLY ASH (UFFA)
Product Description UFFA is principally used as an admixture in concrete as a partial substitute for
Portland cement to achieve very high strengths and excellent durability of the concrete.
Due to high price, UFFA is specified for applications requiring high-strength (>7,000
psi), sulfate or corrosion resistance, and resistance to alkali silica reactivity. These high
durability applications include high-rise buildings, highway bridges, and marine
structures. A Federal Highway Administration (FWHA) study (Appendix 1) comparing 8
and 12 % substitution of UFFA with baseline straight Portland cement concrete shows
UFFA decreases chloride permeability and diffusion coefficient, and increases direct
current resistivity of concrete.
UFFA is produced at one power station in Texas, and is marketed as Boral Micro
3. It is considered a niche product with low usage rates and high price relative to
conventional fly ashes and Portland cement (2 - 4 times). UFFA has no ASTM
specifications at this time, but Texas DOT has established the following specification:
1. Must conform to the TX DOT specifications for Class F fly ash.
2. Strength Activity Index (SAI) must be 85% of control at 7 days and 95% of
control at 28 days.
3. 90% of the particles must be less than 8.5 microns, and 50% of the particles must
be less than 3.25 microns.
4. Less than 6% may be retained on a 45 micron sieve when wet sieved.
5. Maximum moisture is 1%.
6. Maximum Loss on Ignition (LOI) is 2.0%.
Market Because UFFA is a niche product with low demand and high price the market is
national with a focus on the largest cities with tall concrete buildings, and coastal areas.
Since little is known about the production and sales from the one known source for
UFFA the demand and pricing of competitive ultra fine pozzolan products was used to
define the market for UFFA.
23
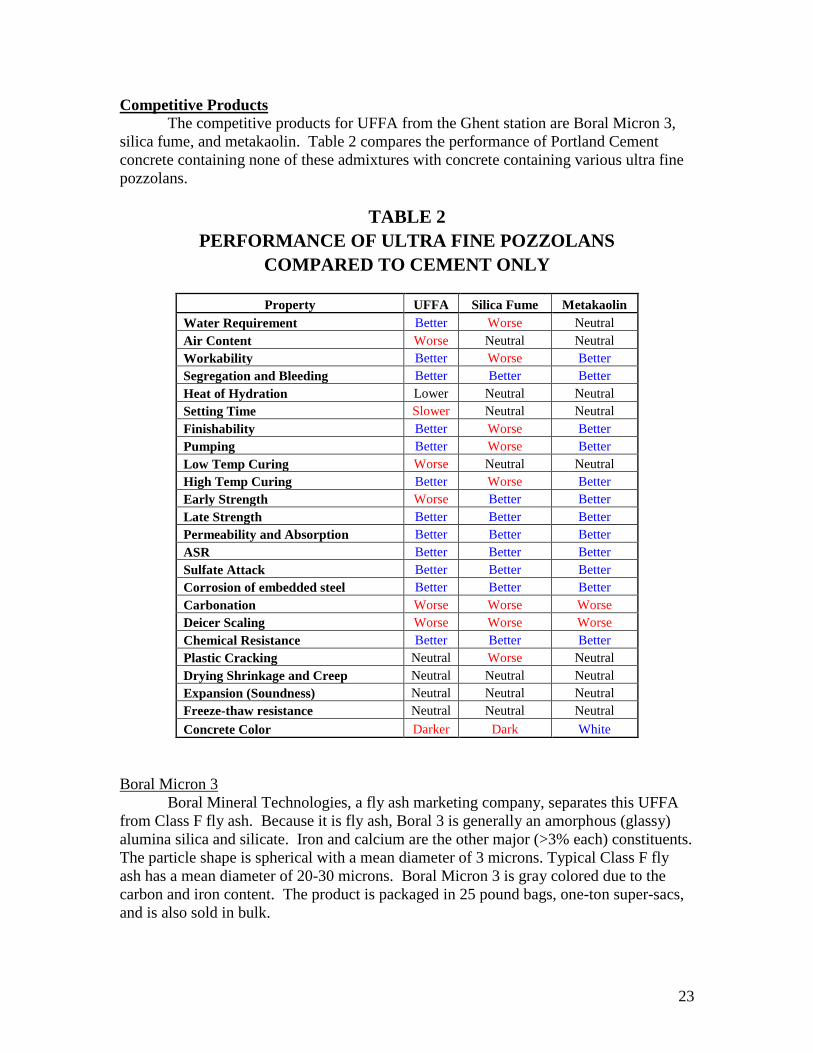
Competitive Products
The competitive products for UFFA from the Ghent station are Boral Micron 3,
silica fume, and metakaolin. Table 2 compares the performance of Portland Cement
concrete containing none of these admixtures with concrete containing various ultra fine
pozzolans.
TABLE 2
PERFORMANCE OF ULTRA FINE POZZOLANS
COMPARED TO CEMENT ONLY
Property UFFA Silica Fume Metakaolin
Water Requirement Better Worse Neutral
Air Content Worse Neutral Neutral
Workability Better Worse Better
Segregation and Bleeding Better Better Better
Heat of Hydration Lower Neutral Neutral
Setting Time Slower Neutral Neutral
Finishability Better Worse Better
Pumping Better Worse Better
Low Temp Curing Worse Neutral Neutral
High Temp Curing Better Worse Better
Early Strength Worse Better Better
Late Strength Better Better Better
Permeability and Absorption Better Better Better
ASR Better Better Better
Sulfate Attack Better Better Better
Corrosion of embedded steel Better Better Better
Carbonation Worse Worse Worse
Deicer Scaling Worse Worse Worse
Chemical Resistance Better Better Better
Plastic Cracking Neutral Worse Neutral
Drying Shrinkage and Creep Neutral Neutral Neutral
Expansion (Soundness) Neutral Neutral Neutral
Freeze-thaw resistance Neutral Neutral Neutral
Concrete Color Darker Dark White
Boral Micron 3
Boral Mineral Technologies, a fly ash marketing company, separates this UFFA
from Class F fly ash. Because it is fly ash, Boral 3 is generally an amorphous (glassy)
alumina silica and silicate. Iron and calcium are the other major (>3% each) constituents.
The particle shape is spherical with a mean diameter of 3 microns. Typical Class F fly
ash has a mean diameter of 20-30 microns. Boral Micron 3 is gray colored due to the
carbon and iron content. The product is packaged in 25 pound bags, one-ton super-sacs,
and is also sold in bulk.

24
There is no public data on the demand for this product, but CEMEX is a large supplier of
ready mix concrete in Texas and has only used less than 1,000 tons of Boral Micron 3 in
the first 3 quarters of 2006.
The price for this product FOB the Rockdale, TX Plant is,
- Bag/sack - $340.00 / ton
- Bulk - $320.00 / ton.
Silica Fume
Silica fume (SF) is a byproduct from the production of ferrosilicon metals. It is
amorphous (glassy) silica. Minor constituents (<10% total) are iron, calcium,
magnesium, potassium, sodium, alumina, and carbon. Like fly ash, silica fume particles
are spherical but with a mean diameter less than 0.2 microns. Silica fume has no ASTM
specifications at this time.
Silica fume is typically used in concrete to reduce permeability, reduce ASR, and
increase sulfate resistance. Concrete mixes with over 5% silica fume exhibit increased
water demand and poorer workability compared to concrete with UFFA.
There are five domestic SF producers listed in the Silica Fume Association. The
source locations are:
Elkem Materials, Inc - Alloy, WV
Norchem, Inc. - Beverly, OH and Selma, AL
AIMCOR - Bridgeport, AL
Simcala, Inc. - Mt. Meigs, AL
SKW Metals and Alloys, Inc. - Calvert City, KY
The product is typically sold packaged in 25 pound bags and in bulk. There is no public
data on the demand for this product so information was obtained from individuals who
are familiar with the market.
Elkem production is estimated at 30,000 tons per year
Total US production is estimated at 100,000 tons per year
Global consumption is estimated at 1,000,000 tons per year.
Not all silica fume is used as an admixture in concrete.
The largest ready mix concrete supplier in the United States consumes
approximately 40 tons of silica fume per month totaling about 480 tons per year.
Based upon this information the estimated national demand for silica fume used as an
admixture for concrete is approximately 50,000 to 100,000 tpy. One of the larger
suppliers, (Elkem) lists the following, FOB their warehouse as of August 8, 2006:
- Bulk $ 0.1025 / lb ($205.00 / Ton)
- 25 lb bag through 2000 lb bags (Densified) $0.1425 / lb ($285.00 / ton)
- 50 lb through 1650 lb bags (Undensified) $0.1425 / lb (285.00 / Ton)

25
These prices are exactly the same as quoted in 2004 which implies ample supply and no
increase in the perceived value of silica fume in the marketplace.
Metakaolin
Metakaolin (MK) is a reactive alumino silicate pozzolan formed by calcining
purified kaolinite at a specified temperature range. MK 3 is generally an amorphous
(glassy) alumina silicate. Because the production of this product is controlled to make
the products it contains limited amounts of crystalline material that is not reactive in
concrete. The kaolinite ore is processed to remove impurities so only minor constituents
remain including iron, calcium, and titanium. Because the material is milled like cement
the particle shape of this product is angular. The literature for MetaMax indicates that
this MK has a typical mean diameter of 1.2 microns, compared to 0.3 microns for silica
fume, 3 microns for UFFA, and 20 to 30 microns for typical Class F fly ash. MetaMax
and other MK are very white in color.
MK must meet ASTM C618 standards as a natural pozzolan. Appendix 5 lists an
NRMCA Comparison of MK (PowerPozz) and silica fume which indicates similar
performance for compressive strengths. The product is typically sold packaged in 55-
pound bags and 1-ton pound super-sacs, and is also sold in bulk. Larger producers of MK
are BASF-Engelhard (MetaMax products), Burgess and others located in central Georgia
between Macon and Augusta.
ISG purchased a company in South Carolina in 1999 and began producing MK. It
was given the name CEMax, met the requirements of ASTM C-618 Type N, and
reportedly replaced microsilica as a high-performance pozzolan. ISG shut down the
operation after a few years.
There is no public data on the demand for this product, but the closure of the ISG
facility indicates a relatively low demand. The price of their MK was $6.25-$8.75 per 50
lb bag ($250-$350 / ton).
1.6.2 Capital Cost Estimations
Status: Completed
Summary: A total of four flowsheet configurations were considered during this
evaluation and tested at the pilot scale (2-5 tph feed rate). During testing, each unit
process was rigorously evaluated by varying operating conditions and sampling to
determine appropriate ranges of operation and performance. Data was compiled and used
to determine equipment size specifications for a commercial demonstration plant. In
order to compare the flowsheet configurations, a design basis of 50 tph solids feed rate
was selected as the design basis. It was also assumed that the feed would be supplied to
the process plant by a dredge, providing 1000 gpm slurry at 18% solids, operating
specifications well within the operating range recommended by dredge vendors. A
detailed description of each flowsheet configuration has been prepared as well as
justification for specific equipment that will be required.
A description of the various unit processes with a summary of relevant sizing
criteria has also been prepared. In some cases, equipment specifications and
recommendations were provided by vendors, while in other cases the recommended
equipment is generic to mineral processing applications and sizing was determined by
flow rate calculations from the process flowsheets. In still other cases, equipment sizing

26
was determined from results of pilot-scale testing conducted at the Ghent site. Since no
technical determination has been made pertaining to the inclusion or elimination of a
thermal dryer, capital cost estimation battery limits end with the production of damp
products.
A summary of the process flowsheets evaluated is presented in Table 3. A more
detailed description of each flowsheet has also been prepared. A total of four process
configurations were considered and are compared using a 50 ton/hr feed solids basis.
Flowsheet 1 was the simplest, incorporating only primary classification and spiral
concentration and produced pozzolan and coarse carbon products. In Flowsheet 2, froth
flotation was added and produced an additional fine carbon product. Flowsheet 3
included primary classification, spiral concentration and secondary classification and the
resulting products were ultrafine ash (UFA) and coarse carbon. The most complex circuit
evaluated was Flowsheet 4 which used primary and secondary classification and spiral
concentration as well as froth flotation. With this configuration, three products were
generated: UFA, coarse carbon, and fine carbon. An additional pozzolan product could
potentially be recovered with this flowsheet, but was not considered in this evaluation.
Table 3. Summary of Process Flowsheets Evaluated, 50 tph Basis Flowsheet 1 Flowsheet 2 Flowsheet 3 Flowsheet 4
Unit Processes
Primary Classification X X X X
Spiral Concentration X X X X
Froth Flotation X X
Secondary Classification X X
Installed Capital Cost $3.24M $4.00M $3.44M $4.21M
Additive Cost $/plant feed ton 0.029 0.622 1.00-1.35 1.52-1.75
$/product ton (pozzolan or UFA) 0.033 0.828 3.88-4.48 4.48-5.52
Pozzolan
tons/hr 46.5 43.7 - -
% LOI 3.5 2.3 - -
% Moisture 20 20 - -
UFA
tons/hr - - 14 13.1
% LOI - - 2.5 2.5
% Moisture - - 30 30
Coarse Carbon tons/hr 0.4 0.4 0.4 0.4
Btu/lb (dmf) 5400 5400 5400 5400
Fine Carbon tons/hr - 2.8 - 2.8
Btu/lb (dmf) - 2700 - 2700
Capital costs were determined by using verbal equipment quotes from various
equipment vendors after sizing the major pieces of equipment to the required flow rates
and performance specifications. Several chemical additives were used in the evaluations.
Specifically, when froth flotation was employed, both frother and collector added. When
secondary classification was used to produce UFA, a dispersant was necessary. For each
flowsheet, flocculant was used to provide an adequate settling rate to minimize thickener
size and maintain water clarity. During flowsheet testing, additive addition rates were
monitored and recorded along with process flow rates to accurately determine the various

27
dosages of each additive that were used. Data was compiled and is presented in two
formats: $/plant feed ton and $/product ton. When reporting $/plant feed ton, the costs
simply represent the total additive consumption per ton of dry feed solids reporting to the
primary classifier. Calculating the cost per ton of product was more complicated since
there were in some cases multiple products generated. As such, the cost per product ton
was determined based on the production of the principle product, i.e. UFA or pozzolan.
Not surprisingly, as the processing complexity increased, additive costs increased as well.
Comparing Flowsheet 1 (the simplest) and Flowsheet 4 (the most complex), additive
costs increased from $0.029 to $1.75/ton of plant feed and $0.033 to $5.52/ton of UFA.
The higher additive cost for Flowsheet 4 was due to the lower product yield with the
more complex flowsheet. Not surprisingly, the lower product yield also produced
products with potentially higher value.
1.6.3 Business Plan
Status: The activities in the business plan development were limited because of
lack of private company participation and unfavorable local market conditions, which are
described in the Market Assessment section.
Subtask 1.7. Plant Location and Infrastructure
1.7.1 Selection of Specific Site
Status: The Ghent station was evaluated for locating the demonstration plant.
However, the local market conditions were not favorable for the sale of ash byproducts at
competitive prices.
1.7.2 Off-Site Cost Evaluation
Status: Because of a lack of private financial support for the Ghent site
demonstration, no further work was carried out on any ancillary services.
Task 2. Design
Subtask 2.1. Preliminary Plant Design Status: A conceptual design was performed to obtain preliminary costs estimates
and to facilitate market assessment.
Summary: In order to assess the technical and economic viability of constructing
a commercial-scale processing facility, it was necessary to complete a preliminary plant
design to determine the size of facility that would be envisioned as well as the quantity
and quality of products that would be produced.
2.1.1 Flow Diagrams
Status: Completed
Summary: Although no specific decisions have been made pertaining to the
flowsheet that will be utilized, four flowsheets were considered, and thus, four separate
flow diagrams have been prepared summarizing the water and solids balances that will be
encountered for the various flow streams. This information was compiled using
demonstration plant (2-5 tph feed rate) testing data. During testing, each unit process was

28
rigorously evaluated by varying operating conditions and sampling to determine
appropriate ranges of operation and performance. Data was compiled and used to
determine equipment size specifications for a commercial demonstration plant. In order
to compare the flowsheet configurations, a design basis of 50 tph solids feed rate was
selected as the design basis. It was also assumed that the feed would be supplied to the
process plant by a dredge, providing 1000 gpm slurry at 18% solids, operating
specification well within the operating range recommended by dredge vendors. A
detailed description of each flowsheet configuration follows.
Flowsheet 1: Flowsheet 1 (Figure 1) is the simplest configuration, consisting of
essentially two unit processes; primary classification and spiral concentration that
produce two distinct products; pozzolan and coarse carbon.
The dredge output is discharged into a sump or mix tank after assign through a
trash screen (3/8 inch) to remove primarily vegetation (i.e. weeds, sticks, etc.) and trivial
amounts of misplaced coarse bottom ash or coal that may be present. The trash screen is
primarily a cautionary device to prevent valve and pipe plugging.
The slurry is then pumped into a primary classifier for the specific objective of
separating +100 mesh (+150 µm) coarse ash and carbon from the finer ash. The primary
classifier recommended is the Lewis Econosizer, which when fed at a constant feed rate
provides particle separation based on particle setting velocity. This is an important
operating consideration given the broad size distribution of ash that may be fed into the
plant and fluctuations in the dredge output that can be anticipated. The primary classifier
will consistently provide a 100 mesh separation provided the feed velocity is consistent.
Thus the feed will be introduced into the classifier via a head box equipped with an
overflow to maintain a constant head. The feed enters the base of the device and particle
trajectory is diverted upward by a diverter plate. Particles too coarse to remain in
suspension (+150 µm) are withdrawn from the bottom of the device through an opening
behind the diverter plate while finer particles (-150 µm) overflow the device. Middling
ports are provided to withdraw intermediate-size material from the device if necessary.
The primary classifier underflow (3.5 tph, 30% solids) consists of coarse ash,
coarse carbon, dense ash or „magnetite‟ and misplaced fines. Ideally, this stream would
be suitable for recovering lightweight aggregate, however, it was found during testing
that there is an appreciable amount of coal in the ash pond. Unfortunately, the coal
present was derived primarily from grinding mill rejects and includes locked grains of
pyrite, the precursor to aggregate staining in concrete blocks. For this reason, the
production of lightweight aggregate from the lower ash pond at Ghent is unlikely. There
is, however, coarse unburned carbon present that is readily recoverable with
concentrating spirals.
The spirals operate more efficiently at lower pulp density, so the primary
classifier underflow is diluted to 12% solids. Most of the water, fine ash and carbon
report to the outside spiral race which flows onto a dewatering screen (100 mesh) to
recover the coarse carbon. The amount of coarse carbon present can vary significantly
and will not affect spiral performance. The amount produced (0.4 tph) was derived from
pilot scale testing and will likely be higher (up to 2 tph) depending on the area being
mined. The inside spiral race will concentrate spherical magnetic particles, potentially
suitable for use as heavy media grade magnetite. Recovery of this product was not

29
considered in the economic evaluation. Both the spiral rejects (0.6 tph and carbon
dewatering screen effluent (9% solids) are returned to the ash pond.
The primary classifier overflow (46.5 tph) consists essentially of -100 mesh ash,
potentially marketable as pozzolan. In Flowsheet 1, this dilute slurry is thickened and
filtered to 70% solids. The thickener recommended is a conventional static thickener
with a cantilever rake mechanism. Addition of suitable flocculant (2-5 ppm medium MW
polyethylene oxide) provides adequate solids settling rate (6-12 inches/minute) with
excellent clarity. Thickener overflow is returned to the pond, with the exception of 70
gpm that is used to dilute the spiral feed.
The design basis for the thickener underflow is 50% solids, a conservative value
based on data obtained from manufacturers. Similarly, ash filter performance is also
conservative at 30% moisture. Manufacturer testing confirmed that 20% cake moisture is
readily achievable with a rotary vacuum drum filter.
With this configuration, 46.5 tph pozzolan is produced along with 0.4 tph coarse
carbon. The amount of material returned to the pond is 3.1 tph at 1.6% solids.

30
5 0 t p h
1 8 % s o l i d s
1 0 0 0 g p m
3 . 5 t p h
2 . 9 t p h
0 . 6 t p h
0 . 4 t p h
2 . 5 t p h
1 2 % s o l i d s
1 1 % s o l i d s
2 6 % s o l i d s
7 0 % s o l i d s
9 % s o l i d s
1 0 9 g p m
1 0 1 g p m
8 g p m
2 g p m
9 9 g p m
0 t p h
4 6 . 5 t p h
3 . 5 t p h
0 % s o l i d s
1 7 . 5 % s o l i d s
3 0 % s o l i d s
7 0 g p m
9 6 1 g p m
3 9 g p m
0 t p h
0 t p h
0 t p h
3 . 1 t p h
4 6 . 5 t p h
4 6 . 5 t p h
0 % s o l i d s
0 % s o l i d s
0 % s o l i d s
1 . 6 % s o l i d s
7 0 % s o l i d s
5 0 % s o l i d s
1 0 7 g p m
6 2 6 g p m
6 9 6 g p m
8 4 0 g p m
1 5 8 g p m
2 6 5 g p m
Figure 1. Process Flowsheet 1.

31
Flowsheet 2: Flowsheet 2 (Figure 2) is the same as Flowsheet 1, with the addition of
froth flotation. With this configuration, the primary classifier overflow reports to froth
flotation to remove fine carbon. As such, three different products are produced; coarse
carbon, fine carbon and pozzolan.
The primary classifier overflow (46.5 tph, 17.5% solids) reports to froth flotation
where the appropriate amount of reagents are added. Reagents consist of a fuel oil-based
collector (SPP) to selectively adsorb onto the fine carbon to render the surfaces
hydrophobic, and a water soluble glycol-based frother, to reduce surface tension and
provide sufficient air bubble surface area and stability to remove hydrophobic carbon.
The flotation design basis and reagent requirements were derived from pilot-scale testing.
By incorporating flotation, a froth product is generated (2.8 tph, 10% solids) which may
potentially be used as a fuel. To do so requires an additional vacuum filter. Based on
manufacturer testing, 30% moisture cake is achievable with the use of flocculant. Carbon
filter effluent contains water soluble frother, which may be recirculated back to the
flotation feed to reduce frother consumption. Doing so dilutes flotation feed; however,
pilot testing showed that despite reduced pulp density in the flotation feed, froth solids
remained essentially consistent at 10% solids. The net result will be dilution of the
flotation tailings to less than the designed 18.5% solids, well within the operating range
of the static thickener. The thickener and filter parameters are essentially the same as for
Flowsheet 1, with pozzolan production reduced to 43.7 tph since the differential 2.8 tph
was recovered as a froth product. The net return to the pond is 3.1 tph at 1.8% solids.

32
5 0 t p h
1 8 % s o l i d s
1 0 0 0 g p m
3 . 5 t p h
2 . 9 t p h
0 . 6 t p h
0 . 4 t p h
2 . 8 t p h
2 . 8 t p h
2 . 5 t p h
1 2 % s o l i d s
1 1 % s o l i d s
2 6 % s o l i d s
7 0 % s o l i d s
7 0 % s o l i d s
1 0 % s o l i d s
9 % s o l i d s
1 0 9 g p m
1 0 1 g p m
8 g p m
2 g p m
1 0 g p m
1 0 6 g p m
9 9 g p m
0 t p h
0 t p h
4 6 . 5 t p h
4 3 . 7 t p h
3 . 5 t p h
0 % s o l i d s
0 % s o l i d s
1 7 . 5 % s o l i d s
1 8 . 5 % s o l i d s
3 0 % s o l i d s
7 0 g p m
9 6 g p m
9 6 1 g p m
8 5 4 g p m
3 9 g p m
0 t p h
0 t p h
0 t p h
3 . 1 t p h
4 3 . 7 t p h
4 3 . 7 t p h
0 % s o l i d s
0 % s o l i d s
0 % s o l i d s
1 . 8 % s o l i d s
7 0 % s o l i d s
5 0 % s o l i d s
1 0 0 g p m
5 3 5 g p m
6 0 5 g p m
7 3 8 g p m
1 4 9 g p m
2 4 9 g p m
Figure 2. Process Flowsheet 2.

33
Flowsheet 3: Flowsheet 3 (Figure 3) is the same as Flowsheet 1, with the addition of
secondary classification. With this configuration, the primary classifier overflow reports
to the secondary classifier to recover the finest particles (i.e. <10 µm), thus two products
are produced; coarse carbon and ultra-fine ash (UFA).
The primary classifier overflow (46.5 tph, 17.5% solids) reports to the secondary
classifier where the appropriate amount of dispersant (1-2 g/kg) is added. The dispersant
used in pilot-scale evaluations was a water soluble naphthalene sulfonate (NSF) to
effectively disperse the finest particulates. The dispersed slurry is fed into a secondary
classifier which consists essentially of a rectangular tank with lamella plates aligned
parallel to the feed flow and sloped to the base of the tank at 45o. The lamella plates
serve as settling surfaces for coarse particles (i.e. >10 µm) to effectively remove them
from suspension as they settle. Coarse particles accumulate on the plates and slide to the
bottom of the tank where they accumulate as thickened sediment and are removed and
returned to the pond. The total sediment underflow is 32.5 tph at 60% solids, derived
from pilot-scale testing. This product is potentially marketable as pozzolan, but was not
considered in the economic evaluation.
The dispersed fine particulates flow to the end of the classifier and overflow as a
dilute slurry through vented, submerged pipes. The pipes are vented to prevent siphoning
and are submerged to allow cenospheres, coarse (>150 µm) hollow ash spheres, to
accumulate on the top of the slurry. The cenospheres can readily be collected at this
point as a marketable product, but were not considered as a product in the economic
evaluation.
The overflow (14 tph at 6.7% solids) reports to a thickener where flocculant (5
ppm PEO) is added to improve settling rate and clarity. Thickener underflow design is
50% solids, which was readily achieved in pilot-scale studies, even without the use of
thickener rakes. The thickener clarified water overflow is returned to the pond, except
for spiral feed dilution water.
The thickener underflow is dewatered to 30% solids on a vacuum drum filter.
This cake moisture was readily achieved in pilot-scale studies. Filter studies provided
solids capture of 80-85%. Most of the solids lost in filtration were through leaks in
media seals against the drum, a situation not likely to occur with a larger filter.
Nevertheless, provisions are made in the plant design to return the filter effluent back to
the thickener to maximize UFA recovery.
With this flowsheet design, 0.4 tph coarse carbon is recovered along with 14 tph
UFA. A total of 35.6 tph solids are returned to the pond at 13.4% solids. Additional
products that are potentially recoverable include magnetite, cenospheres and pozzolan.

34
5 0 t p h
1 8 % s o l i d s
1 0 0 0 g p m
3 . 5 t p h
2 . 9 t p h
0 . 6 t p h
0 . 4 t p h
2 . 5 t p h
1 2 % s o l i d s
1 1 % s o l i d s
2 6 % s o l i d s
7 0 % s o l i d s
9 % s o l i d s
1 0 9 g p m
1 0 1 g p m
8 g p m
2 g p m
9 9 g p m
0 t p h
4 6 . 5 t p h
3 . 5 t p h
0 % s o l i d s
1 7 . 5 % s o l i d s
3 0 % s o l i d s
7 0 g p m
9 6 1 g p m
3 9 g p m
3 2 . 5 t p h
0 t p h
0 t p h
0 t p h
3 5 . 6 t p h
1 4 t p h
1 4 t p h
1 4 t p h
6 0 % s o l i d s
0 % s o l i d s
0 % s o l i d s
0 % s o l i d s
1 3 . 4 % s o l i d s
6 . 7 % s o l i d s
7 0 % s o l i d s
5 0 % s o l i d s
1 4 2 g p m
6 0 g p m
6 4 1 g p m
7 1 1 g p m
9 8 6 g p m
8 1 9 g p m
4 8 g p m
1 0 8 g p m
Figure 3. Process Flowsheet 3.

35
Flowsheet4: Flowsheet 4 (Figure 4) is the most complex circuit and includes primary
classification, spiral concentration, flotation and secondary classification. The unit
processes produce coarse carbon fuel, fine carbon fuel and UFA as primary products.
Potential additional products include magnetite, cenospheres and pozzolan, but were not
considered in the economic evaluation.
The primary classifier and spiral circuit are the same as shown in the other
flowsheets. The primary classifier overflow reports to flotation and flow regimes and
reagent additions are the same as for the flotation circuit described for Flowsheet 2; the
froth product (2.8 tph at 10% solids) will again be dewatered with a vacuum filter to 30%
moisture.
Dispersant (1-2 g/kg NSF) is added to the flotation tailings (43.7 tph at 18.5%
solids) and the reagentized slurry flows into the secondary classifier where fine
particulates (<10 µm) are dispersed and coarse (>10 µm) particulates accumulate on
inclined lamella plates and are removed as thickened sediment. The fine particulate
slurry (13.1 tph at 6.6% solids) overflows the secondary classifier and is thickened to
50% solids in the UFA thickener before being dewatered on a vacuum filter to 30%
moisture.
With this configuration, three primary products are produced; 0.4 tph coarse
carbon fuel, 2.8 tph fine carbon fuel and 13.1 tph UFA. The slurry returned to the pond
contains 33.7 tph solids at 13.7% slids. Additional products that are potentially
recoverable include magnetite, cenospheres and pozzolan.

36
5 0 t p h
1 8 % s o l i d s
1 0 0 0 g p m
3 . 5 t p h
2 . 9 t p h
0 . 6 t p h
0 . 4 t p h
2 . 8 t p h
2 . 8 t p h
2 . 5 t p h
1 2 % s o l i d s
1 1 % s o l i d s
2 6 % s o l i d s
7 0 % s o l i d s
7 0 % s o l i d s
1 0 % s o l i d s
9 % s o l i d s
1 0 9 g p m
1 0 1 g p m
8 g p m
2 g p m
1 0 g p m
1 0 6 g p m
9 9 g p m
0 t p h
0 t p h
4 6 . 5 t p h
4 3 . 7 t p h
3 . 5 t p h
0 % s o l i d s
0 % s o l i d s
1 7 . 5 % s o l i d s
1 8 . 5 % s o l i d s
3 0 % s o l i d s
7 0 g p m
9 6 g p m
9 6 1 g p m
8 5 4 g p m
3 9 g p m
3 0 . 6 t p h
0 t p h
0 t p h
0 t p h
3 3 . 7 t p h
1 3 . 1 t p h
1 3 . 1 t p h
1 3 . 1 t p h
6 0 % s o l i d s
0 % s o l i d s
0 % s o l i d s
0 % s o l i d s
1 3 . 7 % s o l i d s
6 . 6 % s o l i d s
7 0 % s o l i d s
5 0 % s o l i d s
1 3 3 g p m
3 6 g p m
5 7 6 g p m
6 4 6 g p m
9 1 2 g p m
7 2 1 g p m
3 9 g p m
7 5 g p m
Figure 4. Process Flowsheet 4.

37
Plant Costs
A summary of plant costs are shown in the following tables and are divided
sections for each unit process (i.e. feed system, classification, flotation, etc.). Within
each unit process section is a list of the specific items and the sizes or capacities required,
horsepower and quantity needed. A description of the size justification will be provided
later in this report. After determining the size of equipment needed, verbal price quotes
were requested from various vendors or other appropriate sources. The source of the
price quotes is included. In order to determine the installation cost, a price estimating
procedure commonly used in the coal preparation and mineral industry was used. This
procedure entailed defining an installation factor which is multiplied by the capital cost to
estimate the installed equipment cost. The installation factors used (Table 4) were
provided from several companies involved with coal preparation and mineral processing
plant construction and modification.
Table 4. Determination of Equipment Installation Factors.
Level of Work Required Installation Factor
Placement 1
Placement & Mounting or Bracing 1.5
Placement, Mounting or Bracing and Electrical
Connection 2
Placement, Mounting or Bracing, Electrical
Connection and Controls 2.5

38
Table 5. Equipment List and Cost Estimate for Flowsheet 1. Flowsheet 1
Hydraulic Classification
Products: Pozzolan, Coarse Carbon
Unit Operation
Item Capacity hp Quantity Total hp Capital Total Capital Installation Total Installed Subtotals Price Source
or Size Cost Cost Factor Cost
Plant Feed System
Dredge 50 tph 50 1 50 $253,460 $253,460 1.5 $380,190 IMS
3/8" Trash Screen 3' X 6' 1 $16,744 $16,744 1.5 $25,116 Charah Environmental
Feed Slurry Tank 1000 gal 1 $13,512 $13,512 1.5 $20,268 Mine and Mill Engineering
Feed Mixer 20 1 20 $11,436 $11,436 2.5 $28,590 Lightnin, Inc.
Classifier Feed Pump 1000 gpm 50 1 $18,860 $18,860 1.5 $28,290 Mine and Mill Engineering
$482,454
Classification
Lewis Econosizer 17' X 17' 1 $149,500 $149,500 1.5 $224,250 Lewis Minerals Corp
Varisieve 60 Mesh 1 $6,900 $6,900 1.5 $10,350 Krebs:reconditioned
$234,600
Spirals
Spiral Feed Sump 500 gal 1 $1,087 $1,000 1.5 $1,500
Spiral Feed Pump 100 gpm 15 1 $3,910 $3,910 2.5 $9,775 Goulds:reconditioned
Spirals, Distributor, Fittings Bank of Triple Starts 2 $2,747 $5,494 1.5 $8,241 PrepTech, Inc.
Coarse Carbon Dewatering Screen 4'X 8' 10 1 $13,800 $13,800 2 $27,600 Tabor: reconditioned
Screen Underflow Sump 100 gallon 1 $627 $627 1.5 $941
Screen Underflow Pump 50 gpm 1 $1,087 $1,087 1.5 $1,631
Screen Underflow Pump Motor 5 1 5 $1,133 $1,133 2.5 $2,833
Carbon Conveyor & Motor 24" x 40' 2 1 $25,645 $25,645 1.5 $38,468 Mine and Mill Engineering
$90,987
Ash Dewatering
Flocculant Make-up and Metering System 0.1 gpm 1 $2,875 $2,875 1.5 $4,313 Cytec, Inc.
Tailings Thickener,Rakes & Controls 40' diam X 12' 10 1 10 $207,000 $207,000 1.5 $310,500 Westec
Thickener Underflow Pump and Motor 200 gpm 30 1 30 $1,435 $1,435 1.5 $2,153 Grainger Industrial Supply
Pozzolan Vacuum Filter & Accessories 700 ft2 285 2 570 $268,824 $537,648 2.5 $1,344,120 Westec
Pozzolan Conveyor & Motor 100 ft 2 1 $20,700 $20,700 1.5 $31,050 surplusrequest.com
$1,692,135
Product Storage
Pozzolan Stacker/Reclaimer 25 1 25 $78,890 $78,890 1.5 $118,335 Mine and Mill Engineering
Damp Pozzolan Storage Facility 1 $112,961 $112,961 1.5 $169,442
Truck Loadout, Dust Collector, Loading Spouts, etc. 10 1 10 $56,879 $56,879 1.5 $85,319 Mine and Mill Engineering
Truck Scales 1 $36,018 $36,018 1.5 $54,027 National Minerals Corp
$427,122
Miscellaneous
Clarified Water Sump 1000 gal 1 $1,880 $1,880 1 $1,880 Mine and Mill Engineering
Clarified Water Pump and Motor 50 gpm 5 1 5 $1,087 $1,087 1.5 $1,631 Mine and Mill Engineering
Make-Up Water Supply Pump 50 gpm 5 1 5 $2,283 $2,283 2.5 $5,708 Goulds:reconditioned
Piping 1 $10,000 $10,000 1.5 $15,000
Instrumentation and Control 1 $10,000 $10,000 1.5 $15,000
Plant Building 1 $15,000 $15,000 1.5 $22,500
Utility Building 1 $57,500 $57,500 1.5 $86,250
Electrical Transmission Line & Sub-station 1 $69,000 $69,000 1.5 $103,500 Mine and Mill Engineering
$251,468
Subtotals 730 $1,744,264 $3,178,766 $3,178,766
Engineering Design & Construction
Mobilization and Demobilization $10,000 Mine and Mill Engineering
Construction Overhead-Secretarial, Accounting, etc. $15,000 Mine and Mill Engineering
39
Project Supervision $20,000 Mine and Mill Engineering
Equipment Rental (2 months) $20,000 Mine and Mill Engineering
$65,000
Total $3,243,766

40
Table 6. Equipment List and Cost Estimate for Flowsheet 2. Flowsheet 2
Hydraulic Classification, Flotation
Products: Pozzolan, Coarse Carbon, Fine Carbon
Unit Operation
Item Capacity hp Quantity Total
hp Capital Total
Capital Installation Total
Installed Subtotals Price Source
or Size Cost Cost Factor Cost Plant Feed System
Dredge 50 tph 50 1 50 $253,460 $253,460 1.5 $380,190 IMS
3/8" Trash Screen 3' X 6' 1 $16,744 $16,744 1.5 $25,116 Charah Environmental
Feed Slurry Tank 1000 gal 1 $13,512 $13,512 1.5 $20,268 Mine and Mill Engineering
Feed Mixer 20 1 20 $11,436 $11,436 2.5 $28,590 Lightnin, Inc.
Classifier Feed Pump 1000 gpm 50 1 $18,860 $18,860 1.5 $28,290 Mine and Mill Engineering
$482,454
Classification
Lewis Econosizer 17' X 17' 1 $149,500 $149,500 1.5 $224,250 Lewis Minerals Corp
Varisieve 60 Mesh 1 $6,900 $6,900 1.5 $10,350 Krebs:reconditioned
$234,600
Spirals
Spiral Feed Sump 500 gal 1 $1,087 $1,000 1.5 $1,500
Spiral Feed Pump 100 gpm 15 1 $3,910 $3,910 2.5 $9,775 Goulds:reconditioned
Spirals, Distributor, Fittings Bank of Triple Starts 2 $2,747 $5,494 1.5 $8,241 PrepTech, Inc.
Coarse Carbon Dewatering Screen 4'X 8' 10 1 $13,800 $13,800 2 $27,600 Tabor: reconditioned
Screen Underflow Sump 100 gallon 1 $627 $627 1.5 $941
Screen Underflow Pump 50 gpm 1 $1,087 $1,087 1.5 $1,631
Screen Underflow Pump Motor 5 1 5 $1,133 $1,133 2.5 $2,833
Carbon Conveyor & Motor 24" x 40' 2 1 $25,645 $25,645 1.5 $38,468 Mine and Mill Engineering
$90,987
Flotation Flotation Cells,Motors, Launders, etc. 600 ft3 15 1 150 $135,700 $135,700 1.5 $203,550 Denver Equipment Co.
Bulk Reagent Storage 2000 gal 2 $1,037 $2,074 1.5 $3,111 US Plastic Corp
Reagent Day Tanks 200 gal 2 $232 $464 1.5 $696 US Plastic Corp
Reagent Transfer Pumps 3 gpm 1 2 2 $205 $410 1.5 $615 Grainger Industrial Supply
Reagent Metering Pumps 0.1 gpm 4 $644 $2,576 1.5 $3,864 Fluid Metering, Inc.
$211,836
Carbon Dewatering
Carbon Vacuum Filter & Accessories 210 ft2 290 1 290 $207,000 $207,000 2.5 $517,500 Westec
Carbon Conveyor & Motor 100 ft 2 1 $20,700 $20,700 1.5 $31,050 surplusrequest.com
$548,550
Ash Dewatering
Flocculant Make-up and Metering System 0.1 gpm 1 $2,875 $2,875 1.5 $4,313 Cytec, Inc.
Tailings Thickener,Rakes & Controls 40' diam X 12' 10 1 10 $207,000 $207,000 1.5 $310,500 Westec
Thickener Underflow Pump and Motor 200 gpm 30 1 30 $1,435 $1,435 1.5 $2,153 Grainger Industrial Supply
Pozzolan Vacuum Filter & Accessories 700 ft2 285 2 570 $268,824 $537,648 2.5 $1,344,120 Westec
Pozzolan Conveyor & Motor 100 ft 2 1 $20,700 $20,700 1.5 $31,050 surplusrequest.com
$1,692,135
Product Storage
Pozzolan Stacker/Reclaimer 25 1 25 $78,890 $78,890 1.5 $118,335 Mine and Mill

41
Engineering
Damp Pozzolan Storage Facility 1 $112,961 $112,961 1.5 $169,442
Truck Loadout, Dust Collector, Loading Spouts, etc. 10 1 10 $56,879 $56,879 1.5 $85,319 Mine and Mill Engineering
Truck Scales 1 $36,018 $36,018 1.5 $54,027 National Minerals Corp
$427,122
Miscellaneous
Clarified Water Sump 1000 gal 1 $1,880 $1,880 1 $1,880 Mine and Mill Engineering
Clarified Water Pump and Motor 50 gpm 5 1 5 $1,087 $1,087 1.5 $1,631 Mine and Mill Engineering
Make-Up Water Supply Pump 50 gpm 5 1 5 $2,283 $2,283 2.5 $5,708 Goulds:reconditioned
Piping 1 $10,000 $10,000 1.5 $15,000
Instrumentation and Control 1 $10,000 $10,000 1.5 $15,000
Plant Building 1 $15,000 $15,000 1.5 $22,500
Utility Building 1 $57,500 $57,500 1.5 $86,250
Electrical Transmission Line & Sub-station 1 $69,000 $69,000 1.5 $103,500 Mine and Mill Engineering
$251,468
Subtotals 1172 $2,113,188 $3,939,152 $3,939,152
Engineering Design & Construction
Mobilization and Demobilization $10,000 Mine and Mill Engineering
Construction Overhead-Secretarial, Accounting, etc. $15,000 Mine and Mill Engineering
Project Supervision $20,000 Mine and Mill Engineering
Equipment Rental (2 months) $20,000 Mine and Mill Engineering
$65,000
Total $4,004,152

42
Table 7. Equipment List and Cost Estimate for Flowsheet 3. Flowsheet 3
Hydraulic Classification,
Products: UFA, Coarse Carbon
Unit Operation
Item Capacity hp Quantity Total
hp Capital Total
Capital Installation Total
Installed Subtotals Price Source
or Size Cost Cost Factor Cost
Plant Feed System
Dredge 50 tph 50 1 50 $253,460 $253,460 1.5 $380,190 IMS
3/8" Trash Screen 3' X 6' 1 $16,744 $16,744 1.5 $25,116 Charah Environmental
Feed Slurry Tank 1000 gal 1 $13,512 $13,512 1.5 $20,268 Mine and Mill Engineering
Feed Mixer 20 1 20 $11,436 $11,436 2.5 $28,590 Lightnin, Inc.
Classifier Feed Pump 1000 gpm 50 1 $18,860 $18,860 1.5 $28,290 Mine and Mill Engineering
$482,454
Classification
Lewis Econosizer 17' X 17' 1 $149,500 $149,500 1.5 $224,250 Lewis Minerals Corp
$224,250
Spirals Spiral Feed Sump 500 gal 1 $1,087 $1,000 1.5 $1,500
Spiral Feed Pump 100 gpm 15 1 $3,910 $3,910 2.5 $9,775 Goulds:reconditioned
Spirals, Distributor, Fittings Bank of Triple Starts 2 $2,747 $5,494 1.5 $8,241 PrepTech, Inc.
Coarse Carbon Dewatering Screen 4'X 8' 10 1 $13,800 $13,800 2 $27,600 Tabor: reconditioned
Screen Underflow Sump 100 gallon 1 $627 $627 1.5 $941
Screen Underflow Pump 50 gpm 1 $1,087 $1,087 1.5 $1,631
Screen Underflow Pump Motor 5 1 5 $1,133 $1,133 2.5 $2,833
Carbon Conveyor & Motor 24" x 40' 2 1 $25,645 $25,645 1.5 $38,468 Mine and Mill Engineering
$90,987
UFA Classification
UFA Classifier 15 1 150 $135,700 $135,700 1.5 $203,550
Bulk Reagent Storage 2000 gal 1 $1,037 $1,037 1.5 $1,556 US Plastic Corp
Reagent Day Tanks 200 gal 1 $232 $232 1.5 $348 US Plastic Corp
Reagent Transfer Pumps 3 gpm 1 1 1 $205 $205 1.5 $308 Grainger Industrial Supply
Reagent Metering Pumps 0.1 gpm 1 $644 $644 1.5 $966 Fluid Metering, Inc.
Underflow Pumps & Motors 5 gpm 2 4 8 $2,500 $10,000 2.5 $25,000
$206,727
Ash Dewatering
Flocculant Make-up and Metering System 0.1 gpm 1 $2,875 $2,875 1.5 $4,313 Cytec, Inc.
Tailings Thickener,Rakes & Controls 40' diam X 12' 10 1 10 $207,000 $207,000 1.5 $310,500 Westec
Thickener Underflow Pump and Motor 200 gpm 30 1 30 $1,435 $1,435 1.5 $2,153
Grainger Industrial Supply
Pozzolan Vacuum Filter & Accessories 700 ft2 285 2 570 $268,824 $537,648 2.5 $1,344,120 Westec
Pozzolan Conveyor & Motor 100 ft 2 1 $20,700 $20,700 1.5 $31,050 surplusrequest.com
$1,692,135 Product Storage
Pozzolan Stacker/Reclaimer 25 1 25 $78,890 $78,890 1.5 $118,335 Mine and Mill Engineering
Damp Pozzolan Storage Facility 1 $112,961 $112,961 1.5 $169,442
Truck Loadout, Dust Collector, Loading Spouts, etc. 10 1 10 $56,879 $56,879 1.5 $85,319 Mine and Mill

43
Engineering
Truck Scales 1 $36,018 $36,018 1.5 $54,027 National Minerals Corp
$427,122
Miscellaneous
Clarified Water Sump 1000 gal 1 $1,880 $1,880 1 $1,880 Mine and Mill Engineering
Clarified Water Pump and Motor 50 gpm 5 1 5 $1,087 $1,087 1.5 $1,631 Mine and Mill Engineering
Make-Up Water Supply Pump 50 gpm 5 1 5 $2,283 $2,283 2.5 $5,708 Goulds:reconditioned
Piping 1 $10,000 $10,000 1.5 $15,000
Instrumentation and Control 1 $10,000 $10,000 1.5 $15,000
Plant Building 1 $15,000 $15,000 1.5 $22,500
Utility Building 1 $57,500 $57,500 1.5 $86,250
Electrical Transmission Line & Sub-station 1 $69,000 $69,000 1.5 $103,500
Mine and Mill Engineering
$251,468
Subtotals 889 $1,885,182 $3,400,143 $3,375,143
Engineering Design & Construction
Mobilization and Demobilization $10,000 Mine and Mill Engineering
Construction Overhead-Secretarial, Accounting, etc. $15,000 Mine and Mill Engineering
Project Supervision $20,000 Mine and Mill Engineering
Equipment Rental (2 months) $20,000 Mine and Mill Engineering
$65,000
Total $3,440,143

44
Table 8. Equipment List and Cost Estimate for Flowsheet 4. Flowsheet 4
Hydraulic Classification, Flotation
Products: Coarse Carbon, Fine Carbon, UFA
Unit Operation
Item Capacity hp Quantity Total
hp Capital Total
Capital Installation Total
Installed Subtotals Price Source
or Size Cost Cost Factor Cost Plant Feed System
Dredge 50 tph 50 1 50 $253,460 $253,460 1.5 $380,190 IMS
3/8" Trash Screen 3' X 6' 1 $16,744 $16,744 1.5 $25,116 Charah Environmental
Feed Slurry Tank 1000 gal 1 $13,512 $13,512 1.5 $20,268 Mine and Mill Engineering
Feed Mixer 20 1 20 $11,436 $11,436 2.5 $28,590 Lightnin, Inc.
Classifier Feed Pump 1000 gpm 50 1 $18,860 $18,860 1.5 $28,290 Mine and Mill Engineering
$482,454
Classification
Lewis Econosizer 17' X 17' 1 $149,500 $149,500 1.5 $224,250 Lewis Minerals Corp
Varisieve 60 Mesh 1 $6,900 $6,900 1.5 $10,350 Krebs:reconditioned
$234,600
Spirals
Spiral Feed Sump 500 gal 1 $1,087 $1,000 1.5 $1,500
Spiral Feed Pump 100 gpm 15 1 $3,910 $3,910 2.5 $9,775 Goulds:reconditioned
Spirals, Distributor, Fittings Bank of Triple Starts 2 $2,747 $5,494 1.5 $8,241 PrepTech, Inc.
Coarse Carbon Dewatering Screen 4'X 8' 10 1 $13,800 $13,800 2 $27,600 Tabor: reconditioned
Screen Underflow Sump 100 gallon 1 $627 $627 1.5 $941
Screen Underflow Pump 50 gpm 1 $1,087 $1,087 1.5 $1,631
Screen Underflow Pump Motor 5 1 5 $1,133 $1,133 2.5 $2,833
Carbon Conveyor & Motor 24" x 40' 2 1 $25,645 $25,645 1.5 $38,468 Mine and Mill Engineering
$90,987
Flotation
Flotation Cells,Motors, Launders, etc. 600 ft3 15 1 150 $135,700 $135,700 1.5 $203,550 Denver Equipment Co.
Bulk Reagent Storage 2000 gal 2 $1,037 $2,074 1.5 $3,111 US Plastic Corp
Reagent Day Tanks 200 gal 2 $232 $464 1.5 $696 US Plastic Corp
Reagent Transfer Pumps 3 gpm 1 2 2 $205 $410 1.5 $615 Grainger Industrial Supply
Reagent Metering Pumps 0.1 gpm 4 $644 $2,576 1.5 $3,864 Fluid Metering, Inc.
$211,836
Carbon Dewatering
Carbon Vacuum Filter & Accessories 210 ft2 290 1 290 $207,000 $207,000 2.5 $517,500 Westec
Carbon Conveyor & Motor 100 ft 2 1 $20,700 $20,700 1.5 $31,050 surplusrequest.com
$548,550 UFA Classification
UFA Classifier 15 1 150 $135,700 $135,700 1.5 $203,550
Bulk Reagent Storage 2000 gal 1 $1,037 $1,037 1.5 $1,556 US Plastic Corp
Reagent Day Tanks 200 gal 1 $232 $232 1.5 $348 US Plastic Corp
Reagent Transfer Pumps 3 gpm 1 1 1 $205 $205 1.5 $308 Grainger Industrial Supply
Reagent Metering Pumps 0.1 gpm 1 $644 $644 1.5 $966 Fluid Metering, Inc.
Underflow Pumps & Motors 5 gpm 2 4 8 $2,500 $10,000 2.5 $25,000
$206,727
Ash Dewatering
Flocculant Make-up and Metering System 0.1 gpm 1 $2,875 $2,875 1.5 $4,313 Cytec, Inc.
Tailings Thickener,Rakes & Controls 40' diam X 12' 10 1 10 $207,000 $207,000 1.5 $310,500 Westec
Thickener Underflow Pump and Motor 200 gpm 30 1 30 $1,435 $1,435 1.5 $2,153 Grainger Industrial

45
Supply
Pozzolan Vacuum Filter & Accessories 700 ft2 285 2 570 $268,824 $537,648 2.5 $1,344,120 Westec
Pozzolan Conveyor & Motor 100 ft 2 1 $20,700 $20,700 1.5 $31,050 surplusrequest.com
$1,692,135
Product Storage
Pozzolan Stacker/Reclaimer 25 1 25 $78,890 $78,890 1.5 $118,335 Mine and Mill Engineering
Damp Pozzolan Storage Facility 1 $112,961 $112,961 1.5 $169,442
Truck Loadout, Dust Collector, Loading Spouts, etc. 10 1 10 $56,879 $56,879 1.5 $85,319 Mine and Mill Engineering
Truck Scales 1 $36,018 $36,018 1.5 $54,027 National Minerals Corp
$427,122
Miscellaneous
Clarified Water Sump 1000 gal 1 $1,880 $1,880 1 $1,880 Mine and Mill Engineering
Clarified Water Pump and Motor 50 gpm 5 1 5 $1,087 $1,087 1.5 $1,631 Mine and Mill Engineering
Make-Up Water Supply Pump 50 gpm 5 1 5 $2,283 $2,283 2.5 $5,708 Goulds:reconditioned
Piping 1 $10,000 $10,000 1.5 $15,000
Instrumentation and Control 1 $10,000 $10,000 1.5 $15,000
Plant Building 1 $15,000 $15,000 1.5 $22,500
Utility Building 1 $57,500 $57,500 1.5 $86,250
Electrical Transmission Line & Sub-station 1 $69,000 $69,000 1.5 $103,500
Mine and Mill Engineering
$251,468
Subtotals 1331 $2,261,006 $4,170,879 $4,145,879
Engineering Design and Construction
Mobilization and Demobilization $10,000 Mine and Mill Engineering
Construction Overhead-Secretarial, Accounting, etc. $15,000 Mine and Mill Engineering
Project Supervision $20,000 Mine and Mill Engineering
Equipment Rental (2 months) $20,000 Mine and Mill Engineering
$65,000
Total $4,210,879

46
Table 9 provides a summary of the estimated construction costs of a 50 tph plant
for each of the four process flowsheet configurations considered along with the principle
products produced with each flowsheet. Principle product production rates were
determined from pilot-scale testing conducted at the Ghent site. Additional products such
as magnetite, cenospheres, aggregate and additional pozzolan may be recovered form the
various process streams but were not considered in this evaluation summary.
Table 9. Summary of Installed Plant Costs and Products Produced.
Flowsheet 1 2 3 4
Total Cost $3.24M $4.00M $3.44 $4.21M
Principle Products Produced
Pozzolan, tph 46.5 43.7 - -
UFA, tph - - 14.0 13.1
Coarse Carbon, tph 0.4 0.4 0.4 0.4
Fine Carbon, tph - 2.8 - 2.8
Total Principle Products, tph 46.9 46.9 14.4 16.3
Plant Product Yield, % 93.8 93.8 28.8 32.6

47
Conclusions
Technical Highlights of Budget Period 1.
Coring activities revealed that the lower ash pond at Ghent Station contains over 7
million tons of ash, including over 1.5 million tons of coarse carbon and 1.8 million tons
of fine (<10 µm) glassy pozzolanic material. These potential products are primarily
concentrated in the lower end of the pond adjacent to the outlet.
A representative bulk sample was excavated for conducting laboratory-scale
process testing while a composite 150 ton sample was also excavated for demonstration-
scale testing at the Ghent site. A mobile demonstration plant with a design feed rate of
2.5 tph was constructed and hauled to the Ghent site to evaluate unit processes (i.e.
primary classification, froth flotation, spiral concentration, secondary classification, etc.)
on a continuous basis to determine appropriate scale-up data.
Unit processes were configured into four different flowsheets and operated at a
feed rate of 2.5 tph to verify continuous operating performance and generate bulk (1 to 2
tons) products for product testing. Cementitious products were evaluated for
performance in mortar and concrete as well as cement manufacture process addition. All
relevant data from the four flowsheets was compiled to compare product yields and
quality while preliminary flowsheet designs were generated to determine throughputs,
equipment size specifications and capital cost summaries.
The best results obtained with primary classification were met at a feed rate of 40
to 60 gpm. Higher feed rate results in poor classification and poor rejection of coarse
solids while lower feed rate diminishes both yield and recovery of ultrafines. In regards
to feed solids, operating at high feed solids (i.e. 25%) provided reduced rejection of +100
mesh solids when the feed rate was higher than 40 gpm.
Release analysis showed that froth flotation could effectively be used to reduce
the classified ash from 4.5% LOI to the target grade of 2.5% LOI with a yield as high as
90%. A minimum retention time of 6 minutes was required to provide LOI reduction to
2.5% LOI using 1.2 lbs/ton collector and 0.23 lbs/ton frother. Reagent costs to provide
acceptable grade tailings were 0.50 to 1.00 $/ton of flotation feed. The collector used
(SPP) was a mixture of 90% #2 fuel oil and 10% petroleum sulfonate while the frother
was Ciba F948, a water soluble mixed glycol product. Demonstration plant flotation
results were consistent with release analysis results, indicating that no further significant
improvement in flotation performance could be expected with additional testing.
The proper flocculant to provide satisfactory thickening and clarity results on the
UFA product is PEO at a dosage of 5 ppm on a slurry basis. These conditions provide a
settling rate of 6 inches/minute and settled solids concentrations of over 50% solids by
weight. PEO has been used in numerous concrete applications as a viscosity reducer and
will not present any adverse effects to cement chemistry, particularly when used at such a
minimal dosage. Maximum throughput of the thickened slurry with continuous vacuum
filtration was 115 lb/hr dry cake rate (25 lb/ft2/hr) and was achieved at a cycle time of
1.25 minutes. Under these conditions the cake moisture was 30.5% with 85% solids
capture. Increasing cycle time not did not reduce cake moisture but did reduce the dry
cake rate and throughput.

48
Dryer evaluations were conducted in consultation with thermal dryer
manufacturers familiar with the application and product end use. To produce a dry
product, fuel requirement will be 1100 Btu to evaporate 1 pound of water. Considering
the scale of the proposed operation and volatility of fuel prices, the use of thermal drying
presents a serious economic impediment to the successful completion of this project. An
even greater challenge is the air permits required to construct and operate a dryer at the
proposed facility.
As expected, flowsheets not incorporating secondary classification produced
products that were coarser. As such, the levels of water reduction achieved by these
coarser products when tested in mortar were also lower. The primary classification
product (EP) product achieved a Strength Activity Index (SAI) of 85% of control strength
in 7 days, 100% in 28 days and 130% in 56 days. The froth flotation product (FP)
product performed similarly after 7 and 28 days, but achieved only 103% of control in 56
days. The highest strengths were obtained with the finer products produced by secondary
classification with (FUFA) and without (UFA) flotation. Several bulk products were
produced under a variety of operating conditions, with the finest products producing the
higher strengths. Both UFA and FUFA products provided SAI of 102 to 110% of control
in 7 days and 126 to 140% of control in 56 days. The higher dosages of air entraining
admixture (AEA) to achieve constant air for the finer products is attributed primarily to
increased fineness.
Concrete testing was conducted using a Kentucky Transportation Pavement Mix
design and substituting locally available Trimble ash or UFA at a substitution rate of
20%. The Trimble ash achieved 87% of control strength after 7 days and increased to
102% after 56 days. Two series of tests were conducted with UFA and although there
were some differences particularly for the early strengths, the UFA outperformed the
Trimble ash with 87-90.5% of control after 7 days, 105 to 107% after 28 days and 109.5
to 112% after 56 days.
Another series of concrete cylinders were poured using a Kentucky
Transportation Cabinet High Performance Mix Design (MA designation). The UFA
cylinders showed an expected delay in strength development during the early stages of
curing and outperformed the control after approximately 20 days.
At 5% UFA substitution, SAI was 101% after 1 and 7 days and increased to 106%
after 28 days. At 15% substitution, SAI decreased to 89.5% after 1 day and 98% after 7
days, but the longer term strength gains were apparent after 28 days as a SAI of 113%
was attained. At 25% substitution, early strengths were diminished and again, a SAI of
119.5% was achieved after 28 days. At the highest substitution level tested (35%), early
strengths were the lowest and SAI increased to 105% after 28 days. These results
illustrate that higher substitution levels certainly delay early strength development, but
surpass control strength after 28 days while lower substitution levels provide both early
and longer term strength.
One of the most significant benefits provided by using UFA in concrete mix
designs is the improved resistance to chloride permeability. While it has been known for
some time that using fly ash in concrete reduces permeability, using finer ash provides a
significant improvement in this criterion. Chloride permeability testing was conducted

49
using four different concrete mixes: control, 20% Trimble ash, 20% UFA, and 40%
UFA. Chloride permeability was improved when Trimble ash was used. Significant
further reductions were demonstrated when UFA was used, achieving an ASTM Chloride
Rating of Very Low.
The effect of Trimble ash and UFA on concrete flexural and tensile strength were
also evaluated. Results showed that marginal improvements in flexural strength were
realized with Trimble ash and were somewhat higher when UFA was used in the mix
design. Tensile strength was essentially unchanged when UFA was used and decreased
for the Trimble ash.
Despite the above mentioned technical merits of this technology, market
developments in the Ohio River Valley area during 2006-2007 were not conducive to
demonstrating the project at the scale proposed in the Cooperative Agreement. As a
result, Cemex withdrew from the project in 2006 citing unfavorable local market
conditions at the demonstration site. Although CAER had generated interest in the
technology, a financial commitment to proceed to Budget Period 2 could not be obtained
from private companies. Thus, CAER concurred with the USDoE to conclude the project
at the end of Budget Period 1, March 31, 2007.