Advanced Mechanical Design and Material 6ME503
64
Advanced Mechanical Design and Materials 6ME503 Lecturers:Dr Mansoor Hashemi Dr Dani Harmanto Dr Yiling Lu Student:Mark Antoni Georg
-
Upload
mark-georg-hndipmech-eng-miet -
Category
Documents
-
view
26 -
download
2
Transcript of Advanced Mechanical Design and Material 6ME503

Advanced Mechanical Design and Materials 6ME503 Lecturers:Dr Mansoor Hashemi
Dr Dani Harmanto
Dr Yiling Lu
Student:Mark Antoni Georg

Advanced Mechanical Design and Materials
P a g e 1 | 63
Abstract A design for a car park barrier was created using Solidworks.
The barrier needed to be able to withstand self-weight loadings, 105MPH winds, and have an actuation cycle life of >
107 cycles.
Over varying stages the report demonstrates the progression and improvements of the design, from initial hand
calculations to final validation using CES material selection, Solidworks FEA/ Flow Simulations, and fatigue studies.
Acknowledgements Dr Mansoor Hashemi, Loughborough College Lecturer
Solid Solutions
CES Edupack2015
Solidworks 2015
University of Derby
Loughborough College
Advanced Mechanical Design and Materials
P a g e 2 | 63
Contents Abstract ............................................................................................................................................................................. 1
Acknowledgements ........................................................................................................................................................... 1
Table of Figures ................................................................................................................................................................. 4
Introduction ...................................................................................................................................................................... 6
Research required: .................................................................................................................................................... 6
Analysis used: ............................................................................................................................................................ 6
Design optimisations used: ....................................................................................................................................... 6
Material selection tools: ........................................................................................................................................... 6
Methodology ..................................................................................................................................................................... 7
Product Review ................................................................................................................................................................. 8
Wind Loading .................................................................................................................................................................... 8
Case Study-Storm Katie ................................................................................................................................................. 9
Technical Specification .................................................................................................................................................... 10
Hand Calculation Pre-requisites, Goals, and Methods ................................................................................................... 11
Pre-Requisites ............................................................................................................................................................. 11
Goals ........................................................................................................................................................................... 11
Methods ...................................................................................................................................................................... 11
Hand Calculations ........................................................................................................................................................... 12
Calculation 1 ................................................................................................................................................................ 12
Calculation 2 ................................................................................................................................................................ 14
Calculation 3 ................................................................................................................................................................ 15
Calculation 4 ................................................................................................................................................................ 16
Calculation 5 ................................................................................................................................................................ 17
Calculation 6 ................................................................................................................................................................ 18
Calculation 7 ................................................................................................................................................................ 20
Designed for Failure (material selection) ........................................................................................................................ 22
Model Creation ............................................................................................................................................................... 24
Concept Brainstorm Sketch ........................................................................................................................................ 24
3D Cad Model .............................................................................................................................................................. 25
FEA, Hand Calculation Comparison ................................................................................................................................. 28
Motion Study .............................................................................................................................................................. 28
Static Study (gravity only-fixed pivot) ......................................................................................................................... 29
Static Study (gravity only-free pivot) .......................................................................................................................... 31
Static Study (Wind load from hand calcs) ................................................................................................................... 32
Initial check with fixed pivot ................................................................................................................................... 32

Advanced Mechanical Design and Materials
P a g e 3 | 63
Flow Simulation ........................................................................................................................................................... 36
Static Study (from flow simulation) ............................................................................................................................ 39
Non-Linear Dynamic Analysis ...................................................................................................................................... 40
Suitable Material Selection (CES) .................................................................................................................................... 42
Boom Arm Material Selection ..................................................................................................................................... 42
Motor Shaft Material Selection .................................................................................................................................. 45
Re-Run FEA (wind load) ................................................................................................................................................... 48
Design Optimisation ........................................................................................................................................................ 48
FEA Phase 3 ..................................................................................................................................................................... 50
Non-Linear Dynamic Analysis Re-Run ......................................................................................................................... 50
Static Study Re-Run (gravity) ...................................................................................................................................... 52
Static Study Re-Run (wind load) .................................................................................................................................. 52
Static Study Re-Run (from flow simulation) ................................................................................................................ 53
Fatigue Analysis ............................................................................................................................................................... 54
Fatigue Proof ............................................................................................................................................................... 56
Summary ......................................................................................................................................................................... 57
References ...................................................................................................................................................................... 58
Bibliography .................................................................................................................................................................... 59
Appendices ...................................................................................................................................................................... 60
Appendix 1 .................................................................................................................................................................. 60
Appendix 2 .................................................................................................................................................................. 63

Advanced Mechanical Design and Materials
P a g e 4 | 63
Table of Figures Figure 1 Wind speed Average (metoffice, 2016) .............................................................................................................. 8
Figure 2 Storm Katie (metoffice, 2016) ............................................................................................................................. 9
Figure 3 Storm Katie Wind Speed (metoffice, 2016) ........................................................................................................ 9
Figure 4 Minimum Access (planningni.gov.uk, 2008) ..................................................................................................... 10
Figure 5 Car park Barrier (avon-barrier, 2016) ............................................................................................................... 10
Figure 6 Bending moments ............................................................................................................................................. 12
Figure 7 Bending Moments ............................................................................................................................................. 13
Figure 8 Bending Moments ............................................................................................................................................. 13
Figure 9 Counter Weight ................................................................................................................................................. 14
Figure 10 Deflection ........................................................................................................................................................ 15
Figure 11 Counter Weight (Sign) ..................................................................................................................................... 16
Figure 12 Wind Loads ...................................................................................................................................................... 17
Figure 13 Wind Loads ...................................................................................................................................................... 17
Figure 14 Bending stress (Wind) ..................................................................................................................................... 18
Figure 15 Bending Stress (Wind) ..................................................................................................................................... 19
Figure 16 Shaft Stress ...................................................................................................................................................... 20
Figure 17 Shaft Stress ...................................................................................................................................................... 21
Figure 18 CES ................................................................................................................................................................... 22
Figure 19 CES ................................................................................................................................................................... 23
Figure 20 CES ................................................................................................................................................................... 23
Figure 21 Brainstorm Sketch ........................................................................................................................................... 24
Figure 22 2D Drawing ...................................................................................................................................................... 25
Figure 23 3D Image ......................................................................................................................................................... 25
Figure 24 3D views .......................................................................................................................................................... 26
Figure 25 3D views .......................................................................................................................................................... 27
Figure 26 Motion Study................................................................................................................................................... 28
Figure 27 Motion Study................................................................................................................................................... 28
Figure 28 FEA Gravity 1 ................................................................................................................................................... 29
Figure 29 FEA Gravity 2 ................................................................................................................................................... 29
Figure 30 FEA Gravity 3 ................................................................................................................................................... 30
Figure 31 FEA Gravity 4 ................................................................................................................................................... 30
Figure 32 FEA Gravity 5 ................................................................................................................................................... 31
Figure 33 FEA Gravity 6 ................................................................................................................................................... 31
Figure 34 FEA Wind 1 ...................................................................................................................................................... 32
Figure 35 FEA Wind 2 ...................................................................................................................................................... 32
Figure 36 FEA Wind 3 ...................................................................................................................................................... 33
Figure 37 FEA Wind 5 ...................................................................................................................................................... 33
Figure 38 FEA Wind 6 ...................................................................................................................................................... 34
Figure 39 FEA Wind 7 ...................................................................................................................................................... 34
Figure 40 FEA Wind 8 ...................................................................................................................................................... 35
Figure 41 Flow 1 .............................................................................................................................................................. 36
Figure 42 Flow 2 .............................................................................................................................................................. 36
Figure 43 Flow 3 .............................................................................................................................................................. 37
Figure 44 Flow 4 .............................................................................................................................................................. 37
Figure 45 Flow 5 .............................................................................................................................................................. 37
Figure 46 Flow 7 .............................................................................................................................................................. 38
Figure 47 Flow 8 .............................................................................................................................................................. 38

Advanced Mechanical Design and Materials
P a g e 5 | 63
Figure 48 Flow 8 .............................................................................................................................................................. 39
Figure 49 Flow 9 .............................................................................................................................................................. 39
Figure 50 Flow 10 ............................................................................................................................................................ 40
Figure 51 Flow 11 ............................................................................................................................................................ 41
Figure 52 Flow 12 ............................................................................................................................................................ 41
Figure 53 CES Parameters ............................................................................................................................................... 42
Figure 54 Comparison Chart ........................................................................................................................................... 43
Figure 55 Kloeckner Stock (kloecknermetalsuk, 2015) ................................................................................................... 43
Figure 56 CES Graph ........................................................................................................................................................ 44
Figure 57 CES Parameters ............................................................................................................................................... 45
Figure 58 Comparison Chart ........................................................................................................................................... 46
Figure 59 CES Graph ........................................................................................................................................................ 46
Figure 60 Stock (kloecknermetalsuk, 2015) .................................................................................................................... 47
Figure 61 FEA Wind Re-Run ............................................................................................................................................ 48
Figure 62 Optimisation .................................................................................................................................................... 48
Figure 63 Optimisation .................................................................................................................................................... 49
Figure 64 Re-Design ........................................................................................................................................................ 50
Figure 65 Re-Design ........................................................................................................................................................ 50
Figure 66 Non-Linear result ............................................................................................................................................ 51
Figure 67Non- Linear result ............................................................................................................................................ 51
Figure 68 FEA Static ......................................................................................................................................................... 52
Figure 69 FEA Wind ......................................................................................................................................................... 52
Figure 70 FEA Flow .......................................................................................................................................................... 53
Figure 71 FEA Flow .......................................................................................................................................................... 53
Figure 72 Stress Ratio ...................................................................................................................................................... 54
Figure 73 Cycles .............................................................................................................................................................. 54
Figure 74 CES Fatigue Strength ....................................................................................................................................... 55
Figure 75 S-N Input ......................................................................................................................................................... 55
Figure 76 Fatigue ............................................................................................................................................................. 56
Figure 77 Fatigue ............................................................................................................................................................. 56
Figure 78 Fatigue ............................................................................................................................................................. 57
Figure 79 Car Barrier technical spec (avon-barrier, 2016) .............................................................................................. 60
Figure 80 Car barrier technical spec (avon-barrier, 2016) .............................................................................................. 61
Figure 81 CES Citation Rules ........................................................................................................................................... 63

Advanced Mechanical Design and Materials
P a g e 6 | 63
Introduction The intention of the assignment is to follow analysis and material selection processes, of components, from concept
to validated product.
Due to high storm winds, a new car park barrier arm and shaft were designed to be able to withstand wind speeds of
up to 105MPH, also these components must have a resultant actuation (lifting and lowering the arm) lifespan of >107
cycles.
The report will show how hand calculations can be carried out to determine the self-weight stresses in the system,
and how materials are then selected, that would intentionally fail, to show how the process works.
Using a number of steps the report will show how FEA and suitable material selection can improve the failed analysis
to a validated, fit for purpose product.
Research required: Average wind speeds-UK
Recent storm wind velocities
Car park barriers and typical materials used
Road width (single lane access)
Analysis used: Motion Analysis
Static-Gravity
Static-Wind load from hand calculations
Flow simulation
Static-from imported flow simulation results
Non-linear Dynamic Simulation
Fatigue
Design optimisations used: Design study/Optimisation
Material selection tools: CES
Advanced Mechanical Design and Materials
P a g e 7 | 63
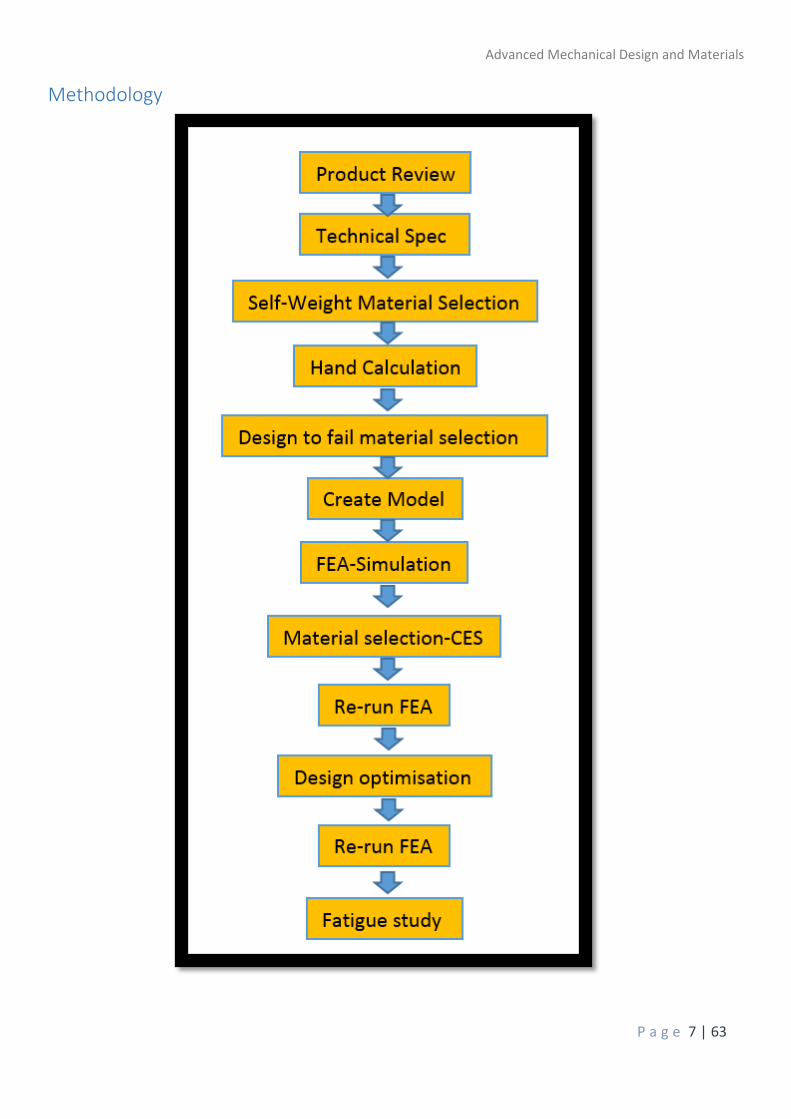
Methodology

Advanced Mechanical Design and Materials
P a g e 8 | 63
Product Review The report scenario is a company looking into creating a car park barrier that can withstand high storm loads and has
a high cycle life (Boom Lifting/Lowering).
The car park barrier design will be based on a common balanced boom arm. Key design criteria will be obtained from
(avon-barrier, 2016), full technical specifications and reference drawings can be found in Appendix 1.
Wind Loading To be able to calculate the wind load on the barrier it is first necessary to do some research into wind speed
averages and peaks during recent storms.
According to (metoffice, 2016) data shows the average low lying wind velocities are around 1-3 knots.
Figure 1 Wind speed Average (metoffice, 2016)
The highest average wind speeds in the UK according to (metoffice, 2016) are in the Shetland Islands, with a velocity
of 14.7 Knots. As this study is based on typical storm loads and reasonable precautions on damage prevention, a
recent storm will be researched.

Advanced Mechanical Design and Materials
P a g e 9 | 63
Case Study-Storm Katie
Figure 2 Storm Katie (metoffice, 2016)
Figure 3 Storm Katie Wind Speed (metoffice, 2016)
According to (metoffice, 2016) storm Katie had the potential for wind velocities of 70MPH. After the event
(metoffice, 2016) stated the highest recorded velocity was around 105MPH (Fig 3) this value will be used in the
study.

Advanced Mechanical Design and Materials
P a g e 10 | 63
Technical Specification After researching materials used in barriers supplied by (avon-barrier, 2016) and (barriersdirec, 2016) aluminium
appeared to be the preferred type. This would possibly be due to the density, and corrosion protection. The
lightweight material will create lower static and actuating stresses.
The required length of the arm can be established from minimum road widths, according to (planningni.gov.uk,
2008) the minimum allowable single access would be 3.2m (Fig 4).
Figure 4 Minimum Access (planningni.gov.uk, 2008)
Figure 5 Car park Barrier (avon-barrier, 2016)
Using Avon barriers as a boom height standard the key criteria can now be stated.

Advanced Mechanical Design and Materials
P a g e 11 | 63
Hand Calculation Pre-requisites, Goals, and Methods
Pre-Requisites A pre-requisite will be to establish a suitable material dimensions to base the initial hand calculations upon, as the
static loadings are self-weight.
The material used for the boom arm is a type of aluminium. The density of the boom arm is 2700KG/M3, and an
available tube diameter of 88.9mm has been selected from a steel stockist (kloecknermetalsuk, 2015).
Goals Initially we need to establish what kind of stresses the boom arm and motor shaft will be subjected too. This
information will give us a point to base the material selection and validations upon.
Validation of the components will involve selecting material that can withstand these stresses with a factor of safety.
For example: If a FOS of 2 is required, max stress is 100MPA then a 200MPa min yield material will be required.
Methods The boom arm maximum stresses will be established by utilising static cantilever beam calculations to find stresses
and beam deflection under self-weight.
Additionally, beam calculations will be carried out if a stop sign is to be included at installation.
The second required calculation will be to find stresses created under a wind load of 105MPH, these stresses will be
calculated for the boom arm (including sign) and motor shaft.

Advanced Mechanical Design and Materials
P a g e 12 | 63
Hand Calculations
Calculation 1 This calculation will establish the maximum stress and deflection in the boom arm during its static state, assuming
the holding sleeve is fixed.
Figure 6 Bending moments

Advanced Mechanical Design and Materials
P a g e 13 | 63
Figure 7 Bending Moments
Figure 8 Bending Moments
Maximum stress (in tension) on the beam is 6.56 MPa, max deflection is 5.47mm.

Advanced Mechanical Design and Materials
P a g e 14 | 63
Calculation 2 The second calculation will be to establish a counter weight (without sign) to keep the beam in equilibrium and thus
not using energy to hold the arm in the horizontal position.
The assumed material at this point is to be a carbon steel with a density of 7860kg/M2.
Figure 9 Counter Weight
Counter weight dimensions=OD 194.2mm, ID 88.9mm, length 200mm (36.81kg).
Advanced Mechanical Design and Materials
P a g e 15 | 63
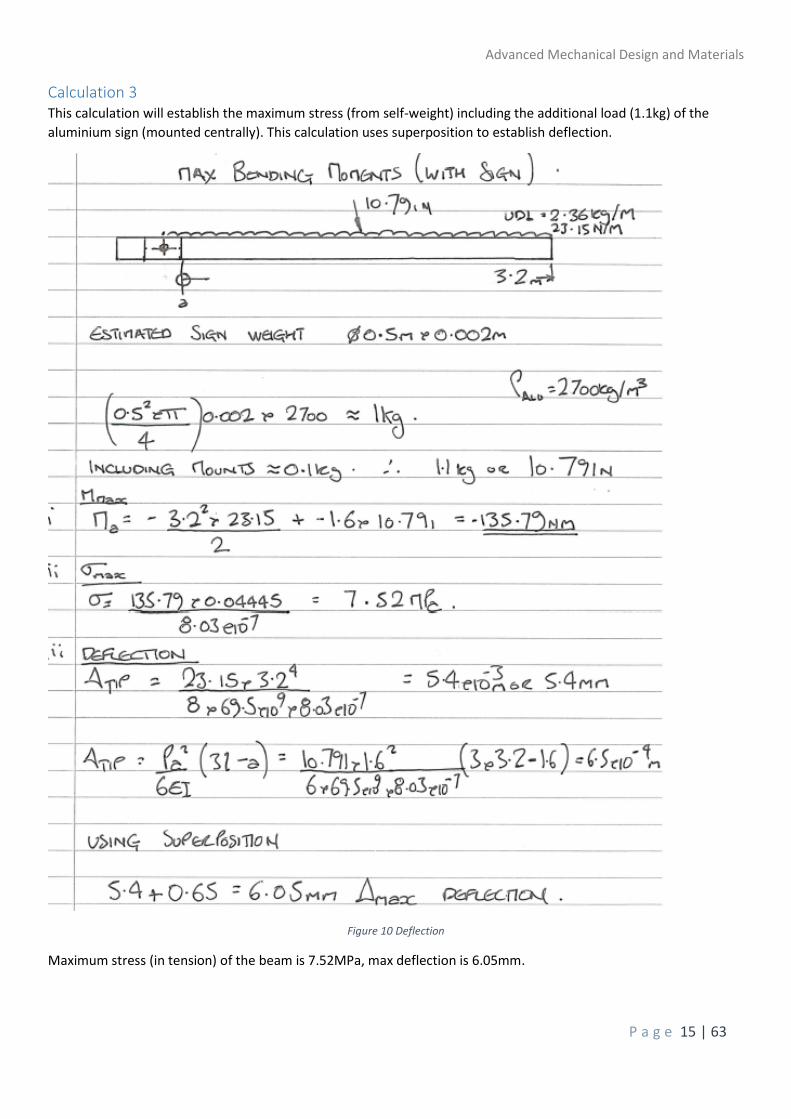
Calculation 3 This calculation will establish the maximum stress (from self-weight) including the additional load (1.1kg) of the
aluminium sign (mounted centrally). This calculation uses superposition to establish deflection.
Figure 10 Deflection
Maximum stress (in tension) of the beam is 7.52MPa, max deflection is 6.05mm.
Advanced Mechanical Design and Materials
P a g e 16 | 63
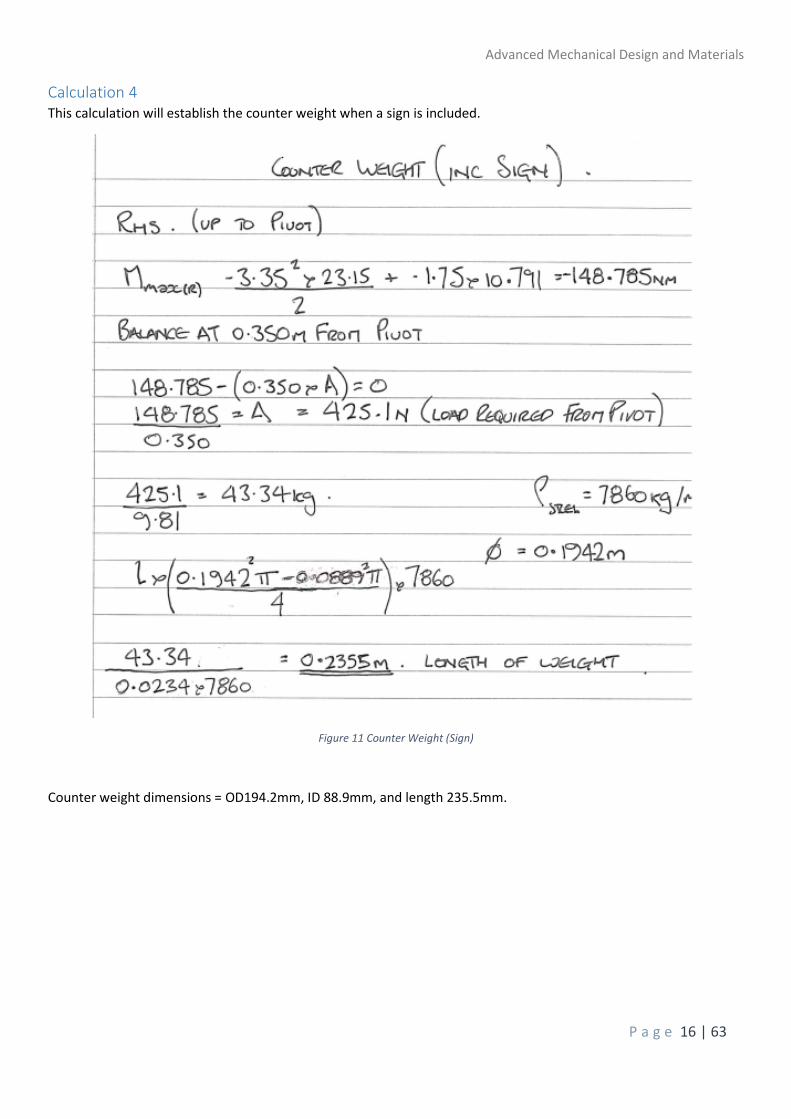
Calculation 4 This calculation will establish the counter weight when a sign is included.
Figure 11 Counter Weight (Sign)
Counter weight dimensions = OD194.2mm, ID 88.9mm, and length 235.5mm.

Advanced Mechanical Design and Materials
P a g e 17 | 63
Calculation 5 Using formulae and correction coefficients from (diracdelta, 2015)/ (Physics, 2016) calculations were carried out to
establish the wind load (105MPH) force on the boom and sign.
Figure 12 Wind Loads
Load on the sign is 524.45N, and the long section of the arm is 378.84N.
Figure 13 Wind Loads
Short side arm wind load = 23.29N, counter weight =121.25N.

Advanced Mechanical Design and Materials
P a g e 18 | 63
Calculation 6 This calculation establishes the maximum stress on the beam from wind load.
Figure 14 Bending stress (Wind)

Advanced Mechanical Design and Materials
P a g e 19 | 63
Figure 15 Bending Stress (Wind)
Maximum stress on the boom is (tension) =80 MPa.

Advanced Mechanical Design and Materials
P a g e 20 | 63
Calculation 7 This calculation establishes the maximum stress on the motor shaft.
Figure 16 Shaft Stress

Advanced Mechanical Design and Materials
P a g e 21 | 63
Figure 17 Shaft Stress
Maximum stress on the shaft=398.97MPa.

Advanced Mechanical Design and Materials
P a g e 22 | 63
Designed for Failure (material selection)
Based on the results from the hand calculations, the intentional design failures can now be incorporated by selecting
inappropriate material.
As previously stated, the boom arm material is calculated to be of a density of 2700Kg/m3, the next step is to find a
suitable material from CES to design in the failure.
The hand calcs show that the max stress on the boom, under wind load, would be 80MPa, a material below this
range is then selected.
Figure 18 CES

Advanced Mechanical Design and Materials
P a g e 23 | 63
Figure 19 CES
Figure 20 CES
The above figures (19-20) show that the selected material stress range (61-68MPa) is below the 80MPa max stress,
so the first (Fail) phase FEA will be conducted with 6063T1.
The shaft stress at 200mm from the boom axis was hand calculated to be 398MPa so a plain carbon steel option with
a yield of 220MPa will be used.

Advanced Mechanical Design and Materials
P a g e 24 | 63
Model Creation
Concept Brainstorm Sketch
Figure 21 Brainstorm Sketch

Advanced Mechanical Design and Materials
P a g e 25 | 63
3D Cad Model A 3D model was created using the dimensions from the technical specification and hand calculations results.
Figure 22 2D Drawing
Figure 23 3D Image

Advanced Mechanical Design and Materials
P a g e 26 | 63
Figure 24 3D views

Advanced Mechanical Design and Materials
P a g e 27 | 63
Figure 25 3D views

Advanced Mechanical Design and Materials
P a g e 28 | 63
FEA, Hand Calculation Comparison
Motion Study To validate the counter balance hand calculations, a motion analysis was carried out with gravity active.
Figure 26 Motion Study
At zero seconds the beam is set horizontally.
Figure 27 Motion Study
After 4 seconds no movements can be detected, so the beam is in equilibrium.

Advanced Mechanical Design and Materials
P a g e 29 | 63
Static Study (gravity only-fixed pivot) The first FEA analysis is to determine the maximum stress and deflection of the beam (with sign). As was validated in
the hand calcs, the sign will cause more stress in the beam, so only analysis including the sign (worst case scenario)
will be carried.
Fixtures were added to the cement (not necessary at this stage), and pivot (to simulate the hand calc), also mesh
sizes were entered (fig 28-29).
Figure 28 FEA Gravity 1
Figure 29 FEA Gravity 2
Advanced Mechanical Design and Materials
P a g e 30 | 63
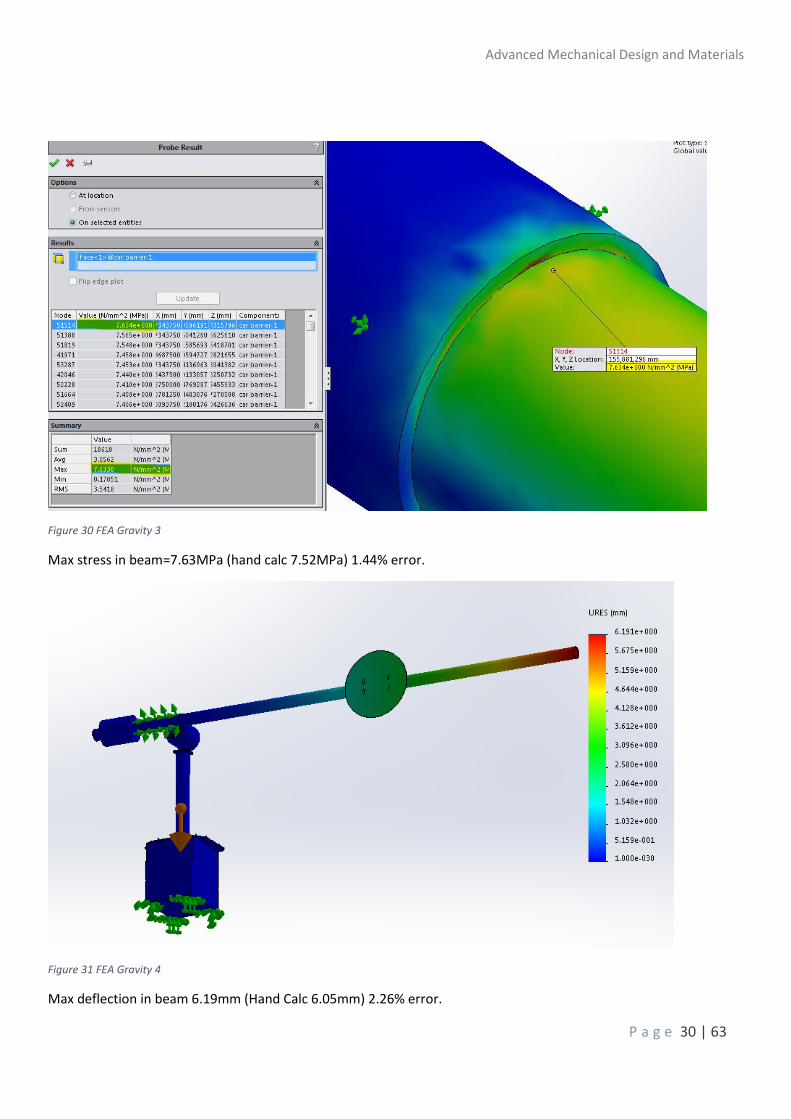
Figure 30 FEA Gravity 3
Max stress in beam=7.63MPa (hand calc 7.52MPa) 1.44% error.
Figure 31 FEA Gravity 4
Max deflection in beam 6.19mm (Hand Calc 6.05mm) 2.26% error.

Advanced Mechanical Design and Materials
P a g e 31 | 63
Static Study (gravity only-free pivot) A study was ran with the fixed cement geometry and a free pivot to check the translation of stresses.
Figure 32 FEA Gravity 5
The highest stress in the assembly was in the Motor shaft = 38.5MPa.
Figure 33 FEA Gravity 6
The maximum deflection increased to 6.69mm, due to the shaft deflection.
(No components failed during this study as yield results were below that of the materials)

Advanced Mechanical Design and Materials
P a g e 32 | 63
Static Study (Wind load from hand calcs) The next calculation is to establish the maximum stresses and deflection under wind loads.
Initial check with fixed pivot Wind load is applied to the sign, counter weight, and beam (fig 34, 35, 36, 37).
Figure 34 FEA Wind 1
Figure 35 FEA Wind 2

Advanced Mechanical Design and Materials
P a g e 33 | 63
Figure 36 FEA Wind 3
Figure 37 FEA Wind 5

Advanced Mechanical Design and Materials
P a g e 34 | 63
Figure 38 FEA Wind 6
Maximum stress on the beam with wind load (fixed pivot) =82.2MPa, (Hand calc=80MPa) 2.67% error
this is the first intentional failure as the material has a yield of 65MPa.
The next simulation is with a free moving pivot (fig 39)
Figure 39 FEA Wind 7
The stress at 200mm from the beam centreline was hand calculated to be 398MPa, the probe shows
386Mpa 3% error above yield strength 220MPa).
The maximum stress in the study is 536MPa, this is above the yield of the material (220MPa) this is the second
designed in failure.

Advanced Mechanical Design and Materials
P a g e 35 | 63
Figure 40 FEA Wind 8
Maximum deflection (121mm) under wind load is relatively high due to shaft failure.
Advanced Mechanical Design and Materials
P a g e 36 | 63
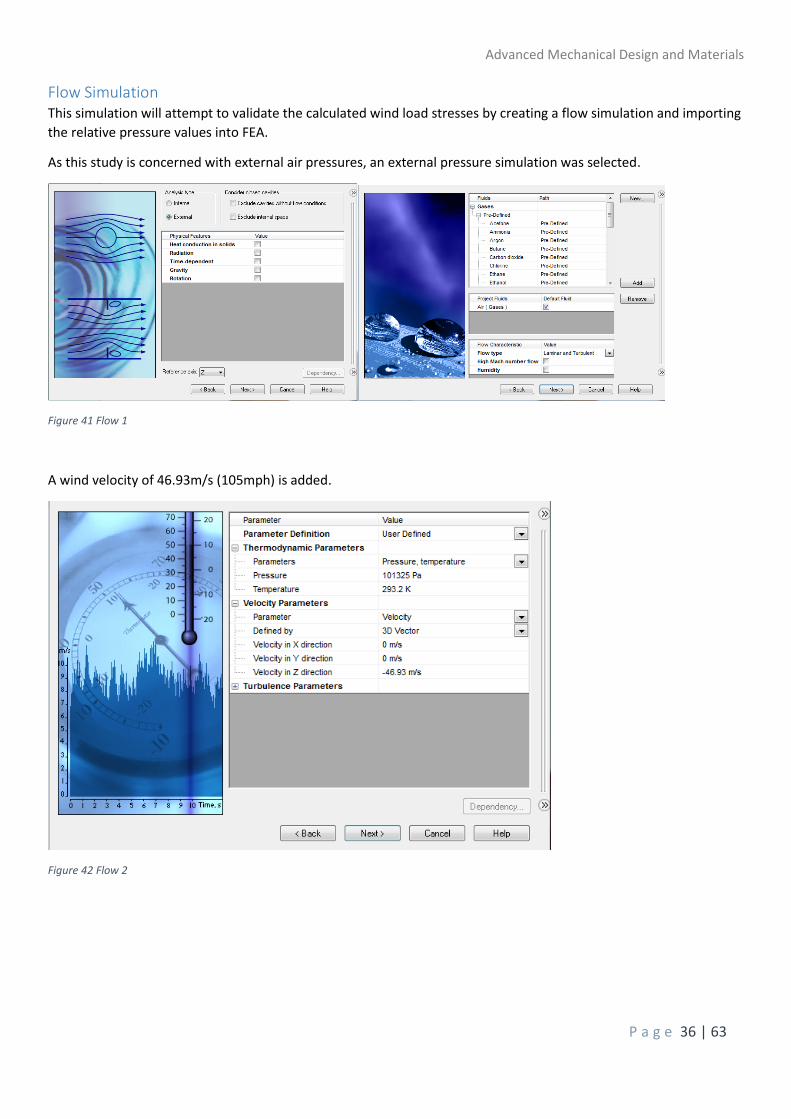
Flow Simulation This simulation will attempt to validate the calculated wind load stresses by creating a flow simulation and importing
the relative pressure values into FEA.
As this study is concerned with external air pressures, an external pressure simulation was selected.
Figure 41 Flow 1
A wind velocity of 46.93m/s (105mph) is added.
Figure 42 Flow 2

Advanced Mechanical Design and Materials
P a g e 37 | 63
The computation domain is defined (fig 43).
Figure 43 Flow 3
The relevant goals are added (fig 45). Normal forces are required for FEA.
Figure 44 Flow 4
Figure 45 Flow 5
Advanced Mechanical Design and Materials
P a g e 38 | 63
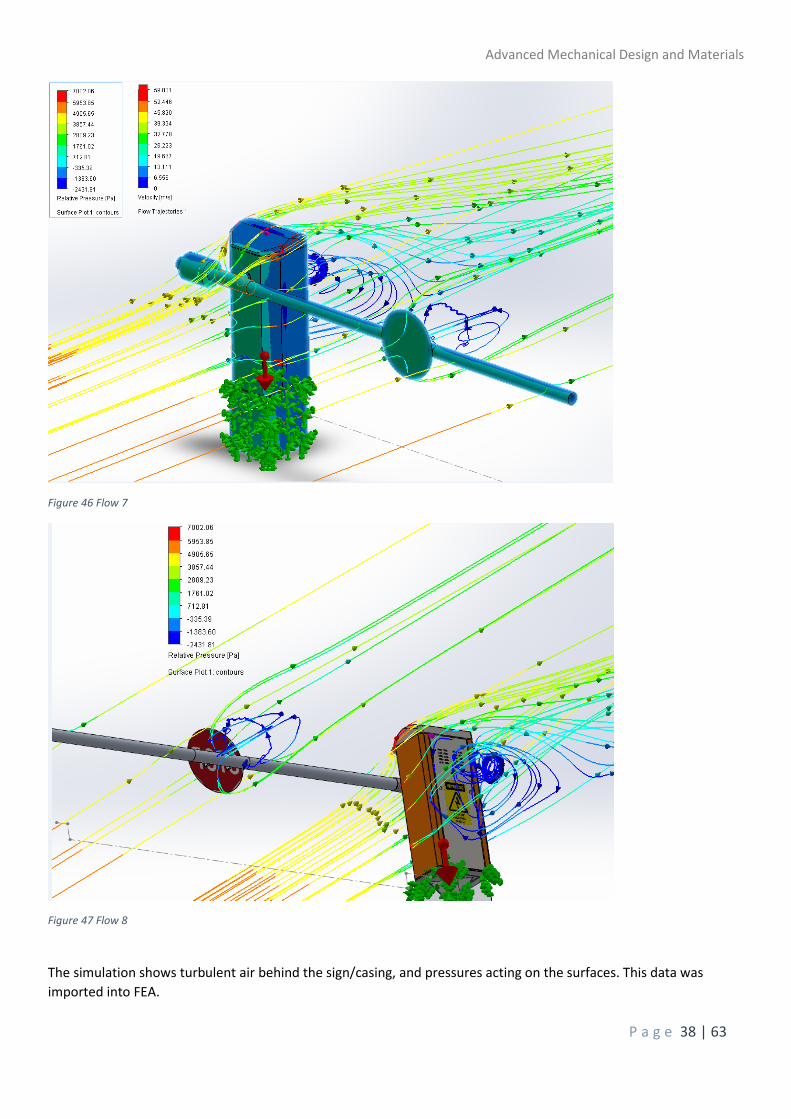
Figure 46 Flow 7
Figure 47 Flow 8
The simulation shows turbulent air behind the sign/casing, and pressures acting on the surfaces. This data was
imported into FEA.
Advanced Mechanical Design and Materials
P a g e 39 | 63
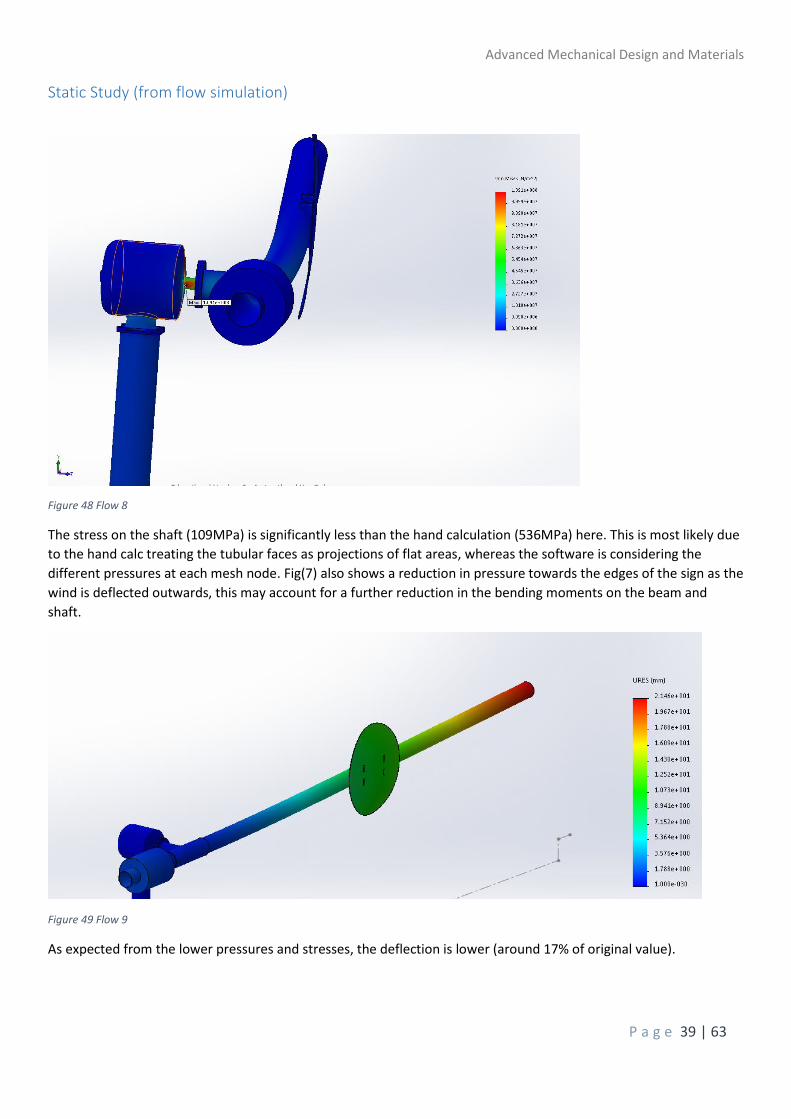
Static Study (from flow simulation)
Figure 48 Flow 8
The stress on the shaft (109MPa) is significantly less than the hand calculation (536MPa) here. This is most likely due
to the hand calc treating the tubular faces as projections of flat areas, whereas the software is considering the
different pressures at each mesh node. Fig(7) also shows a reduction in pressure towards the edges of the sign as the
wind is deflected outwards, this may account for a further reduction in the bending moments on the beam and
shaft.
Figure 49 Flow 9
As expected from the lower pressures and stresses, the deflection is lower (around 17% of original value).

Advanced Mechanical Design and Materials
P a g e 40 | 63
Now that the hand calculations have been validated (excluding wind forces) and the designed in failures established,
the next step is to check the dynamic stresses in the system using the more advanced options of Solidworks.
This will give us additional data needed to achieve a validated product.
Non-Linear Dynamic Analysis
This simulation is used to calculate the varying stresses on the boom and shaft as the boom arm is being raised, it
also accounts for inertia and fluctuations in load due to the arm vibrating.
To carry out this simulation, the model needed to be simplified as the first pass took over 10 hours to calculate. To
achieve this the sign and mounting pole were removed, and a cylinder added to simulate the loading.
The first step was adding advanced pivoting constraints to the shaft, also a radian value of 1.57 was added to
simulate the arm travelling through 90 degrees.
Figure 50 Flow 10
A time period of 2 seconds and a step period of 0.05 seconds were added (this will calculate the stresses on the
assembly, at 0.05s steps over a 2s duration, during the 90 degree travel.

Advanced Mechanical Design and Materials
P a g e 41 | 63
Figure 51 Flow 11
After carrying out the simulation, the maximum stress over all the steps was found (Fig 52).
Figure 52 Flow 12
The maximum stress was located, at step 30 about 1.5 seconds into the movement, on the shaft with a value of
306MPa. This value is over the yield threshold of the material (220Mpa) so the shaft has failed. Also the stress on the
boom (85MPa) during this step was greater than the yield for the material (65MPa).
Now that the failure points and values have been established, the next step is to find appropriate materials from
CES, and use design optimisation to change the geometry to create a viable solution.

Advanced Mechanical Design and Materials
P a g e 42 | 63
Suitable Material Selection (CES)
Boom Arm Material Selection Using the values established with the FEA simulations, some search criteria for the boom arm can be added to CES.
The highest stress=85MPa, so with a FOS of 2 the Yield strength needs to be 160-220MPa.
Density =2700Kg/M3 (light weight arm).
Fatigue strength 107 cycles= 85-220 (based on highest stress).
As the component will be extruded the hot forming process needs to be excellent (more likely to be available in
extruded form).
Figure 53 CES Parameters

Advanced Mechanical Design and Materials
P a g e 43 | 63
A table of results was created, additional checks were made to establish supplier availability.
Figure 54 Comparison Chart
Figure 55 Kloeckner Stock (kloecknermetalsuk, 2015)
Kloeckner Material suppliers show that 6053T6 is a stocked item.

Advanced Mechanical Design and Materials
P a g e 44 | 63
Figure 56 CES Graph
Graph (fig 56) shows the yield range of 6030T6 is greater than the maximum stress on the boom arm.
The results from the CES enquiry indicated that 6063 T6 would be appropriate because the:
Minimum yield strength of the material would yield a FOS of 2.5
Fatigue strength @ 107 =85MPa (mean was equal to the max recorded figure of 85MPa)
Density is 2700Kg/m3, the moment of inertia and self-weight will be lower than a steel component, thus
reducing stress on the motor shaft (key load bearing element)
Material is excellent for hot forming processes, and freely available in CHS form (fig 55) without costly
tooling and manufacturing processes
Results showed all Co2 and recycling energy values were equal
Price per Kg was lowest (shared with one other not freely available result)
6063T6 was selected for the boom material

Advanced Mechanical Design and Materials
P a g e 45 | 63
Motor Shaft Material Selection The next material to be established is for the motor shaft. Using the highest stress from the flow simulation, a
suitable material is to be selected and further investigations into geometry adjustments are to be carried out. These
adjustments may improve the translation of stresses due to worst case hand calculated wind loads. The philosophy
behind the previous statement is that without any empirical data (at the design stage) on wind loading, it cannot be
established what are the more accurate values: the hand calcs or flow simulation?
The assumption is that the particle analysis carried out by Solidworks is the more accurate of the two, but
precautions must be incorporated. After prototyping, a different material could be investigated.
(Material parameters based on Results from flow simulation)
Highest stress=109MPa, so with a FOS of 2: Yield strength 218-250
Density =7800-7900Kg/M3 (light weight arm)
Fatigue strength 107 cycles= 220 Min
As the component will be extruded the hot forming process needs to be excellent (more likely to be available in
extruded form).
Figure 57 CES Parameters

Advanced Mechanical Design and Materials
P a g e 46 | 63
Figure 58 Comparison Chart
Figure 59 CES Graph

Advanced Mechanical Design and Materials
P a g e 47 | 63
Figure 60 Stock (kloecknermetalsuk, 2015)
Graph (fig 59) shows the yield range of S275N is greater than the maximum stress on the motor shaft (109MPa).
The results from the CES enquiry indicated that S275N would be appropriate because the:
Yield strength of the material would yield a FOS of 2.2 (based on mean yield)
Fatigue strength @ 107 =214MPa (mean value is higher than max recorded figure of 109MPa)
Density is 7860Kg/m3 mean carbon steel figure
Material is excellent for hot forming processes, and freely available in round bar form (fig 60) without costly
tooling and manufacturing processes
Lowest Co2 and recycling energy values
Price per Kg was second lowest
S275N was selected for the motor shaft.

Advanced Mechanical Design and Materials
P a g e 48 | 63
Re-Run FEA (wind load)
Figure 61 FEA Wind Re-Run
Re-running the FEA showed that the max stress in the motor shaft has not changed.
This can be demonstrated with the hand calc σ =𝑀𝑌
𝐼 changing the material properties alone will not change the
maximum stress in the motor shaft (although changing the material to be suitable for this stress is an option). The
geometry needs to be adjusted.
Design Optimisation Design optimisation will be used to find a suitable shaft diameter that will bring the stress down to a lower figure.
The philosophy behind this is that buying a more processed material with a higher yield is an option but may cost
more when creating tooling or doing additional machining processes. The goal here is to make the design solution
usable with a feely available common material.
A value range for the diameter of the shaft was added to the design study, and additionally another material added
to proof changing material will not change the stress, just the FOS.
Figure 62 Optimisation

Advanced Mechanical Design and Materials
P a g e 49 | 63
Figure 63 Optimisation
The optimisation result: Changing the material does not change the stress, only changing the diameter does.
Optimal results:
AISI1020
40mm Dia shaft=145.11MPa
Plain carbon steel shaft
40mm Dia shaft=145.11MPa
Therefore, changing the diameter of the shaft to 40mm and incorporating the stronger yield (275MPa min) material
will increase the FOS to 1.89 from 0.5 (original FOS).

Advanced Mechanical Design and Materials
P a g e 50 | 63
FEA Phase 3 Now the adjustments to material and geometry have been made the FEA studies can be re-ran.
Non-Linear Dynamic Analysis Re-Run As one of the highest stresses was established during Non-linear analysis, this is the study that will be ran first.
One of the causes for the high stresses on the motor shaft could be how the shaft intersects with the flange (sharp
edge), this is causing stress raisers. A 10mm radius is added to try to resolve this.
Figure 64 Re-Design
Adding the radius did not resolve the high concentration of stress. After running a new non-linear analysis the
maximum stress is now 316MPa, increased from 306MPa (Sharp corner).
The radius was removed and a boss added to step the stress during translation into the motor shaft.
.
Figure 65 Re-Design
Advanced Mechanical Design and Materials
P a g e 51 | 63
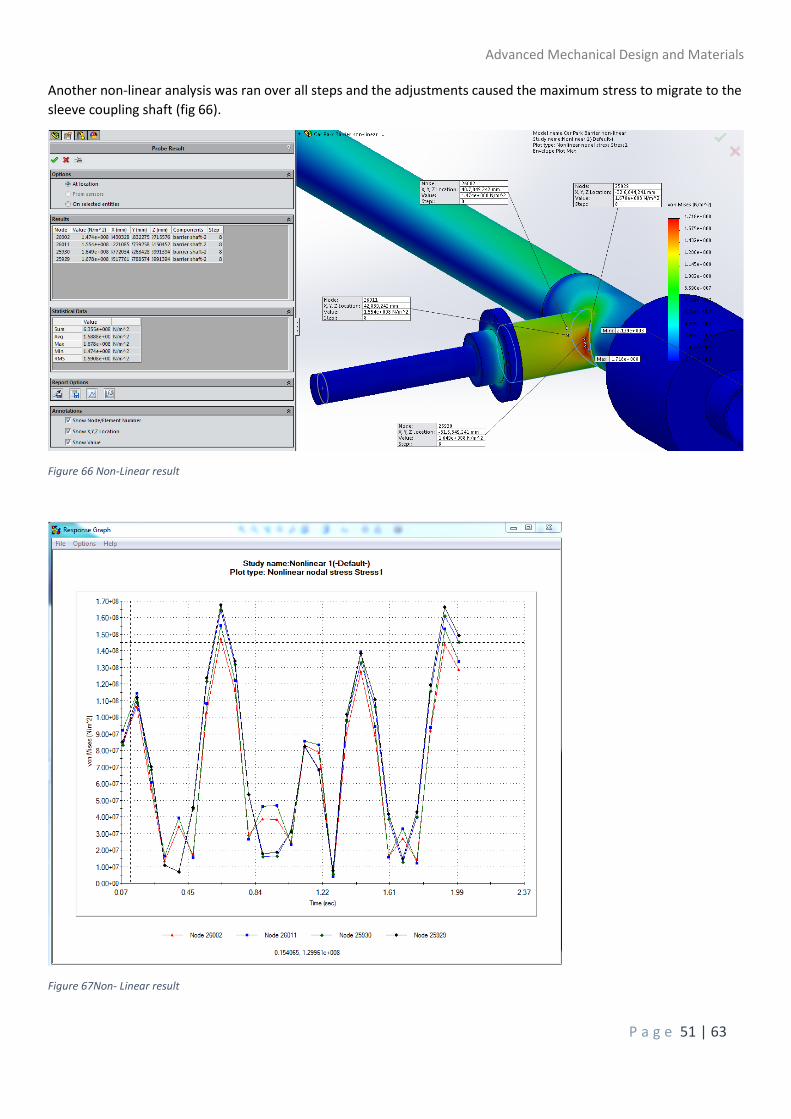
Another non-linear analysis was ran over all steps and the adjustments caused the maximum stress to migrate to the
sleeve coupling shaft (fig 66).
Figure 66 Non-Linear result
Figure 67Non- Linear result

Advanced Mechanical Design and Materials
P a g e 52 | 63
The new maximum stress (171MPa) is lower than the yield in the coupling shaft (275MPa) and has a FOS of 1.57.
By using the design optimiser and some common knowledge, the stress in the shaft assembly is now within
acceptable levels and has passed this study.
Static Study Re-Run (gravity)
Figure 68 FEA Static
The maximum stress on the assembly is 1.382Kpa with a min FOS of 19 and clearly passes this study.
Static Study Re-Run (wind load)
Figure 69 FEA Wind
Maximum stress here under the worst case scenario is 219MPa on a material with 275MPa yield.
FOS=1.26, this is quite close to 1:1 but considering this study is based on the maximum hand calculation, which
varied to a major degree to the flow simulation (much lower stresses), it will be considered a pass. Empirical data
may lead to further investigation.

Advanced Mechanical Design and Materials
P a g e 53 | 63
Static Study Re-Run (from flow simulation)
Figure 70 FEA Flow
Figure 71 FEA Flow
After re-running the flow simulation based study, the maximum stress is 58MPa and has a FOS of 4.7.
The design solution has passed this study.
Advanced Mechanical Design and Materials
P a g e 54 | 63
Fatigue Analysis Having achieved passes in all re-ran studies, the next step is to confirm that the selected fatigue strength material
values in CES yield a life of >107 cycles during arm actuation.
As the fatigue study is based on the cyclic movement of the boom arm, the highest stresses found from the Non-
linear study were simulated in a static study and a fatigue simulation was carried out.
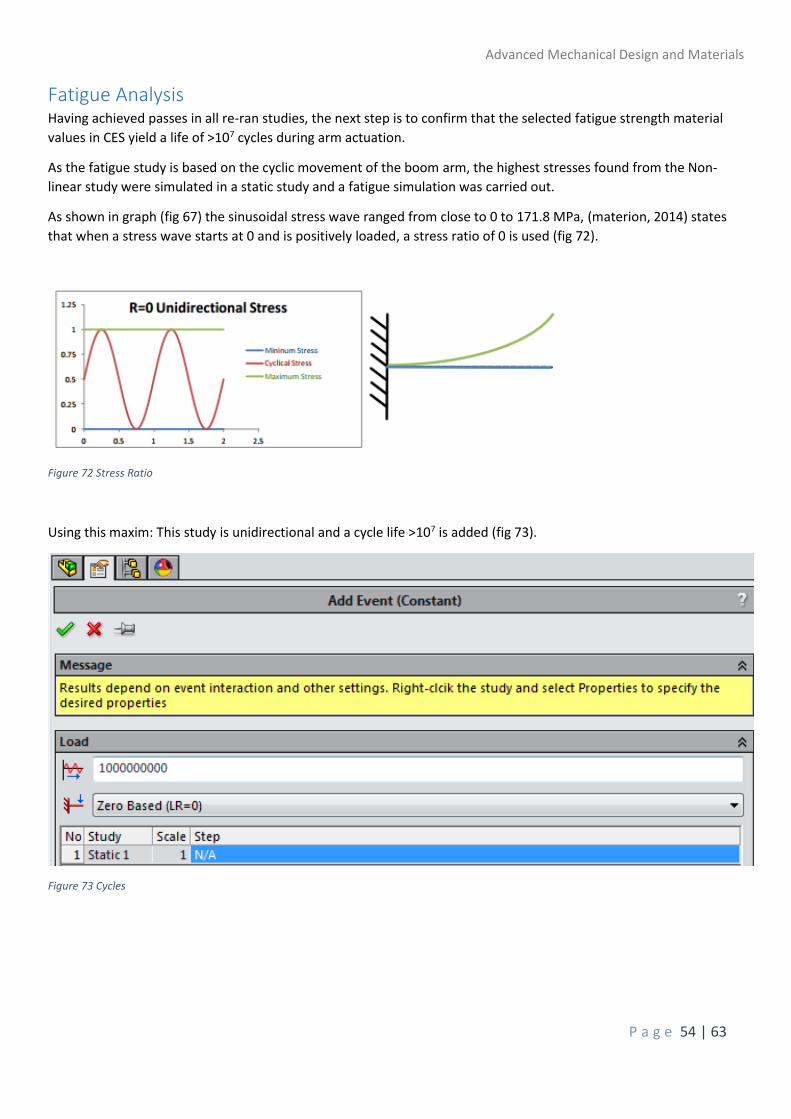
As shown in graph (fig 67) the sinusoidal stress wave ranged from close to 0 to 171.8 MPa, (materion, 2014) states
that when a stress wave starts at 0 and is positively loaded, a stress ratio of 0 is used (fig 72).
Figure 72 Stress Ratio
Using this maxim: This study is unidirectional and a cycle life >107 is added (fig 73).
Figure 73 Cycles

Advanced Mechanical Design and Materials
P a g e 55 | 63
Figure 74 CES Fatigue Strength
The next step is to enter the fatigue strength values for S275N (mean) from the CES S-N graph (FIG 74) into
Solidworks.
Figure 75 S-N Input

Advanced Mechanical Design and Materials
P a g e 56 | 63
A fatigue study is ran, the mean fatigue strength of the material is 213MPa, which is above the highest working
stress of 171.8MPa, so a cycle life of greater that 107 cycles is expected.
Figure 76 Fatigue
The Solidworks chart shows that the design solution has a cycle life of =>107.
Fatigue Proof An additional study with a higher simulated stress was ran to check the results were not invalid as they all state 107.
Figure 77 Fatigue
By roughly doubling the loading, the cycle life reduced to 100 cycles.

Advanced Mechanical Design and Materials
P a g e 57 | 63
Figure 78 Fatigue
The coupling shaft showed highest damage percentage.
The model is now fully validate, and has passed all required goals.
Summary Using CES and Solidworks simulation it was possible to take a designed to fail assembly and demonstrate how to
make it viable through the described processes.
The CES tool proved a valuable step in the process as the search features parameter function helped narrow down
the search field, had extensive data, and would prove efficient, valuable, and also essential in a working design
environment.
Using FEA simulation is very efficient in terms of time and visualisation, however, hand calculations must always be
carried out to know your simulation is correct.
A number of times during the creation of this report I noticed disparity with results which, after investigation,
highlighted errors such as: Incorrect material in Simulation, incorrect probe positioning, getting results from the
incorrect component, poorly placed loading, incorrect counter balance placement to name a few. These are all quite
significant errors and would have cause most of my results to be incorrect if I had not noticed them during the
comparison stage.
I noticed material values differed in CES to Solidworks: (6063 T1) 65MPa/ 90MPa yield respectively.
This is concerning as both companies are reputable but the difference is substantial (which one do you trust?)
S275 is sold as minimum Yield 275Mpa states (steelexpress, 2016) however CES shows a range (205-275MPa) this
may depend on thickness as stated by (b2bmetal, 2016) which will need accounting for in my future simulations.
Do I trust the Solidworks results? According to (javelin-tech, 2016) without empirical data it is impossible to know.
The hand calculations are a maxim and empirically speaking the results were very close to the Solidworks results
(below 4%) apart from flow simulation. These results were 27.3% of my hand calculations. This is probably due to the
simplistic hand calculation but it caused me to do some further research.
(javelin-tech, 2016) States the National Agency for Finite Element Methods and Standards (NAFEMS) has standard
benchmarks. Solidworks, over six categories, has 50 NAFEMS benchmarks states (javelin-tech, 2016) which increases
confidence in my simulation results.

Advanced Mechanical Design and Materials
P a g e 58 | 63
References avon-barrier. (2016) Parking-Barriers. [Online]
Available at: http://www.avon-barrier.co.uk/Parking-Barriers-
(Accessed 21 4 2016)
b2bmetal. (2016) 144. [Online]
Available at: http://www.b2bmetal.eu/en/pages/index/index/id/144/
(Accessed 21 4 2016)
barriersdirec. (2016) arm-barriers. [Online]
Available at: http://www.barriersdirect.co.uk/barriers-c1157/arm-barriers-c1117/aluminium-manual-rising-arm-
barriers-up-to-7m-p8961
(Accessed 21 4 2016)
diracdelta. (2015) drag. [Online]
Available at: http://www.diracdelta.co.uk/science/source/d/r/drag%20coefficient/source.html#.VxjvAfkrKUl
(Accessed 2016 4 2016)
javelin-tech. (2016) solidworks-simulation-accuracy. [Online]
Available at: http://www.javelin-tech.com/blog/2015/01/solidworks-simulation-accuracy/
(Accessed 21 4 2016)
kloecknermetalsuk. (2015) Aluminium-Productsi. [Online]
Available at: http://www.kloecknermetalsuk.com/wp-content/uploads/2015/09/SA-5775-Aluminium-Productsi1.pdf
(Accessed 21 4 2016)
materion. (2014) Ratios. [Online]
Available at:
http://materion.com/~/media/Files/PDFs/Alloy/Newsletters/Technical%20Tidbits/Issue%20No%2053%20-
%20Fatigue%20and%20Stress%20Ratios.pdf
(Accessed 21 4 2016)
metoffice. (21/4/2016) wind-map. [Online]
Available at: http://www.metoffice.gov.uk/renewables/wind-map
(Accessed 21 04 2016)
metoffice. (2016) storm-katie. [Online]
Available at: http://www.metoffice.gov.uk/news/releases/2016/storm-katie
(Accessed 21 4 2016)
metoffice. (2016) what-katie-did-a-review-of-easter-mondays-storm-katie/. [Online]
Available at: https://blog.metoffice.gov.uk/2016/03/28/what-katie-did-a-review-of-easter-mondays-storm-katie/
(Accessed 21 4 2016)
Physics. (2016) drag-coefficient. [Online]
Available at: http://physics.stackexchange.com/questions/201633/what-shape-has-the-highest-drag-
coefficient/201664
(Accessed 21 4 2016)
planningni.gov.uk. (2008) vehicular-access. [Online]
Available at: http://www.planningni.gov.uk/downloads/dcan15-vehicular-access.pdf
(Accessed 21 4 2016)

Advanced Mechanical Design and Materials
P a g e 59 | 63
steelexpress. (2016) S355-S275-structural-steel. [Online]
Available at: http://www.steelexpress.co.uk/structuralsteel/S355-S275-structural-steel.html
(Accessed 21 4 2016)
metoffice. (2016) windiest-place-in-UK. [Online]
Available at: http://www.metoffice.gov.uk/learning/wind/windiest-place-in-UK
(Accessed 21 04 2016)
Bibliography Ashby, M. F. (2011) Material Selection in Mechanical Design. 4th ed. Oxford: Elsevier.
Dingle, M. T. a. L. (2008) Higher National Engineering. 2nd ed. Oxford: Elsevier.
javelin-tech. (2016) solidworks-simulation-accuracy. [Online]
Available at: http://www.javelin-tech.com/blog/2015/01/solidworks-simulation-accuracy/
(Accessed 21 4 2016)
Michael Ashby, H. S. a. D. C. (2014) Engineering, science, Processing, and design. Third ed. Oxford: Elsevier.
Physics. (2016) drag-coefficient. [Online]
Available at: http://physics.stackexchange.com/questions/201633/what-shape-has-the-highest-drag-
coefficient/201664
(Accessed 21 4 2016)
planningni.gov.uk. (2008) vehicular-access. [Online]
Available at: http://www.planningni.gov.uk/downloads/dcan15-vehicular-access.pdf
(Accessed 21 4 2016)
Additionally (Specific CES Request. All images must have the below acknowledgement attached and in
bibliography-Appendix 2)
Charts/data/etc. from “CES EduPack 2015, Granta Design Limited, UK (www.grantadesign.com)”.
Advanced Mechanical Design and Materials
P a g e 60 | 63
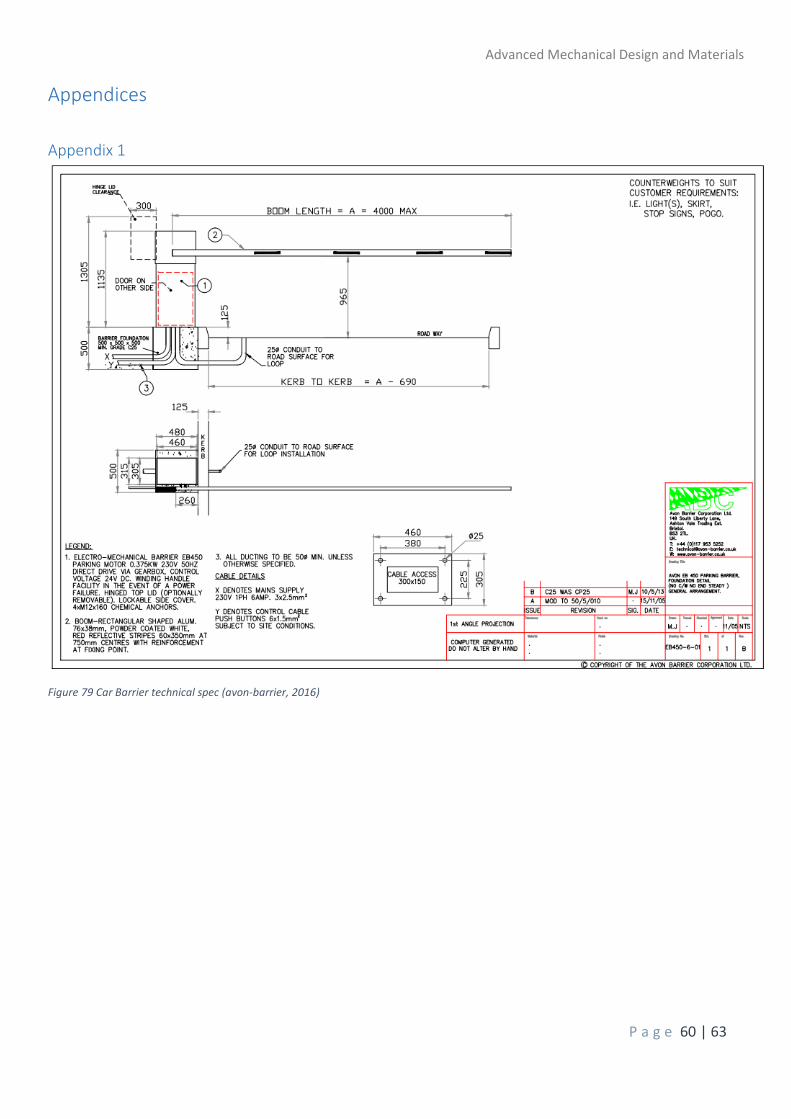
Appendices
Appendix 1
Figure 79 Car Barrier technical spec (avon-barrier, 2016)

Advanced Mechanical Design and Materials
P a g e 61 | 63
Figure 80 Car barrier technical spec (avon-barrier, 2016)

Advanced Mechanical Design and Materials
P a g e 62 | 63

Advanced Mechanical Design and Materials
P a g e 63 | 63
Appendix 2
Figure 81 CES Citation Rules


![Advanced Material Technology±MT[0-33-3].pdf · Material Technology Technology. Advanced Material Technology Advanced Material Technology. 3.4-16. Advanced Material Technology. Advanced](https://static.fdocuments.net/doc/165x107/5ebad08215a94a1265211c82/advanced-material-mt0-33-3pdf-material-technology-technology-advanced-material.jpg)