Advanced General Aviation Transport Experiments 1.3 Acronyms and Definitions A – Basis 95% lower...
140
Advanced General Aviation Transport Experiments B – Basis Design Allowables for Epoxy – Based Prepreg Fiberite Plain Weave Graphite Fabric T650 3K-70-PW / 7740 AGATE-WP3.3-033051-100 September 2001 J. Tomblin, J. McKenna, Y. Ng, K. S. Raju National Institute for Aviation Research Wichita State University Wichita, KS 67260-0093
Transcript of Advanced General Aviation Transport Experiments 1.3 Acronyms and Definitions A – Basis 95% lower...
Advanced General Aviation Transport Experiments
B – Basis Design Allowables for Epoxy – Based Prepreg
Fiberite Plain Weave Graphite Fabric
T650 3K-70-PW / 7740
AGATE-WP3.3-033051-100 September 2001 J. Tomblin, J. McKenna, Y. Ng, K. S. Raju National Institute for Aviation Research Wichita State University Wichita, KS 67260-0093

3
TABLE OF CONTENTS
1.0 INTRODUCTION .....................................................................................................5 1.1 Scope ................................................................................................................................................... 5 1.2 Symbols Used...................................................................................................................................... 6 1.3 Acronyms and Definitions .................................................................................................................... 7 1.4 References........................................................................................................................................... 8 1.5 Methodology ........................................................................................................................................ 9
1.5.1 Test Matrix..................................................................................................................................... 9 1.5.2 Environmental Conditioning ........................................................................................................ 11 1.5.3 Fluid Sensitivity Screening .......................................................................................................... 11 1.5.4 Normalization Procedures........................................................................................................... 12 1.5.5 Statistical Analysis....................................................................................................................... 13 1.5.6 Material Performance Envelope and Interpolation...................................................................... 13
1.5.6.1 Interpolation Example........................................................................................................... 15
2.0 FIBERITE T650 3K-70-PW / 7740 PREPREG PROPERTIES ................................17 2.1 Prepreg Documentation by Prepreg Lot ............................................................................................ 18 2.2 Process Specification......................................................................................................................... 19
3.0 FIBERITE T650 3K-70-PW / 7740 LAMINATE PROPERTIES ...............................20 3.1 Test Results ....................................................................................................................................... 21
3.1.1 Summary ..................................................................................................................................... 22 3.1.2 Individual Test Summaries.......................................................................................................... 23
3.1.2.1 Tension, 1-axis ..................................................................................................................... 24 3.1.2.2 Tension, 2-axis ..................................................................................................................... 25 3.1.2.3 Compression, 1-axis............................................................................................................. 26 3.1.2.4 Compression, 2-axis............................................................................................................. 27 3.1.2.5 Shear, 12 axis....................................................................................................................... 28 3.1.2.6 Shear, 13 axis....................................................................................................................... 29
3.1.3 Individual Test Charts ................................................................................................................. 30 3.1.3.1 Tension, 1-axis ..................................................................................................................... 31 3.1.3.2 Tension, 2-axis ..................................................................................................................... 32 3.1.3.3 Compression, 1-axis............................................................................................................. 33 3.1.3.4 Compression, 2-axis............................................................................................................. 34 3.1.3.5 Shear, 12 axis....................................................................................................................... 35 3.1.3.6 Shear, 13 axis....................................................................................................................... 36
3.2 Raw Data ........................................................................................................................................... 37

4
3.2.1 Raw Data Spreadsheets and Scatter Charts .............................................................................. 38 3.2.2 Fluid Sensitivity Raw Data Spreadsheets and Scatter Charts .................................................... 81 3.2.3 Representative Shear Stress-Strain Curve................................................................................. 86
3.3 Statistical Results............................................................................................................................... 88 3.3.1 Plot by Condition ......................................................................................................................... 89 3.3.2 Plot of Pooled Data ................................................................................................................... 100
3.4 Moisture Conditioning History Charts .............................................................................................. 111 3.5 Physical Test Results....................................................................................................................... 116
4.0 TESTING AND REPORTING COMMENTS...........................................................128
APPENDIX A. PHYSICAL TEST DATA SUPPLIED BY MATERIAL VENDOR .........130
APPENDIX B. DATES OF PANEL MANUFACTURE AND COPY OF FAA FORM 8130-3....................................................................................................................................140

5
1.0 INTRODUCTION
1.1 Scope
The test methods and results described in this document are intended to provide basic composite properties essential to most methods of analysis. These properties are considered to provide the initial base of the “building block” approach. Additional coupon level tests and subelement tests may be required to fully substantiate the full-scale design.
The test methods and results contained in this document are consistent with MIL-HDBK-17-1E,2D,3E - Military Handbook for Polymer Matrix Composites. All material, specimens, fixtures and test results contained within this document were traceable and conformed by the Federal Aviation Administration (FAA). It should be noted that before application of the basis values presented in this document to design, demonstration of the ability to consistently produce equivalent material properties as that evaluated during this program should be substantiated through an acceptable test program.

6
1.2 Symbols Used
�12tu major Poisson’s ratio, tension
�� micro-strain E1
c compressive modulus, longitudinal E1
t tensile modulus, longitudinal E2
c compressive modulus, transverse E2
t tensile modulus, transverse F12
su in – plane shear strength F13
su apparent interlaminar shear strength F1
cu compressive strength, longitudinal F1
tu tensile strength, longitudinal F2
cu compressive strength, transverse F2
tu tensile strength, transverse G12
s in – plane shear modulus Superscripts c compression cu compression ultimate s shear su shear ultimate t tension tu tension ultimate Subscripts 1 1 – axis; longitudinal
(parallel to warp direction of reinforcement) 2 2 – axis; transverse
(parallel to fill direction of reinforcement) 12 in – plane shear 13 interlaminar shear (apparent)

7
1.3 Acronyms and Definitions
A – Basis 95% lower confidence limit on the first population percentile AGATE Advanced General Aviation Transport Experiments ASTM American Society for Testing and Materials B – Basis 95% lower confidence limit on the tenth population percentile C. V. coefficient of variation CTD cold temperature dry CPT cured ply thickness DMA dynamic mechanical analysis dry specimen tested with an “as fabricated” moisture content ETD elevated temperature dry ETW elevated temperature wet FAR Federal Aviation Regulations FAW fiber areal weight Gr/Ep Graphite/Epoxy NASA National Aeronautics and Space Administration RTD room temperature dry SACMA Suppliers of Advanced Composite Materials Association SRM SACMA Recommended Method Tg glass transition temperature tply cured ply thickness wet specimen tested with an equilibrium moisture content per
section 1.5.2

8
1.4 References
ASTM Standards D3039-95 Tensile Properties of Polymer Matrix Composite Materials D5379-93 Shear Properties of Composite Materials by the V-Notched
Beam Method D2344-89 Apparent Interlaminar Shear Strength of Parallel Fiber
Composites by Short – Beam Method D792-91 Density and Specific Gravity (Relative Density) of Plastics by
Displacement D2734-94 Void Content of Reinforced Plastics D3171-90 Fiber Content of Resin – Matrix Composites by Matrix
Digestion D695-91 Compressive Properties of Rigid Plastics SACMA Standards SRM 1-94 Compressive Properties of Oriented Fiber-Resin Composites SRM 8-94 Short Beam Shear Strength of Oriented Fiber-Resin
Composites SRM 18-94 Glass Transition Temperature (Tg) Determination by DMA of
Oriented Fiber-Resin Composites Other Documents FAA Document DOT/FAA/AR-00/47: Material Qualification and Equivalency for Polymer Matrix Composite Material Systems, J.S. Tomblin, Y.C. Ng and K.S. Raju, 2001. MIL-HDBK-17 1E, 2D, 3E – Military Handbook for Polymer Matrix Composites Cessna Aircraft Company, Document # 98-87-005: B-Basis Design Allowables Test Plan for Preimpregnated Carbon/Epoxy Broadgoods, Revision B, January 1999.

9
1.5 Methodology
1.5.1 Test Matrix Testing was performed according to the test methods delineated in the test matrix, with modifications as referenced in the AGATE report, Material Qualification and Equivalency for Polymer Matrix Composite Material Systems. The test matrix for properties included in this document is listed on the next page, with the following notation cited in each column:
# x #
where the first # represents the required number of prepreg batches, defined as: Prepreg containing T650 3K-70-PW graphite fabric from one mill roll, impregnated with one batch of resin in one continuous manufacturing operation with traceability to all components. The second # represents the required number of replicates per prepreg batch. For example, “3 x 6” refers to three prepreg batches of material and six specimens per prepreg batch for a total requirement of 18 test specimens.

10
Table 1.5.1: Test Matrix and Standards Used
NO. OF REPLICATES PER
TEST CONDITION
TEST
METHOD CTD1,5
RTD2,5
ETW3
ETD4,5
0o (warp) Tension Strength
ASTM D3039-95 1x4
3x4
3x4
3x4
0o (warp) Tension Modulus, Strength and Poisson’s Ratio
ASTM D3039-95
1x2
3x2
3x2
3x2 90o (fill) Tension Strength
ASTM D3039-95
1x4
3x4
3x4
3x4
90o (fill) Tension Modulus and Strength
ASTM D3039-95
1x2
3x2
3x2
3x2 0o (warp) Compression Strength
SACMA SRM 1-94
1x6
3x6
3x6
3x6
0o (warp) Compression Modulus
SACMA SRM 1-94
1x2
3x2
3x2 3x2 90o (fill) Compression Strength
SACMA SRM 1-94
1x6
3x6
3x6
3x6
90o (fill) Compression Modulus SACMA SRM 1-94
1x2
3x2
3x2 3x2 In-Plane Shear Strength
ASTM D5379-93
1x4
3x4
3x4
3x4
In-Plane Shear Modulus and Strength
ASTM D5379-93
1x2
3x2
3x2 3x2 Short Beam Shear
ASTM D2344-89 --
3x6 -- --
Fiber Volume ASTM D3171-90 One sample per panel Resin Volume ASTM D3171-90 One sample per panel Void Content ASTM D2734-94 One sample per panel Cured Neat Resin Density --- Supplied by manufacturer for
material Glass Transition Temperature SACMA SRM 18-94 3 dry, 3 wet per prepreg lot
Notes : 1 CTD: One prepreg lot of material tested (test temperature = -65
� 5o F, moisture content = as fabricated, soak time at –65 was 3 min.)
2 RTD: Three prepreg lots of material tested (test temperature = 70 � 10o F,
moisture content = as fabricated) 3 ETW: Three prepreg lots of material tested (test temperature = 180
� 5o F, moisture content = equilibrium per section 1.5.2, soak time at 180 was 60 sec.)
4 ETD: Three prepreg lots of material tested (test temperature = 180 � 5o F,
moisture content = as fabricated, soak time at 180 was 60 sec.) 5 Dry specimens are “as fabricated” specimens that have been maintained at
ambient conditions in an environmentally controlled laboratory.

11
1.5.2 Environmental Conditioning All ‘wet’ conditioned samples were exposed to elevated temperature and humidity conditions to establish moisture saturation of the material. Specimens were exposed to 85 ± 5 % relative humidity and 145 ± 5 °F until an equilibrium moisture weight gain of traveler, or witness coupons (1” x 1” x specimen thickness) was achieved. ASTM D5229 and SACMA SRM 11 were used as guidelines for environmental conditioning and moisture absorption. Effective moisture equilibrium was achieved when the average moisture content of the traveler specimen changed by less than 0.05% for two consecutive readings within a span of 7 ± 0.5 days and was expressed by:
where Wi = weight at current time
Wi-1 = weight at previous time Wb = baseline weight prior to conditioning
It is common to see small fluctuations in an unfitted plot of the weight gain vs. time curve. There were no fluctuations that made significant errors in results or caused rejection in the moisture equilibrium criteria. Once the traveler coupons passed the criteria for two consecutive readings, the samples were removed from the environmental chamber and placed in a sealed bag with a moist paper or cotton towel for a maximum of 14 days until mechanical testing. Strain gauged specimens were removed from the controlled environment for a maximum of 2 hours for application of gages in ambient laboratory conditions.
1.5.3 Fluid Sensitivity Screening All ‘wet’ conditioned samples were exposed to elevated temperature and humidity conditions to establish moisture saturation of the material. Specimens were exposed to 85 ± 5 % relative humidity and 145 ± 5 °F until an equilibrium moisture weight gain of traveler, or witness coupons (1” x 1” x specimen thickness) was achieved. ASTM D5229 and SACMA SRM 11 were used as guidelines for environmental conditioning and moisture absorption. Effective moisture equilibrium was achieved when the average moisture content of the traveler specimen changed by less than 0.05% for two consecutive readings within a span of 7 ± 0.5 days and was expressed by:
0.0005 < WW - W
b
1 - ii

12
where Wi = weight at current time
Wi-1 = weight at previous time Wb = baseline weight prior to conditioning
It is common to see small fluctuations in an unfitted plot of the weight gain vs. time curve. There were no fluctuations that made significant errors in results or caused rejection in the moisture equilibrium criteria. Once the traveler coupons passed the criteria for two consecutive readings, the samples were removed from the environmental chamber and placed in a sealed bag with a moist paper or cotton towel for a maximum of 14 days until mechanical testing. Strain gauged specimens were removed from the controlled environment for a maximum of 2 hours for application of gages in ambient laboratory conditions.
1.5.4 Normalization Procedures The normalization procedure attempts to reduce variability in fiber-dominated material properties by adjusting raw test values to a specified fiber volume content. Only the following properties were normalized: �� 0° (warp) Tensile Strength and Modulus �� 90° (fill) Tensile Strength and Modulus �� 0° (warp) Compressive Strength and Modulus �� 90° (fill) Compressive Strength and Modulus The normalization procedure was adopted from MIL-HDBK-17-1E, section 2.4.3.3. The procedure which was used to normalize the data is based on two primary assumptions:
�� The relationship between fiber volume fraction and ultimate laminate strength is linear over the entire range of fiber/resin ratios. (It neglects the effects of resin starvation at high fiber contents.)
�� Fiber volume is not commonly measured for each test sample, so
this method accounts for the fiber volume variation between individual test specimens by utilizing a relationship between fiber volume fraction and laminate cured ply thickness. This relationship is virtually linear in the 0.45 to 0.65 fiber volume fraction range.
Additional information is detailed in FAA Document DOT/FAA/AR-00/47: Material Qualification and Equivalency for Polymer Matrix Composite Material Systems. For all
0.0005 < WW - W
b
1 - ii

13
normalized data contained in this document, the test values are normalized by cured ply thickness according to:
where:
1.5.5 Statistical Analysis When compared to metallic materials, fiber reinforced composite materials exhibit a high degree of material property variability. This variability is due to many factors, including but not limited to: raw material and prepreg manufacture, material handling, part fabrication techniques, ply stacking sequence, environmental conditions, and testing techniques. This inherent variability drives up the cost of composite testing and tends to render smaller data sets than those produced for metallic materials. This necessitates the usage of statistical techniques for determining reasonable design allowables for composites. The analyses and design allowable generation for both A and B basis values were performed using the procedure detailed in section 5.3 of FAA Document DOT/FAA/AR-00/47: Material Qualification and Equivalency for Polymer Matrix Composite Material Systems.
1.5.6 Material Performance Envelope and Interpolation Using the B-basis numbers, a material performance envelope may be generated for the material system by plotting these values as a function of temperature. Figure 1.5.1 shows an example material performance envelope using B-basis values.
gnormalizin
specimen
CPTCPT
ValueTestValueNormalized ��
pliesofThicknessSampleAverageCPTspecimen #
�

14
-100 -50 0 50 100 150 200Temperature (o F)
20
40
60
80
100
120
B-B
asis
Str
engt
h Va
lues
(ksi
)
Actual Basis ValueEstimated Value
CTDRTD
ETD
ETW
RTW
MaterialPerformanceEnvelope
Figure 1.5.1 Material performance envelope. Since each specific aircraft application of the qualified material may have different Material Operational Limits (MOL) than those tested in the material qualification (which is usually the upper limit), some applications may require a reduced MOL. In this case, simple linear interpolation may be used to obtain the corresponding basis values at the new application MOL. This interpolation may be accomplished using the following simple relationships assuming TRTD < TMOL < TETD : For the corresponding MOL “dry” basis value, the “interpolated” basis value using the qualification data is
� � � �
� �ETDRTD
MOLRTDETDRTDRTDMOL TT
TTBBBB�
��
��
where BMOL = new application basis value interpolated to TMOL

15
BRTD = basis RTD strength value BETD = basis ETD strength value TRTD = RTD test temperature
TETD = ETD test temperature TMOL = new application MOL temperature
For the corresponding MOL “wet” basis value, an estimated Room Temperature Wet (RTW) value must be calculated. This may be accomplished by the simple relation
)( ETWETDRTDRTW BBBB ��� The “interpolated” wet basis value using the qualification data may then be obtained by
� �� �� �ETWRTW
MOLRTWETWRTWRTWMOL TT
TTBBBB�
��
��
where: BMOL = new application basis value interpolated to TMOL BRTW = estimated basis RTW strength value BETW = basis ETW strength value TRTW = RTW (i.e., RTD) test temperature
TETW = ETW test temperature TMOL = new application MOL temperature
These equations may also be used for interpolated mean strengths as well as A-basis values with the appropriate substitutions. It should be noted that because unforeseen material property drop-offs with respect to temperature and environment can occur, extrapolation to a higher MOL should not be attempted without additional testing and verification. In addition, the interpolation equations shown above are practical for materials obeying typical mechanical behavior. In most cases, some minimal amount of testing may also be required to verify the interpolated values.
1.5.6.1 Interpolation Example This section provides an example of linear interpolations to a specific application environment less than the tested upper material limit used in qualification. Assuming a specific application environment of 150o F, Figure 1.5.2 depicts the linear interpolation of the B-basis design allowable to this environment. Using the above equations along with the nominal testing temperatures (see Table 1.5.1), the interpolated basis values at 150o F become

16
ETD : BMOL = 75.106 ksi ETW : BMOL = 59.746 ksi
-100 -50 0 50 100 150 200Temperature (o F)
20
40
60
80
100
120
B-B
asis
Str
engt
h Va
lues
(ksi
)
Actual Basis ValueEstimated Value
CTD
RTD
ETD
ETW
RTW
Figure 1.5.2 Example of 150o F interpolation for B-basis values.

17
2.0 FIBERITE T650 3K-70-PW / 7740 PREPREG PROPERTIES

18
2.1 Prepreg Documentation by Prepreg Lot
Prepreg Documentation Prepreg Manufacturer & Product ID: HMF 7740/T650-35-3K-PW-195-42” Impregnation Method: SOLVENT
Prepreg Batch or Lot # 310604 310605 310606 Batch (Lot) ID as labeled on samples 1 2 3 Date of Manufacture 11-13-97 11-13-97 11-13-97 Expiration Date 11-13-98 11-13-98 11-13-98 Resin Content [%] 39% 38 % 38 % Reinforcement Areal Weight & Test Method 194 g/sq m 195 g/sq m 192 g/sq m Resin Flow & Test Conditions 20% @ 100 psi 19% @ 100 psi 20% @ 100 psi Gel Time & Test Conditions 3 min @ 177 C 3 min @ 177 C 3 min @ 177 C Volatile Content 0.5 0.6 0.9
Reinforcement Documentation Fiber/Fabric Manufacturer & Product ID: T650/35 3K 309NT Precursor Type: PAN Nominal Filament Count: 3K Finish/Sizing Type and %: UC309, .93—.97% Nominal tow or yarn count/inch: Twist: not available
Fabric Batch or Lot # B3S0803 B3S0803 B3S0602
Sizing weight, % .97 % .97 % .93%
Date of Manufacture 8-27-97 8-27-97 8-27-97
Average Fiber Density per Lot & Test Method 1.778 g/cc 1.778 g/cc 1.772 g/cc
Matrix Documentation Resin Manufacturer & Product ID: Matrix Batch or Lot # 310604 310605 310606 Date of Manufacture 11-5-97 11-5-97 11-5-97 Average Neat Resin Density by Lot & Test Method 1.27 g/ccm 1.27 g/ccm 1.27 g/ccm

19
2.2 Process Specification This specification does not address issues relating to safety, quality control, bagging material selection, bagging procedure, tool preparation, or equipment selection. Although these may affect overall part quality, it is the responsibility of the end user to develop procedures related to these issues in a manner that produces parts with high quality and consistency. The following autoclave cure procedures are excerpts from Cessna process specification CSAC005. The exception to this specification is the cure cycle and ply orientation tolerance. The cure cycle for panel fabrication is 250°F, ±10°: for 120 minutes, +60, -0; 45 psi, ±5. Individual ply orientation is ±2° with respect to the tooled reference edge. The detailed cure cycle procedure is given below. All test specimens were cured per this specification by Cessna Aircraft Company. However, the effects of the upper and lower limits of vacuum, temperature, cure time, heat-up rate and hold temperature on the mechanical and thermal properties have not been investigated.
(1) Apply 22 in-Hg of vacuum minimum to vacuum bag. Initiate autoclave pressure 3
psi/minute minimum, vent bag at 20±10 psig. Final vessel pressure 45±5 psi. (2) From 230°F to 240°F, a minimum heat up rate of 0.3°F/minute is acceptable. (3) All thermocouples shall be at temperature

20
3.0 FIBERITE T650 3K-70-PW / 7740 LAMINATE PROPERTIES

21
3.1 Test Results

22
3.1.1 Summary
MMMAAATTTEEERRRIIIAAALLL::: FFFiiibbbeeerrriiittteee 777777444000///TTT666555000 333KKK---777000---PPPWWW GGGrrraaappphhhiiittteee 777777444000///TTT666555000 333KKK---777000---PPPWWW
PPPRRREEEPPPRRREEEGGG::: FFFiiibbbeeerrriiittteee HHHMMMFFF 777777444000///TTT666555000---333555---333KKK---PPPWWW---111999555---444222””” SSSuuummmmmmaaarrryyy
FFFIIIBBBEEERRR::: AAAmmmooocccooo TTT666555000///333555 333KKK 333000999NNNTTT RRREEESSSIIINNN::: FFFiiibbbeeerrriiittteee HHHMMMFFF 777777444000
TTTggg (((dddrrryyy)))::: 222444444...444444 ���FFF TTTggg (((wwweeettt)))::: 222000555...666999 ���FFF TTTggg MMMEEETTTHHHOOODDD::: DDDMMMAAA (((SSSRRRMMM 111888---999444)))
PPPRRROOOCCCEEESSSSSSIIINNNGGG::: AAAuuutttoooccclllaaavvveee cccuuurrreee::: 222555000���111000���FFF fffooorrr 111222000���666000,,,���000 mmmiiinnn... @@@ 444555���555 pppsssiii
DDDaaattteee ooofff fffiiibbbeeerrr mmmaaannnuuufffaaaccctttuuurrreee 888///222777///999777 DDDaaattteee ooofff ttteeessstttiiinnnggg 111///222666///999999 --- 444///111444///999999 DDDaaattteee ooofff rrreeesssiiinnn mmmaaannnuuufffaaaccctttuuurrreee 111111///555///999777 DDDaaattteee ooofff dddaaatttaaa sssuuubbbmmmiiittttttaaalll 888///999999 DDDaaattteee ooofff ppprrreeeppprrreeeggg mmmaaannnuuufffaaaccctttuuurrreee 111111///111333///999777 Date of analysis 1/27/99 - 4/14/99 DDDaaattteee ooofff cccooommmpppooosssiiittteee mmmaaannnuuufffaaaccctttuuurrreee 333///111999///999888 ––– 444///111666///999888
LLLAAAMMMIIINNNAAA MMMEEECCCHHHAAANNNIIICCCAAALLL PPPRRROOOPPPEEERRRTTTYYY SSSUUUMMMMMMAAARRRYYY
DDDaaatttaaa RRReeepppooorrrttteeeddd aaasss::: MMMeeeaaasssuuurrreeeddd (((NNNooorrrmmmaaallliiizzzeeeddd bbbyyy CCCPPPTTT===000...000000777999 iiinnn)))
CCCTTTDDD RRRTTTDDD EEETTTDDD EEETTTWWW
BBB---BBBaaasssiiisss MMMeeeaaannn BBB---BBBaaasssiiisss MMMeeeaaannn BBB---BBBaaasssiiisss MMMeeeaaannn BBB---BBBaaasssiiisss MMMeeeaaannn
FFF111tttuuu (((kkksssiii))) 111111777...333000
(((111111666...222000))) 111222666...777999
(((111222666...333333))) 111111777...777777
(((111111777...000444))) 111222555...888888
(((111222555...777111))) 111222000...999999
(((111222000...000777))) 111222999...333777
(((111222999...000111))) 111111666...777222
(((111111666...444444))) 111222444...444111
(((111222444...666999)))
EEE111ttt (((MMMsssiii))) --------- 999...444999
(((999...444222))) --------- 999...777555
(((999...666999))) --------- 888...999222
(((888...999111))) --------- 999...999666
(((999...888777)))
���111222tttuuu --------- 000...000333444 --------- 000...000444555 --------- 000...000333333 --------- 000...000333999
FFF222tttuuu (((kkksssiii))) 111000555...111000
(((111000666...777333))) 111111777...666444
(((111111999...444444))) 111000888...111555
(((111000888...444222))) 111111999...111333
(((111111999...444111))) 111000444...222222
(((111000444...999666))) 111111444...888111
(((111111555...666000))) 111000222...777000
(((111000333...222333))) 111111222...666222
(((111111333...111777)))
EEE222ttt (((MMMsssiii))) --------- 111000...333111
(((111000...444999))) --------- 999...888444
(((999...777777))) --------- 888...666999
(((888...777777))) --------- 999...666777
(((999...666666)))
FFF111cccuuu (((kkksssiii))) 999555...000222
(((999111...555999))) 111111111...111777
(((111000888...555222))) 999111...777222
(((999000...111999))) 111000444...999000
(((111000444...222777))) 777333...222222
(((777111...999111))) 888333...777555
(((888333...111333))) 555222...222555
(((555111...666222))) 555999...333888
(((555999...222666)))
EEE111ccc (((MMMsssiii))) --------- 888...777222
(((888...888000))) --------- 999...222999
(((999...111444))) --------- 999...555999
(((999...444666))) --------- 999...666444
(((999...444777)))
FFF222cccuuu (((kkksssiii))) 999444...111666
(((999222...777666))) 111000888...444111
(((111000777...888777))) 888555...888555
(((888444...666666))) 999666...888777
(((999666...333333))) 666999...222999
(((666777...666555))) 777888...111888
(((777666...999888))) 555222...444777
(((555111...888222))) 555888...999000
(((555888...666555)))
EEE222ccc (((MMMsssiii))) --------- 999...222777
(((999...333111))) --------- 888...999444
(((888...888555))) --------- 999...222000
(((999...111444))) --------- 999...555888
(((999...444444)))
FFF111222sssuuu (((kkksssiii))) 222222...333888 222444...000888 111777...777222 111888...888222 111333...333222 111444...111444 111000...222222 111000...888666
GGG111222sss (((MMMsssiii))) --------- 000...777111 --------- 000...666777 --------- 000...444666 --------- 000...444333
FFF111333sssuuu****** (((kkksssiii))) --------- --------- 999...999999 111000...666888 --------- --------- --------- ---------
****** AAAppppppaaarrreeennnttt iiinnnttteeerrrlllaaammmiiinnnaaarrr ssshhheeeaaarrr ssstttrrreeennngggttthhh

23
3.1.2 Individual Test Summaries

24
3.1.2.1 Tension, 1-axis Material: Fiberite 7740/T650 3K-70-PW Graphite
Resin content: 33 - 39 wt% Comp. density: 1.51 - 1.54 g/ccFiber volume: 52 - 58 vol% Void content: 1.8 to 2.4 %Ply thickness: 0.0073 - 0.0082 in.Ply range: 14 plies
Test method: D3039-95 Modulus calculation: linear fit from 1000 - 3000 ��
Normalized by: 0.0079 in. ply thickness
Test Temperature [°F] -65 75 180Moisture Conditioning dry dry dryEquilibrium at T, RH as fabricated as fabricated as fabricatedSource code
Normalized Measured Normalized Measured Normalized Measured Normalized Measured Normalized Measured
Mean 126.33 126.79 125.71 125.88 129.01 129.37 124.69 124.41Minimum 113.70 117.87 116.03 119.01 123.15 121.96 113.04 112.64Maximum 136.35 136.76 135.59 133.91 134.55 135.62 132.14 132.16C.V.(%) 6.52 5.23 3.92 3.18 2.49 2.77 4.34 4.34
F1tu
(ksi) B-value 116.20 117.30 117.04 117.77 120.07 120.99 116.44 116.72A-value 110.58 112.03 111.30 112.40 114.18 115.48 110.68 111.36
No. Specimens 6 19 18No. Prepreg Lots 1 3 3
Mean 9.42 9.49 9.69 9.75 8.91 8.92 9.87 9.96Minimum 9.14 8.94 9.36 9.28 8.19 8.17 9.33 9.34Maximum 9.70 10.04 10.01 10.62 9.56 9.82 10.41 10.56
E1t C.V.(%) 4.22 8.19 2.43 5.08 5.29 6.34 4.07 4.66
(Msi)No. Specimens 2 6 6No. Prepreg Lots 1 3 3
Mean 0.034 0.045 0.033 0.039�12
t No. Specimens 2 6 6No. Prepreg Lots 1 3 3 3
3
63
6
18062 days, .64-.71% wt gain
145 F, 85 %
30
BCJXXXXB BCJXXXXA BCJXXXXG BCJXXXXF
CTD (B) RTD (A) ETD (G) ETW (F)
Tension, 1-axisG/Ep
Fiberite 7740/T650 3K-70-PW Graphite[0]14

25
3.1.2.2 Tension, 2-axis Material: Fiberite 7740/T650 3K-70-PW Graphite
Resin content: 32 - 40 wt% Comp. density: 1.50 - 1.55 g/ccFiber volume: 52 - 58 vol% Void content: 0.2 to 3.9 %Ply thickness: 0.0073 - 0.0083 in.Ply range: 14 plies
Test method: D3039-95 Modulus calculation: linear fit from 1000 - 3000 ��
Normalized by: 0.0079 in. ply thickness
Test Temperature [°F] -65 75 180Moisture Conditioning dry dry dryEquilibrium at T, RH as fabricated as fabricated as fabricatedSource code
Normalized Measured Normalized Measured Normalized Measured Normalized Measured Normalized Measured
Mean 119.44 117.64 119.41 119.13 115.60 114.81 113.17 112.62Minimum 112.37 112.68 107.28 107.81 104.80 104.41 99.84 100.85Maximum 125.85 122.25 128.86 133.86 127.80 122.54 125.45 125.19C.V.(%) 4.49 3.27 5.51 6.01 5.51 4.69 5.40 5.70
F2tu
(ksi) B-value 106.73 105.10 108.42 108.15 104.96 104.22 103.23 102.70A-value 99.67 98.13 101.19 100.91 97.96 97.25 96.29 95.78
No. Specimens 6 18 18No. Prepreg Lots 1 3 3
Mean 10.49 10.31 9.77 9.84 8.77 8.69 9.66 9.67Minimum 10.47 10.23 9.31 9.36 8.58 8.23 9.45 9.37Maximum 10.50 10.40 10.13 10.59 8.95 9.00 9.97 10.45
E2t C.V.(%) 0.19 1.17 2.88 4.29 1.69 3.04 1.83 4.24
(Msi)No. Specimens 2 6 6No. Prepreg Lots 1 3 3
3
63
18062 days, .63-.74% wt gain
145 F, 85 %
30
CTD (B) RTD (A) ETD (G) ETW (F)
BCUXXXXB BCUXXXXA BCUXXXXG BCUXXXXF
Tension, 2-axisG/Ep
Fiberite 7740/T650 3K-70-PW Graphite[0]14
26
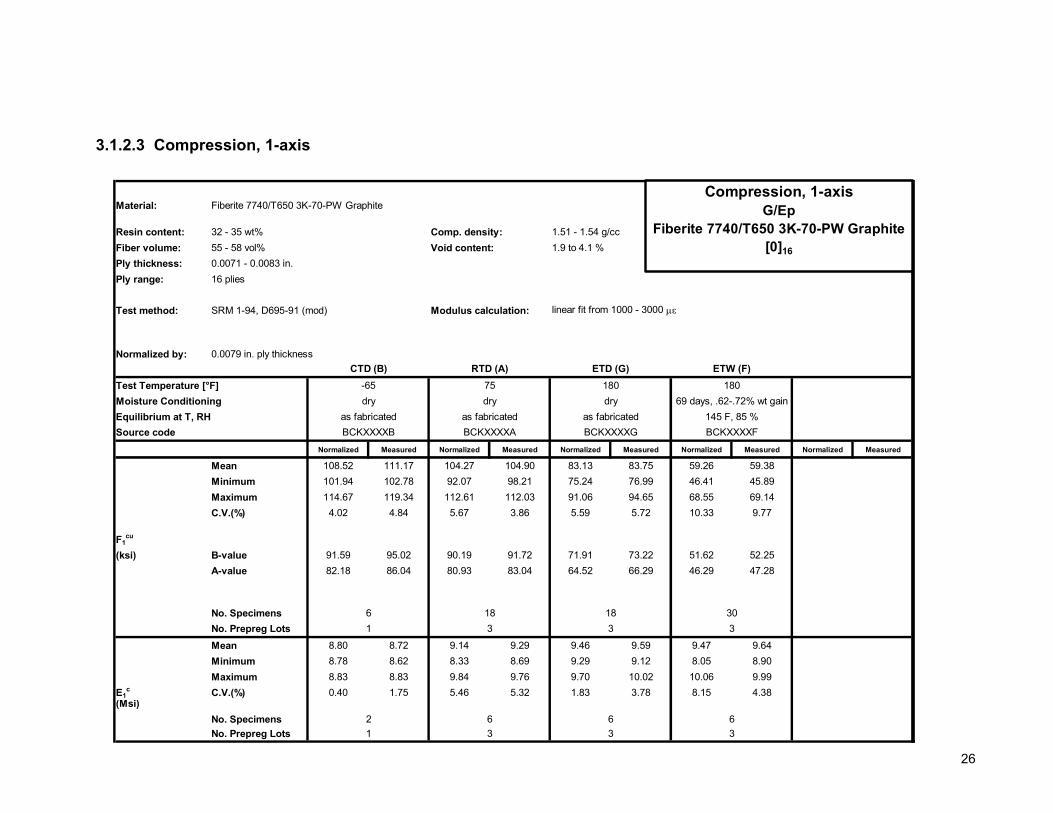
3.1.2.3 Compression, 1-axis
Material: Fiberite 7740/T650 3K-70-PW Graphite
Resin content: 32 - 35 wt% Comp. density: 1.51 - 1.54 g/ccFiber volume: 55 - 58 vol% Void content: 1.9 to 4.1 %Ply thickness: 0.0071 - 0.0083 in.Ply range: 16 plies
Test method: SRM 1-94, D695-91 (mod) Modulus calculation: linear fit from 1000 - 3000 ��
Normalized by: 0.0079 in. ply thickness
Test Temperature [°F] -65 75 180Moisture Conditioning dry dry dryEquilibrium at T, RH as fabricated as fabricated as fabricatedSource code
Normalized Measured Normalized Measured Normalized Measured Normalized Measured Normalized Measured
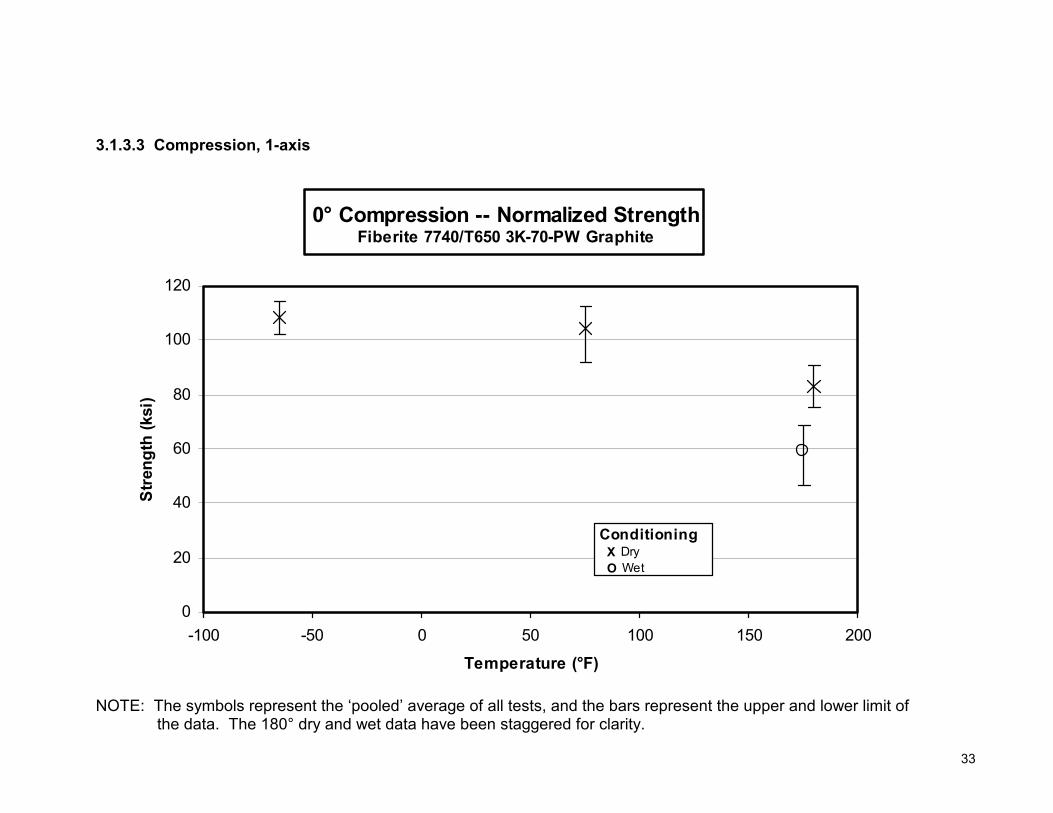
Mean 108.52 111.17 104.27 104.90 83.13 83.75 59.26 59.38Minimum 101.94 102.78 92.07 98.21 75.24 76.99 46.41 45.89Maximum 114.67 119.34 112.61 112.03 91.06 94.65 68.55 69.14C.V.(%) 4.02 4.84 5.67 3.86 5.59 5.72 10.33 9.77
F1cu
(ksi) B-value 91.59 95.02 90.19 91.72 71.91 73.22 51.62 52.25A-value 82.18 86.04 80.93 83.04 64.52 66.29 46.29 47.28
No. Specimens 6 18 18No. Prepreg Lots 1 3 3
Mean 8.80 8.72 9.14 9.29 9.46 9.59 9.47 9.64Minimum 8.78 8.62 8.33 8.69 9.29 9.12 8.05 8.90Maximum 8.83 8.83 9.84 9.76 9.70 10.02 10.06 9.99
E1c C.V.(%) 0.40 1.75 5.46 5.32 1.83 3.78 8.15 4.38
(Msi)No. Specimens 2 6 6No. Prepreg Lots 1 3 3
3
63
18069 days, .62-.72% wt gain
145 F, 85 %
30
BCKXXXXB BCKXXXXA BCKXXXXG BCKXXXXF
CTD (B) RTD (A) ETD (G) ETW (F)
Compression, 1-axisG/Ep
Fiberite 7740/T650 3K-70-PW Graphite[0]16
27
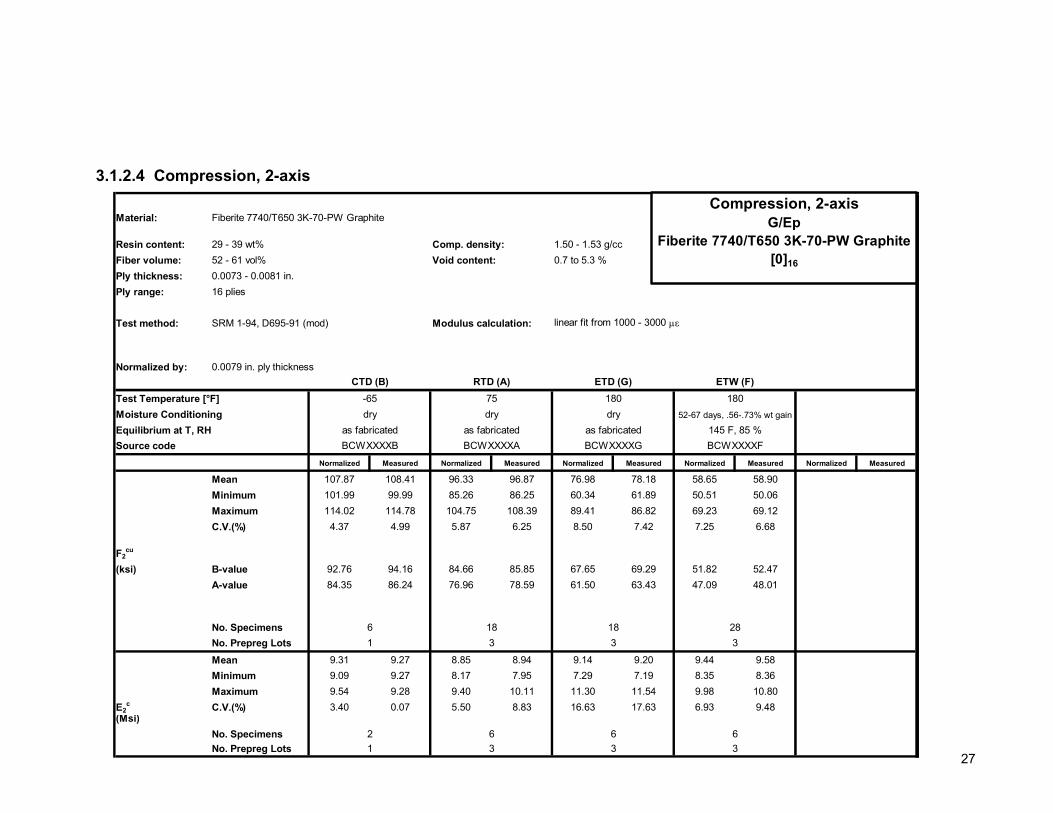
3.1.2.4 Compression, 2-axis
Material: Fiberite 7740/T650 3K-70-PW Graphite
Resin content: 29 - 39 wt% Comp. density: 1.50 - 1.53 g/ccFiber volume: 52 - 61 vol% Void content: 0.7 to 5.3 %Ply thickness: 0.0073 - 0.0081 in.Ply range: 16 plies
Test method: SRM 1-94, D695-91 (mod) Modulus calculation: linear fit from 1000 - 3000 ��
Normalized by: 0.0079 in. ply thickness
Test Temperature [°F] -65 75 180Moisture Conditioning dry dry dryEquilibrium at T, RH as fabricated as fabricated as fabricatedSource code
Normalized Measured Normalized Measured Normalized Measured Normalized Measured Normalized Measured
Mean 107.87 108.41 96.33 96.87 76.98 78.18 58.65 58.90Minimum 101.99 99.99 85.26 86.25 60.34 61.89 50.51 50.06Maximum 114.02 114.78 104.75 108.39 89.41 86.82 69.23 69.12C.V.(%) 4.37 4.99 5.87 6.25 8.50 7.42 7.25 6.68
F2cu
(ksi) B-value 92.76 94.16 84.66 85.85 67.65 69.29 51.82 52.47A-value 84.35 86.24 76.96 78.59 61.50 63.43 47.09 48.01
No. Specimens 6 18 18No. Prepreg Lots 1 3 3
Mean 9.31 9.27 8.85 8.94 9.14 9.20 9.44 9.58Minimum 9.09 9.27 8.17 7.95 7.29 7.19 8.35 8.36Maximum 9.54 9.28 9.40 10.11 11.30 11.54 9.98 10.80
E2c C.V.(%) 3.40 0.07 5.50 8.83 16.63 17.63 6.93 9.48
(Msi)No. Specimens 2 6 6No. Prepreg Lots 1 3 3
3
63
18052-67 days, .56-.73% wt gain
145 F, 85 %
28
CTD (B) RTD (A) ETD (G) ETW (F)
BCWXXXXB BCWXXXXA BCWXXXXG BCWXXXXF
Compression, 2-axisG/Ep
Fiberite 7740/T650 3K-70-PW Graphite[0]16

28
3.1.2.5 Shear, 12 axis
Material: Fiberite 7740/T650 3K-70-PW Graphite
Resin content: 35 - 38 wt% Comp. density: 1.50 - 1.54 g/ccFiber volume: 53 - 55 vol% Void content: 0.8 to 3.5 %Ply thickness: 0.0075 - 0.0083 in.Ply range: 18 plies
Test method: D5379-93 Modulus calculation: linear fit from 1000 - 6000 ��
Normalized by: N/A
Test Temperature [°F] -65 75 180Moisture Conditioning dry dry dryEquilibrium at T, RH as fabricated as fabricated as fabricatedSource code
Normalized Measured Normalized Measured Normalized Measured Normalized Measured Normalized Measured
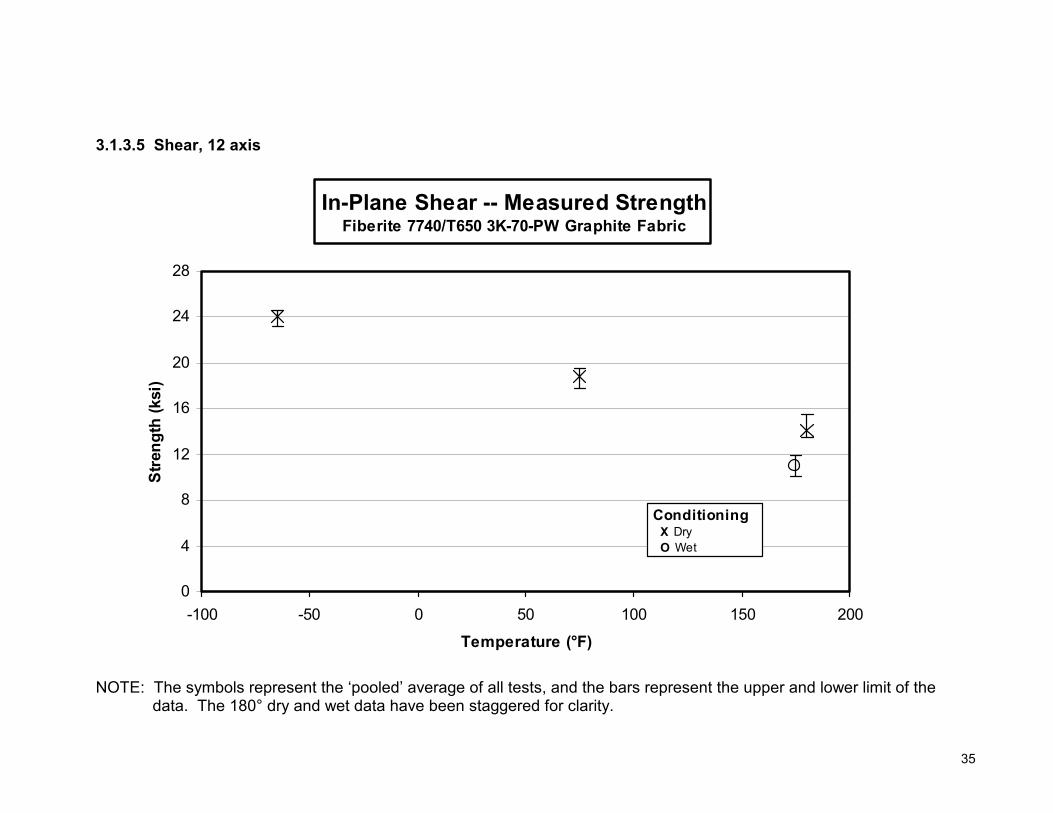
Mean 24.08 18.82 14.14 10.86Minimum 23.19 17.71 13.49 10.04Maximum 24.54 19.53 15.46 11.87C.V.(%) 2.23 2.18 3.35 5.07
F12su
(ksi) B-value 22.38 17.72 13.32 10.22A-value 21.44 16.96 12.75 9.78
No. Specimens 6 28 27No. Prepreg Lots 1 3 3
Mean 0.71 0.67 0.46 0.43Minimum 0.63 0.62 0.37 0.41Maximum 0.80 0.71 0.60 0.46
G12s C.V.(%) 16.79 6.05 18.08 4.96
(Msi)No. Specimens 2 6 7No. Prepreg Lots 1 3 3
3
63
18070 days, .63-.70% wt gain
145 F, 85 %
24
BCNXXXXF
CTD (B) RTD (A) ETD (G) ETW (F)
BCNXXXXB BCNXXXXA BCNXXXXG
Shear, 12-axisG/Ep
Fiberite 7740/T650 3K-70-PW Graphite[(0/90)4/0]S

29
3.1.2.6 Shear, 13 axis NOTES: These values represent the apparent interlaminar shear properties and are to be used for quality control purposes only. Do not use these values for interlaminar shear strength design values.
Material: Fiberite 7740/T650 3K-70-PW Graphite
Resin content: 32 - 39 wt% Comp. density: 1.51 - 1.55 g/ccFiber volume: 52 - 59 vol% Void content: 1.6 to 3.1 %Ply thickness: 0.0072 - 0.0081 in.Ply range: 14 plies
Test method: D2344-89 Modulus calculation: N/A
Normalized by: N/A
Test Temperature [°F]Moisture ConditioningEquilibrium at T, RHSource code
Normalized Measured Normalized Measured Normalized Measured Normalized Measured Normalized Measured
Mean 10.68Minimum 10.16Maximum 11.24C.V.(%) 3.24
F13su
(ksi) B-value 9.99A-value 9.50
No. SpecimensNo. Prepreg Lots
183
75dry
as fabricatedBCQXXXXA
CTD (B) RTD (A) ETD (G) ETW (F)
Shear, 13-axisG/Ep
Fiberite 7740/T650 3K-70-PW Graphite[0]14

30
3.1.3 Individual Test Charts
31
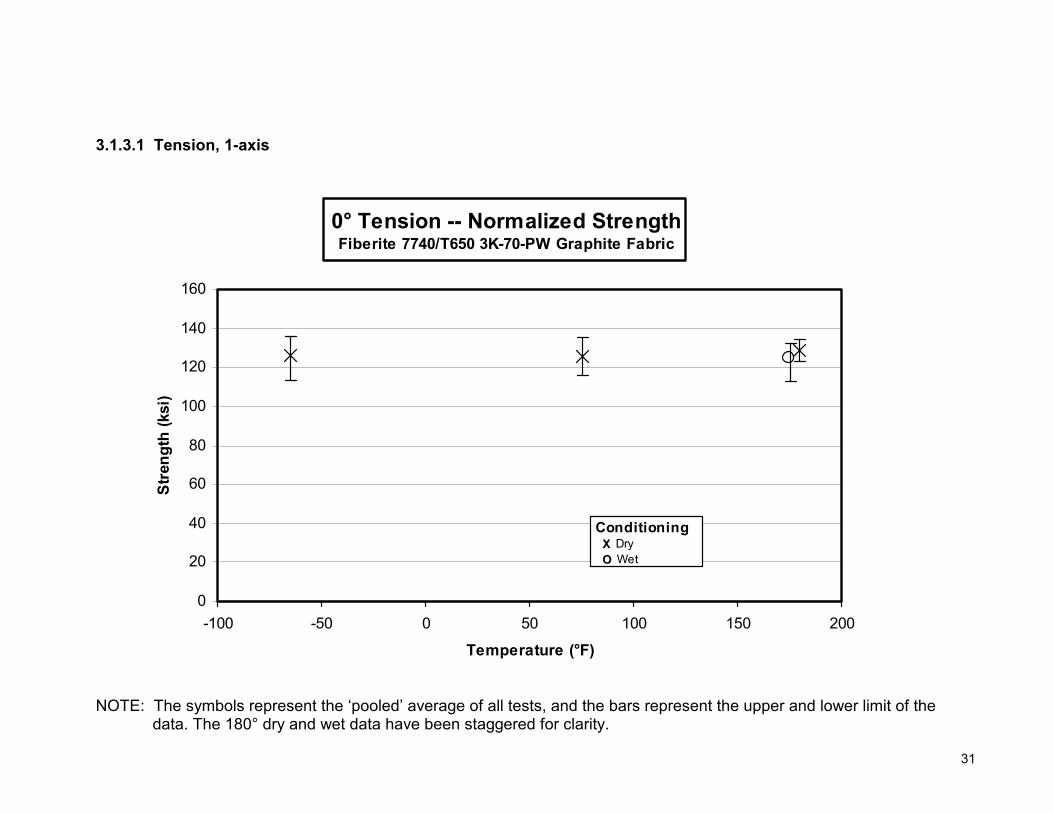
3.1.3.1 Tension, 1-axis NOTE: The symbols represent the ‘pooled’ average of all tests, and the bars represent the upper and lower limit of the data. The 180° dry and wet data have been staggered for clarity.
0° Tension -- Normalized StrengthFiberite 7740/T650 3K-70-PW Graphite Fabric
0
20
40
60
80
100
120
140
160
-100 -50 0 50 100 150 200
Temperature (°F)
Stre
ngth
(ksi
)
Conditioning X Dry O Wet

32
3.1.3.2 Tension, 2-axis
NOTE: The symbols represent the ‘pooled’ average of all tests, and the bars represent the upper and lower limit of the data. The 180° dry and wet data have been staggered for clarity.
90° Tension -- Normalized StrengthFiberite 7740/T650 3K-70-PW Graphite Fabric
0
20
40
60
80
100
120
140
160
-100 -50 0 50 100 150 200
Temperature (°F)
Stre
ngth
(ksi
)
Conditioning X Dry O Wet
33
3.1.3.3 Compression, 1-axis NOTE: The symbols represent the ‘pooled’ average of all tests, and the bars represent the upper and lower limit of the data. The 180° dry and wet data have been staggered for clarity.
0° Compression -- Normalized StrengthFiberite 7740/T650 3K-70-PW Graphite
0
20
40
60
80
100
120
-100 -50 0 50 100 150 200
Temperature (°F)
Stre
ngth
(ksi
)
Conditioning X Dry O Wet

34
3.1.3.4 Compression, 2-axis NOTE: The symbols represent the ‘pooled’ average of all tests, and the bars represent the upper and lower limit of the data. The 180° dry and wet data have been staggered for clarity.
90° Compression -- Normalized StrengthFiberite 7740/T650 3K-70-PW Graphite
0
20
40
60
80
100
120
-100 -50 0 50 100 150 200
Temperature (°F)
Stre
ngth
(ksi
)
Conditioning X Dry O Wet
35
3.1.3.5 Shear, 12 axis NOTE: The symbols represent the ‘pooled’ average of all tests, and the bars represent the upper and lower limit of the data. The 180° dry and wet data have been staggered for clarity.
In-Plane Shear -- Measured StrengthFiberite 7740/T650 3K-70-PW Graphite Fabric
0
4
8
12
16
20
24
28
-100 -50 0 50 100 150 200
Temperature (°F)
Stre
ngth
(ksi
)
Conditioning X Dry O Wet

36
3.1.3.6 Shear, 13 axis NOTE: The symbols represent the ‘pooled’ average of all tests, and the bars represent the upper and lower limit of the data.
Apparent Interlaminar Shear -- Measured Strength Fiberite 7740/T650 3K-70-PW Graphite Fabric
0
4
8
12
16
-100 -50 0 50 100 150 200
Temperature (°F)
Stre
ngth
(ksi
)
Conditioning X Dry O Wet

37
3.2 Raw Data
Specimen Naming Convention
Test coupons were identified using an eight-digit specimen code, with the significance of each digit delineated below. A representative sample ID is shown for reference purposes.
B C J 2 1 2 5 F
1st Character: Fabricator ‘B’ designates Cessna
2nd Character: Material System ‘C’ designates T650 3K-70-PW / 7740
3rd Character: Test Type ‘J’ designates 0° Tension Strength and Modulus, other test types will be clearly labeled at the top of each sheet
4th Character: Prepreg Batch ID See Table 2.1 for Fiberite Batch ID / Sample Batch ID correlation.
5th Character: Panel Number The panel(s) fabricated for a specific test method.
6th Character: Subpanel Number The sub-panel(s) cut from each panel, with subpanel numbers labeled increasing from reference edge.
7th Character: Sample Number The sample(s) cut from each subpanel, with sample numbers labeled increasing from reference edge.
8th Character: Test Condition ‘A’ --- RTD ‘B’ --- CTD ‘F’ --- ETW ‘G’ --- ETD See Table 1.5.1 for condition parameters.

38
3.2.1 Raw Data Spreadsheets and Scatter Charts

39
normalizing tply[in]
0.0079
Specimen Cure Prepreg ASAP Strength Modulus Poisson's Avg. Specimen # Plies in Avg. tply Strengthnorm ModulusnormNumber Cycle Lot # Batch # [ksi] [Msi] Ratio Thickn. [in] Laminate [in] [ksi] [Msi]
BCJ12X1A 1 1 1 129.543 10.618 0.044 0.104 14 0.00745 122.164 10.013BCJ12X2A 1 1 1 125.589 0.107 14 0.00761 120.952BCJ12X3A 1 1 1 120.994 0.106 14 0.00758 116.035BCJ14X1A 2 1 2 126.619 9.295 0.046 0.113 14 0.00808 129.539 9.509BCJ14X2A 2 1 2 127.762 0.113 14 0.00807 130.458BCJ14X3A 2 1 2 129.576 0.114 14 0.00812 133.208BCJ21X1A 1 2 3 128.994 9.918 0.049 0.108 14 0.00769 125.592 9.657BCJ21X2A 1 2 3 123.772 0.111 14 0.00791 123.922BCJ21X3A 1 2 3 119.768 0.111 14 0.00790 119.750BCJ23X6A 2 2 4 123.002 9.282 0.042 0.112 14 0.00797 124.040 9.361BCJ23X7A 2 2 4 130.173 0.111 14 0.00790 130.134BCJ23X8A 2 2 4 127.717 0.109 14 0.00777 125.619BCJ31X6A 1 3 5 129.053 9.769 0.051 0.111 14 0.00795 129.811 9.827BCJ31X7A 1 3 5 123.179 0.111 14 0.00794 123.791BCJ31X8A 1 3 5 119.007 0.112 14 0.00799 120.406BCJ33X2A 2 3 6 126.983 0.111 14 0.00794 127.557BCJ33X3A 2 3 6 124.450 0.112 14 0.00799 125.912BCJ33X4A 2 3 6 133.913 0.112 14 0.00800 135.588BCJ33X6A 2 3 6 121.541 9.608 0.037 0.113 14 0.00806 123.959 9.799
Average 125.876 9.748 0.045 Averagenorm 0.00789 125.707 9.694Standard Dev. 3.999 0.496 0.005 Standard Dev.norm 4.922 0.235
Coeff. of Var. [%] 3.177 5.084 11.320 Coeff. of Var. [%]norm 3.915 2.429Min. 119.007 9.282 0.037 Min. 0.0075 116.035 9.361Max. 133.913 10.618 0.051 Max. 0.0081 135.588 10.013
Number of Spec. 19 6 6 Number of Spec. 19 6
0° Tension-- (RTD)Strength & Modulus
Fiberite 7740/T650 3K-70-PW Graphite

40
0
1
2
3
4
5
6
0 50 100 150 200 250 300
0° Tension Strength [ksi]
ASAP
Bat
ch #
0
1
2
3
Prepeg Lot #
0° Tension Tension -- (RTD)Normalized Strength
Fiberite 7740/T650 3K-70-PW Graphite
Pooled Average = 125.707 [ksi]Pooled Standard Deviation = 4.922 [ksi]Pooled Coeff. of Variation = 3.915 [%]
0
1
2
3
4
5
6
0.0 2.0 4.0 6.0 8.0 10.0 12.0 14.0 16.0 18.0 20.0
0° Tension Modulus [Msi]
ASAP
Bat
ch #
0
1
2
3
Prepreg Lot #
0° Tension -- (RTD)Normalized Modulus
Fiberite 7740/T650 3K-70-PW Graphite
Pooled Average = 9.694 [Msi]Pooled Standard Deviation = 0.235 [Msi]Pooled Coeff. of Variation = 2.429 [%]

41
normalizing tply[in]
0.0079
Specimen Cure Prepreg ASAP Strength Modulus Poisson's Avg. Specimen # Plies in Avg. tply Strengthnorm ModulusnormNumber Cycle Lot # Batch # [ksi] [Msi] Ratio Thickn. [in] Laminate [in] [ksi] [Msi]
BCJ12X5B 1 1 1 117.869 0.107 14 0.00762 113.695BCJ12X6B 1 1 1 124.511 0.107 14 0.00762 120.102BCJ12X7B 1 1 1 136.763 10.040 0.036 0.107 14 0.00763 132.146 9.701BCJ14X5B 2 1 2 131.973 0.114 14 0.00816 136.348BCJ14X6B 2 1 2 125.435 0.114 14 0.00811 128.724BCJ14X7B 2 1 2 124.202 8.941 0.032 0.113 14 0.00808 126.953 9.139
Average 126.792 9.491 0.034 Averagenorm 0.00787 126.328 9.420Standard Dev. 6.628 0.777 0.003 Standard Dev.norm 8.231 0.397
Coeff. of Var. [%] 5.227 8.185 7.661 Coeff. of Var. [%]norm 6.516 4.216Min. 117.869 8.941 0.032 Min. 0.0076 113.695 9.139Max. 136.763 10.040 0.036 Max. 0.0082 136.348 9.701
Number of Spec. 6 2 2 Number of Spec. 6 2
0° Tension -- (CTD)Strength & Modulus
Fiberite 7740/T650 3K-70-PW Graphite
42
0
1
2
3
4
5
6
0 50 100 150 200 250 300
0° Tension Strength [ksi]
ASAP
Bat
ch #
0
1
2
3
Prepeg Lot #
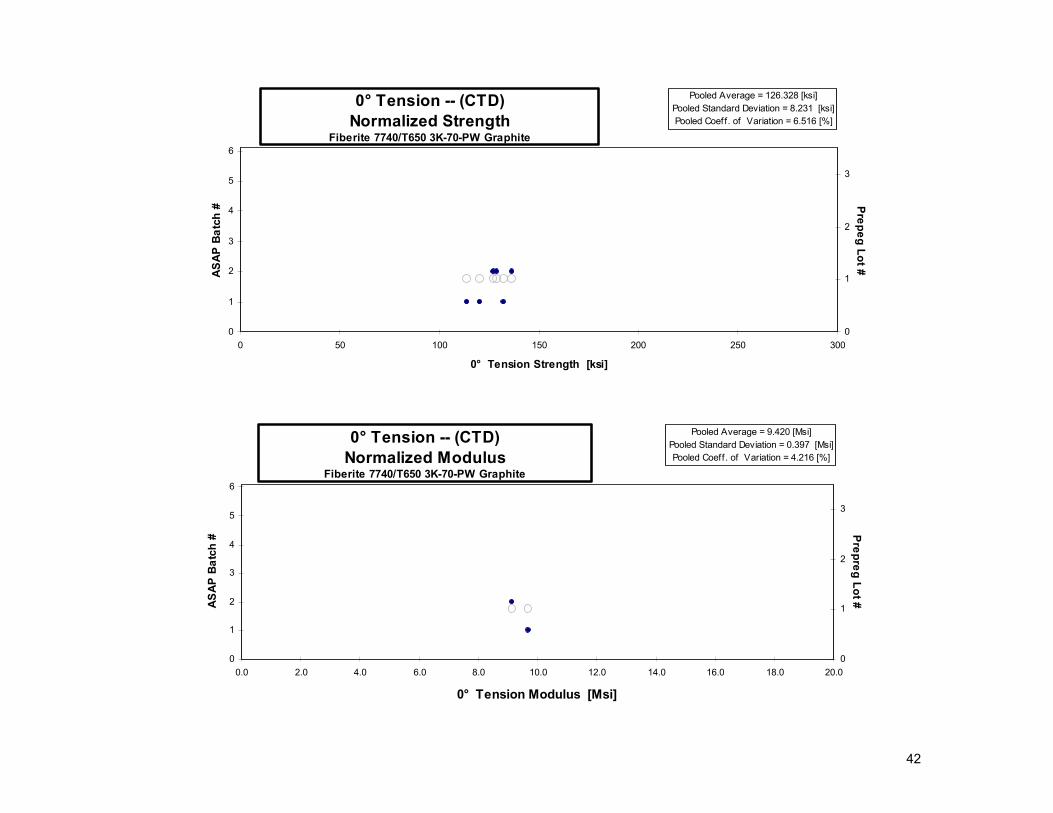
0° Tension -- (CTD)Normalized Strength
Fiberite 7740/T650 3K-70-PW Graphite
Pooled Average = 126.328 [ksi]Pooled Standard Deviation = 8.231 [ksi]Pooled Coeff. of Variation = 6.516 [%]
0
1
2
3
4
5
6
0.0 2.0 4.0 6.0 8.0 10.0 12.0 14.0 16.0 18.0 20.0
0° Tension Modulus [Msi]
ASAP
Bat
ch #
0
1
2
3
Prepreg Lot #
0° Tension -- (CTD)Normalized Modulus
Fiberite 7740/T650 3K-70-PW Graphite
Pooled Average = 9.420 [Msi]Pooled Standard Deviation = 0.397 [Msi]Pooled Coeff . of Variation = 4.216 [%]

43
normalizing tply[in]
0.0079
Specimen Cure Prepreg ASAP Strength Modulus Poisson's Avg. Specimen # Plies in Avg. tply Strengthnorm ModulusnormNumber Cycle Lot # Batch # [ksi] [Msi] Ratio Thickn. [in] Laminate [in] [ksi] [Msi]
BCJ11X1F 1 1 1 130.479 10.277 0.043 0.105 14 0.00747 123.381 9.718BCJ11X2F 1 1 1 126.941 0.108 14 0.00769 123.574BCJ11X3F 1 1 1 127.160 0.108 14 0.00771 124.133BCJ11X4F 1 1 1 131.651 0.108 14 0.00773 128.735BCJ11X5F 1 1 1 128.188 0.109 14 0.00780 126.507BCJ13X1F 2 1 2 127.007 9.577 0.035 0.114 14 0.00815 131.026 9.880BCJ13X2F 2 1 2 126.307 0.115 14 0.00825 131.865BCJ13X3F 2 1 2 123.586 0.115 14 0.00818 127.963BCJ13X4F 2 1 2 119.666 0.114 14 0.00813 123.147BCJ13X5F 2 1 2 124.519 0.113 14 0.00808 127.390BCJ22X1F 1 2 3 132.159 9.336 0.029 0.110 14 0.00789 132.019 9.327BCJ22X2F 1 2 3 128.420 0.112 14 0.00801 130.239BCJ22X3F 1 2 3 125.005 0.112 14 0.00802 126.945BCJ22X4F 1 2 3 131.685 0.111 14 0.00793 132.141BCJ22X5F 1 2 3 130.874 0.110 14 0.00786 130.184BCJ23X1F 2 2 4 123.651 9.818 0.042 0.109 14 0.00776 121.489 9.646BCJ23X2F 2 2 4 115.418 0.110 14 0.00787 114.948BCJ23X3F 2 2 4 112.638 0.111 14 0.00794 113.164BCJ23X4F 2 2 4 113.372 0.111 14 0.00795 114.021BCJ23X5F 2 2 4 113.500 0.110 14 0.00787 113.038BCJ31X1F 1 3 5 129.183 10.198 0.044 0.111 14 0.00794 129.865 10.252BCJ31X2F 1 3 5 126.325 0.111 14 0.00793 126.820BCJ31X3F 1 3 5 120.629 0.113 14 0.00805 122.865BCJ31X4F 1 3 5 122.650 0.111 14 0.00795 123.390BCJ31X5F 1 3 5 125.375 0.111 14 0.00792 125.753BCJ34X1F 2 3 6 124.301 10.562 0.039 0.109 14 0.00779 122.502 10.410BCJ34X2F 2 3 6 124.216 0.111 14 0.00791 124.404BCJ34X3F 2 3 6 122.778 0.112 14 0.00800 124.351BCJ34X4F 2 3 6 120.685 0.112 14 0.00799 122.012BCJ34X5F 2 3 6 124.011 0.110 14 0.00783 122.964
Average 124.413 9.961 0.039 Averagenorm 0.00792 124.694 9.872Standard Dev. 5.397 0.464 0.006 Standard Dev.norm 5.415 0.401
Coeff. of Var. [%] 4.338 4.657 15.100 Coeff. of Var. [%]norm 4.343 4.065Min. 112.638 9.336 0.029 Min. 0.0075 113.038 9.327Max. 132.159 10.562 0.044 Max. 0.0082 132.141 10.410
Number of Spec. 30 6 6 Number of Spec. 30 6
0° Tension -- (ETW)Strength & Modulus
Fiberite 7740/T650 3K-70-PW Graphite
44
0
1
2
3
4
5
6
0 25 50 75 100 125 150 175 200 225 250 275 300
0° Tension Strength [ksi]
ASAP
Bat
ch #
0
1
2
3
Prepeg Lot #
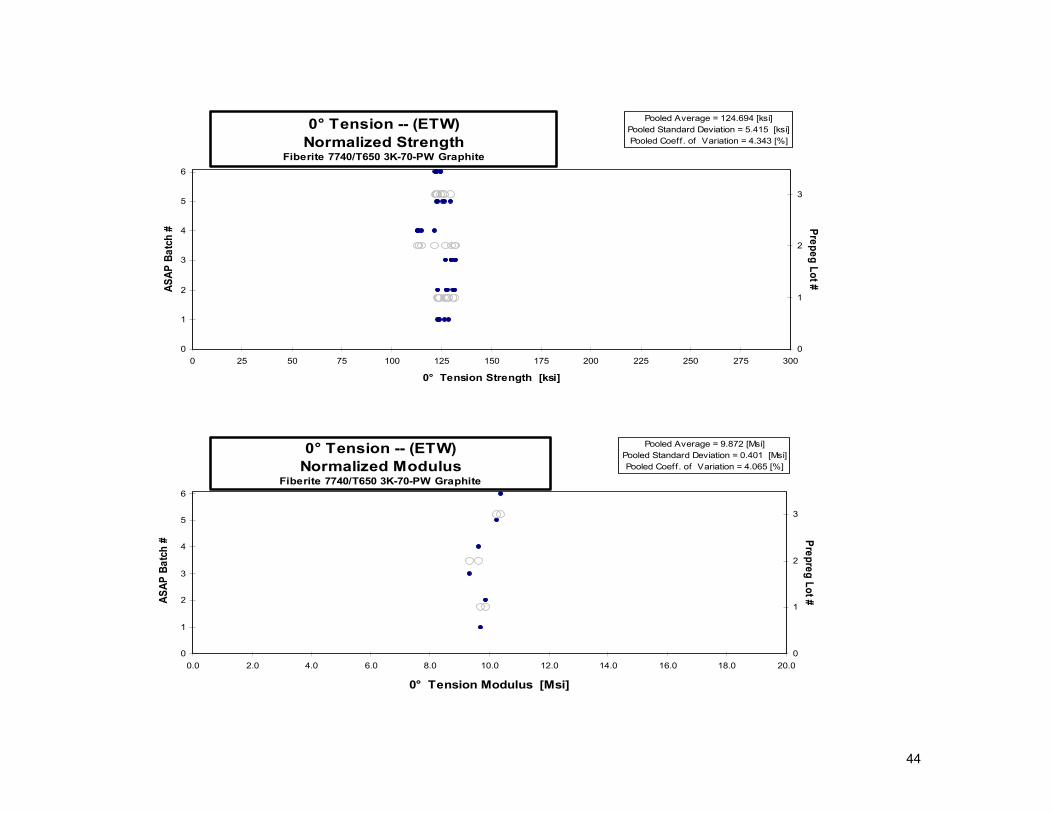
0° Tension -- (ETW)Normalized Strength
Fiberite 7740/T650 3K-70-PW Graphite
Pooled Average = 124.694 [ksi]Pooled Standard Deviation = 5.415 [ksi]Pooled Coeff. of Variation = 4.343 [%]
0
1
2
3
4
5
6
0.0 2.0 4.0 6.0 8.0 10.0 12.0 14.0 16.0 18.0 20.0
0° Tension Modulus [Msi]
ASAP
Bat
ch #
0
1
2
3
Prepreg Lot #
0° Tension -- (ETW)Normalized Modulus
Fiberite 7740/T650 3K-70-PW Graphite
Pooled Average = 9.872 [Msi]Pooled Standard Deviation = 0.401 [Msi]Pooled Coeff. of Variation = 4.065 [%]

45
normalizing tply[in]
0.0079
Specimen Cure Prepreg ASAP Strength Modulus Poisson's Avg. Specimen # Plies in Avg. tply Strengthnorm ModulusnormNumber Cycle Lot # Batch # [ksi] [Msi] Ratio Thickn. [in] Laminate [in] [ksi] [Msi]
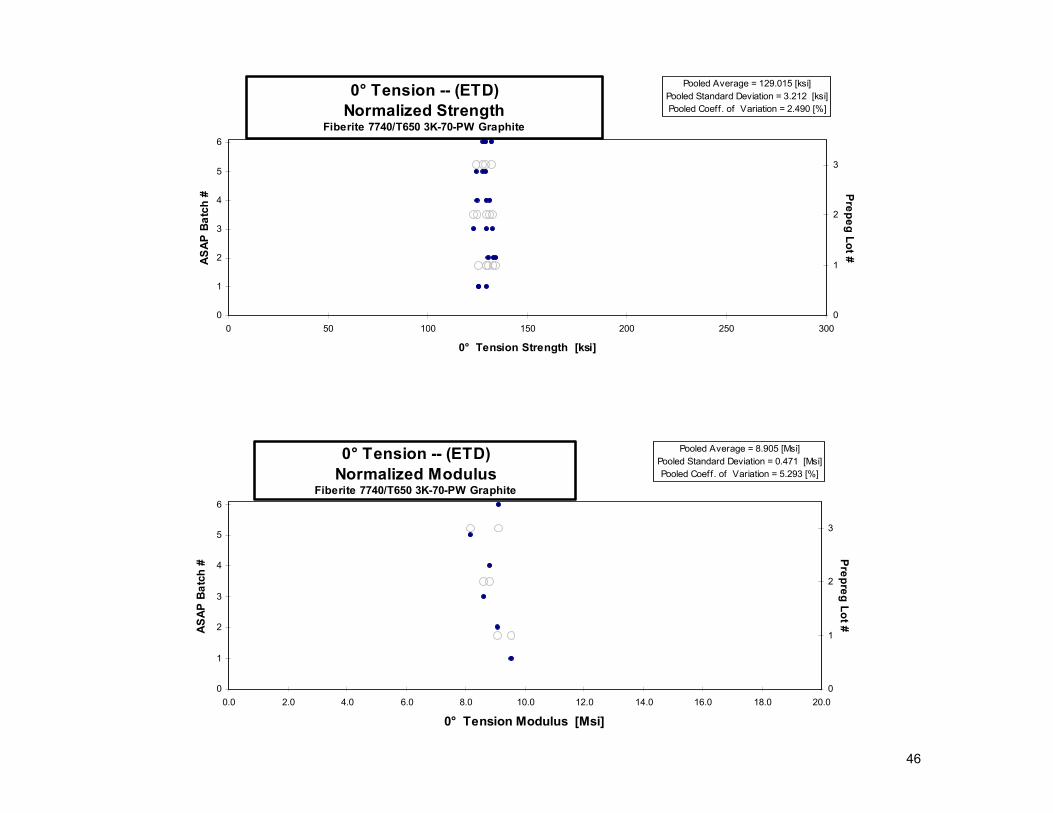
BCJ11X6G 1 1 1 133.078 9.825 0.033 0.108 14 0.00769 129.469 9.558BCJ11X7G 1 1 1 131.437 0.106 14 0.00756 125.851BCJ11X8G 1 1 1 135.622 0.103 14 0.00733 125.833BCJ13X6G 2 1 2 126.832 8.824 0.037 0.114 14 0.00813 130.540 9.082BCJ13X7G 2 1 2 128.336 0.115 14 0.00819 133.113BCJ13X8G 2 1 2 130.214 0.114 14 0.00816 134.551BCJ21X5G 1 2 3 121.958 8.540 0.040 0.112 14 0.00798 123.153 8.624BCJ21X6G 1 2 3 130.800 0.110 14 0.00784 129.775BCJ21X7G 1 2 3 133.928 0.109 14 0.00782 132.495BCJ24X1G 2 2 4 127.438 9.026 0.031 0.108 14 0.00774 124.903 8.847BCJ24X2G 2 2 4 132.843 0.110 14 0.00782 131.542BCJ24X3G 2 2 4 130.805 0.110 14 0.00782 129.504BCJ32X1G 1 3 5 129.015 8.165 0.026 0.111 14 0.00792 129.346 8.186BCJ32X2G 1 3 5 122.709 0.112 14 0.00801 124.373BCJ32X3G 1 3 5 127.189 0.111 14 0.00796 128.166BCJ34X6G 2 3 6 129.344 9.139 0.030 0.111 14 0.00790 129.305 9.136BCJ34X7G 2 3 6 126.671 0.112 14 0.00798 127.988BCJ34X8G 2 3 6 130.392 0.112 14 0.00802 132.357
Average 129.367 8.920 0.033 Averagenorm 0.00788 129.015 8.905Standard Dev. 3.585 0.566 0.005 Standard Dev.norm 3.212 0.471
Coeff. of Var. [%] 2.771 6.344 16.186 Coeff. of Var. [%]norm 2.490 5.293Min. 121.958 8.165 0.026 Min. 0.0073 123.153 8.186Max. 135.622 9.825 0.040 Max. 0.0082 134.551 9.558
Number of Spec. 18 6 6 Number of Spec. 18 6
0° Tension-- (ETD)Strength & Modulus
Fiberite 7740/T650 3K-70-PW Graphite
46
0
1
2
3
4
5
6
0 50 100 150 200 250 300
0° Tension Strength [ksi]
ASAP
Bat
ch #
0
1
2
3
Prepeg Lot #
0° Tension -- (ETD)Normalized Strength
Fiberite 7740/T650 3K-70-PW Graphite
Pooled Average = 129.015 [ksi]Pooled Standard Deviation = 3.212 [ksi]Pooled Coeff. of Variation = 2.490 [%]
0
1
2
3
4
5
6
0.0 2.0 4.0 6.0 8.0 10.0 12.0 14.0 16.0 18.0 20.0
0° Tension Modulus [Msi]
ASAP
Bat
ch #
0
1
2
3
Prepreg Lot #
0° Tension -- (ETD)Normalized Modulus
Fiberite 7740/T650 3K-70-PW Graphite
Pooled Average = 8.905 [Msi]Pooled Standard Deviation = 0.471 [Msi]Pooled Coeff. of Variation = 5.293 [%]

47
normalizing tply[in]
0.0079
Specimen Cure Prepreg ASAP Strength Modulus Avg. Specimen # Plies in Avg. tply Strengthnorm ModulusnormNumber Cycle Lot # Batch # [ksi] [Msi] Thickn. [in] Laminate [in] [ksi] [Msi]
BCU12X1A 1 1 1 133.860 10.588 0.106 14 0.00756 128.111 10.133BCU12X2A 1 1 1 130.075 0.109 14 0.00778 128.173BCU12X3A 1 1 1 122.686 0.111 14 0.00794 123.241BCU14X1A 2 1 2 125.368 0.114 14 0.00812 128.863BCU14X2A 2 1 2 129.237 10.011 0.110 14 0.00787 128.711 9.970BCU14X3A 2 1 2 120.787 0.113 14 0.00807 123.335BCU21X6A 1 2 3 120.883 9.772 0.111 14 0.00794 121.484 9.821BCU21X7A 1 2 3 118.463 0.113 14 0.00806 120.908BCU21X8A 1 2 3 121.023 0.110 14 0.00788 120.713BCU23X3A 2 2 4 111.765 9.703 0.111 14 0.00790 111.815 9.707BCU23X4A 2 2 4 115.079 0.111 14 0.00794 115.669BCU23X6A 2 2 4 111.230 0.110 14 0.00788 110.962BCU31X1A 1 3 5 107.814 9.357 0.110 14 0.00786 107.278 9.311BCU31X2A 1 3 5 119.068 0.110 14 0.00788 118.709BCU31X3A 1 3 5 111.131 0.113 14 0.00804 113.158BCU33X6A 2 3 6 116.457 0.112 14 0.00797 117.510BCU33X7A 2 3 6 115.493 9.621 0.111 14 0.00795 116.294 9.688BCU33X8A 2 3 6 113.937 0.111 14 0.00793 114.366
Average 119.131 9.842 Averagenorm 0.00792 119.406 9.772Standard Dev. 7.165 0.423 Standard Dev.norm 6.577 0.281
Coeff. of Var. [%] 6.014 4.294 Coeff. of Var. [%]norm 5.508 2.881Min. 107.814 9.357 Min. 0.0076 107.278 9.311Max. 133.860 10.588 Max. 0.0081 128.863 10.133
Number of Spec. 18 6 Number of Spec. 18 6
90° Tension-- (RTD)Strength & Modulus
Fiberite 7740/T650 3K-70-PW Graphite

48
0
1
2
3
4
5
6
0 25 50 75 100 125 150 175 200 225 250
90° Tension Strength [ksi]
ASAP
Bat
ch #
0
1
2
3
Prepeg Lot #
90° Tension -- (RTD)Normalized Strength
Fiberite 7740/T650 3K-70-PW Graphite
Pooled Average = 119.406 [ksi]Pooled Standard Deviation = 6.577 [ksi]Pooled Coeff. of Variation = 5.508 [%]
0
1
2
3
4
5
6
0.0 2.0 4.0 6.0 8.0 10.0 12.0 14.0 16.0 18.0 20.090° Tension Modulus [Msi]
ASAP
Bat
ch #
0
1
2
3
Prepreg Lot #
90° Tension -- (RTD)Normalized Modulus
Fiberite 7740/T650 3K-70-PW Graphite
Pooled Average = 9.772 [Msi]Pooled Standard Deviation = 0.281 [Msi]Pooled Coeff. of Variation = 2.881 [%]

49
normalizing tply[in]
0.0079
Specimen Cure Prepreg ASAP Strength Modulus Avg. Specimen # Plies in Avg. tply Strengthnorm ModulusnormNumber Cycle Lot # Batch # [ksi] [Msi] Thickn. [in] Laminate [in] [ksi] [Msi]
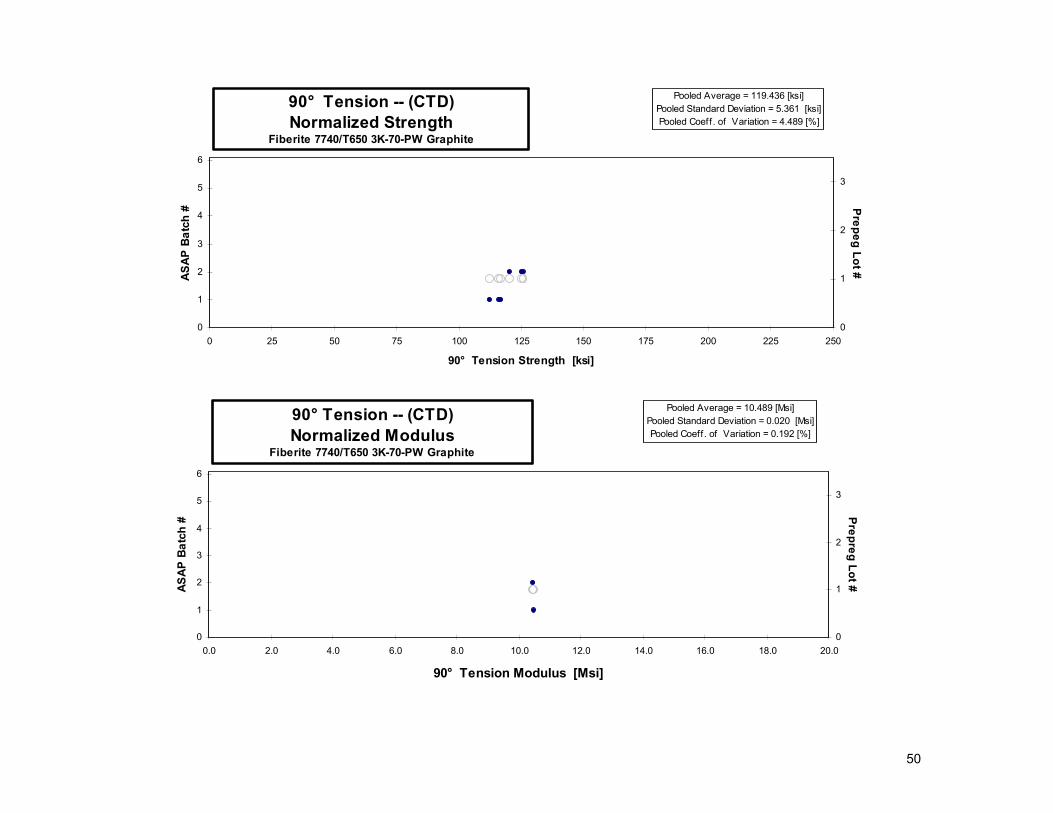
BCU12X5B 1 1 1 115.550 10.398 0.112 14 0.00798 116.716 10.503BCU12X6B 1 1 1 116.192 0.110 14 0.00789 116.069BCU12X7B 1 1 1 112.681 0.110 14 0.00788 112.375BCU14X5B 2 1 2 122.237 10.228 0.113 14 0.00809 125.185 10.475BCU14X7B 2 1 2 116.905 0.114 14 0.00814 120.428BCU14X8B 2 1 2 122.253 0.114 14 0.00813 125.846
Average 117.636 10.313 Averagenorm 0.00802 119.436 10.489Standard Dev. 3.848 0.120 Standard Dev.norm 5.361 0.020
Coeff. of Var. [%] 3.271 1.167 Coeff. of Var. [%]norm 4.489 0.192Min. 112.681 10.228 Min. 0.0079 112.375 10.475Max. 122.253 10.398 Max. 0.0081 125.846 10.503
Number of Spec. 6 2 Number of Spec. 6 2
90° Tension-- (CTD)Strength & Modulus
Fiberite 7740/T650 3K-70-PW Graphite
50
0
1
2
3
4
5
6
0 25 50 75 100 125 150 175 200 225 250
90° Tension Strength [ksi]
ASAP
Bat
ch #
0
1
2
3Prepeg Lot #
90° Tension -- (CTD)Normalized Strength
Fiberite 7740/T650 3K-70-PW Graphite
Pooled Average = 119.436 [ksi]Pooled Standard Deviation = 5.361 [ksi]Pooled Coeff. of Variation = 4.489 [%]
0
1
2
3
4
5
6
0.0 2.0 4.0 6.0 8.0 10.0 12.0 14.0 16.0 18.0 20.0
90° Tension Modulus [Msi]
ASAP
Bat
ch #
0
1
2
3
Prepreg Lot #
90° Tension -- (CTD)Normalized Modulus
Fiberite 7740/T650 3K-70-PW Graphite
Pooled Average = 10.489 [Msi]Pooled Standard Deviation = 0.020 [Msi]Pooled Coeff. of Variation = 0.192 [%]
51
normalizing tply[in]
0.0079
Specimen Cure Prepreg ASAP Strength Modulus Avg. Specimen # Plies in Avg. tply Strengthnorm ModulusnormNumber Cycle Lot # Batch # [ksi] [Msi] Thickn. [in] Laminate [in] [ksi] [Msi]
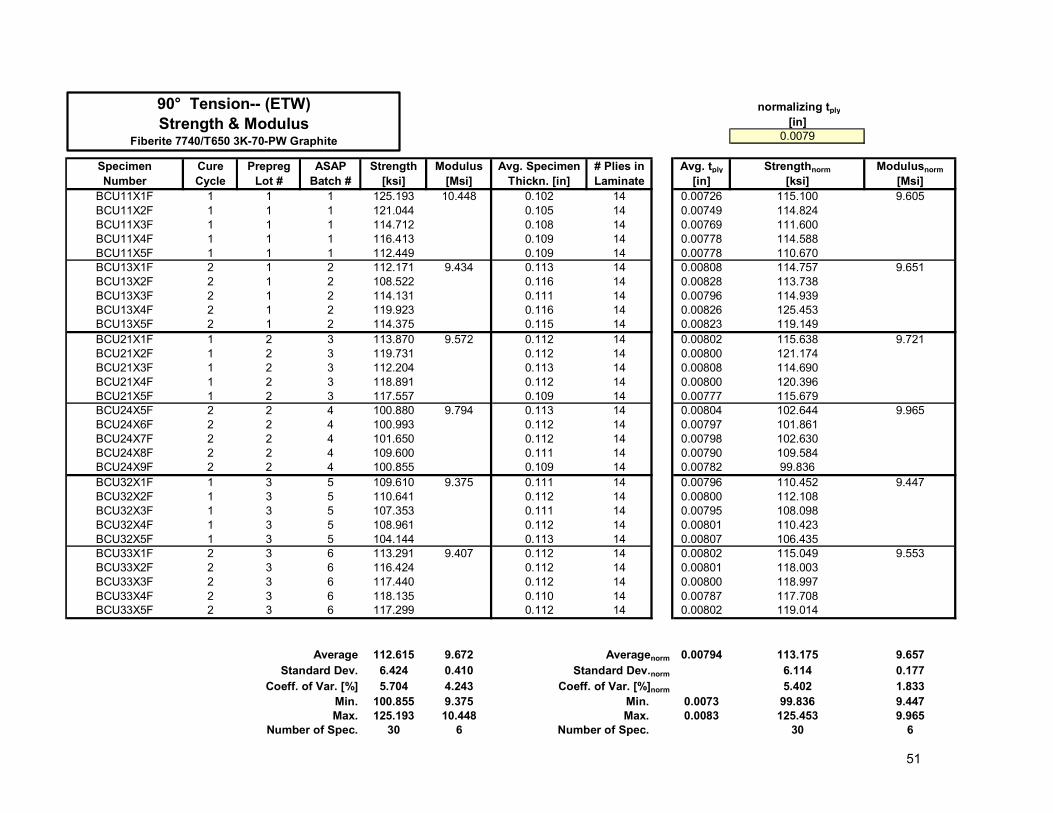
BCU11X1F 1 1 1 125.193 10.448 0.102 14 0.00726 115.100 9.605BCU11X2F 1 1 1 121.044 0.105 14 0.00749 114.824BCU11X3F 1 1 1 114.712 0.108 14 0.00769 111.600BCU11X4F 1 1 1 116.413 0.109 14 0.00778 114.588BCU11X5F 1 1 1 112.449 0.109 14 0.00778 110.670BCU13X1F 2 1 2 112.171 9.434 0.113 14 0.00808 114.757 9.651BCU13X2F 2 1 2 108.522 0.116 14 0.00828 113.738BCU13X3F 2 1 2 114.131 0.111 14 0.00796 114.939BCU13X4F 2 1 2 119.923 0.116 14 0.00826 125.453BCU13X5F 2 1 2 114.375 0.115 14 0.00823 119.149BCU21X1F 1 2 3 113.870 9.572 0.112 14 0.00802 115.638 9.721BCU21X2F 1 2 3 119.731 0.112 14 0.00800 121.174BCU21X3F 1 2 3 112.204 0.113 14 0.00808 114.690BCU21X4F 1 2 3 118.891 0.112 14 0.00800 120.396BCU21X5F 1 2 3 117.557 0.109 14 0.00777 115.679BCU24X5F 2 2 4 100.880 9.794 0.113 14 0.00804 102.644 9.965BCU24X6F 2 2 4 100.993 0.112 14 0.00797 101.861BCU24X7F 2 2 4 101.650 0.112 14 0.00798 102.630BCU24X8F 2 2 4 109.600 0.111 14 0.00790 109.584BCU24X9F 2 2 4 100.855 0.109 14 0.00782 99.836BCU32X1F 1 3 5 109.610 9.375 0.111 14 0.00796 110.452 9.447BCU32X2F 1 3 5 110.641 0.112 14 0.00800 112.108BCU32X3F 1 3 5 107.353 0.111 14 0.00795 108.098BCU32X4F 1 3 5 108.961 0.112 14 0.00801 110.423BCU32X5F 1 3 5 104.144 0.113 14 0.00807 106.435BCU33X1F 2 3 6 113.291 9.407 0.112 14 0.00802 115.049 9.553BCU33X2F 2 3 6 116.424 0.112 14 0.00801 118.003BCU33X3F 2 3 6 117.440 0.112 14 0.00800 118.997BCU33X4F 2 3 6 118.135 0.110 14 0.00787 117.708BCU33X5F 2 3 6 117.299 0.112 14 0.00802 119.014
Average 112.615 9.672 Averagenorm 0.00794 113.175 9.657Standard Dev. 6.424 0.410 Standard Dev.norm 6.114 0.177
Coeff. of Var. [%] 5.704 4.243 Coeff. of Var. [%]norm 5.402 1.833Min. 100.855 9.375 Min. 0.0073 99.836 9.447Max. 125.193 10.448 Max. 0.0083 125.453 9.965
Number of Spec. 30 6 Number of Spec. 30 6
90° Tension-- (ETW)Strength & Modulus
Fiberite 7740/T650 3K-70-PW Graphite

52
0
1
2
3
4
5
6
0 25 50 75 100 125 150 175 200 225 250
90° Tension Strength [ksi]
ASAP
Bat
ch #
0
1
2
3Prepeg Lot #
90° Tension -- (ETW)Normalized Strength
Fiberite 7740/T650 3K-70-PW Graphite
Pooled Average = 113.175 [ksi]Pooled Standard Deviation = 6.114 [ksi]Pooled Coeff. of Variation = 5.402 [%]
0
1
2
3
4
5
6
0.0 2.0 4.0 6.0 8.0 10.0 12.0 14.0 16.0 18.0 20.0
90° Tension Modulus [Msi]
ASAP
Bat
ch #
0
1
2
3
Prepreg Lot #
90° Tension -- (ETW)Normalized Modulus
Fiberite 7740/T650 3K-70-PW Graphite
Pooled Average = 9.657 [Msi]Pooled Standard Deviation = 0.177 [Msi]Pooled Coeff. of Variation = 1.833 [%]

53
normalizing tply[in]
0.0079
Specimen Cure Prepreg ASAP Strength Modulus Avg. Specimen # Plies in Avg. tply Strengthnorm ModulusnormNumber Cycle Lot # Batch # [ksi] [Msi] Thickn. [in] Laminate [in] [ksi] [Msi]
BCU11X6G 1 1 1 117.359 9.001 0.108 14 0.00774 115.042 8.823BCU11X7G 1 1 1 116.891 0.108 14 0.00773 114.390BCU11X8G 1 1 1 120.082 0.107 14 0.00767 116.626BCU13X6G 2 1 2 120.335 8.228 0.116 14 0.00825 125.684 8.594BCU13X7G 2 1 2 118.583 0.115 14 0.00825 123.783BCU13X8G 2 1 2 122.540 0.115 14 0.00824 127.802BCU22X1G 1 2 3 115.388 8.800 0.112 14 0.00803 117.336 8.949BCU22X2G 1 2 3 119.836 0.110 14 0.00787 119.403BCU22X3G 1 2 3 117.759 0.109 14 0.00775 115.523BCU24X1G 2 2 4 115.275 8.791 0.111 14 0.00795 115.953 8.843BCU24X2G 2 2 4 114.618 0.112 14 0.00798 115.810BCU24X3G 2 2 4 113.416 0.112 14 0.00801 114.954BCU31X5G 1 3 5 104.409 8.724 0.112 14 0.00800 105.668 8.829BCU31X6G 1 3 5 117.816 0.112 14 0.00802 119.538BCU31X7G 1 3 5 110.107 0.112 14 0.00800 111.534BCU34X1G 2 3 6 107.455 8.568 0.111 14 0.00791 107.649 8.584BCU34X2G 2 3 6 105.293 0.110 14 0.00786 104.801BCU34X3G 2 3 6 109.331 0.111 14 0.00790 109.282
Average 114.805 8.685 Averagenorm 0.00795 115.599 8.770Standard Dev. 5.389 0.264 Standard Dev.norm 6.366 0.148
Coeff. of Var. [%] 4.694 3.039 Coeff. of Var. [%]norm 5.507 1.686Min. 104.409 8.228 Min. 0.0077 104.801 8.584Max. 122.540 9.001 Max. 0.0083 127.802 8.949
Number of Spec. 18 6 Number of Spec. 18 6
90° Tension-- (ETD)Strength & Modulus
Fiberite 7740/T650 3K-70-PW Graphite

54
0
1
2
3
4
5
6
0 25 50 75 100 125 150 175 200 225 25090° Tension Strength [ksi]
ASAP
Bat
ch #
0
1
2
3
Prepeg Lot #
90° Tension -- (ETD)Normalized Strength
Fiberite 7740/T650 3K-70-PW Graphite
Pooled Average = 115.599 [ksi]Pooled Standard Deviation = 6.366 [ksi]Pooled Coeff. of Variation = 5.507 [%]
0
1
2
3
4
5
6
0.0 2.0 4.0 6.0 8.0 10.0 12.0 14.0 16.0 18.0 20.0
90° Tension Modulus [Msi]
ASAP
Bat
ch #
0
1
2
3
Prepreg Lot #
90° Tension -- (ETD)Normalized Modulus
Fiberite 7740/T650 3K-70-PW Graphite
Pooled Average = 8.770 [Msi]Pooled Standard Deviation = 0.148 [Msi]Pooled Coeff. of Variation = 1.686 [%]

55
normalizing tply[in]
0.0079
Specimen Cure Prepreg ASAP Strength Modulus Avg. Specimen # Plies in Avg. tply Strengthnorm ModulusnormNumber Cycle Lot # Batch # [ksi] [Msi] Thickn. [in] Laminate [in] [ksi] [Msi]
BCK1116A 1 1 1 108.101 0.131 16 0.00822 112.420BCK1117A 1 1 1 99.603 0.132 16 0.00824 103.937BCK1118A 1 1 1 107.730 0.130 16 0.00815 111.118BCL11X6A 1 1 1 8.691 0.131 16 0.00818 8.996BCK1218A 3 1 2 106.278 0.127 16 0.00794 106.845BCK1219A 3 1 2 109.619 0.122 16 0.00761 105.543BCK121BA 3 1 2 100.652 0.129 16 0.00808 102.921BCL12X6A 3 1 2 9.258 0.125 16 0.00779 9.133BCK2116A 2 2 3 103.515 0.128 16 0.00803 105.214BCK2117A 2 2 3 101.821 0.129 16 0.00804 103.674BCK2118A 2 2 3 105.109 0.127 16 0.00794 105.650BCL21X6A 2 2 3 9.735 0.128 16 0.00799 9.843BCK2216A 3 2 4 99.529 0.117 16 0.00734 92.482BCK2218A 3 2 4 98.212 0.119 16 0.00741 92.074BCK2219A 3 2 4 106.311 0.118 16 0.00738 99.309BCL22X6A 3 2 4 8.706 0.121 16 0.00756 8.329BCK3117A 3 3 5 104.604 0.126 16 0.00785 103.963BCK3118A 3 3 5 102.512 0.124 16 0.00774 100.424BCK311AA 3 3 5 103.422 0.122 16 0.00763 99.903BCL31X6A 3 3 5 9.765 0.122 16 0.00761 9.412BCK3227A 4 3 6 112.031 0.127 16 0.00794 112.607BCK3228A 4 3 6 110.001 0.126 16 0.00789 109.805BCK3229A 4 3 6 109.214 0.126 16 0.00788 108.890BCL32X6A 4 3 6 9.599 0.120 16 0.00752 9.142
Average 104.904 9.292 Averagenorm 0.00783 104.265 9.142Standard Dev. 4.051 0.494 Standard Dev.norm 5.913 0.500
Coeff. of Var. [%] 3.862 5.317 Coeff. of Var. [%]norm 5.671 5.464Min. 98.212 8.691 Min. 0.0073 92.074 8.329Max. 112.031 9.765 Max. 0.0082 112.607 9.843
Number of Spec. 18 6 Number of Spec. 18 6
0° Compression -- (RTD)Strength & Modulus
Fiberite 7740/T650 3K-70-PW Graphite

56
0
1
2
3
4
5
6
0 20 40 60 80 100 120 140 160 180 200
0° Compression Strength [ksi]
ASAP
Bat
ch #
0
1
2
3Prepeg Lot #
0° Compression -- (RTD)Normalized Strength
Fiberite 7740/T650 3K-70-PW Graphite
Pooled Average = 104.265 [ksi]Pooled Standard Deviation = 5.913 [ksi]Pooled Coeff. of Variation = 5.671 [%]
0
1
2
3
4
5
6
0.0 2.0 4.0 6.0 8.0 10.0 12.0 14.0 16.0 18.00° Compression Modulus [Msi]
ASAP
Bat
ch #
0
1
2
3
Prepreg Lot #
0° Compression -- (RTD)Normalized Modulus
Fiberite 7740/T650 3K-70-PW Graphite
Pooled Average = 9.142 [Msi]Pooled Standard Deviation = 0.500 [Msi]Pooled Coeff. of Variation = 5.464 [%]
57
normalizing tply[in]
0.0079
Specimen Cure Prepreg ASAP Strength Modulus Avg. Specimen # Plies in Avg. tply Strengthnorm ModulusnormNumber Cycle Lot # Batch # [ksi] [Msi] Thickn. [in] Laminate [in] [ksi] [Msi]
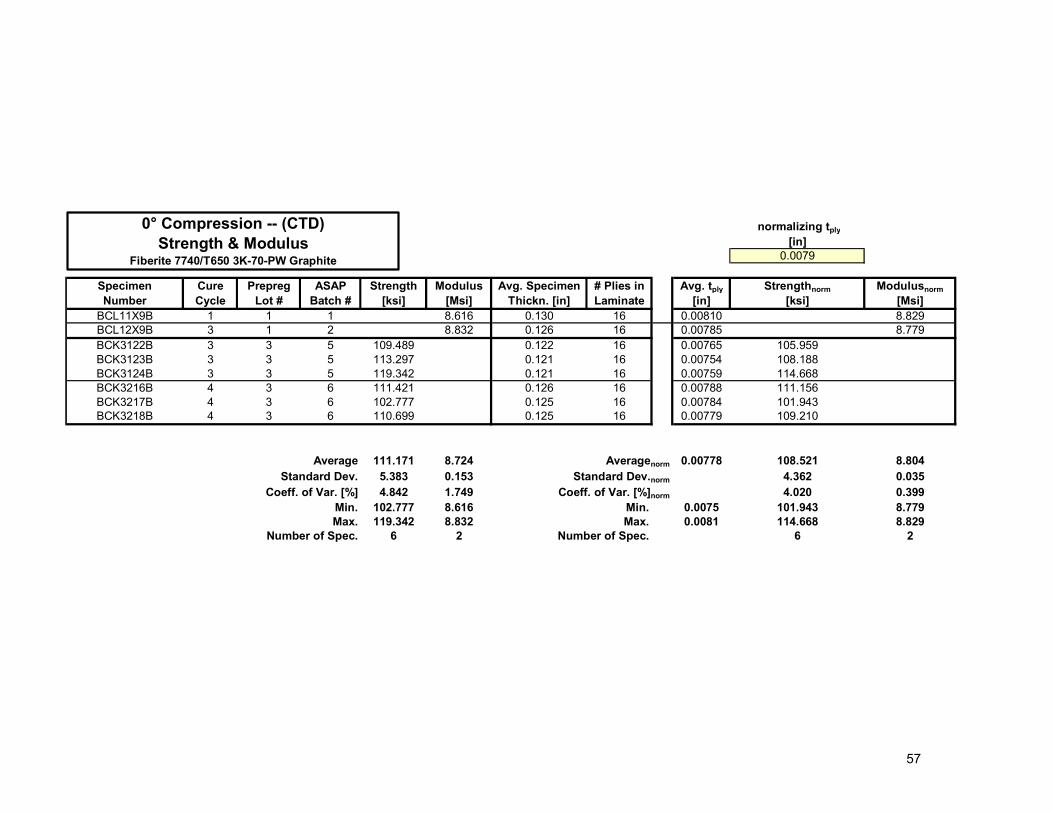
BCL11X9B 1 1 1 8.616 0.130 16 0.00810 8.829BCL12X9B 3 1 2 8.832 0.126 16 0.00785 8.779BCK3122B 3 3 5 109.489 0.122 16 0.00765 105.959BCK3123B 3 3 5 113.297 0.121 16 0.00754 108.188BCK3124B 3 3 5 119.342 0.121 16 0.00759 114.668BCK3216B 4 3 6 111.421 0.126 16 0.00788 111.156BCK3217B 4 3 6 102.777 0.125 16 0.00784 101.943BCK3218B 4 3 6 110.699 0.125 16 0.00779 109.210
Average 111.171 8.724 Averagenorm 0.00778 108.521 8.804Standard Dev. 5.383 0.153 Standard Dev.norm 4.362 0.035
Coeff. of Var. [%] 4.842 1.749 Coeff. of Var. [%]norm 4.020 0.399Min. 102.777 8.616 Min. 0.0075 101.943 8.779Max. 119.342 8.832 Max. 0.0081 114.668 8.829
Number of Spec. 6 2 Number of Spec. 6 2
0° Compression -- (CTD)Strength & Modulus
Fiberite 7740/T650 3K-70-PW Graphite

58
0
1
2
3
4
5
6
0 20 40 60 80 100 120 140 160 180 200
0° Compression Strength [ksi]
ASAP
Bat
ch #
0
1
2
3Prepeg Lot #
0° Compression -- (CTD)Normalized Strength
Fiberite 7740/T650 3K-70-PW Graphite
Pooled Average = 108.521 [ksi]Pooled Standard Deviation = 4.362 [ksi]Pooled Coeff. of Variation = 4.020 [%]
0
1
2
3
4
5
6
0.0 2.0 4.0 6.0 8.0 10.0 12.0 14.0 16.0 18.0
0° Compression Modulus [Msi]
ASAP
Bat
ch #
0
1
2
3
Prepreg Lot #
0° Compression -- (CTD)Normalized Modulus
Fiberite 7740/T650 3K-70-PW Graphite
Pooled Average = 8.804 [Msi]Pooled Standard Deviation = 0.035 [Msi]Pooled Coeff . of Variation = 0.399 [%]

59
normalizing tply[in]
0.0079
Specimen Cure Prepreg ASAP Strength Modulus Avg. Specimen # Plies in Avg. tply Strengthnorm ModulusnormNumber Cycle Lot # Batch # [ksi] [Msi] Thickn. [in] Laminate [in] [ksi] [Msi]
BCK1111F 1 1 1 51.781 0.132 16 0.00826 54.157BCK1112F 1 1 1 51.621 0.133 16 0.00829 54.153BCK1113F 1 1 1 57.288 0.131 16 0.00821 59.532BCK1114F 1 1 1 59.901 0.131 16 0.00818 61.998BCK1115F 1 1 1 55.347 0.129 16 0.00809 56.694BCL11X1F 1 1 1 9.472 0.130 16 0.00810 9.709BCK1213F 3 1 2 45.891 0.128 16 0.00799 46.408BCK1214F 3 1 2 58.324 0.129 16 0.00804 59.351BCK1215F 3 1 2 61.471 0.130 16 0.00810 63.015BCK1216F 3 1 2 52.188 0.130 16 0.00811 53.582BCK1217F 3 1 2 56.796 0.127 16 0.00797 57.267BCL12X1F 3 1 2 9.989 0.126 16 0.00787 9.946BCK2111F 2 2 3 55.081 0.128 16 0.00800 55.779BCK2112F 2 2 3 63.774 0.128 16 0.00801 64.644BCK2113F 2 2 3 57.197 0.124 16 0.00777 56.258BCK2114F 2 2 3 61.295 0.127 16 0.00791 61.392BCK2115F 2 2 3 65.984 0.127 16 0.00795 66.389BCL21X1F 2 2 3 9.977 0.127 16 0.00797 10.060BCK2211F 3 2 4 51.044 0.116 16 0.00725 46.854BCK2212F 3 2 4 54.068 0.119 16 0.00746 51.063BCK2213F 3 2 4 57.748 0.119 16 0.00744 54.413BCK2214F 3 2 4 56.710 0.118 16 0.00739 53.043BCK2215F 3 2 4 56.018 0.119 16 0.00742 52.606BCL22X1F 3 2 4 8.902 0.114 16 0.00714 8.046BCK3111F 3 3 5 65.936 0.125 16 0.00781 65.205BCK3113F 3 3 5 64.310 0.126 16 0.00787 64.081BCK3114F 3 3 5 64.653 0.126 16 0.00788 64.474BCK3115F 3 3 5 63.033 0.125 16 0.00782 62.360BCK3116F 3 3 5 65.208 0.126 16 0.00787 64.963BCL31X1F 3 3 5 9.576 0.121 16 0.00753 9.133BCK3221F 4 3 6 66.159 0.127 16 0.00794 66.473BCK3222F 4 3 6 69.139 0.125 16 0.00783 68.551BCK3223F 4 3 6 68.081 0.127 16 0.00792 68.229BCK3224F 4 3 6 61.731 0.124 16 0.00778 60.779BCK3225F 4 3 6 63.496 0.128 16 0.00798 64.136BCL32X1F 4 3 6 9.921 0.126 16 0.00790 9.927
Average 59.376 9.640 Averagenorm 0.00786 59.262 9.470Standard Dev. 5.799 0.422 Standard Dev.norm 6.124 0.772
Coeff. of Var. [%] 9.766 4.379 Coeff. of Var. [%]norm 10.334 8.151Min. 45.891 8.902 Min. 0.0071 46.408 8.046Max. 69.139 9.989 Max. 0.0083 68.551 10.060
Number of Spec. 30 6 Number of Spec. 30 6
0° Compression -- (ETW)Strength & Modulus
Fiberite 7740/T650 3K-70-PW Graphite

60
0
1
2
3
4
5
6
0 20 40 60 80 100 120 140 160 180 200
0° Compression Strength [ksi]
ASAP
Bat
ch #
0
1
2
3Prepeg Lot #
0° Compression -- (ETW)Normalized Strength
Fiberite 7740/T650 3K-70-PW Graphite
Pooled Average = 59.262 [ksi]Pooled Standard Deviation = 6.124 [ksi]Pooled Coeff. of Variation = 10.334 [%]
0
1
2
3
4
5
6
0.0 2.0 4.0 6.0 8.0 10.0 12.0 14.0 16.0 18.0
0° Compression Modulus [Msi]
ASAP
Bat
ch #
0
1
2
3
Prepreg Lot #
0° Compression -- (ETW)Normalized Modulus
Fiberite 7740/T650 3K-70-PW Graphite
Pooled Average = 9.470 [Msi]Pooled Standard Deviation = 0.772 [Msi]Pooled Coeff. of Variation = 8.151 [%]

61
normalizing tply[in]
0.0079
Specimen Cure Prepreg ASAP Strength Modulus Avg. Specimen # Plies in Avg. tply Strengthnorm ModulusnormNumber Cycle Lot # Batch # [ksi] [Msi] Thickn. [in] Laminate [in] [ksi] [Msi]
BCK1119G 1 1 1 82.974 0.131 16 0.00822 86.306BCK111AG 1 1 1 78.843 0.131 16 0.00819 81.775BCK111BG 1 1 1 81.549 0.132 16 0.00822 84.839BCL11XCG 1 1 1 9.116 0.130 16 0.00811 9.363BCK1227G 3 1 2 87.041 0.125 16 0.00780 85.905BCK1228G 3 1 2 89.490 0.125 16 0.00782 88.588BCK122AG 3 1 2 84.785 0.125 16 0.00782 83.930BCL12XCG 3 1 2 9.382 0.127 16 0.00796 9.457BCK2129G 2 2 3 90.323 0.124 16 0.00778 88.948BCK211AG 2 2 3 89.746 0.128 16 0.00802 91.060BCK211BG 2 2 3 83.047 0.128 16 0.00799 84.000BCL21X9G 2 2 3 9.676 0.127 16 0.00792 9.698BCK2221G 3 2 4 94.650 0.118 16 0.00740 88.604BCK2222G 3 2 4 81.595 0.122 16 0.00761 78.609BCK2223G 3 2 4 80.583 0.121 16 0.00756 77.140BCL22X9G 3 2 4 10.021 0.117 16 0.00733 9.295BCK3126G 3 3 5 80.437 0.124 16 0.00776 79.037BCK3128G 3 3 5 76.987 0.124 16 0.00772 75.236BCK3129G 3 3 5 79.425 0.123 16 0.00771 77.540BCL31X9G 3 3 5 9.977 0.122 16 0.00763 9.630BCK3211G 4 3 6 84.302 0.125 16 0.00782 83.468BCK3212G 4 3 6 78.680 0.126 16 0.00789 78.618BCK3213G 4 3 6 82.983 0.126 16 0.00787 82.704BCL32X9G 4 3 6 9.371 0.125 16 0.00783 9.293
Average 83.747 9.591 Averagenorm 0.00783 83.128 9.456Standard Dev. 4.787 0.363 Standard Dev.norm 4.651 0.173
Coeff. of Var. [%] 5.716 3.785 Coeff. of Var. [%]norm 5.595 1.830Min. 76.987 9.116 Min. 0.0073 75.236 9.293Max. 94.650 10.021 Max. 0.0082 91.060 9.698
Number of Spec. 18 6 Number of Spec. 18 6
0° Compression -- (ETD)Strength & Modulus
Fiberite 7740/T650 3K-70-PW Graphite

62
0
1
2
3
4
5
6
0 20 40 60 80 100 120 140 160 180 200
0° Compression Strength [ksi]
ASAP
Bat
ch #
0
1
2
3
Prepeg Lot #
0° Compression -- (ETD)Normalized Strength
Fiberite 7740/T650 3K-70-PW Graphite
Pooled Average = 83.128 [ksi]Pooled Standard Deviation = 4.651 [ksi]Pooled Coeff. of Variation = 5.595 [%]
0
1
2
3
4
5
6
0.0 2.0 4.0 6.0 8.0 10.0 12.0 14.0 16.0 18.0
0° Compression Modulus [Msi]
ASAP
Bat
ch #
0
1
2
3
Prepreg Lot #
0° Compression -- (ETD)Normalized Modulus
Fiberite 7740/T650 3K-70-PW Graphite
Pooled Average = 9.456 [Msi]Pooled Standard Deviation = 0.173 [Msi]Pooled Coeff. of Variation = 1.830 [%]

63
normalizing tply[in]
0.0079
Specimen Cure Prepreg ASAP Strength Modulus Avg. Specimen # Plies in Avg. tply Strengthnorm ModulusnormNumber Cycle Lot # Batch # [ksi] [Msi] Thickn. [in] Laminate [in] [ksi] [Msi]
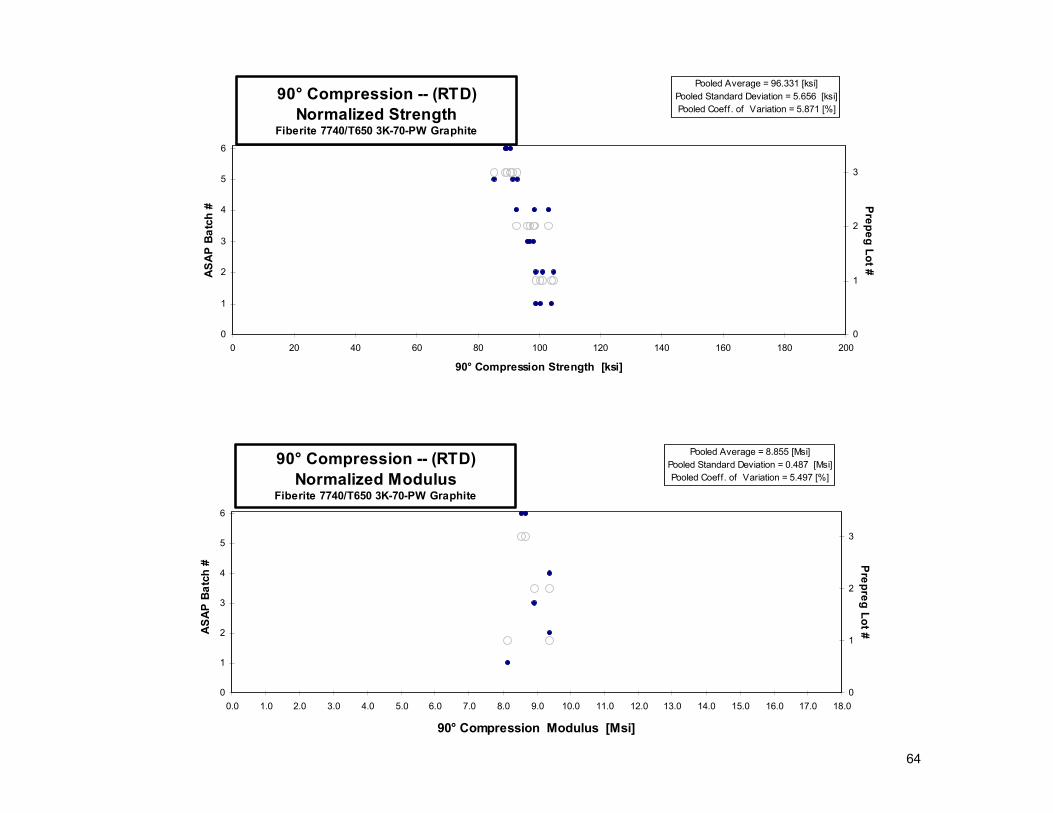
BCW1121A 1 1 1 97.472 0.130 16 0.00814 100.422BCW1122A 1 1 1 96.484 0.130 16 0.00811 99.003BCW1123A 1 1 1 103.422 0.127 16 0.00794 103.954BCZ11X7A 1 1 1 7.947 0.130 16 0.00812 8.165BCW1221A 3 1 2 101.129 0.127 16 0.00792 101.389BCW1222A 3 1 2 98.750 0.127 16 0.00793 99.082BCW1223A 3 1 2 104.312 0.127 16 0.00793 104.746BCZ12X6A 3 1 2 9.600 0.124 16 0.00773 9.397BCW2127A 2 2 3 97.620 0.127 16 0.00795 98.295BCW2128A 2 2 3 96.837 0.127 16 0.00792 97.105BCW2129A 2 2 3 95.391 0.128 16 0.00798 96.334BCZ21X6A 2 2 3 8.887 0.127 16 0.00793 8.925BCW2216A 3 2 4 98.033 0.120 16 0.00747 92.720BCW2217A 3 2 4 104.291 0.120 16 0.00747 98.598BCW2218A 3 2 4 108.391 0.120 16 0.00753 103.246BCZ22X6A 3 2 4 10.113 0.117 16 0.00734 9.395BCW31X2A 3 3 5 92.751 0.125 16 0.00780 91.522BCW31X3A 3 3 5 94.607 0.124 16 0.00777 92.998BCW31X4A 3 3 5 86.254 0.125 16 0.00781 85.264BCW3116A 4 3 6 89.247 0.127 16 0.00793 89.635BCW3117A 4 3 6 88.073 0.128 16 0.00799 89.048BCW3118A 4 3 6 90.531 0.127 16 0.00791 90.603BCZ31X6A 4 3 6 8.624 0.127 16 0.00797 8.695BCZ32X6A 4 3 6 8.474 0.128 16 0.00797 8.550
Average 96.866 8.941 Averagenorm 0.00786 96.331 8.855Standard Dev. 6.053 0.790 Standard Dev.norm 5.656 0.487
Coeff. of Var. [%] 6.249 8.832 Coeff. of Var. [%]norm 5.871 5.497Min. 86.254 7.947 Min. 0.0073 85.264 8.165Max. 108.391 10.113 Max. 0.0081 104.746 9.397
Number of Spec. 18 6 Number of Spec. 18 6
90° Compression -- (RTD)Strength & Modulus
Fiberite 7740/T650 3K-70-PW Graphite
64
0
1
2
3
4
5
6
0 20 40 60 80 100 120 140 160 180 200
90° Compression Strength [ksi]
ASAP
Bat
ch #
0
1
2
3Prepeg Lot #
90° Compression -- (RTD)Normalized Strength
Fiberite 7740/T650 3K-70-PW Graphite
Pooled Average = 96.331 [ksi]Pooled Standard Deviation = 5.656 [ksi]Pooled Coeff. of Variation = 5.871 [%]
0
1
2
3
4
5
6
0.0 1.0 2.0 3.0 4.0 5.0 6.0 7.0 8.0 9.0 10.0 11.0 12.0 13.0 14.0 15.0 16.0 17.0 18.0
90° Compression Modulus [Msi]
ASAP
Bat
ch #
0
1
2
3
Prepreg Lot #
90° Compression -- (RTD)Normalized Modulus
Fiberite 7740/T650 3K-70-PW Graphite
Pooled Average = 8.855 [Msi]Pooled Standard Deviation = 0.487 [Msi]Pooled Coeff. of Variation = 5.497 [%]
65
normalizing tply[in]
0.0079
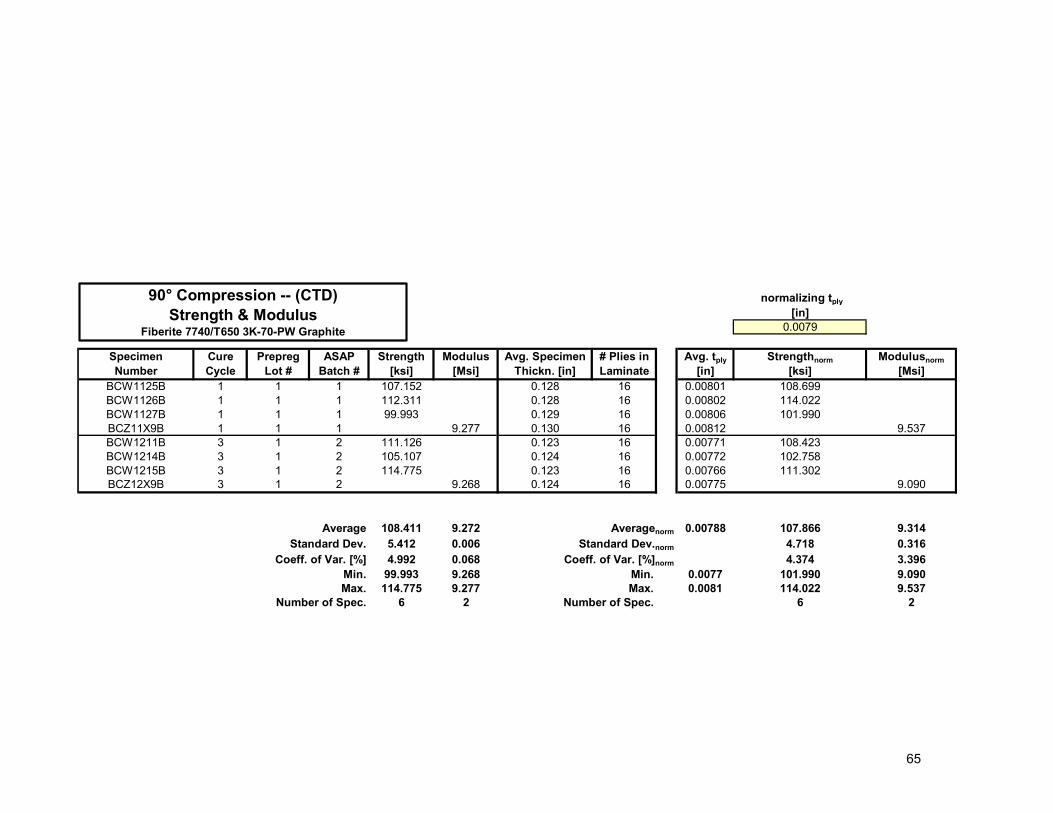
Specimen Cure Prepreg ASAP Strength Modulus Avg. Specimen # Plies in Avg. tply Strengthnorm ModulusnormNumber Cycle Lot # Batch # [ksi] [Msi] Thickn. [in] Laminate [in] [ksi] [Msi]
BCW1125B 1 1 1 107.152 0.128 16 0.00801 108.699BCW1126B 1 1 1 112.311 0.128 16 0.00802 114.022BCW1127B 1 1 1 99.993 0.129 16 0.00806 101.990BCZ11X9B 1 1 1 9.277 0.130 16 0.00812 9.537BCW1211B 3 1 2 111.126 0.123 16 0.00771 108.423BCW1214B 3 1 2 105.107 0.124 16 0.00772 102.758BCW1215B 3 1 2 114.775 0.123 16 0.00766 111.302BCZ12X9B 3 1 2 9.268 0.124 16 0.00775 9.090
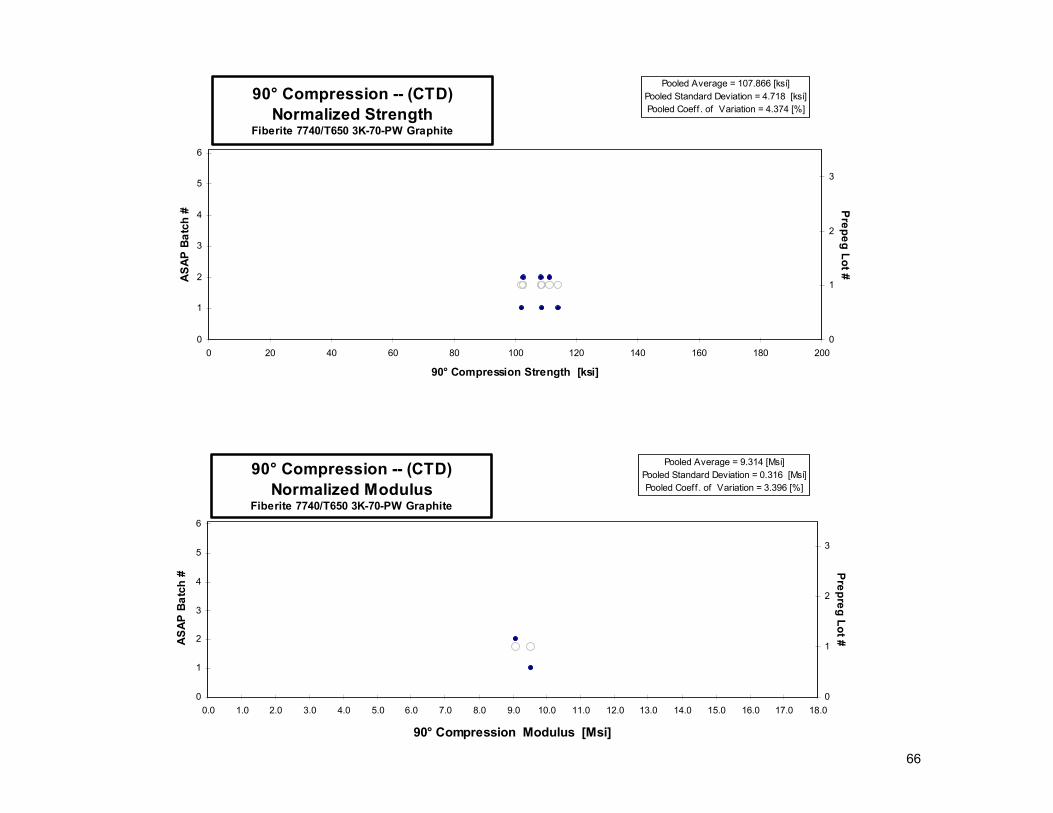
Average 108.411 9.272 Averagenorm 0.00788 107.866 9.314Standard Dev. 5.412 0.006 Standard Dev.norm 4.718 0.316
Coeff. of Var. [%] 4.992 0.068 Coeff. of Var. [%]norm 4.374 3.396Min. 99.993 9.268 Min. 0.0077 101.990 9.090Max. 114.775 9.277 Max. 0.0081 114.022 9.537
Number of Spec. 6 2 Number of Spec. 6 2
90° Compression -- (CTD)Strength & Modulus
Fiberite 7740/T650 3K-70-PW Graphite
66
0
1
2
3
4
5
6
0 20 40 60 80 100 120 140 160 180 200
90° Compression Strength [ksi]
ASAP
Bat
ch #
0
1
2
3
Prepeg Lot #
90° Compression -- (CTD)Normalized Strength
Fiberite 7740/T650 3K-70-PW Graphite
Pooled Average = 107.866 [ksi]Pooled Standard Deviation = 4.718 [ksi]Pooled Coeff . of Variation = 4.374 [%]
0
1
2
3
4
5
6
0.0 1.0 2.0 3.0 4.0 5.0 6.0 7.0 8.0 9.0 10.0 11.0 12.0 13.0 14.0 15.0 16.0 17.0 18.0
90° Compression Modulus [Msi]
ASAP
Bat
ch #
0
1
2
3
Prepreg Lot #
90° Compression -- (CTD)Normalized Modulus
Fiberite 7740/T650 3K-70-PW Graphite
Pooled Average = 9.314 [Msi]Pooled Standard Deviation = 0.316 [Msi]Pooled Coeff . of Variation = 3.396 [%]

67
normalizing tply[in]
0.0079
Specimen Cure Prepreg ASAP Strength Modulus Avg. Specimen # Plies in Avg. tply Strengthnorm ModulusnormNumber Cycle Lot # Batch # [ksi] [Msi] Thickn. [in] Laminate [in] [ksi] [Msi]
BCW1118F 1 1 1 59.856 0.125 16 0.00784 59.370BCW1119F 1 1 1 59.323 0.126 16 0.00789 59.229BCW111AF 1 1 1 56.971 0.130 16 0.00811 58.504BCW111BF 1 1 1 57.588 0.127 16 0.00797 58.078BCW111CF 1 1 1 59.199 0.127 16 0.00796 59.620BCZ11X1F 1 1 1 9.674 0.130 16 0.00815 9.976BCW1228F 3 1 2 64.187 0.128 16 0.00797 64.784BCW1229F 3 1 2 59.971 0.128 16 0.00798 60.600BCW122BF 3 1 2 63.578 0.128 16 0.00802 64.571BCZ12X2F 3 1 2 10.383 0.120 16 0.00753 9.892BCW2121F 2 2 3 57.800 0.127 16 0.00794 58.109BCW2122F 2 2 3 59.839 0.127 16 0.00795 60.242BCW2123F 2 2 3 62.782 0.125 16 0.00779 61.876BCW2124F 2 2 3 64.995 0.128 16 0.00797 65.573BCW2125F 2 2 3 60.639 0.126 16 0.00789 60.531BCZ21X1F 2 2 3 9.342 0.128 16 0.00800 9.464BCW2211F 3 2 4 59.405 0.119 16 0.00743 55.833BCW2212F 3 2 4 55.027 0.121 16 0.00755 52.568BCW2213F 3 2 4 56.558 0.120 16 0.00753 53.896BCW2214F 3 2 4 57.464 0.120 16 0.00747 54.350BCW2215F 3 2 4 59.706 0.119 16 0.00744 56.258BCZ22X1F 3 2 4 10.803 0.116 16 0.00728 9.954BCW3211F 4 3 5 54.252 0.127 16 0.00795 54.606BCW3212F 4 3 5 50.061 0.128 16 0.00797 50.507BCW3213F 4 3 5 54.580 0.128 16 0.00800 55.303BCW3214F 4 3 5 53.574 0.128 16 0.00798 54.094BCW3215F 4 3 5 57.283 0.128 16 0.00801 58.098BCZ31X1F 4 3 5 8.925 0.128 16 0.00797 9.008BCW3111F 4 3 6 69.124 0.127 16 0.00791 69.233BCW3112F 4 3 6 62.089 0.126 16 0.00789 62.027BCW3113F 4 3 6 55.656 0.127 16 0.00795 56.008BCW3114F 4 3 6 57.226 0.126 16 0.00790 57.215BCW3115F 4 3 6 60.519 0.128 16 0.00797 61.070BCZ32X1F 4 3 6 8.359 0.126 16 0.00789 8.346
Average 58.902 9.581 Averagenorm 0.00785 58.648 9.440Standard Dev. 3.936 0.908 Standard Dev.norm 4.253 0.654
Coeff. of Var. [%] 6.683 9.479 Coeff. of Var. [%]norm 7.251 6.931Min. 50.061 8.359 Min. 0.0073 50.507 8.346Max. 69.124 10.803 Max. 0.0081 69.233 9.976
Number of Spec. 28 6 Number of Spec. 28 6
90° Compression -- (ETW)Strength & Modulus
Fiberite 7740/T650 3K-70-PW Graphite
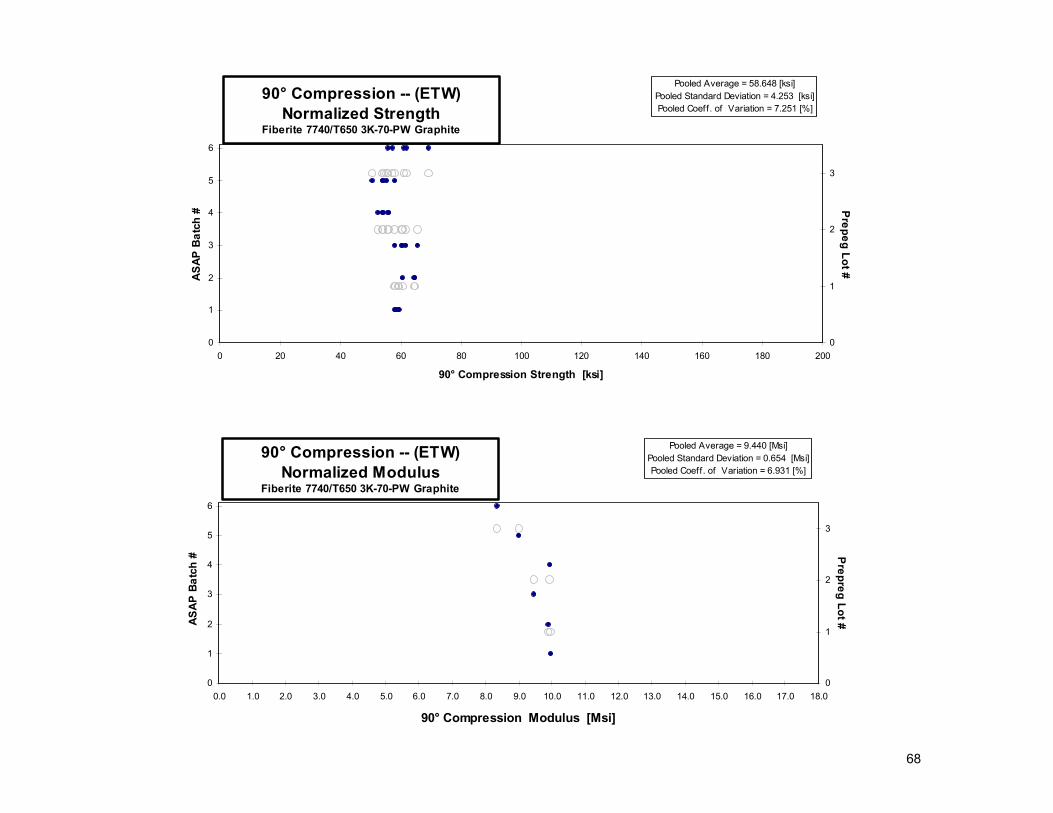
68
0
1
2
3
4
5
6
0 20 40 60 80 100 120 140 160 180 200
90° Compression Strength [ksi]
ASAP
Bat
ch #
0
1
2
3
Prepeg Lot #
90° Compression -- (ETW)Normalized Strength
Fiberite 7740/T650 3K-70-PW Graphite
Pooled Average = 58.648 [ksi]Pooled Standard Deviation = 4.253 [ksi]Pooled Coeff. of Variation = 7.251 [%]
0
1
2
3
4
5
6
0.0 1.0 2.0 3.0 4.0 5.0 6.0 7.0 8.0 9.0 10.0 11.0 12.0 13.0 14.0 15.0 16.0 17.0 18.0
90° Compression Modulus [Msi]
ASAP
Bat
ch #
0
1
2
3
Prepreg Lot #
90° Compression -- (ETW)Normalized Modulus
Fiberite 7740/T650 3K-70-PW Graphite
Pooled Average = 9.440 [Msi]Pooled Standard Deviation = 0.654 [Msi]Pooled Coeff. of Variation = 6.931 [%]

69
normalizing tply[in]
0.0079
Specimen Cure Prepreg ASAP Strength Modulus Avg. Specimen # Plies in Avg. tply Strengthnorm ModulusnormNumber Cycle Lot # Batch # [ksi] [Msi] Thickn. [in] Laminate [in] [ksi] [Msi]
BCW1129G 1 1 1 86.821 0.130 16 0.00814 89.414BCW112AG 1 1 1 80.597 0.130 16 0.00814 83.036BCW112BG 1 1 1 83.353 0.128 16 0.00801 84.540BCZ11XCG 1 1 1 10.181 0.130 16 0.00813 10.477BCW1217G 3 1 2 61.895 0.123 16 0.00770 60.340BCW1219G 3 1 2 79.236 0.124 16 0.00776 77.810BCW121AG 3 1 2 78.951 0.120 16 0.00753 75.251BCZ12XCG 3 1 2 11.543 0.124 16 0.00773 11.299BCW2111G 2 2 3 85.997 0.126 16 0.00786 85.520BCW2112G 2 2 3 73.745 0.125 16 0.00778 72.636BCW2113G 2 2 3 75.925 0.126 16 0.00788 75.684BCZ21X9G 2 2 3 8.015 0.128 16 0.00799 8.106BCW2222G 3 2 4 73.630 0.119 16 0.00742 69.159BCW2223G 3 2 4 85.263 0.117 16 0.00732 79.007BCW2226G 3 2 4 77.304 0.117 16 0.00734 71.815BCZ22XAG 3 2 4 9.908 0.119 16 0.00742 9.311BCW31X6G 3 3 5 80.265 0.124 16 0.00773 78.582BCW31X7G 3 3 5 80.960 0.123 16 0.00772 79.071BCW31X9G 3 3 5 78.020 0.125 16 0.00779 76.971BCW3121G 4 3 6 74.900 0.128 16 0.00799 75.715BCW3122G 4 3 6 75.154 0.127 16 0.00795 75.630BCW3123G 4 3 6 75.268 0.127 16 0.00792 75.446BCZ31X9G 4 3 6 7.193 0.128 16 0.00801 7.293BCZ32X9G 4 3 6 8.332 0.127 16 0.00793 8.367
Average 78.182 9.195 Averagenorm 0.00780 76.979 9.142Standard Dev. 5.802 1.621 Standard Dev.norm 6.540 1.520
Coeff. of Var. [%] 7.421 17.627 Coeff. of Var. [%]norm 8.496 16.629Min. 61.895 7.193 Min. 0.0073 60.340 7.293Max. 86.821 11.543 Max. 0.0081 89.414 11.299
Number of Spec. 18 6 Number of Spec. 18 6
90° Compression -- (ETD)Strength & Modulus
Fiberite 7740/T650 3K-70-PW Graphite

70
0
1
2
3
4
5
6
0 20 40 60 80 100 120 140 160 180 200
90° Compression Strength [ksi]
ASAP
Bat
ch #
0
1
2
3
Prepeg Lot #
90° Compression -- (ETD)Normalized Strength
Fiberite 7740/T650 3K-70-PW Graphite
Pooled Average = 76.979 [ksi]Pooled Standard Deviation = 6.540 [ksi]Pooled Coeff. of Variation = 8.496 [%]
0
1
2
3
4
5
6
0.0 1.0 2.0 3.0 4.0 5.0 6.0 7.0 8.0 9.0 10.0 11.0 12.0 13.0 14.0 15.0 16.0 17.0 18.0
90° Compression Modulus [Msi]
ASAP
Bat
ch #
0
1
2
3
Prepreg Lot #
90° Compression -- (ETD)Normalized Modulus
Fiberite 7740/T650 3K-70-PW Graphite
Pooled Average = 9.142 [Msi]Pooled Standard Deviation = 1.520 [Msi]Pooled Coeff. of Variation = 16.629 [%]

71
Specimen Cure Prepreg ASAP Strength Modulus Avg. Specimen # Plies in Avg. tplyNumber Cycle Lot # Batch # [ksi] [Msi] Thickn. [in] Laminate [in]
BCN1116A 1 1 1 18.868 0.624 0.145 18 0.00805BCN1117A 1 1 1 18.944 0.146 18 0.00812BCN1118A 1 1 1 19.074 0.146 18 0.00810BCN1119A 1 1 1 18.924 0.146 18 0.00809BCN111AA 1 1 1 19.139 0.146 18 0.00810BCN1216A 4 1 2 19.024 0.655 0.146 18 0.00814BCN1217A 4 1 2 19.081 0.140 18 0.00778BCN1218A 4 1 2 18.711 0.146 18 0.00811BCN1219A 4 1 2 18.773 0.146 18 0.00812BCN121AA 4 1 2 18.797 0.145 18 0.00806BCN2116A 2 2 3 18.901 0.714 0.142 18 0.00786BCN2117A 2 2 3 18.392 0.142 18 0.00788BCN2118A 2 2 3 18.399 0.142 18 0.00790BCN2119A 2 2 3 18.563 0.140 18 0.00780BCN211AA 2 2 3 18.352 0.141 18 0.00785BCN2216A 3 2 4 18.442 0.697 0.142 18 0.00790BCN2217A 3 2 4 18.474 0.136 18 0.00753BCN2218A 3 2 4 18.323 0.142 18 0.00790BCN2219A 3 2 4 17.710 0.142 18 0.00787BCN221AA 3 2 4 18.244 0.142 18 0.00789BCN3112A 3 3 5 19.526 0.695 0.148 18 0.00820BCN3113A 3 3 5 19.045 0.149 18 0.00826BCN3114A 3 3 5 19.339 0.149 18 0.00825BCN3115A 3 3 5 19.189 0.149 18 0.00826BCN3216A 4 3 6 19.333 0.619 0.140 18 0.00778BCN3217A 4 3 6 18.969 0.141 18 0.00783BCN3218A 4 3 6 19.227 0.140 18 0.00779BCN321AA 4 3 6 19.111 0.142 18 0.00786
Average 18.817 0.667 0.0080Standard Dev. 0.410 0.040
Coeff. of Var. [%] 2.178 6.049Min. 17.710 0.619 Min. 0.0075Max. 19.526 0.714 Max. 0.0083
Number of Spec. 28 6
In-Plane Shear -- (RTD)Strength & Modulus
Fiberite 7740/T650 3K-70-PW Graphite
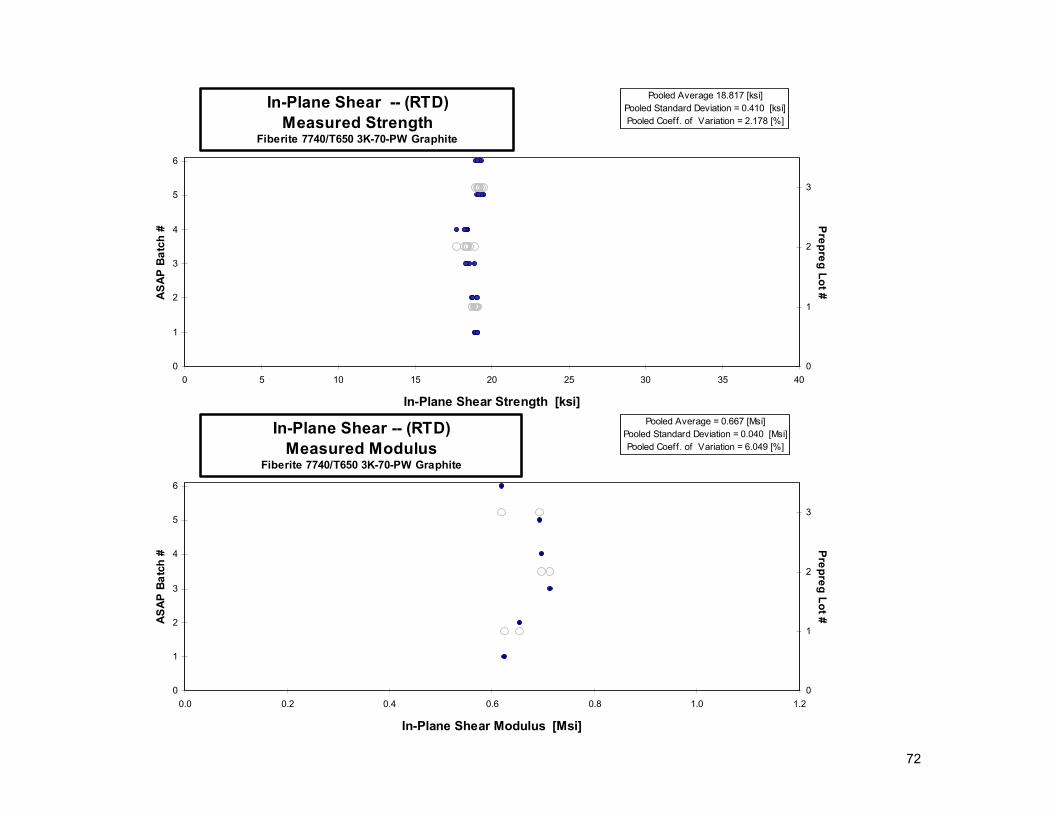
72
0
1
2
3
4
5
6
0 5 10 15 20 25 30 35 40
In-Plane Shear Strength [ksi]
ASAP
Bat
ch #
0
1
2
3
Prepreg Lot #
In-Plane Shear -- (RTD)Measured Strength
Fiberite 7740/T650 3K-70-PW Graphite
Pooled Average 18.817 [ksi]Pooled Standard Deviation = 0.410 [ksi]Pooled Coeff. of Variation = 2.178 [%]
0
1
2
3
4
5
6
0.0 0.2 0.4 0.6 0.8 1.0 1.2
In-Plane Shear Modulus [Msi]
ASAP
Bat
ch #
0
1
2
3
Prepreg Lot #
In-Plane Shear -- (RTD)Measured Modulus
Fiberite 7740/T650 3K-70-PW Graphite
Pooled Average = 0.667 [Msi]Pooled Standard Deviation = 0.040 [Msi]Pooled Coeff. of Variation = 6.049 [%]

73
Specimen Cure Prepreg ASAP Strength Modulus Avg. Specimen # Plies in Avg. tplyNumber Cycle Lot # Batch # [ksi] [Msi] Thickn. [in] Laminate [in]
BCN1128B 1 1 1 24.360 0.799 0.144 18 0.00799BCN1129B 1 1 1 24.386 0.144 18 0.00801BCN112AB 1 1 1 24.349 0.143 18 0.00792BCN1226B 4 1 2 23.195 0.630 0.143 18 0.00796BCN1227B 4 1 2 24.537 0.143 18 0.00792BCN1228B 4 1 2 23.630 0.144 18 0.00799
Average 24.076 0.715 0.0080Standard Dev. 0.537 0.120
Coeff. of Var. [%] 2.228 16.788Min. 23.195 0.630 Min. 0.0079Max. 24.537 0.799 Max. 0.0080
Number of Spec. 6 2
In-Plane Shear -- (CTD)Strength & Modulus
Fiberite 7740/T650 3K-70-PW Graphite

74
0
1
2
3
4
5
6
0 5 10 15 20 25 30 35 40
In-Plane Shear Strength [ksi]
ASAP
Bat
ch #
0
1
2
3
Prepreg Lot #
In-Plane Shear -- (CTD)Measured Strength
Fiberite 7740/T650 3K-70-PW Graphite
Pooled Average 24.076 [ksi]Pooled Standard Deviation = 0.537 [ksi]Pooled Coeff. of Variation = 2.228 [%]
0
1
2
3
4
5
6
0.0 0.2 0.4 0.6 0.8 1.0 1.2
In-Plane Shear Modulus [Msi]
ASAP
Bat
ch #
0
1
2
3
Prepreg Lot #
In-Plane Shear -- (CTD)Measured Modulus
Fiberite 7740/T650 3K-70-PW Graphite
Pooled Average = 0.715 [Msi]Pooled Standard Deviation = 0.120 [Msi]Pooled Coeff. of Variation = 16.788 [%]

75
Specimen Cure Prepreg ASAP Strength Modulus Avg. Specimen # Plies in Avg. tplyNumber Cycle Lot # Batch # [ksi] [Msi] Thickn. [in] Laminate [in]
BCN1112F 1 1 1 10.353 0.144 18 0.00800BCN1113F 1 1 1 11.351 0.433 0.145 18 0.00803BCN1114F 1 1 1 11.420 0.143 18 0.00792BCN1115F 1 1 1 11.051 0.146 18 0.00812BCN1212F 4 1 2 10.229 0.146 18 0.00811BCN1213F 4 1 2 11.565 0.464 0.146 18 0.00812BCN1214F 4 1 2 10.673 0.145 18 0.00804BCN1215F 4 1 2 10.526 0.147 18 0.00816BCN2112F 2 2 3 10.700 0.142 18 0.00790BCN2113F 2 2 3 10.189 0.406 0.142 18 0.00791BCN2114F 2 2 3 10.841 0.143 18 0.00793BCN2115F 2 2 3 10.490 0.142 18 0.00789BCN2212F 3 2 4 10.338 0.140 18 0.00780BCN2213F 3 2 4 10.180 0.408 0.141 18 0.00783BCN2214F 3 2 4 10.040 0.141 18 0.00781BCN2215F 3 2 4 10.365 0.140 18 0.00777BCN3126F 3 3 5 10.738 0.147 18 0.00816BCN3127F 3 3 5 11.748 0.427 0.146 18 0.00811BCN3128F 3 3 5 11.533 0.148 18 0.00820BCN312AF 3 3 5 11.486 0.137 18 0.00763BCN3212F 4 3 6 10.762 0.143 18 0.00792BCN3213F 4 3 6 11.870 0.421 0.142 18 0.00790BCN3214F 4 3 6 10.943 0.141 18 0.00783BCN3215F 4 3 6 11.223 0.141 18 0.00785
Average 10.859 0.426 0.0080Standard Dev. 0.551 0.021
Coeff. of Var. [%] 5.071 4.959Min. 10.040 0.406 Min. 0.0076Max. 11.870 0.464 Max. 0.0082
Number of Spec. 24 6
In-Plane Shear -- (ETW)Strength & Modulus
Fiberite 7740/T650 3K-70-PW Graphite

76
0
1
2
3
4
5
6
0 5 10 15 20 25 30 35 40
In-Plane Shear Strength [ksi]
ASAP
Bat
ch #
0
1
2
3
Prepreg Lot #
In-Plane Shear -- (ETW)Measured Strength
Fiberite 7740/T650 3K-70-PW Graphite
Pooled Average 10.859 [ksi]Pooled Standard Deviation = 0.551 [ksi]Pooled Coeff. of Variation = 5.071 [%]
0
1
2
3
4
5
6
0.0 0.2 0.4 0.6 0.8 1.0 1.2
In-Plane Shear Modulus [Msi]
ASAP
Bat
ch #
0
1
2
3
Prepreg Lot #
In-Plane Shear -- (ETW)Measured Modulus
Fiberite 7740/T650 3K-70-PW Graphite
Pooled Average = 0.426 [Msi]Pooled Standard Deviation = 0.021 [Msi]Pooled Coeff. of Variation = 4.959 [%]
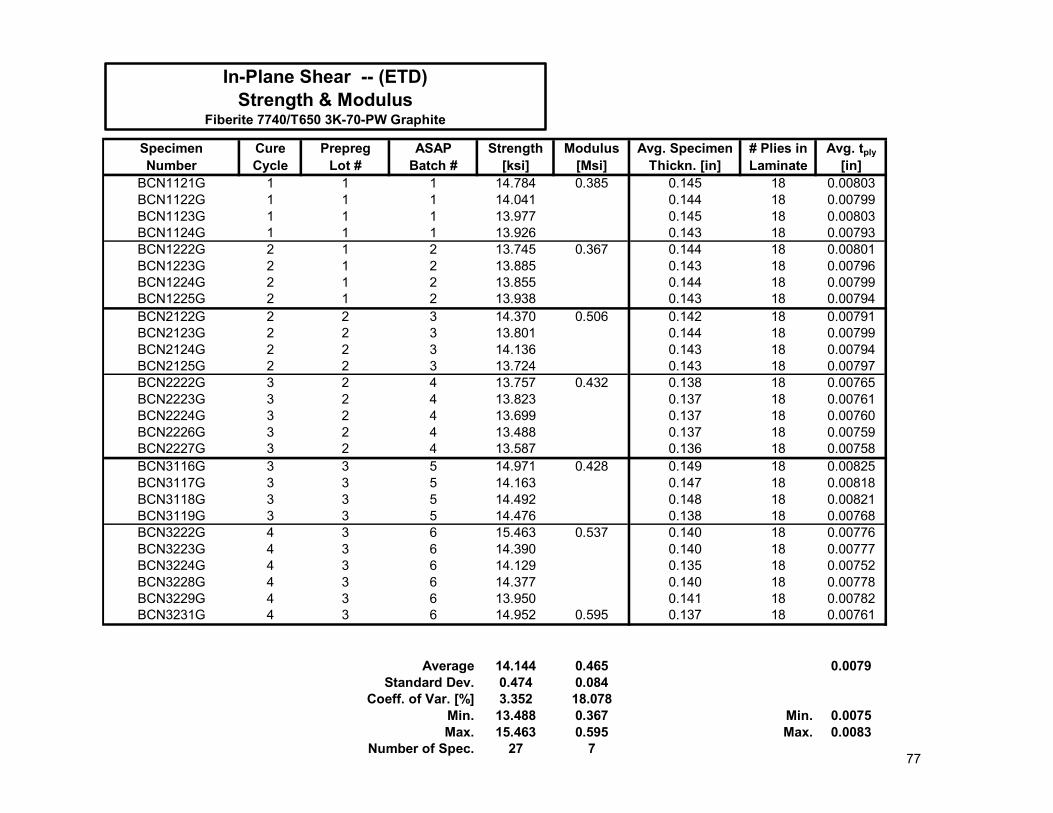
77
Specimen Cure Prepreg ASAP Strength Modulus Avg. Specimen # Plies in Avg. tplyNumber Cycle Lot # Batch # [ksi] [Msi] Thickn. [in] Laminate [in]
BCN1121G 1 1 1 14.784 0.385 0.145 18 0.00803BCN1122G 1 1 1 14.041 0.144 18 0.00799BCN1123G 1 1 1 13.977 0.145 18 0.00803BCN1124G 1 1 1 13.926 0.143 18 0.00793BCN1222G 2 1 2 13.745 0.367 0.144 18 0.00801BCN1223G 2 1 2 13.885 0.143 18 0.00796BCN1224G 2 1 2 13.855 0.144 18 0.00799BCN1225G 2 1 2 13.938 0.143 18 0.00794BCN2122G 2 2 3 14.370 0.506 0.142 18 0.00791BCN2123G 2 2 3 13.801 0.144 18 0.00799BCN2124G 2 2 3 14.136 0.143 18 0.00794BCN2125G 2 2 3 13.724 0.143 18 0.00797BCN2222G 3 2 4 13.757 0.432 0.138 18 0.00765BCN2223G 3 2 4 13.823 0.137 18 0.00761BCN2224G 3 2 4 13.699 0.137 18 0.00760BCN2226G 3 2 4 13.488 0.137 18 0.00759BCN2227G 3 2 4 13.587 0.136 18 0.00758BCN3116G 3 3 5 14.971 0.428 0.149 18 0.00825BCN3117G 3 3 5 14.163 0.147 18 0.00818BCN3118G 3 3 5 14.492 0.148 18 0.00821BCN3119G 3 3 5 14.476 0.138 18 0.00768BCN3222G 4 3 6 15.463 0.537 0.140 18 0.00776BCN3223G 4 3 6 14.390 0.140 18 0.00777BCN3224G 4 3 6 14.129 0.135 18 0.00752BCN3228G 4 3 6 14.377 0.140 18 0.00778BCN3229G 4 3 6 13.950 0.141 18 0.00782BCN3231G 4 3 6 14.952 0.595 0.137 18 0.00761
Average 14.144 0.465 0.0079Standard Dev. 0.474 0.084
Coeff. of Var. [%] 3.352 18.078Min. 13.488 0.367 Min. 0.0075Max. 15.463 0.595 Max. 0.0083
Number of Spec. 27 7
In-Plane Shear -- (ETD)Strength & Modulus
Fiberite 7740/T650 3K-70-PW Graphite

78
0
1
2
3
4
5
6
0 5 10 15 20 25 30 35 40
In-Plane Shear Strength [ksi]
ASAP
Bat
ch #
0
1
2
3
Prepreg Lot #
In-Plane Shear -- (ETD)Measured Strength
Fiberite 7740/T650 3K-70-PW Graphite
Pooled Average 14.144 [ksi]Pooled Standard Deviation = 0.474 [ksi]Pooled Coeff. of Variation = 3.352 [%]
0
1
2
3
4
5
6
0.0 0.2 0.4 0.6 0.8 1.0 1.2
In-Plane Shear Modulus [Msi]
ASAP
Bat
ch #
0
1
2
3
Prepreg Lot #
In-Plane Shear -- (ETD)Measured Modulus
Fiberite 7740/T650 3K-70-PW Graphite
Pooled Average = 0.465 [Msi]Pooled Standard Deviation = 0.084 [Msi]Pooled Coeff. of Variation = 18.078 [%]

79
Specimen Cure Prepreg ASAP Strength Avg. Specimen # Plies in Avg. tplyNumber Cycle Lot # Batch # [ksi] Thickn. [in] Laminate [in]
BCQ1111A 1 1 10.907 0.111 14 0.00790BCQ1112A 1 1 11.037 0.110 14 0.00787BCQ1113A 1 1 10.948 0.110 14 0.00784BCQ1114A 1 1 11.237 0.113 14 0.00805BCQ1115A 1 1 10.513 0.112 14 0.00799BCQ1116A 1 1 11.185 0.111 14 0.00791BCQ2111A 2 2 11.028 0.108 14 0.00773BCQ2112A 2 2 11.050 0.107 14 0.00761BCQ2113A 2 2 10.695 0.109 14 0.00778BCQ2114A 2 2 10.498 0.109 14 0.00776BCQ2115A 2 2 10.592 0.108 14 0.00768BCQ2116A 2 2 10.234 0.107 14 0.00768BCQ3111A 3 3 10.161 0.102 14 0.00729BCQ3112A 3 3 10.460 0.101 14 0.00719BCQ3113A 3 3 10.569 0.102 14 0.00731BCQ3114A 3 3 10.188 0.102 14 0.00729BCQ3115A 3 3 10.554 0.102 14 0.00727BCQ3116A 3 3 10.359 0.102 14 0.00729
Average 10.679 0.0076Standard Dev. 0.346
Coeff. of Var. [%] 3.239Min. 10.161 Min. 0.0072Max. 11.237 Max. 0.0081
Number of Spec. 18
Apparent Interlaminar Shear -- (RTD)Strength
Fiberite 7740/T650 3K-70-PW Graphite Fabric

80
0
1
2
3
0 2 4 6 8 10 12 14 16 18 20
Apparent Interlaminar Shear Strength [ksi]
ASAP
Bat
ch #
0
1
2
3
Prepreg Lot #
Apparent Interlaminar Shear -- (RTD)Measured Strength
Fiberite 7740/T650 3K-70-PW Graphite Fabric
Pooled Average = 10.679 [ksi]Pooled Standard Deviation = 0.346 [ksi]Pooled Coeff. of Variation = 3.239 [%]

81
3.2.2 Fluid Sensitivity Raw Data Spreadsheets and Scatter Charts

82
Specimen Batch Strength Avg. Specimen # Plies in Avg. tply
Number Number [ksi] Thickn. [in] Laminate [in]BCN3237T 3 18.574 0.142 18 0.00789BCN1229T 1 18.986 0.143 18 0.00795BCN122AT 1 18.884 0.144 18 0.00800BCN222AT 2 18.037 0.136 18 0.00758BCN322AT 3 18.503 0.140 18 0.00778
Average 18.597 0.0078Standard Dev. 0.373
Coeff. of Var. [%] 2.006Min. 18.037 Min. 0.0076Max. 18.986 Max. 0.0080
Number of Spec. 5
In-Plane Shear -- (MEK - RTD)Strength
Fiberite 7740/T650 3K-70-PW Graphite
0
1
2
3
0 5 10 15 20 25 30 35 40
In-Plane Shear Strength [ksi]
Bat
ch #
In-Plane Shear -- (MEK - RTD)Measured Strength
Fiberite 7740/T650 3K-70-PW Graphite
Pooled Average = 18.597 [ksi]Pooled Standard Deviation = 0.373 [ksi]Pooled Coeff. of Variation = 2.006 [%]

83
Specimen Batch Strength Avg. Specimen # Plies in Avg. tply
Number Number [ksi] Thickn. [in] Laminate [in]BCN3232R 3 13.894 0.141 18 0.00782BCN3233R 3 13.625 0.142 18 0.00787BCN3234R 3 13.831 0.142 18 0.00787BCN3235R 3 13.519 0.143 18 0.00792BCN3236R 3 13.554 0.143 18 0.00793
Average 13.685 0.0079Standard Dev. 0.168
Coeff. of Var. [%] 1.231Min. 13.519 Min. 0.0078Max. 13.894 Max. 0.0079
Number of Spec. 5
In-Plane Shear -- (JP-4 JET FUEL - ETD)Strength
Fiberite 7740/T650 3K-70-PW Graphite
0
1
2
3
0 5 10 15 20 25 30 35 40
In-Plane Shear Strength [ksi]
Bat
ch #
In-Plane Shear -- (JP-4 JET FUEL - ETD)
Measured Strength
Pooled Average = 13.685 [ksi]Pooled Standard Deviation = 0.168 [ksi]Pooled Coeff. of Variation = 1.231 [%]
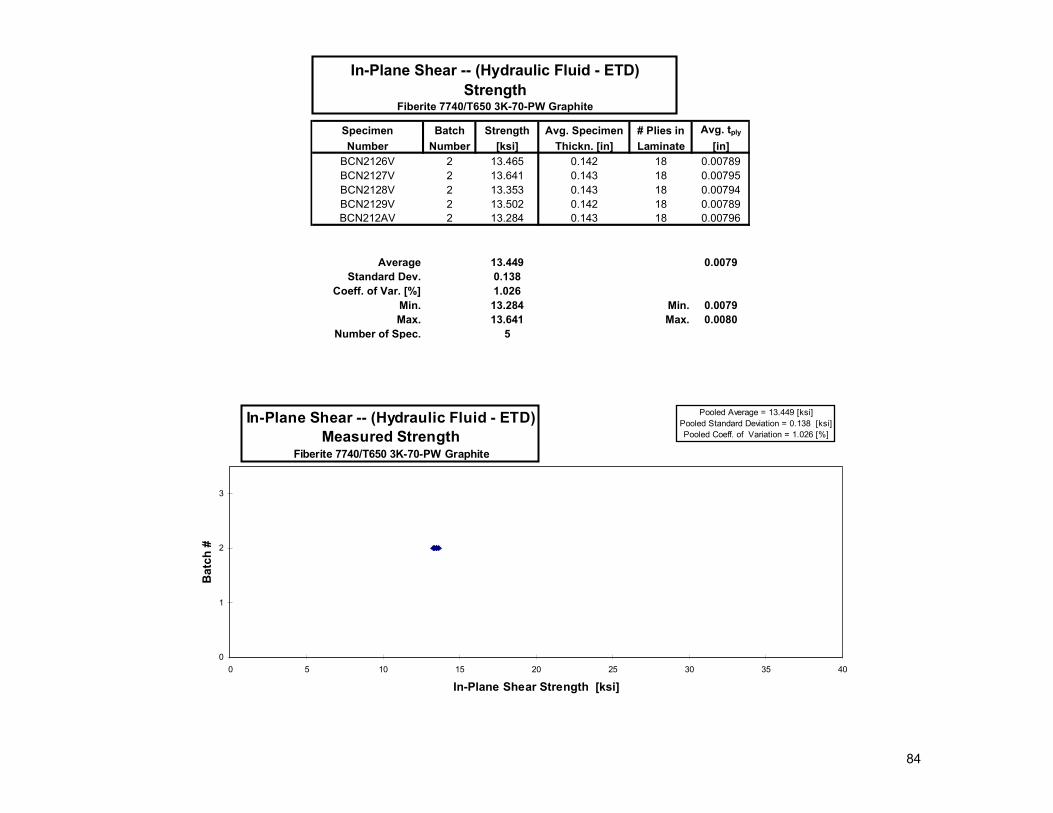
84
Specimen Batch Strength Avg. Specimen # Plies in Avg. tply
Number Number [ksi] Thickn. [in] Laminate [in]BCN2126V 2 13.465 0.142 18 0.00789BCN2127V 2 13.641 0.143 18 0.00795BCN2128V 2 13.353 0.143 18 0.00794BCN2129V 2 13.502 0.142 18 0.00789BCN212AV 2 13.284 0.143 18 0.00796
Average 13.449 0.0079Standard Dev. 0.138
Coeff. of Var. [%] 1.026Min. 13.284 Min. 0.0079Max. 13.641 Max. 0.0080
Number of Spec. 5
In-Plane Shear -- (Hydraulic Fluid - ETD)Strength
Fiberite 7740/T650 3K-70-PW Graphite
0
1
2
3
0 5 10 15 20 25 30 35 40
In-Plane Shear Strength [ksi]
Bat
ch #
In-Plane Shear -- (Hydraulic Fluid - ETD)Measured Strength
Fiberite 7740/T650 3K-70-PW Graphite
Pooled Average = 13.449 [ksi]Pooled Standard Deviation = 0.138 [ksi]Pooled Coeff. of Variation = 1.026 [%]

85
Fluid Sensitivity Comparison: Average In-Plane Shear Strength
with Fluid (ksi) Same Environment In-Plane Shear Strength without Fluid (ksi)
Worst Case Environment In-Plane Shear Strength (ksi)
MEK (RTD)
18.60
(RTD)
18.82
(ETW)
10.86 The RTD average in-plane shear strength was reduced by 1% after exposure to MEK. However it remained 71% higher than water exposure in ETW conditions. Average In-Plane Shear Strength
with Fluid (ksi) Same Environment In-Plane Shear Strength without Fluid (ksi)
Worst Case Environment In-Plane Shear Strength (ksi)
JP-4 JET FUEL (ETD)
13.69
(ETD)
14.14
(ETW)
10.86
The ETD average in-plane shear strength was reduced by 3% after exposure to MEK. However it remained 26% higher than water exposure in ETW conditions. Average In-Plane Shear Strength
with Fluid (ksi) Same Environment In-Plane Shear Strength without Fluid (ksi)
Worst Case Environment In-Plane Shear Strength (ksi)
HYDRAULIC FLUID (ETD)
13.45
(ETD)
14.14
(ETW)
10.86 The ETD average in-plane shear strength was reduced by 5% after exposure to MEK. However it remained 24% higher than water exposure in ETW conditions.

86
3.2.3 Representative Shear Stress-Strain Curve
The following stress-strain curve is representative of the T650 3K-70-PW / 7740 prepreg system. The tension and compression stress-strain curves are not presented in graphical form. If strain design allowables from these tests are required, simple one-dimensional linear stress-strain relationships may be used to obtain corresponding strain design values. This process should approximate tensile and compressive strain behavior relatively well but may produce extremely conservative strain values in shear due to the nonlinear behavior. A more realistic approach for shear strain design allowables is to use a maximum strain value of 5% (reference MIL-HDBK-17-1E, section 5.7.6). If a nonlinear analysis of the material’s shear behavior is required, the curve-fit of the shear stress-strain curve may be used. The representative shear stress-strain curve was obtained by taking the average of all the sample shear curves and determining the best-fit line through the data. The actual data points also presented on the chart to demonstrate material variability.

87
Shear Stress vs. Shear Strain, RTD
0
2000
4000
6000
8000
10000
12000
14000
16000
0 0.02 0.04 0.06 0.08 0.1 0.12
Shear Strain [in/in]
Shea
r Str
ess
[psi
]
y-1 = a+blnx/xr2 = 0.99986629
a = 6.8382568e-05b = -2.2176645e-07
88
3.3 Statistical Results

89
3.3.1 Plot by Condition

90
DISTRIBUTION OF GROUPED DATA FOR DIFFERENT TEST CONDITIONS
0.00
0.20
0.40
0.60
0.80
1.00
1.20
0.60 20.60 40.60 60.60 80.60 100.60 120.60 140.60 160.60 180.60 200.60
PRO
BA
BIL
ITY
OF
SUR
VIVA
L
CTDRTDETDETWNO DATANORMAL CURVENORMAL CURVENORMAL CURVENORMAL CURVENORMAL CURVE
0° Tension - BCJXXXXX Measured
Fiberite 7740/T650 3K-70-PW GraphiteCessna

91
DISTRIBUTION OF GROUPED DATA FOR DIFFERENT TEST CONDITIONS
0.00
0.20
0.40
0.60
0.80
1.00
1.20
0.60 50.60 100.60 150.60 200.60 250.60
PRO
BA
BIL
ITY
OF
SUR
VIVA
L
CTDRTDETDETWNO DATANORMAL CURVENORMAL CURVENORMAL CURVENORMAL CURVENORMAL CURVE
0° Tension - BCJXXXXX Normalized
Fiberite 7740/T650 3K-70-PW GraphiteCessna

92
DISTRIBUTION OF GROUPED DATA FOR DIFFERENT TEST CONDITIONS
0.00
0.20
0.40
0.60
0.80
1.00
1.20
0.60 50.60 100.60 150.60 200.60 250.60
PRO
BAB
ILIT
Y O
F SU
RVI
VAL
CTDRTDETDETWNO DATANORMAL CURVENORMAL CURVENORMAL CURVENORMAL CURVENORMAL CURVE
90° Tension - BCUXXXXX Measured
Fiberite 7740/T650 3K-70-PW GraphiteCessna

93
DISTRIBUTION OF GROUPED DATA FOR DIFFERENT TEST CONDITIONS
0.00
0.20
0.40
0.60
0.80
1.00
1.20
0.60 50.60 100.60 150.60 200.60 250.60
PRO
BAB
ILIT
Y O
F SU
RVI
VAL
CTDRTDETDETWNO DATANORMAL CURVENORMAL CURVENORMAL CURVENORMAL CURVENORMAL CURVE
90° Tension - BCUXXXXX Normalized
Fiberite 7740/T650 3K-70-PW GraphiteCessna

94
DISTRIBUTION OF GROUPED DATA FOR DIFFERENT TEST CONDITIONS
0.00
0.20
0.40
0.60
0.80
1.00
1.20
0.60 20.60 40.60 60.60 80.60 100.60 120.60 140.60 160.60 180.60
PRO
BA
BIL
ITY
OF
SUR
VIVA
L
CTDRTDETDETWNO DATANORMAL CURVENORMAL CURVENORMAL CURVENORMAL CURVENORMAL CURVE
0° Compression - BCKXXXXX Measured
Fiberite 7740/T650 3K-70-PW GraphiteCessna

95
DISTRIBUTION OF GROUPED DATA FOR DIFFERENT TEST CONDITIONS
0.00
0.20
0.40
0.60
0.80
1.00
1.20
0.60 20.60 40.60 60.60 80.60 100.60 120.60 140.60 160.60 180.60
PRO
BAB
ILIT
Y O
F SU
RVI
VAL
CTDRTDETDETWNO DATANORMAL CURVENORMAL CURVENORMAL CURVENORMAL CURVENORMAL CURVE
0° Compression - BCKXXXXX Normalized
Fiberite 7740/T650 3K-70-PW GraphiteCessna

96
DISTRIBUTION OF GROUPED DATA FOR DIFFERENT TEST CONDITIONS
0.00
0.20
0.40
0.60
0.80
1.00
1.20
0.60 20.60 40.60 60.60 80.60 100.60 120.60 140.60 160.60 180.60
PRO
BAB
ILIT
Y O
F SU
RVI
VAL
CTDRTDETDETWNO DATANORMAL CURVENORMAL CURVENORMAL CURVENORMAL CURVENORMAL CURVE
90° Compression - BCWXXXXX Measured
Fiberite 7740/T650 3K-70-PW GraphiteCessna

97
DISTRIBUTION OF GROUPED DATA FOR DIFFERENT TEST CONDITIONS
0.00
0.20
0.40
0.60
0.80
1.00
1.20
0.60 20.60 40.60 60.60 80.60 100.60 120.60 140.60 160.60 180.60 200.60
PRO
BAB
ILIT
Y O
F SU
RVI
VAL
CTDRTDETDETWNO DATANORMAL CURVENORMAL CURVENORMAL CURVENORMAL CURVENORMAL CURVE
90° Compression - BCWXXXXX Normalized
Fiberite 7740/T650 3K-70-PW GraphiteCessna
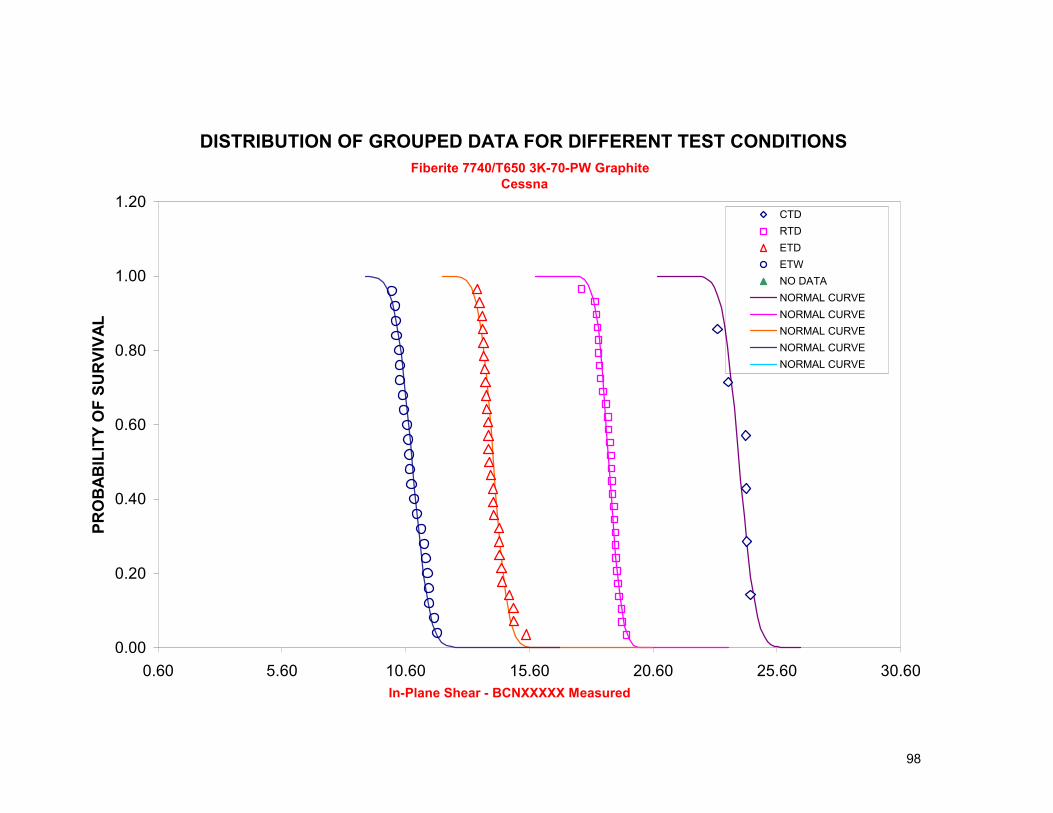
98
DISTRIBUTION OF GROUPED DATA FOR DIFFERENT TEST CONDITIONS
0.00
0.20
0.40
0.60
0.80
1.00
1.20
0.60 5.60 10.60 15.60 20.60 25.60 30.60
PRO
BAB
ILIT
Y O
F SU
RVI
VAL
CTDRTDETDETWNO DATANORMAL CURVENORMAL CURVENORMAL CURVENORMAL CURVENORMAL CURVE
In-Plane Shear - BCNXXXXX Measured
Fiberite 7740/T650 3K-70-PW GraphiteCessna

99
DISTRIBUTION OF GROUPED DATA FOR DIFFERENT TEST CONDITIONS
0.00
0.20
0.40
0.60
0.80
1.00
1.20
0.60 2.60 4.60 6.60 8.60 10.60 12.60 14.60
PRO
BAB
ILIT
Y O
F SU
RVI
VAL
CTDRTDETDETWNO DATANORMAL CURVENORMAL CURVENORMAL CURVENORMAL CURVENORMAL CURVE
Apparent Interlaminar Shear - BCQXXXXX Measured
Fiberite 7740/T650 3K-70-PW GraphiteCessna

100
3.3.2 Plot of Pooled Data

101
DISTRIBUTION OF POOLED DATA
0.0
0.1
0.2
0.3
0.4
0.5
0.6
0.7
0.8
0.9
1.0
0.40 0.50 0.60 0.70 0.80 0.90 1.00 1.10 1.20
NORMALIZED VALUE
PRO
BA
BIL
ITY
OF
SUR
VIVA
L
Fiberite 7740/T650 3K-70-PW Graphite
Cessna0° Tension - BCJXXXXX Measured

102
DISTRIBUTION OF POOLED DATA
0.0
0.1
0.2
0.3
0.4
0.5
0.6
0.7
0.8
0.9
1.0
0.40 0.50 0.60 0.70 0.80 0.90 1.00 1.10 1.20
NORMALIZED VALUE
PRO
BA
BIL
ITY
OF
SUR
VIVA
L
Fiberite 7740/T650 3K-70-PW Graphite
Cessna
0° Tension - BCJXXXXX Normalized

103
DISTRIBUTION OF POOLED DATA
0.0
0.1
0.2
0.3
0.4
0.5
0.6
0.7
0.8
0.9
1.0
0.40 0.50 0.60 0.70 0.80 0.90 1.00 1.10 1.20
NORMALIZED VALUE
PRO
BAB
ILIT
Y O
F SU
RVIV
AL
Fiberite 7740/T650 3K-70-PW Graphite
Cessna
90° Tension - BCUXXXXX Measured

104
DISTRIBUTION OF POOLED DATA
0.0
0.1
0.2
0.3
0.4
0.5
0.6
0.7
0.8
0.9
1.0
0.40 0.50 0.60 0.70 0.80 0.90 1.00 1.10 1.20
NORMALIZED VALUE
PRO
BAB
ILIT
Y O
F SU
RVIV
AL
Fiberite 7740/T650 3K-70-PW Graphite
Cessna
90° Tension - BCUXXXXX Normalized

105
DISTRIBUTION OF POOLED DATA
0.0
0.1
0.2
0.3
0.4
0.5
0.6
0.7
0.8
0.9
1.0
0.40 0.50 0.60 0.70 0.80 0.90 1.00 1.10 1.20 1.30 1.40
NORMALIZED VALUE
PRO
BA
BIL
ITY
OF
SUR
VIVA
L
Fiberite 7740/T650 3K-70-PW Graphite
Cessna
0° Compression - BCKXXXXX Measured

106
DISTRIBUTION OF POOLED DATA
0.0
0.1
0.2
0.3
0.4
0.5
0.6
0.7
0.8
0.9
1.0
0.40 0.50 0.60 0.70 0.80 0.90 1.00 1.10 1.20 1.30 1.40
NORMALIZED VALUE
PRO
BAB
ILIT
Y O
F SU
RVIV
AL
Fiberite 7740/T650 3K-70-PW Graphite
Cessna
0° Compression - BCKXXXXX Normalized
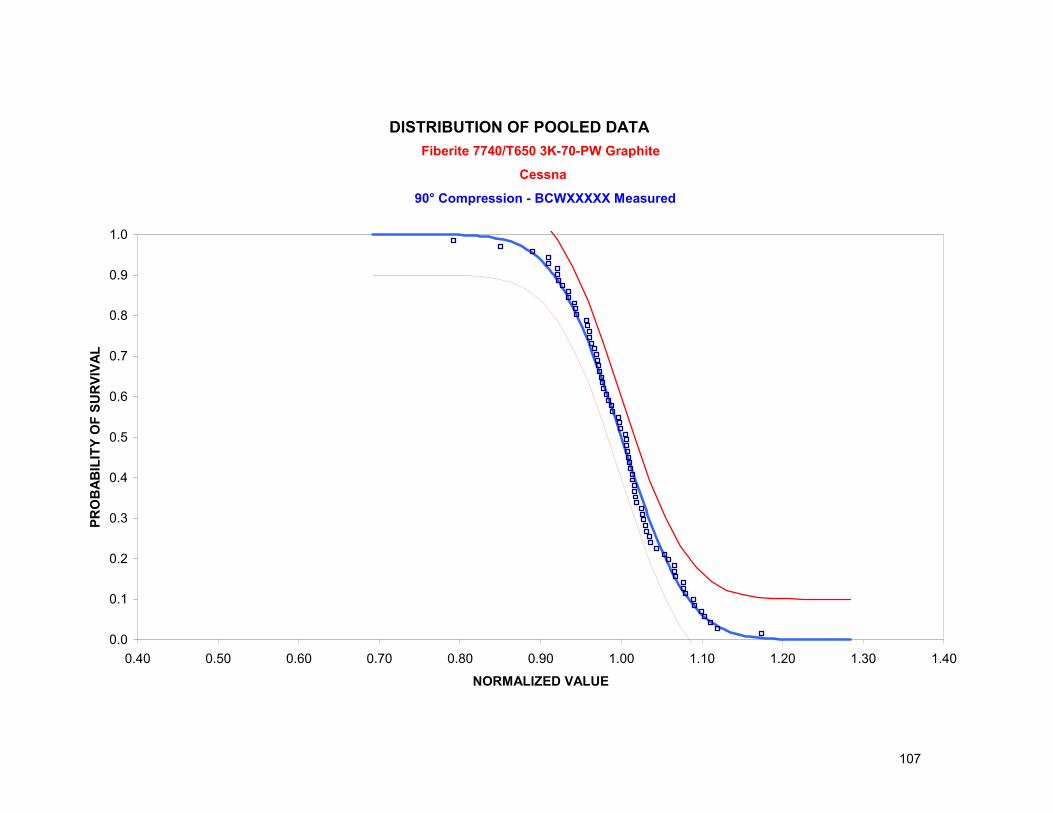
107
DISTRIBUTION OF POOLED DATA
0.0
0.1
0.2
0.3
0.4
0.5
0.6
0.7
0.8
0.9
1.0
0.40 0.50 0.60 0.70 0.80 0.90 1.00 1.10 1.20 1.30 1.40
NORMALIZED VALUE
PRO
BAB
ILIT
Y O
F SU
RVIV
AL
Fiberite 7740/T650 3K-70-PW Graphite
Cessna
90° Compression - BCWXXXXX Measured

108
DISTRIBUTION OF POOLED DATA
0.0
0.1
0.2
0.3
0.4
0.5
0.6
0.7
0.8
0.9
1.0
0.40 0.50 0.60 0.70 0.80 0.90 1.00 1.10 1.20 1.30 1.40
NORMALIZED VALUE
PRO
BAB
ILIT
Y O
F SU
RVIV
AL
Fiberite 7740/T650 3K-70-PW Graphite
Cessna
90° Compression - BCWXXXXX Normalized
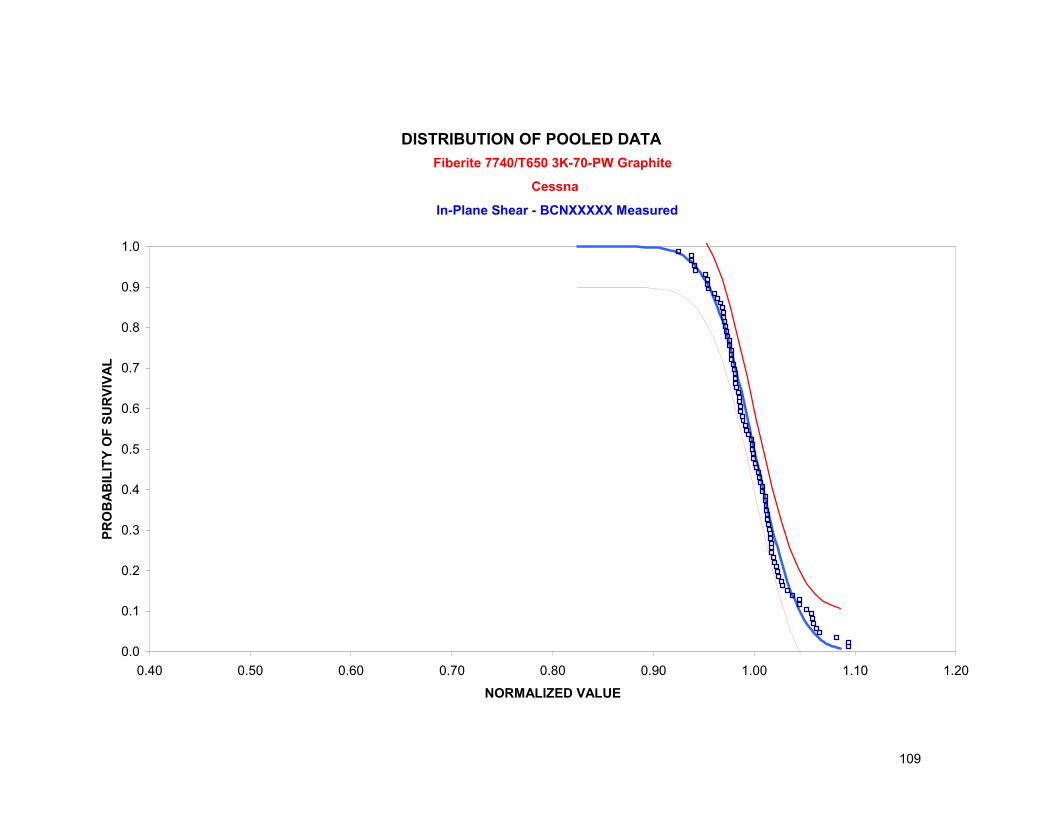
109
DISTRIBUTION OF POOLED DATA
0.0
0.1
0.2
0.3
0.4
0.5
0.6
0.7
0.8
0.9
1.0
0.40 0.50 0.60 0.70 0.80 0.90 1.00 1.10 1.20
NORMALIZED VALUE
PRO
BAB
ILIT
Y O
F SU
RVIV
AL
Fiberite 7740/T650 3K-70-PW Graphite
Cessna
In-Plane Shear - BCNXXXXX Measured
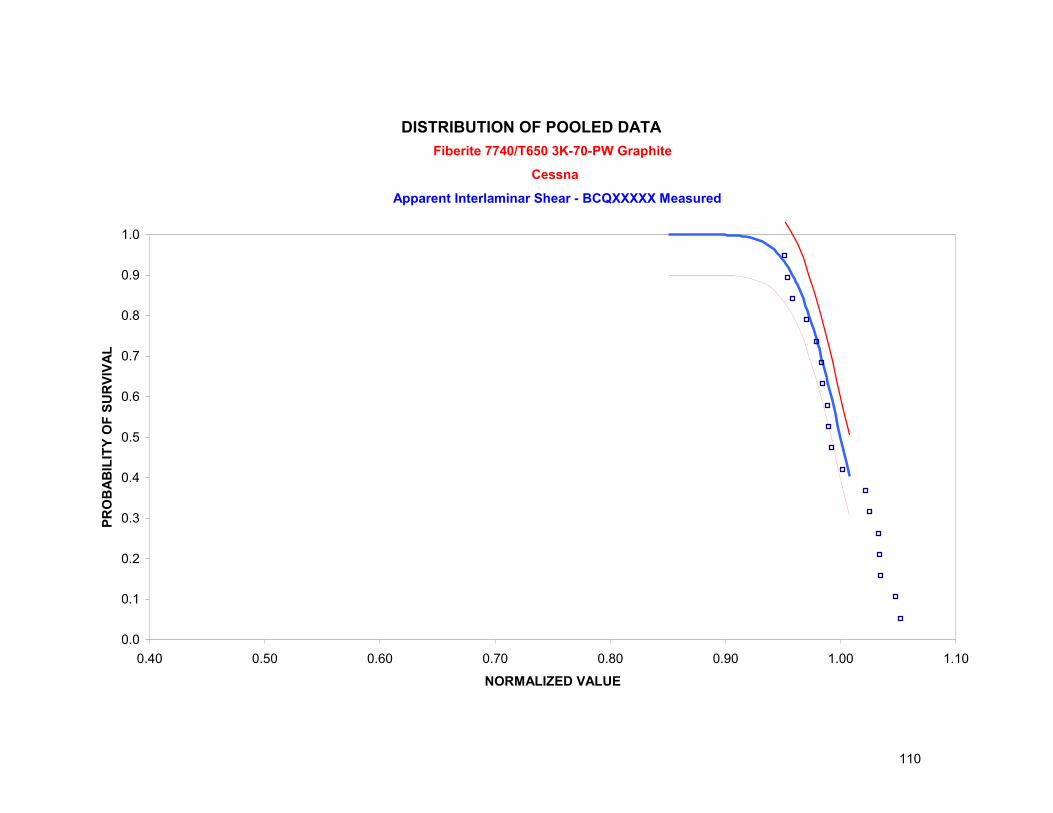
110
DISTRIBUTION OF POOLED DATA
0.0
0.1
0.2
0.3
0.4
0.5
0.6
0.7
0.8
0.9
1.0
0.40 0.50 0.60 0.70 0.80 0.90 1.00 1.10
NORMALIZED VALUE
PRO
BAB
ILIT
Y O
F SU
RVIV
AL
Fiberite 7740/T650 3K-70-PW Graphite
Cessna
Apparent Interlaminar Shear - BCQXXXXX Measured

111
3.4 Moisture Conditioning History Charts

112
Conditioning History CessnaFiberite 7740/T650 3K-70-PW Graphite
0.000
0.100
0.200
0.300
0.400
0.500
0.600
0.700
0.800
0 10 20 30 40 50 60 70
Time (days)
BCJ31BCJ34BCJ22BCJ23BCJ23BCJ11BCJ13
Conditioning History CessnaFiberite 7740/T650 3K-70-PW Graphite
0.000
0.100
0.200
0.300
0.400
0.500
0.600
0.700
0.800
0 10 20 30 40 50 60 70Time (days)
% W
eigh
t Gai
n (T
otal
)
BCU11
BCU13
BCU21
BCU24
BCU24
BCU32
BCU33

113
Conditioning History CessnaFiberite 7740/T650 3K-70-PW Graphite
0.000
0.050
0.100
0.150
0.200
0.250
0.300
0.350
0.400
0.450
0.500
0 20 40 60 80
Time (days)
% W
eigh
t Gai
n (T
otal
)
BCK1111F
BCK1213F
BCK2111F
BCK2211F
BCK2211F
BCK3111F
BCK3221F
Conditioning History CessnaFiberite 7740/T650 3K-70-PW Graphite
0.000
0.100
0.200
0.300
0.400
0.500
0.600
0.700
0.800
0 20 40 60 80
Time (days)
BCL21X1FBCL22X1FBCL11X1FBCL12X1FBCL12X1FBCL31X1FBCL32X1F
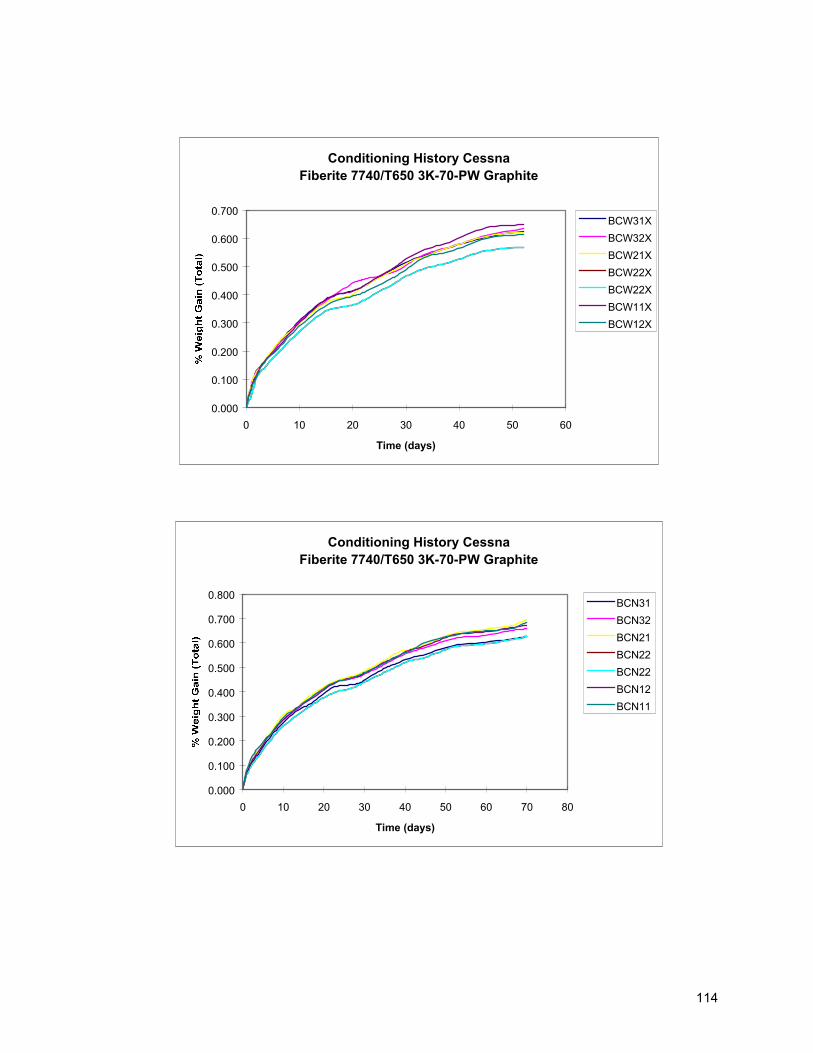
114
Conditioning History CessnaFiberite 7740/T650 3K-70-PW Graphite
0.000
0.100
0.200
0.300
0.400
0.500
0.600
0.700
0 10 20 30 40 50 60
Time (days)
BCW31XBCW32XBCW21XBCW22XBCW22XBCW11XBCW12X
Conditioning History CessnaFiberite 7740/T650 3K-70-PW Graphite
0.000
0.100
0.200
0.300
0.400
0.500
0.600
0.700
0.800
0 10 20 30 40 50 60 70 80
Time (days)
BCN31BCN32BCN21BCN22BCN22BCN12BCN11

115
Conditioning History CessnaFiberite 7740/T650 3K-70-PW Graphite
0.000
0.100
0.200
0.300
0.400
0.500
0.600
0.700
0.800
0 20 40 60 80Time (days)
% W
eigh
t Gai
n (T
otal
)
BCZ31
BCZ32
BCZ21
BCZ22
BCZ22
BCZ11
BCZ12
Conditioning History CessnaFiberite 7740/T650 3K-70-PW Graphite
0.000
0.100
0.200
0.300
0.400
0.500
0.600
0.700
0.800
0 10 20 30 40 50 60 70 80
Time (days)
BCD11BCD21BCD31
116
3.5 Physical Test Results

117
Composite Resin Fiber VoidDensity Content Volume Content[g/cc] [wt%] [vol%] [vol%]
0° Tension (BCJXXXXX) No. of Specimens 12 12 12 12
Mean 1.521 36.587 54.243 1.965Standard Deviation 0.013 1.840 1.991 0.402
90° Tension (BCUXXXXX)No. of Specimens 12 12 12 12
Mean 1.516 36.297 54.324 2.342Standard Deviation 0.012 2.018 1.781 1.030
0° Compression (BCKXXXXX)No. of Specimens 6 6 6 6
Mean 1.522 33.791 56.687 2.806Standard Deviation 0.012 1.228 1.079 0.928
90° Compression (BCWXXXXX)No. of Specimens 6 6 6 6
Mean 1.519 34.203 56.211 2.887Standard Deviation 0.013 4.374 3.814 1.632
In-Plane Shear (BCNXXXXX)No. of Specimens 6 6 6 6
Mean 1.517 36.375 54.296 2.237Standard Deviation 0.012 1.103 0.708 1.073
Interlaminar Shear (BCQXXXXX)No. of Specimens 3 3 3 3
Mean 1.526 35.026 55.779 2.183Standard Deviation 0.023 3.690 3.905 0.785
Overall No. of Specimens 45 45 45 45Overall Mean 1.519 35.687 54.962 2.352
Overall Std. Deviation 0.013 2.485 2.301 0.988
Fiberite 7740/T650 3K-70-PW Graphite Physical Test Summary

118
COMPANY : CessnaMATERIAL SYSTEM : Fiberite 7740/T650 3K-70-PW Graphite PROJECT : 980409C1
DRY WETAs Fabricated Moisture Equilibirum at 85% RH
Sample # Tg [°C] Tg [°F] Sample # Tg [°C] Tg [°F]BCD1X1FA 121.84 251.30 BCD1X1BC 97.35 207.23BCD1X1GA 115.72 240.29 BCD1X1CC 96.87 206.37BCD1X1HA 120.82 249.48 BCD1X1DC 97.17 206.90BCD2X1FA 119.24 246.62 BCD2X1BC 94.17 201.50BCD2X1GA 116.73 242.11 BCD2X1CC 97.11 206.80BCD2X1HA 116.79 242.23 BCD2X1DC 96.39 205.50BCD3X1FA 120.58 249.04 BCD3X1BC 96.93 206.47BCD3X1GA 113.63 236.54 BCD3X1CC 96.58 205.84BCD3X1HA 116.88 242.38 BCD3X1DC 95.89 204.61
Average [°F] 244.44 Average [°F] 205.69Standard Dev. [°F] 4.91 Standard Dev. [°F] 1.76Coeff. Of Var. [%] 2.01 Coeff. Of Var. [%] 0.86
DRY WET
As Fabricated Moisture Equilibirum at 85% RHSample # Tg [°C] Tg [°F] Sample # Tg [°C] Tg [°F]BCD1X1FA 132.80 271.05 BCD1X1BC 110.14 230.25BCD1X1GA 132.60 270.69 BCD1X1CC 110.39 230.70BCD1X1HA 132.45 270.42 BCD1X1DC 109.60 229.28BCD2X1FA 133.03 271.45 BCD2X1BC 109.19 228.55BCD2X1GA 131.50 268.69 BCD2X1CC 110.11 230.20BCD2X1HA 132.61 270.69 BCD2X1DC 109.03 228.25BCD3X1FA 133.87 272.97 BCD3X1BC 116.06 240.90BCD3X1GA 134.54 274.17 BCD3X1CC 112.93 235.28BCD3X1HA 131.93 269.48 BCD3X1DC 114.51 238.12
Average [°F] 271.07 Average [°F] 232.39Standard Dev. [°F] 1.67 Standard Dev. [°F] 4.57Coeff. Of Var. [%] 0.62 Coeff. Of Var. [%] 1.97
DMA Results -- Onset Storage Modulus
DMA Results - Peak Tan Delta
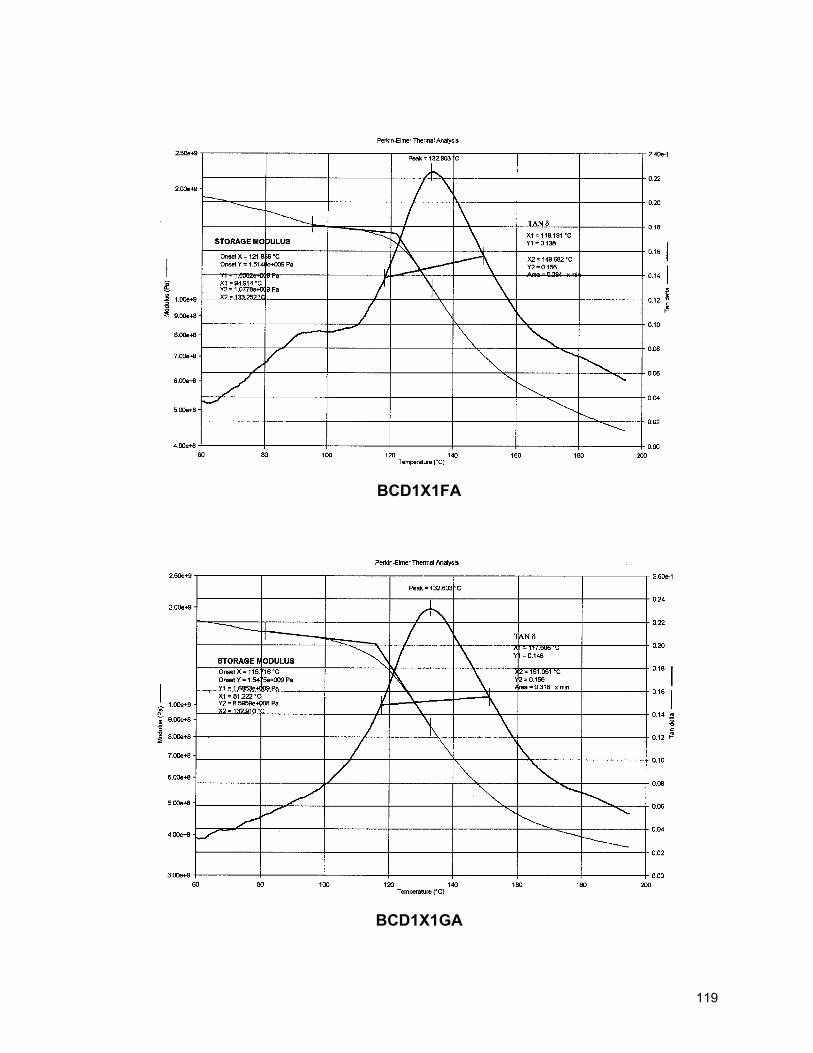
119
BCD1X1FA
BCD1X1GA

120
BCD1X1HA
BCD2X1FA

121
BCD2X1GA
BCD2X1HA

122
BCD3X1FA
BCD3X1GA

123
Figure 1. BCD3X1HA
BCD1X1BC

124
Figure 2. BCD1X1CC
BCD1X1DC

125
BCD2X1BC
BCD2X1CC

126
BCD2X1DC
BCD3X1BC

127
BCD3X1CC
BCD3X1DC

128
4.0 TESTING AND REPORTING COMMENTS

129
All tests were conformed under Designated Option Authority (DOA) by Cessna Aircraft Co., Inc.
130
APPENDIX A. PHYSICAL TEST DATA SUPPLIED BY MATERIAL VENDOR
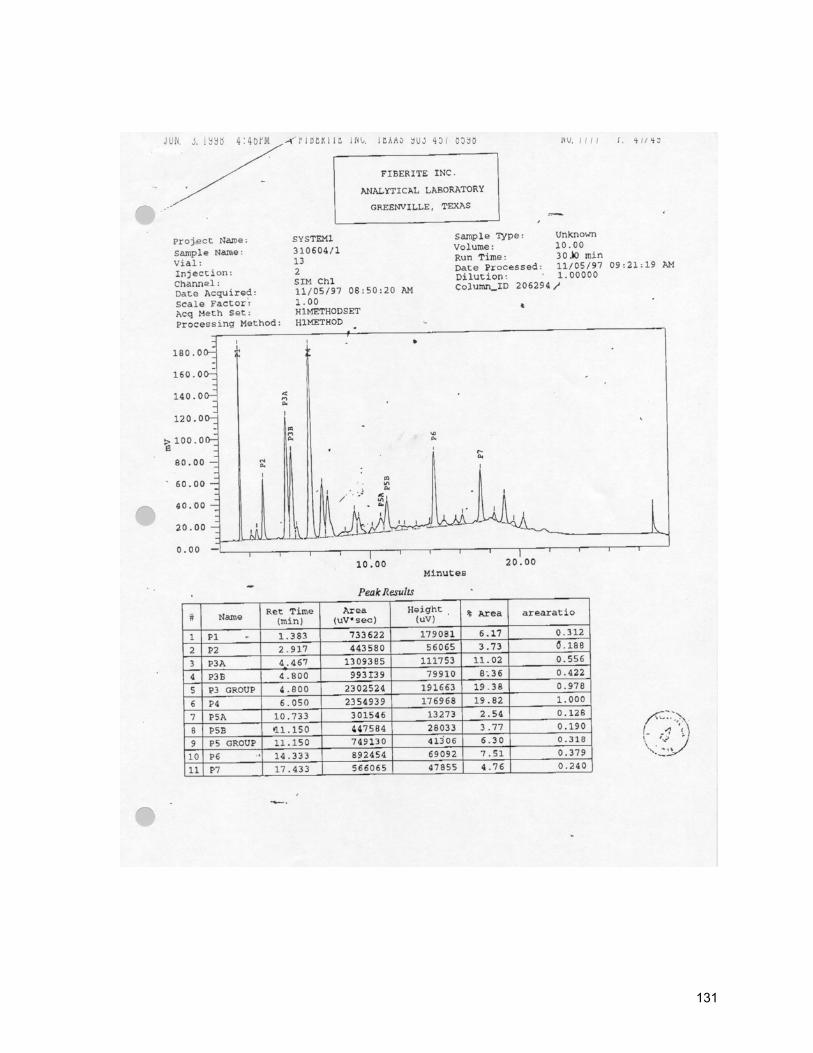
131

132

133
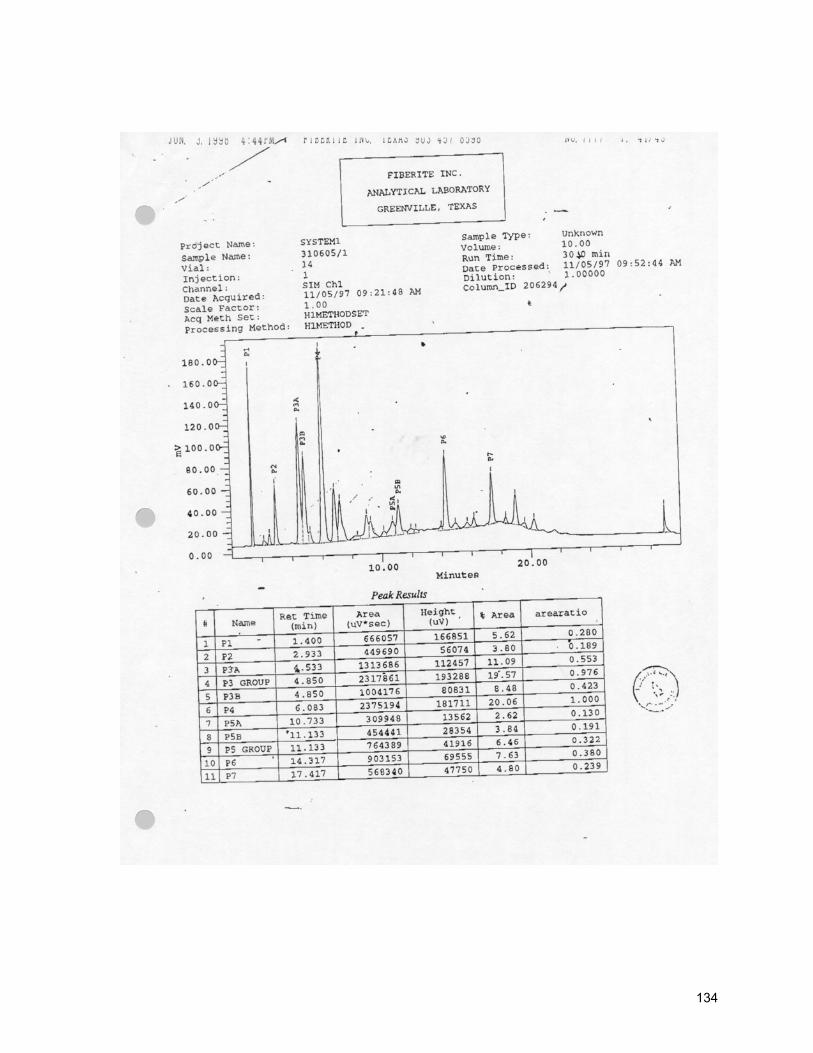
134

135

136

137

138
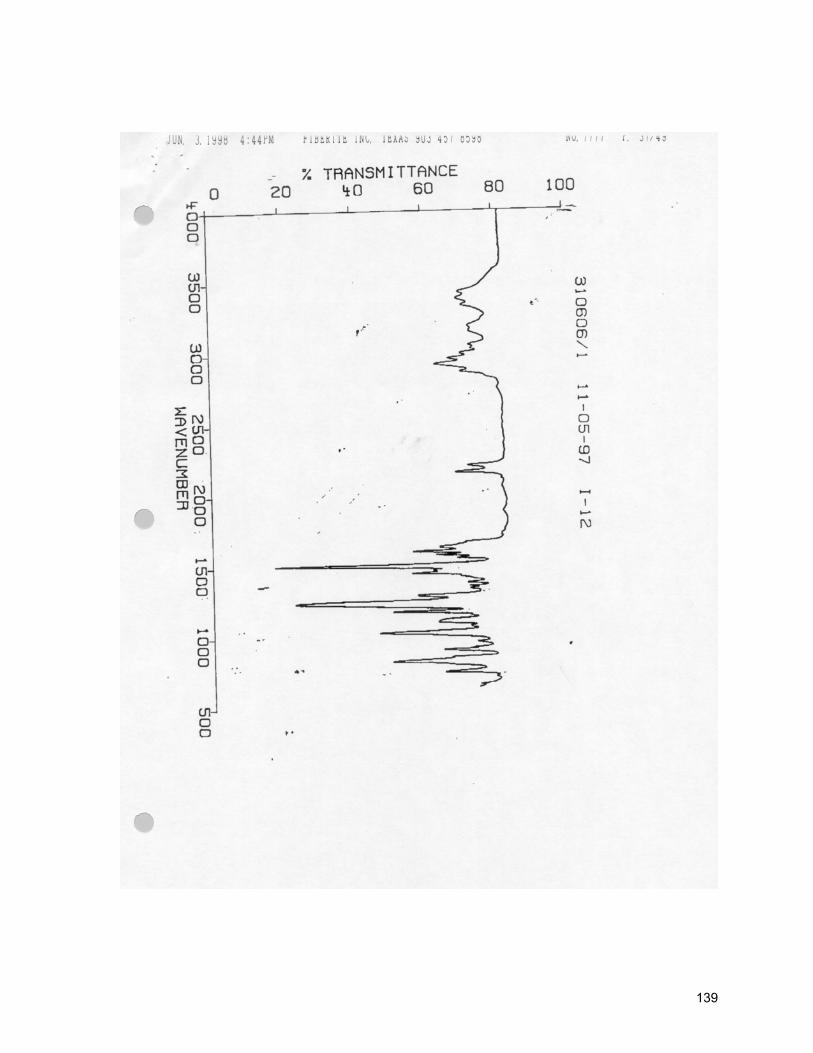
139

140
APPENDIX B. DATES OF PANEL MANUFACTURE AND COPY OF FAA FORM 8130-3

141