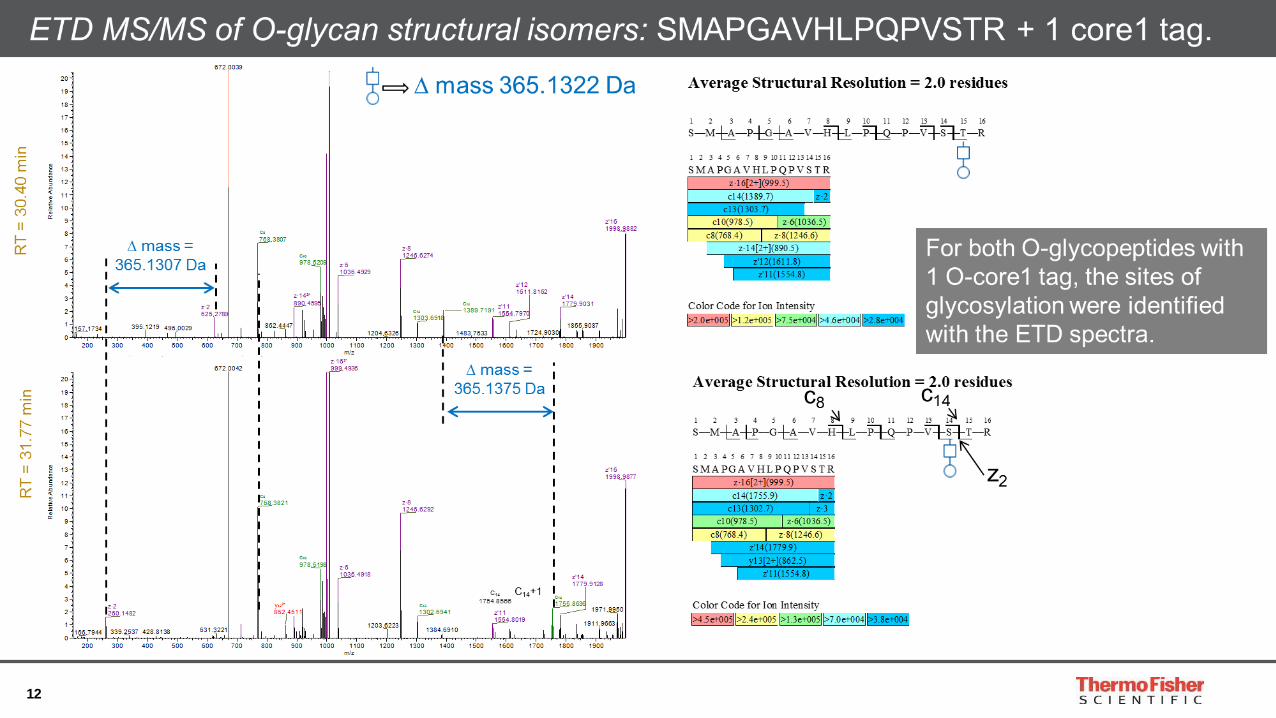
Advanced Fragmentation Techniques for BioPharma ... · 3 MS Tools for Major Biopharma...
50
The world leader in serving science Global BioPharma Summit Advanced Fragmentation Techniques for BioPharma Characterization
-
Upload
truongdung -
Category
Documents
-
view
220 -
download
0
Transcript of Advanced Fragmentation Techniques for BioPharma ... · 3 MS Tools for Major Biopharma...

The world leader in serving science
Global BioPharma Summit
Advanced Fragmentation Techniques for BioPharma Characterization

2
Different modes of fragmentation to answer different questions or for different assays
(Figure from Coon et al., Analytical Chemistry, 2009)
Peptide Mapping
Site occupancy of PTM
for mAb or site of
conjugation for ADC
Top-Middle down
3
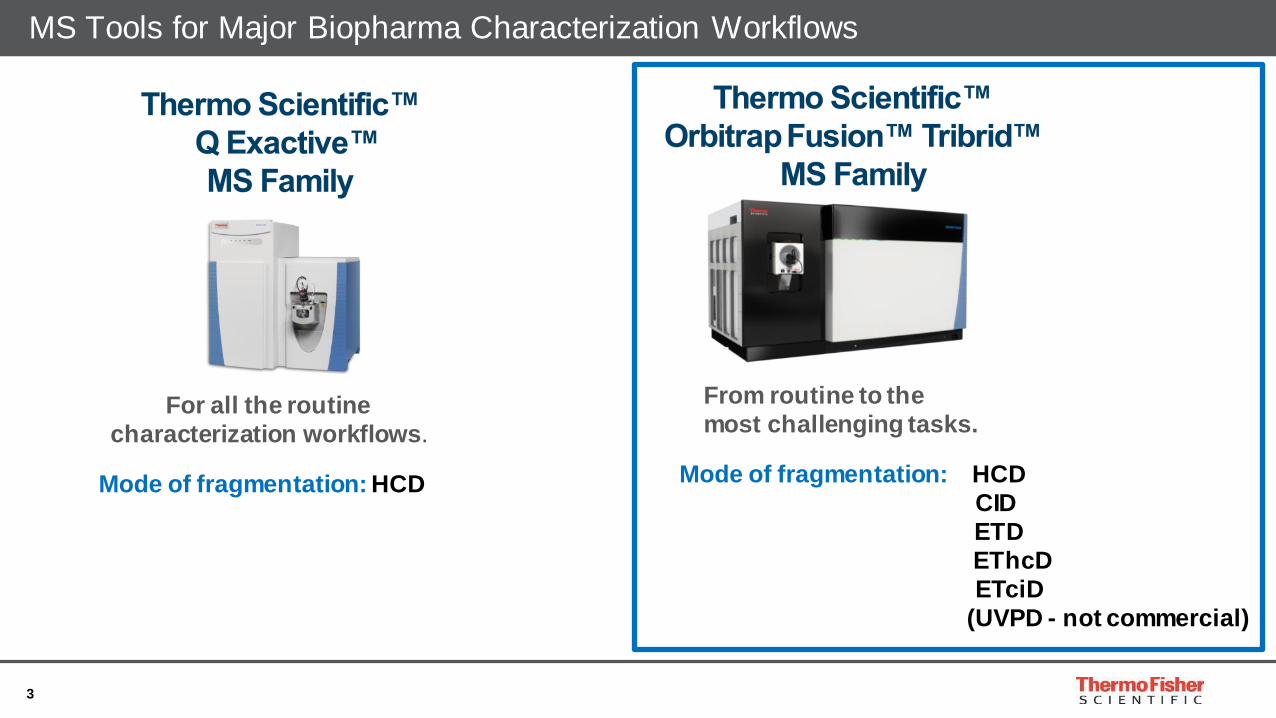
MS Tools for Major Biopharma Characterization Workflows
Mode of fragmentation: HCD
CID
ETD
EThcD
ETciD
(UVPD - not commercial)
Mode of fragmentation: HCD
For all the routine
characterization workflows.
From routine to the
most challenging tasks.

4
Etanercept: O-glycosylation
5
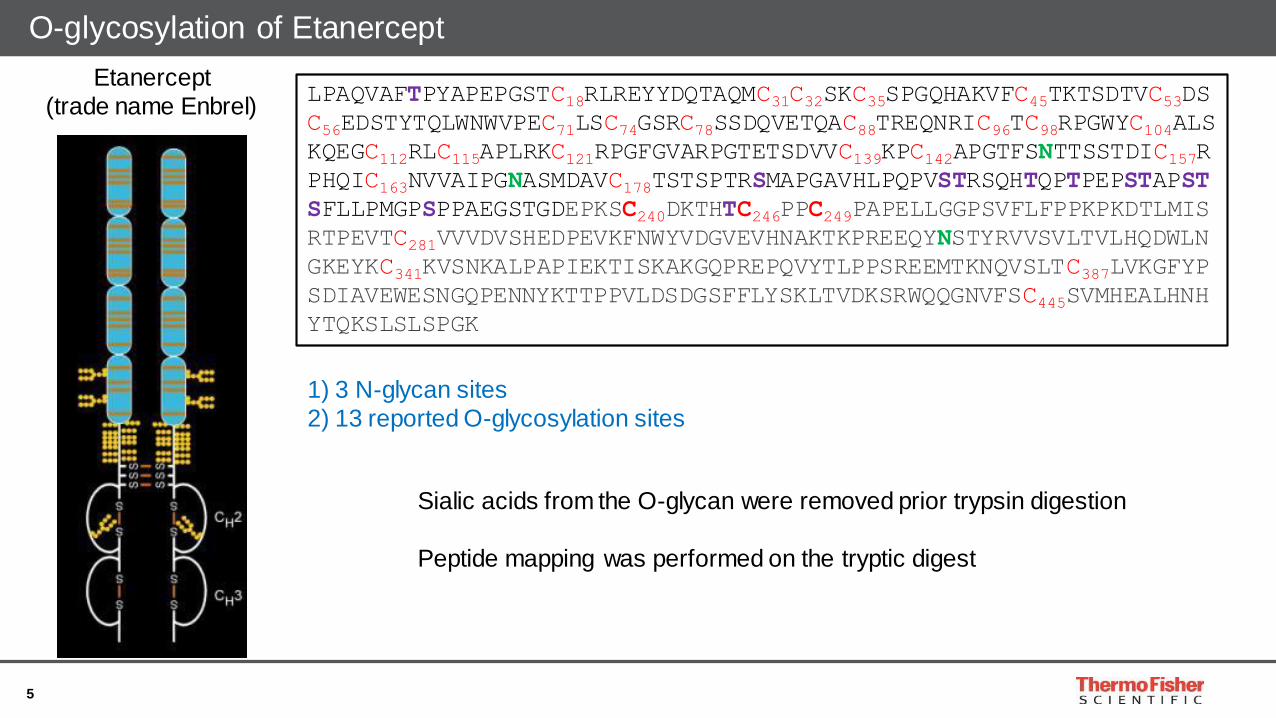
O-glycosylation of Etanercept
Etanercept
(trade name Enbrel)LPAQVAFTPYAPEPGSTC18RLREYYDQTAQMC31C32SKC35SPGQHAKVFC45TKTSDTVC53DS
C56EDSTYTQLWNWVPEC71LSC74GSRC78SSDQVETQAC88TREQNRIC96TC98RPGWYC104ALS
KQEGC112RLC115APLRKC121RPGFGVARPGTETSDVVC139KPC142APGTFSNTTSSTDIC157R
PHQIC163NVVAIPGNASMDAVC178TSTSPTRSMAPGAVHLPQPVSTRSQHTQPTPEPSTAPST
SFLLPMGPSPPAEGSTGDEPKSC240DKTHTC246PPC249PAPELLGGPSVFLFPPKPKDTLMIS
RTPEVTC281VVVDVSHEDPEVKFNWYVDGVEVHNAKTKPREEQYNSTYRVVSVLTVLHQDWLN
GKEYKC341KVSNKALPAPIEKTISKAKGQPREPQVYTLPPSREEMTKNQVSLTC387LVKGFYP
SDIAVEWESNGQPENNYKTTPPVLDSDGSFFLYSKLTVDKSRWQQGNVFSC445SVMHEALHNH
YTQKSLSLSPGK
1) 3 N-glycan sites
2) 13 reported O-glycosylation sites
Sialic acids from the O-glycan were removed prior trypsin digestion
Peptide mapping was performed on the tryptic digest

6
Results for peptide SMAPGAVHLPQPVSTR after processing HCD data
RT: 27.13 - 35.10 SM: 7G
27.5 28.0 28.5 29.0 29.5 30.0 30.5 31.0 31.5 32.0 32.5 33.0 33.5 34.0 34.5 35.0
Time (min)
0
50
100
0
50
100
0
50
100
Rela
tive A
bundance 0
50
10032.43
34.11
31.57
30.40
29.17 32.24 32.39 32.6030.96 31.12 33.2732.9829.83 33.9733.8129.72
29.07
27.82 29.9929.60 32.7130.26 30.53 31.0430.69
27.75
35.0533.7430.26 32.43 33.4429.81 33.9530.73
NL: 5.21E5
m/z= 549.9566-549.9620 F: ms MS 20170406_Etanercept_Ocore_HCD30_test2
NL: 3.95E7
m/z= 671.6666-671.6734 F: ms MS 20170406_Etanercept_Ocore_HCD30_test2
NL: 6.19E7
m/z= 1189.5621-1189.5739 F: ms MS 20170406_Etanercept_Ocore_HCD30_test2
NL: 2.68E5
m/z= 686.5336-686.5941 F: ms MS 20170406_Etanercept_Ocore_HCD30_test2SMAPGAVHLPQPVSTR
SMAPGAVHLPQPVSTR +
SMAPGAVHLPQPVSTR +
S186MAPGAVHLPQPVS199T200R
HCD

7
8
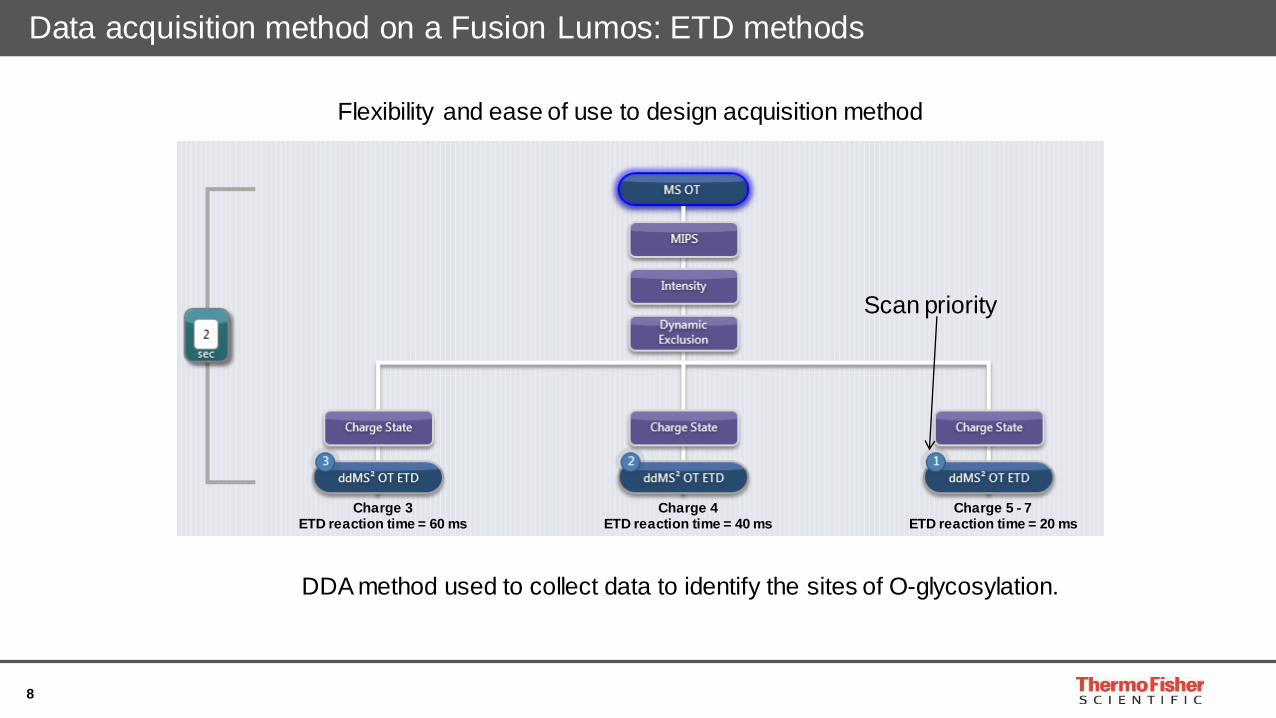
Data acquisition method on a Fusion Lumos: ETD methods
Flexibility and ease of use to design acquisition method
Charge 3ETD reaction time = 60 ms
Charge 4ETD reaction time = 40 ms
Charge 5 - 7ETD reaction time = 20 ms
Scan priority
DDA method used to collect data to identify the sites of O-glycosylation.

9
Data acquisition method on a Fusion Lumos: ETD methods
Flexibility and ease of use to design acquisition method
10
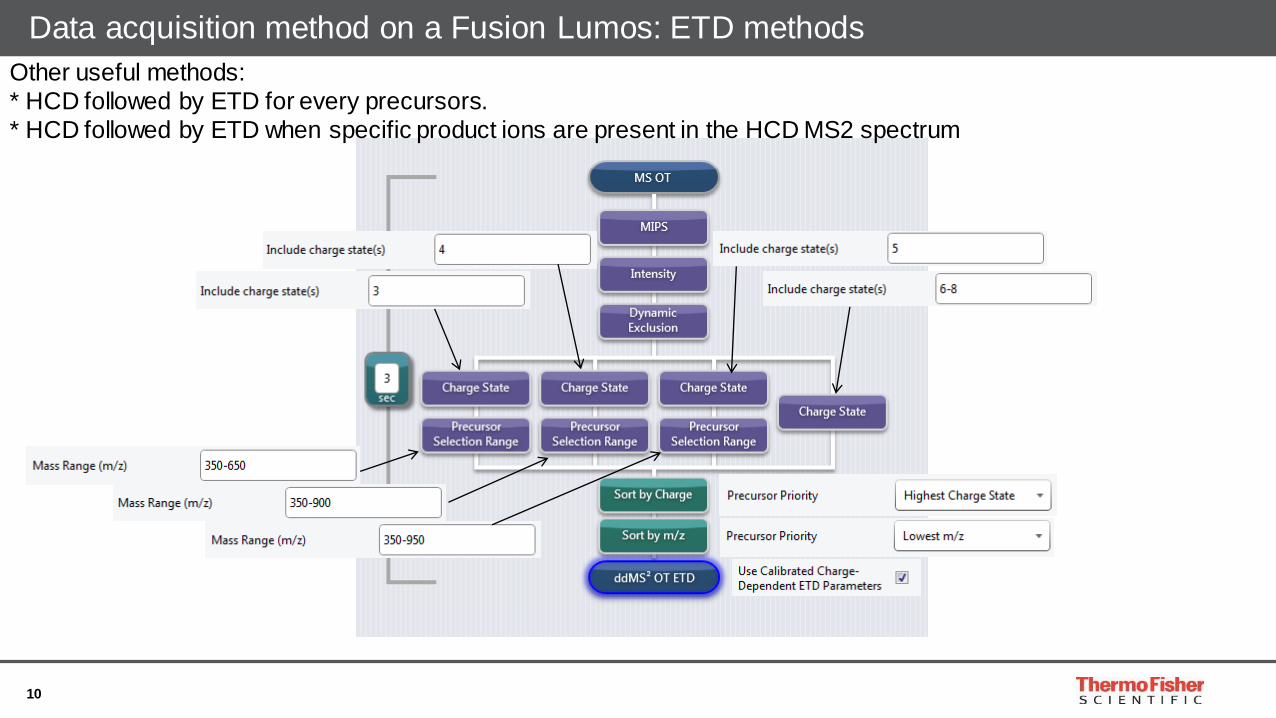
Data acquisition method on a Fusion Lumos: ETD methods
Other useful methods:
* HCD followed by ETD for every precursors.
* HCD followed by ETD when specific product ions are present in the HCD MS2 spectrum

11
12
13

14
15
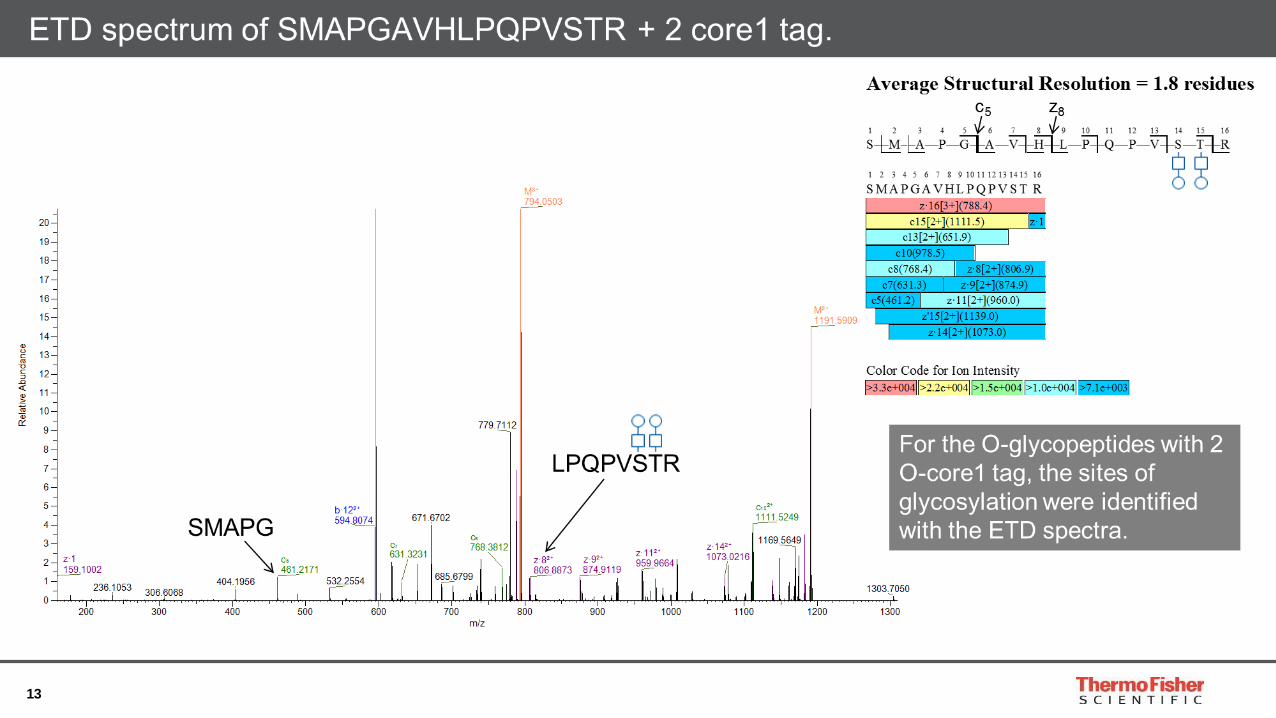
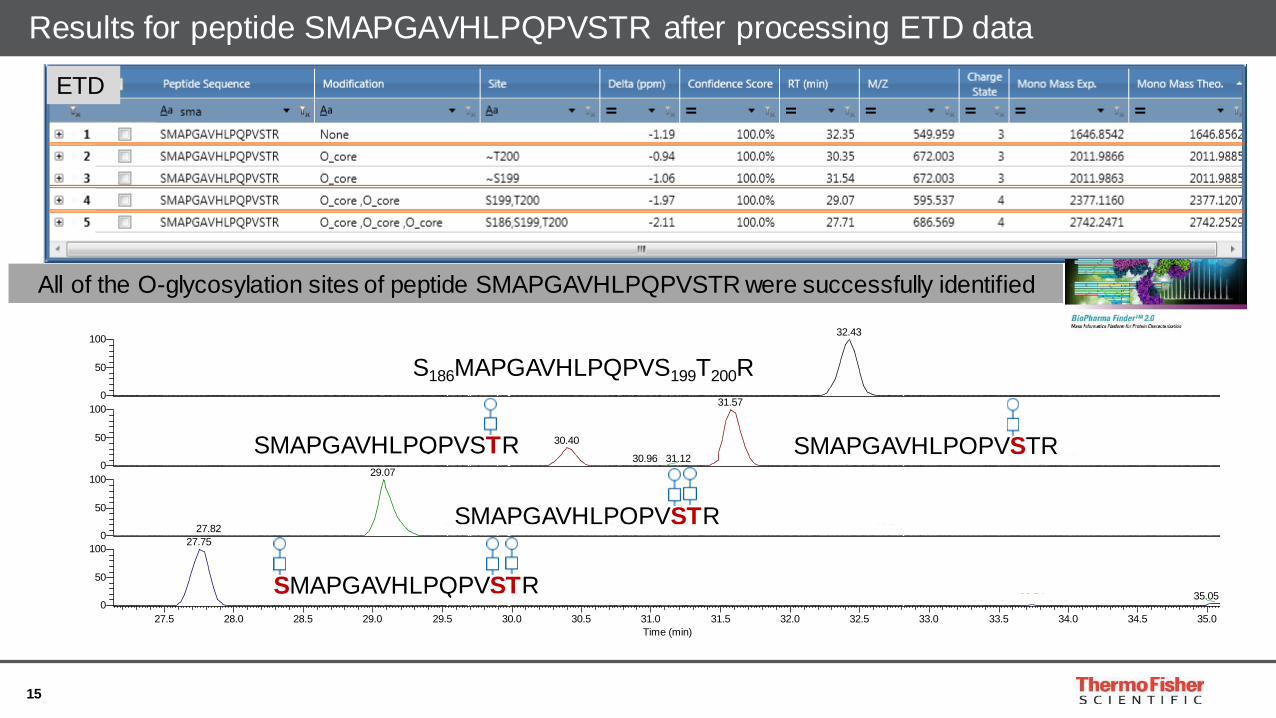
Results for peptide SMAPGAVHLPQPVSTR after processing ETD data
RT: 27.13 - 35.10 SM: 7G
27.5 28.0 28.5 29.0 29.5 30.0 30.5 31.0 31.5 32.0 32.5 33.0 33.5 34.0 34.5 35.0
Time (min)
0
50
100
0
50
100
0
50
100
Rela
tive A
bundance 0
50
10032.43
34.11
31.57
30.40
29.17 32.24 32.39 32.6030.96 31.12 33.2732.9829.83 33.9733.8129.72
29.07
27.82 29.9929.60 32.7130.26 30.53 31.0430.69
27.75
35.0533.7430.26 32.43 33.4429.81 33.9530.73
NL: 5.21E5
m/z= 549.9566-549.9620 F: ms MS 20170406_Etanercept_Ocore_HCD30_test2
NL: 3.95E7
m/z= 671.6666-671.6734 F: ms MS 20170406_Etanercept_Ocore_HCD30_test2
NL: 6.19E7
m/z= 1189.5621-1189.5739 F: ms MS 20170406_Etanercept_Ocore_HCD30_test2
NL: 2.68E5
m/z= 686.5336-686.5941 F: ms MS 20170406_Etanercept_Ocore_HCD30_test2
S186MAPGAVHLPQPVS199T200R
SMAPGAVHLPQPVSTR
SMAPGAVHLPQPVSTR
SMAPGAVHLPQPVSTR
SMAPGAVHLPQPVSTR
ETD
All of the O-glycosylation sites of peptide SMAPGAVHLPQPVSTR were successfully identified

16
Etanercept: leveraging ETD and MSn
for disulfide bond mapping
17
Disulfide bond mapping: Etanercept
Etanercept
(trade name Enbrel)
LPAQVAFTPYAPEPGSTC18RLREYYDQTAQMC31C32SKC35SPGQHAK
VFC45TKTSDTVC53DSC56EDSTYTQLWNWVPEC71LSC74GSRC78SSD
QVETQAC88TREQNRIC96TC98RPGWYC104ALSKQEGC112RLC115APL
RKC121RPGFGVARPGTETSDVVC139KPC142APGTFSNTTSSTDIC157RPHQIC163NVVAIPGNASMDAVC178TSTSPTRSMAPGAVHLPQPVST
RSQHTQPTPEPSTAPSTSFLLPMGPSPPAEGSTGDEPKSC240DKTHT
C246PPC249PAPELLGGPSVFLFPPKPKDTLMISRTPEVTC281VVVDV
SHEDPEVKFNWYVDGVEVHNAKTKPREEQYNSTYRVVSVLTVLHQDW
LNGKEYKC341KVSNKALPAPIEKTISKAKGQPREPQVYTLPPSREEM
TKNQVSLTC387LVKGFYPSDIAVEWESNGQPENNYKTTPPVLDSDGS
FFLYSKLTVDKSRWQQGNVFSC445SVMHEALHNHYTQKSLSLSPGK
18
Disulfide bond mapping: Etanercept
Etanercept
(trade name Enbrel)
LPAQVAFTPYAPEPGSTC18RLREYYDQTAQMC31C32SKC35SPGQHAK
VFC45TKTSDTVC53DSC56EDSTYTQLWNWVPEC71LSC74GSRC78SSD
QVETQAC88TREQNRIC96TC98RPGWYC104ALSKQEGC112RLC115APL
RKC121RPGFGVARPGTETSDVVC139KPC142APGTFSNTTSSTDIC157RPHQIC163NVVAIPGNASMDAVC178TSTSPTRSMAPGAVHLPQPVST
RSQHTQPTPEPSTAPSTSFLLPMGPSPPAEGSTGDEPKSC240DKTHT
C246PPC249PAPELLGGPSVFLFPPKPKDTLMISRTPEVTC281VVVDV
SHEDPEVKFNWYVDGVEVHNAKTKPREEQYNSTYRVVSVLTVLHQDW
LNGKEYKC341KVSNKALPAPIEKTISKAKGQPREPQVYTLPPSREEM
TKNQVSLTC387LVKGFYPSDIAVEWESNGQPENNYKTTPPVLDSDGS
FFLYSKLTVDKSRWQQGNVFSC445SVMHEALHNHYTQKSLSLSPGK
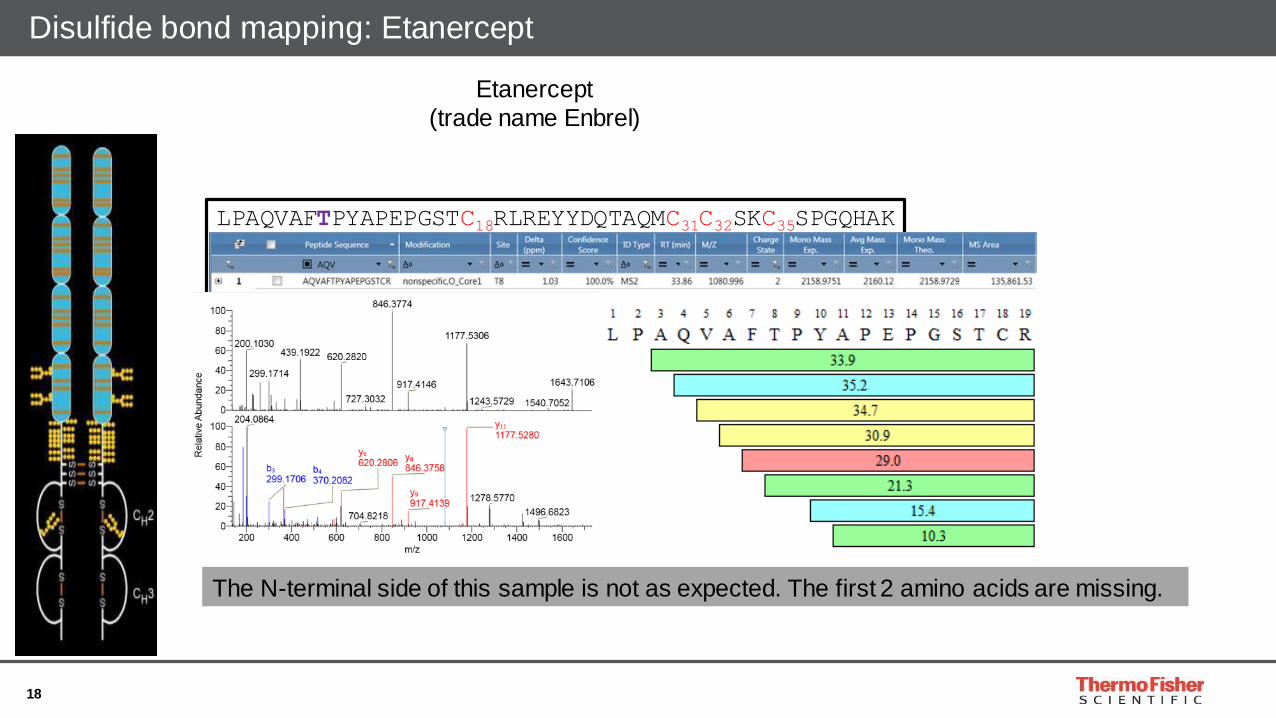
The N-terminal side of this sample is not as expected. The first 2 amino acids are missing.

19
Disulfide Bond Mapping: Etanercept
Etanercept
(trade name Enbrel)
LPAQVAFTPYAPEPGSTC18RLREYYDQTAQMC31C32SKC35SPGQHAKVFC45TKTSDTVC53DS
C56EDSTYTQLWNWVPEC71LSC74GSRC78SSDQVETQAC88TREQNRIC96TC98RPGWYC104ALS
KQEGC112RLC115APLRKC121RPGFGVARPGTETSDVVC139KPC142APGTFSNTTSSTDIC157R
PHQIC163NVVAIPGNASMDAVC178TSTSPTRSMAPGAVHLPQPVSTRSQHTQPTPEPSTAPST
SFLLPMGPSPPAEGSTGDEPKSC240DKTHTC246PPC249PAPELLGGPSVFLFPPKPKDTLMIS
RTPEVTC281VVVDVSHEDPEVKFNWYVDGVEVHNAKTKPREEQYNSTYRVVSVLTVLHQDWLN
GKEYKC341KVSNKALPAPIEKTISKAKGQPREPQVYTLPPSREEMTKNQVSLTC387LVKGFYP
SDIAVEWESNGQPENNYKTTPPVLDSDGSFFLYSKLTVDKSRWQQGNVFSC445SVMHEALHNH
YTQKSLSLSPGK
The N-terminal side peptide contains one cysteine.
The HCD search result of the non-reduced sample suggests that the N-terminal peptide is
linked to two other peptides through disulfide bonds.

20
Leveraging ETD and MSn for disulfide bond mapping
Workflow of the MS2 ETD – MS3 HCD for disulfide bond peptide identification
Ultra-High Field Orbitrap
Analyzer
Dual-Pressure
Linear Ion Trap
Ion Routing
Multipole
3 fragment channels after ETD of disulfide bond peptide

21
Leveraging ETD and MSn for disulfide bond mapping
Workflow of the MS2 ETD – MS3 HCD for disulfide bond peptide identification
Ultra-High Field Orbitrap
Analyzer
Dual-Pressure
Linear Ion Trap
Ion Routing
Multipole
3 fragment channels after ETD of disulfide bond
peptide
22
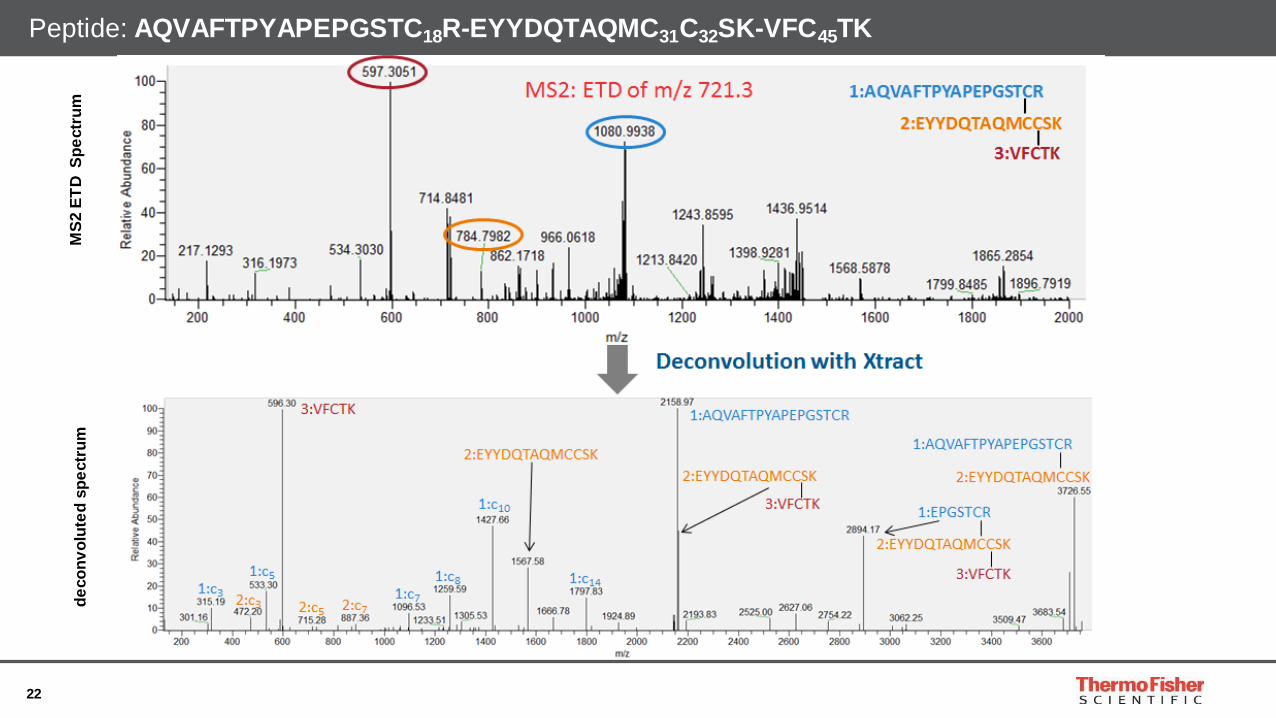
Peptide: AQVAFTPYAPEPGSTC18R-EYYDQTAQMC31C32SK-VFC45TK
MS
2 E
TD
S
pe
ctr
um
de
co
nv
olu
ted
sp
ectr
um
23
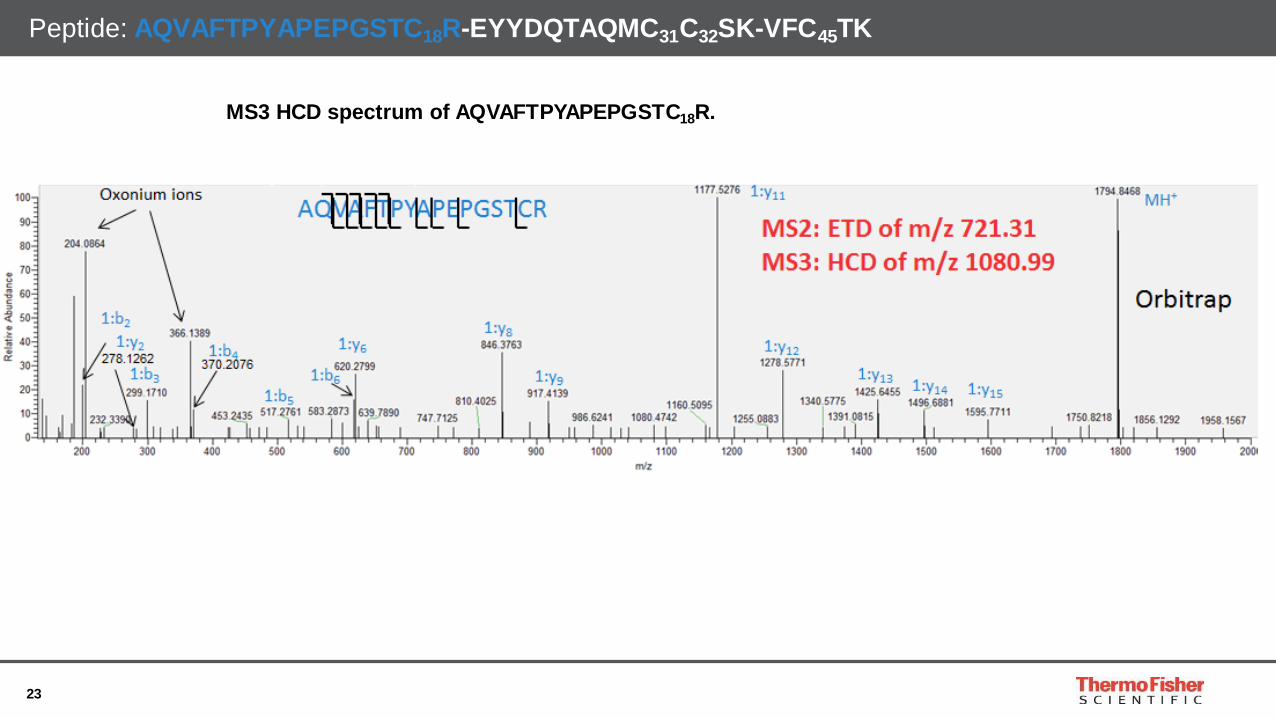
Peptide: AQVAFTPYAPEPGSTC18R-EYYDQTAQMC31C32SK-VFC45TK
MS3 HCD spectrum of AQVAFTPYAPEPGSTC18R.
24
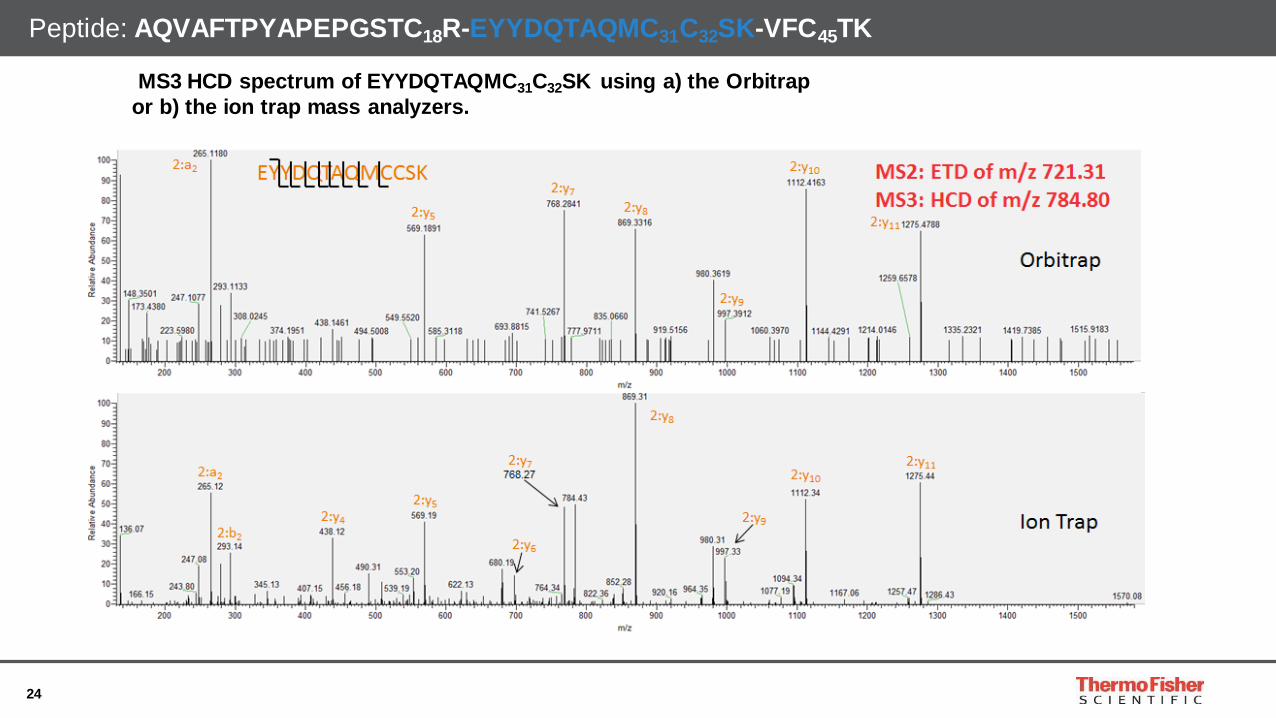
Peptide: AQVAFTPYAPEPGSTC18R-EYYDQTAQMC31C32SK-VFC45TK
MS3 HCD spectrum of EYYDQTAQMC31C32SK using a) the Orbitrap
or b) the ion trap mass analyzers.

25
Peptide: AQVAFTPYAPEPGSTC18R-EYYDQTAQMC31C32SK-VFC45TK
MS3 HCD spectrum of VFC45TK.

26
Antibody Drug Conjugates
27
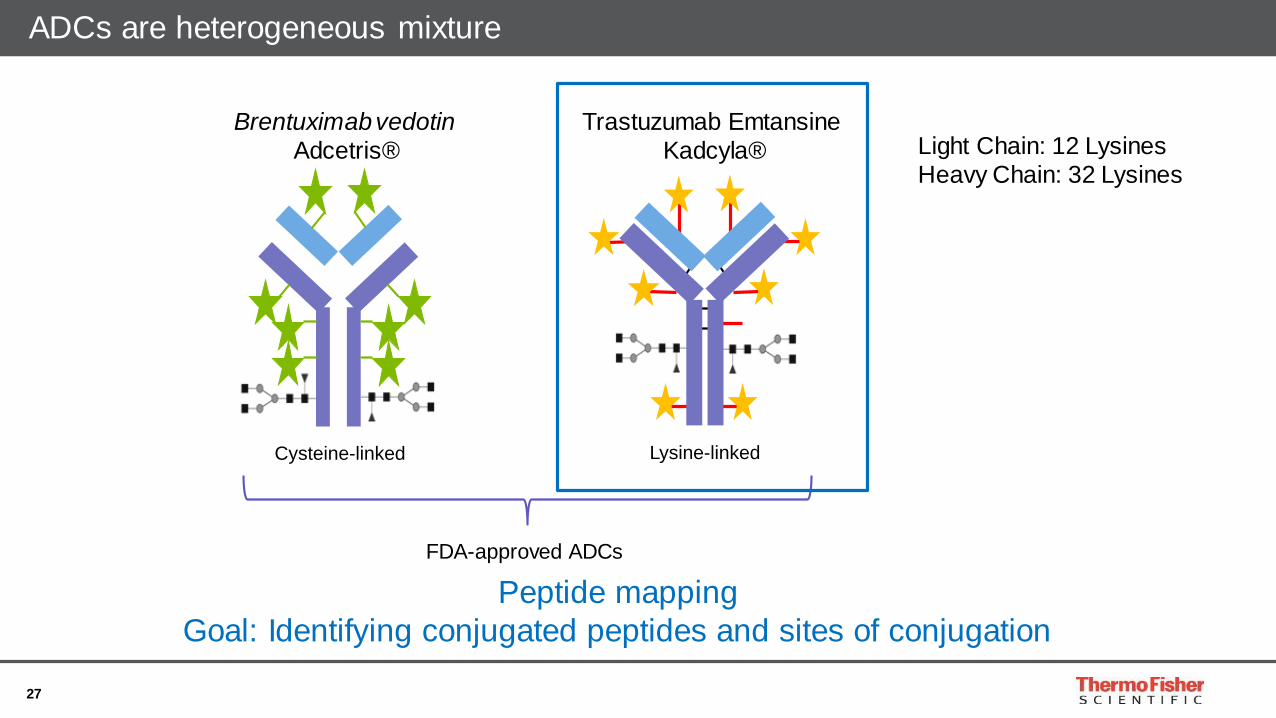
ADCs are heterogeneous mixture
Lysine-linkedCysteine-linked
FDA-approved ADCs
Brentuximab vedotin
Adcetris®
Trastuzumab Emtansine
Kadcyla® Light Chain: 12 Lysines
Heavy Chain: 32 Lysines
Peptide mapping
Goal: Identifying conjugated peptides and sites of conjugation
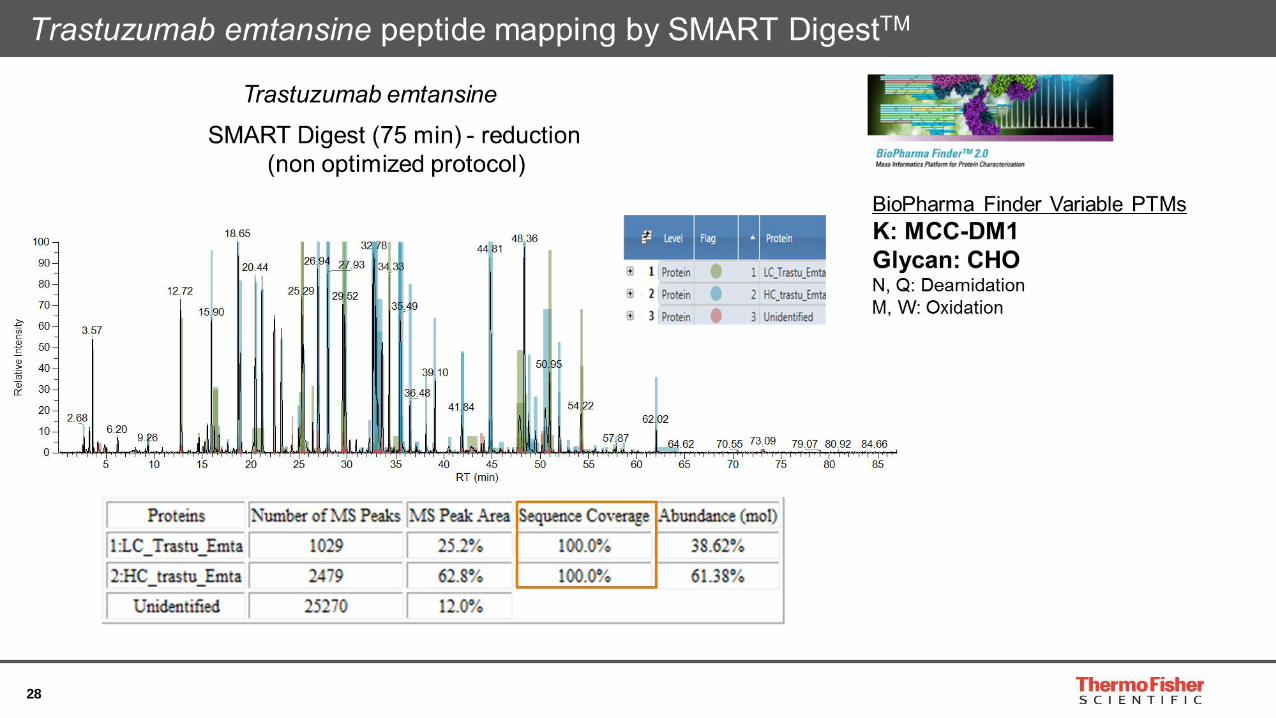
28
29
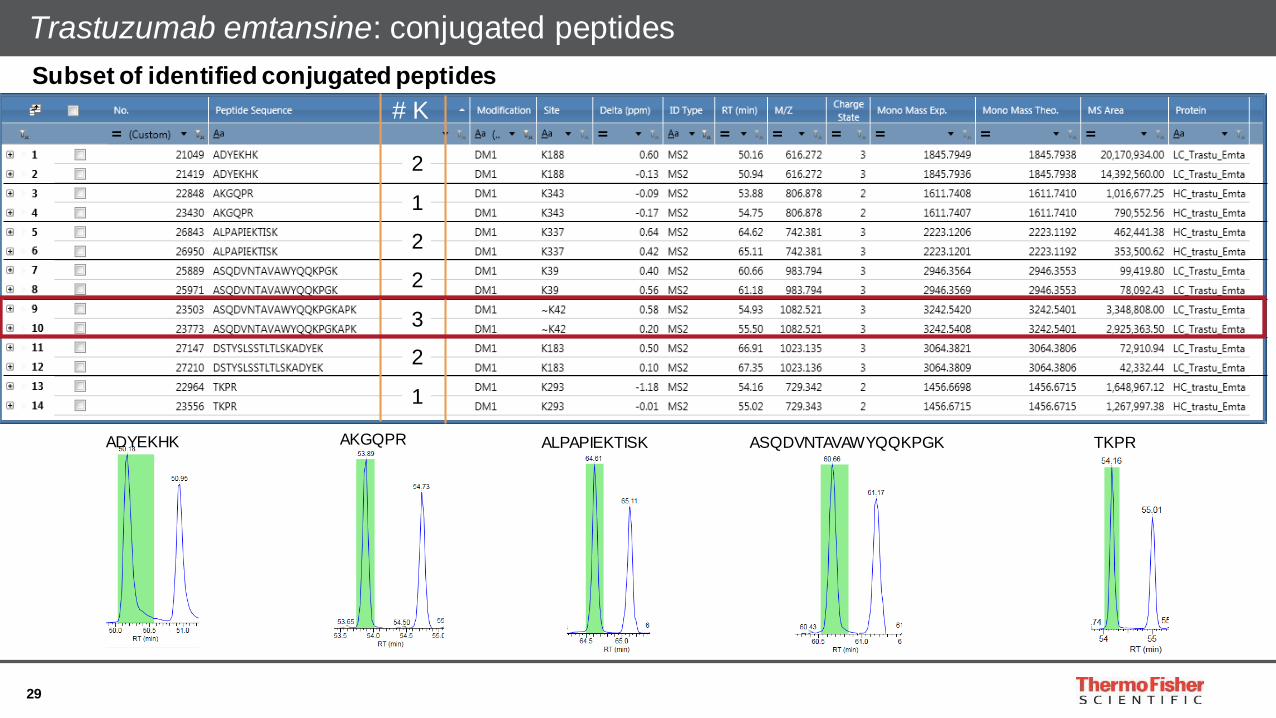
Trastuzumab emtansine: conjugated peptides
Subset of identified conjugated peptides
TKPRASQDVNTAVAWYQQKPGKALPAPIEKTISKAKGQPRADYEKHK
# K
2
1
2
2
3
2
1

30

31
32
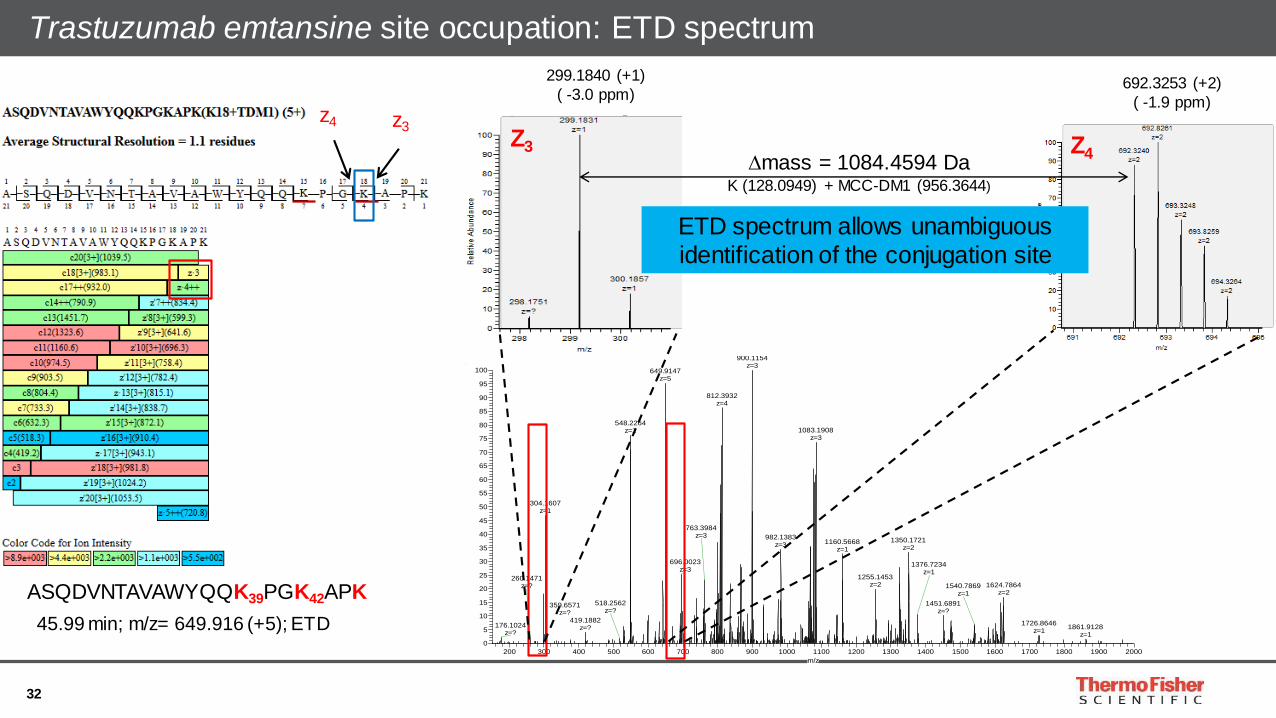
Trastuzumab emtansine site occupation: ETD spectrum
20160525_fsn10361_TDM1_smart_mNBA_targetETD_0P3_20ms_04pmNBA_2AfteCali #5880 RT: 46.41 AV: 1 NL: 3.55E4F: FTMS + p ESI d Full ms2 [email protected] [150.0000-2000.0000]
200 300 400 500 600 700 800 900 1000 1100 1200 1300 1400 1500 1600 1700 1800 1900 2000
m/z
0
5
10
15
20
25
30
35
40
45
50
55
60
65
70
75
80
85
90
95
100
Re
lativ
e A
bu
nd
an
ce
900.1154z=3
649.9147z=5
812.3932z=4
548.2264z=1 1083.1908
z=3
304.1607z=1
1350.1721z=2
982.1383z=3 1160.5668
z=1
696.0023z=3
763.3984z=3
1255.1453z=2 1624.7864
z=2
1451.6891z=?
1376.7234z=1
1540.7869z=1
419.1882z=?
1726.8646z=1
176.1024z=?
518.2562z=?
1861.9128z=1
260.1471z=?
359.6571z=?
Z3
299.1840 (+1)
( -3.0 ppm)
Z4
692.3253 (+2)
( -1.9 ppm)
Dmass = 1084.4594 DaK (128.0949) + MCC-DM1 (956.3644)
z3z4
ASQDVNTAVAWYQQK39PGK42APK
45.99 min; m/z= 649.916 (+5); ETD
ETD spectrum allows unambiguous
identification of the conjugation site

33
Trastuzumab emtansine site occupation
20160525_fsn10361_TDM1_smart_mNBA_targetETD_0P3_20ms_04pmNBA_2AfteCali #5880 RT: 46.41 AV: 1 NL: 3.55E4F: FTMS + p ESI d Full ms2 [email protected] [150.0000-2000.0000]
200 300 400 500 600 700 800 900 1000 1100 1200 1300 1400 1500 1600 1700 1800 1900 2000
m/z
0
5
10
15
20
25
30
35
40
45
50
55
60
65
70
75
80
85
90
95
100
Re
lativ
e A
bu
nd
an
ce
900.1154z=3
649.9147z=5
812.3932z=4
548.2264z=1 1083.1908
z=3
304.1607z=1
1350.1721z=2
982.1383z=3 1160.5668
z=1
696.0023z=3
763.3984z=3
1255.1453z=2 1624.7864
z=2
1451.6891z=?
1376.7234z=1
1540.7869z=1
419.1882z=?
1726.8646z=1
176.1024z=?
518.2562z=?
1861.9128z=1
260.1471z=?
359.6571z=?
c14
790.3785 (+2)
( -3.3 ppm)
c17
931.4632 (+2)
( -2.1 ppm)
Dmass = 282.1694 DaK (128.0949) + P (97.0528) +G (57.0215)
c17c14
ASQDVNTAVAWYQQKPGKAPK
45.99 min; m/z= 649.916 (+5); ETD

34
Trastuzumab emtansine: conjugated peptides
Subset of identified conjugated peptides
# K
2
1
2
2
3
2
1

35

36
Middle-down: ETD
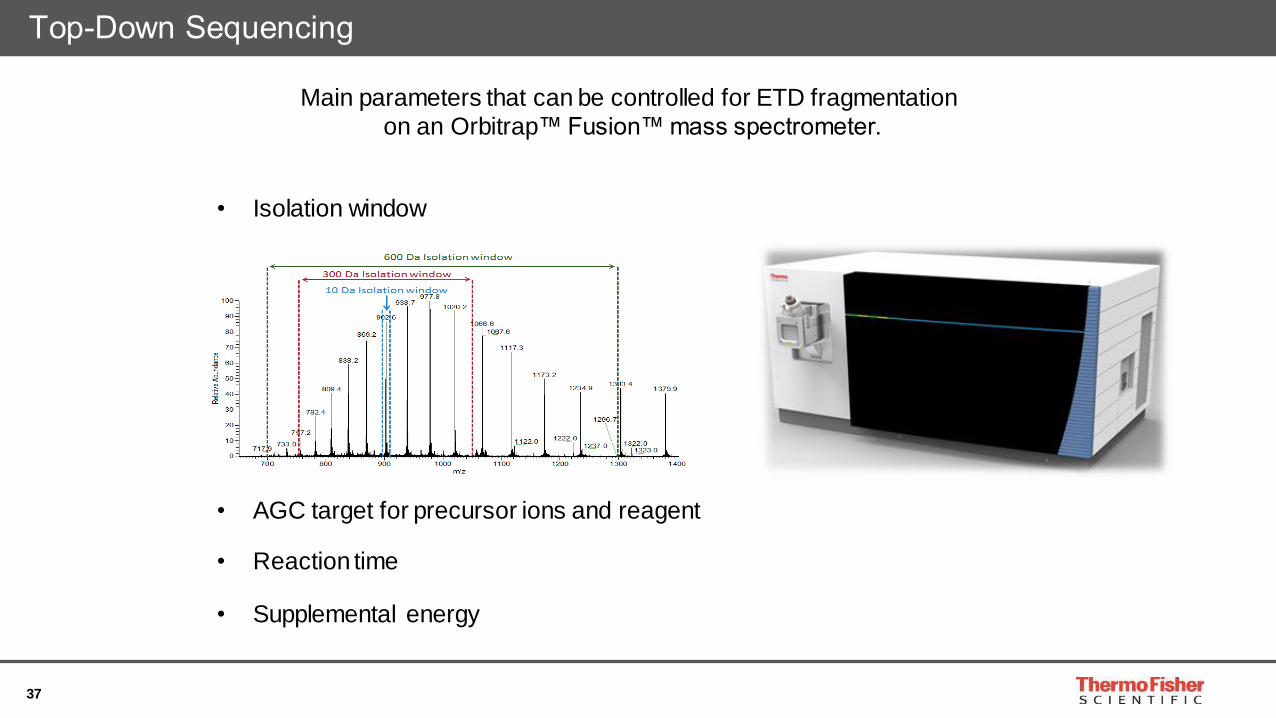
37
Main parameters that can be controlled for ETD fragmentation
on an Orbitrap™ Fusion™ mass spectrometer.
• Isolation window
• AGC target for precursor ions and reagent
• Reaction time
• Supplemental energy

38
Light Chain of Trastuzumab
ETD settings: 300Da isolation window, 3E5 precursor, 7E5 reagent, 10 ms reaction time
Due to the complexity of the spectra in top-down analysis, high resolution is required
MS/MS
39
Effect of parent ion AGC and ETD reaction time on sequence coverage (Trastuzumab)
% residue cleavages for AGC target value of 3E5 or 1E6 at different ETD reaction times
Ion Routing Multipole
C-Trap
Ion Trap
HPC
LPC
MP0Q1
1st parent ion isolation in Q1
Orbitrap
1st parent: ETD dissociation
1st parent trapped in the ion trap
Injection of ETD reagent
ETD
LC

40
Effect of parent ion AGC and ETD reaction time on sequence coverage (Trastuzumab)
% residue cleavages for AGC target value of 3E5 or 1E6 at different ETD reaction times
Fc FdLC
41
Effect of parent ion AGC and ETD reaction time on sequence coverage (Trastuzumab)
% residue cleavages for AGC target value of 3E5 or 1E6 at different ETD reaction times
LC
42
Middle Down: Orbitrap Tribrid Fusion Lumos
High sequence coverage for the light chain, Fc and Fd
were obtained from the combined ETD and EThcD
experiments.
LC Fd
Fc
43
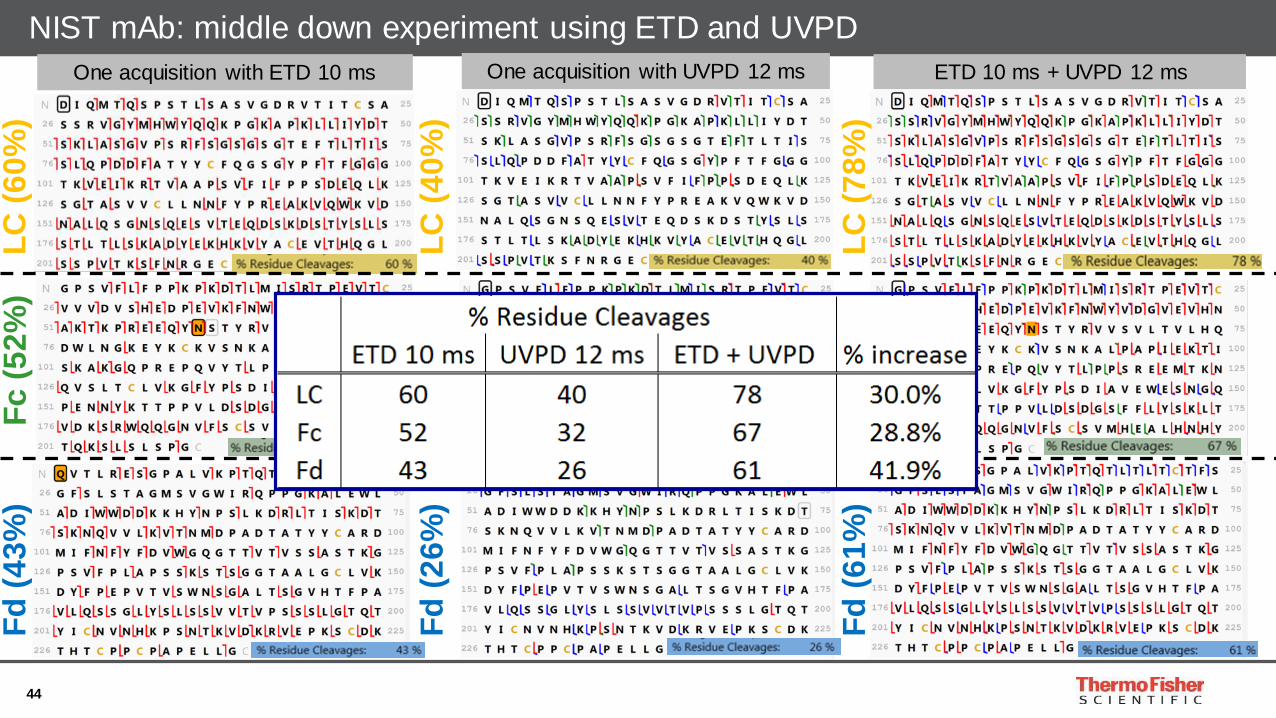
NIST mAb: middle down experiment using ETD and UVPD F
c (
52
%)
Fd
(43
%)
LC
(6
0%
)
One acquisition with ETD 10 ms One acquisition with UVPD 12 ms
Fc
(3
2%
)F
d(2
6%
)L
C (
40
%)
ETD 10 ms + UVPD 12 ms
Fc
(6
7%
)F
d(6
1%
)L
C (
78
%)
44
NIST mAb: middle down experiment using ETD and UVPD F
c (
52
%)
Fd
(43
%)
LC
(6
0%
)
One acquisition with ETD 10 ms One acquisition with UVPD 12 ms
Fc
(3
2%
)F
d(2
6%
)L
C (
40
%)
ETD 10 ms + UVPD 12 ms
Fc
(6
7%
)F
d(6
1%
)L
C (
78
%)
45
Hydrogen Deuterium Exchange

46
HDX-MS workflow
MS1

47
Moving from MS only to MS/MS HDX experiment using ETD
•Minimal deuterium scrambling ETD measurement with different instruments and source
conditions(No deuterium is retained on Histidine due to fast exchange with solvent)
HHHHHHIIKIIK
0.0
0.5
1.0
1.5
2.0
2.5
3.0
C2 C3 C4 C5 C6 C7 C8 C9 C10
De
ute
riu
m C
on
tent
Orbitrap Fusion
Literature
(Martin Zehl, Kasper D. Rand, Ole N. Jensen, and Thomas J. D. Jørgensen
J. AM. CHEM. SOC. 2008, 130, 17453–17459 9 17453)
Under normal operation condition, minimal scrambling is observed on the ETD Spectrum

48
Moving from MS only to MS/MS HDX experiment using ETD
Significant change was observed around Z8-Z10 is
consistent with the C fragments plot. Combine
the two plot results, the potential binding site was
predicted.
Deuterium labeled protein and protein+ligand
biding sample’s C and Z fragments mass
differences vs. sequence position. From C3 to C14
mass differences were from 0.03 to 0.2. Start from
C17, the Δ mass increased to around 1 and stay at
the same level for the rest of the C fragments. C14
was identified as significant change area.
Pinpoint the Protein Ligand Binding Site with ETD
Deuterium labeled protein and protein+ligand
biding sample’s C and Z fragments mass
differences vs. sequence position. From C3 to C14
mass differences were from 0.03 to 0.2. Start from
C17, the Δ mass increased to around 1 and stay at
the same level for the rest of the C fragments. C14
was identified as significant change area.
49
Summary
• ETD is a must have type of
fragmentation for in-depth
characterization of biotherapeutic
proteins.
• High sequence coverage for middle-
down experiments allows quick
characterization assays.
• Orbitrap Fusion Lumos offers multiple
types of fragmentation and ease of use
to tackle the most challenging task.
50
Thank you !
Acknowledgements
• Kelly Broster
• Rowan Moore
• Terry Zhang
• Aaron Bailey
• Kyle D’Silva
• Michael Blank
• Simon Cubbon
• Stephane Houel
• Jonathan Josephs
• John Rontree
• Jennifer Sutton
• Mark Sanders
• Helene Cardasis
• Seema Sharma
• Romain Huguet
• Vlad Zabrouskov