Advanced Endoscopic Imaging in the …...Advanced Endoscopic Imaging in the Gastrointestinal Tract...
246
Advanced Endoscopic Imaging in the Gastrointestinal Tract – Improving the view of Neoplasia Dr Peter John Basford This thesis is submitted in partial fulfilment of the requirements for the award of the degree of Doctor of Medicine of the University of Portsmouth July 2015 School of Pharmacy and Biomedical Sciences 1
Transcript of Advanced Endoscopic Imaging in the …...Advanced Endoscopic Imaging in the Gastrointestinal Tract...
Advanced Endoscopic Imaging in the Gastrointestinal Tract – Improving the view of Neoplasia
Dr Peter John Basford
This thesis is submitted in partial fulfilment of the requirements for the award of the degree of Doctor of Medicine of the University of Portsmouth
July 2015
School of Pharmacy and Biomedical Sciences
1
Abstract
Gastrointestinal endoscopy is a vital tool for the detection and treatment of early neoplasia in the
upper and lower gastrointestinal tracts. Survival from gastrointestinal cancer is largely dependent
on the stage at diagnosis – thus detection of early lesions, or better still treatment of pre-
cancerous lesions is vital to improve outcomes.
The world of endoscopy is changing rapidly with the development of dye-based and digital
enhancement techniques with the aim of improving the detection and characterisation of
neoplastic lesions. This thesis reviews the development of all the main advanced imaging
techniques and comprehensively reviews the evidence for the use of these in the colon.
Chapter 4 describes the development of a new classification system for characterising small
colonic polyps using the Pentax i-Scan digital enhancement system.
Chapter 5 describes a prospective cohort study using i-Scan for the in-vivo characterisation of
small colonic polyps in 87 patients. No differences in the accuracy of polyp characterisation
between high-definition white light endoscopy, i-Scan and chromoendoscopy were found when
performed by an expert endoscopist. All 3 modalities met the ASGE criteria for management
based on optical diagnosis.
Chapter 6 describes a retrospective study looking at factors influencing polyp and adenoma
detection in a large UK Bowel cancer screening cohort. Endoscope definition (standard vs high
definition) was examined in particular. In this group of patients, endoscope definition was found
to have no impact on any outcome measure, but endoscopist and bowel preparation were
consistent predictors of key quality outcomes.
Chapter 7 describes a randomised controlled clinical trial recruiting 126 patients of a pre-
endoscopy drink containing water, n-acetyl cysteine and simeticone. This was shown to
significantly improve mucosal visibility compared to water alone, or no preparation, and also
significantly reduced the need for procedural fluid flushes.
Chapters 8 & 9 describes two studies examining the baseline performance and impact of training
modules on the accuracy of colonic lesion and polyp characterisation amongst non-endoscopists
and endoscopists with varying degrees of experience. Baseline performance of experienced
endoscopists was found to be no different to that of inexperienced endoscopists and novices in
2
both studies, but training improved accuracy in all groups. These studies highlight the need for
training in lesion characterisation to become part of the formal training programme for all
endoscopists.
3
Declaration
Whilst registered as a candidate for the above degree, I have not been registered for any other research award. The results and conclusions embodied in this thesis are the work of the named candidate and have not been submitted for any other academic award.
Word count = 48962
4
Acknowledgements
The work that underpins this thesis would not have been possible without the help of
many individuals. First and foremost I would like to thank my two supervisors Professor
Pradeep Bhandari and Dr James Brown for their unstinting support, ideas,
encouragement and guidance. None of this work would have been possible without
them.
I would also like to thank my endoscopy research fellow colleagues, Gaius Longcroft-
Wheaton, who’s initial work led to many of the projects in this thesis and has been a
constant support, and Rupam Bhattacharyya who assisted me with many of the projects.
The staff of the Queen Alexandra Hospital endoscopy unit were, as ever, accommodating,
helpful and supportive of research activity in the department. In particular I would like to
thank the research nurses for their assistance with the NICEVIS study.
The Trust research department under the guidance of Anoop Chauhan and Kate
Greenwood have been a great source of help and guidance.
Finally, this work would not have been possible without the support of my wife Alex over
the past five years. She is now looking forward to me spending a little less time ‘with the
polyps’.
5
Publictions & presentations arising from this work
Full publications
• High-definition endoscopy with i-Scan for evaluation of small colon polyps: the HiSCOPE study Basford PJ, Longcroft-Wheaton G, Higgins B, Bhandari P Gastrointestinal Endoscopy 2014 Jan; 79(1): 111-8
• Indigo carmine or Lugol’s iodine? A beginner’s guide to chromoendoscopy and advanced imaging Basford P, Benton A, Jarvis T, Bhandari P Gastrointestinal Nursing 2013 11 (6); 16-23
Oral presentations
BSG 2011
• Colonic lesion histology prediction: comparison between experts, registrars,
consultants, BCS nurses and endoscopy research fellows P J Basford, R J Mead, T Uraoka,
T Matsuda, P Bhandari Gut 2011;60:Suppl 1 A12
UEGW 2011
• Colonic lesion histology prediction: a comparison of in-vivo diagnosis skills between UK endoscopists P J Basford, *, R J Mead, T Uraoka, T Matsuda, P Bhandari
UEGW 2012
• High Definition endoscopy increases the number of adenomas detected in the UK Bowel Cancer Screening Population PJ Basforrd, S Tholoor, J Homer, P Bhandari
• High definition white light endoscopy & i-Scan for in-vivo characterisation of small colonic polyps : no need to push the button PJ Basford, G Longcroft-Wheaton, P Bhandari
BSG 2013
• High definition white light endoscopy & i-Scan for small colonic polyp evaluation : Results of the HiSCOPE Study PJ Basford, GR Longcroft-Wheaton, B Higgins, P Bhnardari – received best oral presentation prize, Endoscopy Section
6
Poster Abstracts
DDW 2011
• Colonic polyp recognition skills: a blinded comparison of lesion recognition skills amongst UK endoscopists P J Basford, *, R J Mead, T Uraoka, T Matsuda, P Bhandari
DDW 2012
• High Definition endoscopy increases the number of adenomas detected in the UK Bowel Cancer Screening Population PJ Basford, S Tholoor, J Homer, P Bhandari
DDF 2012
• High Definition endoscopy increases the number of adenomas detected in the UK Bowel Cancer Screening Population PJ Basford, S Tholoor, J Homer, P Bhandari
• i-Scan in the evaluation of small colonic polyps: outcomes and learning curve from a large prospective series P. J. Basford, G. R. Longcroft-Wheaton, P. Bhandari
UEGW 2012
• The learning curve for in-vivo characterisation of small colonic polyps: number needed to train (NNT) is 200 polyps PJ Basford, G Longcroft-Wheaton, P Bhandari
DDW 2013
• Prospective comparison of FICE and i-Scan for in-vivo characterisation of small colonic polyps PJ Basford GR Longcroft-Wheaton, P Bhandari – Poster chosen to be showcased at Education and Networking Exchange event
• The learning curve for in-vivo characterisation of small colonic polyps: Number needed to train (NNT) is 200 polyps PJ Basford, GR Longcroft-Wheaton – received ASGE Cook Marsha Dreyer Award DDW 2013
• High definition white light endoscopy and i-Scan for in-vivo characterisation of small colonic polyps: No need to push the button PJ Basford, GR Longcroft-Wheaton, P Bhandari
BSG 2013
• Prospective comparison of FICE and i-Scan for in-vivo characterisation of small colonic polyps PJ Basford, GR Longcroft-Wheaton, P Bhandari
UEGW 2013
• The learning curve for in-vivo characterisation of small colonic polyps: comparison between expert and trainee endoscopist PJ Basford, GR Longcorft-Wheaton, P Bhandari
7
DDW 2015
• NICEVIS - Results of a randomised controlled trial of Simeticone and n-acetylcysteine as a pre-procedure drink to improve mucosal visibility during diagnostic gastroscopy P Basford, J Brown, L Gadeke, C Fogg, B Haysom-Newport, R Ogollah, B Higgins, R Bhattacharyya, G Longcroft-Wheaton, F Thursby-Pelham, J Neale, P Bhandari
DDF 2015
• Defining the optimal i-Scan settings for small colonic polyp characterisation – results from a large prospective P. J. Basford, G. Longcroft-Wheaton, P. Bhandari
• NICEVIS - Results of a randomised controlled trial of Simeticone and n-acetylcysteine as a pre-procedure drink to improve mucosal visibility during diagnostic gastroscopy P Basford, J Brown, L Gadeke, C Fogg, B Haysom-Newport, R Ogollah, B Higgins, R Bhattacharyya, G Longcroft-Wheaton, F Thursby-Pelham, J Neale, P Bhandari
8
Contents
Chapter 1 - The burden of gastrointestinal cancer ........................................................................... 20
1.1 Gastrointestinal cancer incidence and outcomes ................................................................... 20
1.2 Oesophageal Cancer ............................................................................................................... 23
1.3 Gastric Cancer ......................................................................................................................... 27
1.4 Colorectal cancer and colonic polyps...................................................................................... 29
Chapter 2 - The changing role of endoscopy in the diagnosis and treatment of gastrointestinal cancer and precursor lesions ............................................................................................................ 33
2.1 The history of gastrointestinal endoscopy .............................................................................. 33
2.2 Progression from a diagnostic to therapeutic device ............................................................. 34
2.3 Indications for Endoscopy ....................................................................................................... 36
2.4 Lesion Detection ..................................................................................................................... 37
2.5 Adenoma Detection Rate ........................................................................................................ 38
2.6 Chromoendoscopy .................................................................................................................. 42
2.6.1 Methylene Blue ................................................................................................................ 42
2.6.2 Lugol’s Iodine ................................................................................................................... 44
2.6.3 Acetic Acid ........................................................................................................................ 45
2.6.4 Cresyl Violet ..................................................................................................................... 46
2.6.5 Indigo carmine ................................................................................................................. 50
2.7 Advanced Endoscopic Imaging Techniques ............................................................................ 52
2.7.1 Narrow-Band Imaging ...................................................................................................... 52
2.7.2 Flexible Spectral Imaging Colour Enhancement (FICE) .................................................... 54
2.7.3 i-Scan ................................................................................................................................ 55
2.7.4 Autofluorescence imaging ............................................................................................... 60
2.7.5 Confocal Laser Endomicroscopy ...................................................................................... 61
2.7.6 High definition endoscopy ............................................................................................... 64
Chapter 3 - In-vivo optical characterisation in the colon ................................................................. 65
3.1 Types of Colonic Mucosal lesions ........................................................................................... 65
3.2 The concept of in-vivo characterisation.................................................................................. 65
3.3 Early attempts at colonic in-vivo characterisation.................................................................. 67
3.4 Chromoendoscopy for the in-vivo characterisation of colonic lesions ................................... 68
3.5 Magnifying Chromoendoscopy ............................................................................................... 70
3.6 Non-magnifying Chromoendoscopy ....................................................................................... 72
9
3.7 Narrow-band imaging (NBI) with magnification ..................................................................... 75
3.8 Narrow-band imaging without magnification......................................................................... 79
3.9 Flexible Spectral Imaging Colour Enhancement (FICE) ........................................................... 84
3.10 i-Scan ..................................................................................................................................... 87
3.11 Autofluorescence Imaging .................................................................................................... 90
3.12 Confocal Laser Endomicroscopy ........................................................................................... 92
3.13 The clinical significance of small and diminutive colonic polyps .......................................... 94
3.14 Effect of polyp size on in-vivo characterisation outcomes ................................................... 96
3.15 Clinical applications of in-vivo characterisation of small colonic polyps ............................ 101
3.16 Effect of Endoscopist experience and training ................................................................... 105
Chapter 4 – Use of i-Scan for the in-vivo characterisation of small colonic polyps – developing and validating a system for characterising small colonic polyps with i-Scan and determining the performance of individual components of i-Scan ........................................................................... 108
4.1 Introduction – Systems for characterising small colonic polyps ........................................... 108
4.1.1 NBI .................................................................................................................................. 108
4.1.2 FICE ................................................................................................................................. 109
4.1.3 i-Scan .............................................................................................................................. 110
4.2 Development of a system for characterising small colonic polyps with i-Scan .................... 112
4.2.1 Aims................................................................................................................................ 112
4.2.2 Methods ......................................................................................................................... 112
4.2.3 Results ............................................................................................................................ 118
4.2.4 Discussion ....................................................................................................................... 120
4.3 Validating the system for characterising small colonic polyps with i-Scan and analysing separate i-Scan components ....................................................................................................... 122
4.3.1 Aims................................................................................................................................ 122
4.3.2 Methods ......................................................................................................................... 122
4.3.3 Results ............................................................................................................................ 124
4.3.4 Discussion ....................................................................................................................... 128
Chapter 5 – In-vivo study of high definition white light endoscopy, i-Scan and Indigo carmine for the in-vivo diagnosis of small colonic polyps .................................................................................. 131
5.1 Introduction .......................................................................................................................... 131
5.2 Aims....................................................................................................................................... 133
5.3 Methods ................................................................................................................................ 133
5.4 Results ................................................................................................................................... 136
5.4.1 Study population ............................................................................................................ 136
10
5.4.2 Polyp size, morphology, location and histology............................................................. 136
5.4.3 In-vivo characterisation results – all polyps ................................................................... 137
5.4.4 In-vivo characterisation results – diminutive polyps ..................................................... 137
5.4.5 Results of low confidence assessments ......................................................................... 138
5.4.6 Surveillance intervals ..................................................................................................... 139
5.5 Discussion .............................................................................................................................. 140
Chapter 6 - Comparison between standard definition and high definition endoscopy for the detection of colonic polyps in the UK Bowel Cancer Screening Programme ................................. 147
6.1 Introduction .......................................................................................................................... 147
6.2 Aims....................................................................................................................................... 149
6.3 Outcome Measures ............................................................................................................... 149
6.4 Power calculations ................................................................................................................ 149
6.5 Definitions ............................................................................................................................. 150
6.6 Exclusion criteria ................................................................................................................... 151
6.7 Ethical considerations ........................................................................................................... 151
6.8 Methods ................................................................................................................................ 151
6.9 Statistics ................................................................................................................................ 152
6.10 Results ................................................................................................................................. 153
6.10.1 Baseline demographics ................................................................................................ 153
6.10.2 Adenoma detection rate .............................................................................................. 154
6.10.3 Mean Adenomas per patient (MAP) ............................................................................ 156
6.10.4 Polyp Detection Rate (PDR) ......................................................................................... 157
6.10.5 Mean Polyps per patient (MPP) ................................................................................... 158
6.10.6 Diminutive adenoma detection rate and proximal colon adenoma detection rate .... 159
6.10.7 Proximal colon serrated polyps and advanced adenomas .......................................... 160
6.10.8 Logistic Regression – ADR & PDR ................................................................................. 161
6.10.9 Logisitic Regression – DimADR & ProxADR .................................................................. 162
6.10.10 Logistic Regression – Proximal Serrated polyp detection and advanced adenoma detection ................................................................................................................................. 164
6.11 Discussion............................................................................................................................ 165
Chapter 7 - A randomised controlled trial of simeticone and n-acetylcysteine as a pre-procedure drink to improve mucosal visibility during diagnostic gastroscopy – the NICEVIS Study ............... 169
7.1 Introduction .......................................................................................................................... 169
7.2 Investigational Medicinal Products ....................................................................................... 173
7.3 Trial Objectives ...................................................................................................................... 174
11
7.4 Primary endpoints ................................................................................................................. 174
7.5 Secondary endpoints ............................................................................................................ 174
7.6 Trial Design ............................................................................................................................ 174
7.7 Inclusion Criteria ................................................................................................................... 177
7.8 Exclusion Criteria ................................................................................................................... 177
7.9 Safety Monitoring/Adverse events ....................................................................................... 177
7.10 Selection of Participants ..................................................................................................... 178
7.11 Statistics & Sample size calculation .................................................................................... 178
7.12 Results ................................................................................................................................. 179
7.12.1 Enrolment & Exclusions ............................................................................................... 179
7.12.2 Baseline group demographics ...................................................................................... 180
7.12.3 Inter observer agreement prior to rating study images .............................................. 182
7.12.4 Primary outcome measure – mucosal visibility scores ................................................ 182
7.12.5 Secondary outcomes – procedure duration and volume of flush used ....................... 184
7.13 Adverse events .................................................................................................................... 185
7.14 Discussion............................................................................................................................ 185
Chapter 8 - Colonic lesion assessment skills amongst UK endoscopists ........................................ 189
8.1 Introduction .......................................................................................................................... 189
8.2 Methods ................................................................................................................................ 189
8.3 Statistics ................................................................................................................................ 191
8.4 Results ................................................................................................................................... 192
8.4.1 Overall accuracy pre and post training .......................................................................... 192
8.4.2 Sensitivity pre- and post-training ................................................................................... 194
8.4.3 Specificity pre- and post-training ................................................................................... 195
8.4.4 Interobserver agreement ............................................................................................... 196
8.4.5 Performance by modality ............................................................................................... 196
8.5 Conclusions ........................................................................................................................... 197
Chapter 9 - Endoscopic characterisation of small colonic polyps – comparison between medical students, registrars and consultants and the impact of a novel web-based training intervention202
9.1 Introduction .......................................................................................................................... 202
9.2 Aims....................................................................................................................................... 203
9.3 Methods ................................................................................................................................ 203
9.4 Statistics ................................................................................................................................ 208
9.5 Results ................................................................................................................................... 209
12
9.5.1 Overall Accuracy ............................................................................................................ 209
9.5.2 Sensitivity, Specificity & Negative Predictive Value ....................................................... 211
9.5.3 Interobserver agreement ............................................................................................... 213
9.5.4 Performance by modality ............................................................................................... 213
9.5.5 Confidence ratings by subject group ............................................................................. 215
9.5.6 Confidence rating by modality ....................................................................................... 217
9.5.7 Accuracy of high confidence predictions ....................................................................... 217
9.6 Conclusions ........................................................................................................................... 218
Chapter 10 – Summary of work and suggestions for future research ............................................ 222
List of Figures
Endoscopic figures used in this thesis are in magnification of x50-x150.
Figure 1 - The 20 Most Common Cancers, Percentage Change in European Age-Standardised Three Year Average Incidence Rates, Males, UK, 2000-2002 and 2009-2011. ................................. 21 Figure 2 - The 20 Most Common Cancers, Percentage Change in European Age-Standardised Three Year Average Incidence Rates, Females, UK, 2000-2002 and 2009-2011. ....................................... 22 Figure 3 - Oesophageal Cancer, Age-Standardised Five-Year Relative Survival Rates, England and Wales 1971-1995 and England 1996-2009. ...................................................................................... 23 Figure 4 - Oesophageal Cancer (C15), European Age-Standardised Incidence Rates, Great Britain, 1975-2011. ........................................................................................................................................ 24 Figure 5 - Features used to stage oesophageal carcinoma by TNM classification. .......................... 26 Figure 6 - Stomach Cancer (C16), European Age-Standardised Incidence Rates, Great Britain, 1975-2011. ................................................................................................................................................. 28 Figure 7 - Gastric Cancer (C16), Age-Standardised Five-Year Relative Survival Rates, England and Wales 1971-1999 and England 2001-2009. ...................................................................................... 28 Figure 8 - Age standardised UK colorectal cancer 5-year survival rates for adults, change over time .......................................................................................................................................................... 31 Figure 9 - Strip biopsy technique.. .................................................................................................... 35 Figure 10 - Cumulative hazard rates for interval colorectal cancer, according to the endoscopist’s adenoma detection rate (ADR). ........................................................................................................ 39 Figure 11 –Methylene blue staining in the colon. ............................................................................ 43 Figure 12 – Oesophageal squamous dysplasia. ................................................................................ 45 Figure 13 - Use of acetic acid chromoendoscopy in Barrett’s oesophagus ...................................... 46 Figure 14 - Use of acetic acid chromoendoscopy for the detection of early gastric neoplasia.. ...... 46 Figure 15 - Magnifiying endoscopy procedure ................................................................................. 47 Figure 16 - Kudo’s pit patterns .......................................................................................................... 48 Figure 17 - Type I pit pattern after cresyl violet staining .................................................................. 49
13
Figure 18 - Type 2 pit pattern ........................................................................................................... 49 Figure 19 - Early gastric cancer in the antrum. ................................................................................. 51 Figure 20 - Confirmed T2 rectal cancer in a patient with longstanding ulcerative colitis ................ 52 Figure 21 - Explanation of the theory behind narrow NBI. ............................................................... 53 Figure 22 - Colonic adenoma viewed with standard white light and FICE ....................................... 55 Figure 23 - Pictorial explanation of i-Scan SE. ................................................................................... 56 Figure 24 - Pictorial explanation of i-Scan CE ................................................................................... 56 Figure 25 - Pictorial explanation of i-Scan TE .................................................................................... 57 Figure 26 - Adenomatous polyp viewed with HDWL. ....................................................................... 58 Figure 27 - Adenomatous polyp viewed with i-Scan 1. ..................................................................... 59 Figure 28 - Adenomatous polyp viewed with i-Scan 2 ...................................................................... 59 Figure 29 - Adenomatous polyp viewed with i-Scan 3 ...................................................................... 60 Figure 30 - 20mm flat colonic adenoma viewed with standard white light and AFI ....................... 61 Figure 31 - Integrated CLE system .................................................................................................... 62 Figure 32 - Probe-based CLE system ................................................................................................. 62 Figure 33 – CLE example images of colonic mucosa. ........................................................................ 63 Figure 34 - Advanced stricturing rectal cancer. ................................................................................ 66 Figure 35 - Kudo’s pit patterns. ......................................................................................................... 69 Figure 36 - Magnifying endoscopic assessment with NBI. ................................................................ 78 Figure 37 - British Society of Gastroenterology colonoscopic surveillance interval guidelines. .... 102 Figure 38 - Endoscopic capillary vessel classification using FICE .................................................... 110 Figure 39- Example of a polyp graded as hypovascular with i-Scan. .............................................. 114 Figure 40 - Example of a polyp graded as isovascular with i-Scan. ................................................. 114 Figure 41 - Example of a polyp graded as hypervascular with i-Scan. ............................................ 114 Figure 42 - Example of a polyp with no visible vessels ................................................................... 115 Figure 43 - Example of a polyp demonstrating a fine vessel not following the edges of crypts .... 116 Figure 44 - Example of a polyp with dense regular pericryptal vessels .......................................... 116 Figure 45 - Example of a polyp with no visible surface patterns .................................................... 117 Figure 46 - Example of a polyp with large non-compact pits ......................................................... 117 Figure 47 - Example of a polyp with compact regular tubular pits ................................................. 118 Figure 48 - Adenomatous polyp viewed with HDWL and i-Scan .................................................... 132 Figure 49 - Hyperplastic polyp viewed with HDWL and i-Scan ...................................................... 132 Figure 50 - Adapted NAC Classification System ............................................................................. 134 Figure 51 – Mucosal visibility examples Score 1/2 ......................................................................... 176 Figure 52 – Mucosal visibility examples Score 3/4 ......................................................................... 176 Figure 53 - Study enrolement and exclusions flow chart ............................................................... 180 Figure 54- Distribution of mucosal visibility scores. ....................................................................... 183 Figure 55 - Example images from image library of colonic lesions viewed with white light, chromoendoscopy and magnifying chromoendoscopy .................................................................. 190 Figure 56 - Example slides from the in-vivo diagnosis training module. ........................................ 191 Figure 57- Overall score pre and post training ............................................................................... 194 Figure 58 - Screenshot image from the Prezi web-based training module .................................... 205 Figure 59 - Screenshot image from the Prezi web-based training module .................................... 206 Figure 60 - Screenshot image from the Prezi web-based training module .................................... 206 Figure 61 - Screenshot image from the Prezi web-based training module .................................... 207
14
Figure 62 – Pre and Post-training accuracy by group with comparisons between groups ............ 210 Figure 63 - Individual participant accuracy scores pre- and post-training ..................................... 211 Figure 64- Pre- and Post-training mean accuracy by modality ....................................................... 214 Figure 65 - Image capture with an early endoscope using a polaroid camera directed at the monitor. .......................................................................................................................................... 222
List of Tables
Table 1 - FICE pre-set bandwidths.. .................................................................................................. 54 Table 2 - Relationship between pit patterns and histopathological diagnosis. ................................ 70 Table 3 - Studies of magnifying chromoendoscopy for the characterisation of colonic polyps. ...... 72 Table 4 - Results of In-vivo characterisation of 206 colonic polyps reproduced from Fu et al187. ... 74 Table 5 - Studies of non-magnifying indigo carmine chromoendoscopy for the characterisation of colonic polyps ................................................................................................................................... 74 Table 6 - In-vivo characterisation of 116 small polyps using magnifying NBI ................................... 77 Table 7- Studies of magnifying narrow-band imaging for the characterisation of colonic polyps ... 79 Table 8 - Modified Kudo’s classification and Vascular colour intensity with NBI. ............................ 81 Table 9 - Studies of non-magnifying narrow-band imaging for the characterisation of colonic polyps. ............................................................................................................................................... 83 Table 10 - Studies of FICE for the in-vivo characterisation of colonic polyps. .................................. 86 Table 11 - Unified endoscopic classification of diminutive colonic polyps under digital chromoendoscopy ............................................................................................................................ 88 Table 12 - Studies of in-vivo characterisation of colonic polyps using i-Scan. .................................. 89 Table 13 - Studies of Autofluorescence imaging (AFI) for the in-vivo characterisation of colonic lesions. .............................................................................................................................................. 91 Table 14 - Studies of in-vivo characterisation of colonic lesions by confocal laser endomicroscopy. .......................................................................................................................................................... 93 Table 15 - Classification of polyp size ............................................................................................... 94 Table 16 - Proportion of polyps found during colonoscopy that are small or diminutive. ............... 94 Table 17 - Risk of advanced neoplasia or cancer in small and diminutive colonic polyps. ............... 96 Table 18 - Effect of polyp size on in-vivo diagnosis outcomes with white light endoscopy. ............ 97 Table 19 - Cases with incorrect prediction of histology by polyp size .............................................. 97 Table 20 - Effect of polyp size on in-vivo diagnosis outcomes with chromoendoscopy. ................. 98 Table 21 - Effect of polyp size on in-vivo diagnosis outcomes with advanced endoscopic imaging techniques. ...................................................................................................................................... 100 Table 22- NICE classification for classification of diminutive colorectal polyps ............................. 109 Table 23 - Endoscopic classification of diminutive colonic polyps using digital chromoendoscopy. ........................................................................................................................................................ 111 Table 24 - Histology prediction with HDWL and i-Scan using modified Kudo’s pit pattern and vascular colour intensity. ................................................................................................................ 111 Table 25 - Features of the modified NAC classification system ...................................................... 119 Table 26 - Features of adenomatous polyps visible with i-Scan 1, 2 and 3 .................................... 124 Table 27 - Features of hyperplastic polyps visible with i-Scan 1, 2 and 3 ....................................... 125
15
Table 28 - Sensitivity, specificity and overall accuracy of 100 polyps viewed with i-Scan 1, 2 and 3 ........................................................................................................................................................ 126 Table 29 - NAC classification system adapted for i-Scan ................................................................ 134 Table 30- Polyp location and histology. .......................................................................................... 136 Table 31 - Results of in-vivo characterisation with HDWL, i-Scan and chromoendoscopy for all polyps. ............................................................................................................................................. 137 Table 32 - Results of in-vivo characterisation with HDWL, i-Scan and chromoendoscopy for polyps ≤5mm .............................................................................................................................................. 138 Table 33 - Final histology of 29 polyps with low confidence in-vivo assessments. ........................ 139 Table 34 - Patients in whom surveillance interval using optical diagnosis of DCPs with high confidence assessments differed from that determined by histopathology as per BSG guidelines ........................................................................................................................................................ 140 Table 35 - Studies of white light endoscopy for the in-vivo characterisation of colonic polyps. ... 142 Table 36 - Studies comparing the adenoma detection rate (ADR) using standard definition endoscopes (SD) and high definition endoscopes (HD). ................................................................. 148 Table 37 - Studies comparing the mean adenomas per patient (MAP) using standard definition endoscopes (SD) and high definition endoscopes (HD). ................................................................. 148 Table 38 - Baseline demographics of SD and HD groups. ............................................................... 154 Table 39 - Mean withdrawal time for negative colonoscopies. ...................................................... 154 Table 40 - Univariate analysis of factors associated with ADR ....................................................... 155 Table 41 - Univariate analysis of factors associated with MAP ...................................................... 156 Table 42 - Univariate analysis of factors associated with PDR ....................................................... 157 Table 43 - Univariate analysis of factors associated with MPP ...................................................... 158 Table 44 - Univariate analysis of factors associated with DimADR and ProxADR .......................... 159 Table 45 - Univariate analysis of factors associated with proximal serrated polyp detection rate and advanced adenoma detection rate .......................................................................................... 160 Table 46 - Multivariant analysis of independent variables associated with ADR and PDR. ........... 162 Table 47 - Multivariant analysis of independent variables associated with DimADR and ProxADR. ........................................................................................................................................................ 163 Table 48 - Multivariant analysis of independent variables associated with proximal serrated polyp detection rate and advanced adenoma detection rate. ................................................................. 165 Table 49 - Previous studies of pre-endoscopy preparatory drinks ................................................. 171 Table 50 - Baseline demographics .................................................................................................. 181 Table 51 - Mucosal visibility scores ................................................................................................. 182 Table 52 - Distribution of mucosal visibility scores. ........................................................................ 183 Table 53- Procedure duration and volume of intraprocedural flush required ............................... 184 Table 54 - Overall accuracy pre- and post-training ......................................................................... 193 Table 55 - Sensitivity for neoplasia pre- and post-training ............................................................. 195 Table 56 - Specificity pre- and post-training ................................................................................... 195 Table 57 - Interobserver agreement pre- and post-training........................................................... 196 Table 58 - Overall accuracy analysed by modality by group and pre-/post-training. ..................... 197 Table 59- Pre-training accuracy by group with comparisons between groups .............................. 209 Table 60 - Post-training accuracy by group with comparisons between groups ............................ 210 Table 61 - Pre-training and post-training sensitivity by group with comparisons between groups ........................................................................................................................................................ 212
16
Table 62 - Pre-training and post-training specificity by group with comparisons between groups ........................................................................................................................................................ 212 Table 63 - Pre-training and post-training negative predictive value by group with comparisons between groups .............................................................................................................................. 212 Table 64 - Mean kappa values by group pre- and post-training ..................................................... 213 Table 65 - Mean accuracy pre-training by modality ....................................................................... 213 Table 66 - Mean accuracy post-training by modality ..................................................................... 214 Table 67 - Prediction confidence ratings pre-training .................................................................... 215 Table 68 - Odds ratio of high confidence prediction pre-training - comparison between groups . 215 Table 69 - Prediction confidence ratings post-training ................................................................... 216 Table 70 - Odds ratio of high confidence prediction post-training – comparison between groups ........................................................................................................................................................ 216 Table 71 - Odds ratio of high confidence prediction pre vs post-training ...................................... 216 Table 72 - Confidence ratings by modality pre-training ................................................................. 217 Table 73 - Confidence ratings by modality post-training ................................................................ 217 Table 74 - Odds ratio of high confidence prediction by modality post-training ............................. 217 Table 75 - Mean accuracy of high confidence predictions. ............................................................ 218
17
Abbreviations
ADR – adenoma detection rate
ASGE - American Society of Gastrointestinal Endoscopy
BCSP – Bowel Cancer Screening Programme
BSG – British Society of Gastroenterology
CCD – charge coupled device
CLE – confocal laser endomicroscopy
CRC – colorectal cancer
CT – computerised tomography
EMR – endoscopic mucosal resection
ESD – endoscopic submucosal dissection
EUS - endoscopic ultrasound
FICE – flexible spectral imaging colour enhancement
GORD – gastro-oesophageal reflux disease
H2RA – histamine 2 receptor antagonist
HD – high definition
HDWL – high definition white light
IM – intestinal metaplasia
LST – laterally spreading tumour
MAP – mean adenomas per patient
MRI – magnetic resonance imaging
NPV – negative predictive value
18
PET CT – positron emission tomography computerised tomography
PPI – proton pump inhibitor
SCC – squamous cell cancer
SD – standard definition
VCI – vascular colour intensity
VPI – vascular pattern intensity
19
Chapter 1 - The burden of gastrointestinal cancer
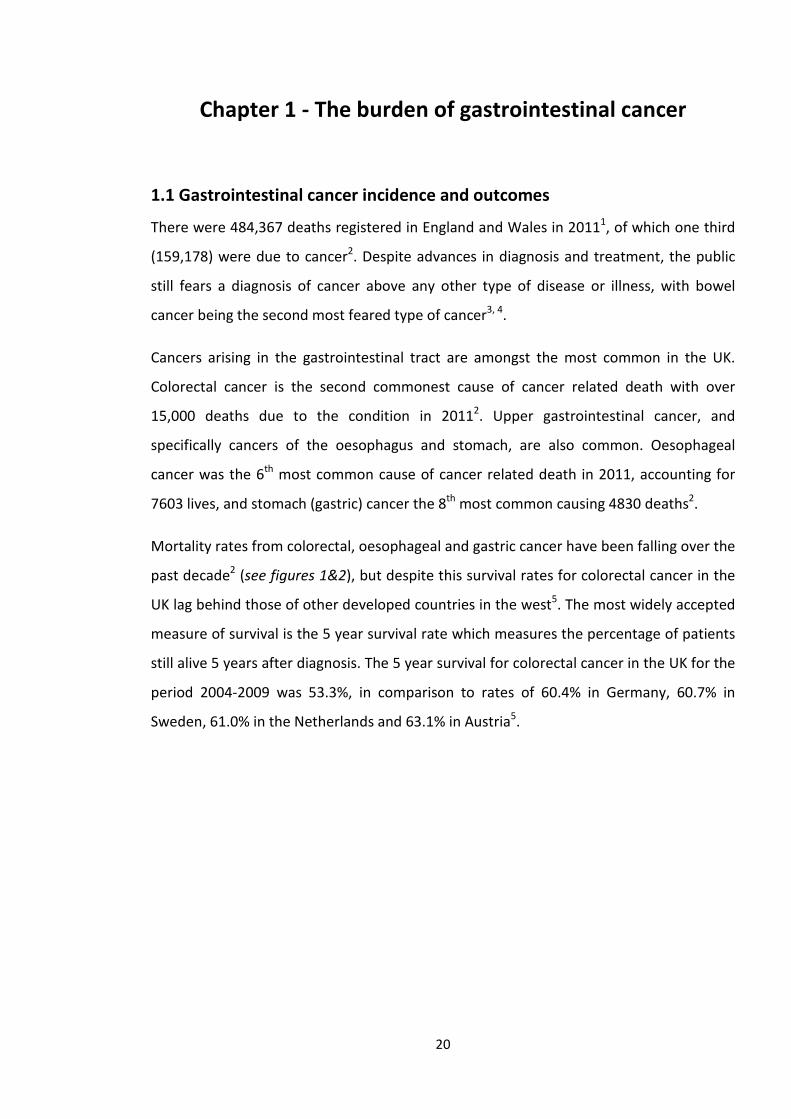
1.1 Gastrointestinal cancer incidence and outcomes
There were 484,367 deaths registered in England and Wales in 20111, of which one third
(159,178) were due to cancer2. Despite advances in diagnosis and treatment, the public
still fears a diagnosis of cancer above any other type of disease or illness, with bowel
cancer being the second most feared type of cancer3, 4.
Cancers arising in the gastrointestinal tract are amongst the most common in the UK.
Colorectal cancer is the second commonest cause of cancer related death with over
15,000 deaths due to the condition in 20112. Upper gastrointestinal cancer, and
specifically cancers of the oesophagus and stomach, are also common. Oesophageal
cancer was the 6th most common cause of cancer related death in 2011, accounting for
7603 lives, and stomach (gastric) cancer the 8th most common causing 4830 deaths2.
Mortality rates from colorectal, oesophageal and gastric cancer have been falling over the
past decade2 (see figures 1&2), but despite this survival rates for colorectal cancer in the
UK lag behind those of other developed countries in the west5. The most widely accepted
measure of survival is the 5 year survival rate which measures the percentage of patients
still alive 5 years after diagnosis. The 5 year survival for colorectal cancer in the UK for the
period 2004-2009 was 53.3%, in comparison to rates of 60.4% in Germany, 60.7% in
Sweden, 61.0% in the Netherlands and 63.1% in Austria5.
20
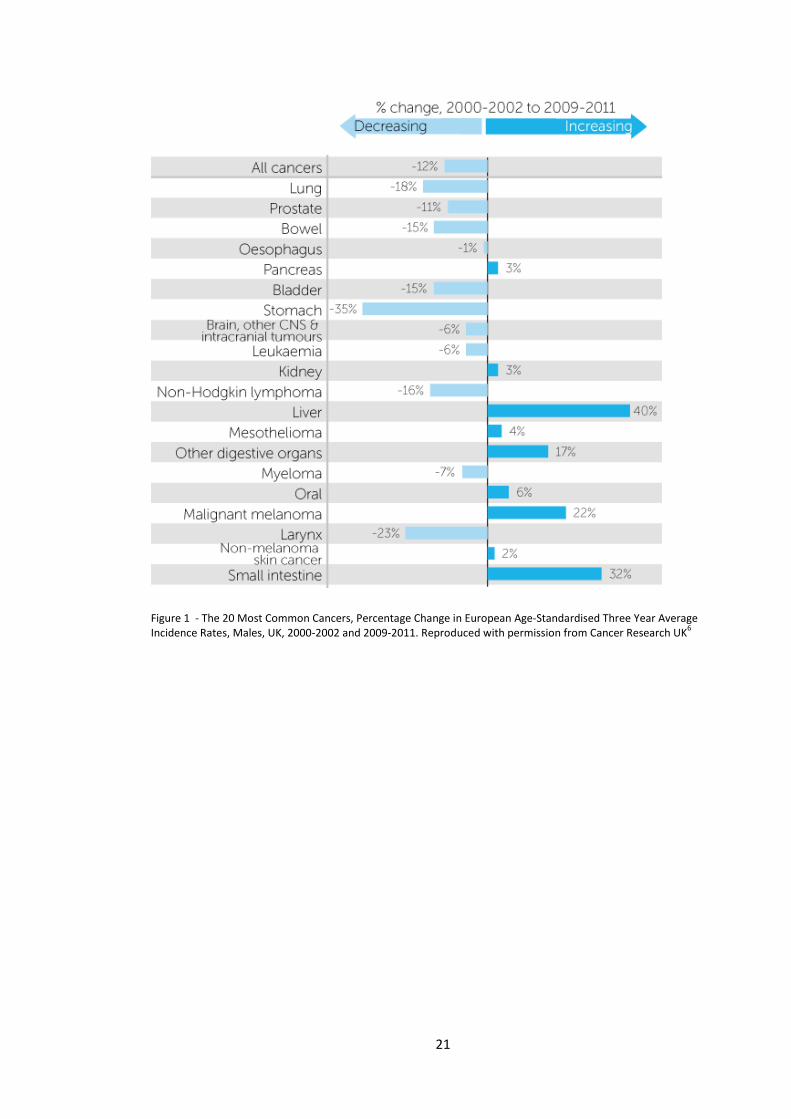
Figure 1 - The 20 Most Common Cancers, Percentage Change in European Age-Standardised Three Year Average Incidence Rates, Males, UK, 2000-2002 and 2009-2011. Reproduced with permission from Cancer Research UK6
21
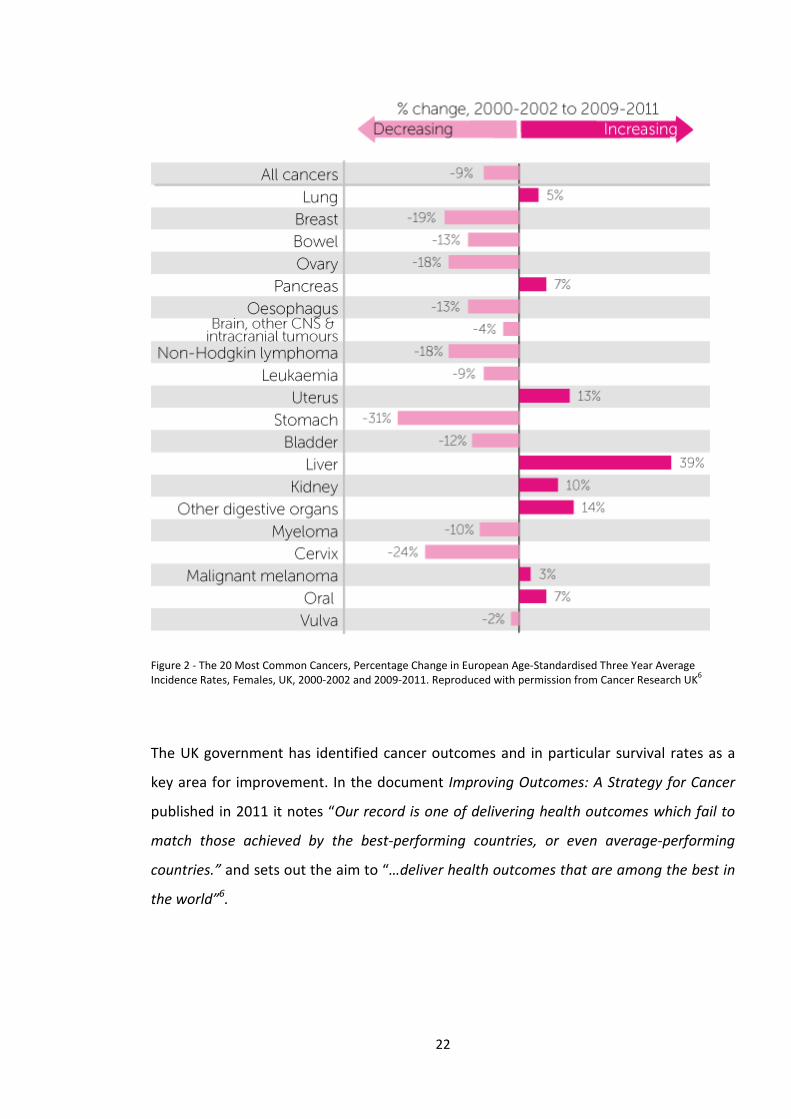
Figure 2 - The 20 Most Common Cancers, Percentage Change in European Age-Standardised Three Year Average Incidence Rates, Females, UK, 2000-2002 and 2009-2011. Reproduced with permission from Cancer Research UK6
The UK government has identified cancer outcomes and in particular survival rates as a
key area for improvement. In the document Improving Outcomes: A Strategy for Cancer
published in 2011 it notes “Our record is one of delivering health outcomes which fail to
match those achieved by the best-performing countries, or even average-performing
countries.” and sets out the aim to “…deliver health outcomes that are among the best in
the world”6.
22
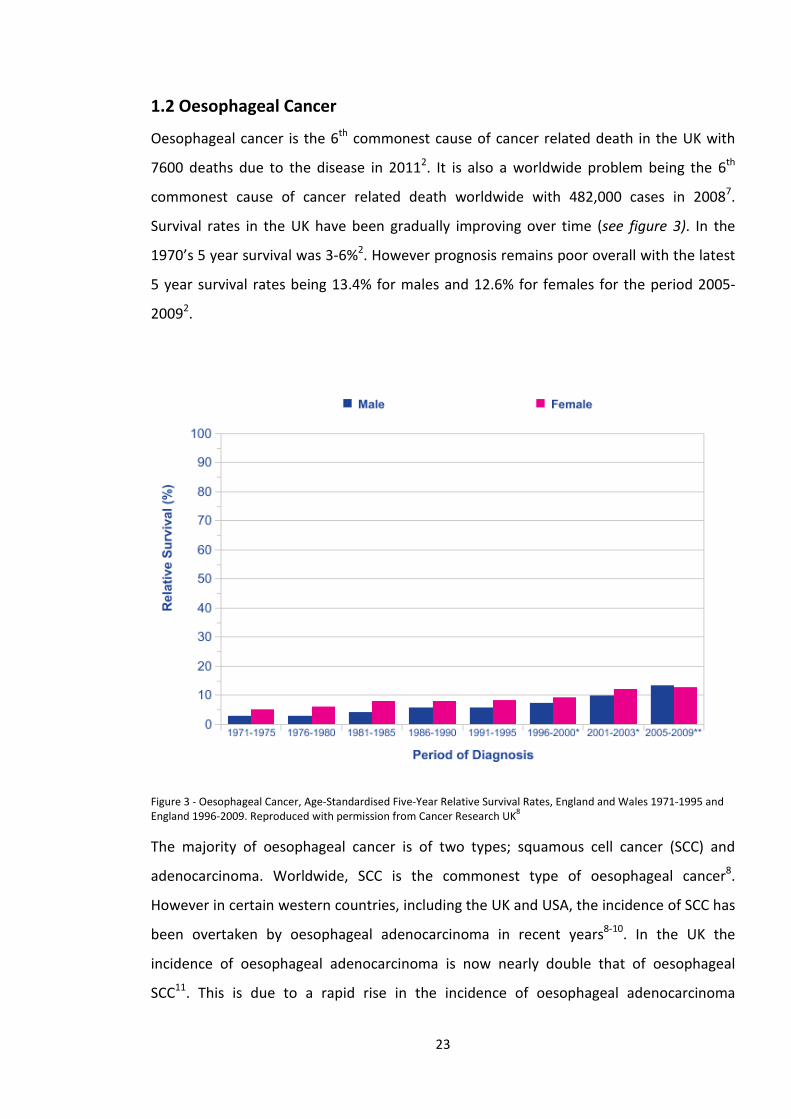
1.2 Oesophageal Cancer
Oesophageal cancer is the 6th commonest cause of cancer related death in the UK with
7600 deaths due to the disease in 20112. It is also a worldwide problem being the 6th
commonest cause of cancer related death worldwide with 482,000 cases in 20087.
Survival rates in the UK have been gradually improving over time (see figure 3). In the
1970’s 5 year survival was 3-6%2. However prognosis remains poor overall with the latest
5 year survival rates being 13.4% for males and 12.6% for females for the period 2005-
20092.
Figure 3 - Oesophageal Cancer, Age-Standardised Five-Year Relative Survival Rates, England and Wales 1971-1995 and England 1996-2009. Reproduced with permission from Cancer Research UK8
The majority of oesophageal cancer is of two types; squamous cell cancer (SCC) and
adenocarcinoma. Worldwide, SCC is the commonest type of oesophageal cancer8.
However in certain western countries, including the UK and USA, the incidence of SCC has
been overtaken by oesophageal adenocarcinoma in recent years8-10. In the UK the
incidence of oesophageal adenocarcinoma is now nearly double that of oesophageal
SCC11. This is due to a rapid rise in the incidence of oesophageal adenocarcinoma
23
amongst white men10, 12. The cause of this marked increase in incidence in this cohort has
not been established.
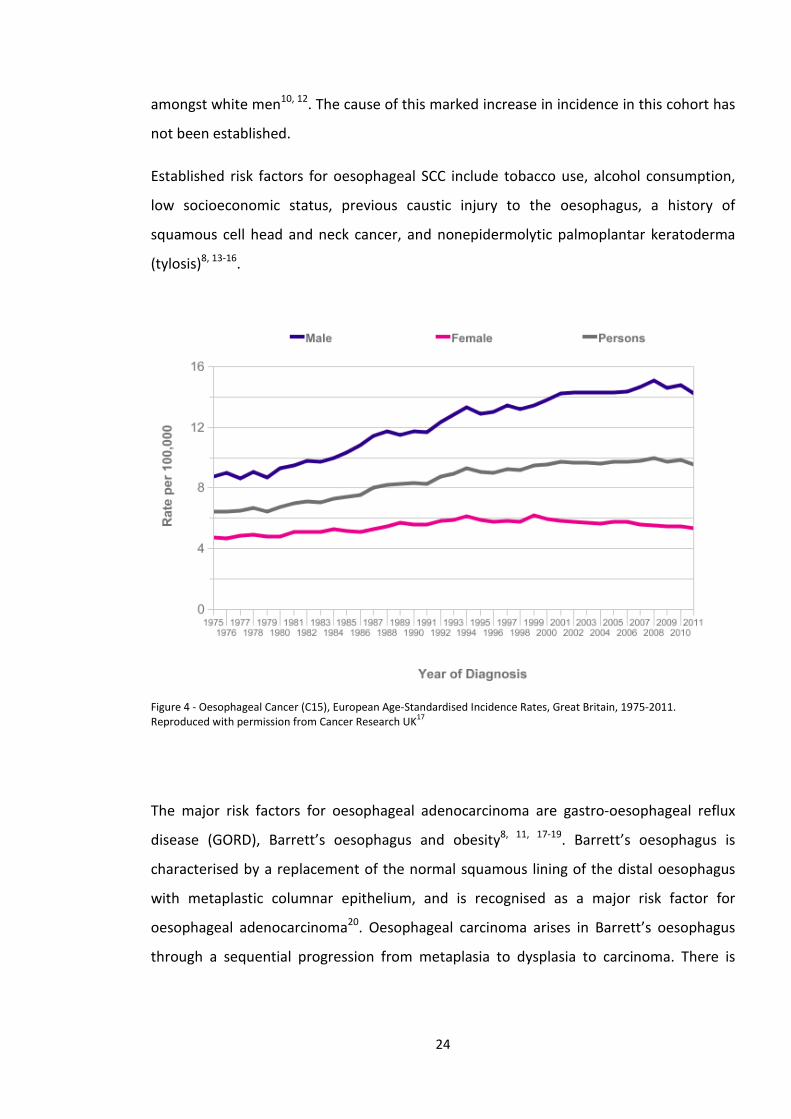
Established risk factors for oesophageal SCC include tobacco use, alcohol consumption,
low socioeconomic status, previous caustic injury to the oesophagus, a history of
squamous cell head and neck cancer, and nonepidermolytic palmoplantar keratoderma
(tylosis)8, 13-16.
Figure 4 - Oesophageal Cancer (C15), European Age-Standardised Incidence Rates, Great Britain, 1975-2011. Reproduced with permission from Cancer Research UK17
The major risk factors for oesophageal adenocarcinoma are gastro-oesophageal reflux
disease (GORD), Barrett’s oesophagus and obesity8, 11, 17-19. Barrett’s oesophagus is
characterised by a replacement of the normal squamous lining of the distal oesophagus
with metaplastic columnar epithelium, and is recognised as a major risk factor for
oesophageal adenocarcinoma20. Oesophageal carcinoma arises in Barrett’s oesophagus
through a sequential progression from metaplasia to dysplasia to carcinoma. There is
24
some evidence that Helicobacter Pylori infection may play a protective role against
developing Barrett’s oesophagus and oesophageal adenocarcinoma21, 22.
Oesophageal cancer typically presents with symptoms of dysphagia (difficulty in
swallowing) with patients usually describing a feeling of food ‘sticking’ in their gullet.
Other typical features are odynophagia (pain on swallowing), new onset of heartburn,
and weight loss.
Historically barium swallow studies were the initial investigation of choice for patients
with suspected oesophageal cancer. These have now largely been replaced by endoscopy
as the initial investigation of choice. Endoscopy offers the advantage of direct
visualisation of the oesophagus as well as the ability to take biopsy specimens. A history
of recent onset dysphagia should prompt an urgent referral from a patient’s general
practitioner via the ‘2-week wait’ pathway6. This aims to provide access to urgent
endoscopy for all patients with suspected oesophageal cancer within 2 weeks of referral.
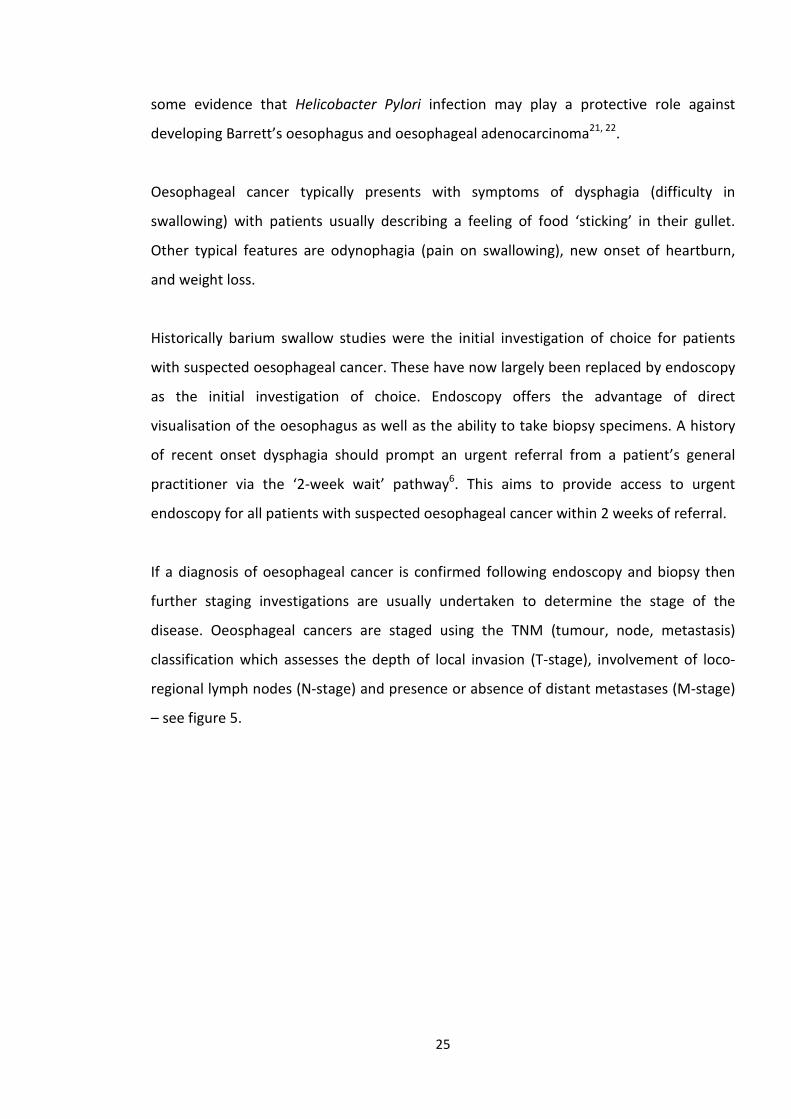
If a diagnosis of oesophageal cancer is confirmed following endoscopy and biopsy then
further staging investigations are usually undertaken to determine the stage of the
disease. Oeosphageal cancers are staged using the TNM (tumour, node, metastasis)
classification which assesses the depth of local invasion (T-stage), involvement of loco-
regional lymph nodes (N-stage) and presence or absence of distant metastases (M-stage)
– see figure 5.
25
Figure 5 - Features used to stage oesophageal carcinoma by TNM classification. Tis = intraepithelial neoplasia. HGD = high grade dysplasia. Reproduced with permission from Enzinger et al 13Copyright Massachusetts Medical Society.
Endoscopic Ultrasound (EUS) is used to assess the depth of invasion through the wall of
the oesophagus and spread to loco-regional lymph nodes8, 11, 20. Computerised
tomography scanning (CT) has also traditionally been used to assess local TNM stage.
More recently positron emission tomography CT scanning (PET-CT), using 18F-
fluorodeoxglucose to highlight foci of tumour with high metabolic activity, has been used
to identify involved lymph nodes and distant metastases which are either equivocal or
not seen on standard CT scanning8, 11, 20.
The outcome of oesophageal cancer depends greatly on the stage of disease at the time
of diagnosis. Diagnosis at a pre-cancerous stage of high grade dysplasia (Tis = carcinoma
in situ) has an excellent prognosis with 5 year survival rates in excess of 95%. Stage I
oesophageal adenocarcinoma (T1/2 without lymph node spread or metastases) has a 5
year survival rate of 50-80%, but in contrast stage III disease (lymph node spread or
invasion of adjacent organs) has a 5 year survival rate of 10-15% and stage IV disease,
characterised by distant metastases has an even more dismal prognosis with 5 year
survival rates of less than 5%13.
26
Treatment options for oesophageal adenocarcinoma are determined by staging. High
grade dysplasia or early T1 disease involving only the mucosa (intramucosal
carcinoma/T1a) are suitable for endoscopic resection. More advanced T stages require
radical surgical resection with or without pre-operative neo-adjuvant chemotherapy23.
Oesophagectomy is a major operation and carries an in-hospital mortality rate of 4.5%
and complication rate of 29.8% as reported in the 2010 UK wide audit24.
Advanced disease with distant metastases is not suitable for surgical resection and should
be treated with palliative chemotherapy, stenting of the tumour if it is causing
obstruction or best supportive care23.
Early Oesophageal SCC confined to the mucosa may be amenable to endoscopic
resection, although does carry higher risk of lymph node micro metastases than
adenocarcinoma25. Higher T stages are amenable to chemoradiotherapy followed by
surgery for operable tumours or palliative chemoradiotherapy in advanced cases or those
not suitable for surgery23.
Unfortunately the majority of cases of oesophageal cancer are too advanced for potential
curative endoscopic or surgical resection by the time they are diagnosed. Only 36% of
cases in the UK national oesophago-gastric cancer audit were suitable for potential
curative treatment24. Oesophageal tumours are usually bulky by the time they cause
sufficient luminal narrowing to lead to symptoms of dysphagia.
1.3 Gastric Cancer
Gastric cancer is the 8th commonest cause of cancer related death in the UK with over
4800 deaths due to the disease in 201126. Worldwide it accounts for 10% of cancer
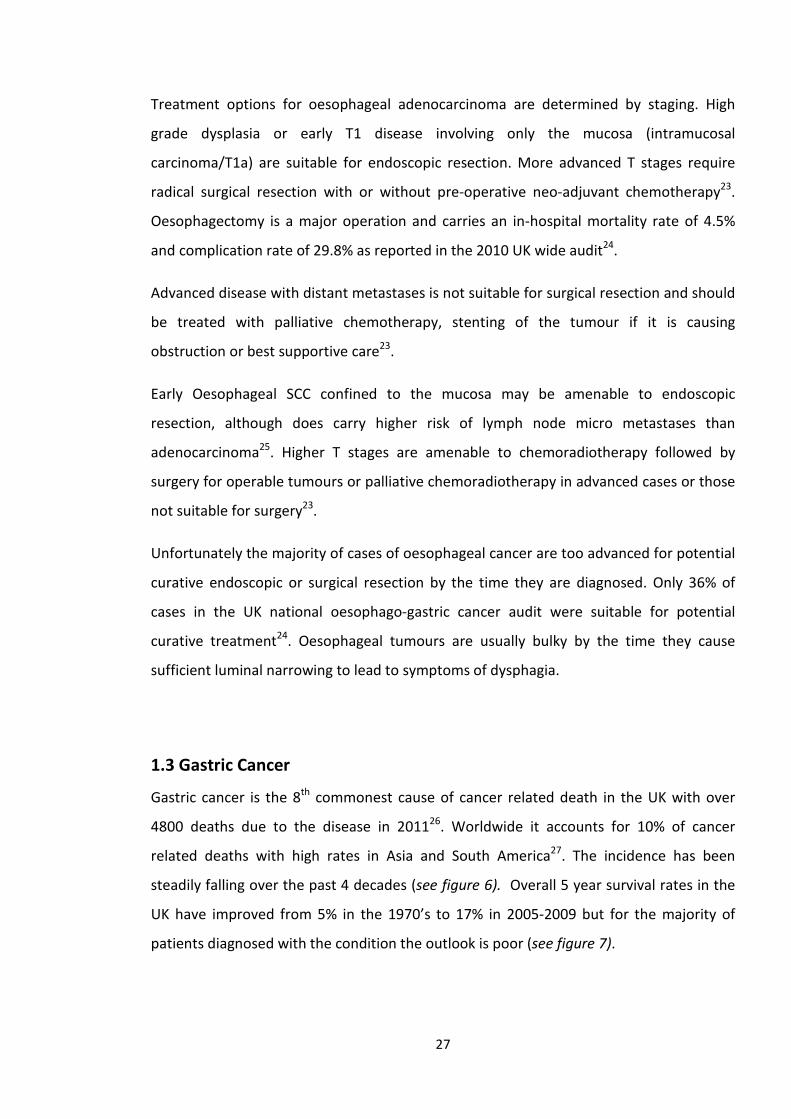
related deaths with high rates in Asia and South America27. The incidence has been
steadily falling over the past 4 decades (see figure 6). Overall 5 year survival rates in the
UK have improved from 5% in the 1970’s to 17% in 2005-2009 but for the majority of
patients diagnosed with the condition the outlook is poor (see figure 7).
27
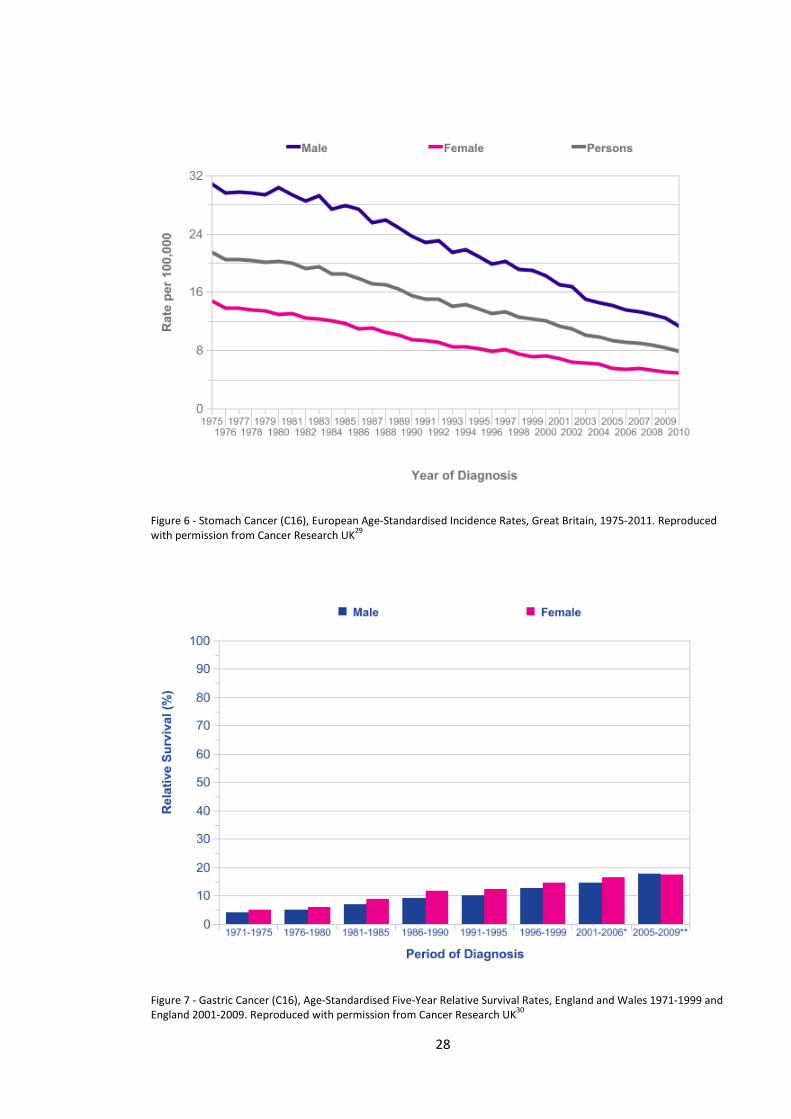
Figure 6 - Stomach Cancer (C16), European Age-Standardised Incidence Rates, Great Britain, 1975-2011. Reproduced with permission from Cancer Research UK29
Figure 7 - Gastric Cancer (C16), Age-Standardised Five-Year Relative Survival Rates, England and Wales 1971-1999 and England 2001-2009. Reproduced with permission from Cancer Research UK30
28
The vast majority of malignant neoplasms arising in the stomach are adenocarcinomas.
The major risk-factors for development of gastric adenocarcinoma are; infection with
Helicobacter pylori, cigarette smoking, high alcohol intake, high dietary salt levels and
consumption of salt based food preservatives20, 28-33. Gastric adenocarcinoma develops
slowly over time via a progression from chronic gastritis to gastric atrophy, intestinal
metaplasia, dysplasia and cancer20.
Gastric cancer can present with a variety of symptoms including new onset of dyspepsia,
weight loss, early satiety, vomiting, signs of upper gastrointestinal bleeding or anaemia20,
28. In a similar fashion to oesophageal cancer the disease is often advanced at the time of
diagnosis. In the UK national audit of 2010 only 36% of cases were suitable for potential
curative treatment24.
Diagnosis follows a similar pathway to oesophageal cancer with rapid access to upper
gastrointestinal endoscopy plus biopsy followed by staging with CT, PET-CT and EUS
depending on the location of the primary tumour23. Staging laparosocopy is also used to
exclude peritoneal micrometastases23.
Treatment options depend on the stage of disease at diagnosis with early gastric cancers
suitable for endoscopic removal by endoscopic mucosal resection (EMR) or endoscopic
submucosal dissection (ESD) with excellent long-term outcomes34-36. More advanced
disease which is suitable for curative surgical resection is usually treated with pre-
operative neo-adjuvant chemotherapy followed by partial or total gastrectomy,
depending on tumour location23. Advanced inoperable disease can be treated with
palliative chemotherapy, stenting for obstructive tumours, and best supportive care23.
1.4 Colorectal cancer and colonic polyps
Colorectal cancer (CRC) is the third commonest malignancy in the UK and the second
commonest cause of cancer death, with an annual incidence of approximately 40,000
cases37. The vast majority of CRC arises from a precursor lesion, the adenomatous colonic
polyp, via the well-established adenoma-carcinoma sequence38, 39. This process usually
takes years, via a series of mutations in oncogenes and tumour suppressor genes. Thus
29
adenomatous polyps, with the potential to develop into cancers, are present in the colon
for several years prior to the development of CRC, and are usually asymptomatic. The
removal of colonic adenomas by colonoscopic polypectomy has been shown to be highly
effective in reducing future risk of colorectal cancer40, 41.
In addition to adenomatous colonic polyps, the other main type of polyp found in the
colon is the hyperplastic polyp. True hyperplastic polyps have negligible malignant
potential. Sessile serrated polyps, which are related to hyperplastic polyps, are usually
found in the proximal colon and can progress to CRC via the alternative serrated
pathway42. However small hyperplastic polyps in the rectum and sigmoid colon are a
common finding at colonoscopy and have negligible malignant potential.
The main risk factors for sporadic colorectal cancer are increasing age, male sex, obesity,
diabetes mellitus, a history of colonic polyps, and a diet high in red meat and fat and low
in fibre42. Certain inherited conditions can also predispose to colorectal cancer; familial
adenomatous polyposis, Hereditary non-polyposis colorectal cancer (Lynch syndrome),
serrated polyposis syndrome, MUTYH-associated polyposis and Peutz-Jeghers
syndrome43, 44. However the majority of CRC cases are of the sporadic type.
Colorectal cancer typically present with passage of blood per rectum, tenesmus, change
in bowel habit or anaemia. However many of these ‘red-flag’ symptoms that prompt
urgent referral have poor sensitivity and/or specificity for colorectal cancer45. Any of
these symptoms should prompt urgent referral and the initial investigation of choice is
usually an endoscopic examination; either a flexible sigmoidoscopy which examines the
distal colon and rectum after preparation with an enema, or full colonoscopy following
purgative bowel preparation. An alternative examination for patients who are unwilling
or unable to undergo endoscopic examination is CT colonography. If colorectal cancer is
confirmed on endoscopy and biopsy further staging is performed by CT scanning, plus
MRI for rectal tumours42.
The prognosis for colorectal cancer is closely linked to stage at presentation. Early disease
carries an excellent 5 year survival of 93.2% for patients with a Duke’s A tumour, and 77%
for those with a Duke’s B tumours. More advanced disease has a far more dismal outlook
with rates of 47.7% for patients with a Duke’s C tumour and 6.6% for those with a Duke’s
30
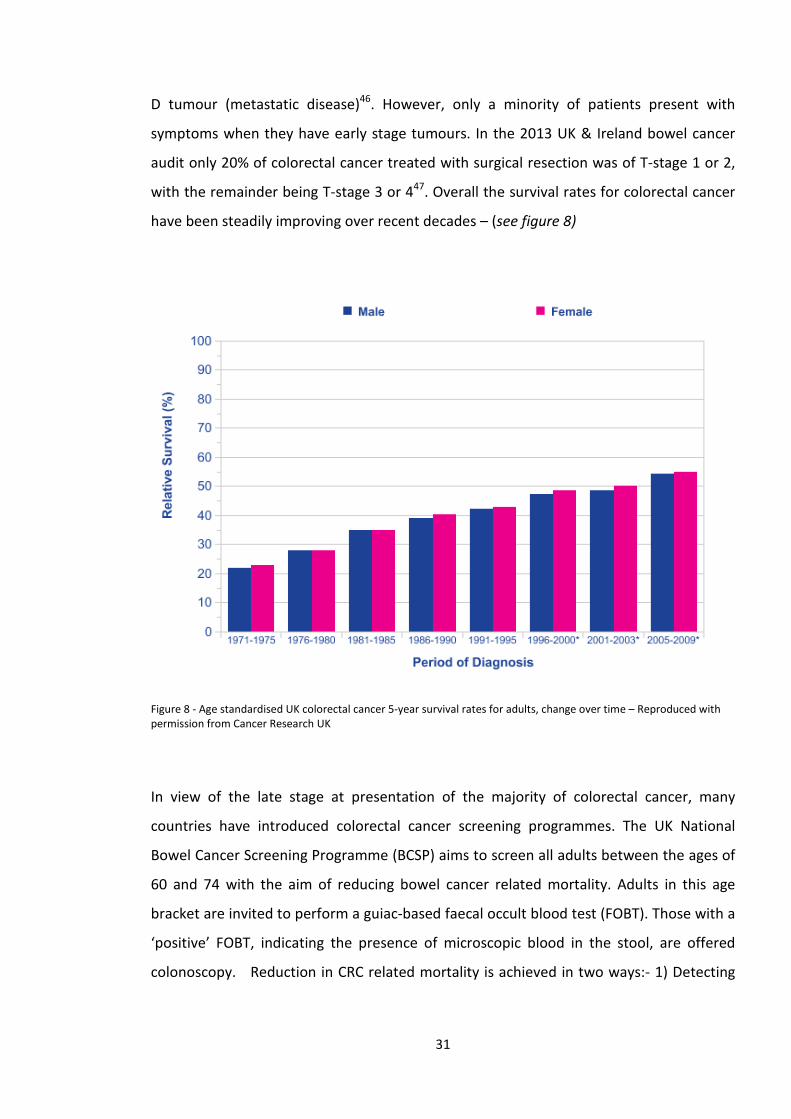
D tumour (metastatic disease)46. However, only a minority of patients present with
symptoms when they have early stage tumours. In the 2013 UK & Ireland bowel cancer
audit only 20% of colorectal cancer treated with surgical resection was of T-stage 1 or 2,
with the remainder being T-stage 3 or 447. Overall the survival rates for colorectal cancer
have been steadily improving over recent decades – (see figure 8)
Figure 8 - Age standardised UK colorectal cancer 5-year survival rates for adults, change over time – Reproduced with permission from Cancer Research UK
In view of the late stage at presentation of the majority of colorectal cancer, many
countries have introduced colorectal cancer screening programmes. The UK National
Bowel Cancer Screening Programme (BCSP) aims to screen all adults between the ages of
60 and 74 with the aim of reducing bowel cancer related mortality. Adults in this age
bracket are invited to perform a guiac-based faecal occult blood test (FOBT). Those with a
‘positive’ FOBT, indicating the presence of microscopic blood in the stool, are offered
colonoscopy. Reduction in CRC related mortality is achieved in two ways:- 1) Detecting
31
and removing potentially pre-malignant polyps 2) Detecting early bowel cancers which
are amenable to curative surgery.
32
Chapter 2 - The changing role of endoscopy in the diagnosis and treatment of gastrointestinal cancer and
precursor lesions
2.1 The history of gastrointestinal endoscopy
Endoscopy has come a long way since the early rigid gastroscopes of the late 19th century
which were introduced into the stomach in a similar fashion to a sword swallower48. The
first flexible gastroscope, introduced by Schindler and Wolf in 1932, was a major advance
and use of gastroscopes became more widespread48. In 1957 Basil Hirschowitz introduced
the first fully flexible fiberoptic gastroscope, to a rather luke-warm response from his
peers. Initial reports suggested the image quality was inferior to that obtained with a
traditional semi-flexible gastroscope using a series of lenses. Even at this early stage of
endoscopy comparisons were being drawn between the diagnostic accuracy of different
endoscopic technologies.
Instruments for examining the anus and rectum date back as far as Egypt and Pompeii48.
Rigid sigmoidoscopes were developed in the late 19th century and permitted direct
visualisation and biopsy of the rectum and distal sigmoid colon. By the 1960’s flexible
sigmoidoscopes were being developed in the USA and Japan and in the late 1960’s and
early 1970’s the first cases of total fiberoptic colonoscopy were being reported48-50.
Alongside its diagnostic capabilities, early endoscopists were also developing the
technique of colonoscopic polypectomy to remove adenomatous and other polyps.
Shinya and Wolff reported a series of several hundred endoscopic polypectomies with
good results and very low complication rates51, thus avoiding the need for laparotomy
and colectomy.
The 1980’s brought a further advance with the development of the photosensitive
charged-coupled device (CCD) or ‘chip’ allowing electronic transmission of the image to a
video monitor and the beginnings of the modern age of endoscopy52, 53. Charged-coupled
devices, made from silicon, are divided into pixels with the resolution of the image
produced being related to the number of pixels present on the ‘chip’.
33
2.2 Progression from a diagnostic to therapeutic device
As already described, colonic polypectomy was being performed even in the early days of
fiberoptic colonoscopy54. Over the intervening years several large series of endoscopic
removal of colonic polyps were published with this becoming a well-established
technique and an alternative to segmental resection of the colon54-58. The advantages of
an endoscopic approach are shorter duration of hospital stay, maintenance of bowel
integrity and swifter recovery time. In early series the main technique involved en bloc
electrocautery snare resection of pedunculated polyps and piecemeal snare resection of
sessile polyps. Complication rates were low but some patients were found to have
invasive carcinoma present in the resected specimen at rates of 3 to 24% in these early
series54-56, 58. The majority of these cases proceeded to surgical colonic resection.
Recurrence rates of adenomatous tissue were also high compared to current acceptable
standards, at up to 29%, although the majority of these could be treated by further
endoscopic resection56.
Refinement of the resection technique has occurred over the years. In 1973 Deyhle and
colleagues first described the use of a submucosal fluid injection prior to snare resection
of mucosa59. This provided a protective submucosal cushion of fluid to prevent damage to
deeper layers of the bowel wall by diathermy. This was a particular concern in the
proximal colon where the colon wall can be only 2-3mm thick. Deyhle described the use
of this technique in 10 dogs, none of which suffered a perforation, and subsequent use in
a human patient to remove 7 polyps. In 1984 Tada and colleagues described the ‘strip-off
biopsy’ technique, using a submucosal saline injection, for resecting gastric neoplasia60.
Following submucosal injection using a double-channelled endoscope the lesion was
grasped with forceps and pulled through an open snare which was subsequently closed
and resection performed. In subsequent publications by the same group the ‘strip biopsy’
technique was shown to be effective for removal of both gastric and colonic neoplasia up
to 20mm in a single piece61 and for piecemeal resection of larger lesions62. These were
the first descriptions of what is now known as endoscopic mucosal resection (EMR).
34
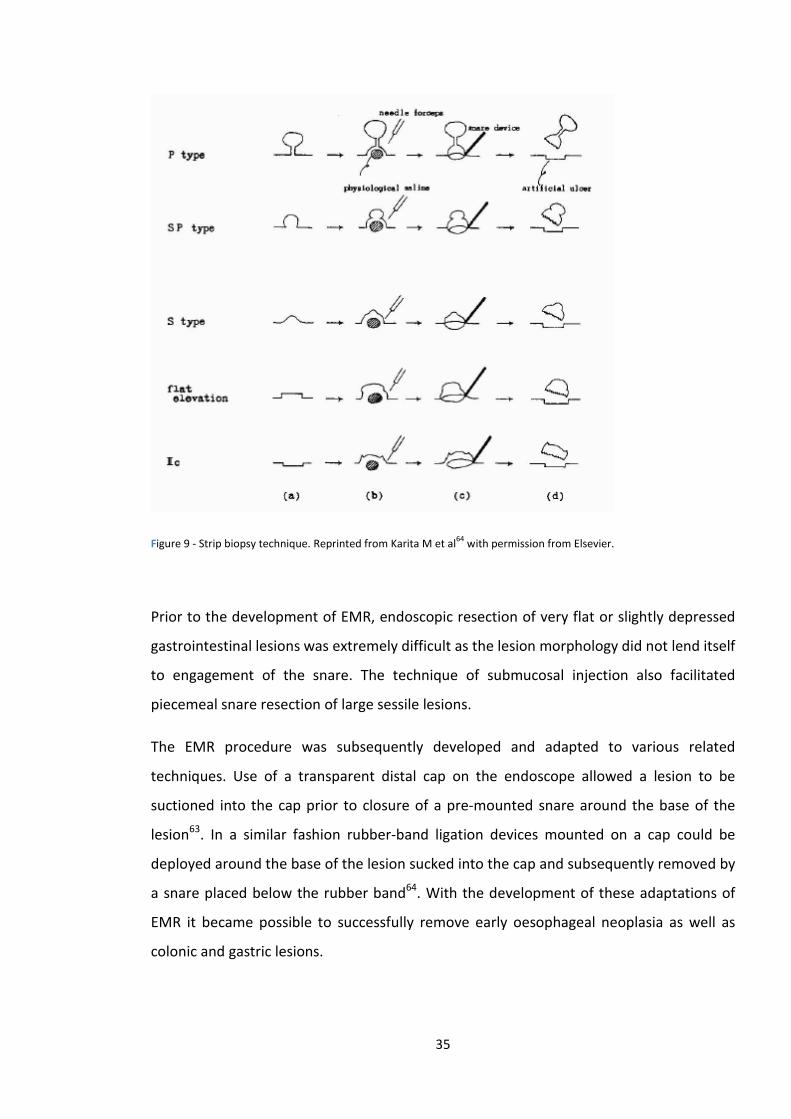
Figure 9 - Strip biopsy technique. Reprinted from Karita M et al64 with permission from Elsevier.
Prior to the development of EMR, endoscopic resection of very flat or slightly depressed
gastrointestinal lesions was extremely difficult as the lesion morphology did not lend itself
to engagement of the snare. The technique of submucosal injection also facilitated
piecemeal snare resection of large sessile lesions.
The EMR procedure was subsequently developed and adapted to various related
techniques. Use of a transparent distal cap on the endoscope allowed a lesion to be
suctioned into the cap prior to closure of a pre-mounted snare around the base of the
lesion63. In a similar fashion rubber-band ligation devices mounted on a cap could be
deployed around the base of the lesion sucked into the cap and subsequently removed by
a snare placed below the rubber band64. With the development of these adaptations of
EMR it became possible to successfully remove early oesophageal neoplasia as well as
colonic and gastric lesions.
35
The next major advance in endoscopic resection was the development of endoscopic
submucosal dissection (ESD). ESD was developed initially for the treatment of early gastric
cancers but was later adapted to colonic and oesophageal lesions. Following elevation of
a lesion by submucosal injection a circumferential mucosal incision is made using an
electrosurgical needle-knife only a few millimetres in length. In early series resection
following this circumferential incision was completed by snare resection57, 65. With
development and improvement of the technique, circumferential mucosal incision was
followed by careful submucosal dissection using the same needle-knife, allowing en bloc
resection of lesions greater than 20 mm in size.
The advantages of ESD over EMR are that it allows en bloc removal of larger lesions,
enabling a precise histopathological diagnosis to be obtained including careful assessment
of submucosal invasion. The disadvantages are that the technique is technically
demanding, takes longer to perform, and carries higher risks of the main complications of
bleeding and perforation. Despite these challenges, impressive results of ESD for gastric,
oesophageal and colorectal neoplasia have been reported, with high en bloc resection
rates and very low rates of recurrence35, 66-70.
2.3 Indications for Endoscopy
Upper and lower gastrointestinal endoscopy is performed for a number of indications: 1)
Investigation of a patient’s symptoms which may be attributable to a gastrointestinal
cause, for example dyspepsia, weight loss, change in bowel habit, per rectal bleeding or
iron-deficiency anaemia; 2) Screening for cancer precursor lesions or early cancers in
asymptomatic individuals on a population basis such as for bowel cancer screening; 3)
Surveillance in patients with a personal history of gastrointestinal cancer, precursors
lesions or risk factors for dysplastic lesions (eg previous colonic adenomas, colonic
polyposis syndromes or known Barrett’s oesophagus)71. Endoscopy is also performed as
follow-up in patients who’ve undergone previous endoscopic resection.
In the first of these groups the main focus of the procedure is to identify any potential
causes for the patients’ presenting symptoms. In the screening and surveillance groups,
36
patients are generally asymptomatic and the primary purpose of the examination is to
detect neoplastic lesions such as adenomatous colonic polyps, areas of dysplasia within
Barrett’s oesophagus or precursor lesions of gastric cancer. However, even in the
symptomatic group, endoscopy offers a valuable opportunity to detect neoplastic lesions.
Hence, one of the core aims of gastrointestinal endoscopy is to remove neoplastic lesions
and therefore reduce patients’ future risk of gastrointestinal cancer or to detect cancers
at an early stage where curative treatment is possible. For this aim to be realised several
steps in the process need to be achieved; detection, characterisation and resection.
2.4 Lesion Detection
Detection of neoplastic lesions is dependent on several factors; those related to the
lesion itself, the endoscopic equipment used including any additional techniques utilised,
and the endoscopist themselves. Advanced neoplasia is likely, by its very nature, to be
more evident during endoscopy than early neoplastic lesions. However, even invasive
lesions can be missed at endoscopy. Miss rates of up to 7% have been reported for upper
gastrointestinal cancers72, 73 and up to 5% for colorectal cancer74, 75. Unsurprisingly, miss
rates for colonic adenomas are higher than for invasive cancer as adenomas are generally
smaller and more subtle. Miss rates for colonic adenomas in tandem endoscopy studies
range from 22% to 35%76-78. Similarly, detection of early dysplastic lesions in the
oesophagus and stomach can be difficult as they can often be subtle and very similar in
appearance to the background mucosa.
Endoscopist related factors related to neoplasia detection during colonoscopy include
success of caecal intubation (ability to perform a complete examination of the colon),
experience and withdrawal technique. The caecal intubation rate, defined as percentage
of colonoscopies in which the caecum is reached, is one of the key quality measures of
colonoscopy79. If the proximal colon is not reached and visualised during the examination,
there is potential to miss neoplastic lesions in this area of bowel. Hence there has been a
drive in many countries, including the UK, to improve caecal intubation rates. This has
37
resulted in a significant improvement in the mean caecal intubation rate from 76.9% to
92.3% in UK national audits80, 81.
2.5 Adenoma Detection Rate
The most widely used measure of neoplasia detection during colonoscopy is the
Adenoma Detection Rate (ADR) which is the percentage of colonoscopies where at least
one adenomatous polyp is detected. Recent large studies have shown that an individual
endoscopist’s ADR is inversely correlated with the risk of interval colorectal cancer40, 82.
Interval cancers are those that are diagnosed between a screening colonoscopy and the
time of a subsequent planned surveillance colonoscopy. A seminal study from Poland by
Kaminski et al., involving 186 endoscopists and 45,026 patients, divided endoscopists into
4 groups based on their ADR (<11%, 11-14.9%, 15-19.9%, ≥20%)40. Hazard ratios for
interval colorectal cancer occurring within 5 years of colonoscopy were greater than 10
for each of the first 3 groups when compared to the group with an ADR of ≥20% - see
figure 10.
A subsequent study by Corley et al., examined the relationship between interval cancer
rate and colonoscopist ADR following 314,872 colonoscopies performed by 136
gastroenterologists in California, USA82. Practitioners were divided into quintiles based on
their ADR which ranged from 7.5% to 52.5%. In comparison to the quintile with the
lowest ADR, the adjusted hazard ratio for interval colorectal cancer in the quintile of
colonoscopists with the highest ADR was 0.52 (95% confidence interval 0.39 – 0.69).
Similar results were found for the risk of interval advanced stage CRC (HR 0.43, 95% CI
0.29-0.64) or risk of death from CRC (HR 0.38, 95% CI 0.22-0.65).
38
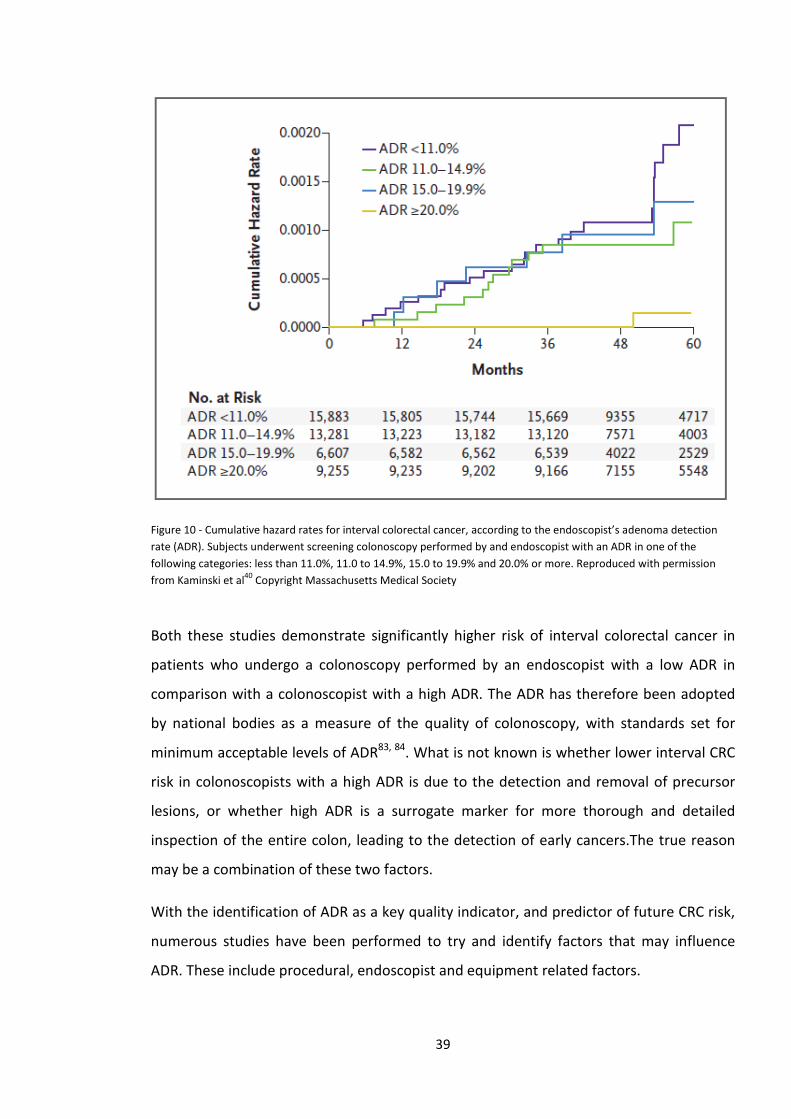
Figure 10 - Cumulative hazard rates for interval colorectal cancer, according to the endoscopist’s adenoma detection rate (ADR). Subjects underwent screening colonoscopy performed by and endoscopist with an ADR in one of the following categories: less than 11.0%, 11.0 to 14.9%, 15.0 to 19.9% and 20.0% or more. Reproduced with permission from Kaminski et al40 Copyright Massachusetts Medical Society
Both these studies demonstrate significantly higher risk of interval colorectal cancer in
patients who undergo a colonoscopy performed by an endoscopist with a low ADR in
comparison with a colonoscopist with a high ADR. The ADR has therefore been adopted
by national bodies as a measure of the quality of colonoscopy, with standards set for
minimum acceptable levels of ADR83, 84. What is not known is whether lower interval CRC
risk in colonoscopists with a high ADR is due to the detection and removal of precursor
lesions, or whether high ADR is a surrogate marker for more thorough and detailed
inspection of the entire colon, leading to the detection of early cancers.The true reason
may be a combination of these two factors.
With the identification of ADR as a key quality indicator, and predictor of future CRC risk,
numerous studies have been performed to try and identify factors that may influence
ADR. These include procedural, endoscopist and equipment related factors.
39
The colon is best visualised during withdrawal of the colonoscope once any excess fluid or
liquid stool has been aspirated and a clear luminal view can be obtained. Clear
visualisation of the mucosa is obviously dependent on adequate bowel cleansing pre-
procedure. Commonly used oral bowel cleansing preparations include polyethylene glycol
and sodium picosulphate. It is logical to assume that detection of colonic neoplasia is
dependent on the adequacy of bowel preparation. This has been demonstrated in several
studies showing significantly lower rates of adenoma detection in cases with inadequate
bowel preparation compared to cases with adequate preparation as assessed using
validated scales such as the Boston Bowel Preparation Scale85-88. Hence adequate bowel
preparation is a prerequisite for adequate inspection of the colon during colonoscopy. In
the context of poor preparation, it is highly unlikely that any ancillary techniques or
technological developments will have any impact on ADR, and rescheduling of the
procedure should be considered. Whilst the importance of bowel preparation prior to
colonoscopy has been well documented, at present there is no standard approach to
‘preparing’ the upper GI tract prior to gastroscopy.
There is evidence that increasing experience and total number of colonoscopy procedures
performed amongst trainees improves adenoma detection89. However, a large
prospective study amongst 21 consultants in Germany did not show any correlation
between either lifetime colonoscopy case volume, or annual case volume, and adenoma
detection rate90. Hence it may be the case that adenoma detection rate improves during
the training phase of colonoscopy before plateauing. In contrast, a large study of
adenoma detection rates in the UK bowel cancer screening programme showed a small
but significant difference (Odds Ratio 1.2, 95% confidence interval 1.11-1.30) in the ADR
of those endoscopists who had performed ≥300 previous screening colonoscopies versus
those who had performed 0-299 previous screening colonoscopies91.
Time taken for inspection during withdrawal of the colonoscope from caecum to anus has
been shown to correlate with an individual endoscopist’s adenoma detection rate91-94.
Barclay et al., observed a marked difference in neoplasia detection rates between
colonoscopists, with a mean withdrawal time above and below a threshold of 6 minutes
(≥ 6mins 28.3% vs. <6mins 11.8%, P<0.001)92. Significant differences were also observed
in the rate of detection of advanced colonic neoplasia (≥6mins 6.4% vs. <6mins 2.6%, P =
40
0.005). More recently Lee et al., examining results from the UK BCSP, reported an
increase in ADR with increasing mean withdrawal time up to a threshold of 10mins93.
Multivariant analysis of data from 31,088 colonoscopies performed as part of the UK
BCSP suggested that earlier colonoscopy start time was associated with higher ADR,
suggesting that endoscopist fatigue may be an important factor in the quality of
colonoscopy91.
The use of antispasmodics such as hyoscine butylbromide is commonplace during
colonoscopy. The antimuscarinic antispasmodic effect of these medications can be useful
to relax colonic smooth muscle and reduce spasm during the procedure. Several studies
have examined whether use of antispasmodics increases the ADR by relaxing the bowel
and allowing examination of a greater proportion of the mucosa. In a randomised trial of
hyoscine butylbromide versus placebo in 599 patients, the adjusted odds of detecting at
least one adenoma were 1.59 (95% confidence interval 1.09-2.47 p=0.017) in the hyoscine
groups compared to the placebo group95. However, a very similar trial in 674 patients
conducted by de Brouwer et al., found no significant differences in polyp or adenoma
detection rates between the hyoscine and placebo groups96. A third randomised
controlled trial of hyoscine butylbromide versus placebo, involving 402 patients in Italy,
again failed to show any significant differences in ADR between the two groups97.
Changes in the patients position (eg left lateral, supine, right lateral) during colonoscopy
are useful on insertion of the colonoscope to minimise angulation of flexures and reduce
the formation of loops98, 99. Three studies have examined whether changes in patient
position on withdrawal may aid ADR by positioning the colonic segment being examined
at the highest point, allowing maximum distension with gas and draining away excess
fluid. The studies revealed conflicting results with East et al., and Koksal et al., observing a
positive effect on ADR of dynamic position changes on withdrawal100, 101. In contrast Ou et
al., found no difference in ADR between groups randomised to prescribed position
changes and ‘usual practice’102. However, it is notable that in this study baseline ADR was
very high at approximately 40% in both groups, and that 33% of patients in the control
group underwent at least one position change during withdrawal.
41
Other techniques to improve mucosal visualisation behind colonic folds have also been
studied, such as the use of transparent distal attachments on the colonoscope103, and
retroflexion of the colonoscope tip in the right colon104. However at present no definite
conclusions about these techniques can be made.
The impact of dye-based chromoendoscopy and more recent advances in imaging
techniques on adenoma detection rates has been widely studied. Before discussing the
results of these trials, the next section will describe chromoendoscopy and advanced
imaging techniques.
2.6 Chromoendoscopy
Chromoendoscopy (literally colour-endoscopy) was developed in Japan in the late 1960’s
and early 1970’s as a method of enhancing mucosal visualisation, and in particular
identifying and characterising abnormalities in the gastrointestinal tract by applying dyes
to the upper or lower gastrointestinal mucosa. Chromoendoscopy dyes fall into 2 broad
categories :- Contrast agents are non-absorptive dyes which lie in the grooves, crevices
and pits of the mucosa, highlighting raised areas and surface patterns; vital stains are
taken up by the cells of the mucosa. The uptake of vital stains differs between normal
mucosa and areas of inflammation or dysplasia and hence these areas are highlighted.
2.6.1 Methylene Blue
Several early studies examined the use of vital stains to identify areas of abnormal
mucosa in the stomach. Suzuki et al., used methylene blue, a vital stain, to identify early
gastric cancers and intestinal metaplasia (IM). They noted that methylene blue was taken
up by early cancers and IM, but not by normal gastric mucosa, helping to identify and
establish the margins of early gastric cancers which had been difficult to identify using
standard white light endoscopy105. Ida et al., also demonstrated that methylene blue
selectively stained areas of IM in contrast to areas of normal gastric mucosa106. Tatsuta et
al., studied the use of a combination of two vital stains, methylene blue and Congo Red
for identifying early gastric cancers107. They noted that when using both dyes together,
42
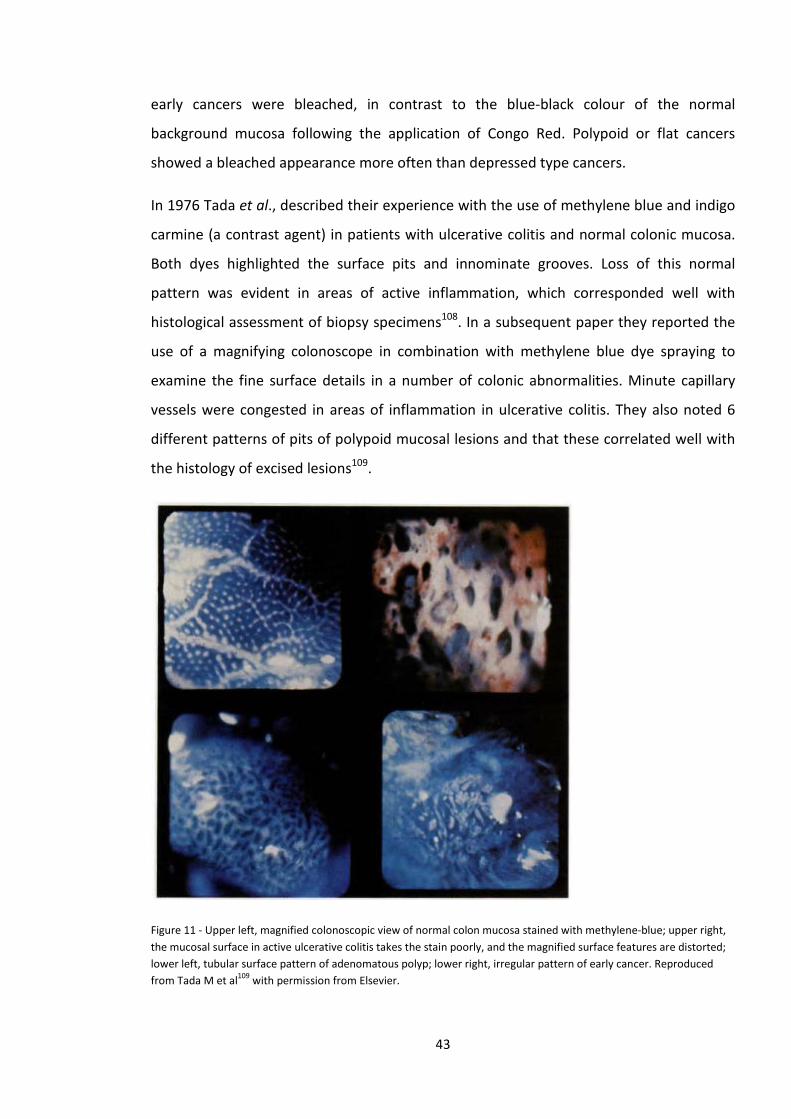
early cancers were bleached, in contrast to the blue-black colour of the normal
background mucosa following the application of Congo Red. Polypoid or flat cancers
showed a bleached appearance more often than depressed type cancers.
In 1976 Tada et al., described their experience with the use of methylene blue and indigo
carmine (a contrast agent) in patients with ulcerative colitis and normal colonic mucosa.
Both dyes highlighted the surface pits and innominate grooves. Loss of this normal
pattern was evident in areas of active inflammation, which corresponded well with
histological assessment of biopsy specimens108. In a subsequent paper they reported the
use of a magnifying colonoscope in combination with methylene blue dye spraying to
examine the fine surface details in a number of colonic abnormalities. Minute capillary
vessels were congested in areas of inflammation in ulcerative colitis. They also noted 6
different patterns of pits of polypoid mucosal lesions and that these correlated well with
the histology of excised lesions109.
Figure 11 - Upper left, magnified colonoscopic view of normal colon mucosa stained with methylene-blue; upper right, the mucosal surface in active ulcerative colitis takes the stain poorly, and the magnified surface features are distorted; lower left, tubular surface pattern of adenomatous polyp; lower right, irregular pattern of early cancer. Reproduced from Tada M et al109 with permission from Elsevier.
43
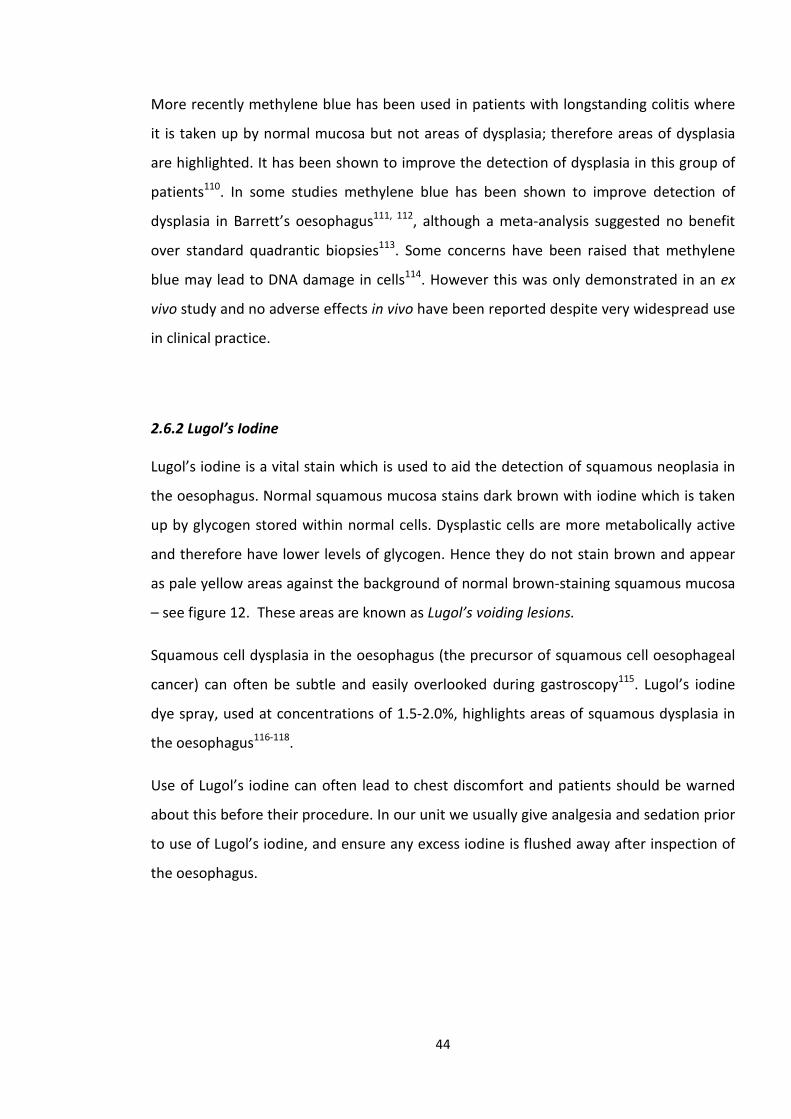
More recently methylene blue has been used in patients with longstanding colitis where
it is taken up by normal mucosa but not areas of dysplasia; therefore areas of dysplasia
are highlighted. It has been shown to improve the detection of dysplasia in this group of
patients110. In some studies methylene blue has been shown to improve detection of
dysplasia in Barrett’s oesophagus111, 112, although a meta-analysis suggested no benefit
over standard quadrantic biopsies113. Some concerns have been raised that methylene
blue may lead to DNA damage in cells114. However this was only demonstrated in an ex
vivo study and no adverse effects in vivo have been reported despite very widespread use
in clinical practice.
2.6.2 Lugol’s Iodine
Lugol’s iodine is a vital stain which is used to aid the detection of squamous neoplasia in
the oesophagus. Normal squamous mucosa stains dark brown with iodine which is taken
up by glycogen stored within normal cells. Dysplastic cells are more metabolically active
and therefore have lower levels of glycogen. Hence they do not stain brown and appear
as pale yellow areas against the background of normal brown-staining squamous mucosa
– see figure 12. These areas are known as Lugol’s voiding lesions.
Squamous cell dysplasia in the oesophagus (the precursor of squamous cell oesophageal
cancer) can often be subtle and easily overlooked during gastroscopy115. Lugol’s iodine
dye spray, used at concentrations of 1.5-2.0%, highlights areas of squamous dysplasia in
the oesophagus116-118.
Use of Lugol’s iodine can often lead to chest discomfort and patients should be warned
about this before their procedure. In our unit we usually give analgesia and sedation prior
to use of Lugol’s iodine, and ensure any excess iodine is flushed away after inspection of
the oesophagus.
44
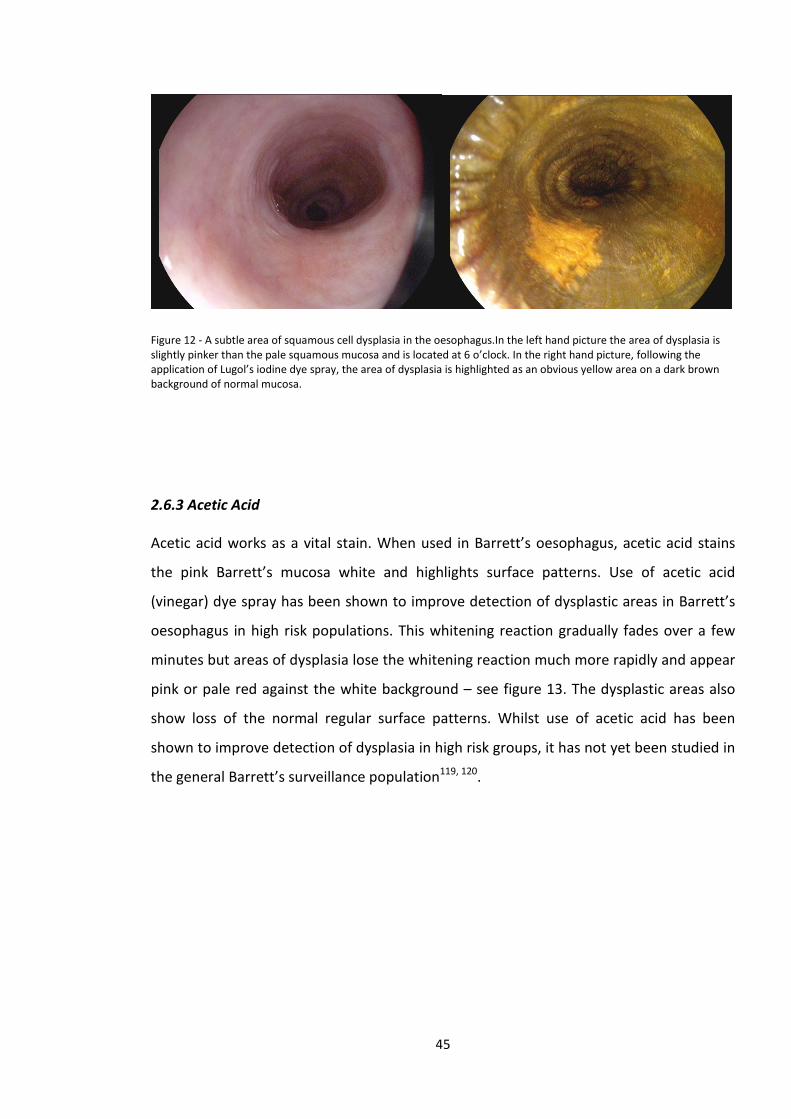
Figure 12 - A subtle area of squamous cell dysplasia in the oesophagus.In the left hand picture the area of dysplasia is slightly pinker than the pale squamous mucosa and is located at 6 o’clock. In the right hand picture, following the application of Lugol’s iodine dye spray, the area of dysplasia is highlighted as an obvious yellow area on a dark brown background of normal mucosa.
2.6.3 Acetic Acid
Acetic acid works as a vital stain. When used in Barrett’s oesophagus, acetic acid stains
the pink Barrett’s mucosa white and highlights surface patterns. Use of acetic acid
(vinegar) dye spray has been shown to improve detection of dysplastic areas in Barrett’s
oesophagus in high risk populations. This whitening reaction gradually fades over a few
minutes but areas of dysplasia lose the whitening reaction much more rapidly and appear
pink or pale red against the white background – see figure 13. The dysplastic areas also
show loss of the normal regular surface patterns. Whilst use of acetic acid has been
shown to improve detection of dysplasia in high risk groups, it has not yet been studied in
the general Barrett’s surveillance population119, 120.
45
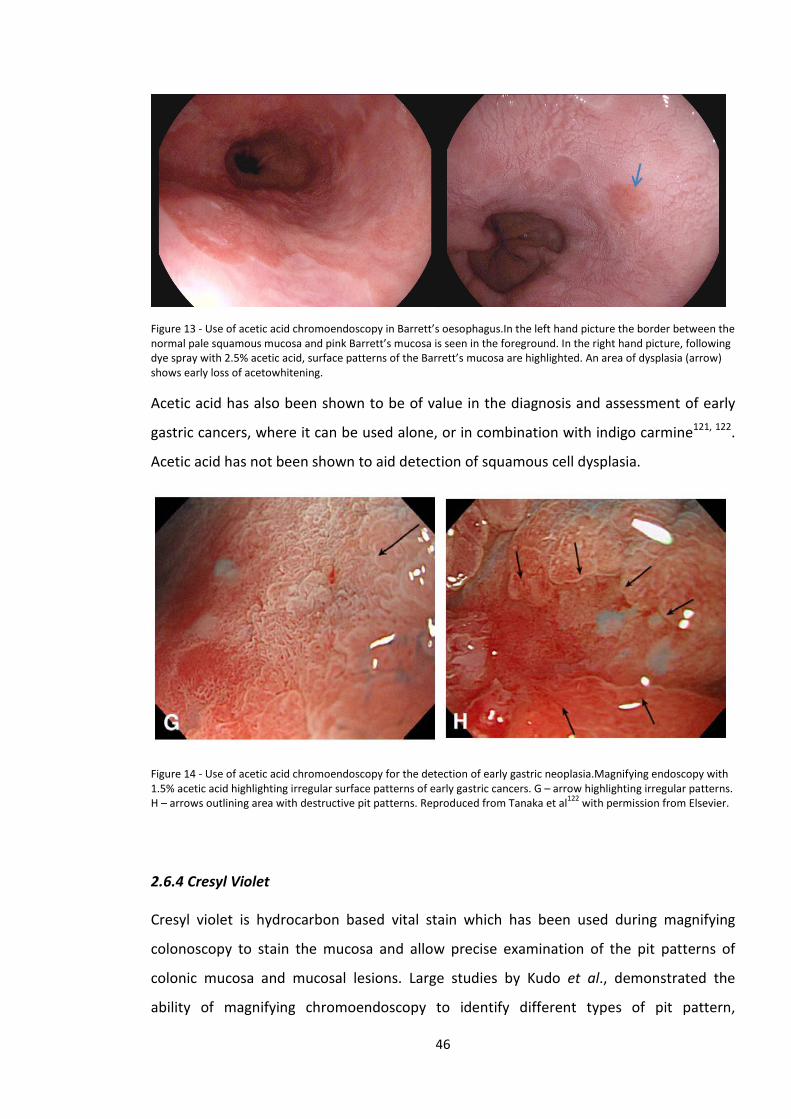
Figure 13 - Use of acetic acid chromoendoscopy in Barrett’s oesophagus.In the left hand picture the border between the normal pale squamous mucosa and pink Barrett’s mucosa is seen in the foreground. In the right hand picture, following dye spray with 2.5% acetic acid, surface patterns of the Barrett’s mucosa are highlighted. An area of dysplasia (arrow) shows early loss of acetowhitening.
Acetic acid has also been shown to be of value in the diagnosis and assessment of early
gastric cancers, where it can be used alone, or in combination with indigo carmine121, 122.
Acetic acid has not been shown to aid detection of squamous cell dysplasia.
Figure 14 - Use of acetic acid chromoendoscopy for the detection of early gastric neoplasia.Magnifying endoscopy with 1.5% acetic acid highlighting irregular surface patterns of early gastric cancers. G – arrow highlighting irregular patterns. H – arrows outlining area with destructive pit patterns. Reproduced from Tanaka et al122 with permission from Elsevier.
2.6.4 Cresyl Violet
Cresyl violet is hydrocarbon based vital stain which has been used during magnifying
colonoscopy to stain the mucosa and allow precise examination of the pit patterns of
colonic mucosa and mucosal lesions. Large studies by Kudo et al., demonstrated the
ability of magnifying chromoendoscopy to identify different types of pit pattern,
46
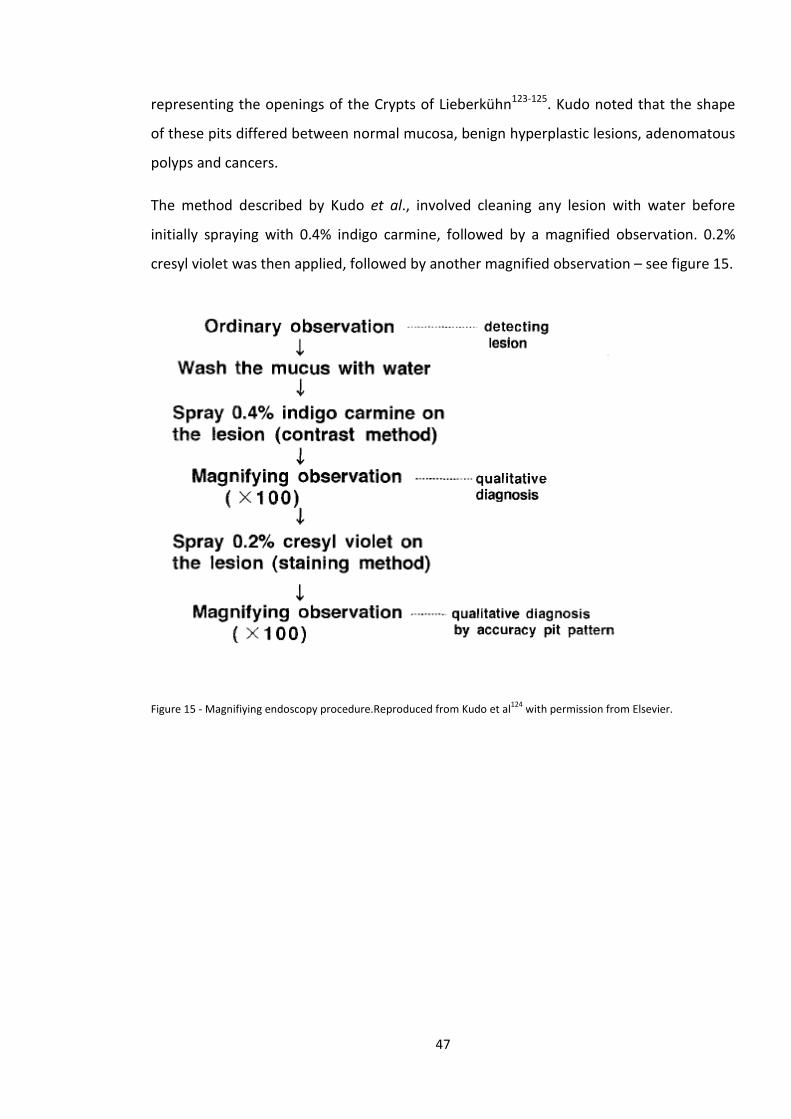
representing the openings of the Crypts of Lieberkühn123-125. Kudo noted that the shape
of these pits differed between normal mucosa, benign hyperplastic lesions, adenomatous
polyps and cancers.
The method described by Kudo et al., involved cleaning any lesion with water before
initially spraying with 0.4% indigo carmine, followed by a magnified observation. 0.2%
cresyl violet was then applied, followed by another magnified observation – see figure 15.
Figure 15 - Magnifiying endoscopy procedure.Reproduced from Kudo et al124 with permission from Elsevier.
47
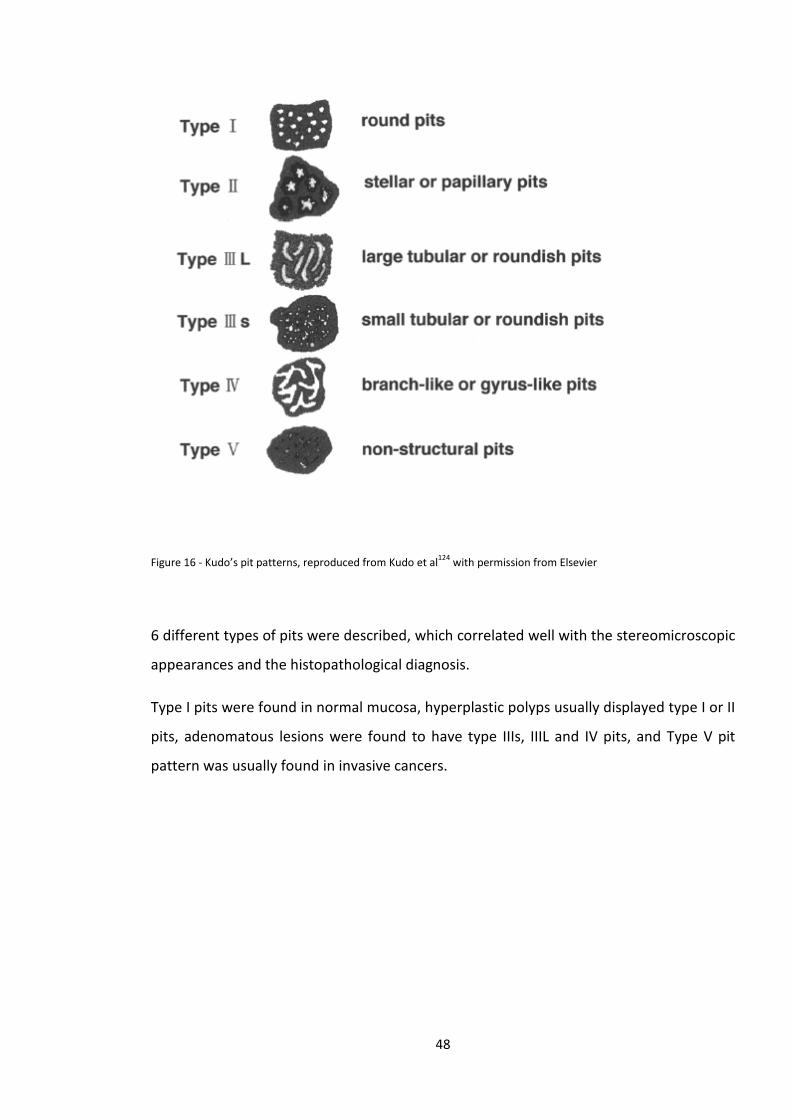
Figure 16 - Kudo’s pit patterns, reproduced from Kudo et al124 with permission from Elsevier
6 different types of pits were described, which correlated well with the stereomicroscopic
appearances and the histopathological diagnosis.
Type I pits were found in normal mucosa, hyperplastic polyps usually displayed type I or II
pits, adenomatous lesions were found to have type IIIs, IIIL and IV pits, and Type V pit
pattern was usually found in invasive cancers.
48
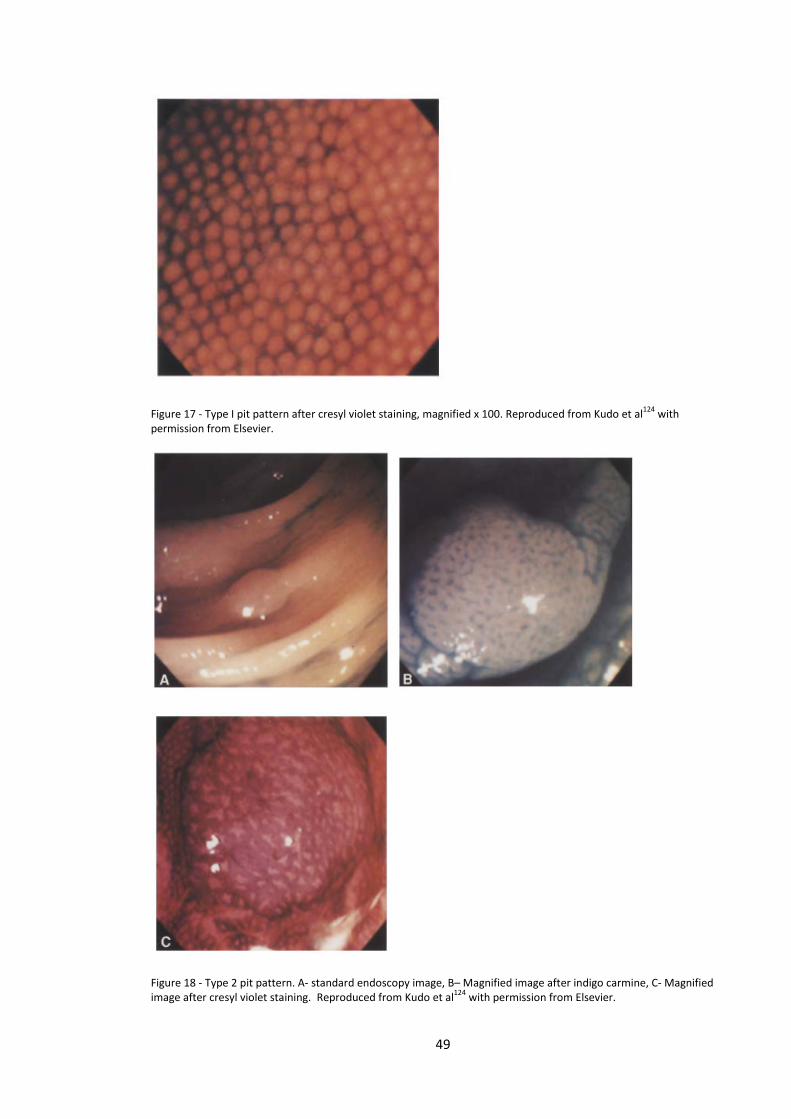
Figure 17 - Type I pit pattern after cresyl violet staining, magnified x 100. Reproduced from Kudo et al124 with permission from Elsevier.
Figure 18 - Type 2 pit pattern. A- standard endoscopy image, B– Magnified image after indigo carmine, C- Magnified image after cresyl violet staining. Reproduced from Kudo et al124 with permission from Elsevier.
49
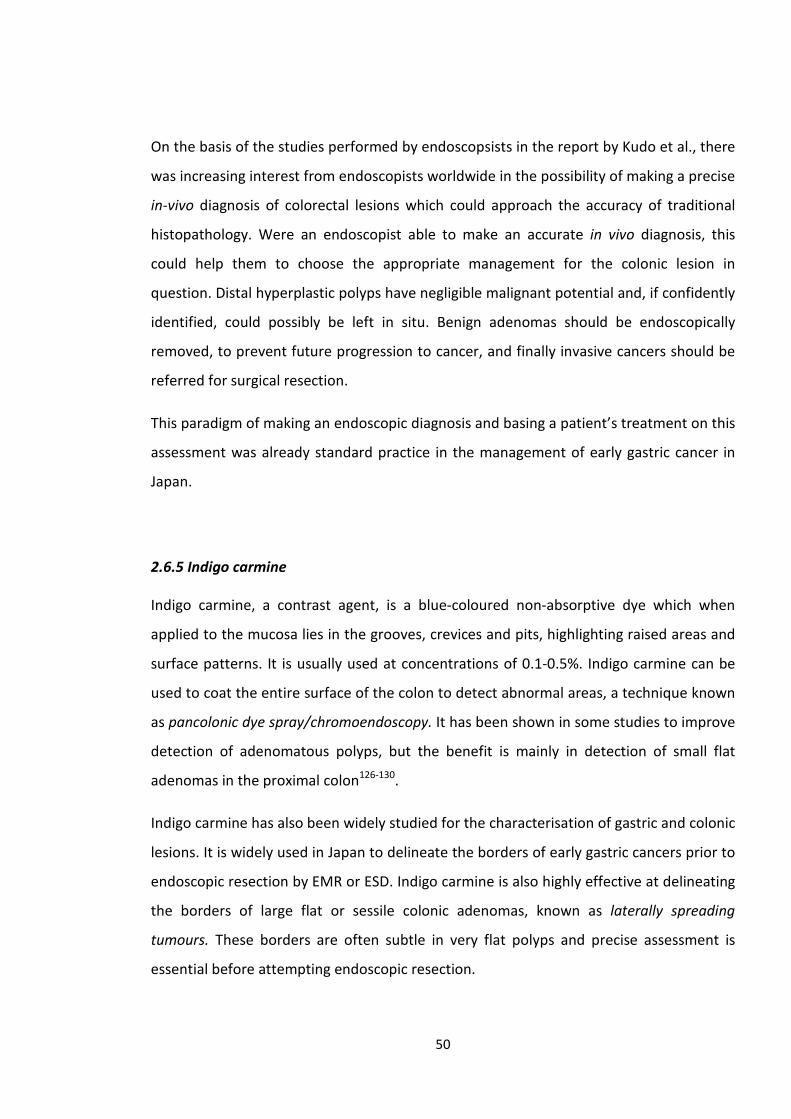
On the basis of the studies performed by endoscopsists in the report by Kudo et al., there
was increasing interest from endoscopists worldwide in the possibility of making a precise
in-vivo diagnosis of colorectal lesions which could approach the accuracy of traditional
histopathology. Were an endoscopist able to make an accurate in vivo diagnosis, this
could help them to choose the appropriate management for the colonic lesion in
question. Distal hyperplastic polyps have negligible malignant potential and, if confidently
identified, could possibly be left in situ. Benign adenomas should be endoscopically
removed, to prevent future progression to cancer, and finally invasive cancers should be
referred for surgical resection.
This paradigm of making an endoscopic diagnosis and basing a patient’s treatment on this
assessment was already standard practice in the management of early gastric cancer in
Japan.
2.6.5 Indigo carmine
Indigo carmine, a contrast agent, is a blue-coloured non-absorptive dye which when
applied to the mucosa lies in the grooves, crevices and pits, highlighting raised areas and
surface patterns. It is usually used at concentrations of 0.1-0.5%. Indigo carmine can be
used to coat the entire surface of the colon to detect abnormal areas, a technique known
as pancolonic dye spray/chromoendoscopy. It has been shown in some studies to improve
detection of adenomatous polyps, but the benefit is mainly in detection of small flat
adenomas in the proximal colon126-130.
Indigo carmine has also been widely studied for the characterisation of gastric and colonic
lesions. It is widely used in Japan to delineate the borders of early gastric cancers prior to
endoscopic resection by EMR or ESD. Indigo carmine is also highly effective at delineating
the borders of large flat or sessile colonic adenomas, known as laterally spreading
tumours. These borders are often subtle in very flat polyps and precise assessment is
essential before attempting endoscopic resection.
50
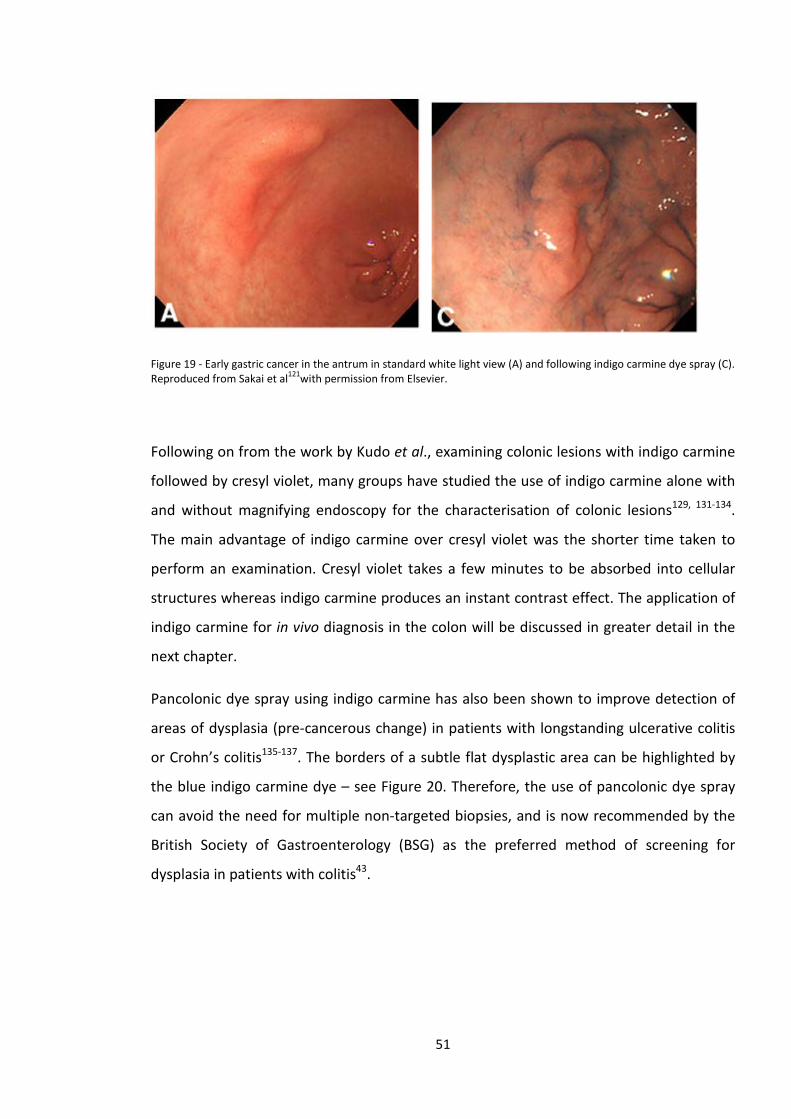
Figure 19 - Early gastric cancer in the antrum in standard white light view (A) and following indigo carmine dye spray (C). Reproduced from Sakai et al121with permission from Elsevier.
Following on from the work by Kudo et al., examining colonic lesions with indigo carmine
followed by cresyl violet, many groups have studied the use of indigo carmine alone with
and without magnifying endoscopy for the characterisation of colonic lesions129, 131-134.
The main advantage of indigo carmine over cresyl violet was the shorter time taken to
perform an examination. Cresyl violet takes a few minutes to be absorbed into cellular
structures whereas indigo carmine produces an instant contrast effect. The application of
indigo carmine for in vivo diagnosis in the colon will be discussed in greater detail in the
next chapter.
Pancolonic dye spray using indigo carmine has also been shown to improve detection of
areas of dysplasia (pre-cancerous change) in patients with longstanding ulcerative colitis
or Crohn’s colitis135-137. The borders of a subtle flat dysplastic area can be highlighted by
the blue indigo carmine dye – see Figure 20. Therefore, the use of pancolonic dye spray
can avoid the need for multiple non-targeted biopsies, and is now recommended by the
British Society of Gastroenterology (BSG) as the preferred method of screening for
dysplasia in patients with colitis43.
51
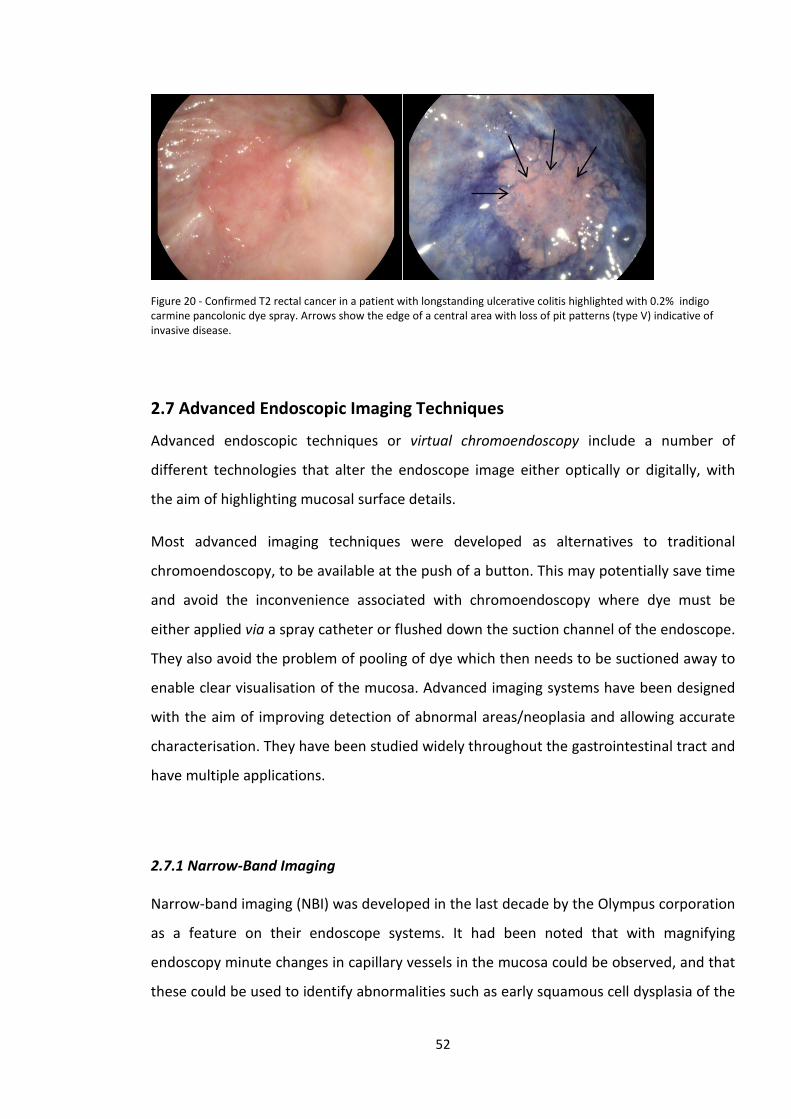
Figure 20 - Confirmed T2 rectal cancer in a patient with longstanding ulcerative colitis highlighted with 0.2% indigo carmine pancolonic dye spray. Arrows show the edge of a central area with loss of pit patterns (type V) indicative of invasive disease.
2.7 Advanced Endoscopic Imaging Techniques
Advanced endoscopic techniques or virtual chromoendoscopy include a number of
different technologies that alter the endoscope image either optically or digitally, with
the aim of highlighting mucosal surface details.
Most advanced imaging techniques were developed as alternatives to traditional
chromoendoscopy, to be available at the push of a button. This may potentially save time
and avoid the inconvenience associated with chromoendoscopy where dye must be
either applied via a spray catheter or flushed down the suction channel of the endoscope.
They also avoid the problem of pooling of dye which then needs to be suctioned away to
enable clear visualisation of the mucosa. Advanced imaging systems have been designed
with the aim of improving detection of abnormal areas/neoplasia and allowing accurate
characterisation. They have been studied widely throughout the gastrointestinal tract and
have multiple applications.
2.7.1 Narrow-Band Imaging
Narrow-band imaging (NBI) was developed in the last decade by the Olympus corporation
as a feature on their endoscope systems. It had been noted that with magnifying
endoscopy minute changes in capillary vessels in the mucosa could be observed, and that
these could be used to identify abnormalities such as early squamous cell dysplasia of the
52
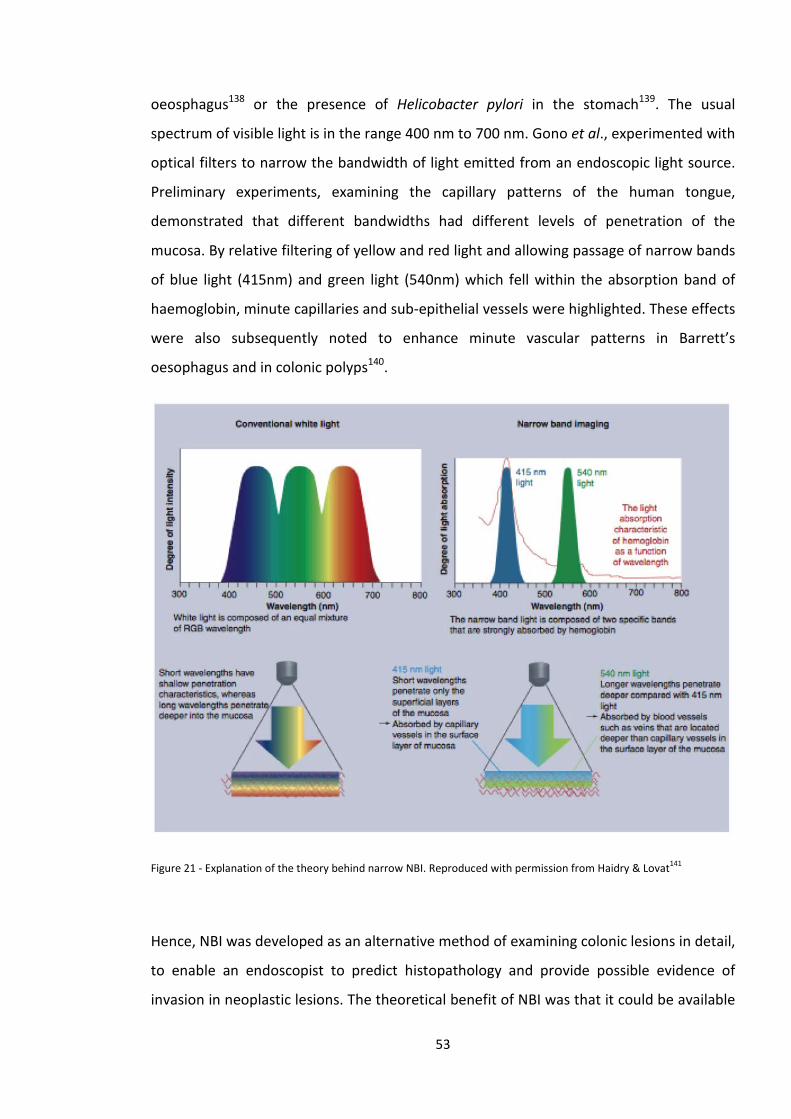
oeosphagus138 or the presence of Helicobacter pylori in the stomach139. The usual
spectrum of visible light is in the range 400 nm to 700 nm. Gono et al., experimented with
optical filters to narrow the bandwidth of light emitted from an endoscopic light source.
Preliminary experiments, examining the capillary patterns of the human tongue,
demonstrated that different bandwidths had different levels of penetration of the
mucosa. By relative filtering of yellow and red light and allowing passage of narrow bands
of blue light (415nm) and green light (540nm) which fell within the absorption band of
haemoglobin, minute capillaries and sub-epithelial vessels were highlighted. These effects
were also subsequently noted to enhance minute vascular patterns in Barrett’s
oesophagus and in colonic polyps140.
Figure 21 - Explanation of the theory behind narrow NBI. Reproduced with permission from Haidry & Lovat141
Hence, NBI was developed as an alternative method of examining colonic lesions in detail,
to enable an endoscopist to predict histopathology and provide possible evidence of
invasion in neoplastic lesions. The theoretical benefit of NBI was that it could be available
53
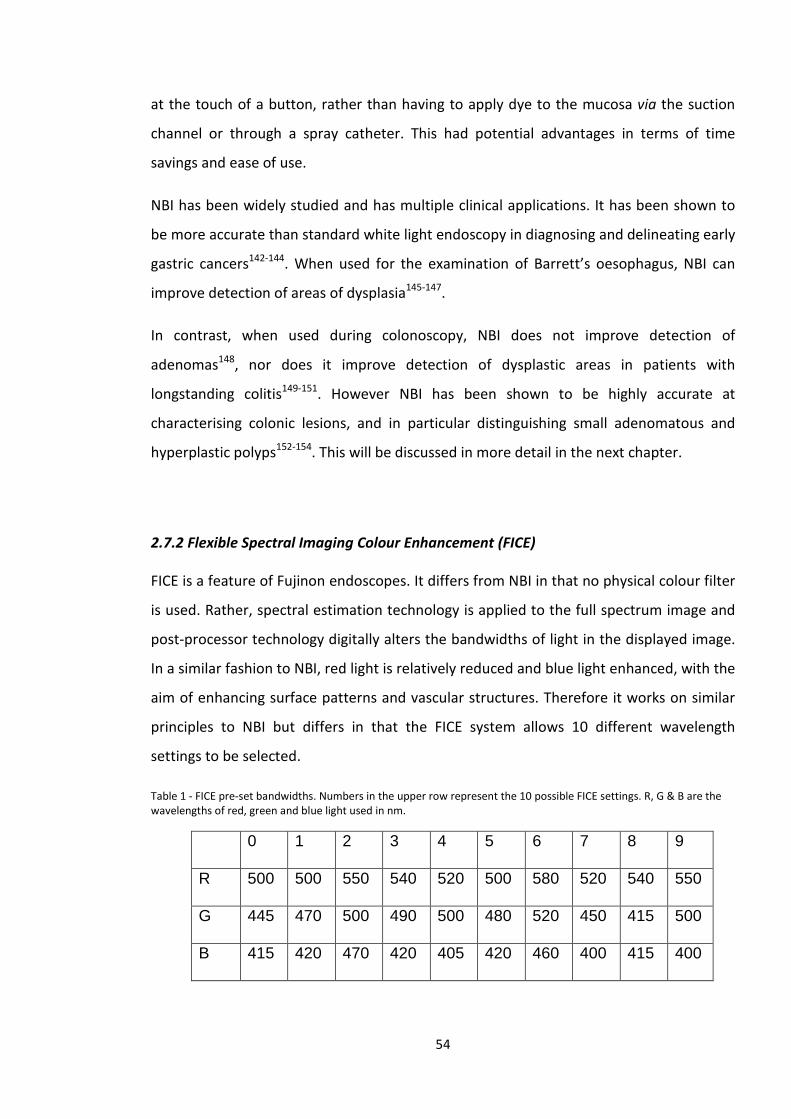
at the touch of a button, rather than having to apply dye to the mucosa via the suction
channel or through a spray catheter. This had potential advantages in terms of time
savings and ease of use.
NBI has been widely studied and has multiple clinical applications. It has been shown to
be more accurate than standard white light endoscopy in diagnosing and delineating early
gastric cancers142-144. When used for the examination of Barrett’s oesophagus, NBI can
improve detection of areas of dysplasia145-147.
In contrast, when used during colonoscopy, NBI does not improve detection of
adenomas148, nor does it improve detection of dysplastic areas in patients with
longstanding colitis149-151. However NBI has been shown to be highly accurate at
characterising colonic lesions, and in particular distinguishing small adenomatous and
hyperplastic polyps152-154. This will be discussed in more detail in the next chapter.
2.7.2 Flexible Spectral Imaging Colour Enhancement (FICE)
FICE is a feature of Fujinon endoscopes. It differs from NBI in that no physical colour filter
is used. Rather, spectral estimation technology is applied to the full spectrum image and
post-processor technology digitally alters the bandwidths of light in the displayed image.
In a similar fashion to NBI, red light is relatively reduced and blue light enhanced, with the
aim of enhancing surface patterns and vascular structures. Therefore it works on similar
principles to NBI but differs in that the FICE system allows 10 different wavelength
settings to be selected.
Table 1 - FICE pre-set bandwidths. Numbers in the upper row represent the 10 possible FICE settings. R, G & B are the wavelengths of red, green and blue light used in nm.
0 1 2 3 4 5 6 7 8 9
R 500 500 550 540 520 500 580 520 540 550
G 445 470 500 490 500 480 520 450 415 500
B 415 420 470 420 405 420 460 400 415 400
54
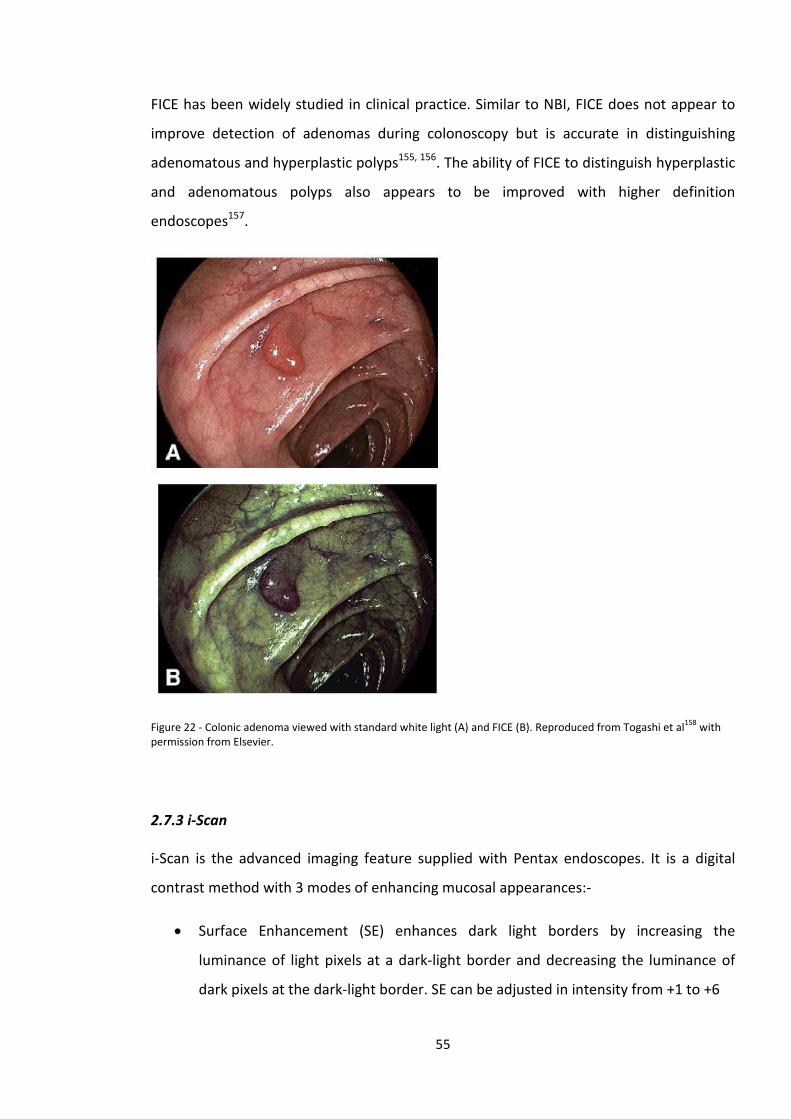
FICE has been widely studied in clinical practice. Similar to NBI, FICE does not appear to
improve detection of adenomas during colonoscopy but is accurate in distinguishing
adenomatous and hyperplastic polyps155, 156. The ability of FICE to distinguish hyperplastic
and adenomatous polyps also appears to be improved with higher definition
endoscopes157.
Figure 22 - Colonic adenoma viewed with standard white light (A) and FICE (B). Reproduced from Togashi et al158 with permission from Elsevier.
2.7.3 i-Scan
i-Scan is the advanced imaging feature supplied with Pentax endoscopes. It is a digital
contrast method with 3 modes of enhancing mucosal appearances:-
• Surface Enhancement (SE) enhances dark light borders by increasing the
luminance of light pixels at a dark-light border and decreasing the luminance of
dark pixels at the dark-light border. SE can be adjusted in intensity from +1 to +6
55
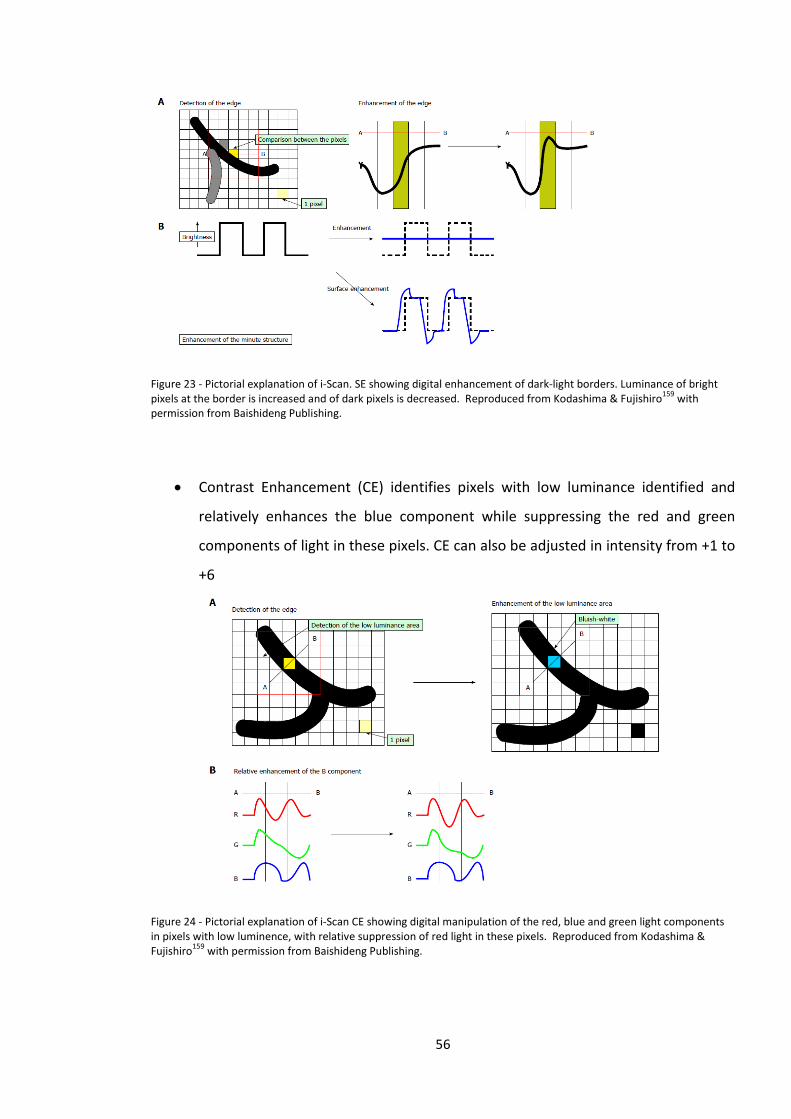
Figure 23 - Pictorial explanation of i-Scan. SE showing digital enhancement of dark-light borders. Luminance of bright pixels at the border is increased and of dark pixels is decreased. Reproduced from Kodashima & Fujishiro159 with permission from Baishideng Publishing.
• Contrast Enhancement (CE) identifies pixels with low luminance identified and
relatively enhances the blue component while suppressing the red and green
components of light in these pixels. CE can also be adjusted in intensity from +1 to
+6
Figure 24 - Pictorial explanation of i-Scan CE showing digital manipulation of the red, blue and green light components in pixels with low luminence, with relative suppression of red light in these pixels. Reproduced from Kodashima & Fujishiro159 with permission from Baishideng Publishing.
56
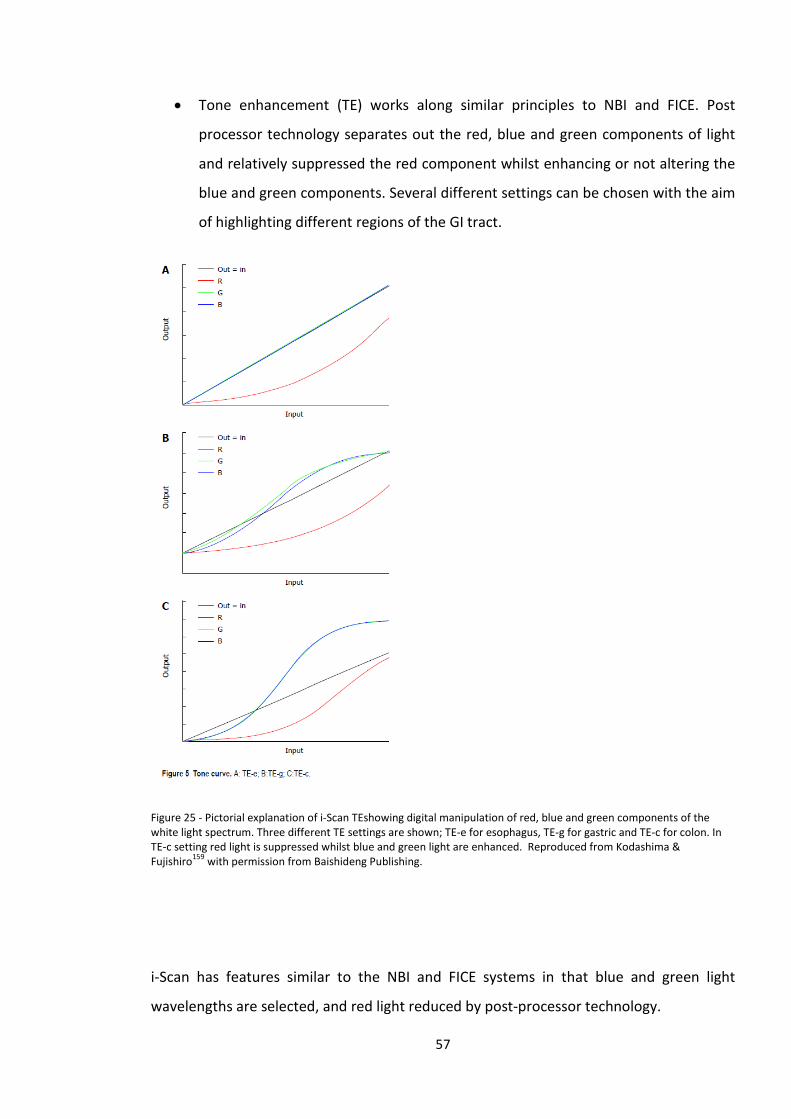
• Tone enhancement (TE) works along similar principles to NBI and FICE. Post
processor technology separates out the red, blue and green components of light
and relatively suppressed the red component whilst enhancing or not altering the
blue and green components. Several different settings can be chosen with the aim
of highlighting different regions of the GI tract.
Figure 25 - Pictorial explanation of i-Scan TEshowing digital manipulation of red, blue and green components of the white light spectrum. Three different TE settings are shown; TE-e for esophagus, TE-g for gastric and TE-c for colon. In TE-c setting red light is suppressed whilst blue and green light are enhanced. Reproduced from Kodashima & Fujishiro159 with permission from Baishideng Publishing.
i-Scan has features similar to the NBI and FICE systems in that blue and green light
wavelengths are selected, and red light reduced by post-processor technology.
57
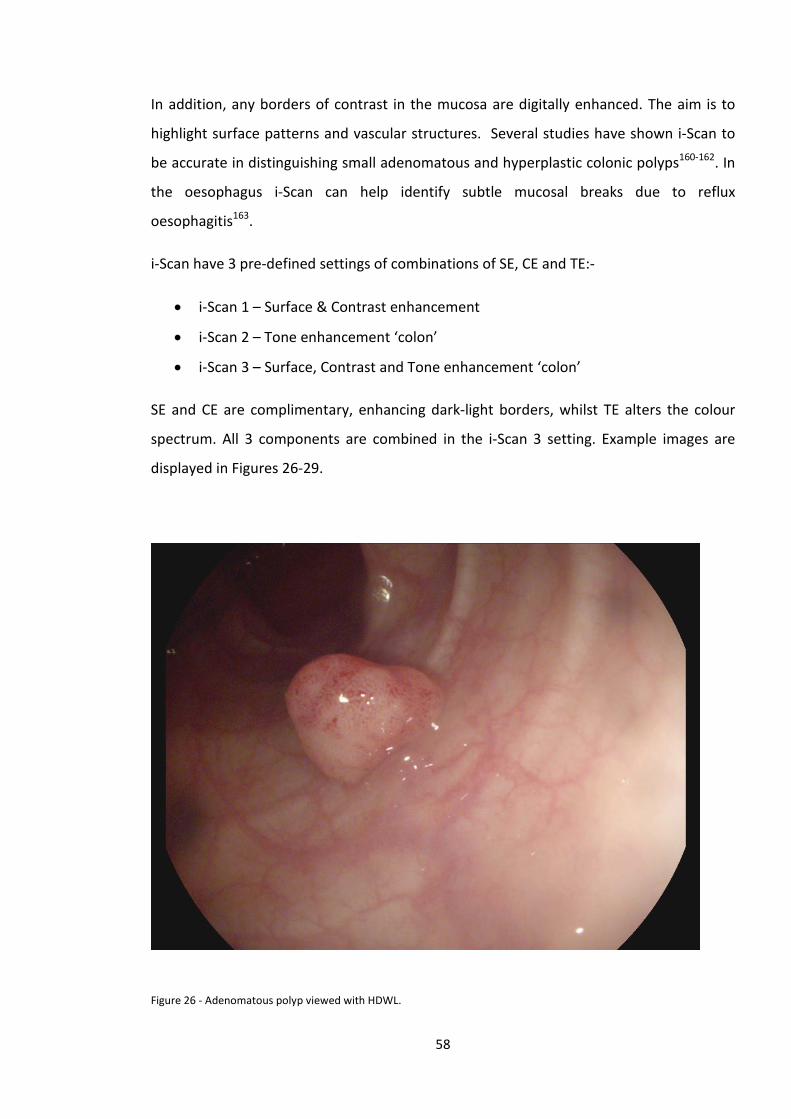
In addition, any borders of contrast in the mucosa are digitally enhanced. The aim is to
highlight surface patterns and vascular structures. Several studies have shown i-Scan to
be accurate in distinguishing small adenomatous and hyperplastic colonic polyps160-162. In
the oesophagus i-Scan can help identify subtle mucosal breaks due to reflux
oesophagitis163.
i-Scan have 3 pre-defined settings of combinations of SE, CE and TE:-
• i-Scan 1 – Surface & Contrast enhancement
• i-Scan 2 – Tone enhancement ‘colon’
• i-Scan 3 – Surface, Contrast and Tone enhancement ‘colon’
SE and CE are complimentary, enhancing dark-light borders, whilst TE alters the colour
spectrum. All 3 components are combined in the i-Scan 3 setting. Example images are
displayed in Figures 26-29.
Figure 26 - Adenomatous polyp viewed with HDWL.
58
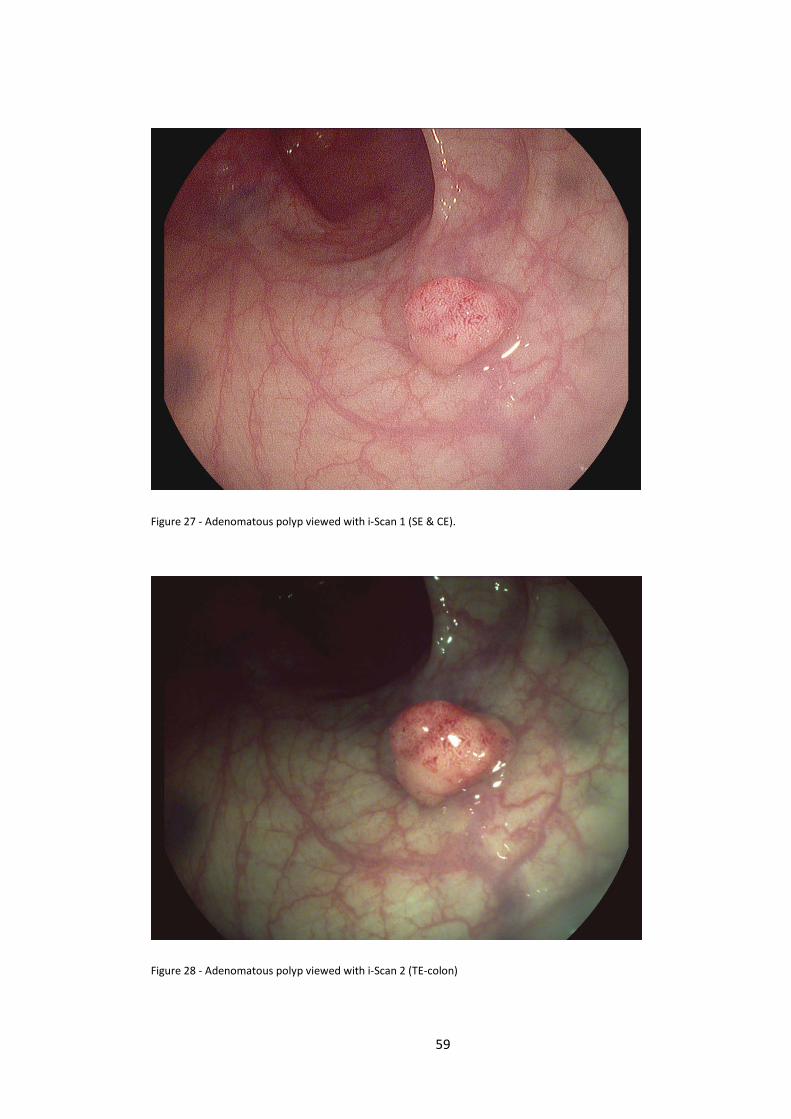
Figure 27 - Adenomatous polyp viewed with i-Scan 1 (SE & CE).
Figure 28 - Adenomatous polyp viewed with i-Scan 2 (TE-colon)
59
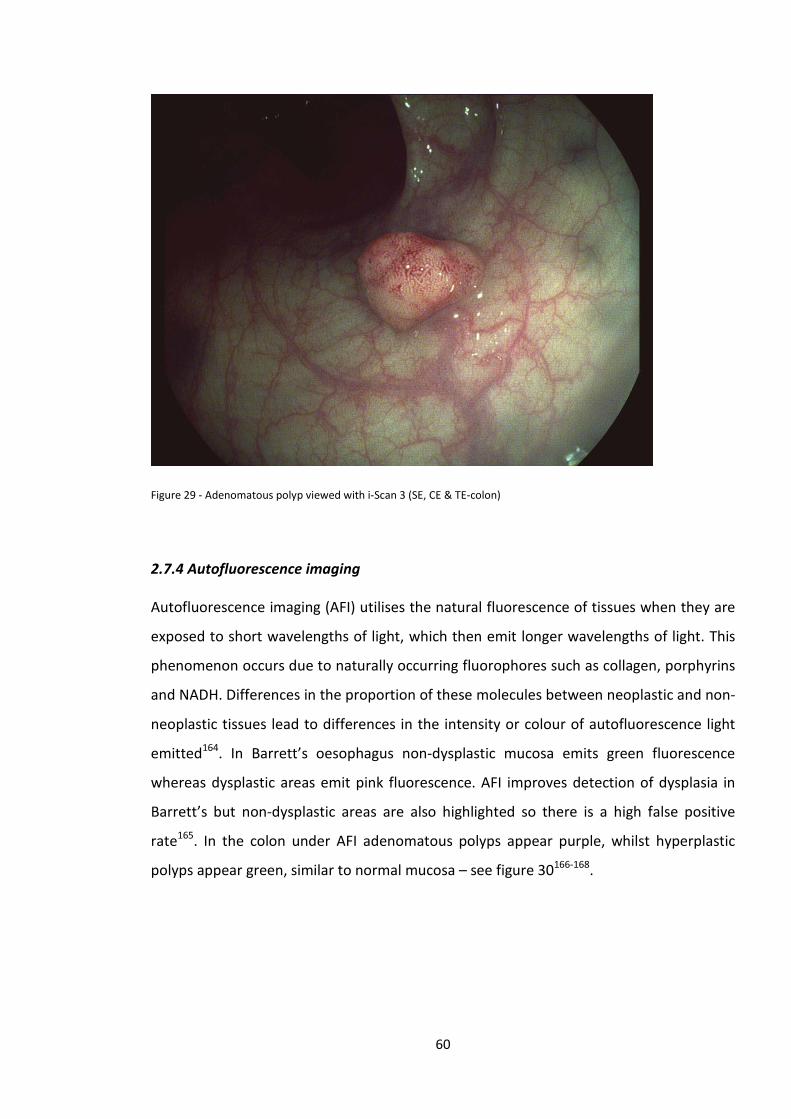
Figure 29 - Adenomatous polyp viewed with i-Scan 3 (SE, CE & TE-colon)
2.7.4 Autofluorescence imaging
Autofluorescence imaging (AFI) utilises the natural fluorescence of tissues when they are
exposed to short wavelengths of light, which then emit longer wavelengths of light. This
phenomenon occurs due to naturally occurring fluorophores such as collagen, porphyrins
and NADH. Differences in the proportion of these molecules between neoplastic and non-
neoplastic tissues lead to differences in the intensity or colour of autofluorescence light
emitted164. In Barrett’s oesophagus non-dysplastic mucosa emits green fluorescence
whereas dysplastic areas emit pink fluorescence. AFI improves detection of dysplasia in
Barrett’s but non-dysplastic areas are also highlighted so there is a high false positive
rate165. In the colon under AFI adenomatous polyps appear purple, whilst hyperplastic
polyps appear green, similar to normal mucosa – see figure 30166-168.
60
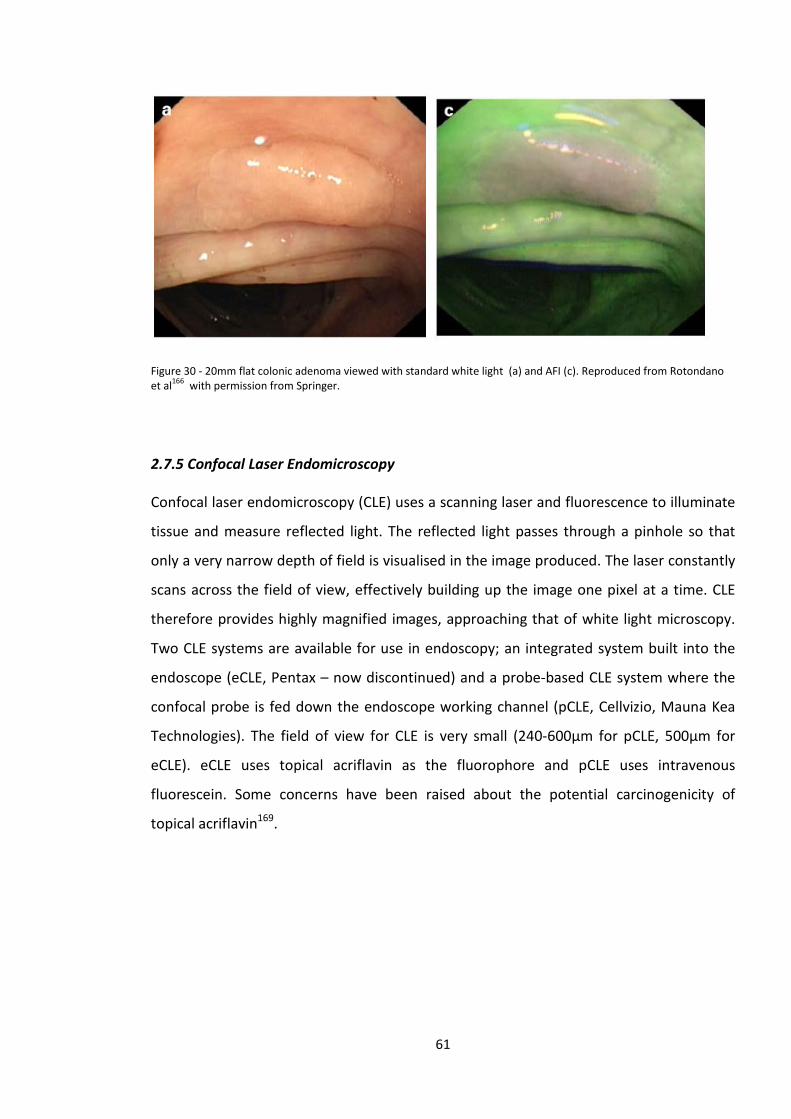
Figure 30 - 20mm flat colonic adenoma viewed with standard white light (a) and AFI (c). Reproduced from Rotondano et al166 with permission from Springer.
2.7.5 Confocal Laser Endomicroscopy
Confocal laser endomicroscopy (CLE) uses a scanning laser and fluorescence to illuminate
tissue and measure reflected light. The reflected light passes through a pinhole so that
only a very narrow depth of field is visualised in the image produced. The laser constantly
scans across the field of view, effectively building up the image one pixel at a time. CLE
therefore provides highly magnified images, approaching that of white light microscopy.
Two CLE systems are available for use in endoscopy; an integrated system built into the
endoscope (eCLE, Pentax – now discontinued) and a probe-based CLE system where the
confocal probe is fed down the endoscope working channel (pCLE, Cellvizio, Mauna Kea
Technologies). The field of view for CLE is very small (240-600µm for pCLE, 500µm for
eCLE). eCLE uses topical acriflavin as the fluorophore and pCLE uses intravenous
fluorescein. Some concerns have been raised about the potential carcinogenicity of
topical acriflavin169.
61
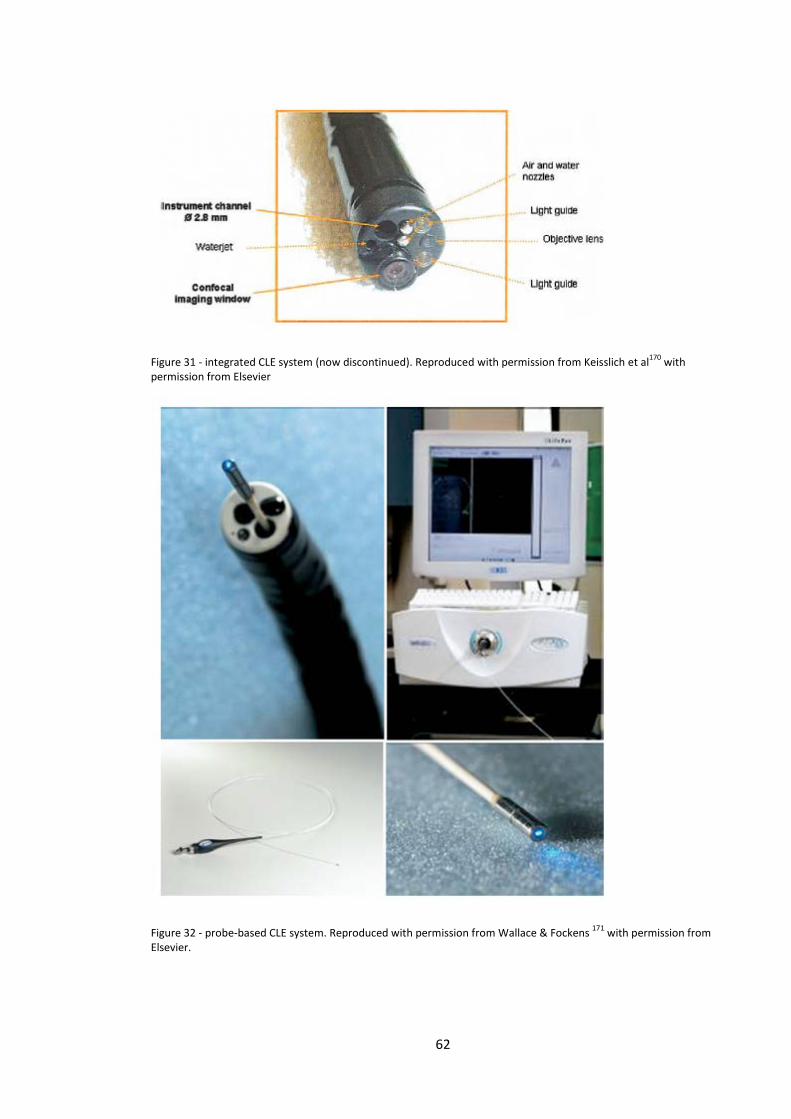
Figure 31 - integrated CLE system (now discontinued). Reproduced with permission from Keisslich et al170 with permission from Elsevier
Figure 32 - probe-based CLE system. Reproduced with permission from Wallace & Fockens 171 with permission from Elsevier.
62
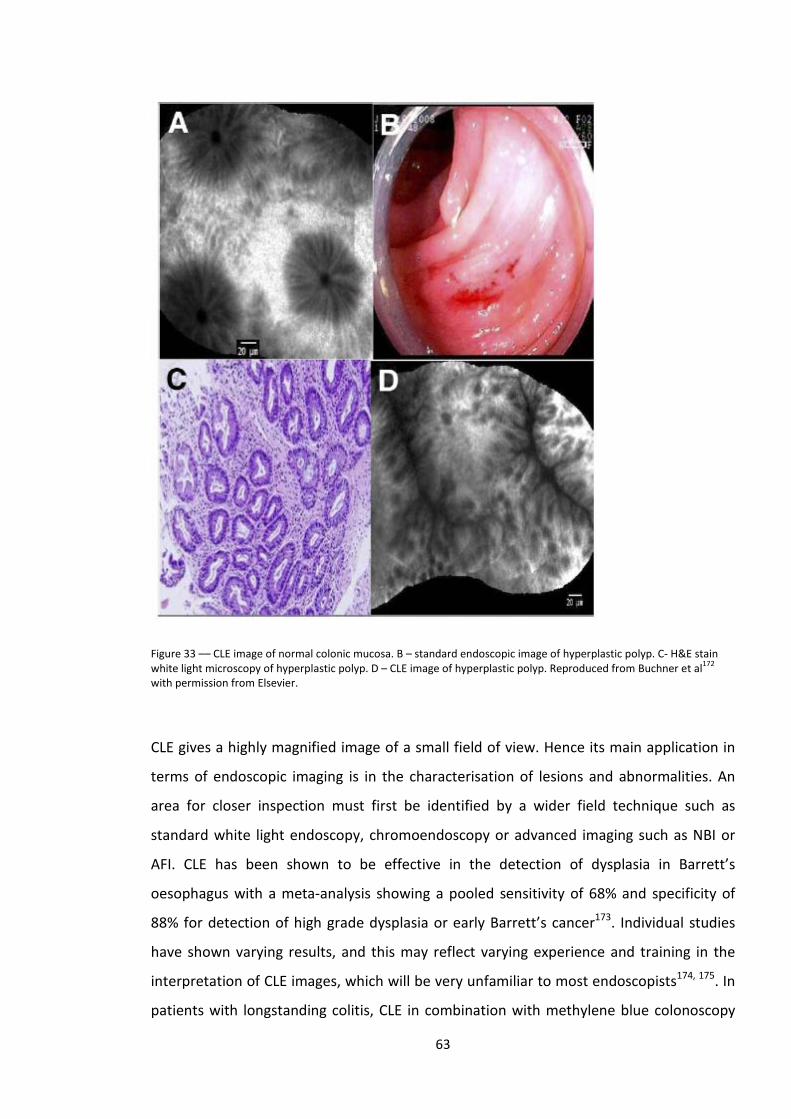
Figure 33 –– CLE image of normal colonic mucosa. B – standard endoscopic image of hyperplastic polyp. C- H&E stain white light microscopy of hyperplastic polyp. D – CLE image of hyperplastic polyp. Reproduced from Buchner et al172 with permission from Elsevier.
CLE gives a highly magnified image of a small field of view. Hence its main application in
terms of endoscopic imaging is in the characterisation of lesions and abnormalities. An
area for closer inspection must first be identified by a wider field technique such as
standard white light endoscopy, chromoendoscopy or advanced imaging such as NBI or
AFI. CLE has been shown to be effective in the detection of dysplasia in Barrett’s
oesophagus with a meta-analysis showing a pooled sensitivity of 68% and specificity of
88% for detection of high grade dysplasia or early Barrett’s cancer173. Individual studies
have shown varying results, and this may reflect varying experience and training in the
interpretation of CLE images, which will be very unfamiliar to most endoscopists174, 175. In
patients with longstanding colitis, CLE in combination with methylene blue colonoscopy
63
has been shown to be an effective tool for characterising lesions detected during
colonoscopy176. CLE for the characterisation of colorectal polyps has also been the subject
of a number of studies, which will be reviewed in the next chapter.
2.7.6 High definition endoscopy
Alongside the development of novel techniques and technologies to help detect and
characterise gastrointestinal neoplasia, there has been a continuous improvement in the
definition of white light video-endoscopy. The earliest video-endoscopes had a resolution
of around 50,000-100,000 pixels, producing images which at the time were felt to be
comparable to fiberoptic endoscopes53, 177, 178. In the intervening decades the resolution
of endoscopes has improved, firstly with the introduction of ‘high resolution endoscopy’
with over 400,000 pixels and more recently high-definition endoscopy with up to
1.3 million pixels. Whether improved endoscope resolution leads to improved detection
or characterisation of gastrointestinal lesions has been the focus of many studies which
will be reviewed in later chapters of this thesis.
64
Chapter 3 - In-vivo optical characterisation in the colon
3.1 Types of Colonic Mucosal lesions
Colonic mucosal lesions can be divided into 3 groups:-
Non-neoplastic lesions – these have negligible malignant potential. By far the most
common are hyperplastic polyps, but these also include inflammatory polyps and
lymphoid aggregates.
Non-malignant neoplastic lesions – this includes polyps which are benign but with
malignant potential, the commonest being adenomatous polyps, with others such as
traditional serrated adenomas and sessile serrated lesions being found less often.
Cancers - invasive colorectal adenocarcinomas. It is felt that the vast majority of these
arise from adenomatous or serrated polyps as precursor lesions38, 39, 42. There is a wide
spectrum of endoscopic appearances from very early submucosally invasive cancers to
large advanced lesions with deep invasion into the bowel wall or adjacent structures.
3.2 The concept of in-vivo characterisation
Since the early years of endoscopy, endoscopists have posed the question of whether an
accurate diagnosis of colorectal lesions could be made on the basis of the endoscopic
characteristics. Advanced cancers are clearly abnormal in appearance, even to the
untrained eye of a novice endoscopist or assistant who has minimal experience in
endoscopy. They will stand out from the normal background mucosa and will often cause
significant stricturing of the colonic lumen – see figure 34. In this situation additional
imaging techniques may not add much to the endoscopic diagnosis.
Where subtle endoscopic characteristics have more of a role is in distinguishing between
i) non-invasive neoplastic polyps and early invasive lesions and ii) non-neoplastic and
neoplastic polyps. This is useful because the management of colorectal lesions is
dependent on their histology. Non-neoplastic lesions with negligible or no malignant
65
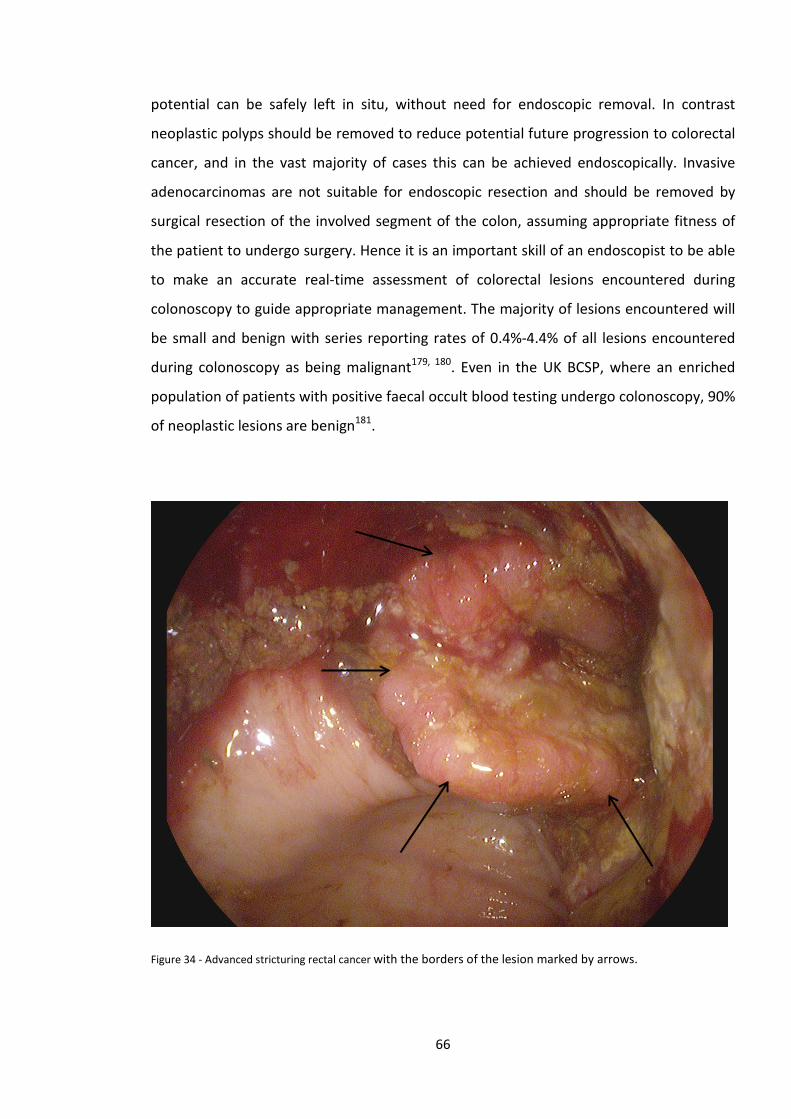
potential can be safely left in situ, without need for endoscopic removal. In contrast
neoplastic polyps should be removed to reduce potential future progression to colorectal
cancer, and in the vast majority of cases this can be achieved endoscopically. Invasive
adenocarcinomas are not suitable for endoscopic resection and should be removed by
surgical resection of the involved segment of the colon, assuming appropriate fitness of
the patient to undergo surgery. Hence it is an important skill of an endoscopist to be able
to make an accurate real-time assessment of colorectal lesions encountered during
colonoscopy to guide appropriate management. The majority of lesions encountered will
be small and benign with series reporting rates of 0.4%-4.4% of all lesions encountered
during colonoscopy as being malignant179, 180. Even in the UK BCSP, where an enriched
population of patients with positive faecal occult blood testing undergo colonoscopy, 90%
of neoplastic lesions are benign181.
Figure 34 - Advanced stricturing rectal cancer with the borders of the lesion marked by arrows.
66
3.3 Early attempts at colonic in-vivo characterisation
In the early days of fiberoptic endoscopy it was felt that accurate distinction between
non-neoplastic and neoplastic polyps could not be made on the basis of the endoscopic
appearances. In a paper from 1976 on the incidence and clinical significance of rectal
polyps, Payne commented that “The gross appearances, including size, do not therefore
give any indication of the microscopic character, and excision of all rectal polyps is
mandatory”.182
In 1982 Chapuis et al., examined 120 polyps ranging from 3 mm to 3.5 cm in size found
during 78 fiberoptic flexible sigmoidoscopy procedures183. They attempted to predict
whether lesions were adenomatous or hyperplastic based on endoscopic appearances
and were correct in 83% of cases. In a similar study, published in 1987 by Neale et al., 81
polyps were assessed with an accuracy of predicted histology of 80%184. Norfleet et al., in
1988 reported a 75% accuracy of optical diagnosis when compared to confirmed
histopathology of 611 polyps185. All of these early studies concluded that standard white
light endoscopy was not able to distinguish between neoplastic and non-neoplastic polyps
with sufficient accuracy to forego formal histopathological assessment182-185. Therefore,
endoscopic removal or biopsy was recommended to guide management and this has
been the paradigm for the vast majority of colonoscopists since the invention of
endoscopy.
Many subsequent studies, as described throughout the rest of this chapter have
compared to accuracy of optical diagnosis with histopathology as the gold standard. Most
of these studies use the following terms to describe the results of various optical
techniques
• Accuracy = number of correctly characterised lesions using optical diagnosis
Total number of lesions
• Sensitivity (for neoplasia) = number of correctly characterised neoplastic lesions
Total number of neoplastic lesions
• Specificity = number of correctly characterised non-neoplastic lesions
67
Total number of non-neoplastic lesions
• Negative Predictive value = no. of correctly characterised non-neoplastic lesions
Total number of non-neoplastic calls
3.4 Chromoendoscopy for the in-vivo characterisation of colonic lesions
The forerunners of improvements in colonic in vivo characterisation were Japanese
endoscopists. In 1994 Professor Kudo et al., described 7 different types of pit which could
be identified in either normal colonic mucosa, or colonic mucosal lesions, when examined
by magnifying colonoscopy123. The pits observed represented the opening of the mucosal
crypts of Lieberkühn and were predictive of the underlying histology.
The pits Kudo described were:
• Normal round pit – found in normal colonic mucosa
• Small round pit – found in borderline malignant lesions or adenocarcinoma
• Small asteroid pit – found in hyperplastic polyps
• Large asteroid pit – found in hyperplastic polyps or serrated adenomas
• Oval pits – found in adenomatous polyps
• Gyrus-like pits – found in tubulovillous adenomas
• Non-pit – found in adenocarcinomas
These 7 different types of pits were classified into 6 groups:
• Type I – normal round pits
• Type II – small and large asteroid pits
• Type IIIs – small round pits
• Type IIIL – oval pits
• Type IV – gyrus-like pit
• Type V – non-pit pattern
68
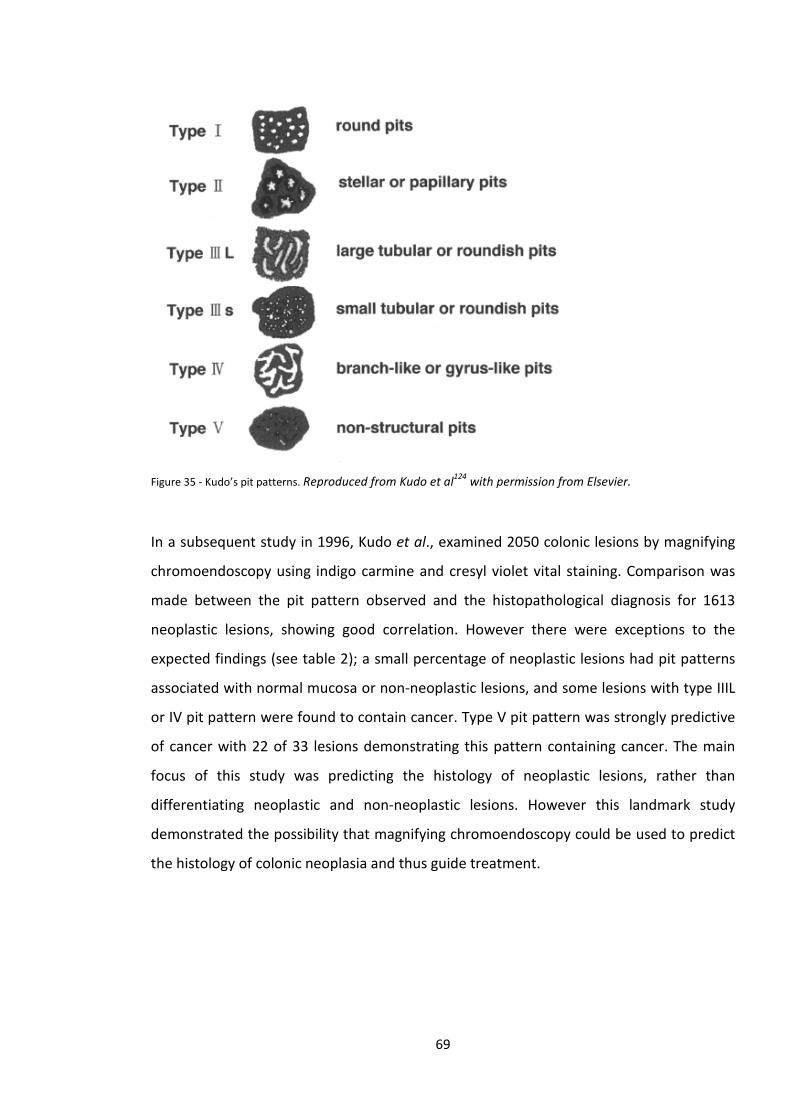
Figure 35 - Kudo’s pit patterns. Reproduced from Kudo et al124 with permission from Elsevier.
In a subsequent study in 1996, Kudo et al., examined 2050 colonic lesions by magnifying
chromoendoscopy using indigo carmine and cresyl violet vital staining. Comparison was
made between the pit pattern observed and the histopathological diagnosis for 1613
neoplastic lesions, showing good correlation. However there were exceptions to the
expected findings (see table 2); a small percentage of neoplastic lesions had pit patterns
associated with normal mucosa or non-neoplastic lesions, and some lesions with type IIIL
or IV pit pattern were found to contain cancer. Type V pit pattern was strongly predictive
of cancer with 22 of 33 lesions demonstrating this pattern containing cancer. The main
focus of this study was predicting the histology of neoplastic lesions, rather than
differentiating neoplastic and non-neoplastic lesions. However this landmark study
demonstrated the possibility that magnifying chromoendoscopy could be used to predict
the histology of colonic neoplasia and thus guide treatment.
69
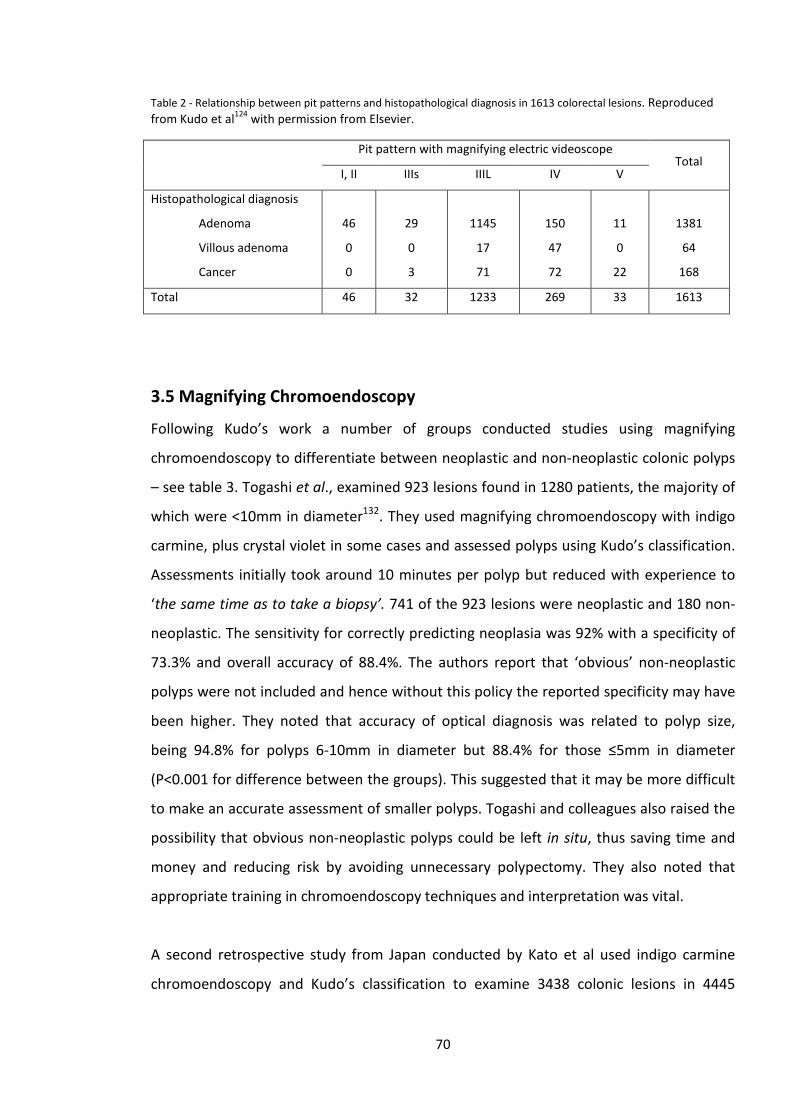
Table 2 - Relationship between pit patterns and histopathological diagnosis in 1613 colorectal lesions. Reproduced from Kudo et al124 with permission from Elsevier.
Pit pattern with magnifying electric videoscope Total
I, II IIIs IIIL IV V
Histopathological diagnosis
Adenoma
Villous adenoma
Cancer
46
0
0
29
0
3
1145
17
71
150
47
72
11
0
22
1381
64
168
Total 46 32 1233 269 33 1613
3.5 Magnifying Chromoendoscopy
Following Kudo’s work a number of groups conducted studies using magnifying
chromoendoscopy to differentiate between neoplastic and non-neoplastic colonic polyps
– see table 3. Togashi et al., examined 923 lesions found in 1280 patients, the majority of
which were <10mm in diameter132. They used magnifying chromoendoscopy with indigo
carmine, plus crystal violet in some cases and assessed polyps using Kudo’s classification.
Assessments initially took around 10 minutes per polyp but reduced with experience to
‘the same time as to take a biopsy’. 741 of the 923 lesions were neoplastic and 180 non-
neoplastic. The sensitivity for correctly predicting neoplasia was 92% with a specificity of
73.3% and overall accuracy of 88.4%. The authors report that ‘obvious’ non-neoplastic
polyps were not included and hence without this policy the reported specificity may have
been higher. They noted that accuracy of optical diagnosis was related to polyp size,
being 94.8% for polyps 6-10mm in diameter but 88.4% for those ≤5mm in diameter
(P<0.001 for difference between the groups). This suggested that it may be more difficult
to make an accurate assessment of smaller polyps. Togashi and colleagues also raised the
possibility that obvious non-neoplastic polyps could be left in situ, thus saving time and
money and reducing risk by avoiding unnecessary polypectomy. They also noted that
appropriate training in chromoendoscopy techniques and interpretation was vital.
A second retrospective study from Japan conducted by Kato et al used indigo carmine
chromoendoscopy and Kudo’s classification to examine 3438 colonic lesions in 4445
70
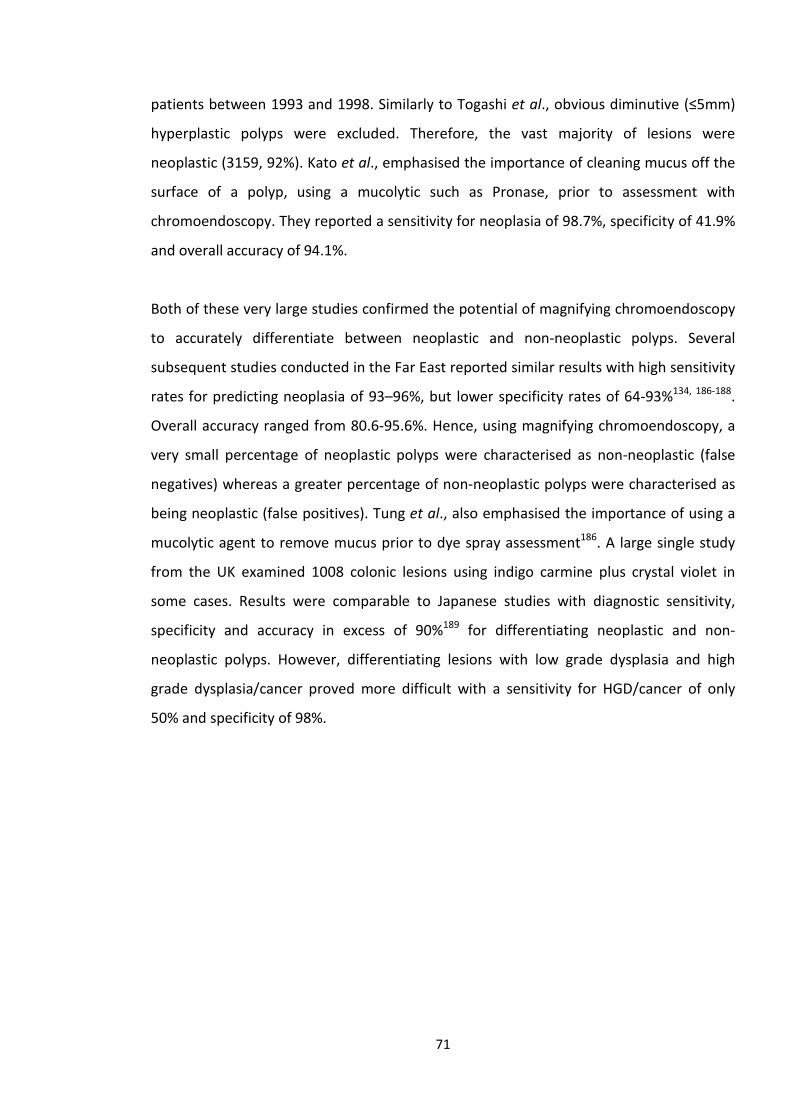
patients between 1993 and 1998. Similarly to Togashi et al., obvious diminutive (≤5mm)
hyperplastic polyps were excluded. Therefore, the vast majority of lesions were
neoplastic (3159, 92%). Kato et al., emphasised the importance of cleaning mucus off the
surface of a polyp, using a mucolytic such as Pronase, prior to assessment with
chromoendoscopy. They reported a sensitivity for neoplasia of 98.7%, specificity of 41.9%
and overall accuracy of 94.1%.
Both of these very large studies confirmed the potential of magnifying chromoendoscopy
to accurately differentiate between neoplastic and non-neoplastic polyps. Several
subsequent studies conducted in the Far East reported similar results with high sensitivity
rates for predicting neoplasia of 93–96%, but lower specificity rates of 64-93%134, 186-188.
Overall accuracy ranged from 80.6-95.6%. Hence, using magnifying chromoendoscopy, a
very small percentage of neoplastic polyps were characterised as non-neoplastic (false
negatives) whereas a greater percentage of non-neoplastic polyps were characterised as
being neoplastic (false positives). Tung et al., also emphasised the importance of using a
mucolytic agent to remove mucus prior to dye spray assessment186. A large single study
from the UK examined 1008 colonic lesions using indigo carmine plus crystal violet in
some cases. Results were comparable to Japanese studies with diagnostic sensitivity,
specificity and accuracy in excess of 90%189 for differentiating neoplastic and non-
neoplastic polyps. However, differentiating lesions with low grade dysplasia and high
grade dysplasia/cancer proved more difficult with a sensitivity for HGD/cancer of only
50% and specificity of 98%.
71
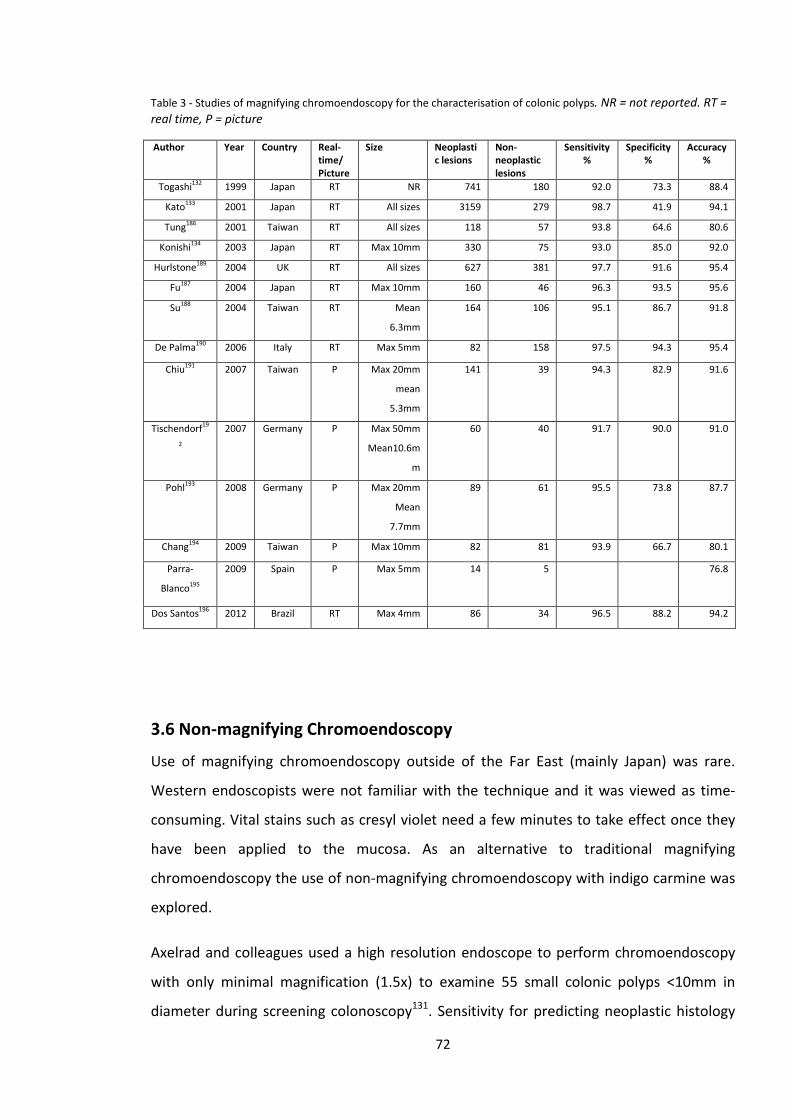
Table 3 - Studies of magnifying chromoendoscopy for the characterisation of colonic polyps. NR = not reported. RT = real time, P = picture
Author Year Country Real-time/ Picture
Size Neoplastic lesions
Non-neoplastic lesions
Sensitivity %
Specificity %
Accuracy %
Togashi132 1999 Japan RT NR 741 180 92.0 73.3 88.4
Kato133 2001 Japan RT All sizes 3159 279 98.7 41.9 94.1
Tung186 2001 Taiwan RT All sizes 118 57 93.8 64.6 80.6
Konishi134 2003 Japan RT Max 10mm 330 75 93.0 85.0 92.0
Hurlstone189 2004 UK RT All sizes 627 381 97.7 91.6 95.4
Fu187 2004 Japan RT Max 10mm 160 46 96.3 93.5 95.6
Su188 2004 Taiwan RT Mean
6.3mm
164 106 95.1 86.7 91.8
De Palma190 2006 Italy RT Max 5mm 82 158 97.5 94.3 95.4
Chiu191 2007 Taiwan P Max 20mm
mean
5.3mm
141 39 94.3 82.9 91.6
Tischendorf19
2
2007 Germany P Max 50mm
Mean10.6m
m
60 40 91.7 90.0 91.0
Pohl193 2008 Germany P Max 20mm
Mean
7.7mm
89 61 95.5 73.8 87.7
Chang194 2009 Taiwan P Max 10mm 82 81 93.9 66.7 80.1
Parra-
Blanco195
2009 Spain P Max 5mm 14 5 76.8
Dos Santos196 2012 Brazil RT Max 4mm 86 34 96.5 88.2 94.2
3.6 Non-magnifying Chromoendoscopy
Use of magnifying chromoendoscopy outside of the Far East (mainly Japan) was rare.
Western endoscopists were not familiar with the technique and it was viewed as time-
consuming. Vital stains such as cresyl violet need a few minutes to take effect once they
have been applied to the mucosa. As an alternative to traditional magnifying
chromoendoscopy the use of non-magnifying chromoendoscopy with indigo carmine was
explored.
Axelrad and colleagues used a high resolution endoscope to perform chromoendoscopy
with only minimal magnification (1.5x) to examine 55 small colonic polyps <10mm in
diameter during screening colonoscopy131. Sensitivity for predicting neoplastic histology
72
was 93%, specificity95% and overall accuracy 95%. These were impressive results for a
non-magnification technique but based on a very small series.
Kiesslich et al., from Mainz, Germany examined 283 polyps (73 neoplastic, 210 non-
neoplastic) using mostly non-magnifying chromoendoscopy with indigo carmine129.
Kudo’s pit patterns were used for characterisation of polyps. In their protocol, if no polyps
were found on initial white light examination, the distal 30cm of sigmoid colon and
rectum were sprayed with indigo carmine to aid lesion detection. This would explain the
high numbers of non-neoplastic polyps found in this study as diminutive hyperplastic
polyps are very common in the distal colon and rectum and become more evident after
dye-spraying. The results for sensitivity and accuracy in this study were very similar to the
Japanese studies using a magnifying technique – see table 3. In addition specificity was
92.4%, higher than that found in most studies using magnifying chromoendoscopy.
In a multicentre study conducted in the US using high-resolution non-magnifying
chromoendoscopy with ingido carmine, Eisen and colleagues characterised 520 colonic
polyps197. Hyperplastic polyps were classified as those displaying circular surface ‘dots’,
similar to the normal mucosa, whereas adenomatous polyps had surface ‘grooves’ or a
sulcus-like appearance. In essence this was a very simplified representation of Kudo’s pit
pattern classification. Only polyps 10 mm or less in diameter were included in the study.
In the reported results they found a sensitivity of 82% for prediction of adenomatous
histology, specificity of 82% and overall accuracy of 82%. However, 40 polyps were
excluded at the time of endoscopy “because of inadequate staining or inability to see the
pits or grooves.” If these polyps are included in the results as false calls on an intention-
to-characterise basis then sensitivity, specificity and accuracy fall to 79%, 74% and 76%
respectively.
In an attempt to determine whether magnification added further diagnostic accuracy
over and above non-magnifying chromoendoscopy, Fu et al., examined 206 polyps
<10mm in diameter sequentially using white light, non-magnifying chromoendoscopy and
finally magnifying chromoendoscopy187. A prediction of histology was made after
assessment with each modality. 160 polyps were neoplastic and 46 non-neoplastic, with
180 of the 206 polyps being 5mm or less in size. The results are displayed in table 4..
73
Magnifying chromoendoscopy was found to have significantly higher accuracy than white
light colonoscopy (P=0.0001) and non-magnifying chromoendoscopy (p=0.0152).
However, there was no statistically significant difference in accuracy between white light
endoscopy and non-magnifying chromoendoscopy (p=0.111). These results suggested
that non-magnifying chromoendoscopy offered no diagnostic advantage over white light
endoscopy, or that the study was insufficiently powered to demonstrate a significant
difference between these two modalities. One potential explanation for this lack of
difference was the high accuracy (84%) achieved with standard white light endoscopy.
The main gain of magnifying chromoendoscopy was found to be an increase in specificity
from 67.4% with white light endoscopy to 76.1% with non-magnifying chromoendoscopy
to 93.5% with magnifying chromoendoscopy.
Table 4 - Results of In-vivo characterisation of 206 colonic polyps reproduced from Fu et al187.
Method Diagnostic Accuracy, % Sensitivity, % Specificity, %
White light 84.0 88.8 67.4
Chromoendoscopy 89.3 93.1 76.1
Chromoendoscopy
with magnification
95.6 96.3 93.5
A German study by Apel et al., examined 273 polyps <5 mm in size limited to the rectum
and sigmoid colon using standard white light endoscopy followed by high resolution non-
magnifying chromoendoscopy with indigo carmine198. Of the included lesions 82% were
hyperplastic polyps. This study found no significant difference in accuracy between white
light and non-magnifying chromoendoscopy (81% & 83% respectively, p = NS).
Table 5 - Studies of non-magnifying indigo carmine chromoendoscopy for the characterisation of colonic polyps.* - Sensitivity, specificity and accuracy 79%, 74% and 76% on intention-to-characterise analysis. ** - rectosigmoid polyps only. NR = not reported, RT = real-time, P = picture
74
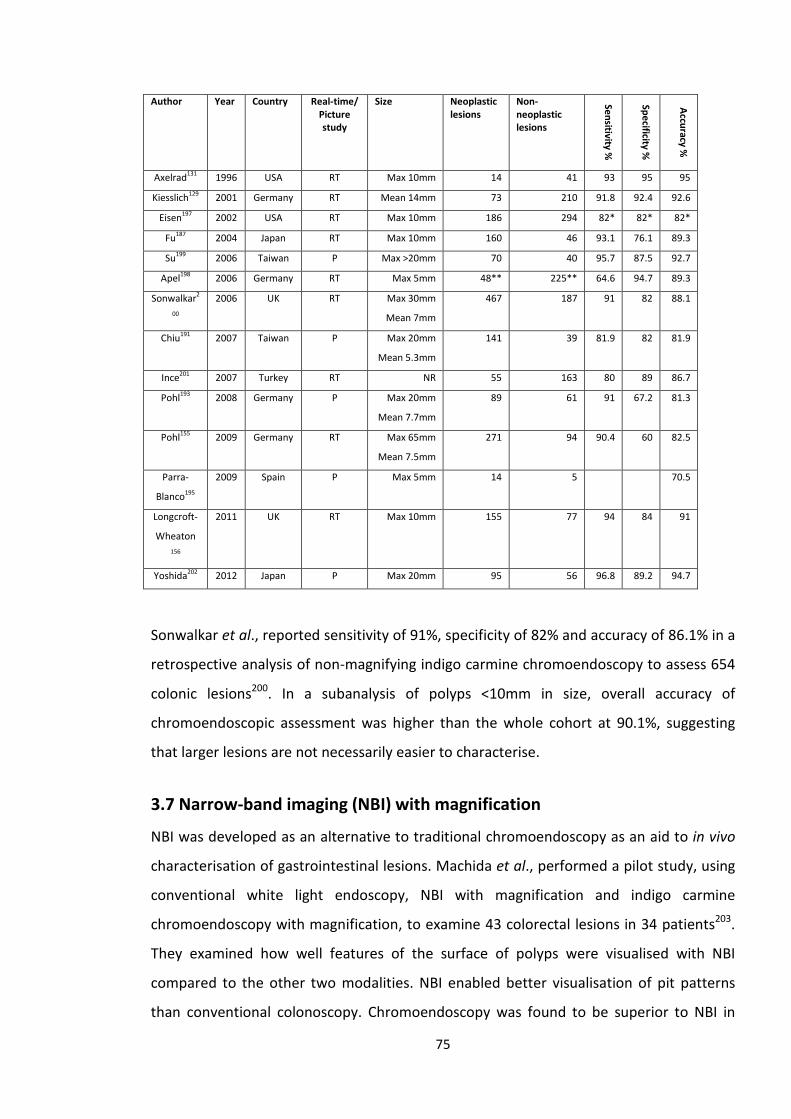
Author Year Country Real-time/ Picture study
Size Neoplastic lesions
Non-neoplastic lesions
Sensitivity %
Specificity %
Accuracy %
Axelrad131 1996 USA RT Max 10mm 14 41 93 95 95
Kiesslich129 2001 Germany RT Mean 14mm 73 210 91.8 92.4 92.6
Eisen197 2002 USA RT Max 10mm 186 294 82* 82* 82*
Fu187 2004 Japan RT Max 10mm 160 46 93.1 76.1 89.3
Su199 2006 Taiwan P Max >20mm 70 40 95.7 87.5 92.7
Apel198 2006 Germany RT Max 5mm 48** 225** 64.6 94.7 89.3
Sonwalkar2
00
2006 UK RT Max 30mm
Mean 7mm
467 187 91 82 88.1
Chiu191 2007 Taiwan P Max 20mm
Mean 5.3mm
141 39 81.9 82 81.9
Ince201 2007 Turkey RT NR 55 163 80 89 86.7
Pohl193 2008 Germany P Max 20mm
Mean 7.7mm
89 61 91 67.2 81.3
Pohl155 2009 Germany RT Max 65mm
Mean 7.5mm
271 94 90.4 60 82.5
Parra-
Blanco195
2009 Spain P Max 5mm 14 5 70.5
Longcroft-
Wheaton 156
2011 UK RT Max 10mm 155 77 94 84 91
Yoshida202 2012 Japan P Max 20mm 95 56 96.8 89.2 94.7
Sonwalkar et al., reported sensitivity of 91%, specificity of 82% and accuracy of 86.1% in a
retrospective analysis of non-magnifying indigo carmine chromoendoscopy to assess 654
colonic lesions200. In a subanalysis of polyps <10mm in size, overall accuracy of
chromoendoscopic assessment was higher than the whole cohort at 90.1%, suggesting
that larger lesions are not necessarily easier to characterise.
3.7 Narrow-band imaging (NBI) with magnification
NBI was developed as an alternative to traditional chromoendoscopy as an aid to in vivo
characterisation of gastrointestinal lesions. Machida et al., performed a pilot study, using
conventional white light endoscopy, NBI with magnification and indigo carmine
chromoendoscopy with magnification, to examine 43 colorectal lesions in 34 patients203.
They examined how well features of the surface of polyps were visualised with NBI
compared to the other two modalities. NBI enabled better visualisation of pit patterns
than conventional colonoscopy. Chromoendoscopy was found to be superior to NBI in
75
this regard. NBI was found to be the best modality for examining the fine vascular
network of lesions. Accuracy of endoscopic diagnosis was the same for NBI and
chromoendoscopy (93.4%), both higher than for conventional white-light endoscopy
(79.1%), although this small study had very limited power to compare NBI and
chromoendoscopy.
In another Japanese study, Tanaka et al., examined 90 colonic lesions (9 hyperplastic
polyps, 60 adenomas and 21 early cancers) using Kudo’s pit patterns visualised with NBI
and compared these with the pit patterns observed with a stereomicroscope204. Overall
there was 93% agreement in pit pattern classification between the two modalities, with
discordant results mainly found in those lesions with a type V pit pattern under
stereomicroscopy.
Tischendorf et al., from Aachen, Germany performed a picture study of 200 colonic
lesions examined by 2 endoscopists, divided equally between magnifying
chromoendoscopy and magnifying NBI192. Lesions were characterised by both Kudo’s pit
patterns and by vascular patterns, firstly by white light endoscopy and then by
chromoendoscopy/NBI. Based on pit pattern assessment there were no significant
differences in performance between chromoendoscopy and NBI. However, NBI was
superior to chromoendoscopy for assessing vascular patterns when compared in terms of
sensitivity, accuracy and negative predictive value. The authors commented that
chromoendoscopy may obscure the view of blood vessels, making assessment of vascular
patterns more difficult. However, they also noted that in reality, it was extremely difficult
for an endoscopist to focus on pit patterns and ‘ignore’ vascular patterns, or vice versa.
In a UK based study, East et al., examined 116 polyps <10 mm in size in real-time using
magnifying NBI. Polyps were characterised according to Kudo’s pit patterns and then by
‘Vascular pattern intensity’ (VPI)152. VPI was defined as “a subjective assessment of the
darkness of the lines that outline each colonic crypt or pit compared with adjacent normal
mucosa”. Darker lines represented increased microvascular density and were classified as
‘Strong’ VPI and indicated a dysplastic polyp. Pale lines were classified as ‘weak’ VPI and
those that were the same as the background mucosa ‘normal’ VPI. Weak and normal VPI
were suggestive of non-neoplastic polyps.
76
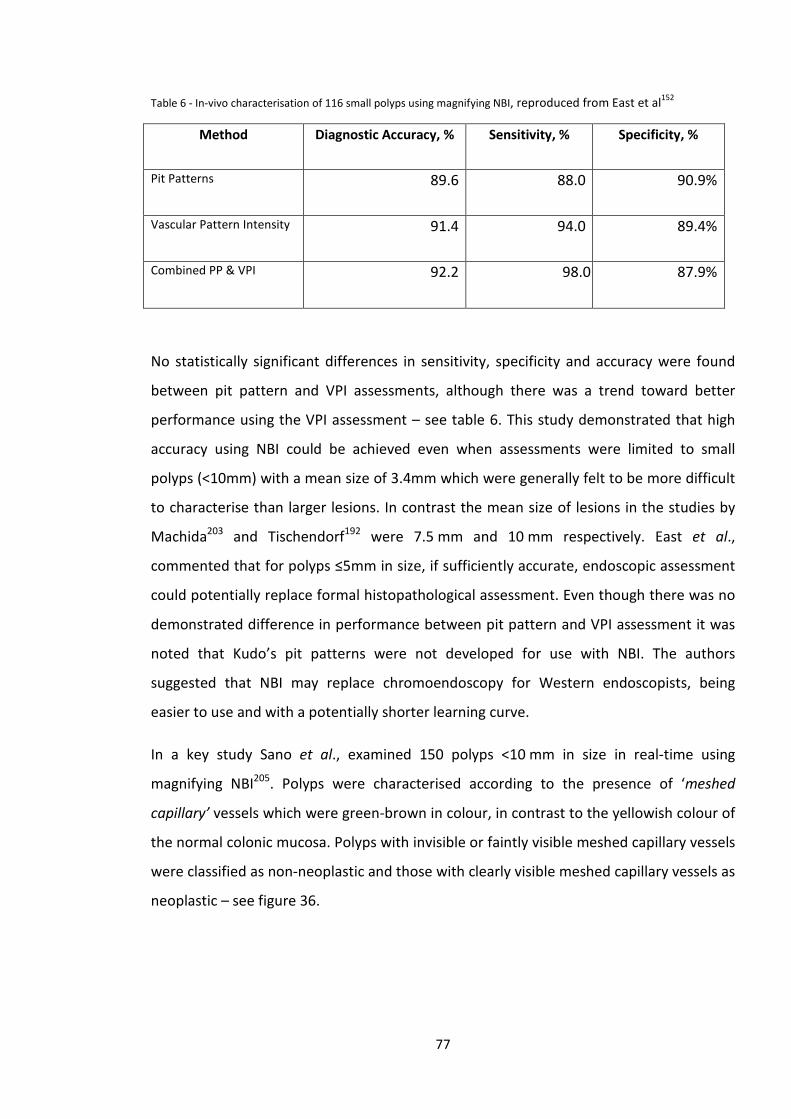
Table 6 - In-vivo characterisation of 116 small polyps using magnifying NBI, reproduced from East et al152
Method Diagnostic Accuracy, % Sensitivity, % Specificity, %
Pit Patterns 89.6 88.0 90.9%
Vascular Pattern Intensity 91.4 94.0 89.4%
Combined PP & VPI 92.2 98.0 87.9%
No statistically significant differences in sensitivity, specificity and accuracy were found
between pit pattern and VPI assessments, although there was a trend toward better
performance using the VPI assessment – see table 6. This study demonstrated that high
accuracy using NBI could be achieved even when assessments were limited to small
polyps (<10mm) with a mean size of 3.4mm which were generally felt to be more difficult
to characterise than larger lesions. In contrast the mean size of lesions in the studies by
Machida203 and Tischendorf192 were 7.5 mm and 10 mm respectively. East et al.,
commented that for polyps ≤5mm in size, if sufficiently accurate, endoscopic assessment
could potentially replace formal histopathological assessment. Even though there was no
demonstrated difference in performance between pit pattern and VPI assessment it was
noted that Kudo’s pit patterns were not developed for use with NBI. The authors
suggested that NBI may replace chromoendoscopy for Western endoscopists, being
easier to use and with a potentially shorter learning curve.
In a key study Sano et al., examined 150 polyps <10 mm in size in real-time using
magnifying NBI205. Polyps were characterised according to the presence of ‘meshed
capillary’ vessels which were green-brown in colour, in contrast to the yellowish colour of
the normal colonic mucosa. Polyps with invisible or faintly visible meshed capillary vessels
were classified as non-neoplastic and those with clearly visible meshed capillary vessels as
neoplastic – see figure 36.
77
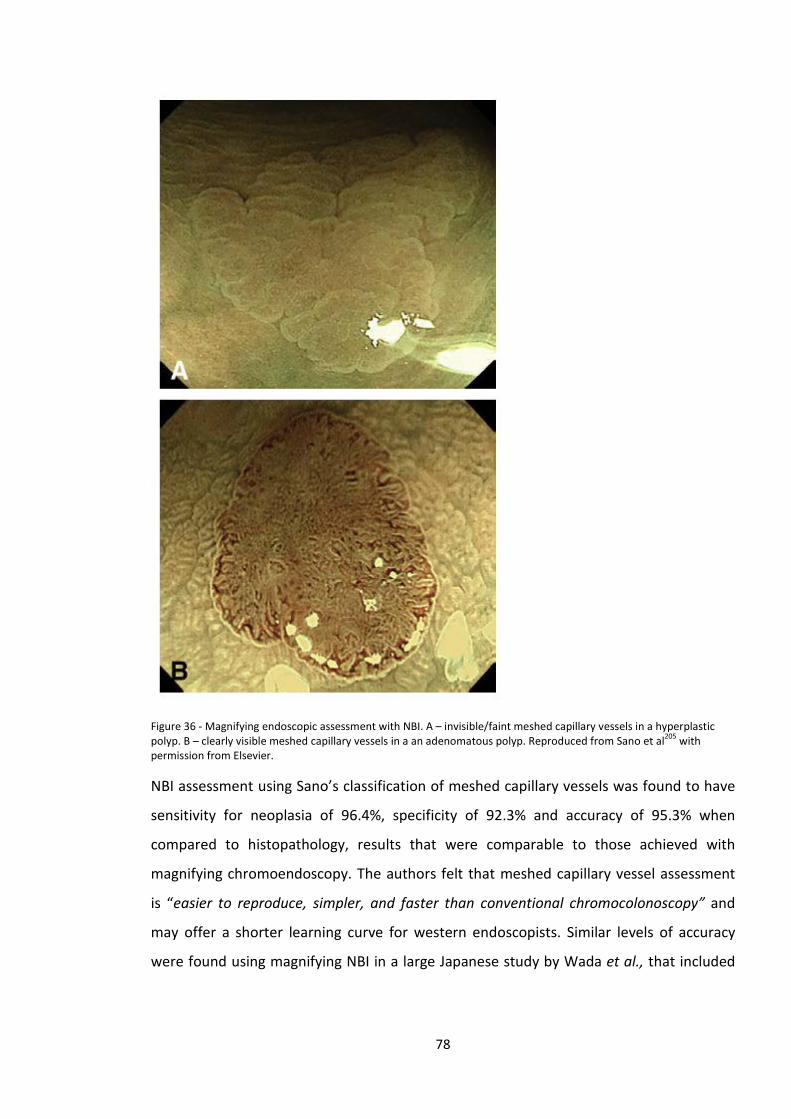
Figure 36 - Magnifying endoscopic assessment with NBI. A – invisible/faint meshed capillary vessels in a hyperplastic polyp. B – clearly visible meshed capillary vessels in a an adenomatous polyp. Reproduced from Sano et al205 with permission from Elsevier.
NBI assessment using Sano’s classification of meshed capillary vessels was found to have
sensitivity for neoplasia of 96.4%, specificity of 92.3% and accuracy of 95.3% when
compared to histopathology, results that were comparable to those achieved with
magnifying chromoendoscopy. The authors felt that meshed capillary vessel assessment
is “easier to reproduce, simpler, and faster than conventional chromocolonoscopy” and
may offer a shorter learning curve for western endoscopists. Similar levels of accuracy
were found using magnifying NBI in a large Japanese study by Wada et al., that included
78
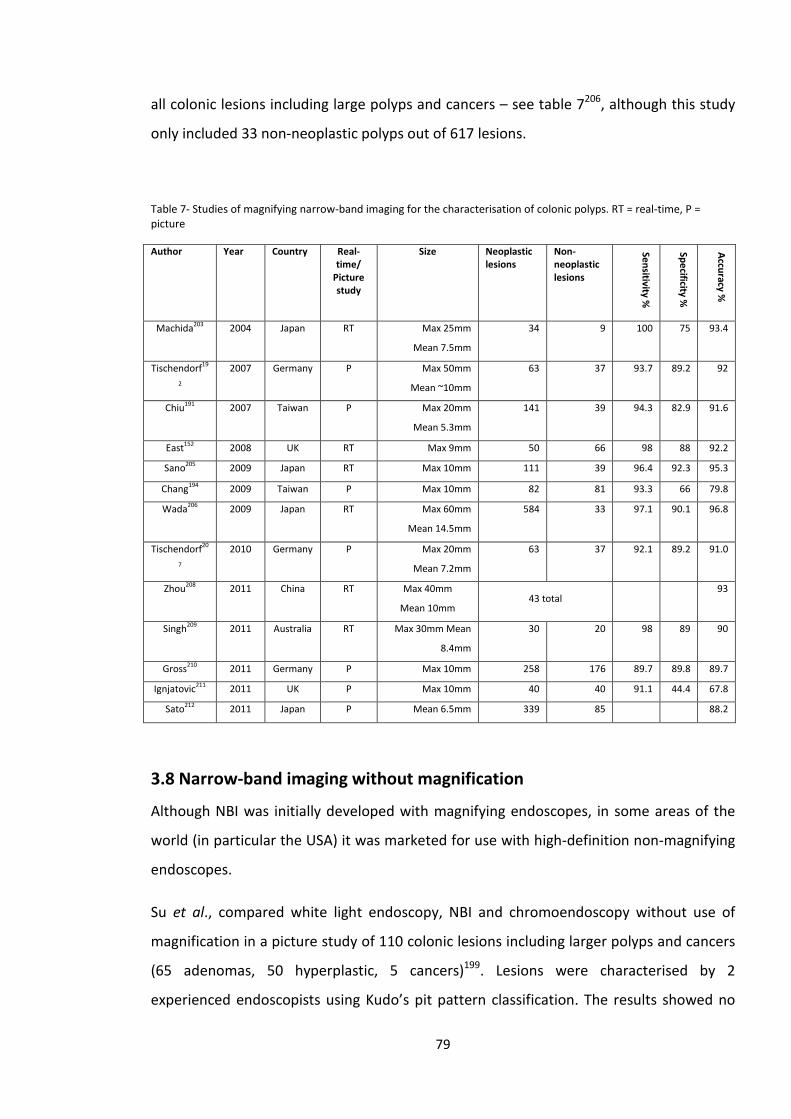
all colonic lesions including large polyps and cancers – see table 7206, although this study
only included 33 non-neoplastic polyps out of 617 lesions.
Table 7- Studies of magnifying narrow-band imaging for the characterisation of colonic polyps. RT = real-time, P = picture
Author Year Country Real-time/
Picture study
Size Neoplastic lesions
Non-neoplastic lesions
Sensitivity %
Specificity %
Accuracy %
Machida203 2004 Japan RT Max 25mm
Mean 7.5mm
34 9 100 75 93.4
Tischendorf19
2
2007 Germany P Max 50mm
Mean ~10mm
63 37 93.7 89.2 92
Chiu191 2007 Taiwan P Max 20mm
Mean 5.3mm
141 39 94.3 82.9 91.6
East152 2008 UK RT Max 9mm 50 66 98 88 92.2
Sano205 2009 Japan RT Max 10mm 111 39 96.4 92.3 95.3
Chang194 2009 Taiwan P Max 10mm 82 81 93.3 66 79.8
Wada206 2009 Japan RT Max 60mm
Mean 14.5mm
584 33 97.1 90.1 96.8
Tischendorf20
7
2010 Germany P Max 20mm
Mean 7.2mm
63 37 92.1 89.2 91.0
Zhou208 2011 China RT Max 40mm
Mean 10mm 43 total
93
Singh209 2011 Australia RT Max 30mm Mean
8.4mm
30 20 98 89 90
Gross210 2011 Germany P Max 10mm 258 176 89.7 89.8 89.7
Ignjatovic211 2011 UK P Max 10mm 40 40 91.1 44.4 67.8
Sato212 2011 Japan P Mean 6.5mm 339 85 88.2
3.8 Narrow-band imaging without magnification
Although NBI was initially developed with magnifying endoscopes, in some areas of the
world (in particular the USA) it was marketed for use with high-definition non-magnifying
endoscopes.
Su et al., compared white light endoscopy, NBI and chromoendoscopy without use of
magnification in a picture study of 110 colonic lesions including larger polyps and cancers
(65 adenomas, 50 hyperplastic, 5 cancers)199. Lesions were characterised by 2
experienced endoscopists using Kudo’s pit pattern classification. The results showed no
79
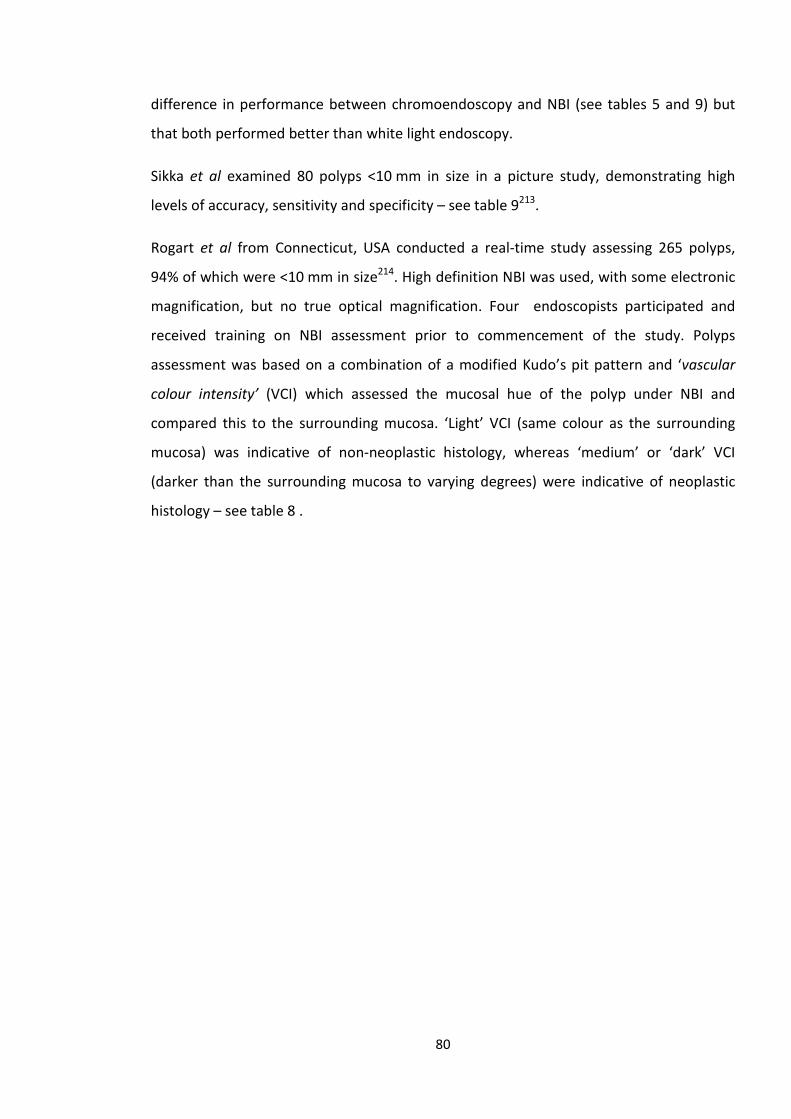
difference in performance between chromoendoscopy and NBI (see tables 5 and 9) but
that both performed better than white light endoscopy.
Sikka et al examined 80 polyps <10 mm in size in a picture study, demonstrating high
levels of accuracy, sensitivity and specificity – see table 9213.
Rogart et al from Connecticut, USA conducted a real-time study assessing 265 polyps,
94% of which were <10 mm in size214. High definition NBI was used, with some electronic
magnification, but no true optical magnification. Four endoscopists participated and
received training on NBI assessment prior to commencement of the study. Polyps
assessment was based on a combination of a modified Kudo’s pit pattern and ‘vascular
colour intensity’ (VCI) which assessed the mucosal hue of the polyp under NBI and
compared this to the surrounding mucosa. ‘Light’ VCI (same colour as the surrounding
mucosa) was indicative of non-neoplastic histology, whereas ‘medium’ or ‘dark’ VCI
(darker than the surrounding mucosa to varying degrees) were indicative of neoplastic
histology – see table 8 .
80
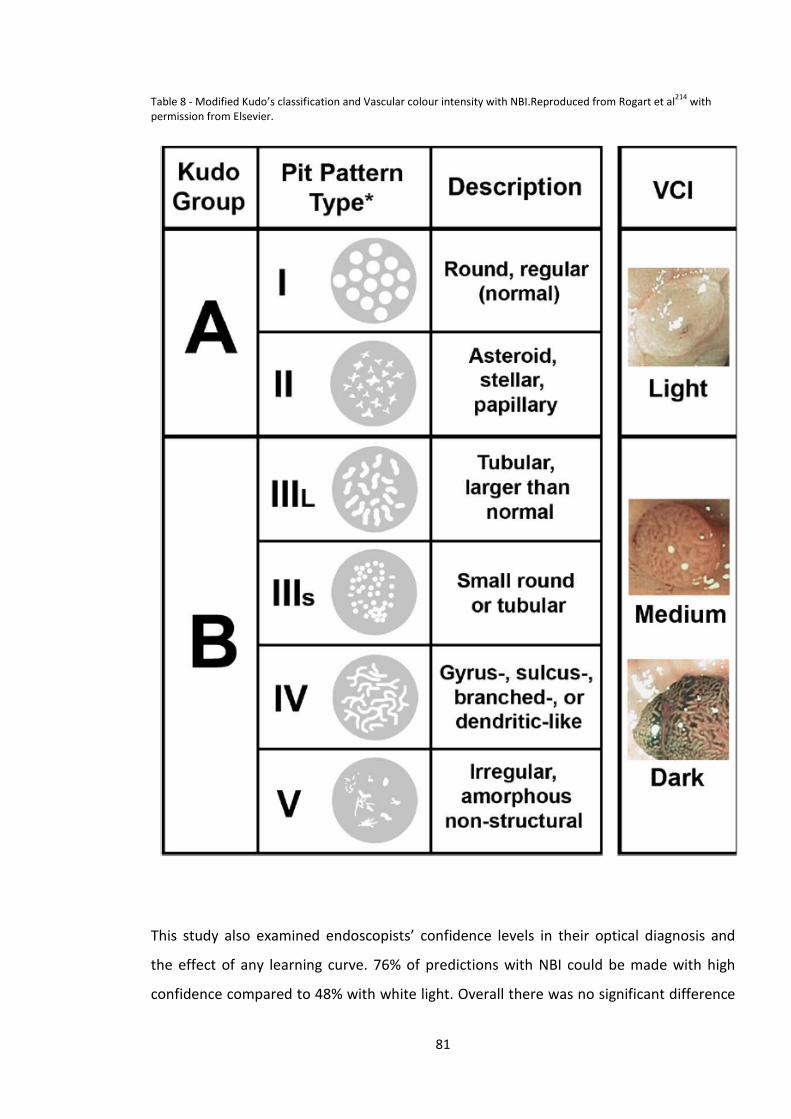
Table 8 - Modified Kudo’s classification and Vascular colour intensity with NBI.Reproduced from Rogart et al214 with permission from Elsevier.
This study also examined endoscopists’ confidence levels in their optical diagnosis and
the effect of any learning curve. 76% of predictions with NBI could be made with high
confidence compared to 48% with white light. Overall there was no significant difference
81
in accuracy of optical characterisation between white light (77%) and NBI (80%).
However, there was an improvement in sensitivity with NBI over white light (80% vs 69%,
P<0.05). It is notable that there was considerable overlap in vascular colour intensity
between neoplastic and non-neoplastic polyps with approximately 30% of neoplastic
polyps demonstrating light VCI, and approximately 30% of non-neoplastic polyps
demonstrating medium VCI.
NBI accuracy improved from 74% to 87% between the first and second halves of the study
but accuracy with white light did not change (78% & 79% respectively), suggesting a
potential learning curve effect with NBI, and emphasising the importance of training in
any new technique used for lesion/polyp assessment.
In contrast to the study by Rogart et al, Rastogi et al did not demonstrate a significant
learning effect between the first and second halves of a study involving real-time
assessment of 236 polyps215. Assessments were performed by a single experienced
endoscopist and found a marked difference in diagnostic accuracy between high
definition white light (61%) and NBI (93%). Sensitivity for neoplasia was also dramatically
different with a rate of 96% for NBI and a surprisingly low rate of 38% with high definition
white light assessment. However there was no significant difference between the two
modalities in specificity (HDWL 97%, NBI 89%).
Several other studies from academic centres using non-magnifying NBI achieved high
rates of sensitivity (77% – 96%), specificity (68%-92%) and accuracy (78.6%-94%)154, 160, 167,
172, 207, 208, 216-218. Tischendorf performed a picture study comparing magnifying and non-
magnifying NBI207. Although vessel clarity was rated as higher with magnifying NBI, there
was no actual significant difference in diagnostic accuracy between the two modalities.
What this large number of studies demonstrated was that NBI, with or without
magnification, was a viable alternative to chromoendoscopy for the accurate in vivo
assessment of colonic lesions, at least in the hands of experienced endoscopists in
academic centres. They also demonstrated that assessment of vascular patterns using NBI
could prove just as accurate as assessment of pit patterns using chromoendoscopy.
82
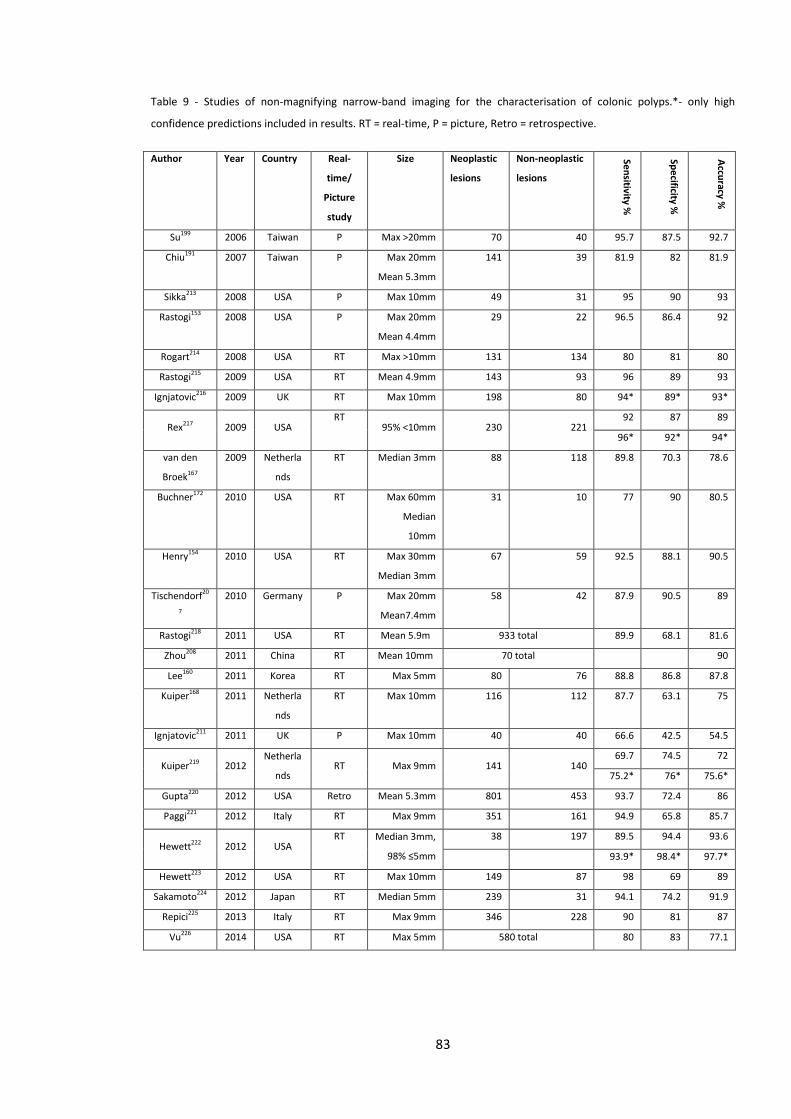
Table 9 - Studies of non-magnifying narrow-band imaging for the characterisation of colonic polyps.*- only high
confidence predictions included in results. RT = real-time, P = picture, Retro = retrospective.
Author Year Country Real-
time/
Picture
study
Size Neoplastic
lesions
Non-neoplastic
lesions Sensitivity %
Specificity %
Accuracy %
Su199 2006 Taiwan P Max >20mm 70 40 95.7 87.5 92.7
Chiu191 2007 Taiwan P Max 20mm
Mean 5.3mm
141 39 81.9 82 81.9
Sikka213 2008 USA P Max 10mm 49 31 95 90 93
Rastogi153 2008 USA P Max 20mm
Mean 4.4mm
29 22 96.5 86.4 92
Rogart214 2008 USA RT Max >10mm 131 134 80 81 80
Rastogi215 2009 USA RT Mean 4.9mm 143 93 96 89 93
Ignjatovic216 2009 UK RT Max 10mm 198 80 94* 89* 93*
Rex217 2009 USA RT
95% <10mm 230 221 92 87 89
96* 92* 94*
van den
Broek167
2009 Netherla
nds
RT Median 3mm 88 118 89.8 70.3 78.6
Buchner172 2010 USA RT Max 60mm
Median
10mm
31 10 77 90 80.5
Henry154 2010 USA RT Max 30mm
Median 3mm
67 59 92.5 88.1 90.5
Tischendorf20
7
2010 Germany P Max 20mm
Mean7.4mm
58 42 87.9 90.5 89
Rastogi218 2011 USA RT Mean 5.9m 933 total 89.9 68.1 81.6
Zhou208 2011 China RT Mean 10mm 70 total 90
Lee160 2011 Korea RT Max 5mm 80 76 88.8 86.8 87.8
Kuiper168 2011 Netherla
nds
RT Max 10mm 116 112 87.7 63.1 75
Ignjatovic211 2011 UK P Max 10mm 40 40 66.6 42.5 54.5
Kuiper219 2012 Netherla
nds RT Max 9mm 141 140
69.7 74.5 72
75.2* 76* 75.6*
Gupta220 2012 USA Retro Mean 5.3mm 801 453 93.7 72.4 86
Paggi221 2012 Italy RT Max 9mm 351 161 94.9 65.8 85.7
Hewett222 2012 USA RT Median 3mm,
98% ≤5mm
38 197 89.5 94.4 93.6
93.9* 98.4* 97.7*
Hewett223 2012 USA RT Max 10mm 149 87 98 69 89
Sakamoto224 2012 Japan RT Median 5mm 239 31 94.1 74.2 91.9
Repici225 2013 Italy RT Max 9mm 346 228 90 81 87
Vu226 2014 USA RT Max 5mm 580 total 80 83 77.1
83
3.9 Flexible Spectral Imaging Colour Enhancement (FICE)
As described in the previous chapter, the FICE system of Fujinon endoscopes utilises post-
processor technology to digitally alter the bandwidths of light in the displayed image,
with 10 different settings available. Several studies have used FICE for the in vivo
assessment of colonic lesions.
Pohl et al examined 150 lesions with a mean size of 7.7 mm using white light, FICE and
indigo carmine, all with and without magnification193. Images captured during
colonoscopy were characterised by an expert endoscopist blinded to the
histopathological diagnosis. In this study the FICE setting used had wavelengths of 420 nm
(blue), 480 nm (green) and 500 nm (red). FICE and chromoendoscopy, with or without
magnification achieved higher sensitivity for neoplasia than white light endoscopy.
However there were no significant differences between FICE/chromoendoscopy and
white light endoscopy in specificity. Accuracy was greater with FICE than white light
endoscopy either with or without magnification. Chromoendoscopy accuracy was only
significantly higher than white light with when used with magnification.
A real-time study performed by the same group compared in vivo characterisation of 676
colonic lesions assessed by 15 colonoscopists155. Subjects underwent assessment with
FICE or indigo carmine chromoendoscopy. This was primarily a study examining detection
of adenomas with FICE compared to white light endoscopy and did not show any
significant difference in this regard. However, it also examined in vivo characterisation,
showing no significant difference between FICE and indigo carmine assessment in terms
of sensitivity (93.2% vs 90.4%, p0.44) or specificity (61.2% vs 60%, p=0.91). Analysis
restricted to polyps <10mm in size revealed very similar results.
Togashi and colleagues examined 107 polyps ≤5mm in size sequentially using white light
endoscopy, FICE and finally chromoendoscopy with indigo carmine plus acetic acid in
some cases if the pit patterns were not clearly seen with indigo carmine alone158. Optical
magnification was used with all 3 modalities. A simple classification system was used for
FICE assessments, where lesions with a visible capillary network were classified as
84
neoplastic and those without a visible capillary network as non-neoplastic. Both FICE and
chromoendoscopy were found to have greater accuracy and sensitivity than white light
endoscopy. There was no significant difference found in specificity, although this was
limited to the assessment of only 27 non-neoplastic polyps. No significant differences in
accuracy or sensitivity were found between FICE and chromoendoscopy. The authors
noted that inflamed non-neoplastic polyps could be misinterpreted as adenomatous
polyps due to their vascular appearance.
The findings of these three studies by Pohl et al., and Togashi suggested that, similar to
NBI, FICE was very similar in performance to chromoendoscopy when applied to the in-
vivo characterisation of colonic polyps.
A later study by Longcroft-Wheaton et al from Portsmouth used sequential assessments
with white light, FICE and indigo carmine, and showed superior accuracy, sensitivity and
specificity of FICE and chromoendoscopy compared to white light endoscopy156. No
significant differences were found between FICE and chromoendoscopy. Similarly, dos
Santos et al found no differences between FICE and chromoendoscopy in the same
outcome measures when assessing 95 diminutive polyps in real-time196.
In a further study Longcroft-Wheaton et al also noted that FICE performance was
dependent on the resolution of endoscope used157. Sensitivity was found to be
significantly higher when FICE was used with HD endoscopes compared to SD, whereas
endoscope definition did not affect specificity.
85
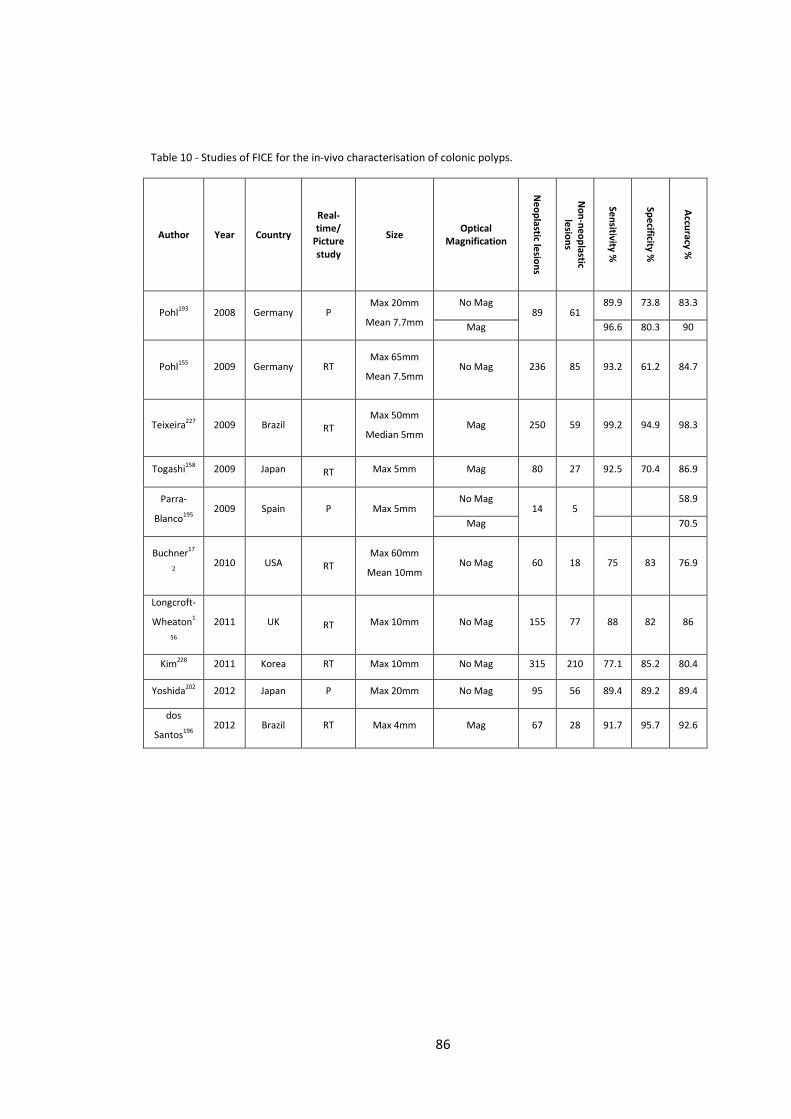
Table 10 - Studies of FICE for the in-vivo characterisation of colonic polyps.
Author Year Country
Real-time/
Picture study
Size Optical Magnification
Neoplastic lesions
Non-neoplastic
lesions
Sensitivity %
Specificity %
Accuracy %
Pohl193 2008 Germany P Max 20mm
Mean 7.7mm
No Mag 89 61
89.9 73.8 83.3
Mag 96.6 80.3 90
Pohl155 2009 Germany
RT
Max 65mm
Mean 7.5mm No Mag 236 85 93.2 61.2 84.7
Teixeira227 2009 Brazil RT Max 50mm
Median 5mm Mag 250 59 99.2 94.9 98.3
Togashi158 2009 Japan RT Max 5mm Mag 80 27 92.5 70.4 86.9
Parra-
Blanco195 2009 Spain P Max 5mm
No Mag 14 5
58.9
Mag 70.5
Buchner17
2 2010 USA RT
Max 60mm
Mean 10mm No Mag 60 18 75 83 76.9
Longcroft-
Wheaton1
56
2011 UK RT Max 10mm No Mag 155 77 88 82 86
Kim228 2011 Korea RT Max 10mm No Mag 315 210 77.1 85.2 80.4
Yoshida202 2012 Japan P Max 20mm No Mag 95 56 89.4 89.2 89.4
dos
Santos196 2012 Brazil RT Max 4mm Mag 67 28 91.7 95.7 92.6
86
3.10 i-Scan
The i-Scan system, a feature of Pentax endoscopes, also features post-processor
technology to manipulate the endoscopic image with the aim of improving the
visualisation of minute surface and vascular patterns.
As described in chapter 2, i-Scan consists of 3 features:-
• Surface Enhancement
• Contrast Enhancement
• Tone enhancement
i-Scan has been examined in several studies as a tool for the in vivo characterisation of
colonic lesions. Hoffman et al examined the distal 30 cm of colon, firstly with high
definition white light, followed by a second endoscope withdrawal with i-Scan229. This
study used tone enhancement p-mode (pattern) and v-mode (vessels). A third withdrawal
was then performed after dye-spraying with methylene blue. This study was primarily
examining lesion detection and the vast majority of lesions found in this study were small
hyperplastic polyps. In vivo characterisation was also examined and was restricted to
polyps ≤5 mm in size. i-Scan was found to have a sensitivity of 82% and specificity of 96%
for neoplastic lesions, although it should be noted that only 11 neoplastic polyps were
included in these results.
A second larger study, by the same group from Germany, was also primarily a study
examining polyp detection, but also examined in vivo characterisation using i-Scan tone
enhancement (p or v mode) and surface enhancement162. A total of 82 neoplastic and 63
non-neoplastic lesions were included with a mean size of 5.6 mm. Impressive outcomes
with sensitivity of 98%, specificity of 100% and overall accuracy of 98.6% were
demonstrated. This study does not report if any lesions were excluded or whether only
high confidence predictions are included in these results.
Lee et al., from Korea, compared high definition white light (HDWL) and NBI on Olympus
endoscopes and HDWL and i-Scan using Pentax endoscopes for the in-vivo
characterisation of diminutive (≤5mm) colonic polyps160. Tone enhancement (colon
87
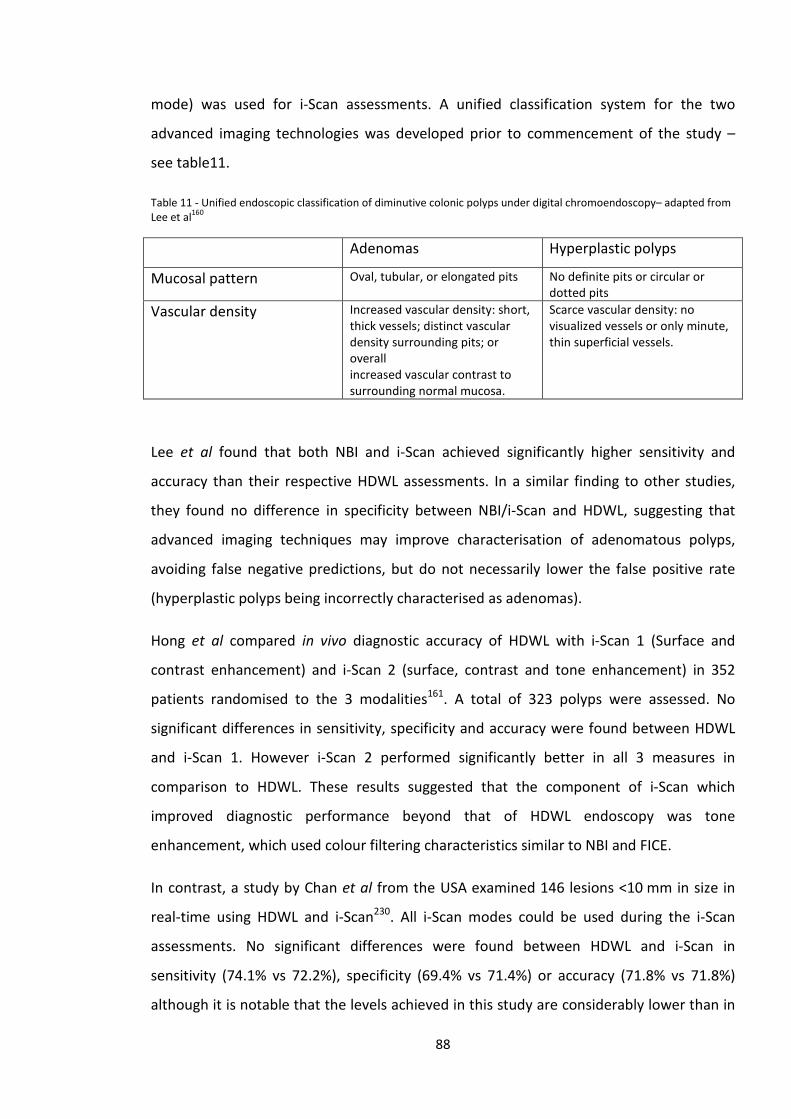
mode) was used for i-Scan assessments. A unified classification system for the two
advanced imaging technologies was developed prior to commencement of the study –
see table11.
Table 11 - Unified endoscopic classification of diminutive colonic polyps under digital chromoendoscopy– adapted from Lee et al160
Adenomas Hyperplastic polyps
Mucosal pattern Oval, tubular, or elongated pits No definite pits or circular or dotted pits
Vascular density Increased vascular density: short, thick vessels; distinct vascular density surrounding pits; or overall increased vascular contrast to surrounding normal mucosa.
Scarce vascular density: no visualized vessels or only minute, thin superficial vessels.
Lee et al found that both NBI and i-Scan achieved significantly higher sensitivity and
accuracy than their respective HDWL assessments. In a similar finding to other studies,
they found no difference in specificity between NBI/i-Scan and HDWL, suggesting that
advanced imaging techniques may improve characterisation of adenomatous polyps,
avoiding false negative predictions, but do not necessarily lower the false positive rate
(hyperplastic polyps being incorrectly characterised as adenomas).
Hong et al compared in vivo diagnostic accuracy of HDWL with i-Scan 1 (Surface and
contrast enhancement) and i-Scan 2 (surface, contrast and tone enhancement) in 352
patients randomised to the 3 modalities161. A total of 323 polyps were assessed. No
significant differences in sensitivity, specificity and accuracy were found between HDWL
and i-Scan 1. However i-Scan 2 performed significantly better in all 3 measures in
comparison to HDWL. These results suggested that the component of i-Scan which
improved diagnostic performance beyond that of HDWL endoscopy was tone
enhancement, which used colour filtering characteristics similar to NBI and FICE.
In contrast, a study by Chan et al from the USA examined 146 lesions <10 mm in size in
real-time using HDWL and i-Scan230. All i-Scan modes could be used during the i-Scan
assessments. No significant differences were found between HDWL and i-Scan in
sensitivity (74.1% vs 72.2%), specificity (69.4% vs 71.4%) or accuracy (71.8% vs 71.8%)
although it is notable that the levels achieved in this study are considerably lower than in
88
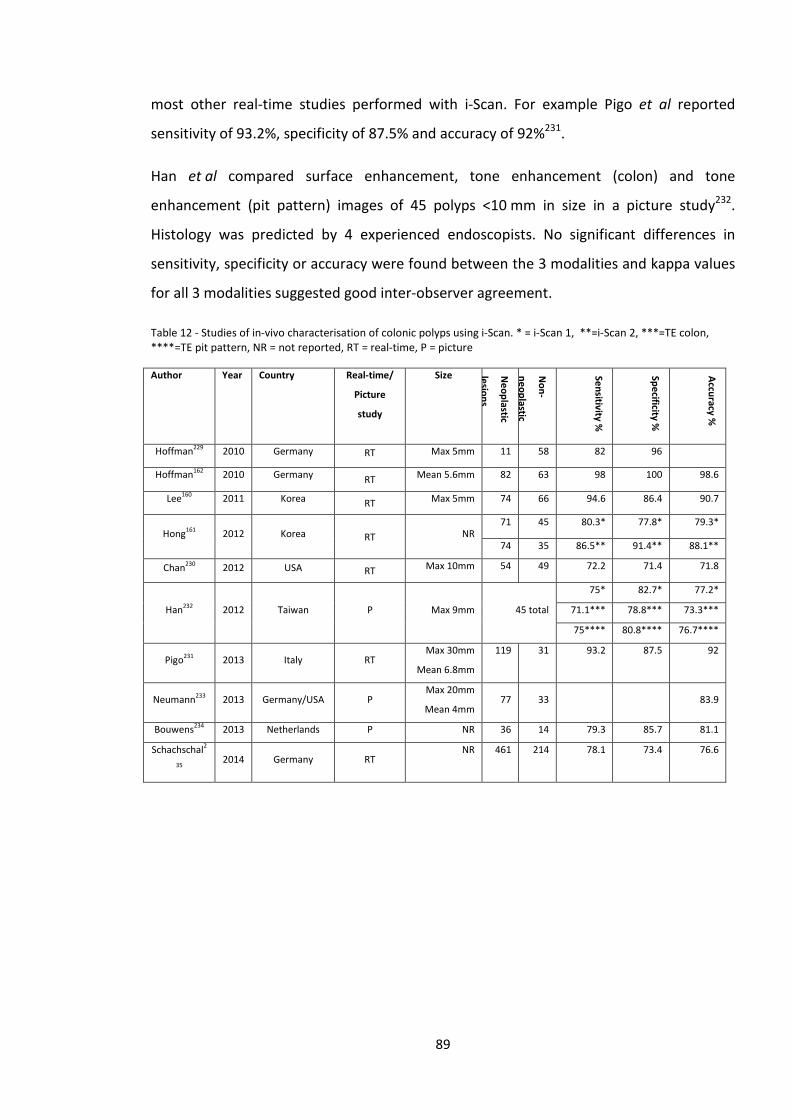
most other real-time studies performed with i-Scan. For example Pigo et al reported
sensitivity of 93.2%, specificity of 87.5% and accuracy of 92%231.
Han et al compared surface enhancement, tone enhancement (colon) and tone
enhancement (pit pattern) images of 45 polyps <10 mm in size in a picture study232.
Histology was predicted by 4 experienced endoscopists. No significant differences in
sensitivity, specificity or accuracy were found between the 3 modalities and kappa values
for all 3 modalities suggested good inter-observer agreement.
Table 12 - Studies of in-vivo characterisation of colonic polyps using i-Scan. * = i-Scan 1, **=i-Scan 2, ***=TE colon, ****=TE pit pattern, NR = not reported, RT = real-time, P = picture
Author Year Country Real-time/
Picture
study
Size Neoplastic
lesions
Non-
neoplastic
Sensitivity %
Specificity %
Accuracy %
Hoffman229 2010 Germany RT Max 5mm 11 58 82 96
Hoffman162 2010 Germany RT Mean 5.6mm 82 63 98 100 98.6
Lee160 2011 Korea RT Max 5mm 74 66 94.6 86.4 90.7
Hong161 2012 Korea RT NR 71 45 80.3* 77.8* 79.3*
74 35 86.5** 91.4** 88.1**
Chan230 2012 USA RT Max 10mm 54 49 72.2 71.4 71.8
Han232 2012 Taiwan P Max 9mm 45 total
75* 82.7* 77.2*
71.1*** 78.8*** 73.3***
75**** 80.8**** 76.7****
Pigo231 2013 Italy RT Max 30mm
Mean 6.8mm
119 31 93.2 87.5 92
Neumann233 2013 Germany/USA P Max 20mm
Mean 4mm 77 33 83.9
Bouwens234 2013 Netherlands P NR 36 14 79.3 85.7 81.1
Schachschal2
35 2014 Germany RT
NR 461 214 78.1 73.4 76.6
89
3.11 Autofluorescence Imaging
Autofluorescence imaging has been studied as an in vivo diagnostic technique for the
assessment of colonic lesions. Van den Broek et al used AFI and NBI to assess 208 colonic
lesions in vivo167. Lesions appearing purple or ambiguous in colour were classified as
neoplastic and those appearing green as non-neoplastic. AFI was found to have very high
sensitivity for predicting neoplastic histology (98.9%), which was significantly greater than
NBI (89.8%). However the specificity of AFI was very low (35.3%), significantly lower than
NBI (70.3%) which also resulted in significantly lower overall accuracy (AFI 62.5%, NBI
78.6%, P<0.001).
In view of these results the authors combined the techniques into a diagnostic algorithm;
“all AFI purple lesions as well as AFI ambiguous lesions with Kudo III to V (NBI) were
regarded as adenomas, whereas AFI green lesions and AFI ambiguous polyps with Kudo I
to II were considered non-neoplastic”167 resulting in sensitivity of 97.7%, specificity of
73.7% and accuracy of 84%. The results obtained with this AFI/NBI algorithm trended
towards greater accuracy than NBI alone but did not reach statistical significance. The
combination of NBI/AFI coupled with high resolution white light endoscopy was termed
‘trimodal imaging’.
A subsequent picture study by the same group produced similar results, with high AFI
sensitivity (98%) but low specificity (49%), and the same AFI/NBI algorithm having
significantly higher accuracy than NBI or AFI alone.
In contrast, Kuiper et al found that the AFI/NBI algorithm had higher accuracy than AFI
alone but was no better than NBI alone168. These studies showed that AFI, although
having excellent sensitivity for predicting neoplastic lesions, was not suitable as a stand-
alone in-vivo diagnostic technique in the colon due to the very high false positive rate.
A subsequent large picture study of white light, NBI and AFI by Sato et al showed higher
accuracy rates of AFI amongst specialists (89.2%) and residents (86.1%)212. However in
this study only the best quality images were selected for inclusion, potentially excluding
more difficult lesions. Of note 80% of the lesions were neoplastic, mitigating against the
90
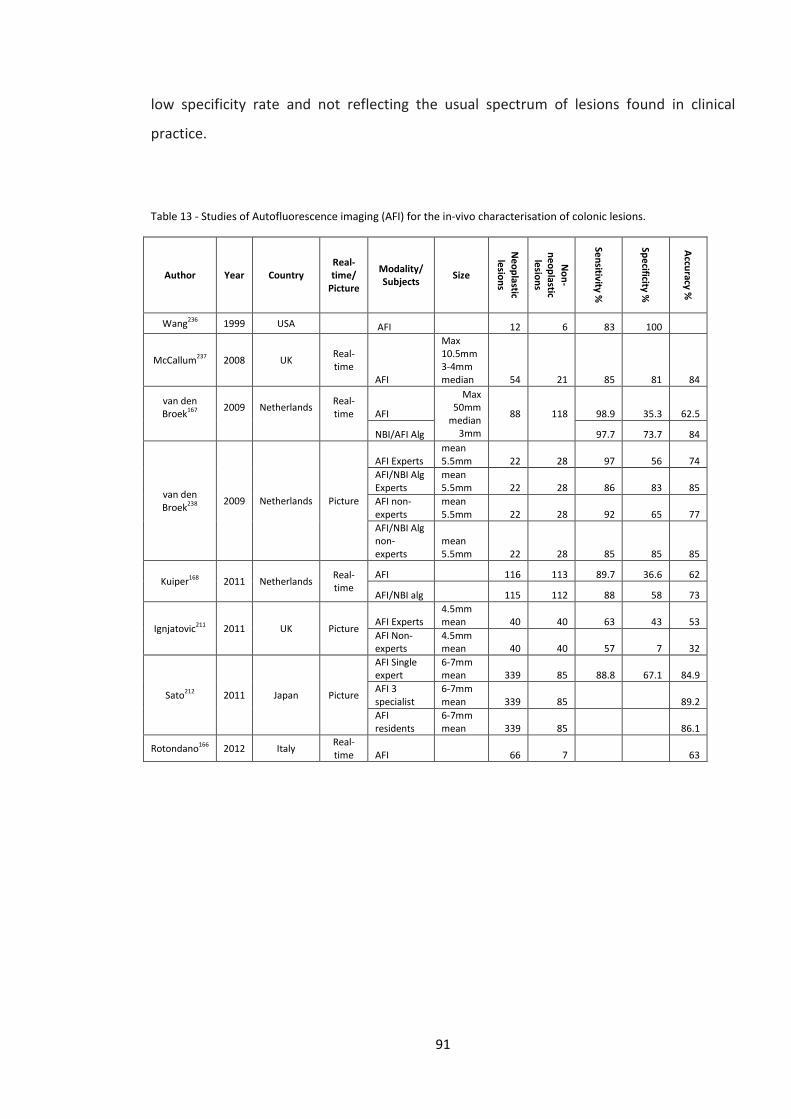
low specificity rate and not reflecting the usual spectrum of lesions found in clinical
practice.
Table 13 - Studies of Autofluorescence imaging (AFI) for the in-vivo characterisation of colonic lesions.
Author Year Country Real-time/
Picture
Modality/ Subjects Size
Neoplastic lesions
Non-
neoplastic lesions
Sensitivity %
Specificity %
Accuracy %
Wang236 1999 USA AFI 12 6 83 100
McCallum237 2008 UK Real-time
AFI
Max 10.5mm 3-4mm median 54 21 85 81 84
van den Broek167
2009
Netherlands
Real-time
AFI
Max 50mm
median 3mm
88
118 98.9 35.3 62.5
NBI/AFI Alg 97.7 73.7 84
van den Broek238 2009 Netherlands Picture
AFI Experts mean 5.5mm 22 28 97 56 74
AFI/NBI Alg Experts
mean 5.5mm 22 28 86 83 85
AFI non-experts
mean 5.5mm 22 28 92 65 77
AFI/NBI Alg non-experts
mean 5.5mm 22 28 85 85 85
Kuiper168 2011 Netherlands Real-time
AFI
116 113 89.7 36.6 62
AFI/NBI alg 115 112 88 58 73
Ignjatovic211 2011 UK Picture AFI Experts
4.5mm mean 40 40 63 43 53
AFI Non-experts
4.5mm mean 40 40 57 7 32
Sato212 2011 Japan Picture
AFI Single expert
6-7mm mean 339 85 88.8 67.1 84.9
AFI 3 specialist
6-7mm mean 339 85
89.2
AFI residents
6-7mm mean 339 85
86.1
Rotondano166 2012 Italy Real-time AFI
66 7
63
91
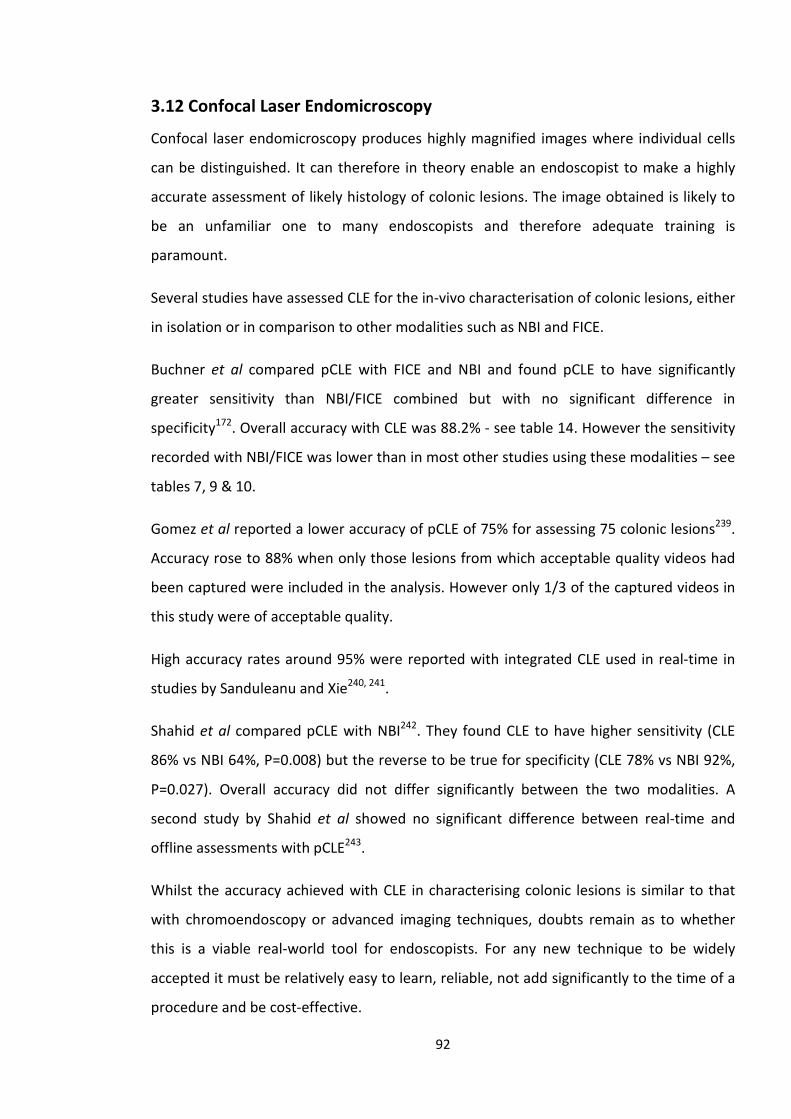
3.12 Confocal Laser Endomicroscopy
Confocal laser endomicroscopy produces highly magnified images where individual cells
can be distinguished. It can therefore in theory enable an endoscopist to make a highly
accurate assessment of likely histology of colonic lesions. The image obtained is likely to
be an unfamiliar one to many endoscopists and therefore adequate training is
paramount.
Several studies have assessed CLE for the in-vivo characterisation of colonic lesions, either
in isolation or in comparison to other modalities such as NBI and FICE.
Buchner et al compared pCLE with FICE and NBI and found pCLE to have significantly
greater sensitivity than NBI/FICE combined but with no significant difference in
specificity172. Overall accuracy with CLE was 88.2% - see table 14. However the sensitivity
recorded with NBI/FICE was lower than in most other studies using these modalities – see
tables 7, 9 & 10.
Gomez et al reported a lower accuracy of pCLE of 75% for assessing 75 colonic lesions239.
Accuracy rose to 88% when only those lesions from which acceptable quality videos had
been captured were included in the analysis. However only 1/3 of the captured videos in
this study were of acceptable quality.
High accuracy rates around 95% were reported with integrated CLE used in real-time in
studies by Sanduleanu and Xie240, 241.
Shahid et al compared pCLE with NBI242. They found CLE to have higher sensitivity (CLE
86% vs NBI 64%, P=0.008) but the reverse to be true for specificity (CLE 78% vs NBI 92%,
P=0.027). Overall accuracy did not differ significantly between the two modalities. A
second study by Shahid et al showed no significant difference between real-time and
offline assessments with pCLE243.
Whilst the accuracy achieved with CLE in characterising colonic lesions is similar to that
with chromoendoscopy or advanced imaging techniques, doubts remain as to whether
this is a viable real-world tool for endoscopists. For any new technique to be widely
accepted it must be relatively easy to learn, reliable, not add significantly to the time of a
procedure and be cost-effective.
92
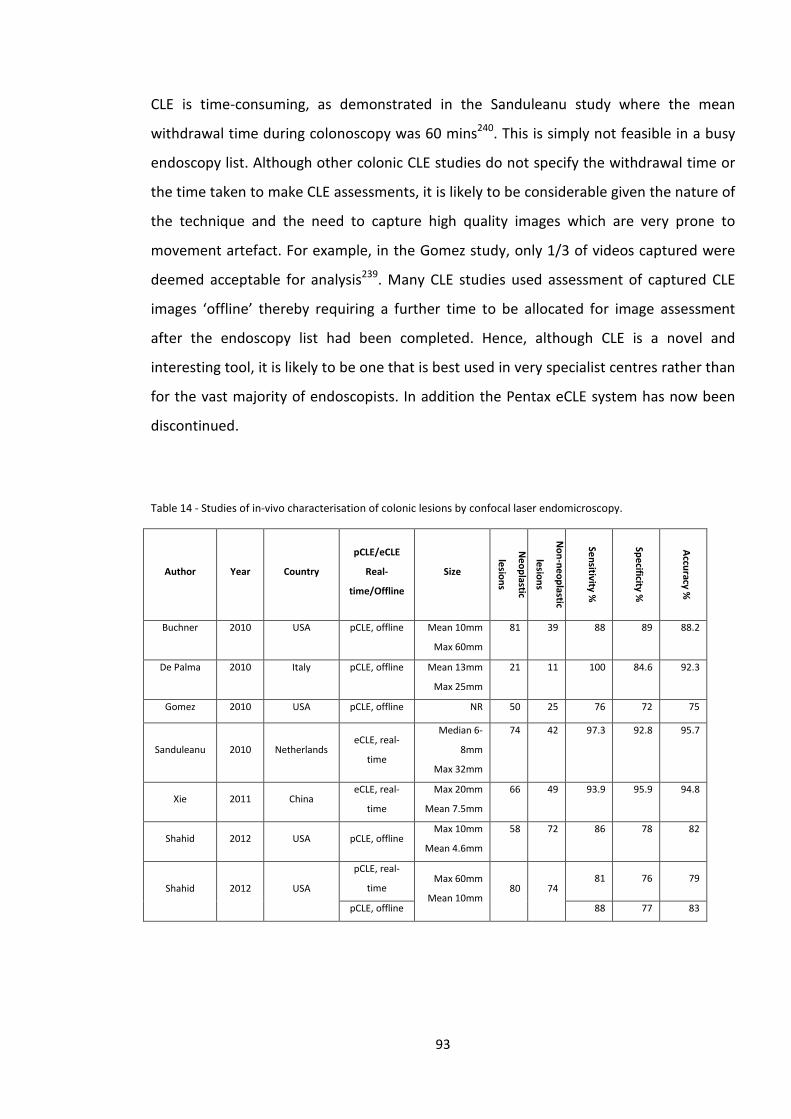
CLE is time-consuming, as demonstrated in the Sanduleanu study where the mean
withdrawal time during colonoscopy was 60 mins240. This is simply not feasible in a busy
endoscopy list. Although other colonic CLE studies do not specify the withdrawal time or
the time taken to make CLE assessments, it is likely to be considerable given the nature of
the technique and the need to capture high quality images which are very prone to
movement artefact. For example, in the Gomez study, only 1/3 of videos captured were
deemed acceptable for analysis239. Many CLE studies used assessment of captured CLE
images ‘offline’ thereby requiring a further time to be allocated for image assessment
after the endoscopy list had been completed. Hence, although CLE is a novel and
interesting tool, it is likely to be one that is best used in very specialist centres rather than
for the vast majority of endoscopists. In addition the Pentax eCLE system has now been
discontinued.
Table 14 - Studies of in-vivo characterisation of colonic lesions by confocal laser endomicroscopy.
Author Year Country
pCLE/eCLE
Real-
time/Offline
Size
Neoplastic
lesions
Non-neoplastic
lesions
Sensitivity %
Specificity %
Accuracy %
Buchner 2010 USA pCLE, offline Mean 10mm
Max 60mm
81 39 88 89 88.2
De Palma 2010 Italy pCLE, offline Mean 13mm
Max 25mm
21 11 100 84.6 92.3
Gomez 2010 USA pCLE, offline NR 50 25 76 72 75
Sanduleanu 2010 Netherlands eCLE, real-
time
Median 6-
8mm
Max 32mm
74 42 97.3 92.8 95.7
Xie 2011 China eCLE, real-
time
Max 20mm
Mean 7.5mm
66 49 93.9 95.9 94.8
Shahid 2012 USA pCLE, offline Max 10mm
Mean 4.6mm
58 72 86 78 82
Shahid 2012 USA
pCLE, real-
time Max 60mm
Mean 10mm 80 74
81 76 79
pCLE, offline 88 77 83
93
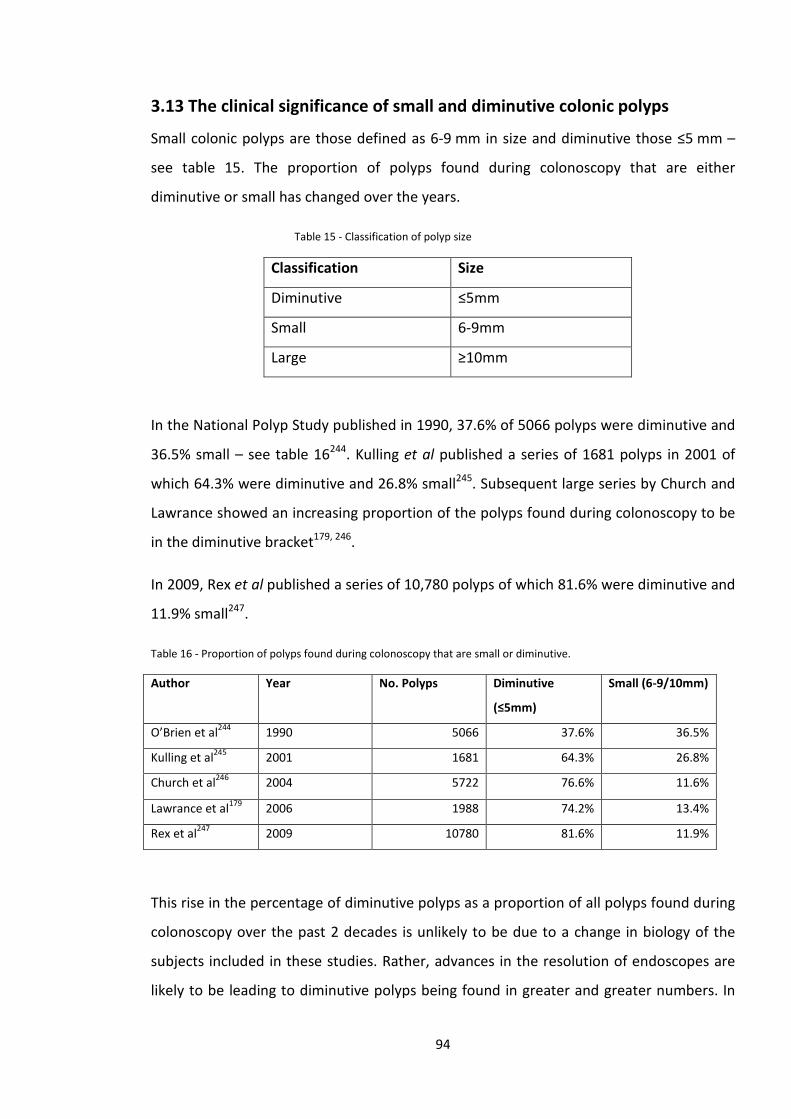
3.13 The clinical significance of small and diminutive colonic polyps
Small colonic polyps are those defined as 6-9 mm in size and diminutive those ≤5 mm –
see table 15. The proportion of polyps found during colonoscopy that are either
diminutive or small has changed over the years.
Table 15 - Classification of polyp size
Classification Size
Diminutive ≤5mm
Small 6-9mm
Large ≥10mm
In the National Polyp Study published in 1990, 37.6% of 5066 polyps were diminutive and
36.5% small – see table 16244. Kulling et al published a series of 1681 polyps in 2001 of
which 64.3% were diminutive and 26.8% small245. Subsequent large series by Church and
Lawrance showed an increasing proportion of the polyps found during colonoscopy to be
in the diminutive bracket179, 246.
In 2009, Rex et al published a series of 10,780 polyps of which 81.6% were diminutive and
11.9% small247.
Table 16 - Proportion of polyps found during colonoscopy that are small or diminutive.
Author Year No. Polyps Diminutive
(≤5mm)
Small (6-9/10mm)
O’Brien et al244 1990 5066 37.6% 36.5%
Kulling et al245 2001 1681 64.3% 26.8%
Church et al246 2004 5722 76.6% 11.6%
Lawrance et al179 2006 1988 74.2% 13.4%
Rex et al247 2009 10780 81.6% 11.9%
This rise in the percentage of diminutive polyps as a proportion of all polyps found during
colonoscopy over the past 2 decades is unlikely to be due to a change in biology of the
subjects included in these studies. Rather, advances in the resolution of endoscopes are
likely to be leading to diminutive polyps being found in greater and greater numbers. In
94
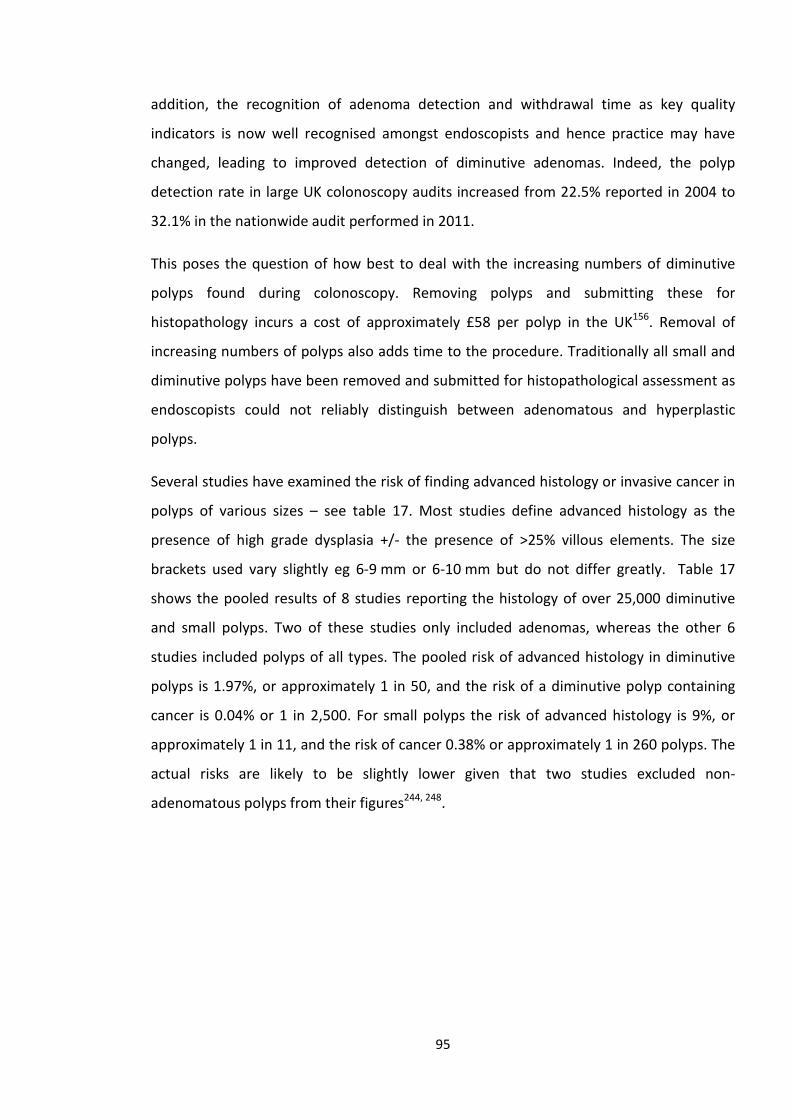
addition, the recognition of adenoma detection and withdrawal time as key quality
indicators is now well recognised amongst endoscopists and hence practice may have
changed, leading to improved detection of diminutive adenomas. Indeed, the polyp
detection rate in large UK colonoscopy audits increased from 22.5% reported in 2004 to
32.1% in the nationwide audit performed in 2011.
This poses the question of how best to deal with the increasing numbers of diminutive
polyps found during colonoscopy. Removing polyps and submitting these for
histopathology incurs a cost of approximately £58 per polyp in the UK156. Removal of
increasing numbers of polyps also adds time to the procedure. Traditionally all small and
diminutive polyps have been removed and submitted for histopathological assessment as
endoscopists could not reliably distinguish between adenomatous and hyperplastic
polyps.
Several studies have examined the risk of finding advanced histology or invasive cancer in
polyps of various sizes – see table 17. Most studies define advanced histology as the
presence of high grade dysplasia +/- the presence of >25% villous elements. The size
brackets used vary slightly eg 6-9 mm or 6-10 mm but do not differ greatly. Table 17
shows the pooled results of 8 studies reporting the histology of over 25,000 diminutive
and small polyps. Two of these studies only included adenomas, whereas the other 6
studies included polyps of all types. The pooled risk of advanced histology in diminutive
polyps is 1.97%, or approximately 1 in 50, and the risk of a diminutive polyp containing
cancer is 0.04% or 1 in 2,500. For small polyps the risk of advanced histology is 9%, or
approximately 1 in 11, and the risk of cancer 0.38% or approximately 1 in 260 polyps. The
actual risks are likely to be slightly lower given that two studies excluded non-
adenomatous polyps from their figures244, 248.
95
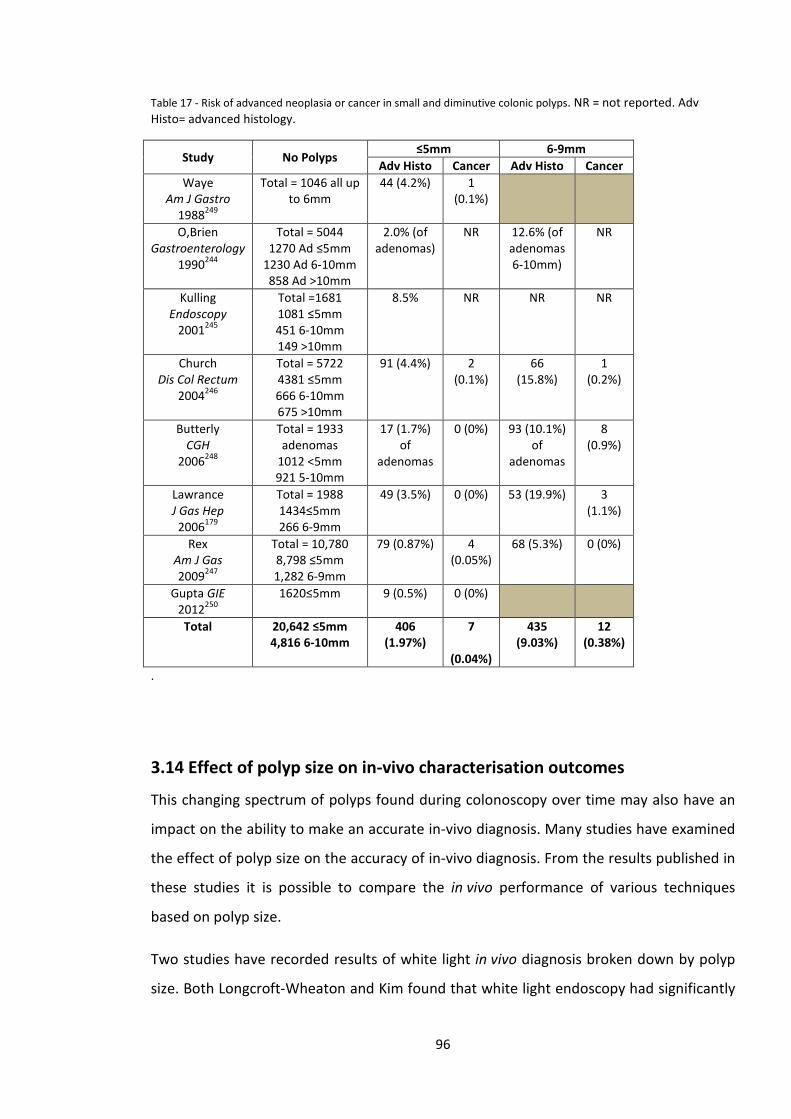
Table 17 - Risk of advanced neoplasia or cancer in small and diminutive colonic polyps. NR = not reported. Adv Histo= advanced histology.
Study No Polyps ≤5mm 6-9mm
Adv Histo Cancer Adv Histo Cancer Waye
Am J Gastro 1988249
Total = 1046 all up to 6mm
44 (4.2%) 1 (0.1%)
O,Brien Gastroenterology
1990244
Total = 5044 1270 Ad ≤5mm
1230 Ad 6-10mm 858 Ad >10mm
2.0% (of adenomas)
NR 12.6% (of adenomas 6-10mm)
NR
Kulling Endoscopy
2001245
Total =1681 1081 ≤5mm 451 6-10mm 149 >10mm
8.5% NR NR NR
Church Dis Col Rectum
2004246
Total = 5722 4381 ≤5mm 666 6-10mm 675 >10mm
91 (4.4%) 2 (0.1%)
66 (15.8%)
1 (0.2%)
Butterly CGH
2006248
Total = 1933 adenomas
1012 <5mm 921 5-10mm
17 (1.7%) of
adenomas
0 (0%) 93 (10.1%) of
adenomas
8 (0.9%)
Lawrance J Gas Hep
2006179
Total = 1988 1434≤5mm 266 6-9mm
49 (3.5%) 0 (0%) 53 (19.9%) 3 (1.1%)
Rex Am J Gas 2009247
Total = 10,780 8,798 ≤5mm 1,282 6-9mm
79 (0.87%) 4 (0.05%)
68 (5.3%) 0 (0%)
Gupta GIE 2012250
1620≤5mm 9 (0.5%) 0 (0%)
Total 20,642 ≤5mm 4,816 6-10mm
406 (1.97%)
7
(0.04%)
435 (9.03%)
12 (0.38%)
.
3.14 Effect of polyp size on in-vivo characterisation outcomes
This changing spectrum of polyps found during colonoscopy over time may also have an
impact on the ability to make an accurate in-vivo diagnosis. Many studies have examined
the effect of polyp size on the accuracy of in-vivo diagnosis. From the results published in
these studies it is possible to compare the in vivo performance of various techniques
based on polyp size.
Two studies have recorded results of white light in vivo diagnosis broken down by polyp
size. Both Longcroft-Wheaton and Kim found that white light endoscopy had significantly
96
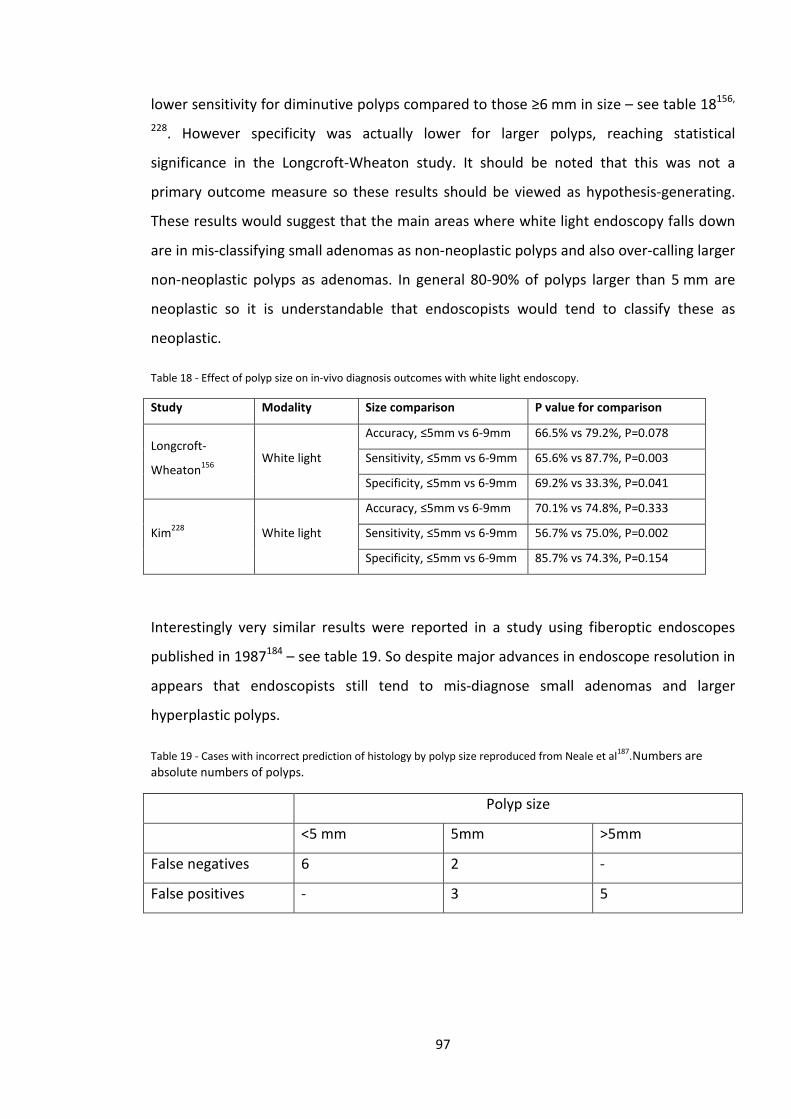
lower sensitivity for diminutive polyps compared to those ≥6 mm in size – see table 18156,
228. However specificity was actually lower for larger polyps, reaching statistical
significance in the Longcroft-Wheaton study. It should be noted that this was not a
primary outcome measure so these results should be viewed as hypothesis-generating.
These results would suggest that the main areas where white light endoscopy falls down
are in mis-classifying small adenomas as non-neoplastic polyps and also over-calling larger
non-neoplastic polyps as adenomas. In general 80-90% of polyps larger than 5 mm are
neoplastic so it is understandable that endoscopists would tend to classify these as
neoplastic.
Table 18 - Effect of polyp size on in-vivo diagnosis outcomes with white light endoscopy.
Study Modality Size comparison P value for comparison
Longcroft-
Wheaton156 White light
Accuracy, ≤5mm vs 6-9mm 66.5% vs 79.2%, P=0.078
Sensitivity, ≤5mm vs 6-9mm 65.6% vs 87.7%, P=0.003
Specificity, ≤5mm vs 6-9mm 69.2% vs 33.3%, P=0.041
Kim228 White light
Accuracy, ≤5mm vs 6-9mm 70.1% vs 74.8%, P=0.333
Sensitivity, ≤5mm vs 6-9mm 56.7% vs 75.0%, P=0.002
Specificity, ≤5mm vs 6-9mm 85.7% vs 74.3%, P=0.154
Interestingly very similar results were reported in a study using fiberoptic endoscopes
published in 1987184 – see table 19. So despite major advances in endoscope resolution in
appears that endoscopists still tend to mis-diagnose small adenomas and larger
hyperplastic polyps.
Table 19 - Cases with incorrect prediction of histology by polyp size reproduced from Neale et al187.Numbers are absolute numbers of polyps.
Polyp size
<5 mm 5mm >5mm
False negatives 6 2 -
False positives - 3 5
97
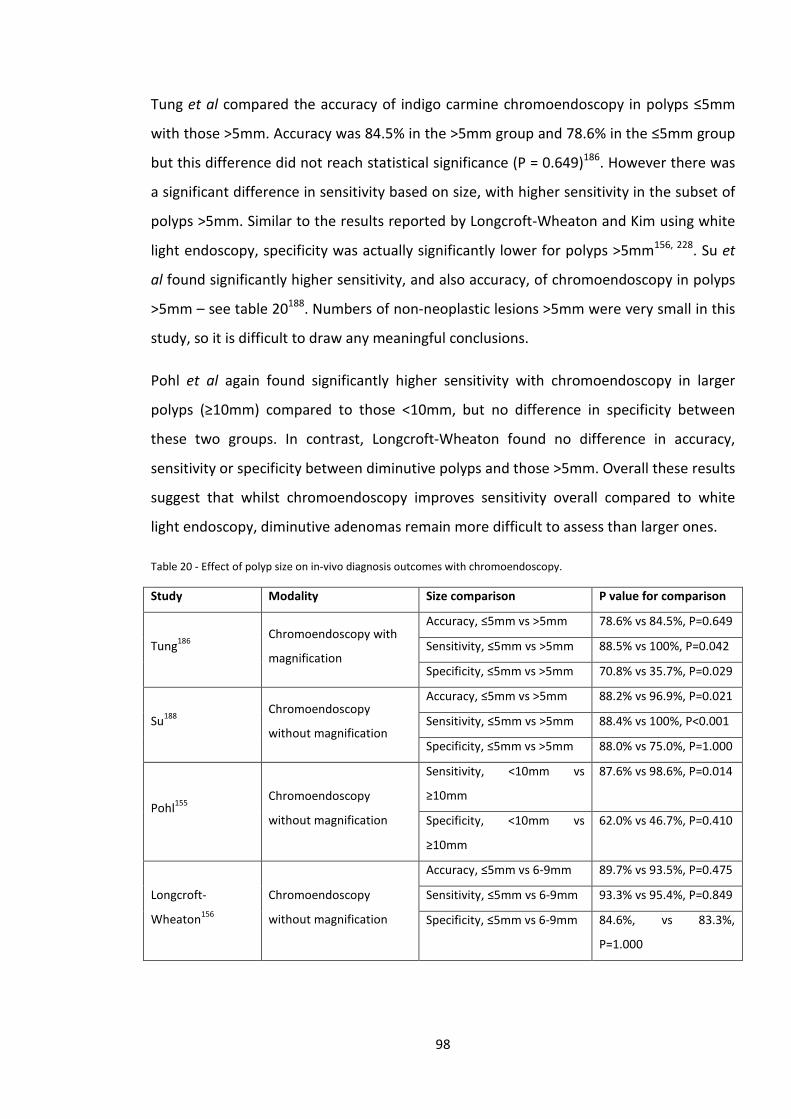
Tung et al compared the accuracy of indigo carmine chromoendoscopy in polyps ≤5mm
with those >5mm. Accuracy was 84.5% in the >5mm group and 78.6% in the ≤5mm group
but this difference did not reach statistical significance (P = 0.649)186. However there was
a significant difference in sensitivity based on size, with higher sensitivity in the subset of
polyps >5mm. Similar to the results reported by Longcroft-Wheaton and Kim using white
light endoscopy, specificity was actually significantly lower for polyps >5mm156, 228. Su et
al found significantly higher sensitivity, and also accuracy, of chromoendoscopy in polyps
>5mm – see table 20188. Numbers of non-neoplastic lesions >5mm were very small in this
study, so it is difficult to draw any meaningful conclusions.
Pohl et al again found significantly higher sensitivity with chromoendoscopy in larger
polyps (≥10mm) compared to those <10mm, but no difference in specificity between
these two groups. In contrast, Longcroft-Wheaton found no difference in accuracy,
sensitivity or specificity between diminutive polyps and those >5mm. Overall these results
suggest that whilst chromoendoscopy improves sensitivity overall compared to white
light endoscopy, diminutive adenomas remain more difficult to assess than larger ones.
Table 20 - Effect of polyp size on in-vivo diagnosis outcomes with chromoendoscopy.
Study Modality Size comparison P value for comparison
Tung186 Chromoendoscopy with
magnification
Accuracy, ≤5mm vs >5mm 78.6% vs 84.5%, P=0.649
Sensitivity, ≤5mm vs >5mm 88.5% vs 100%, P=0.042
Specificity, ≤5mm vs >5mm 70.8% vs 35.7%, P=0.029
Su188 Chromoendoscopy
without magnification
Accuracy, ≤5mm vs >5mm 88.2% vs 96.9%, P=0.021
Sensitivity, ≤5mm vs >5mm 88.4% vs 100%, P<0.001
Specificity, ≤5mm vs >5mm 88.0% vs 75.0%, P=1.000
Pohl155 Chromoendoscopy
without magnification
Sensitivity, <10mm vs
≥10mm
87.6% vs 98.6%, P=0.014
Specificity, <10mm vs
≥10mm
62.0% vs 46.7%, P=0.410
Longcroft-
Wheaton156
Chromoendoscopy
without magnification
Accuracy, ≤5mm vs 6-9mm 89.7% vs 93.5%, P=0.475
Sensitivity, ≤5mm vs 6-9mm 93.3% vs 95.4%, P=0.849
Specificity, ≤5mm vs 6-9mm 84.6%, vs 83.3%,
P=1.000
98
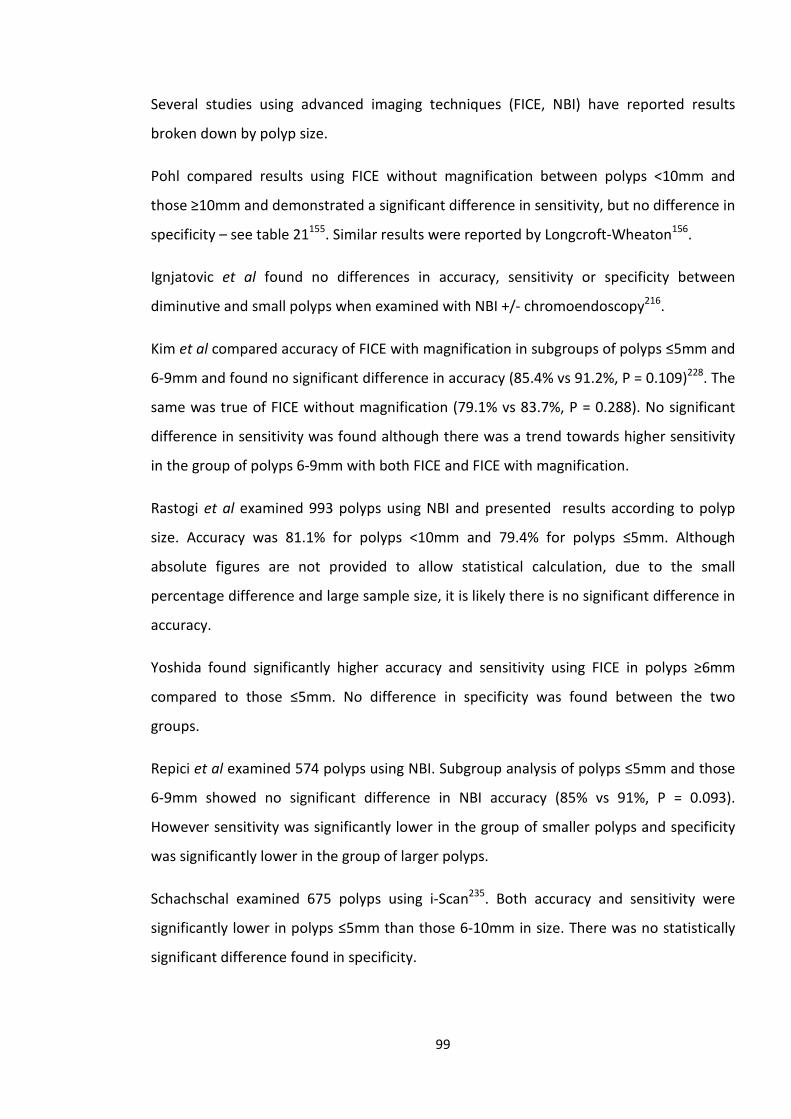
Several studies using advanced imaging techniques (FICE, NBI) have reported results
broken down by polyp size.
Pohl compared results using FICE without magnification between polyps <10mm and
those ≥10mm and demonstrated a significant difference in sensitivity, but no difference in
specificity – see table 21155. Similar results were reported by Longcroft-Wheaton156.
Ignjatovic et al found no differences in accuracy, sensitivity or specificity between
diminutive and small polyps when examined with NBI +/- chromoendoscopy216.
Kim et al compared accuracy of FICE with magnification in subgroups of polyps ≤5mm and
6-9mm and found no significant difference in accuracy (85.4% vs 91.2%, P = 0.109)228. The
same was true of FICE without magnification (79.1% vs 83.7%, P = 0.288). No significant
difference in sensitivity was found although there was a trend towards higher sensitivity
in the group of polyps 6-9mm with both FICE and FICE with magnification.
Rastogi et al examined 993 polyps using NBI and presented results according to polyp
size. Accuracy was 81.1% for polyps <10mm and 79.4% for polyps ≤5mm. Although
absolute figures are not provided to allow statistical calculation, due to the small
percentage difference and large sample size, it is likely there is no significant difference in
accuracy.
Yoshida found significantly higher accuracy and sensitivity using FICE in polyps ≥6mm
compared to those ≤5mm. No difference in specificity was found between the two
groups.
Repici et al examined 574 polyps using NBI. Subgroup analysis of polyps ≤5mm and those
6-9mm showed no significant difference in NBI accuracy (85% vs 91%, P = 0.093).
However sensitivity was significantly lower in the group of smaller polyps and specificity
was significantly lower in the group of larger polyps.
Schachschal examined 675 polyps using i-Scan235. Both accuracy and sensitivity were
significantly lower in polyps ≤5mm than those 6-10mm in size. There was no statistically
significant difference found in specificity.
99
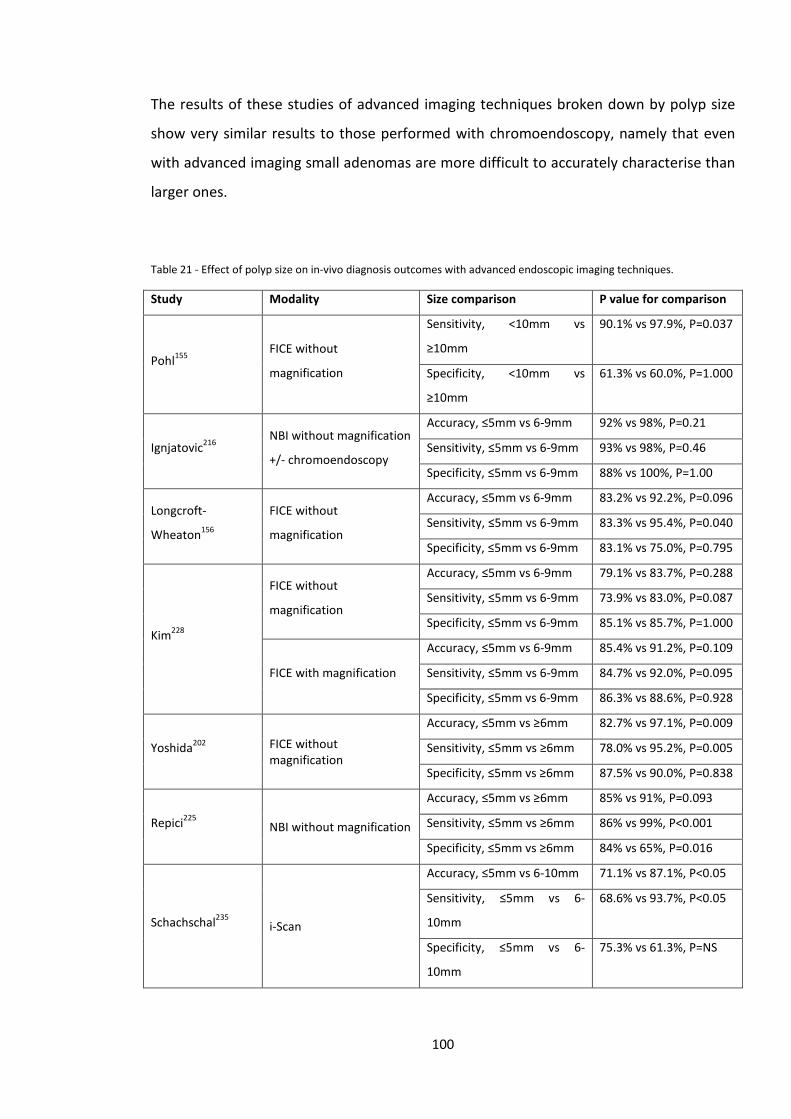
The results of these studies of advanced imaging techniques broken down by polyp size
show very similar results to those performed with chromoendoscopy, namely that even
with advanced imaging small adenomas are more difficult to accurately characterise than
larger ones.
Table 21 - Effect of polyp size on in-vivo diagnosis outcomes with advanced endoscopic imaging techniques.
Study Modality Size comparison P value for comparison
Pohl155 FICE without
magnification
Sensitivity, <10mm vs
≥10mm
90.1% vs 97.9%, P=0.037
Specificity, <10mm vs
≥10mm
61.3% vs 60.0%, P=1.000
Ignjatovic216 NBI without magnification
+/- chromoendoscopy
Accuracy, ≤5mm vs 6-9mm 92% vs 98%, P=0.21
Sensitivity, ≤5mm vs 6-9mm 93% vs 98%, P=0.46
Specificity, ≤5mm vs 6-9mm 88% vs 100%, P=1.00
Longcroft-
Wheaton156
FICE without
magnification
Accuracy, ≤5mm vs 6-9mm 83.2% vs 92.2%, P=0.096
Sensitivity, ≤5mm vs 6-9mm 83.3% vs 95.4%, P=0.040
Specificity, ≤5mm vs 6-9mm 83.1% vs 75.0%, P=0.795
Kim228
FICE without
magnification
Accuracy, ≤5mm vs 6-9mm 79.1% vs 83.7%, P=0.288
Sensitivity, ≤5mm vs 6-9mm 73.9% vs 83.0%, P=0.087
Specificity, ≤5mm vs 6-9mm 85.1% vs 85.7%, P=1.000
FICE with magnification
Accuracy, ≤5mm vs 6-9mm 85.4% vs 91.2%, P=0.109
Sensitivity, ≤5mm vs 6-9mm 84.7% vs 92.0%, P=0.095
Specificity, ≤5mm vs 6-9mm 86.3% vs 88.6%, P=0.928
Yoshida202 FICE without magnification
Accuracy, ≤5mm vs ≥6mm 82.7% vs 97.1%, P=0.009
Sensitivity, ≤5mm vs ≥6mm 78.0% vs 95.2%, P=0.005
Specificity, ≤5mm vs ≥6mm 87.5% vs 90.0%, P=0.838
Repici225 NBI without magnification
Accuracy, ≤5mm vs ≥6mm 85% vs 91%, P=0.093
Sensitivity, ≤5mm vs ≥6mm 86% vs 99%, P<0.001
Specificity, ≤5mm vs ≥6mm 84% vs 65%, P=0.016
Schachschal235 i-Scan
Accuracy, ≤5mm vs 6-10mm 71.1% vs 87.1%, P<0.05
Sensitivity, ≤5mm vs 6-
10mm
68.6% vs 93.7%, P<0.05
Specificity, ≤5mm vs 6-
10mm
75.3% vs 61.3%, P=NS
100
3.15 Clinical applications of in-vivo characterisation of small colonic polyps
Methods of in-vivo characterisation were initially developed to assess gastric and colonic
lesions to predict whether they were suitable for endoscopic resection, or had features
suggesting deep submucosal invasion and therefore were best treated by surgery.
As chromoendoscopy and advanced imaging techniques developed, many studies began
to examine their usefulness for assessing small and diminutive colonic polyps.
Clinical applications of being able to make an accurate in vivo assessment have been
suggested for some time. In 1996 Axelrad suggested that use of a diagnostic method such
as chromoendoscopy could avoid the need for histopathology and could have large cost
savings131. Togashi suggested that confidently identified non-neoplastic polyps could be
left in situ, saving time and money and reducing risk from unnecessary polypectomy132.
Eisen and colleagues stated that high resolution chromoendoscopy “…has the potential to
realize large savings in time, resources and cost” but that training of endoscopists was
required to reach adequate levels of accuracy and further studies would need to examine
cost-effectiveness197. They proposed a threshold value of 90% for negative predictive
value of adenomatous histology. Konishi et al wrote that an optical non-biopsy technique
could reduce costs but would need to be “perfect”134. In 2006 Apel noted that precise
endoscopic diagnosis with chromoendoscopy could avoid overtreatment of diminutive
rectosigmoid hyperplastic polyps and reduce costs198.
Two important papers published in 2009, both using narrow-band imaging, suggested a
future way forward in the management of small colonic polyps. Rex identified features,
visible using NBI without magnification, that were predictive of adenomatous or
hyperplastic histology217. These were used to prospectively characterise 451 colonic
polyps in vivo. A confidence level was assigned to in vivo predictions – high confidence if a
polyp displayed features predictive of one type of histology and no features of the
alternative histology, and low confidence if features of both types of histology were
visible. Overall in vivo accuracy for the entire cohort of polyps was 89%, but rose to 94%
in those polyps with a high confidence prediction. High confidence predictions were
possible in 80% of adenomas and 83% of hyperplastic polyps. For diminutive polyps high
101
confidence predictions yielded an accuracy of 93% overall and for diminutive hyperplastic
polyps a 95% accuracy rate was reported.
Rex also examined the effectiveness of using the in vivo characterisation of diminutive
polyps, with a high confidence prediction, on setting post-polypectomy surveillance
intervals. Patients who are found to have adenomas at colonoscopy are scheduled to
undergo a future surveillance colonoscopy, with the time interval determined by the
number, size and histology of adenomas found at baseline colonoscopy. The
recommended intervals vary slightly between the UK, USA and Europe but are broadly
similar. The British Society of Gastroenterology surveillance recommendations are shown
in figure 37.
Figure 37 - British Society of Gastroenterology colonoscopic surveillance interval following adenoma removal. Reproduced from Cairns et al43 with permission from BMJ publishing.
In the study by Rex et al, surveillance intervals based on the US guidelines were
recommended based on the in vivo assessment of diminutive polyps with a high
confidence assessment combined with histopathology of polyps larger than 5 mm. These
were compared to the recommended surveillance based on the histopathology results of
all polyps. The recommended surveillance interval was the same as that determined by
102
histopathology alone in 94% to 98.5% of patients depending on interpretation of the US
guidelines.
Based on these results the paper suggests that using high confidence NBI predictions 1)
DCPs could be resected and discarded, without the need for submitting tissue for
histopathological assessment and 2) distal hyperplastic polyps with a high confidence
assessment could be left in situ.
A second study published in 2009 by Ignjatovic et al from St Mark’s Hospital, London
examined 278 polyps ≤10 mm using HDWL, +/- NBI +/- chromoendoscopy if required216.
Based on the confidence of their endoscopic assessment, the endoscopists decided how
each polyp would be managed were a policy of optical diagnosis in place. For polyps with
a high confidence assessment management would be based on the optical diagnosis, and
for those with a low confidence assessment it would be based on histopathology. This
was termed a ‘Resect and Discard’ policy in which small polyps with high confidence
assessments would be resected and discarded, rather than sent for histopathology.
Surveillance intervals, based on optical diagnosis, could be made in 82 patients and in 80
of these were in concordance with the interval based on histopathology. Adopting this
approach was predicted to save £13,343 in reduced pathology and clinic costs.
Following the publication of these studies the American Society of Gastrointestinal
Endoscopy (ASGE) published guidelines for the use of real-time endoscopic assessment of
the histology of diminutive colonic polyps251. These Preservation and Incorporation of
Valuable Endoscopic Innovations (PIVI) guidelines aim to direct both developers of
technology and researchers towards finding solutions and answering important clinical
questions in the field of endoscopy. As a consequence, real-time endoscopic prediction of
DCP histology was identified as a key area for research and development.
The ASGE proposed that new paradigms could be adopted for the management of DCPs,
along very similar lines to those proposed in the Rex and Ignjatovic studies216, 217. These
also included clear diagnostic thresholds that any new technique should meet before
adoption into usual clinical practice.
The two paradigms were set out as follows:-
103
1) ‘Resect and Discard’ Paradigm
“In order for colorectal polyps ≤5 mm in size to be resected and discarded without
pathologic assessment, endoscopic technology (when used with high confidence) used to
determine histology of polyps ≤5 mm in size, when combined with the histopathologic
assessment of polyps >5 mm in size, should provide a ≥90% agreement in assignment of
post-polypectomy surveillance intervals when compared to decisions based on pathology
assessment of all identified polyps.”
2) ‘Do not Resect’ paradigm
“In order for a technology to be used to guide the decision to leave suspected
rectosigmoid hyperplastic polyps ≤5 mm in size in place (without resection), the
technology should provide ≥90% negative predictive value (when used with high
confidence) for adenomatous histology.”
The main proposed benefits of these paradigms for managing DCPs were reduction in
pathology costs, avoiding the risk of unnecessary polypectomy, and the ability to set a
surveillance interval at the time of procedure, rather than needing to wait for histology
results.
This ASGE PIVI statement gave direction and clear goals for researchers studying
advanced imaging techniques and chromoendoscopy.
Longcroft-Wheaton et al examined the performance of white light endoscopy, FICE and
indigo carmine chromoendoscopy used sequentially against the ASGE ‘Resect and
Discard’ paradigm156. A total of 232 polyps were examined by a single expert endoscopist.
White light endoscopy led to agreement with BSG surveillance intervals, based on
histopathology, in 83% of patients, not meeting the PIVI threshold. However both FICE
and chromoendoscopy assessments had 97% agreement with histopathology based
surveillance intervals, exceeding the PIVI threshold.
104
Gupta et al performed a retrospective analysis of 3 trials of NBI without magnification to
assess performance against the PIVI thresholds220. These included 410 patients in total.
When comparing surveillance intervals, including optical diagnosis of DCPs against the US
national surveillance guidelines, they used two different histopathology-based
surveillance interval regimes for comparison (A&B). This stems from the US guidelines
which give two surveillance interval options of either 5 years (Regime A) or 10 years
(Regime B) following the removal of 1-2 small low risk adenomas252. Surveillance interval
determined by optical diagnosis of DCPs, combined with histopathology of polyps >5mm
was in agreement with regime A in 86.1% of cases and regime B in 94.1%. Hence the PIVI
threshold for ‘Resect and Discard’ was met for regime B but not regime A. The negative
predictive value for adenomatous histology of diminutive rectosigmoid polyps in this
study was 95.4%, meeting the PIVI threshold for a ‘Do not Resect’ policy. Adoption of
both the ‘Resect and Discard’ and ‘Do not Resect’ policies for DCPs in this cohort of 410
patients was estimated to generate potential cost savings of $93,712, or $228 per patient.
In an Italian study by Pigo et al., 150 polyps were examined by a single experienced
endoscopist using i-Scan and reported a NPV of 93% for adenomatous histology of
diminutive rectosigmoid polyps.
3.16 Effect of Endoscopist experience and training
As has been discussed, large numbers of studies using a variety of techniques have
demonstrated high levels of accuracy in distinguishing between neoplastic and non-
neoplastic small and diminutive colonic polyps.
The ASGE PIVI statement set performance thresholds for new technologies which should
be met before a strategy of optical diagnosis for the management of SCPs/DCPs is
adopted into widespread clinical practice. Concerns have been raised that while the levels
of accuracy achieved in many studies are impressive, the vast majority of these have been
performed in tertiary academic centres by endoscopists with experience in in vivo
diagnostic techniques and special interest in this field134, 152, 155, 156, 160, 161, 187, 190, 195, 198, 205,
216, 217, 228, 253.
105
Concerns about the generalisability of this approach to the management of DCPs has led
to several recent studies examining the performance of optical diagnosis in ‘community’
settings.
Ladabaum and colleagues enrolled 13 community endoscopists into a study using NBI for
the optical diagnosis of DCPs254. Prior to the in vivo part of the study, all participating
endoscopists underwent a computer based training module on the principles of in vivo
characterisation using NBI. Accuracy in a test set of images improved from a mean of 79%
to 94% following training. However only 6 of the 12 endoscopists who completed the
in vivo part of the study achieved the 90% NPV threshold for leaving distal hyperplastic
polyps in situ. Surveillance intervals, based on high confidence NBI characterisation of
DCPs, were in agreement with histopathology based intervals in only 79% of patients,
falling short of the PIVI threshold.
In a Dutch study (the DISCOUNT trial) Kuiper studied the performance of 3 community
endoscopists who used HDWL and NBI for in vivo characterisation of polyps up to 10 mm
in size219. Prior to the study the 3 endoscopists had not used NBI in their practice on a
regular basis, but had participated in previous studies using NBI and received a further
short training session prior to the starts of this study. Agreement with histopathology
based surveillance recommendations was only achieved in 81% of patients using high
confidence NBI assessments of DCPs.
A third study was performed in Italy with 6 community based endoscopists, all with
experience of using NBI. Before starting the study all 6 endoscopists received further
training on NBI polyp assessment, with a pre- and post-training test. Surveillance interval,
based on high confidence NBI assessments of DCPs, matched those of histopathology
based intervals in 85.3% of cases221. Negative predictive value for adenomatous histology
of left sided polyps (although not specifically rectosigmoid polyps) was 88.4%. Hence in
this study NBI in the hands of community endoscopists once again failed to achieve the
targets for performance set by the ASGE.
A recently published German study enrolled 10 experienced community based
endoscopists who had each performed >10,000 colonoscopies235. They used the i-Scan
surface enhancement feature to assess Kudo’s pit patterns for in vivo characterisation of
106
polyps <10 mm in size. Prior to study commencement, the participating endoscopists
were provided with schematic drawings and example images of pit patterns which they
could also refer to during the study. Before the in vivo characterisation part of the study,
between 20-25 colonoscopies were performed by each endoscopist using i-Scan.
Surveillance intervals, based on in vivo assessment of DCPs were correct in only 69.5% of
cases, although it should be noted that this study did not include a confidence assessment
of endoscopists’ predictions of polyp histology.
A further recently published American study using HDWL and NBI compared the
performance of 6 experienced (>5000 colonoscopies) community based and academic
endoscopists using HDWL +/- NBI226 to assess DCPs. Formal teaching and a validated
image set were provided prior to study commencement. The image set was also available
for reference during study procedures. Histology was predicted using HDWL +/- NBI at
each endoscopist’s discretion and confidence in the in vivo prediction was rated on a
visual analogue scale. Concordance with US surveillance intervals, based on a ‘Resect and
Discard’ approach, was 87.8% for the community endoscopists and 83.2% for academic
endoscopists. Interestingly, the community endoscopists only used NBI in 13% of polyp
assessments, compared to 76% of assessments made by academic endoscopists.
As has been described above, to date the 5 published studies of optical diagnosis of DCPs
performed in ‘community’ settings have all failed to show performance that meets the
requirements for adoption of the ‘Resect and Discard’ and ‘Do not Resect’ paradigms set
out in the ASGE PIVI statement. Hence there is concern about the generalisability of the
findings from studies performed in academic centres by endoscopists with an interest in
in vivo diagnosis. Clearly a process of training and accreditation in in vivo diagnosis would
be required before either ‘resect and discard’ or ‘do not resect’ paradigms could be
adopted into widespread practice, and prior to this further studies are required that can
demonstrate adequate performance thresholds can be met by non-expert endoscopists.
107
Chapter 4 – Use of i-Scan for the in-vivo characterisation of small colonic polyps – developing and validating a
system for characterising small colonic polyps with i-Scan and determining the performance of individual
components of i-Scan
4.1 Introduction – Systems for characterising small colonic polyps
All advanced in vivo diagnostic techniques require well-defined classification systems that
are transferable and reproducible. The most widely used system for the characterisation
of colonic mucosal lesions is chromoendoscopy in conjunction with Kudo’s pit patterns, as
previously described123-125.
4.1.1 NBI
Several classification systems using NBI for the characterisation of colonic lesions have
been described. Tanaka used Kudo’s pit patterns as the assessment system with NBI204,
whereas Tischendorf et al used a combination of Kudo’s pit patterns and vascular
patterns192. It became clear during further studies that the main effect of NBI was to
enhance visibility of vascular patterns, which tended to be more prominent in
adenomatous polyps in comparison to hyperplastic polyps. East et al described this as
‘vascular pattern intensity’ (VPI) with adenomas having high VPI and hyperplastic polyps
low VPI152. A very similar classification system using ‘vascular colour intensity’ (VCI) was
described by Rogart214. Sano et al described ‘meshed capillary vessels’ with adenomas,
demonstrating clearly visible meshed capillary vessels and hyperplastic polyps having
invisible or faintly visible meshed capillary vessels205.
More recently a system for colonic polyp classification for use with magnifying and non-
magnifying NBI endoscopes has been described223. This is termed the NBI International
Colorectal Endoscopic (NICE) classification system. The NICE classification combines
108
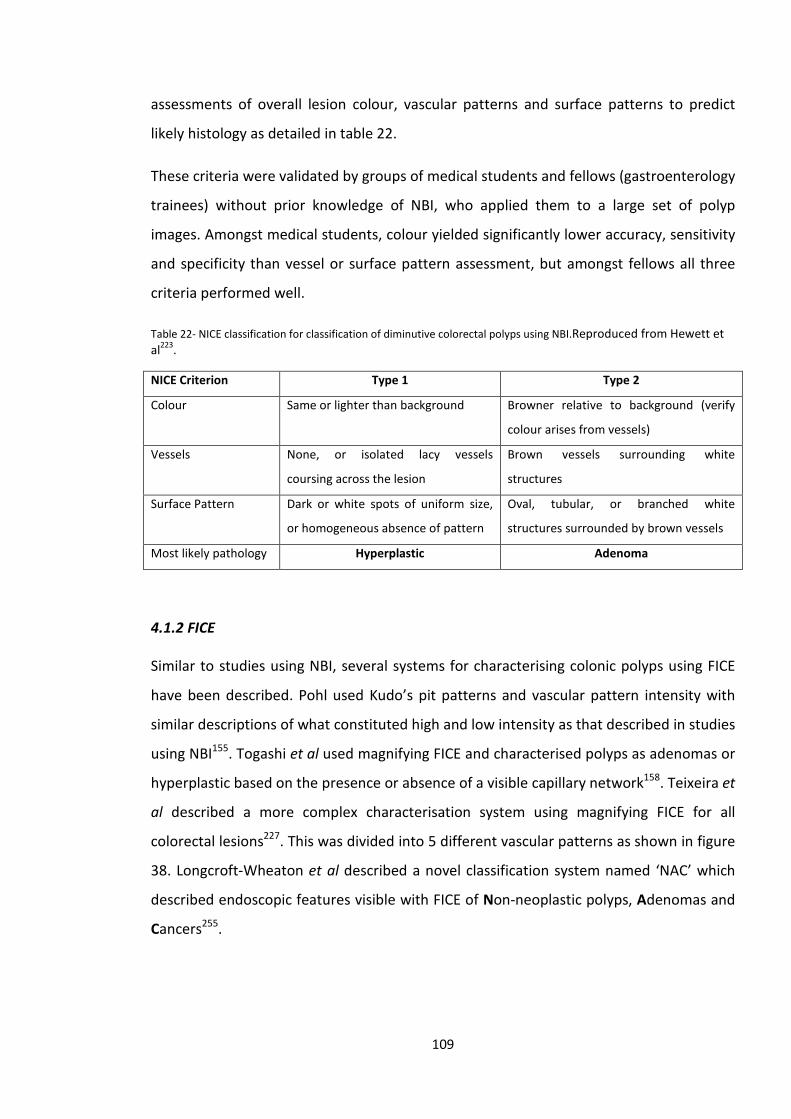
assessments of overall lesion colour, vascular patterns and surface patterns to predict
likely histology as detailed in table 22.
These criteria were validated by groups of medical students and fellows (gastroenterology
trainees) without prior knowledge of NBI, who applied them to a large set of polyp
images. Amongst medical students, colour yielded significantly lower accuracy, sensitivity
and specificity than vessel or surface pattern assessment, but amongst fellows all three
criteria performed well.
Table 22- NICE classification for classification of diminutive colorectal polyps using NBI.Reproduced from Hewett et al223.
NICE Criterion Type 1 Type 2
Colour Same or lighter than background Browner relative to background (verify
colour arises from vessels)
Vessels None, or isolated lacy vessels
coursing across the lesion
Brown vessels surrounding white
structures
Surface Pattern Dark or white spots of uniform size,
or homogeneous absence of pattern
Oval, tubular, or branched white
structures surrounded by brown vessels
Most likely pathology Hyperplastic Adenoma
4.1.2 FICE
Similar to studies using NBI, several systems for characterising colonic polyps using FICE
have been described. Pohl used Kudo’s pit patterns and vascular pattern intensity with
similar descriptions of what constituted high and low intensity as that described in studies
using NBI155. Togashi et al used magnifying FICE and characterised polyps as adenomas or
hyperplastic based on the presence or absence of a visible capillary network158. Teixeira et
al described a more complex characterisation system using magnifying FICE for all
colorectal lesions227. This was divided into 5 different vascular patterns as shown in figure
38. Longcroft-Wheaton et al described a novel classification system named ‘NAC’ which
described endoscopic features visible with FICE of Non-neoplastic polyps, Adenomas and
Cancers255.
109
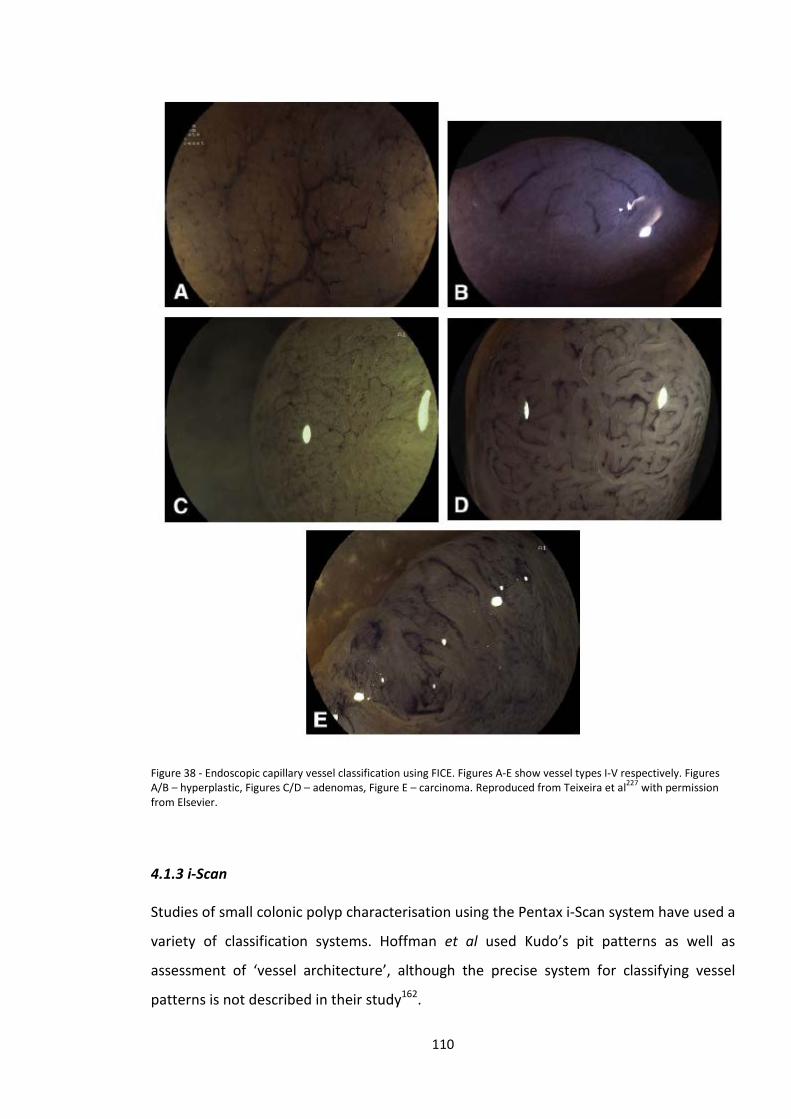
Figure 38 - Endoscopic capillary vessel classification using FICE. Figures A-E show vessel types I-V respectively. Figures A/B – hyperplastic, Figures C/D – adenomas, Figure E – carcinoma. Reproduced from Teixeira et al227 with permission from Elsevier.
4.1.3 i-Scan
Studies of small colonic polyp characterisation using the Pentax i-Scan system have used a
variety of classification systems. Hoffman et al used Kudo’s pit patterns as well as
assessment of ‘vessel architecture’, although the precise system for classifying vessel
patterns is not described in their study162.
110
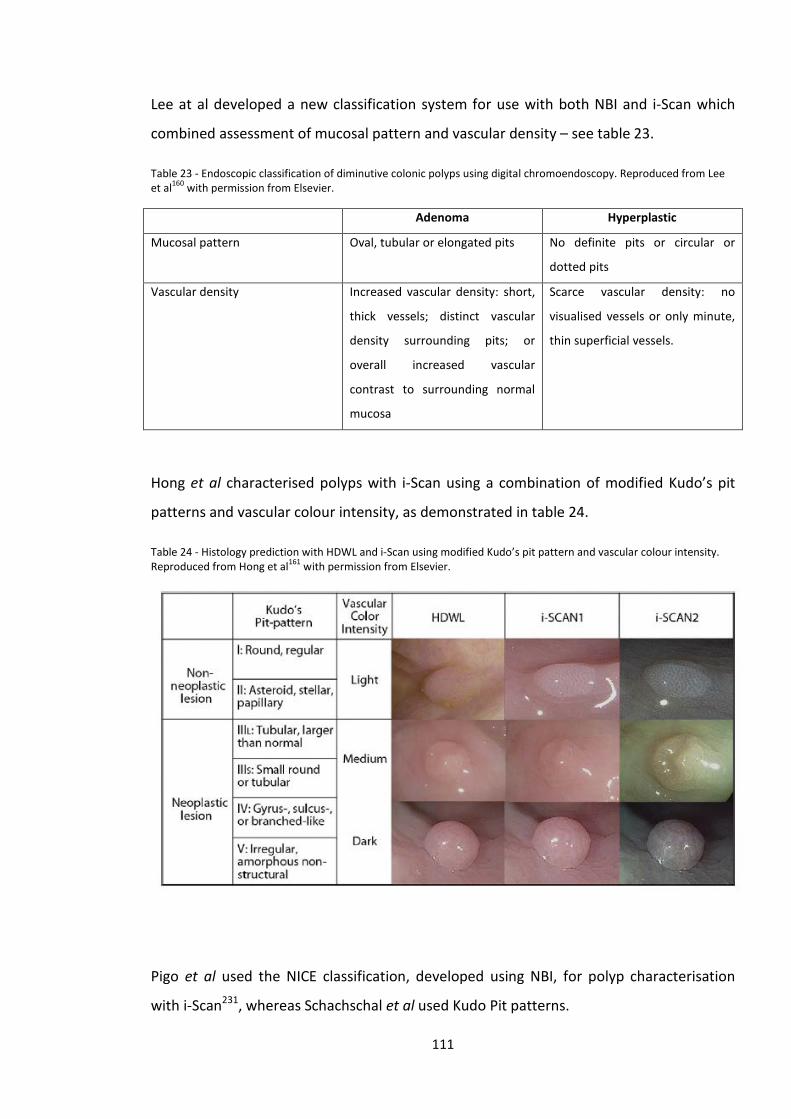
Lee at al developed a new classification system for use with both NBI and i-Scan which
combined assessment of mucosal pattern and vascular density – see table 23.
Table 23 - Endoscopic classification of diminutive colonic polyps using digital chromoendoscopy. Reproduced from Lee et al160 with permission from Elsevier.
Adenoma Hyperplastic
Mucosal pattern Oval, tubular or elongated pits No definite pits or circular or
dotted pits
Vascular density Increased vascular density: short,
thick vessels; distinct vascular
density surrounding pits; or
overall increased vascular
contrast to surrounding normal
mucosa
Scarce vascular density: no
visualised vessels or only minute,
thin superficial vessels.
Hong et al characterised polyps with i-Scan using a combination of modified Kudo’s pit
patterns and vascular colour intensity, as demonstrated in table 24.
Table 24 - Histology prediction with HDWL and i-Scan using modified Kudo’s pit pattern and vascular colour intensity. Reproduced from Hong et al161 with permission from Elsevier.
Pigo et al used the NICE classification, developed using NBI, for polyp characterisation
with i-Scan231, whereas Schachschal et al used Kudo Pit patterns.
111
As can be seen a number of different classification systems for use with advanced
endoscopic imaging techniques have been described. When the individual components
and descriptors are broken down there are three main aspects of the assessment;
i) vascularity, ii) vascular patterns and iii) surface patterns. The different classification
systems use slightly different phrases to describe the typical vascular and surface patterns
suggestive of non-neoplastic polyps and adenomas, but they are essentially describing the
same features.
4.2 Development of a system for characterising small colonic polyps with i-Scan
4.2.1 Aims
The aim of this study was to describe and validate the features of small colonic polyps
which are predictive of neoplastic or non-neoplastic histology and are visible with i-Scan.
4.2.2 Methods
Digital images of 100 small (1-9mm) colonic polyps (50 adenomatous and 50 hyperplastic)
were captured from patients attending for BCSP colonoscopy. Images of consecutive
polyps were captured until 50 high quality images of polyps of each histological type were
obtained. All patients gave informed consent for anonymised use of images for study and
training purposes.
Polyps were cleansed prior to image capture using a flush solution of water, n-
acetylcysteine and simeticone delivered via the endoscope working channel. This ensured
minimal residual stool debris or mucus was present on the mucosal surface prior to image
capture. Pentax EC-3890Li 1.2 Megapixel HD+ colonoscopes were used linked to a EPKi
processor (Pentax Medical, UK). The endoscope image was transmitted between
processor and screen via an HD connection, and displayed on a high definition monitor
capable of displaying 1080 horizontal lines. Images were captured in i-Scan 3 mode, which
incorporates all 3 features of i-Scan (SE+3, CE+2, TE colon) onto a USB storage device.
112
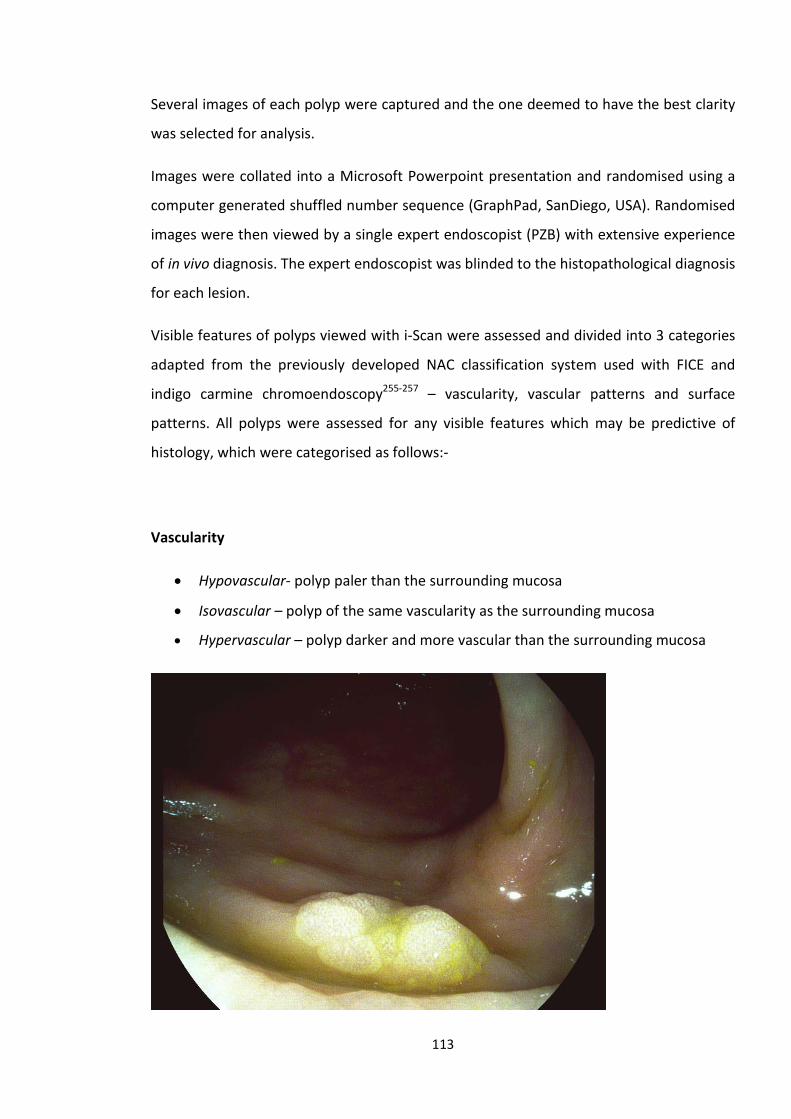
Several images of each polyp were captured and the one deemed to have the best clarity
was selected for analysis.
Images were collated into a Microsoft Powerpoint presentation and randomised using a
computer generated shuffled number sequence (GraphPad, SanDiego, USA). Randomised
images were then viewed by a single expert endoscopist (PZB) with extensive experience
of in vivo diagnosis. The expert endoscopist was blinded to the histopathological diagnosis
for each lesion.
Visible features of polyps viewed with i-Scan were assessed and divided into 3 categories
adapted from the previously developed NAC classification system used with FICE and
indigo carmine chromoendoscopy255-257 – vascularity, vascular patterns and surface
patterns. All polyps were assessed for any visible features which may be predictive of
histology, which were categorised as follows:-
Vascularity
• Hypovascular- polyp paler than the surrounding mucosa
• Isovascular – polyp of the same vascularity as the surrounding mucosa
• Hypervascular – polyp darker and more vascular than the surrounding mucosa
113
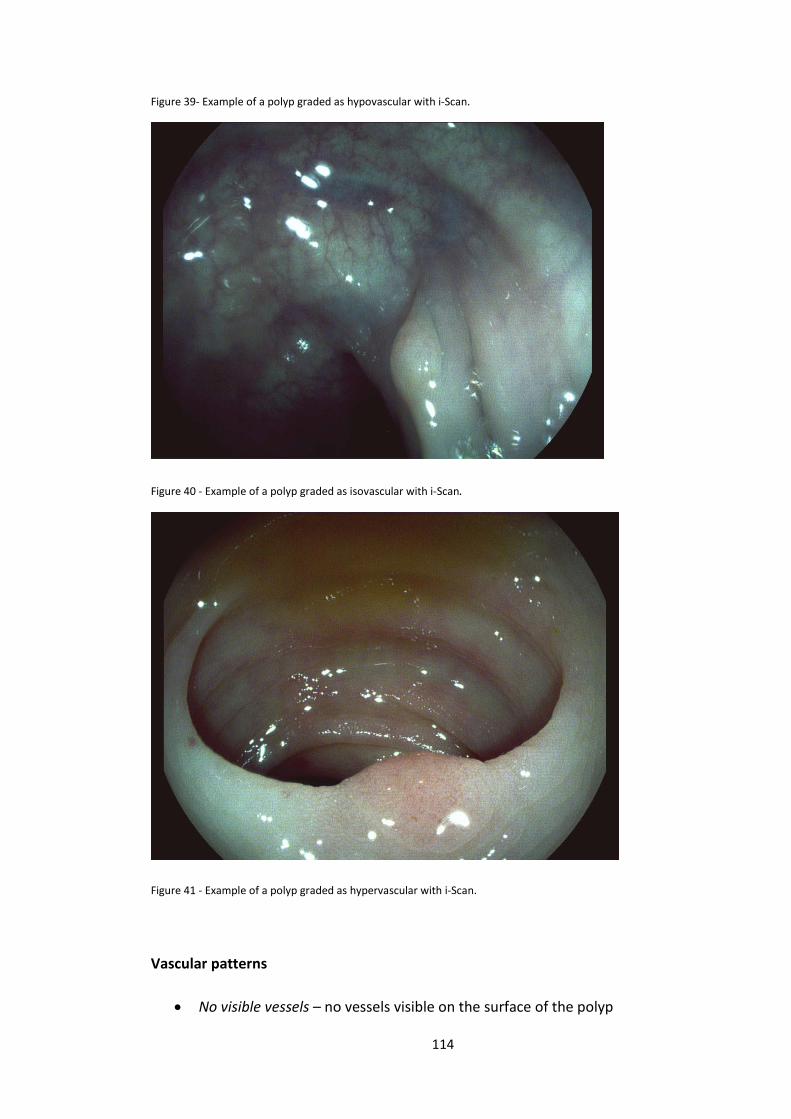
Figure 39- Example of a polyp graded as hypovascular with i-Scan.
Figure 40 - Example of a polyp graded as isovascular with i-Scan.
Figure 41 - Example of a polyp graded as hypervascular with i-Scan.
Vascular patterns
• No visible vessels – no vessels visible on the surface of the polyp
114
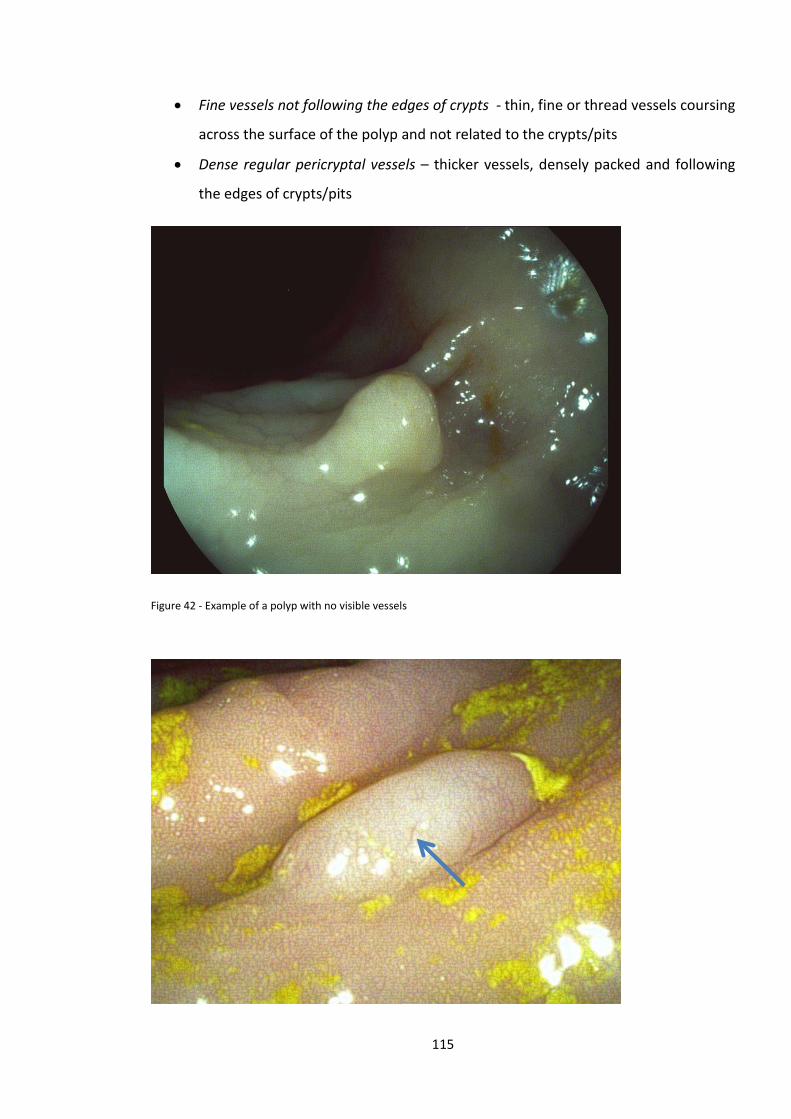
• Fine vessels not following the edges of crypts - thin, fine or thread vessels coursing
across the surface of the polyp and not related to the crypts/pits
• Dense regular pericryptal vessels – thicker vessels, densely packed and following
the edges of crypts/pits
Figure 42 - Example of a polyp with no visible vessels
115
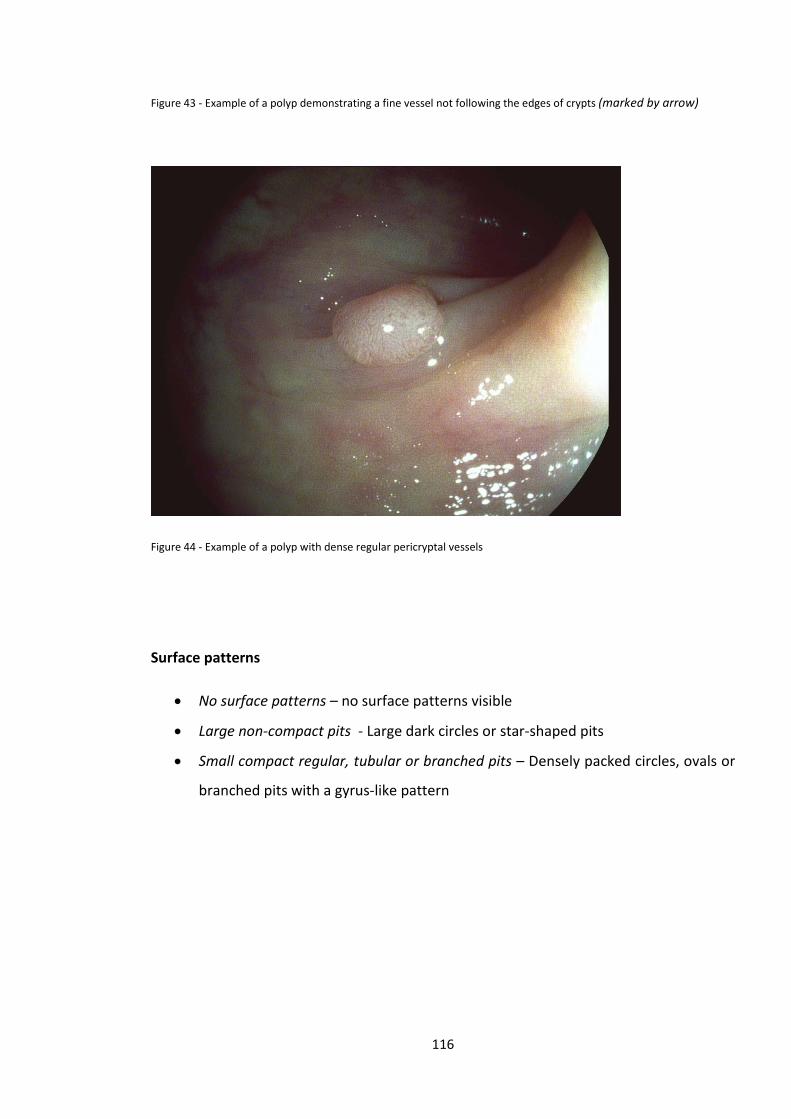
Figure 43 - Example of a polyp demonstrating a fine vessel not following the edges of crypts (marked by arrow)
Figure 44 - Example of a polyp with dense regular pericryptal vessels
Surface patterns
• No surface patterns – no surface patterns visible
• Large non-compact pits - Large dark circles or star-shaped pits
• Small compact regular, tubular or branched pits – Densely packed circles, ovals or
branched pits with a gyrus-like pattern
116
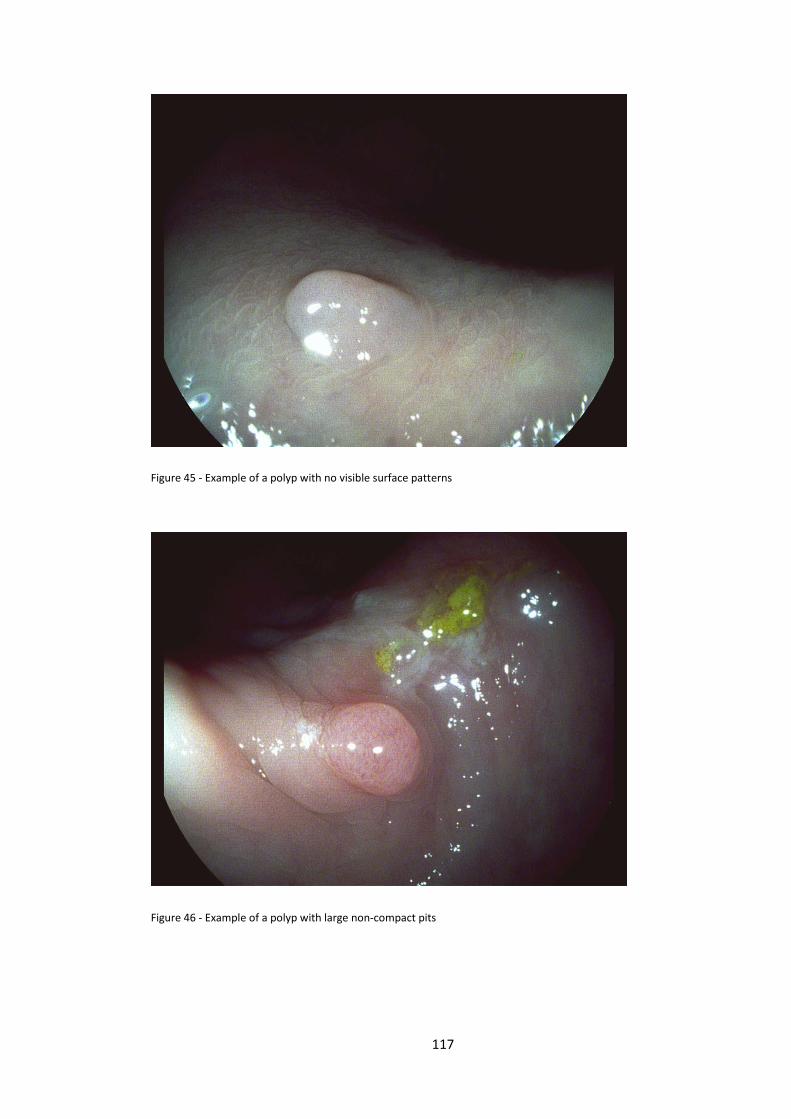
Figure 45 - Example of a polyp with no visible surface patterns
Figure 46 - Example of a polyp with large non-compact pits
117
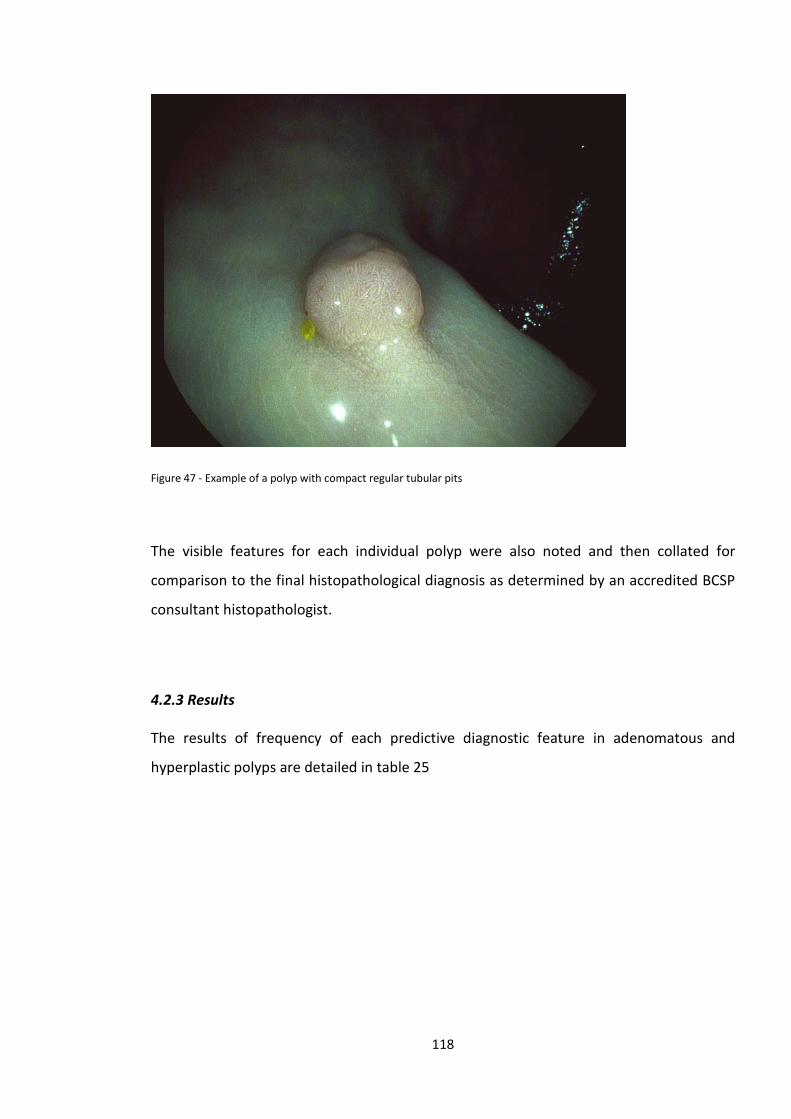
Figure 47 - Example of a polyp with compact regular tubular pits
The visible features for each individual polyp were also noted and then collated for
comparison to the final histopathological diagnosis as determined by an accredited BCSP
consultant histopathologist.
4.2.3 Results
The results of frequency of each predictive diagnostic feature in adenomatous and
hyperplastic polyps are detailed in table 25
118
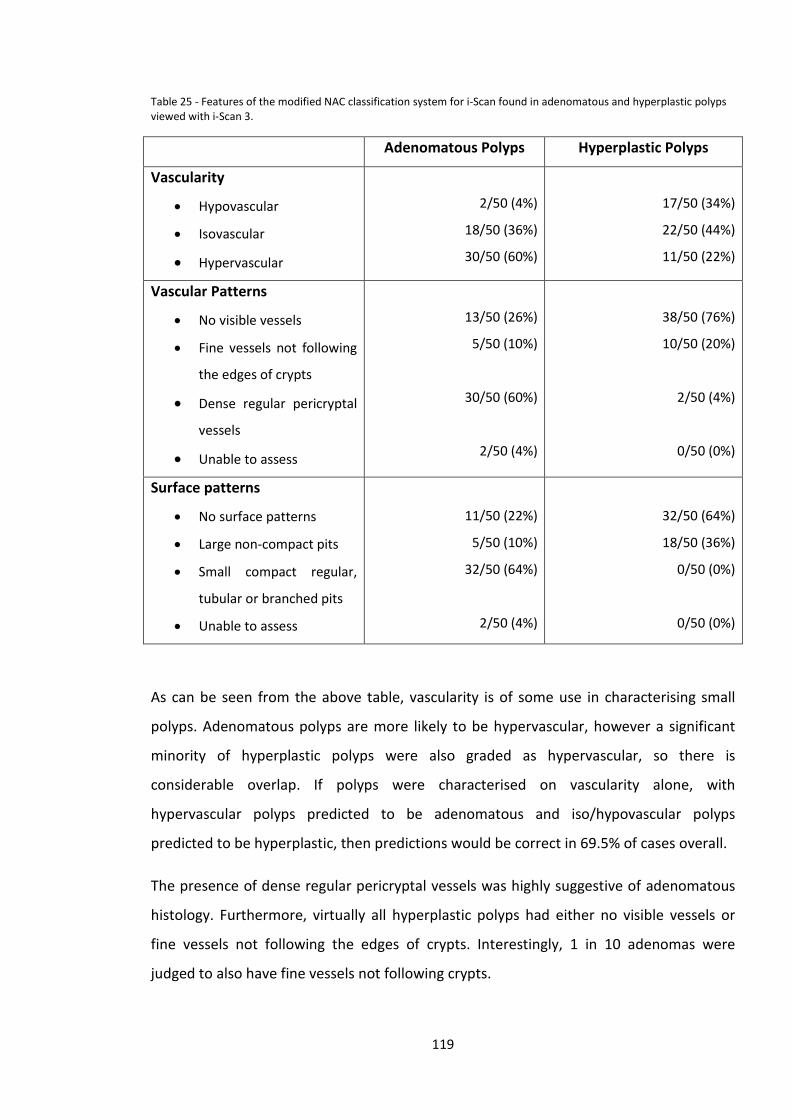
Table 25 - Features of the modified NAC classification system for i-Scan found in adenomatous and hyperplastic polyps viewed with i-Scan 3.
Adenomatous Polyps Hyperplastic Polyps
Vascularity
• Hypovascular
• Isovascular
• Hypervascular
2/50 (4%)
18/50 (36%)
30/50 (60%)
17/50 (34%)
22/50 (44%)
11/50 (22%)
Vascular Patterns
• No visible vessels
• Fine vessels not following
the edges of crypts
• Dense regular pericryptal
vessels
• Unable to assess
13/50 (26%)
5/50 (10%)
30/50 (60%)
2/50 (4%)
38/50 (76%)
10/50 (20%)
2/50 (4%)
0/50 (0%)
Surface patterns
• No surface patterns
• Large non-compact pits
• Small compact regular,
tubular or branched pits
• Unable to assess
11/50 (22%)
5/50 (10%)
32/50 (64%)
2/50 (4%)
32/50 (64%)
18/50 (36%)
0/50 (0%)
0/50 (0%)
As can be seen from the above table, vascularity is of some use in characterising small
polyps. Adenomatous polyps are more likely to be hypervascular, however a significant
minority of hyperplastic polyps were also graded as hypervascular, so there is
considerable overlap. If polyps were characterised on vascularity alone, with
hypervascular polyps predicted to be adenomatous and iso/hypovascular polyps
predicted to be hyperplastic, then predictions would be correct in 69.5% of cases overall.
The presence of dense regular pericryptal vessels was highly suggestive of adenomatous
histology. Furthermore, virtually all hyperplastic polyps had either no visible vessels or
fine vessels not following the edges of crypts. Interestingly, 1 in 10 adenomas were
judged to also have fine vessels not following crypts.
119
In terms of surface patterns all hyperplastic polyps had no visible surface patterns or large
non-compact pits. Again there was some overlap with some adenomas having no visible
surface pattern or large non-compact pits. However the majority of adenomas
demonstrated small compact regular, tubular or branched pits.
In a small number of images one or more features could not be adequately assessed.
4.2.4 Discussion
The features that were found to be visible in this series are broadly similar to those
described in previous similar studies using i-Scan, as well those using FICE and NBI
described in the introduction to this chapter. It appears that i-Scan therefore highlights
similar characteristics of small colonic polyps to FICE/NBI.
In general adenomatous polyps viewed with i-Scan 3 tend to demonstrate the following
features:-
• Hypervascularity
• Dense regular pericryptal vessels
• Small compact regular tubular/branched pits
And hyperplastic polyps demonstrate the following features:-
• Isovascularity or Hypovascularity
• No visible vessels or occasionally fine vessels not following the edge of crypts
• No visible surface pattern or large non-compact pits
When vascularity alone is used as a discriminator, accuracy is approximately 70%, and is
similar to that reported when white light endoscopy is used in isolation for polyp
characterisation156, 160, 161, 218. It is likely that the usefulness of vascularity, as a
discriminator between adenomatous and hyperplastic polyps, is dependent on polyp size.
As demonstrated by these results, small and diminutive adenomatous polyps are often
isovascular or even hypovascular and hence can easily be mistaken as hyperplastic polyps.
The grading of vascularity in the NAC classification system is akin to VPI and VCI
120
described by East and Rogart respectively152, 214 and the grading of colour in the NICE
classification system223. Rogart et al also noted in their study using NBI that 19% of
adenomatous polyps had light VCI and 29% of non-adenomatous polyps had medium VCI.
Hence to make a more accurate diagnosis, inspection of other features, namely vascular
and surface patterns is required.
The presence of dense regular pericryptal vessels and/or small compact regular, tubular
or branched pits, is highly suggestive of adenomatous histology. In this series these
features were found in approximately two-thirds of adenomas, but almost never in
hyperplastic polyps. Hence it appears that these features have a high positive predictive
value for adenomatous histology.
In our adapted NAC classification system the finding described as dense regular
pericryptal vessels is likely to equate to the “brown vessels surrounding white structures”
described in the NICE classification223 using non-magnifying NBI. Similarly the
classification of surface patterns in the NAC classification system is similar to that
described in the NICE classification for NBI223, the NBI/i-Scan combined classification160
and Kudo’s pit patterns.
What the results of this study also demonstrate is that there is some overlap of features
suggestive of neoplastic and non-neoplastic histology. Some of this may be accounted for
by interpretation of the observer and may vary between different endoscopists. Polyps
which display features not typically associated with their histological type will pose a
greater challenge to an endoscopist attempting to make an optical diagnosis. In some
cases the vascular patterns and surface patterns may be discordant, being suggestive of
opposing histological diagnoses. This is the rationale behind the inclusion of confidence
ratings in the ASGE PIVI statement regarding diminutive colon polyps – polyps not
displaying diagnostic features, or conflicting features, should be assigned low confidence
assessments and managed according to formal histopathology, rather than optical
diagnosis251.
Given that many of the diagnostic features of SCPs/DCPs described in studies using NBI,
FICE and i-Scan are very similar, there is potential for adoption of a universal classification
system, such as the NAC or NICE classification systems, for use with all 3 advanced
121
imaging modalities. Agreement on a universal classification system would help
standardise assessment of polyps in vivo and aid teaching and training in optical
diagnostic techniques.
Following this initial study to develop a system for small colonic polyp characterisation
with i-Scan, we proceeded to validate this characterisation system and also analyse the
separate components of i-Scan.
4.3 Validating the system for characterising small colonic polyps with i-Scan and analysing separate i-Scan components
4.3.1 Aims
The aim of this study was to validate the criteria developed for characterising small
colonic polyps with i-Scan and to determine the effectiveness of the separate
components of the i-Scan system in visualising polyp features and predicting histology.
4.3.2 Methods
A separate series of digital images of 100 small colonic polyps (50 adenomatous and 50
hyperplastic) were captured from patients attending for BCSP colonoscopy. All patients
gave informed consent for anonymised use of images for study and training purposes.
As this was a pilot study and following advice from a clinical statistician, no formal power
calculations were considered appropriate. A probability value of P<0.05 was considered
to be statistically significant and as this was a hypothesis generating study, no corrections
were made for multiple comparisons.
122
Methods for polyp cleansing prior to image capture, the Pentax endoscopy equipment
and image capture techniques, were identical to those described in the earlier part of this
chapter. In this study images of each polyp were captured in 3 different i-Scan modes:-
• i-Scan 1 – Surface & Contrast enhancement – SE+3/CE+4
• i-Scan 2 – Tone enhancement ‘colon’
• i-Scan 3 – Surface, Contrast and Tone enhancement – SE+3/CE+4/TE ‘colon’
As described in chapter 2, surface and contrast enhancement are designed to highlight or
sharpen dark-light borders and are designed to work in conjunction. Tone enhancement is
more akin to NBI or FICE in that it is a digital colour filter, reducing red wavelengths of
light and accentuating blue and green wavelengths. The i-Scan system allows
manipulation of each setting with a range of settings from +1 to +6 for SE and CE. Six
different tone enhancement modes are available, including those designed for the
diagnosis of ‘Barrett’s oesophagus’ and ‘Gastric pathologies’. Red, green and blue light
manipulation varies between the 6 different modes. Following a period of familiarisation
with the i-Scan system, experimentation with all settings when viewing normal colonic
mucosa and colonic polyps was undertaken. The above settings were chosen as the
optimal settings for each of the three i-Scan components by the study endoscopist who
has extensive experience in colonic in-vivo diagnostic techniques (>5,000 colonoscopies).
Ideally one would wish to analyse the performance of all possible combinations of i-Scan
settings, but with 216 possible combinations, this was not feasible.
In total 300 images were captured, with 3 images taken of each polyp, one with each i-
Scan mode.
Images were then collated into a Microsoft Powerpoint presentation, randomised using a
computer generated shuffled number sequence (GraphPad, SanDiego, USA). Images were
then viewed separately and independently by two endoscopists with experience of in vivo
diagnostic techniques (>200 colonoscopies performed using advanced imaging
techniques) who had not participated in the first part of the study and were blinded to
123
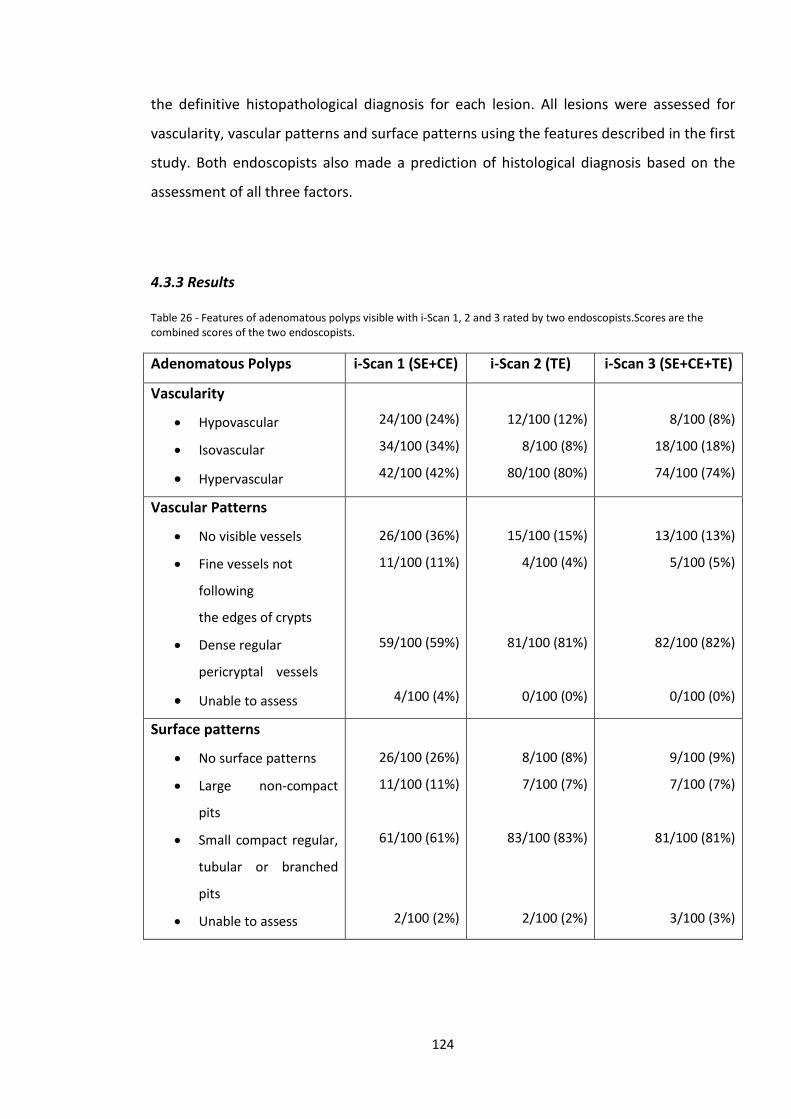
the definitive histopathological diagnosis for each lesion. All lesions were assessed for
vascularity, vascular patterns and surface patterns using the features described in the first
study. Both endoscopists also made a prediction of histological diagnosis based on the
assessment of all three factors.
4.3.3 Results
Table 26 - Features of adenomatous polyps visible with i-Scan 1, 2 and 3 rated by two endoscopists.Scores are the combined scores of the two endoscopists.
Adenomatous Polyps i-Scan 1 (SE+CE) i-Scan 2 (TE) i-Scan 3 (SE+CE+TE)
Vascularity
• Hypovascular
• Isovascular
• Hypervascular
24/100 (24%)
34/100 (34%)
42/100 (42%)
12/100 (12%)
8/100 (8%)
80/100 (80%)
8/100 (8%)
18/100 (18%)
74/100 (74%)
Vascular Patterns
• No visible vessels
• Fine vessels not
following
the edges of crypts
• Dense regular
pericryptal vessels
• Unable to assess
26/100 (36%)
11/100 (11%)
59/100 (59%)
4/100 (4%)
15/100 (15%)
4/100 (4%)
81/100 (81%)
0/100 (0%)
13/100 (13%)
5/100 (5%)
82/100 (82%)
0/100 (0%)
Surface patterns
• No surface patterns
• Large non-compact
pits
• Small compact regular,
tubular or branched
pits
• Unable to assess
26/100 (26%)
11/100 (11%)
61/100 (61%)
2/100 (2%)
8/100 (8%)
7/100 (7%)
83/100 (83%)
2/100 (2%)
9/100 (9%)
7/100 (7%)
81/100 (81%)
3/100 (3%)
124
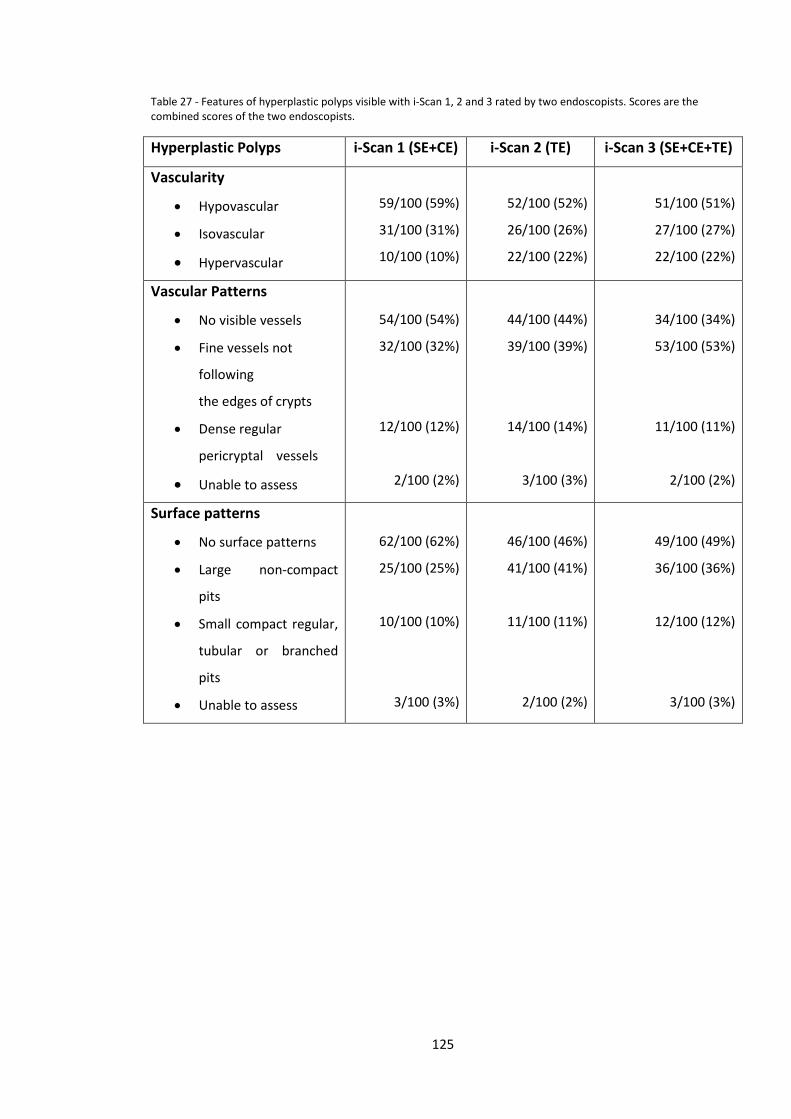
Table 27 - Features of hyperplastic polyps visible with i-Scan 1, 2 and 3 rated by two endoscopists. Scores are the combined scores of the two endoscopists.
Hyperplastic Polyps i-Scan 1 (SE+CE) i-Scan 2 (TE) i-Scan 3 (SE+CE+TE)
Vascularity
• Hypovascular
• Isovascular
• Hypervascular
59/100 (59%)
31/100 (31%)
10/100 (10%)
52/100 (52%)
26/100 (26%)
22/100 (22%)
51/100 (51%)
27/100 (27%)
22/100 (22%)
Vascular Patterns
• No visible vessels
• Fine vessels not
following
the edges of crypts
• Dense regular
pericryptal vessels
• Unable to assess
54/100 (54%)
32/100 (32%)
12/100 (12%)
2/100 (2%)
44/100 (44%)
39/100 (39%)
14/100 (14%)
3/100 (3%)
34/100 (34%)
53/100 (53%)
11/100 (11%)
2/100 (2%)
Surface patterns
• No surface patterns
• Large non-compact
pits
• Small compact regular,
tubular or branched
pits
• Unable to assess
62/100 (62%)
25/100 (25%)
10/100 (10%)
3/100 (3%)
46/100 (46%)
41/100 (41%)
11/100 (11%)
2/100 (2%)
49/100 (49%)
36/100 (36%)
12/100 (12%)
3/100 (3%)
125
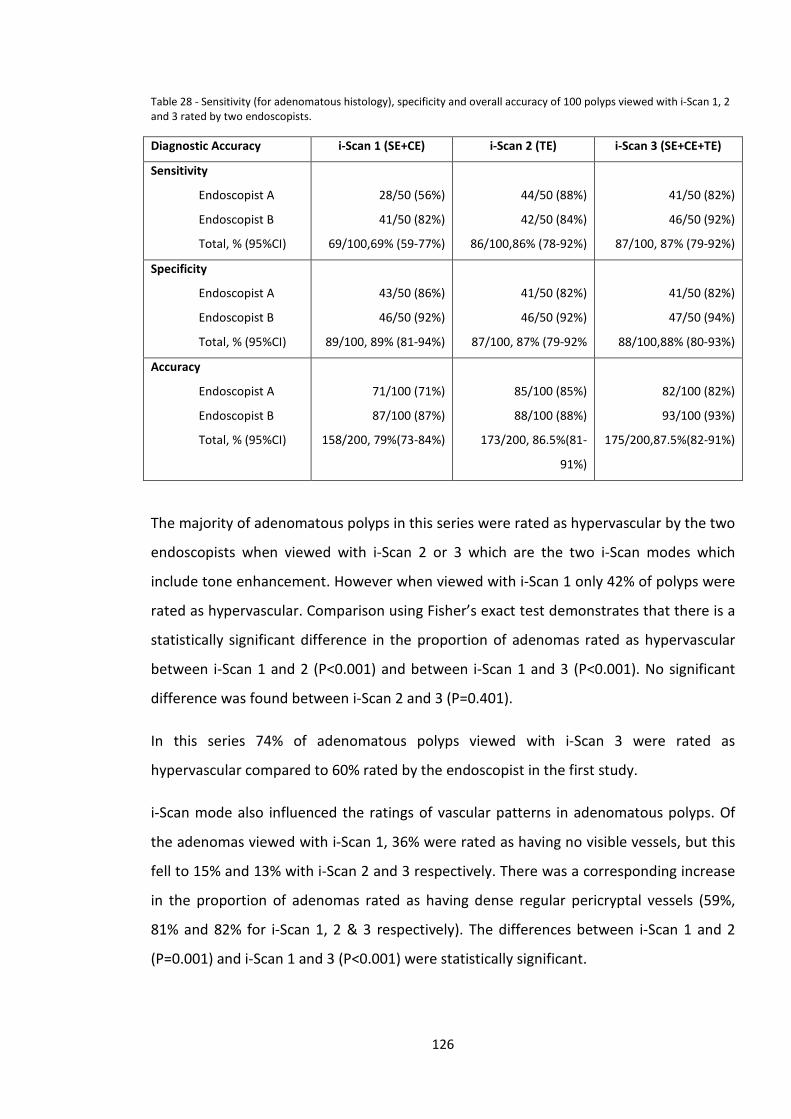
Table 28 - Sensitivity (for adenomatous histology), specificity and overall accuracy of 100 polyps viewed with i-Scan 1, 2 and 3 rated by two endoscopists.
Diagnostic Accuracy i-Scan 1 (SE+CE) i-Scan 2 (TE) i-Scan 3 (SE+CE+TE)
Sensitivity
Endoscopist A
Endoscopist B
Total, % (95%CI)
28/50 (56%)
41/50 (82%)
69/100,69% (59-77%)
44/50 (88%)
42/50 (84%)
86/100,86% (78-92%)
41/50 (82%)
46/50 (92%)
87/100, 87% (79-92%)
Specificity
Endoscopist A
Endoscopist B
Total, % (95%CI)
43/50 (86%)
46/50 (92%)
89/100, 89% (81-94%)
41/50 (82%)
46/50 (92%)
87/100, 87% (79-92%
41/50 (82%)
47/50 (94%)
88/100,88% (80-93%)
Accuracy
Endoscopist A
Endoscopist B
Total, % (95%CI)
71/100 (71%)
87/100 (87%)
158/200, 79%(73-84%)
85/100 (85%)
88/100 (88%)
173/200, 86.5%(81-
91%)
82/100 (82%)
93/100 (93%)
175/200,87.5%(82-91%)
The majority of adenomatous polyps in this series were rated as hypervascular by the two
endoscopists when viewed with i-Scan 2 or 3 which are the two i-Scan modes which
include tone enhancement. However when viewed with i-Scan 1 only 42% of polyps were
rated as hypervascular. Comparison using Fisher’s exact test demonstrates that there is a
statistically significant difference in the proportion of adenomas rated as hypervascular
between i-Scan 1 and 2 (P<0.001) and between i-Scan 1 and 3 (P<0.001). No significant
difference was found between i-Scan 2 and 3 (P=0.401).
In this series 74% of adenomatous polyps viewed with i-Scan 3 were rated as
hypervascular compared to 60% rated by the endoscopist in the first study.
i-Scan mode also influenced the ratings of vascular patterns in adenomatous polyps. Of
the adenomas viewed with i-Scan 1, 36% were rated as having no visible vessels, but this
fell to 15% and 13% with i-Scan 2 and 3 respectively. There was a corresponding increase
in the proportion of adenomas rated as having dense regular pericryptal vessels (59%,
81% and 82% for i-Scan 1, 2 & 3 respectively). The differences between i-Scan 1 and 2
(P=0.001) and i-Scan 1 and 3 (P<0.001) were statistically significant.
126
Rating of surface patterns in adenomas also differed depending on i-Scan mode used.
More adenomas viewed with i-Scan 1 were rated as having no visible surface patterns,
compared to those viewed with i-Scan 2 or i-Scan 3. There was a corresponding increase
in the proportion of polyps rated as having ‘Small compact regular, tubular or branched
pits’. The difference in proportion of adenomas with no visible surface pattern between i-
Scan 1 and 2 was statistically significant (P=0.001), as was the difference between i-Scan 1
and 3 (P=0.003). There was no significant difference between i-Scan 2 and 3 (P=1.00).
In the assessment of hyperplastic polyps use of i-Scan 2 or 3 led to a greater proportion of
polyps being classified as hypervascular. The difference between i-Scan 1 and i-Scan 2/3
were statistically significant (P=0.03).
The proportion of hyperplastic polyps with no visible vessels did not differ significantly
between i-Scan 1 and 2 (P=0.203) or i-Scan 2 and 3 (P=0.192), but did between i-Scan 1
and 3 (P=0.006). Correspondingly the proportion of hyperplastic polyps with ‘fine vessels
not following the edges of crypts’ was greatest with i-Scan 3.
When surface patterns in hyperplastic polyps were assessed more polyps viewed with i-
Scan 1 were rated as having no visible surface patterns, compared to i-Scan 2 or i-Scan 3.
The difference in this proportion between i-Scan 1 and 2 was statistically significant
(P=0.033), but not between i-Scan 1 and i-Scan 3 (P=0.088) or between i-Scan 2 and i-Scan
3 (P=0.777). There was a corresponding increase in the proportion of hyperplastic polyps
rated as having large non-compact pits. Interestingly 10-12% of hyperplastic polyps were
judged to have small compact regular, tubular or branched pits which are typically
associated with adenomatous histology.
Compared to i-Scan 1 assessments mean sensitivity for adenomatous histology was
significantly higher with i-Scan 2 (P=0.006), and with i-Scan 3 (P=0.003). There was no
significant difference in sensitivity between i-Scan 2 and i-Scan 3 assessments (P=1.000).
No significant differences in specificity were found between the 3 i-Scan modes (i-Scan 1
vs i-Scan 2 P=0.828, i-Scan 1 vs i-Scan 3 P=1.000, i-Scan 1 vs i-Scan 3 P=1.000).
Overall accuracy increased from 79% with i-Scan 1 to 86.5% with i-Scan 2 and 87.5% with
i-Scan 3. There was no significant difference in overall accuracy between i-Scan 1 and i-
127
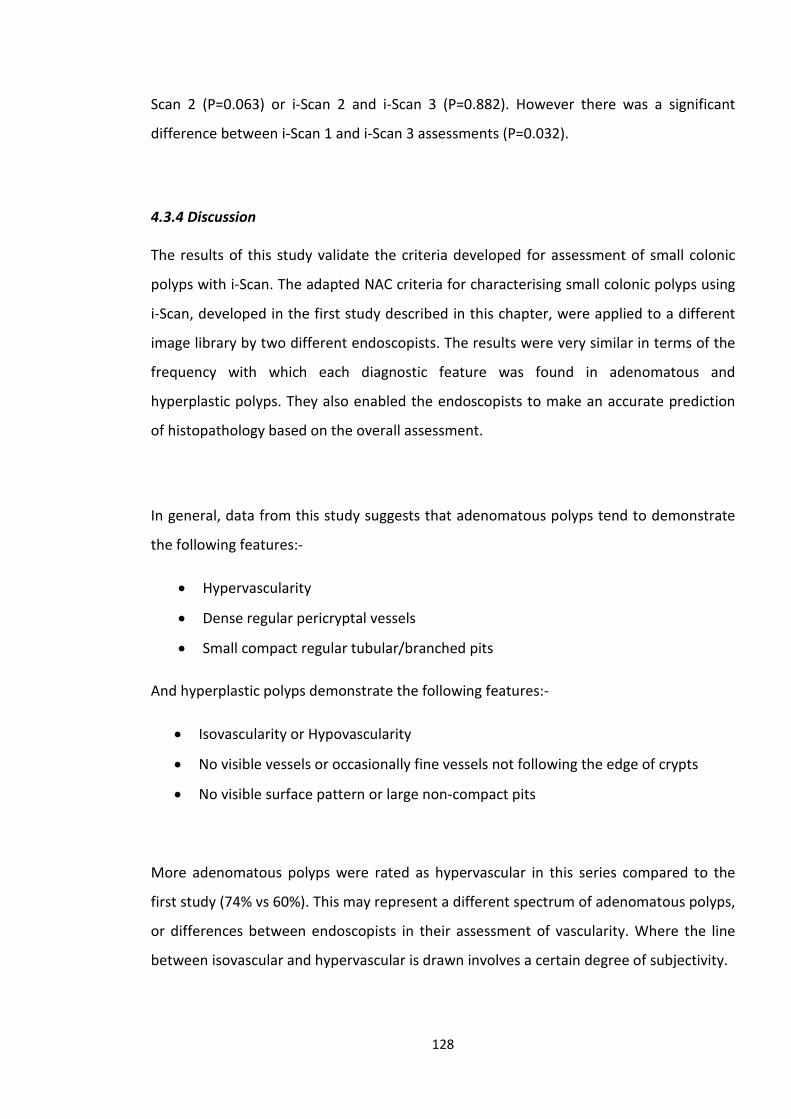
Scan 2 (P=0.063) or i-Scan 2 and i-Scan 3 (P=0.882). However there was a significant
difference between i-Scan 1 and i-Scan 3 assessments (P=0.032).
4.3.4 Discussion
The results of this study validate the criteria developed for assessment of small colonic
polyps with i-Scan. The adapted NAC criteria for characterising small colonic polyps using
i-Scan, developed in the first study described in this chapter, were applied to a different
image library by two different endoscopists. The results were very similar in terms of the
frequency with which each diagnostic feature was found in adenomatous and
hyperplastic polyps. They also enabled the endoscopists to make an accurate prediction
of histopathology based on the overall assessment.
In general, data from this study suggests that adenomatous polyps tend to demonstrate
the following features:-
• Hypervascularity
• Dense regular pericryptal vessels
• Small compact regular tubular/branched pits
And hyperplastic polyps demonstrate the following features:-
• Isovascularity or Hypovascularity
• No visible vessels or occasionally fine vessels not following the edge of crypts
• No visible surface pattern or large non-compact pits
More adenomatous polyps were rated as hypervascular in this series compared to the
first study (74% vs 60%). This may represent a different spectrum of adenomatous polyps,
or differences between endoscopists in their assessment of vascularity. Where the line
between isovascular and hypervascular is drawn involves a certain degree of subjectivity.
128
The proportion of adenomas rated as being hypervascular was significantly higher when
viewed with i-Scan 2/3 compared to i-Scan 1. This suggests that the tone enhancement
feature of i-Scan accentuates differences in vascularity between adenomas and the
surrounding normal mucosa.
It is notable that, as was found in the first study, 22% of hyperplastic polyps viewed with i-
Scan 3 were rated as being hypervascular. Hypervascularity is a feature strongly
associated with adenomatous polyps but clearly can also be found in hyperplastic polyps.
Therefore, relying on vascularity alone to make an in-vivo characterisation is not
sufficient, and other visible features also need to be assessed.
The application of tone enhancement also appears to improve the visibility of surface and
vascular patterns in adenomas in comparison to SE/CE alone.
In the assessment of hyperplastic polyps, application of combined SE, CE and TE (i-Scan 3)
appeared to accentuate the visibility of fine vessels not following the edges of crypts. TE
alone (i-Scan 2) did not make a significant difference compared to SE/CE (i-Scan 1).
In terms of overall assessment of polyp histology in this study it appears that TE improves
recognition of adenomas in comparison to SE/CE. However TE does not appear to
improve recognition of hyperplastic polyps. When overall accuracy was assessed, the
combination of SE/CE/TE was significantly more accurate than SE/CE but did not differ
from TE alone. In similar findings Hong et al found that use of all 3 i-Scan components
(SE/CE/TE) together resulted in significantly higher accuracy for assessing SCPs than
HDWL, but no significant difference was found between SE+CE and HDWL accuracy161.
Thus it appears that the feature of i-Scan that offers the main gains in terms of improving
visibility of diagnostic features and overall prediction of histology is tone enhancement.
The main gains in prediction of histology are in recognition of adenomas, whereas TE
does not appear to have an influence on recognition of hyperplastic polyps.
These findings are in keeping with several other studies that found a significant
improvement in sensitivity over white light when advanced spectral filter based imaging
techniques were applied, but no significant change in specificity. This phenomenon does
not seem to be limited to studies with i-Scan160, 161, but has also been reported in several
129
studies using FICE158, 193, 228 and NBI191, 207, 214. Longcroft-Wheaton et al found that both
sensitivity and specificity were significantly higher with FICE compared to white light
when all polyps <10 mm were analysed, but that only sensitivity was significantly higher
in the subgroup of polyps <5 mm in size156.
Therefore the main benefit of optical or digital filter technologies, such as i-Scan TE, FICE
or NBI, may be an ability to accentuate the appearance of small pericryptal capillary
vessels found in many adenomatous polyps, and hence improve recognition of
adenomatous polyps, thus avoiding ‘false negative’ calls.
The limitations of this study were that pictures were assessed ‘off-line’ rather than in real
time. A still image may not demonstrate all the features that can be assessed in vivo. Care
was taken to produce and select high quality images, and this is reflected in the fact that
in only a very small percentage of cases, vascular and surface patterns could not be
assessed. This study was performed with two endoscopists both of whom had experience
of in vivo diagnostic techniques, and hence it is not clear whether the findings would
apply to all endoscopists.
130
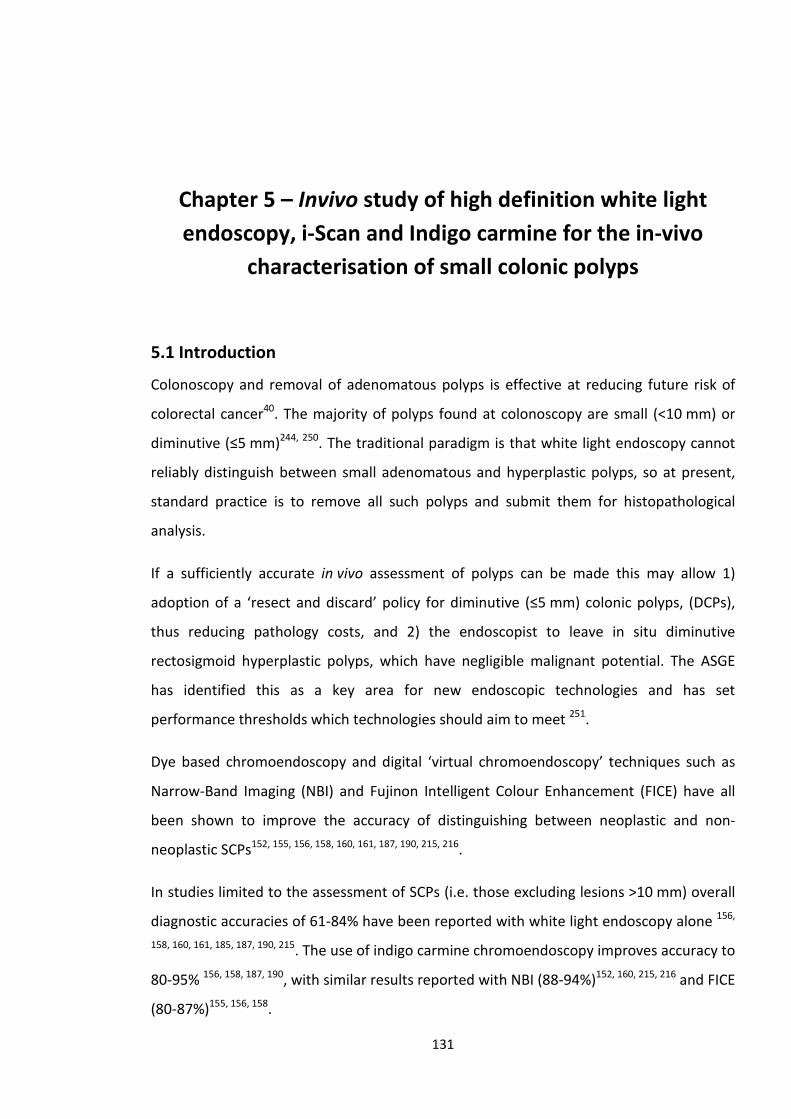
Chapter 5 – Invivo study of high definition white light endoscopy, i-Scan and Indigo carmine for the in-vivo
characterisation of small colonic polyps
5.1 Introduction
Colonoscopy and removal of adenomatous polyps is effective at reducing future risk of
colorectal cancer40. The majority of polyps found at colonoscopy are small (<10 mm) or
diminutive (≤5 mm)244, 250. The traditional paradigm is that white light endoscopy cannot
reliably distinguish between small adenomatous and hyperplastic polyps, so at present,
standard practice is to remove all such polyps and submit them for histopathological
analysis.
If a sufficiently accurate in vivo assessment of polyps can be made this may allow 1)
adoption of a ‘resect and discard’ policy for diminutive (≤5 mm) colonic polyps, (DCPs),
thus reducing pathology costs, and 2) the endoscopist to leave in situ diminutive
rectosigmoid hyperplastic polyps, which have negligible malignant potential. The ASGE
has identified this as a key area for new endoscopic technologies and has set
performance thresholds which technologies should aim to meet 251.
Dye based chromoendoscopy and digital ‘virtual chromoendoscopy’ techniques such as
Narrow-Band Imaging (NBI) and Fujinon Intelligent Colour Enhancement (FICE) have all
been shown to improve the accuracy of distinguishing between neoplastic and non-
neoplastic SCPs152, 155, 156, 158, 160, 161, 187, 190, 215, 216.
In studies limited to the assessment of SCPs (i.e. those excluding lesions >10 mm) overall
diagnostic accuracies of 61-84% have been reported with white light endoscopy alone 156,
158, 160, 161, 185, 187, 190, 215. The use of indigo carmine chromoendoscopy improves accuracy to
80-95% 156, 158, 187, 190, with similar results reported with NBI (88-94%)152, 160, 215, 216 and FICE
(80-87%)155, 156, 158.
131
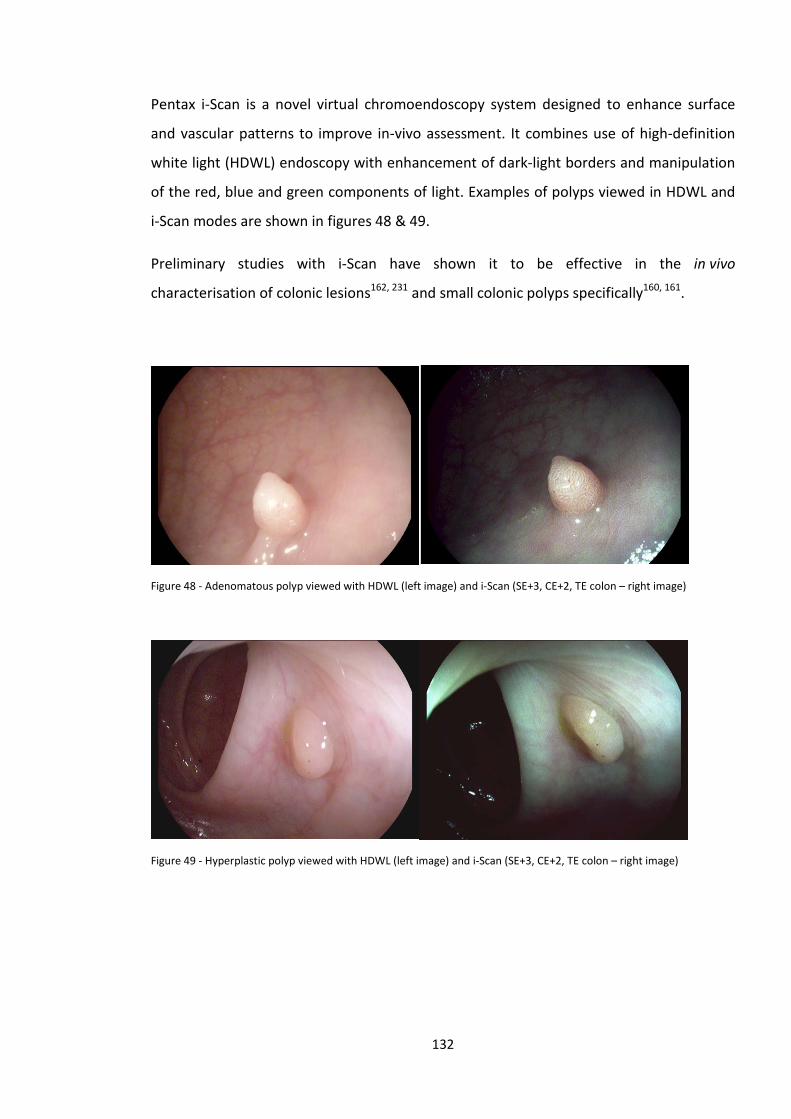
Pentax i-Scan is a novel virtual chromoendoscopy system designed to enhance surface
and vascular patterns to improve in-vivo assessment. It combines use of high-definition
white light (HDWL) endoscopy with enhancement of dark-light borders and manipulation
of the red, blue and green components of light. Examples of polyps viewed in HDWL and
i-Scan modes are shown in figures 48 & 49.
Preliminary studies with i-Scan have shown it to be effective in the in vivo
characterisation of colonic lesions162, 231 and small colonic polyps specifically160, 161.
Figure 48 - Adenomatous polyp viewed with HDWL (left image) and i-Scan (SE+3, CE+2, TE colon – right image)
Figure 49 - Hyperplastic polyp viewed with HDWL (left image) and i-Scan (SE+3, CE+2, TE colon – right image)
132
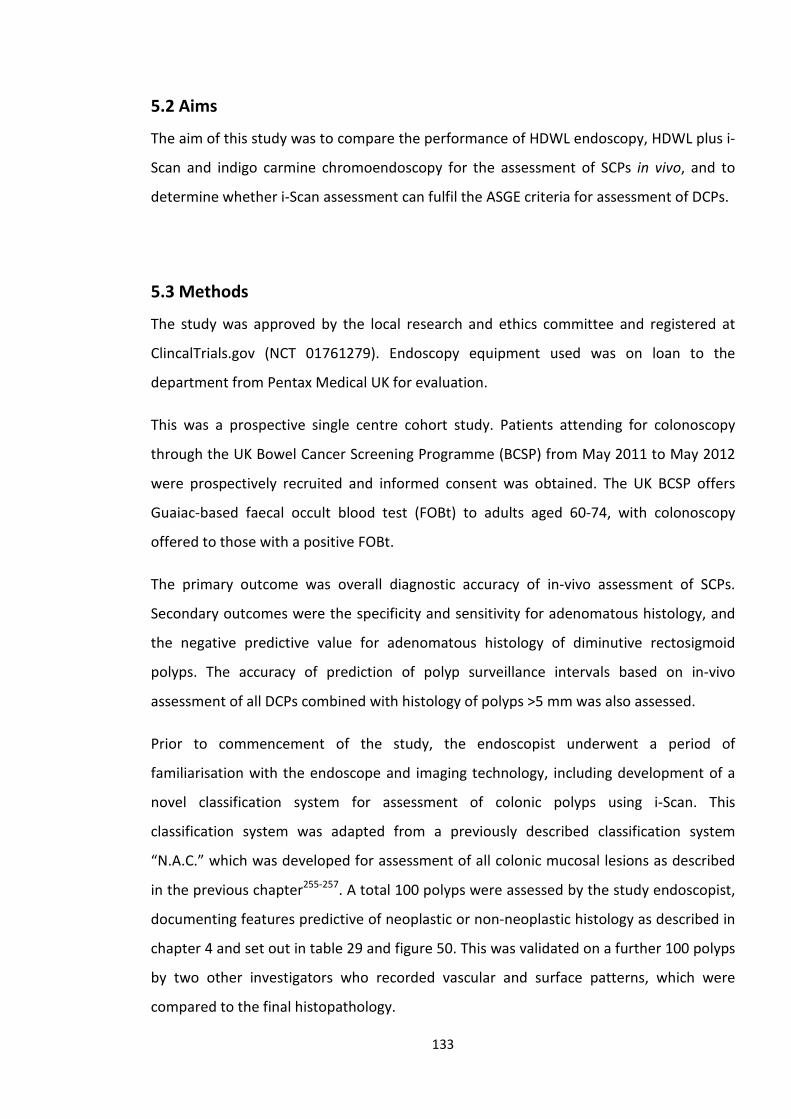
5.2 Aims
The aim of this study was to compare the performance of HDWL endoscopy, HDWL plus i-
Scan and indigo carmine chromoendoscopy for the assessment of SCPs in vivo, and to
determine whether i-Scan assessment can fulfil the ASGE criteria for assessment of DCPs.
5.3 Methods
The study was approved by the local research and ethics committee and registered at
ClincalTrials.gov (NCT 01761279). Endoscopy equipment used was on loan to the
department from Pentax Medical UK for evaluation.
This was a prospective single centre cohort study. Patients attending for colonoscopy
through the UK Bowel Cancer Screening Programme (BCSP) from May 2011 to May 2012
were prospectively recruited and informed consent was obtained. The UK BCSP offers
Guaiac-based faecal occult blood test (FOBt) to adults aged 60-74, with colonoscopy
offered to those with a positive FOBt.
The primary outcome was overall diagnostic accuracy of in-vivo assessment of SCPs.
Secondary outcomes were the specificity and sensitivity for adenomatous histology, and
the negative predictive value for adenomatous histology of diminutive rectosigmoid
polyps. The accuracy of prediction of polyp surveillance intervals based on in-vivo
assessment of all DCPs combined with histology of polyps >5 mm was also assessed.
Prior to commencement of the study, the endoscopist underwent a period of
familiarisation with the endoscope and imaging technology, including development of a
novel classification system for assessment of colonic polyps using i-Scan. This
classification system was adapted from a previously described classification system
“N.A.C.” which was developed for assessment of all colonic mucosal lesions as described
in the previous chapter255-257. A total 100 polyps were assessed by the study endoscopist,
documenting features predictive of neoplastic or non-neoplastic histology as described in
chapter 4 and set out in table 29 and figure 50. This was validated on a further 100 polyps
by two other investigators who recorded vascular and surface patterns, which were
compared to the final histopathology.
133
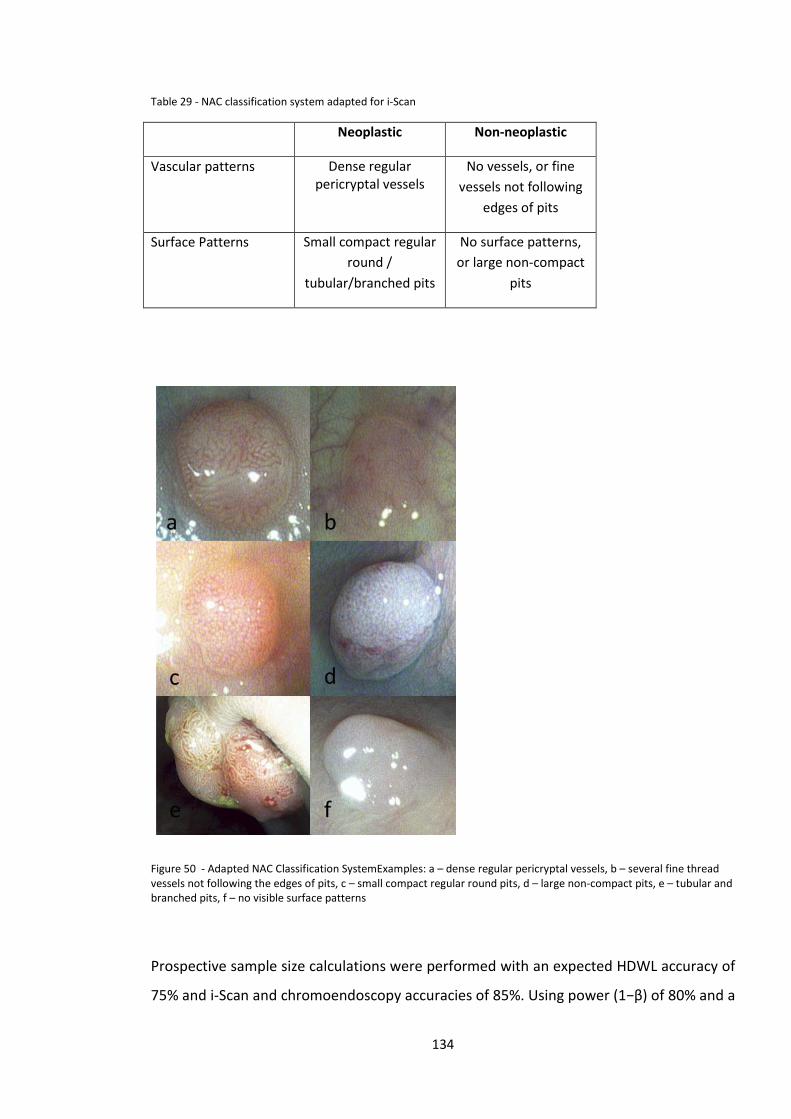
Table 29 - NAC classification system adapted for i-Scan
Neoplastic Non-neoplastic
Vascular patterns Dense regular pericryptal vessels
No vessels, or fine vessels not following
edges of pits
Surface Patterns Small compact regular round /
tubular/branched pits
No surface patterns, or large non-compact
pits
Figure 50 - Adapted NAC Classification SystemExamples: a – dense regular pericryptal vessels, b – several fine thread vessels not following the edges of pits, c – small compact regular round pits, d – large non-compact pits, e – tubular and branched pits, f – no visible surface patterns
Prospective sample size calculations were performed with an expected HDWL accuracy of
75% and i-Scan and chromoendoscopy accuracies of 85%. Using power (1−β) of 80% and a
134
two−sided significance level (α) of 0.05, 198 polyps were required to demonstrate a
significant difference between HDWL and i-Scan. A 5% increase was made to allow for lost
or non-retrieved specimens giving a final target of 208 polyps.
Statistical analysis was performed using SPSS v20 (IBM, Portsmouth, UK). McNemar’s test
for repeated measures was used to compare accuracy, sensitivity and specificity between
HDWL, iScan and chromoendoscopy.
All procedures were performed by a single endoscopist (PZB) with extensive experience in
in vivo characterisation of colonic polyps. Pentax EC-3890Li 1.2 Megapixel HD+
colonoscopes were used linked to an EPKi processor (Pentax Medical, UK). The endoscope
image was transmitted between processor and screen by an HD connection, and
displayed on a high definition monitor capable of displaying 1080 horizontal lines.
Colonoscopy was performed either without sedation or under conscious sedation with
midazolam (0.5-2.5mg and pethidine (25-50mg). The endoscope was first inserted to the
caecum in HDWL mode. Polyps <10 mm in size found on withdrawal of the colonoscope
were assessed. Firstly the polyp was flushed with a solution of water, simethicone and n-
acetylcysteine to remove any excess stool, mucus and bubbles. Each polyp was then
assessed sequentially using HDWL endoscopy followed by i-Scan surface, contrast and
tone enhancement modes (i-Scan 1 = SE+3 CE +4, i-Scan 2 = SE+1, TE colon, i-Scan 3 =
SE+3, CE+2, TE colon) and finally chromoendoscopy using 0.5% indigo carmine. Polyp
location, size (as compared to open biopsy forceps or snare) and morphology258 was
noted. A prediction of polyp histology (Neoplastic vs Non-neoplastic) was first made by
the endoscopist following HDWL assessment and again following assessment with i-Scan
modes and finally following chromoendoscopy. The endoscopist also indicated whether
the overall in vivo assessment was made with high or low confidence. Predicted histology
was subsequently compared to the final histopathological diagnosis, as reported by a
Bowel Cancer Screening Programme accredited histopathologist who was not aware of
the results of the in vivo assessment.
Patients were excluded from the study for the following reasons; poor bowel preparation,
polyposis syndrome and inflammatory bowel disease. Polyps were not included in the
135
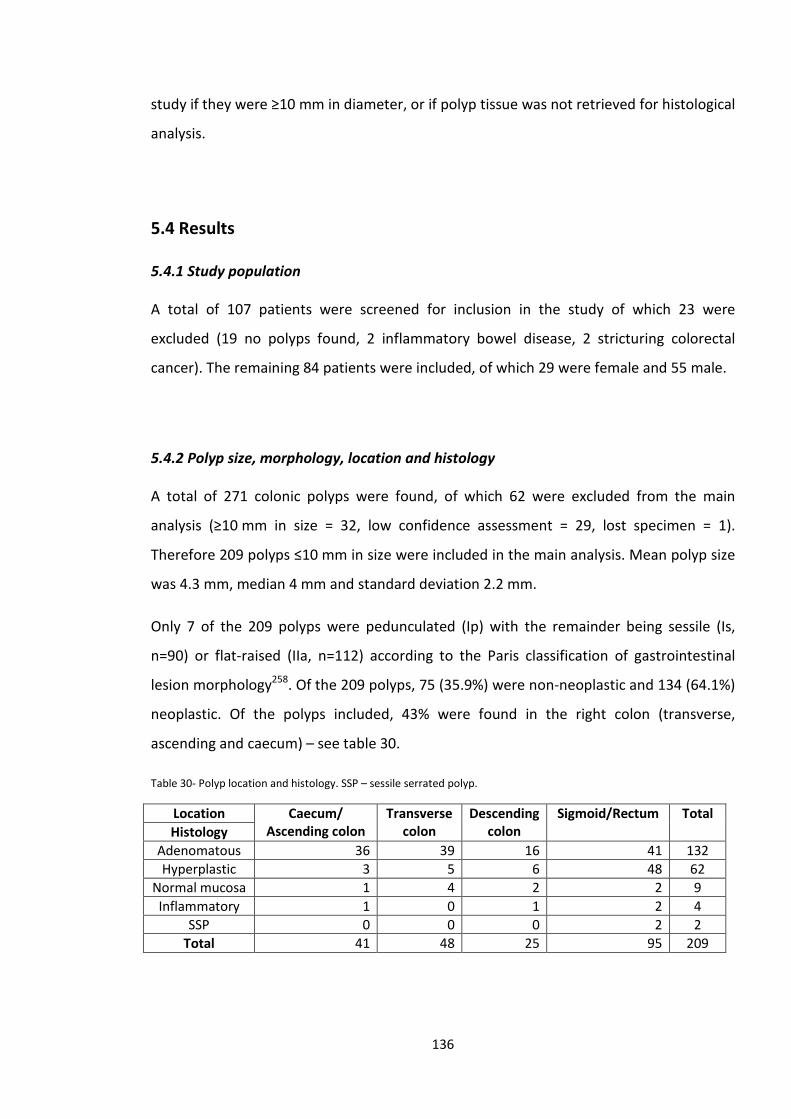
study if they were ≥10 mm in diameter, or if polyp tissue was not retrieved for histological
analysis.
5.4 Results
5.4.1 Study population
A total of 107 patients were screened for inclusion in the study of which 23 were
excluded (19 no polyps found, 2 inflammatory bowel disease, 2 stricturing colorectal
cancer). The remaining 84 patients were included, of which 29 were female and 55 male.
5.4.2 Polyp size, morphology, location and histology
A total of 271 colonic polyps were found, of which 62 were excluded from the main
analysis (≥10 mm in size = 32, low confidence assessment = 29, lost specimen = 1).
Therefore 209 polyps ≤10 mm in size were included in the main analysis. Mean polyp size
was 4.3 mm, median 4 mm and standard deviation 2.2 mm.
Only 7 of the 209 polyps were pedunculated (Ip) with the remainder being sessile (Is,
n=90) or flat-raised (IIa, n=112) according to the Paris classification of gastrointestinal
lesion morphology258. Of the 209 polyps, 75 (35.9%) were non-neoplastic and 134 (64.1%)
neoplastic. Of the polyps included, 43% were found in the right colon (transverse,
ascending and caecum) – see table 30.
Table 30- Polyp location and histology. SSP – sessile serrated polyp.
Location Caecum/ Ascending colon
Transverse colon
Descending colon
Sigmoid/Rectum Total Histology
Adenomatous 36 39 16 41 132 Hyperplastic 3 5 6 48 62
Normal mucosa 1 4 2 2 9 Inflammatory 1 0 1 2 4
SSP 0 0 0 2 2 Total 41 48 25 95 209
136
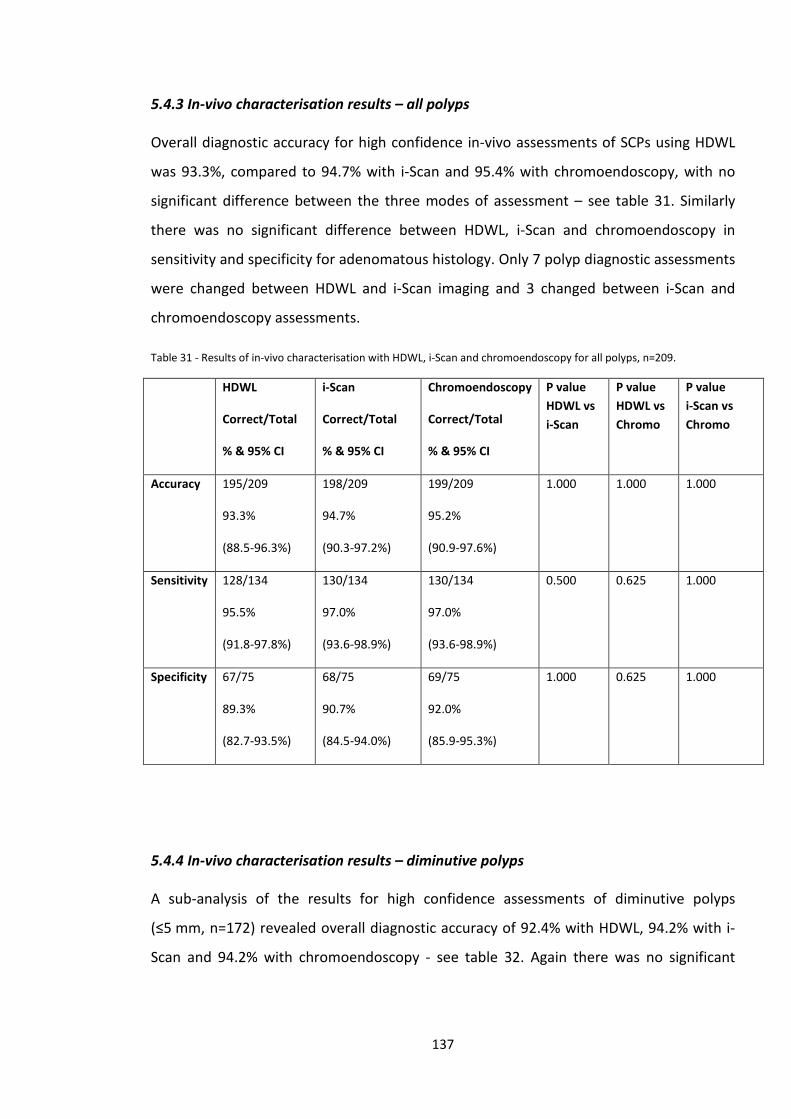
5.4.3 In-vivo characterisation results – all polyps
Overall diagnostic accuracy for high confidence in-vivo assessments of SCPs using HDWL
was 93.3%, compared to 94.7% with i-Scan and 95.4% with chromoendoscopy, with no
significant difference between the three modes of assessment – see table 31. Similarly
there was no significant difference between HDWL, i-Scan and chromoendoscopy in
sensitivity and specificity for adenomatous histology. Only 7 polyp diagnostic assessments
were changed between HDWL and i-Scan imaging and 3 changed between i-Scan and
chromoendoscopy assessments.
Table 31 - Results of in-vivo characterisation with HDWL, i-Scan and chromoendoscopy for all polyps, n=209.
HDWL
Correct/Total
% & 95% CI
i-Scan
Correct/Total
% & 95% CI
Chromoendoscopy
Correct/Total
% & 95% CI
P value HDWL vs i-Scan
P value HDWL vs Chromo
P value i-Scan vs Chromo
Accuracy 195/209
93.3%
(88.5-96.3%)
198/209
94.7%
(90.3-97.2%)
199/209
95.2%
(90.9-97.6%)
1.000 1.000 1.000
Sensitivity 128/134
95.5%
(91.8-97.8%)
130/134
97.0%
(93.6-98.9%)
130/134
97.0%
(93.6-98.9%)
0.500 0.625 1.000
Specificity 67/75
89.3%
(82.7-93.5%)
68/75
90.7%
(84.5-94.0%)
69/75
92.0%
(85.9-95.3%)
1.000 0.625 1.000
5.4.4 In-vivo characterisation results – diminutive polyps
A sub-analysis of the results for high confidence assessments of diminutive polyps
(≤5 mm, n=172) revealed overall diagnostic accuracy of 92.4% with HDWL, 94.2% with i-
Scan and 94.2% with chromoendoscopy - see table 32. Again there was no significant
137
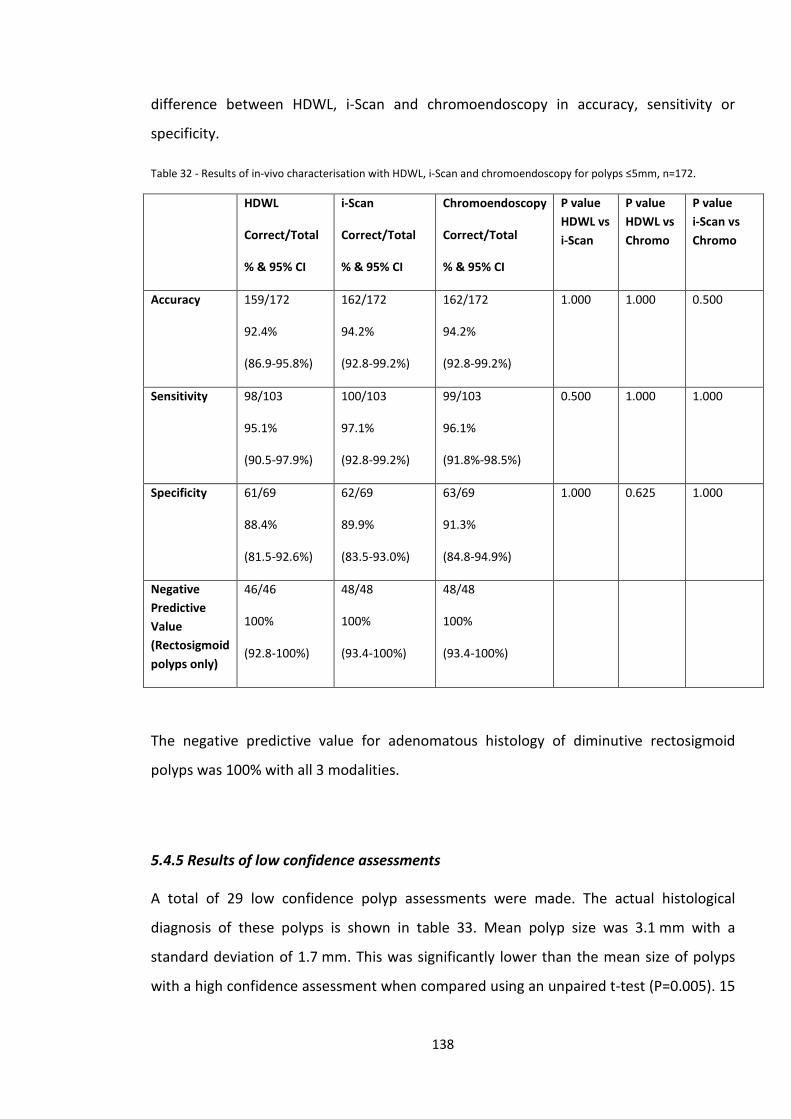
difference between HDWL, i-Scan and chromoendoscopy in accuracy, sensitivity or
specificity.
Table 32 - Results of in-vivo characterisation with HDWL, i-Scan and chromoendoscopy for polyps ≤5mm, n=172.
HDWL
Correct/Total
% & 95% CI
i-Scan
Correct/Total
% & 95% CI
Chromoendoscopy
Correct/Total
% & 95% CI
P value HDWL vs i-Scan
P value HDWL vs Chromo
P value i-Scan vs Chromo
Accuracy 159/172
92.4%
(86.9-95.8%)
162/172
94.2%
(92.8-99.2%)
162/172
94.2%
(92.8-99.2%)
1.000 1.000 0.500
Sensitivity 98/103
95.1%
(90.5-97.9%)
100/103
97.1%
(92.8-99.2%)
99/103
96.1%
(91.8%-98.5%)
0.500 1.000 1.000
Specificity 61/69
88.4%
(81.5-92.6%)
62/69
89.9%
(83.5-93.0%)
63/69
91.3%
(84.8-94.9%)
1.000 0.625 1.000
Negative Predictive Value (Rectosigmoid polyps only)
46/46
100%
(92.8-100%)
48/48
100%
(93.4-100%)
48/48
100%
(93.4-100%)
The negative predictive value for adenomatous histology of diminutive rectosigmoid
polyps was 100% with all 3 modalities.
5.4.5 Results of low confidence assessments
A total of 29 low confidence polyp assessments were made. The actual histological
diagnosis of these polyps is shown in table 33. Mean polyp size was 3.1 mm with a
standard deviation of 1.7 mm. This was significantly lower than the mean size of polyps
with a high confidence assessment when compared using an unpaired t-test (P=0.005). 15
138
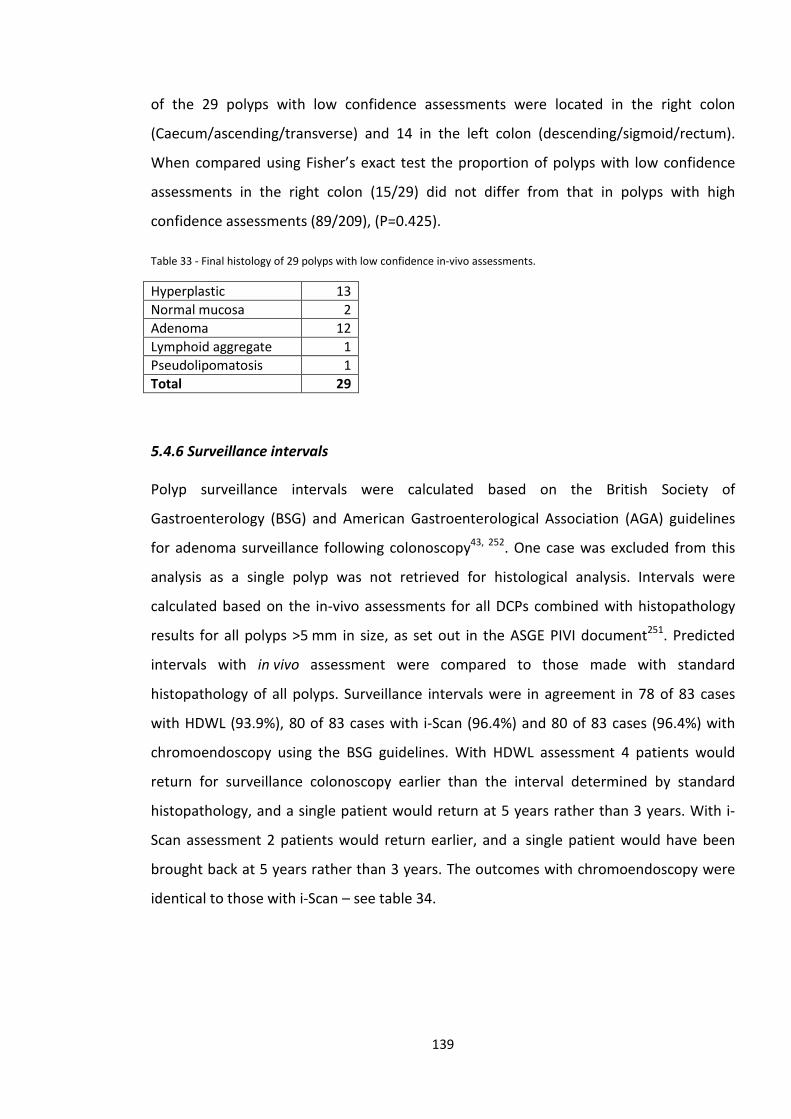
of the 29 polyps with low confidence assessments were located in the right colon
(Caecum/ascending/transverse) and 14 in the left colon (descending/sigmoid/rectum).
When compared using Fisher’s exact test the proportion of polyps with low confidence
assessments in the right colon (15/29) did not differ from that in polyps with high
confidence assessments (89/209), (P=0.425).
Table 33 - Final histology of 29 polyps with low confidence in-vivo assessments.
Hyperplastic 13 Normal mucosa 2 Adenoma 12 Lymphoid aggregate 1 Pseudolipomatosis 1 Total 29
5.4.6 Surveillance intervals
Polyp surveillance intervals were calculated based on the British Society of
Gastroenterology (BSG) and American Gastroenterological Association (AGA) guidelines
for adenoma surveillance following colonoscopy43, 252. One case was excluded from this
analysis as a single polyp was not retrieved for histological analysis. Intervals were
calculated based on the in-vivo assessments for all DCPs combined with histopathology
results for all polyps >5 mm in size, as set out in the ASGE PIVI document251. Predicted
intervals with in vivo assessment were compared to those made with standard
histopathology of all polyps. Surveillance intervals were in agreement in 78 of 83 cases
with HDWL (93.9%), 80 of 83 cases with i-Scan (96.4%) and 80 of 83 cases (96.4%) with
chromoendoscopy using the BSG guidelines. With HDWL assessment 4 patients would
return for surveillance colonoscopy earlier than the interval determined by standard
histopathology, and a single patient would return at 5 years rather than 3 years. With i-
Scan assessment 2 patients would return earlier, and a single patient would have been
brought back at 5 years rather than 3 years. The outcomes with chromoendoscopy were
identical to those with i-Scan – see table 34.
139
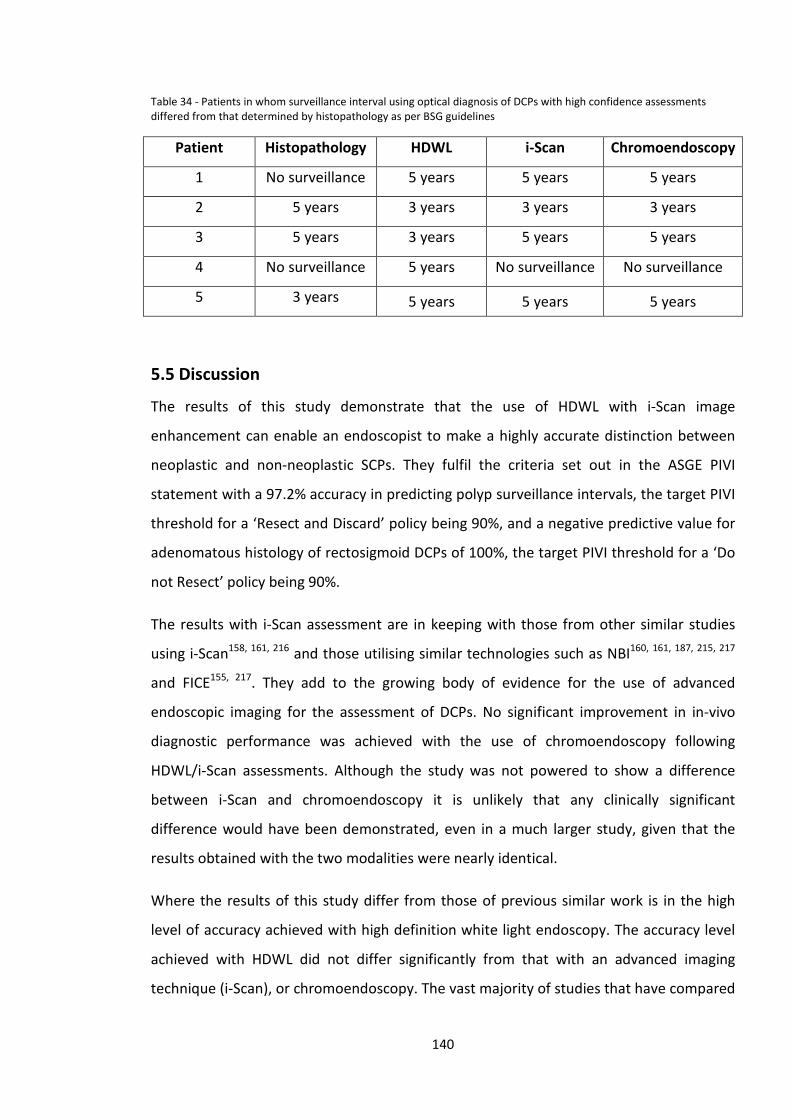
Table 34 - Patients in whom surveillance interval using optical diagnosis of DCPs with high confidence assessments differed from that determined by histopathology as per BSG guidelines
Patient Histopathology HDWL i-Scan Chromoendoscopy
1 No surveillance 5 years 5 years 5 years
2 5 years 3 years 3 years 3 years
3 5 years 3 years 5 years 5 years
4 No surveillance 5 years No surveillance No surveillance
5 3 years 5 years 5 years 5 years
5.5 Discussion
The results of this study demonstrate that the use of HDWL with i-Scan image
enhancement can enable an endoscopist to make a highly accurate distinction between
neoplastic and non-neoplastic SCPs. They fulfil the criteria set out in the ASGE PIVI
statement with a 97.2% accuracy in predicting polyp surveillance intervals, the target PIVI
threshold for a ‘Resect and Discard’ policy being 90%, and a negative predictive value for
adenomatous histology of rectosigmoid DCPs of 100%, the target PIVI threshold for a ‘Do
not Resect’ policy being 90%.
The results with i-Scan assessment are in keeping with those from other similar studies
using i-Scan158, 161, 216 and those utilising similar technologies such as NBI160, 161, 187, 215, 217
and FICE155, 217. They add to the growing body of evidence for the use of advanced
endoscopic imaging for the assessment of DCPs. No significant improvement in in-vivo
diagnostic performance was achieved with the use of chromoendoscopy following
HDWL/i-Scan assessments. Although the study was not powered to show a difference
between i-Scan and chromoendoscopy it is unlikely that any clinically significant
difference would have been demonstrated, even in a much larger study, given that the
results obtained with the two modalities were nearly identical.
Where the results of this study differ from those of previous similar work is in the high
level of accuracy achieved with high definition white light endoscopy. The accuracy level
achieved with HDWL did not differ significantly from that with an advanced imaging
technique (i-Scan), or chromoendoscopy. The vast majority of studies that have compared
140
white light endoscopy with advanced imaging/chromoendoscopy have found a significant
difference between the two. A few other studies have found no significant difference
between white light endoscopy and another technique. Apel et al compared standard
definition white light endoscopy and non-magnifying chromoendoscopy for assessment of
diminutive rectosigmoid polyps and found no significant difference in accuracy between
the two techniques (81% vs 83%, P=0.686)198. Vu et al studied in-vivo characterisation by
community and academic endoscopists using HDWL +/- NBI where required226. Accuracy
of in-vivo assessments was 82.5% with HDWL compared to 73.9% with NBI (P=0.02).
However NBI may have been used predominately for more difficult to assess polyps
which could not be easily classified with HDWL.
The question of whether neoplastic and non-neoplastic colonic polyps can be
distinguished by making an ‘optical diagnosis’ has been posed by endoscopists since the
1980s. Studies using fibreoptic colonoscopes, or early video colonoscopes, achieved
diagnostic accuracy rates of 75-83% 183-185, although these were limited to sigmoidoscopy
rather than full colonoscopy. Somewhat surprisingly, the diagnostic accuracy of white
light endoscopy for the same aim has changed little over the intervening decades. Despite
the advances in endoscopic and imaging technology, similar accuracy rates of 61-84%
have been reported in more recent studies 152, 155, 160, 184, 187, 258. Table 35 lists the results
of studies which have reported outcomes with white light endoscopic assessment.
141
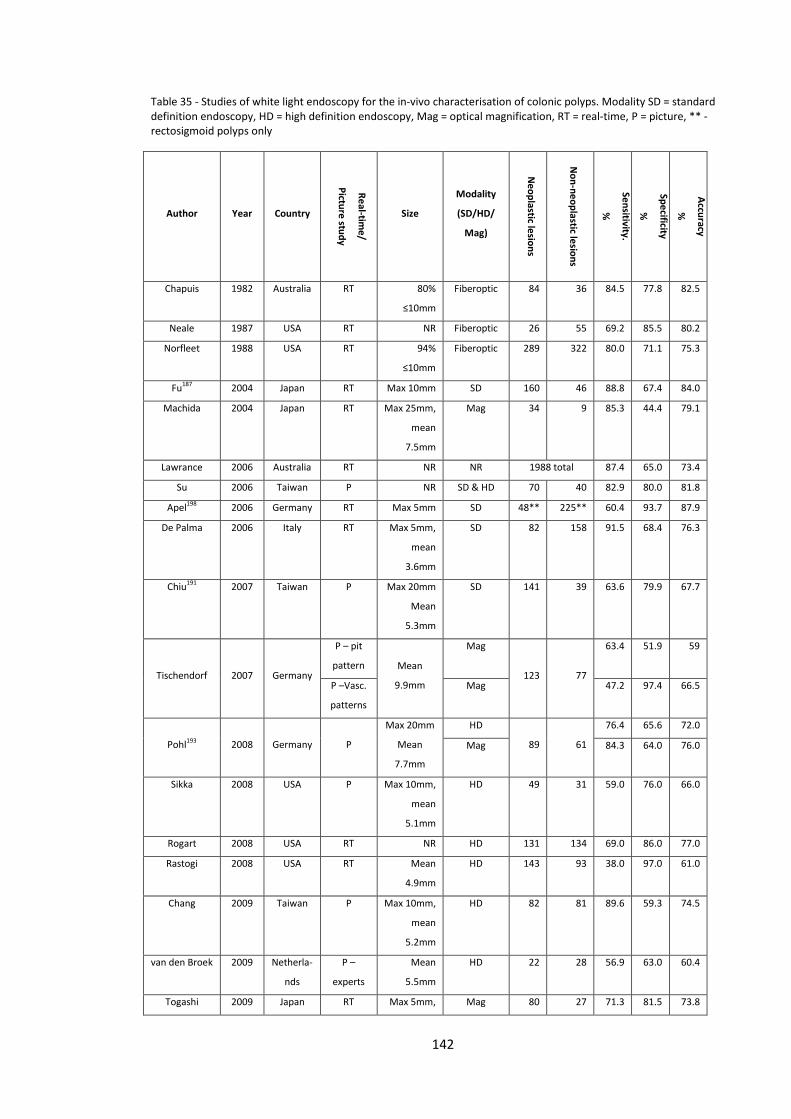
Table 35 - Studies of white light endoscopy for the in-vivo characterisation of colonic polyps. Modality SD = standard definition endoscopy, HD = high definition endoscopy, Mag = optical magnification, RT = real-time, P = picture, ** - rectosigmoid polyps only
Author Year Country
Real-time/
Picture study
Size
Modality
(SD/HD/
Mag)
Neoplastic lesions
Non-neoplastic lesions
Sensitivity.
%
Specificity
%
Accuracy
%
Chapuis 1982 Australia RT 80%
≤10mm
Fiberoptic 84 36 84.5 77.8 82.5
Neale 1987 USA RT NR Fiberoptic 26 55 69.2 85.5 80.2
Norfleet 1988 USA RT 94%
≤10mm
Fiberoptic 289 322 80.0 71.1 75.3
Fu187 2004 Japan RT Max 10mm SD 160 46 88.8 67.4 84.0
Machida 2004 Japan RT Max 25mm,
mean
7.5mm
Mag 34 9 85.3 44.4 79.1
Lawrance 2006 Australia RT NR NR 1988 total 87.4 65.0 73.4
Su 2006 Taiwan P NR SD & HD 70 40 82.9 80.0 81.8
Apel198 2006 Germany RT Max 5mm SD 48** 225** 60.4 93.7 87.9
De Palma 2006 Italy RT Max 5mm,
mean
3.6mm
SD 82 158 91.5 68.4 76.3
Chiu191 2007 Taiwan P Max 20mm
Mean
5.3mm
SD 141 39 63.6 79.9 67.7
Tischendorf 2007 Germany
P – pit
pattern Mean
9.9mm
Mag
123 77
63.4 51.9 59
P –Vasc.
patterns
Mag 47.2 97.4 66.5
Pohl193 2008 Germany P
Max 20mm
Mean
7.7mm
HD
89 61
76.4 65.6 72.0
Mag 84.3 64.0 76.0
Sikka 2008 USA P Max 10mm,
mean
5.1mm
HD 49 31 59.0 76.0 66.0
Rogart 2008 USA RT NR HD 131 134 69.0 86.0 77.0
Rastogi 2008 USA RT Mean
4.9mm
HD 143 93 38.0 97.0 61.0
Chang 2009 Taiwan P Max 10mm,
mean
5.2mm
HD 82 81 89.6 59.3 74.5
van den Broek 2009 Netherla-
nds
P –
experts
Mean
5.5mm
HD 22 28 56.9 63.0 60.4
Togashi 2009 Japan RT Max 5mm, Mag 80 27 71.3 81.5 73.8
142
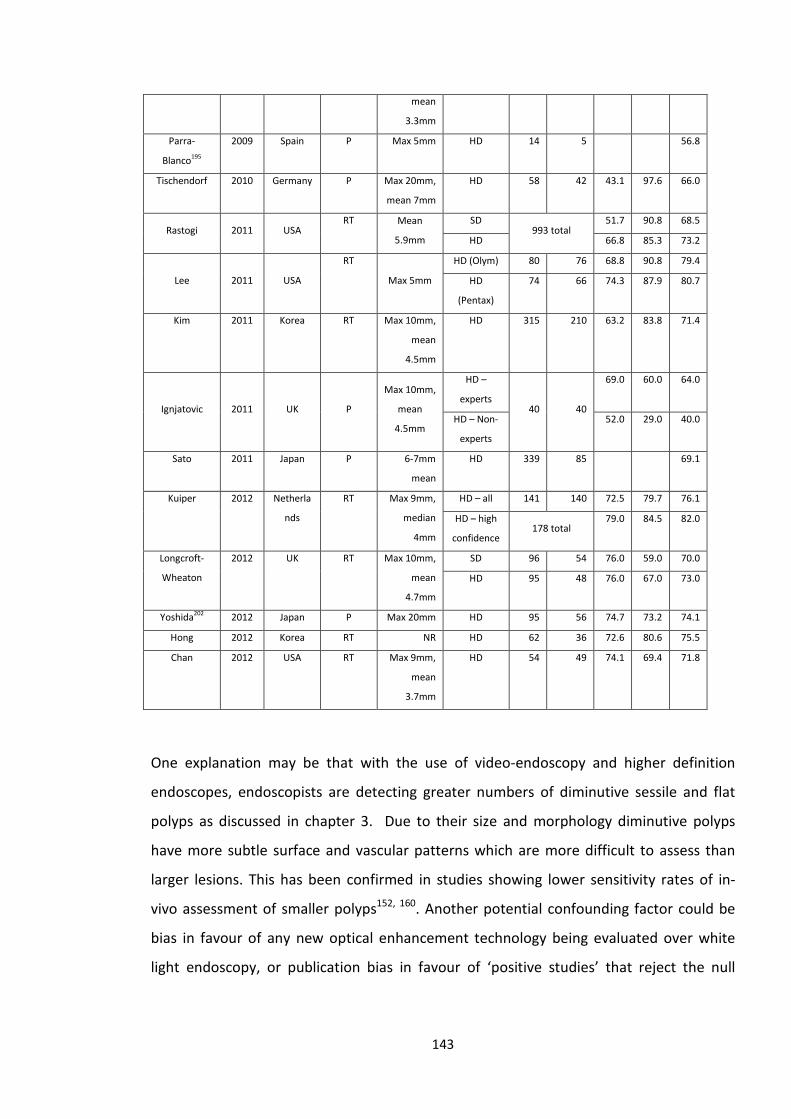
mean
3.3mm
Parra-
Blanco195
2009 Spain P Max 5mm HD 14 5 56.8
Tischendorf 2010 Germany P Max 20mm,
mean 7mm
HD 58 42 43.1 97.6 66.0
Rastogi 2011 USA RT Mean
5.9mm
SD 993 total
51.7 90.8 68.5
HD 66.8 85.3 73.2
Lee 2011 USA
RT Max 5mm
HD (Olym) 80 76 68.8 90.8 79.4
HD
(Pentax)
74 66 74.3 87.9 80.7
Kim 2011 Korea RT Max 10mm,
mean
4.5mm
HD 315 210 63.2 83.8 71.4
Ignjatovic 2011 UK P
Max 10mm,
mean
4.5mm
HD –
experts 40 40
69.0 60.0 64.0
HD – Non-
experts
52.0 29.0 40.0
Sato 2011 Japan P 6-7mm
mean
HD 339 85 69.1
Kuiper 2012 Netherla
nds
RT Max 9mm,
median
4mm
HD – all 141 140 72.5 79.7 76.1
HD – high
confidence 178 total
79.0 84.5 82.0
Longcroft-
Wheaton
2012 UK RT Max 10mm,
mean
4.7mm
SD 96 54 76.0 59.0 70.0
HD 95 48 76.0 67.0 73.0
Yoshida202 2012 Japan P Max 20mm HD 95 56 74.7 73.2 74.1
Hong 2012 Korea RT NR HD 62 36 72.6 80.6 75.5
Chan 2012 USA RT Max 9mm,
mean
3.7mm
HD 54 49 74.1 69.4 71.8
One explanation may be that with the use of video-endoscopy and higher definition
endoscopes, endoscopists are detecting greater numbers of diminutive sessile and flat
polyps as discussed in chapter 3. Due to their size and morphology diminutive polyps
have more subtle surface and vascular patterns which are more difficult to assess than
larger lesions. This has been confirmed in studies showing lower sensitivity rates of in-
vivo assessment of smaller polyps152, 160. Another potential confounding factor could be
bias in favour of any new optical enhancement technology being evaluated over white
light endoscopy, or publication bias in favour of ‘positive studies’ that reject the null
143
hypothesis and therefore demonstrate an advantage of a new technique over white light
endoscopy.
In contrast, this is the first study to demonstrate a diagnostic accuracy in excess of 90%
for the in-vivo characterisation of SCPs using white light endoscopy. This study used
endoscopes with a 1.2 megapixel charge-coupled device and the definition achieved may
be sufficient to make a highly accurate diagnosis. Adenomatous and hyperplastic polyps
are distinguished on the basis of vascular and surface patterns and these results suggest
that these are potentially visible with HDWL endoscopy, thus allowing the endoscopist to
make an accurate assessment. This contrasts conventional thinking regarding white light
endoscopy. As these results have not been reproduced in other studies using lower
definition endoscopes, this may be dependent on using a very high-definition endoscope
(e.g. above 1 megapixel) plus an extended period of training.
However these results with HDWL differ somewhat from previous studies of small and
diminutive colonic polyps using identical processors and 1.2 megapixel endoscopes. Lee
et al155 reported an overall accuracy using HDWL of 80.7% in distinguishing diminutive
adenomas from hyperplastic polyps, compared to an accuracy of 92.4% in this study.
Results from the study by Hong et al160 report that in the analysis of polyps <10 mm the
overall accuracy rate with HDWL was 72.2%.
There are several potential explanations for these results. Firstly the experience of the
endoscopist, and in particular previous experience in vivo diagnostic techniques, is likely
to heavily influence the performance of any new in vivo diagnostic technology. Prior to
commencement of this study an extended period of familiarisation plus development and
validation of a classification system to assess SCPs with i-Scan was carried out. Therefore
when the study was commenced the endoscopist was very familiar with the technology
and was likely to have risen up any learning curve involved. The assessments in this study
were made by a single experienced endoscopist with extensive prior experience in the
field of in vivo characterisation156, 157. The study by Lee et al was performed by a single
experienced endoscopist and the study by Hong et al by 3 experienced endoscopists,
although prior experience of in vivo diagnostic techniques is not reported. Secondly, this
study followed a strict protocol of cleaning all polyps with a fluid flush of water,
144
simethicone and n-acetylcysteine prior to assessment. The use of this solution, to remove
mucus and bubbles, may have improved the HDWL assessment by allowing better
visualisation of surface patterns and vasculature. A third factor which may account for
some of the difference in observed results is that the three studies were carried out in
different populations and therefore the morphology and ease of in vivo assessment of
any polyps encountered may have differed somewhat.
The results reported by Lee et al differ from this study in that they include both high and
low confidence assessments. Again, the study from Hong et al did not restrict the results
to high confidence assessments. In the present study 88% of assessments of SCPs were
made with high confidence. When both high and low confidence assessments of SCPs are
combined, overall accuracy with i-Scan falls from 94.7% to 86.9%, more in keeping with
the result from Lee et al. This would support the ASGE PIVI guidelines that advise that
only polyps for which a high confidence assessment can be made should be managed
based on their optical diagnosis.
This study has limitations; it was carried out in a single centre by a single expert
endoscopist with extensive previous experience of in-vivo diagnosis, and therefore the
study needs to be repeated in other centres and by multiple users with different levels of
experience. As has been discussed in chapter 3, previous studies of in vivo
characterisation techniques in community settings performed by endoscopists who are
not enthusiasts in this field have failed to reproduce the results found in academic
centres219, 221, 226, 235, 254. The HDWL, i-Scan and chromoendoscopy assessments were not
fully independent, as i-Scan and chromoendoscopy assessments were made with prior
knowledge of HDWL and HDWL/i-Scan appearances respectively. However this is more
reflective of a real life situation where polyps are first encountered during white light
endoscopy before additional techniques are used to characterise them further. The study
therefore addresses what additional benefit i-Scan adds to a HDWL assessment and what
benefit chromoendoscopy adds to a combined HDWL/i-Scan assessment.
It can be argued that in vivo assessment may increase the cost and duration of
colonoscopy if endoscopy units were to upgrade equipment from SD to HD. However as
most new endoscope processors are HD quality, and have advanced imaging features,
145
these are likely to become the standard over the next few years. A recent study suggests
that the additional time taken for in vivo assessments is minimal224. Although time for
in vivo assessment was not formally measured in this study, the overall experience was
that the in vivo assessment was performed in the time between finding a polyp and
preparing for polypectomy and did not cause significant delay. If i-Scan were used for
optical diagnosis in daily practice, according to the ASGE PIVI criteria, then the additional
time taken for in vivo assessment may be offset by time saved by avoiding unnecessary
polypectomy of rectosigmoid hyperplastic polyps.
This study was performed with optimised conditions for in vivo assessment; 1) An
extensive period of development and validation of polyp assessment criteria, thus
allowing the endoscopist to ascend the learning curve involved with a new technology 2)
Meticulous cleansing of the polyp surface prior to assessment 3) HD capable endoscope,
processor, connection and monitor 4) An endoscopist experienced in in vivo assessment.
If any of these factors were not present, then such a high level of accuracy may not have
been possible.
The results showed no significant difference in overall accuracy, sensitivity or specificity
between HDWL, i-Scan and chromoendoscopy. This lack of difference could be in part due
to a ceiling effect, given the high performance achieved with HDWL. The confidence
assessment assigned to each polyp was based on the overall assessment made with
HDWL followed by i-Scan and chromoendoscopy and therefore it is possible that fewer
high confidence assessments might be made using HDWL alone. This may also be heavily
influenced by the experience of the endoscopist. In different settings use of i-Scan may
show significant improvement in accuracy over HDWL alone. Therefore, whether in vivo
characterisation with HDWL alone is applicable to the wider endoscopy community
remains to be seen and should be the focus of further studies.
146
Chapter 6 - Comparison between standard definition and high definition endoscopy for the detection of colonic polyps in the UK Bowel Cancer Screening Programme
6.1 Introduction
As set out in chapter 2 one of the key quality indicators of colonoscopy is the adenoma
detection rate. An individual endoscopist’s ADR correlates with risk of interval colorectal
cancer (CRC) for patients in whom they perform colonoscopy40, 82. Patients who undergo
a colonoscopy performed by an endoscopist with a high ADR have a significantly lower
risk of interval CRC than those whose procedure is performed by an endoscopist with low
ADR40, 82. The same is true of advanced CRC and CRC-related death82.
Thus many studies have examined various methods for improving ADR including bowel
preparation quality85-88, withdrawal time91-94, position changes100-102,
chromoendoscopy126-130, advanced imaging148, 161 and use of antispasmodics95, 96.
Steady improvements in the definition or pixel density of endoscopes have taken place in
recent years. The majority of modern endoscopes now produce a high definition (HD)
output and are supplied with HD quality monitors. Older standard definition (SD)
endoscopes have been defined as those with fewer than 650 vertical pixels and high
definition as greater than 650 vertical pixels259. This improvement in endoscope definition
has been proposed as a possible method of improving adenoma detection rates.
Several studies have compared the ADR in colonoscopy performed with standard
definition endoscopes compared to that using HD endoscopes218, 260-265 – see table 36. Of
7 studies, 6 have shown no significant difference in ADR between SD and HD endoscopes,
although the majority have shown a trend towards higher ADR using HD endoscopes. The
largest study to date by Buchner et al involving 2430 patients did show a significantly
higher ADR in the HD cohort262. A meta-analysis examining 5 of these 7 studies did find a
significantly higher ADR with HD endoscopy compared to SD endoscopy266. The pooled
incremental yield with HD endoscopes was 3.5%, with a number need to treat to detect
147
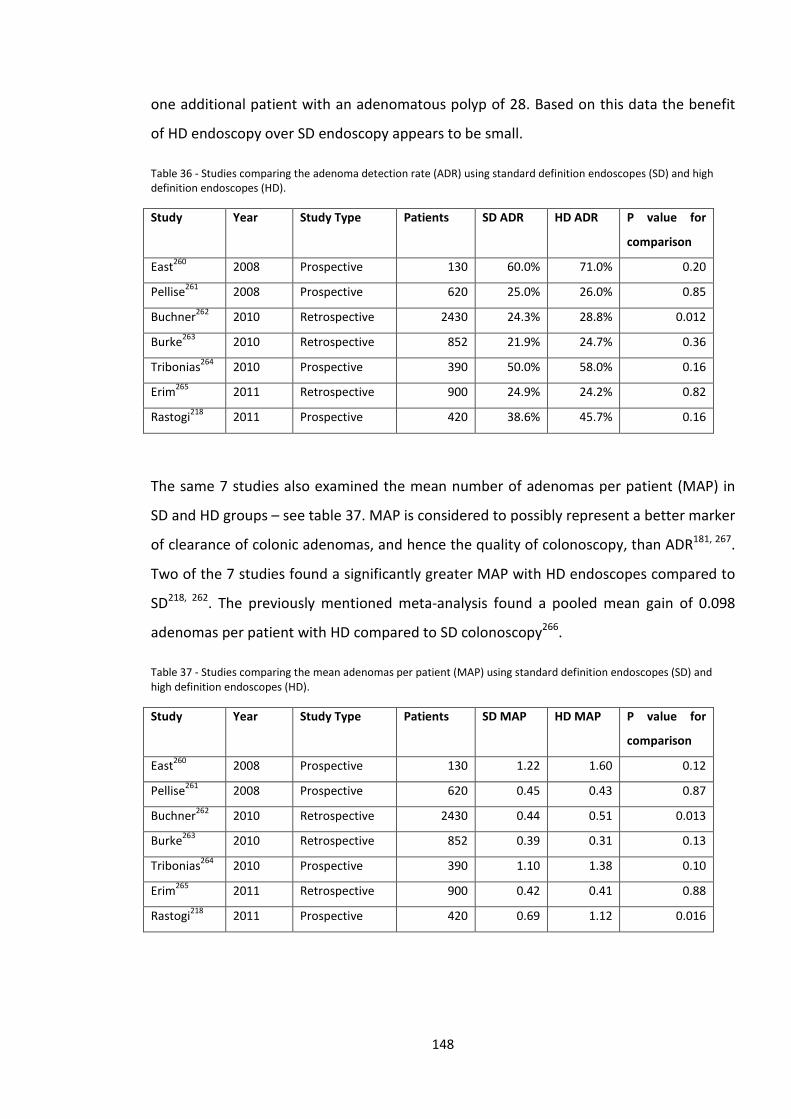
one additional patient with an adenomatous polyp of 28. Based on this data the benefit
of HD endoscopy over SD endoscopy appears to be small.
Table 36 - Studies comparing the adenoma detection rate (ADR) using standard definition endoscopes (SD) and high definition endoscopes (HD).
Study Year Study Type Patients SD ADR HD ADR P value for
comparison
East260 2008 Prospective 130 60.0% 71.0% 0.20
Pellise261 2008 Prospective 620 25.0% 26.0% 0.85
Buchner262 2010 Retrospective 2430 24.3% 28.8% 0.012
Burke263 2010 Retrospective 852 21.9% 24.7% 0.36
Tribonias264 2010 Prospective 390 50.0% 58.0% 0.16
Erim265 2011 Retrospective 900 24.9% 24.2% 0.82
Rastogi218 2011 Prospective 420 38.6% 45.7% 0.16
The same 7 studies also examined the mean number of adenomas per patient (MAP) in
SD and HD groups – see table 37. MAP is considered to possibly represent a better marker
of clearance of colonic adenomas, and hence the quality of colonoscopy, than ADR181, 267.
Two of the 7 studies found a significantly greater MAP with HD endoscopes compared to
SD218, 262. The previously mentioned meta-analysis found a pooled mean gain of 0.098
adenomas per patient with HD compared to SD colonoscopy266.
Table 37 - Studies comparing the mean adenomas per patient (MAP) using standard definition endoscopes (SD) and high definition endoscopes (HD).
Study Year Study Type Patients SD MAP HD MAP P value for
comparison
East260 2008 Prospective 130 1.22 1.60 0.12
Pellise261 2008 Prospective 620 0.45 0.43 0.87
Buchner262 2010 Retrospective 2430 0.44 0.51 0.013
Burke263 2010 Retrospective 852 0.39 0.31 0.13
Tribonias264 2010 Prospective 390 1.10 1.38 0.10
Erim265 2011 Retrospective 900 0.42 0.41 0.88
Rastogi218 2011 Prospective 420 0.69 1.12 0.016
148
The UK BCSP aims to screen the entire population aged 60-75 years with biennial faecal
occult blood testing, with colonoscopy offered to those participants with a strongly
positive FOBt. As this is an enriched population there is a high prevalence of colonic
neoplasia in participants who proceed to colonoscopy. To date no studies have addressed
whether the use of high definition endoscopy in the UK BCSP population improves ADR or
MAP.
6.2 Aims
The aim of this study was to compare the number of polyps found in patients who
underwent colonoscopy using standard definition colonoscopes and high definition
colonoscopes in the UK BCSP.
6.3 Outcome Measures
The primary outcome measures were adenoma detection rate and mean number of
adenomas per patient.
Secondary outcome measures were polyp detection rate, mean number of polyps per
patient, diminutive adenoma and polyp detection rates, proximal colon adenoma
detection rate, proximal colon serrated polyp detection rate and advanced adenoma
detection rate.
Diminutive polyps/adenomas and lesions found in the proximal colon were chosen in
particular as these lesions are often more subtle, and hence may in theory be missed
during standard definition endoscopy.
6.4 Power calculations
Overall ADR was assumed to be 46% based on the national average in the UK BCSP. To
detect a relative increase in ADR of 15% (absolute increase 6.9%) between SD and HD
groups with a significance level of 5% and power (1-β) of 80% would require 1642
149
patients in total (821 per group). Sample size was increased by 5% to allow for exclusions
resulting in a final sample size of 1724.
6.5 Definitions
Adenoma detection rate (ADR) was defined at the percentage of patients with one or
more adenomatous polyps detected.
Polyp detection rate (PDR) was defined as the percentage of patients with one or more
polyps detected.
The proximal colon was defined as that proximal to the splenic flexure.
Diminutive adenomas/polyps were defined as those ≤5mm in size.
Advanced adenomas were defined as those ≥10mm in size and/or containing high grade
dysplasia or cancer.
There is no universal definition of what constitutes an SD or HD endoscope. For the
purposes of this study, SD endoscopes were defined as those with up to 500,000 pixels
and HD endoscopes were defined as those with >500,000 pixels. This is in line with a
recent technology status evaluation report on HD endoscopes published by the ASGE259.
Standard definition endoscope models used:-
• Olympus CFQ260DL
• Fujinon EC530WL
High definition endoscope models used:-
• Fujinon EC530FL
• Fujinon EC530ZW
• Pentax EC-3890Li
• Pentax i90
150
6.6 Exclusion criteria
Cases were excluded for the following reasons:-
• The definition of endoscope used was not recorded or could not be reliably
determined
• Two different endoscopes were used to complete the procedure (eg scope failure
mid-procedure)
• Inflammatory bowel disease
• Polyposis syndrome
• Incomplete colonoscopy (failure to achieve caecal intubation)
• Previous colonic surgery
6.7 Ethical considerations
This project was deemed to be a retrospective service evaluation and hence formal ethics
committee approval was not sought. All patient data was anonymised with no patient
identifiable information was collected. Data was kept in a secure password protected
electronic database.
6.8 Methods
Consecutive BSCP colonoscopy cases performed at Portsmouth Hospitals NHS Trust were
identified from the local BCSP online database. A total of 1724 consecutive cases were
identified for the period February 2009 – December 2012. Data on patient age, gender,
bowel preparation quality, polyp size, location and histology and endoscopist was
extracted from the database.
All procedures were performed by 3 experienced BCS colonoscopists who had undergone
an accreditation process including a formal assessment of knowledge and competence in
colonoscopy and polypectomy technique. Each had experience of over 5000
colonoscopies.
151
All endoscopes used within the endoscopy department are marked with a unique
reference number. This reference number can be used to identify the make and model of
endoscope. When a BCSP colonoscopy is performed, the endoscope reference number is
recorded in both the BCSP online database and a separate logbook in each endoscopy
suite. Both the BCSP database and suite logbooks were checked to establish the model of
endoscope used for each procedure. Any cases where the endoscope reference numbers
did not match or were not recorded in either location were excluded (unknown definition
of endoscope).
Of the initial 1724 cases identified, 92 cases were excluded for the following reasons; two
different endoscopes used during procedure (n=40), unknown definition of endoscope
(n=23), incomplete procedure (n=15), diagnosis of colitis (n=13) and previous colonic
surgery (n=1). This left 1632 cases for the main analysis.
6.9 Statistics
Baseline characteristics of the SD and HD groups were compared using the independent
samples t-test for continuous variables and Fisher’s exact test or Pearson’s Chi-squared
test for categorical variables.
Differences in categorical outcomes (ADR, PDR, Diminutive adenoma detection rate
(DimADR), proximal adenoma detection rate (ProxADR), proximal serrated polyp
detection rate (ProxSerrDR) and advanced adenoma detection rate (AdvADR)) were
examined using the Fisher’s exact test or Pearson’s Chi-squared test for categorical
predictor variables (gender, age, endoscopist, bowel preparation quality, endoscope
definition). Patient age was divided into 4 equal quartiles to aid calculation of results.
Differences in the mean number of adenomas per patient according to independent
variables were calculated using the Mann-Whitney U test or Kruskal-Wallis test for
152
categorical independent variables (gender, endoscopist, bowel preparation quality and
endoscope definition) and using Pearson’s correlation for subject age.
To minimise confounding variables stepwise binary logistic regression was performed
using the following factors – gender, age quartile, endoscopist, bowel preparation quality
and endoscope definition. Six different models of different binary dependent variables
were created (≥1 adenoma, ≥1 polyp, ≥1 diminutive adenoma, ≥1 proximal colonic
adenoma, ≥1 proximal serrated polyp and ≥1 advanced adenoma). Odds ratios were
calculated with 95% confidence intervals. Bowel preparation quality was excluded as an
independent variable from the model for proximal serrated polyp detection as no
proximal serrated polyps were found in the ‘inadequate’ prep group.
A p value of <0.05 was considered statistically significant for all calculations. All reported
p values are 2-sided.
6.10 Results
6.10.1 Baseline demographics
787 cases were included in the SD group and 845 in the HD group.
Table 38 shows the main characteristics of the two groups. No significant differences
were found between the SD and HD groups in terms of age, gender or bowel preparation
quality. However there was a significant difference in the proportion of procedures
performed using SD/HD endoscopes between endoscopists. Endoscopist C performed a
greater proportion of their procedures using HD endoscopes than endoscopists A or B.
153
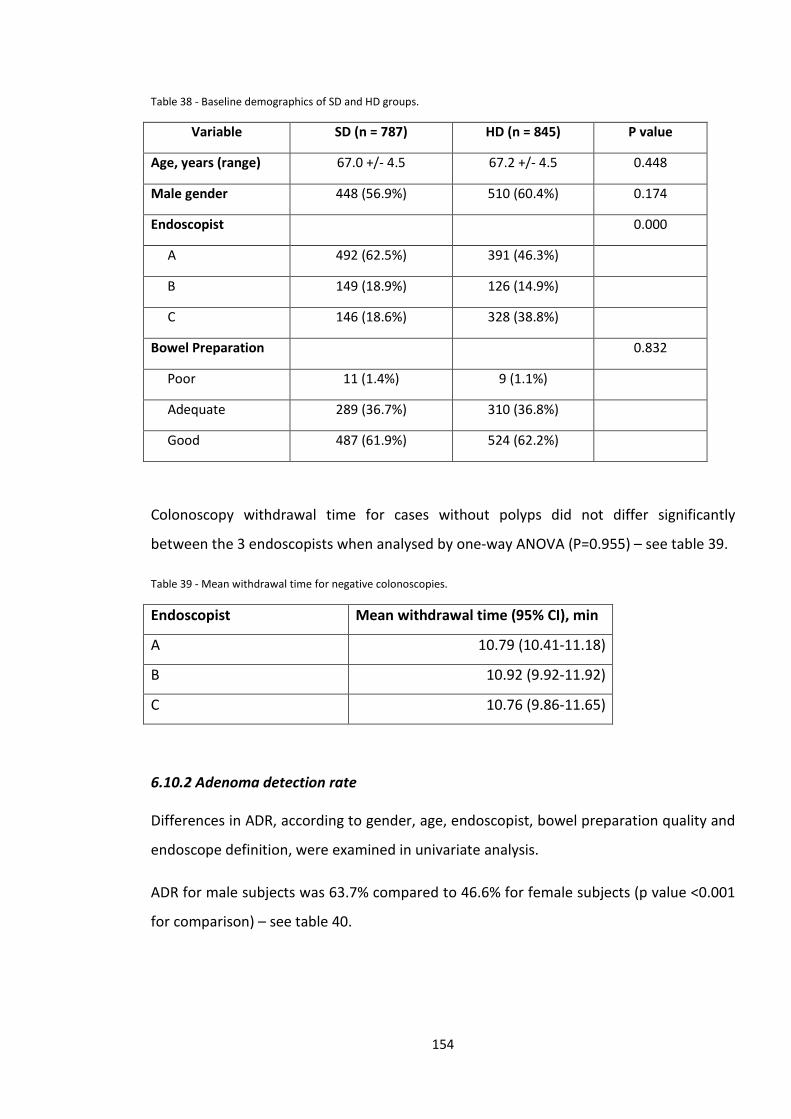
Table 38 - Baseline demographics of SD and HD groups.
Variable SD (n = 787) HD (n = 845) P value
Age, years (range) 67.0 +/- 4.5 67.2 +/- 4.5 0.448
Male gender 448 (56.9%) 510 (60.4%) 0.174
Endoscopist 0.000
A 492 (62.5%) 391 (46.3%)
B 149 (18.9%) 126 (14.9%)
C 146 (18.6%) 328 (38.8%)
Bowel Preparation 0.832
Poor 11 (1.4%) 9 (1.1%)
Adequate 289 (36.7%) 310 (36.8%)
Good 487 (61.9%) 524 (62.2%)
Colonoscopy withdrawal time for cases without polyps did not differ significantly
between the 3 endoscopists when analysed by one-way ANOVA (P=0.955) – see table 39.
Table 39 - Mean withdrawal time for negative colonoscopies.
Endoscopist Mean withdrawal time (95% CI), min
A 10.79 (10.41-11.18)
B 10.92 (9.92-11.92)
C 10.76 (9.86-11.65)
6.10.2 Adenoma detection rate
Differences in ADR, according to gender, age, endoscopist, bowel preparation quality and
endoscope definition, were examined in univariate analysis.
ADR for male subjects was 63.7% compared to 46.6% for female subjects (p value <0.001
for comparison) – see table 40.
154
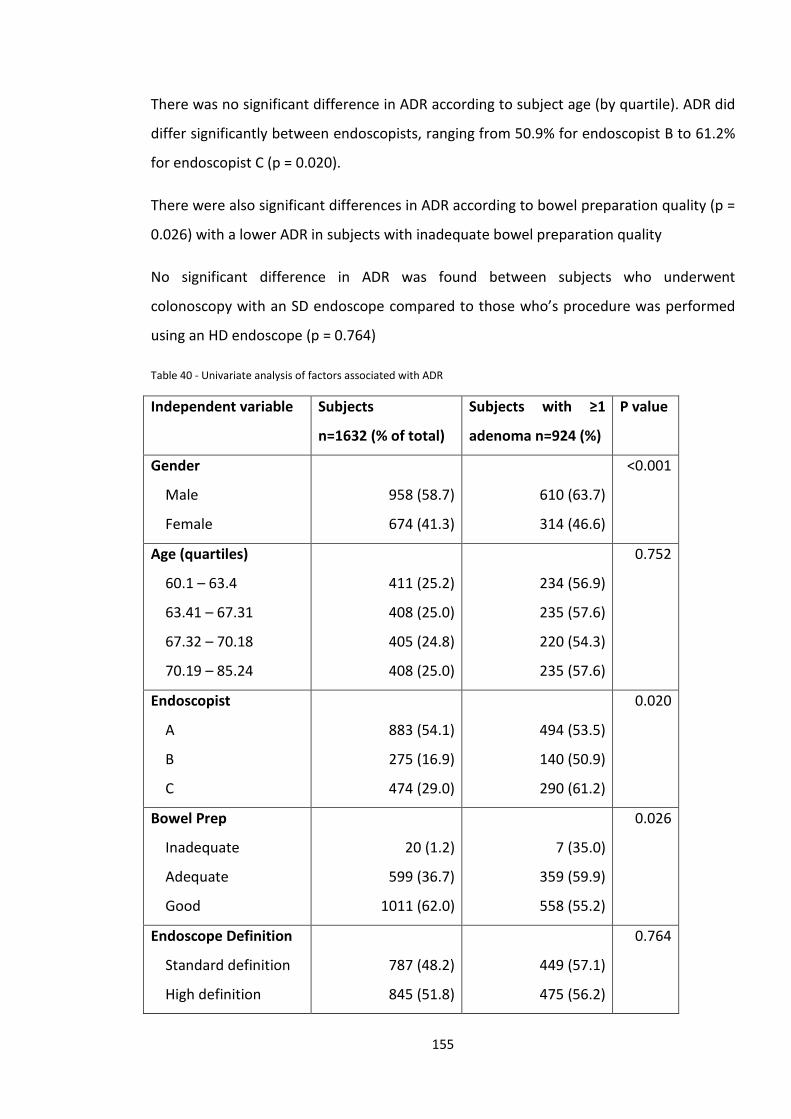
There was no significant difference in ADR according to subject age (by quartile). ADR did
differ significantly between endoscopists, ranging from 50.9% for endoscopist B to 61.2%
for endoscopist C (p = 0.020).
There were also significant differences in ADR according to bowel preparation quality (p =
0.026) with a lower ADR in subjects with inadequate bowel preparation quality
No significant difference in ADR was found between subjects who underwent
colonoscopy with an SD endoscope compared to those who’s procedure was performed
using an HD endoscope (p = 0.764)
Table 40 - Univariate analysis of factors associated with ADR
Independent variable Subjects
n=1632 (% of total)
Subjects with ≥1
adenoma n=924 (%)
P value
Gender
Male
Female
958 (58.7)
674 (41.3)
610 (63.7)
314 (46.6)
<0.001
Age (quartiles)
60.1 – 63.4
63.41 – 67.31
67.32 – 70.18
70.19 – 85.24
411 (25.2)
408 (25.0)
405 (24.8)
408 (25.0)
234 (56.9)
235 (57.6)
220 (54.3)
235 (57.6)
0.752
Endoscopist
A
B
C
883 (54.1)
275 (16.9)
474 (29.0)
494 (53.5)
140 (50.9)
290 (61.2)
0.020
Bowel Prep
Inadequate
Adequate
Good
20 (1.2)
599 (36.7)
1011 (62.0)
7 (35.0)
359 (59.9)
558 (55.2)
0.026
Endoscope Definition
Standard definition
High definition
787 (48.2)
845 (51.8)
449 (57.1)
475 (56.2)
0.764
155
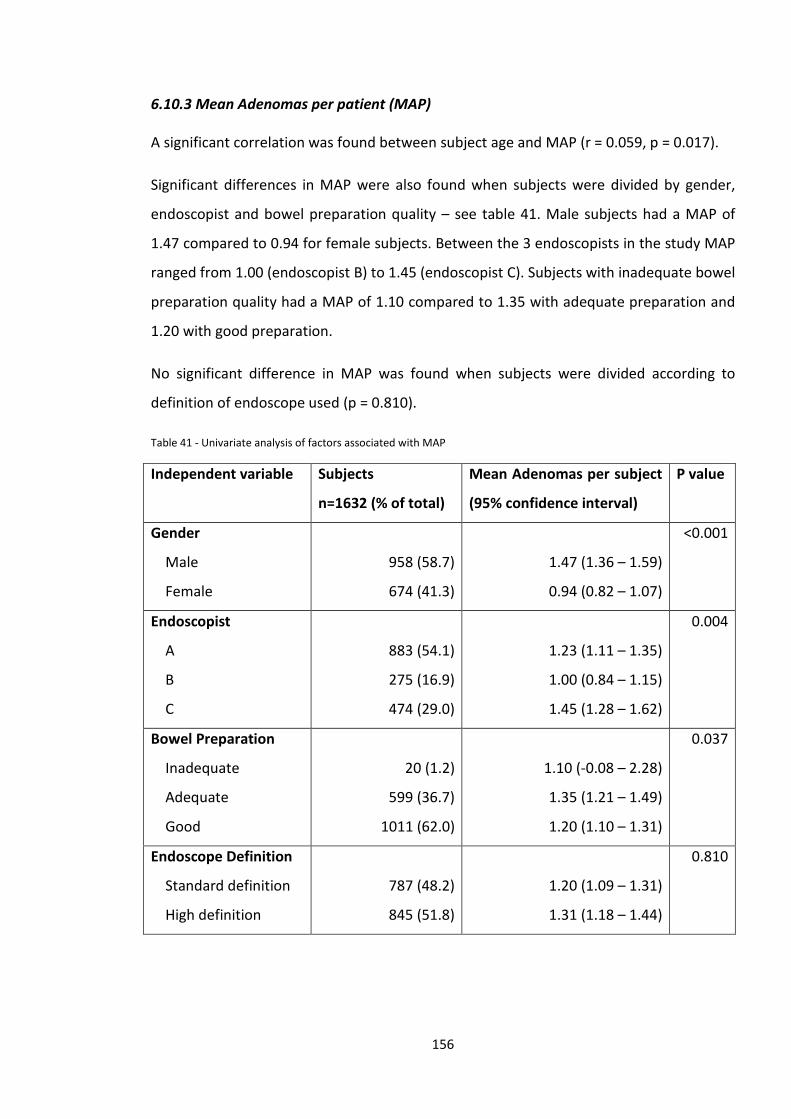
6.10.3 Mean Adenomas per patient (MAP)
A significant correlation was found between subject age and MAP (r = 0.059, p = 0.017).
Significant differences in MAP were also found when subjects were divided by gender,
endoscopist and bowel preparation quality – see table 41. Male subjects had a MAP of
1.47 compared to 0.94 for female subjects. Between the 3 endoscopists in the study MAP
ranged from 1.00 (endoscopist B) to 1.45 (endoscopist C). Subjects with inadequate bowel
preparation quality had a MAP of 1.10 compared to 1.35 with adequate preparation and
1.20 with good preparation.
No significant difference in MAP was found when subjects were divided according to
definition of endoscope used (p = 0.810).
Table 41 - Univariate analysis of factors associated with MAP
Independent variable Subjects
n=1632 (% of total)
Mean Adenomas per subject
(95% confidence interval)
P value
Gender
Male
Female
958 (58.7)
674 (41.3)
1.47 (1.36 – 1.59)
0.94 (0.82 – 1.07)
<0.001
Endoscopist
A
B
C
883 (54.1)
275 (16.9)
474 (29.0)
1.23 (1.11 – 1.35)
1.00 (0.84 – 1.15)
1.45 (1.28 – 1.62)
0.004
Bowel Preparation
Inadequate
Adequate
Good
20 (1.2)
599 (36.7)
1011 (62.0)
1.10 (-0.08 – 2.28)
1.35 (1.21 – 1.49)
1.20 (1.10 – 1.31)
0.037
Endoscope Definition
Standard definition
High definition
787 (48.2)
845 (51.8)
1.20 (1.09 – 1.31)
1.31 (1.18 – 1.44)
0.810
156
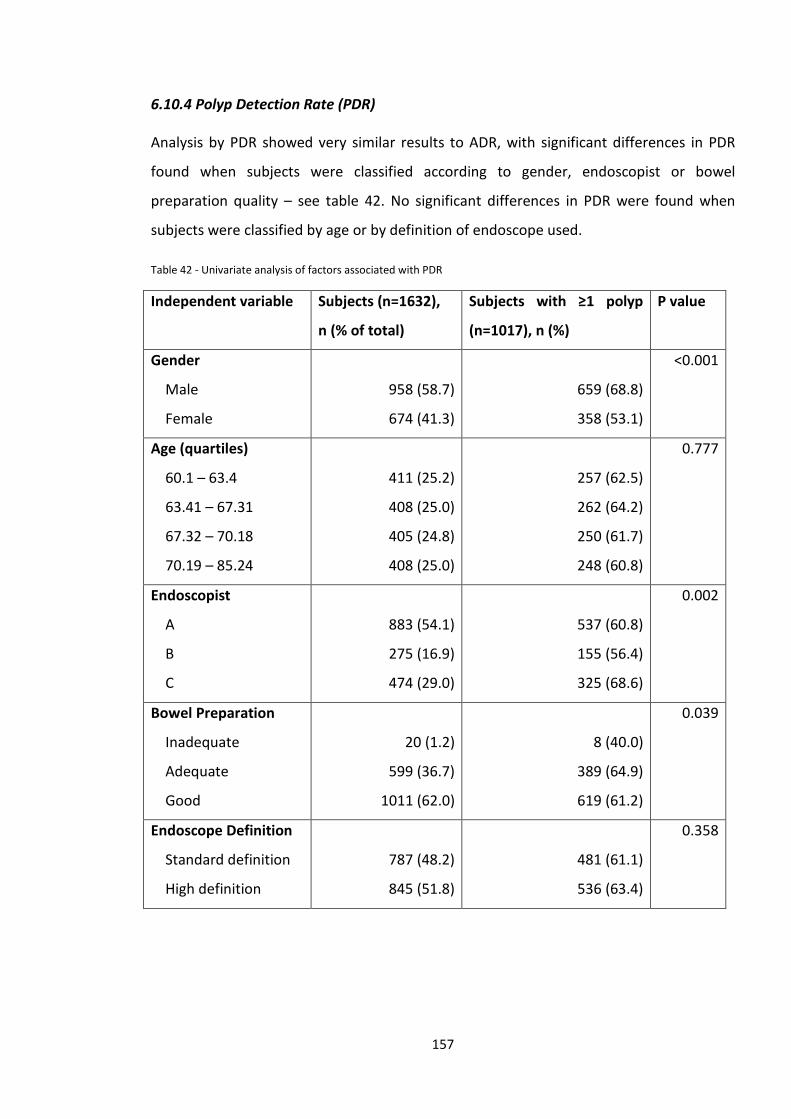
6.10.4 Polyp Detection Rate (PDR)
Analysis by PDR showed very similar results to ADR, with significant differences in PDR
found when subjects were classified according to gender, endoscopist or bowel
preparation quality – see table 42. No significant differences in PDR were found when
subjects were classified by age or by definition of endoscope used.
Table 42 - Univariate analysis of factors associated with PDR
Independent variable Subjects (n=1632),
n (% of total)
Subjects with ≥1 polyp
(n=1017), n (%)
P value
Gender
Male
Female
958 (58.7)
674 (41.3)
659 (68.8)
358 (53.1)
<0.001
Age (quartiles)
60.1 – 63.4
63.41 – 67.31
67.32 – 70.18
70.19 – 85.24
411 (25.2)
408 (25.0)
405 (24.8)
408 (25.0)
257 (62.5)
262 (64.2)
250 (61.7)
248 (60.8)
0.777
Endoscopist
A
B
C
883 (54.1)
275 (16.9)
474 (29.0)
537 (60.8)
155 (56.4)
325 (68.6)
0.002
Bowel Preparation
Inadequate
Adequate
Good
20 (1.2)
599 (36.7)
1011 (62.0)
8 (40.0)
389 (64.9)
619 (61.2)
0.039
Endoscope Definition
Standard definition
High definition
787 (48.2)
845 (51.8)
481 (61.1)
536 (63.4)
0.358
157
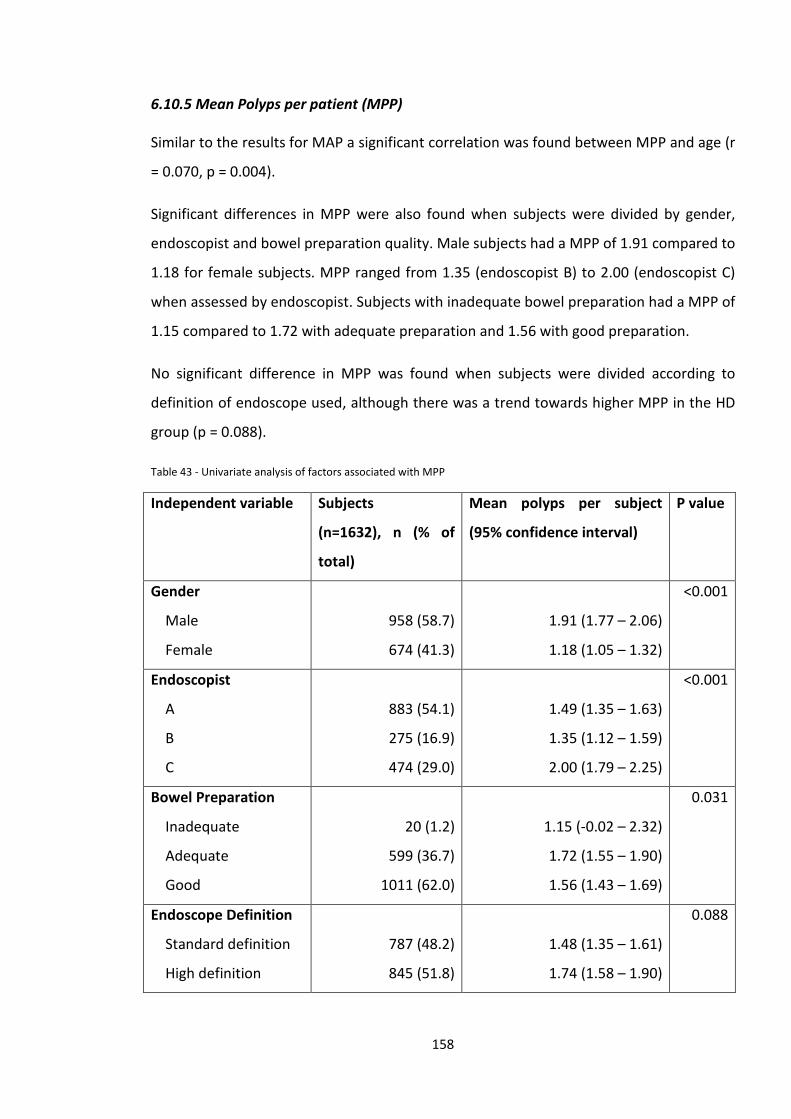
6.10.5 Mean Polyps per patient (MPP)
Similar to the results for MAP a significant correlation was found between MPP and age (r
= 0.070, p = 0.004).
Significant differences in MPP were also found when subjects were divided by gender,
endoscopist and bowel preparation quality. Male subjects had a MPP of 1.91 compared to
1.18 for female subjects. MPP ranged from 1.35 (endoscopist B) to 2.00 (endoscopist C)
when assessed by endoscopist. Subjects with inadequate bowel preparation had a MPP of
1.15 compared to 1.72 with adequate preparation and 1.56 with good preparation.
No significant difference in MPP was found when subjects were divided according to
definition of endoscope used, although there was a trend towards higher MPP in the HD
group (p = 0.088).
Table 43 - Univariate analysis of factors associated with MPP
Independent variable Subjects
(n=1632), n (% of
total)
Mean polyps per subject
(95% confidence interval)
P value
Gender
Male
Female
958 (58.7)
674 (41.3)
1.91 (1.77 – 2.06)
1.18 (1.05 – 1.32)
<0.001
Endoscopist
A
B
C
883 (54.1)
275 (16.9)
474 (29.0)
1.49 (1.35 – 1.63)
1.35 (1.12 – 1.59)
2.00 (1.79 – 2.25)
<0.001
Bowel Preparation
Inadequate
Adequate
Good
20 (1.2)
599 (36.7)
1011 (62.0)
1.15 (-0.02 – 2.32)
1.72 (1.55 – 1.90)
1.56 (1.43 – 1.69)
0.031
Endoscope Definition
Standard definition
High definition
787 (48.2)
845 (51.8)
1.48 (1.35 – 1.61)
1.74 (1.58 – 1.90)
0.088
158
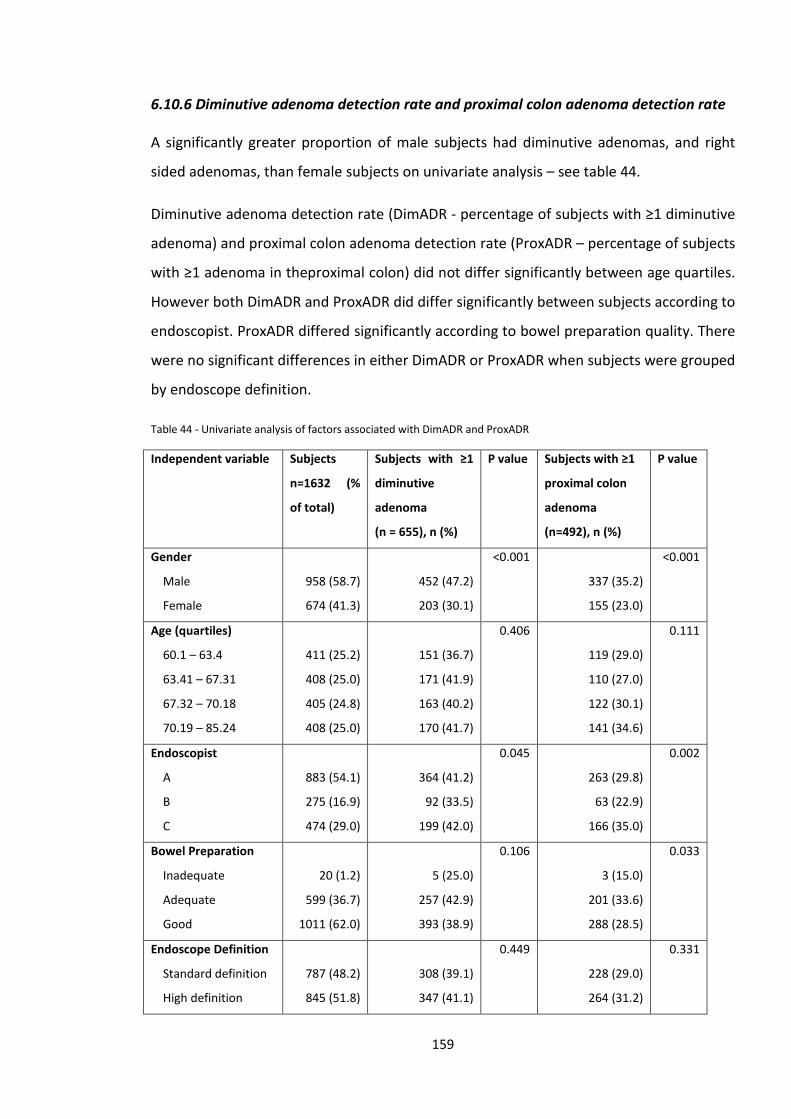
6.10.6 Diminutive adenoma detection rate and proximal colon adenoma detection rate
A significantly greater proportion of male subjects had diminutive adenomas, and right
sided adenomas, than female subjects on univariate analysis – see table 44.
Diminutive adenoma detection rate (DimADR - percentage of subjects with ≥1 diminutive
adenoma) and proximal colon adenoma detection rate (ProxADR – percentage of subjects
with ≥1 adenoma in theproximal colon) did not differ significantly between age quartiles.
However both DimADR and ProxADR did differ significantly between subjects according to
endoscopist. ProxADR differed significantly according to bowel preparation quality. There
were no significant differences in either DimADR or ProxADR when subjects were grouped
by endoscope definition.
Table 44 - Univariate analysis of factors associated with DimADR and ProxADR
Independent variable Subjects
n=1632 (%
of total)
Subjects with ≥1
diminutive
adenoma
(n = 655), n (%)
P value Subjects with ≥1
proximal colon
adenoma
(n=492), n (%)
P value
Gender
Male
Female
958 (58.7)
674 (41.3)
452 (47.2)
203 (30.1)
<0.001
337 (35.2)
155 (23.0)
<0.001
Age (quartiles)
60.1 – 63.4
63.41 – 67.31
67.32 – 70.18
70.19 – 85.24
411 (25.2)
408 (25.0)
405 (24.8)
408 (25.0)
151 (36.7)
171 (41.9)
163 (40.2)
170 (41.7)
0.406
119 (29.0)
110 (27.0)
122 (30.1)
141 (34.6)
0.111
Endoscopist
A
B
C
883 (54.1)
275 (16.9)
474 (29.0)
364 (41.2)
92 (33.5)
199 (42.0)
0.045
263 (29.8)
63 (22.9)
166 (35.0)
0.002
Bowel Preparation
Inadequate
Adequate
Good
20 (1.2)
599 (36.7)
1011 (62.0)
5 (25.0)
257 (42.9)
393 (38.9)
0.106
3 (15.0)
201 (33.6)
288 (28.5)
0.033
Endoscope Definition
Standard definition
High definition
787 (48.2)
845 (51.8)
308 (39.1)
347 (41.1)
0.449
228 (29.0)
264 (31.2)
0.331
159
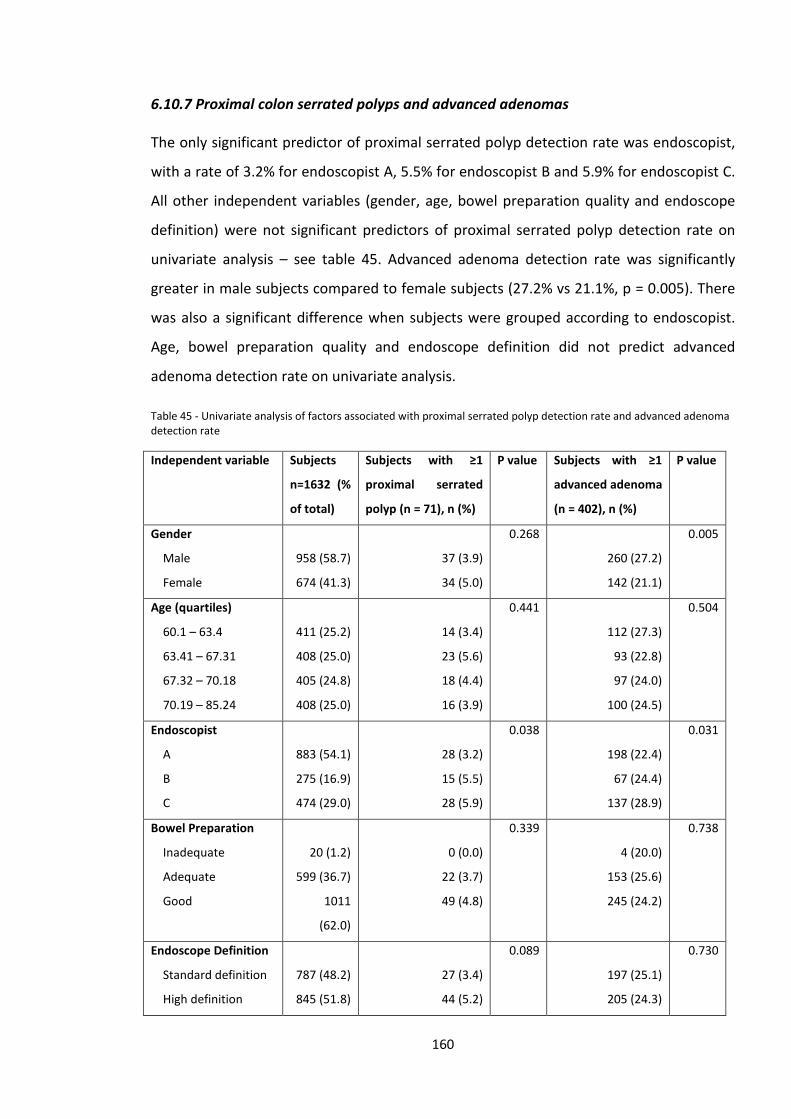
6.10.7 Proximal colon serrated polyps and advanced adenomas
The only significant predictor of proximal serrated polyp detection rate was endoscopist,
with a rate of 3.2% for endoscopist A, 5.5% for endoscopist B and 5.9% for endoscopist C.
All other independent variables (gender, age, bowel preparation quality and endoscope
definition) were not significant predictors of proximal serrated polyp detection rate on
univariate analysis – see table 45. Advanced adenoma detection rate was significantly
greater in male subjects compared to female subjects (27.2% vs 21.1%, p = 0.005). There
was also a significant difference when subjects were grouped according to endoscopist.
Age, bowel preparation quality and endoscope definition did not predict advanced
adenoma detection rate on univariate analysis.
Table 45 - Univariate analysis of factors associated with proximal serrated polyp detection rate and advanced adenoma detection rate
Independent variable Subjects
n=1632 (%
of total)
Subjects with ≥1
proximal serrated
polyp (n = 71), n (%)
P value Subjects with ≥1
advanced adenoma
(n = 402), n (%)
P value
Gender
Male
Female
958 (58.7)
674 (41.3)
37 (3.9)
34 (5.0)
0.268
260 (27.2)
142 (21.1)
0.005
Age (quartiles)
60.1 – 63.4
63.41 – 67.31
67.32 – 70.18
70.19 – 85.24
411 (25.2)
408 (25.0)
405 (24.8)
408 (25.0)
14 (3.4)
23 (5.6)
18 (4.4)
16 (3.9)
0.441
112 (27.3)
93 (22.8)
97 (24.0)
100 (24.5)
0.504
Endoscopist
A
B
C
883 (54.1)
275 (16.9)
474 (29.0)
28 (3.2)
15 (5.5)
28 (5.9)
0.038
198 (22.4)
67 (24.4)
137 (28.9)
0.031
Bowel Preparation
Inadequate
Adequate
Good
20 (1.2)
599 (36.7)
1011
(62.0)
0 (0.0)
22 (3.7)
49 (4.8)
0.339
4 (20.0)
153 (25.6)
245 (24.2)
0.738
Endoscope Definition
Standard definition
High definition
787 (48.2)
845 (51.8)
27 (3.4)
44 (5.2)
0.089
197 (25.1)
205 (24.3)
0.730
160
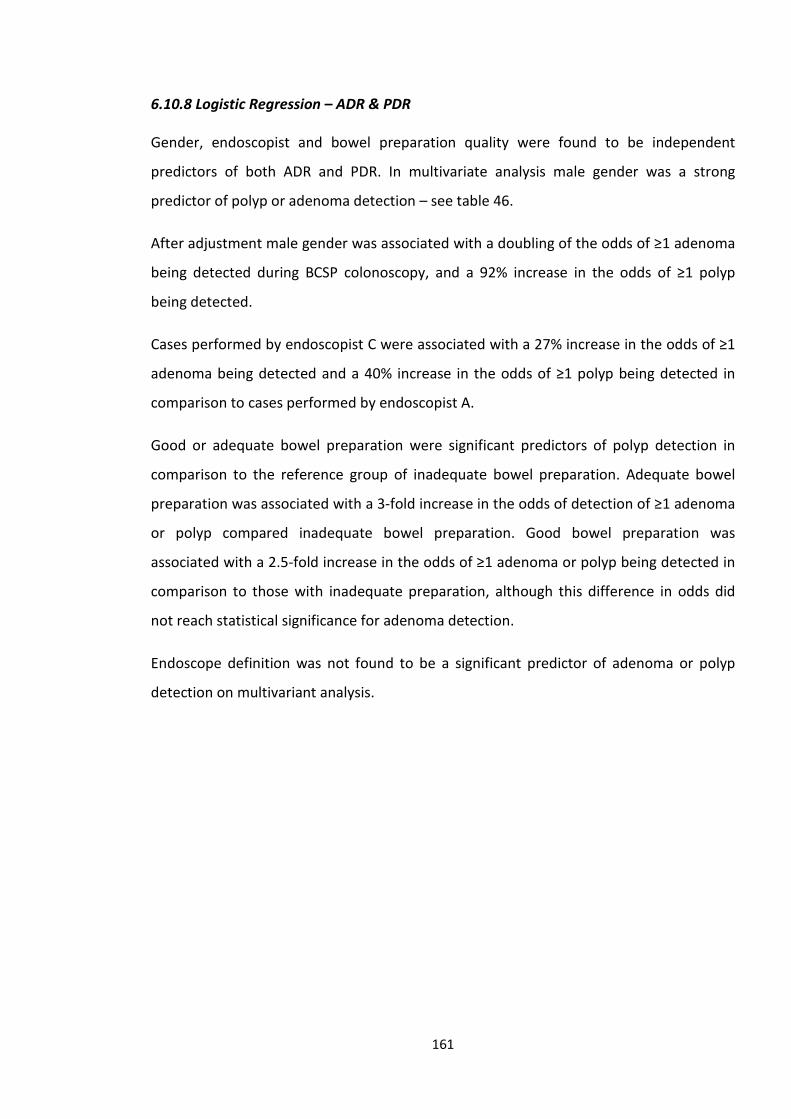
6.10.8 Logistic Regression – ADR & PDR
Gender, endoscopist and bowel preparation quality were found to be independent
predictors of both ADR and PDR. In multivariate analysis male gender was a strong
predictor of polyp or adenoma detection – see table 46.
After adjustment male gender was associated with a doubling of the odds of ≥1 adenoma
being detected during BCSP colonoscopy, and a 92% increase in the odds of ≥1 polyp
being detected.
Cases performed by endoscopist C were associated with a 27% increase in the odds of ≥1
adenoma being detected and a 40% increase in the odds of ≥1 polyp being detected in
comparison to cases performed by endoscopist A.
Good or adequate bowel preparation were significant predictors of polyp detection in
comparison to the reference group of inadequate bowel preparation. Adequate bowel
preparation was associated with a 3-fold increase in the odds of detection of ≥1 adenoma
or polyp compared inadequate bowel preparation. Good bowel preparation was
associated with a 2.5-fold increase in the odds of ≥1 adenoma or polyp being detected in
comparison to those with inadequate preparation, although this difference in odds did
not reach statistical significance for adenoma detection.
Endoscope definition was not found to be a significant predictor of adenoma or polyp
detection on multivariant analysis.
161
Table 46 - Multivariant analysis of independent variables associated with ADR and PDR.
Independent variable Adjusted Odds Ratio
≥1 adenoma (95%
confidence interval)
P value Adjusted Odds Ratio
≥1 polyp (95%
confidence interval)
P value
Gender
Female
Male
1.00
2.00 (1.64-2.45)
<0.001
1.00
1.92 (1.57-2.36)
<0.001
Age (quartiles)
60.1 – 63.4
63.41 – 67.31
67.32 – 70.18
70.19 – 85.24
1.00
0.97 (0.73-1.29)
0.91 (0.68-1.20)
1.06 (0.80-1.410
0.854
0.502
0.693
1.00
1.01 (0.75-1.35)
0.97 (0.73-1.30)
0.95 (0.72-1.27)
0.963
0.840
0.750
Endoscopist
A
B
C
1.00
0.85 (0.64-1.12)
1.27 (1.00-1.61)
0.237
0.050
1.00
0.86 (0.65-1.14)
1.40 (1.10-1.79)
0.294
0.007
Bowel Preparation
Inadequate
Adequate
Good
1.00
2.86 (1.11-7.39)
2.52 (0.98-6.47)
0.030
0.056
1.00
2.76 (1.09-6.97)
2.53 (1.01-6.36)
0.032
0.048
Endoscope Definition
Standard definition
High definition
1.00
0.90 (0.73-1.10)
0.302
1.00
1.01 (0.82-1.24)
0.950
6.10.9 Logisitic Regression – DimADR & ProxADR
Significant predictors of diminutive adenoma detection were male sex, and endoscopist –
see table 47. Male gender was associated with double the odds of detecting at least one
diminutive adenoma. Cases performed by endoscopist B were associated with a 27%
decrease in the odds of diminutive adenoma detection in comparison to cases performed
by endoscopist A.
Age, bowel preparation quality and endoscope definition were not found to be significant
predictors of detection of ≥1 diminutive adenoma.
162
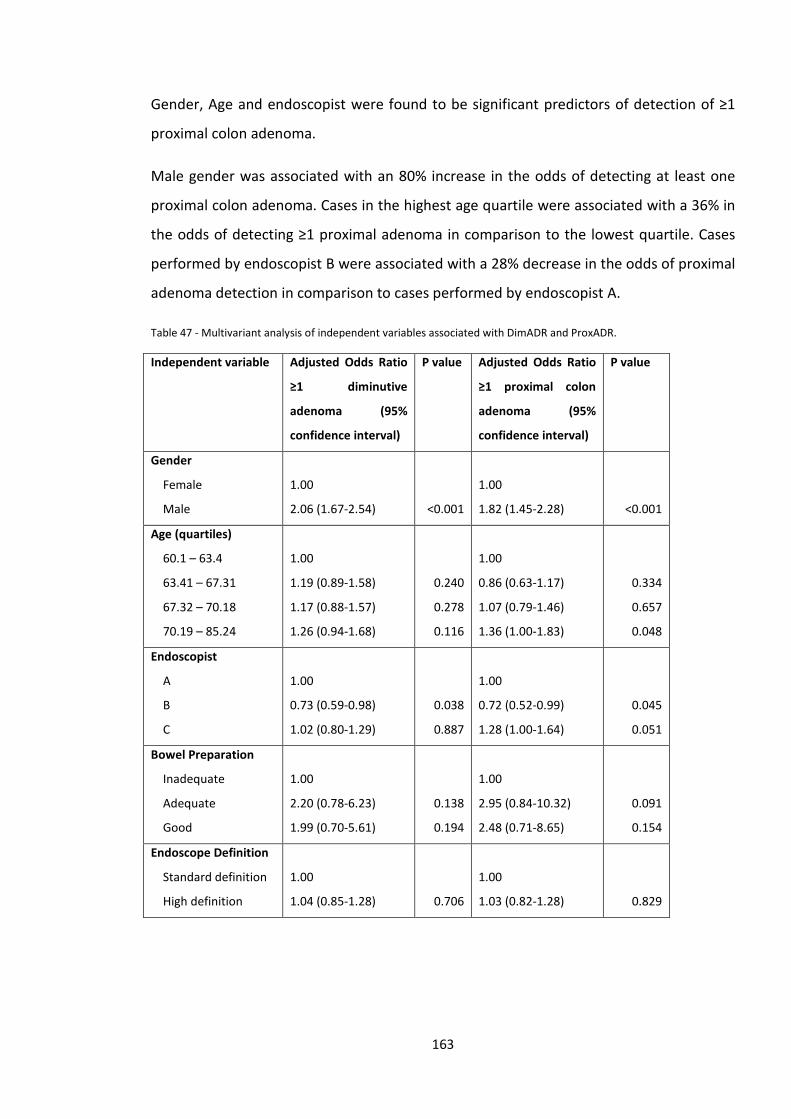
Gender, Age and endoscopist were found to be significant predictors of detection of ≥1
proximal colon adenoma.
Male gender was associated with an 80% increase in the odds of detecting at least one
proximal colon adenoma. Cases in the highest age quartile were associated with a 36% in
the odds of detecting ≥1 proximal adenoma in comparison to the lowest quartile. Cases
performed by endoscopist B were associated with a 28% decrease in the odds of proximal
adenoma detection in comparison to cases performed by endoscopist A.
Table 47 - Multivariant analysis of independent variables associated with DimADR and ProxADR.
Independent variable Adjusted Odds Ratio
≥1 diminutive
adenoma (95%
confidence interval)
P value Adjusted Odds Ratio
≥1 proximal colon
adenoma (95%
confidence interval)
P value
Gender
Female
Male
1.00
2.06 (1.67-2.54)
<0.001
1.00
1.82 (1.45-2.28)
<0.001
Age (quartiles)
60.1 – 63.4
63.41 – 67.31
67.32 – 70.18
70.19 – 85.24
1.00
1.19 (0.89-1.58)
1.17 (0.88-1.57)
1.26 (0.94-1.68)
0.240
0.278
0.116
1.00
0.86 (0.63-1.17)
1.07 (0.79-1.46)
1.36 (1.00-1.83)
0.334
0.657
0.048
Endoscopist
A
B
C
1.00
0.73 (0.59-0.98)
1.02 (0.80-1.29)
0.038
0.887
1.00
0.72 (0.52-0.99)
1.28 (1.00-1.64)
0.045
0.051
Bowel Preparation
Inadequate
Adequate
Good
1.00
2.20 (0.78-6.23)
1.99 (0.70-5.61)
0.138
0.194
1.00
2.95 (0.84-10.32)
2.48 (0.71-8.65)
0.091
0.154
Endoscope Definition
Standard definition
High definition
1.00
1.04 (0.85-1.28)
0.706
1.00
1.03 (0.82-1.28)
0.829
163
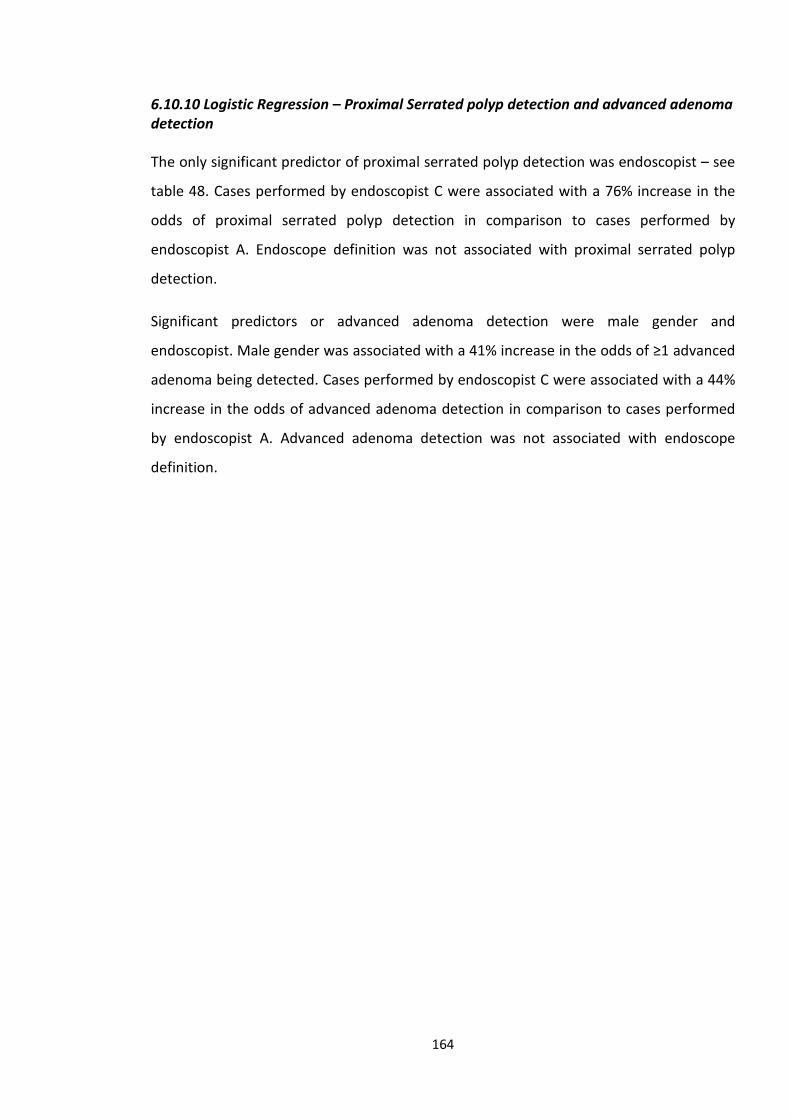
6.10.10 Logistic Regression – Proximal Serrated polyp detection and advanced adenoma detection
The only significant predictor of proximal serrated polyp detection was endoscopist – see
table 48. Cases performed by endoscopist C were associated with a 76% increase in the
odds of proximal serrated polyp detection in comparison to cases performed by
endoscopist A. Endoscope definition was not associated with proximal serrated polyp
detection.
Significant predictors or advanced adenoma detection were male gender and
endoscopist. Male gender was associated with a 41% increase in the odds of ≥1 advanced
adenoma being detected. Cases performed by endoscopist C were associated with a 44%
increase in the odds of advanced adenoma detection in comparison to cases performed
by endoscopist A. Advanced adenoma detection was not associated with endoscope
definition.
164
Table 48 - Multivariant analysis of independent variables associated with proximal serrated polyp detection rate and advanced adenoma detection rate.
Independent variable Adjusted Odds Ratio
≥1 proximal serrated
polyp (95%
confidence interval)
P value Adjusted Odds Ratio
≥1 advanced
adenoma (95%
confidence interval)
P value
Gender
Female
Male
1.00
0.74 (0.47-1.19)
0.213
1.00
1.41 (1.11-1.78)
0.005
Age (quartiles)
60.1 – 63.4
63.41 – 67.31
67.32 – 70.18
70.19 – 85.24
1.00
1.69 (0.86-3.34)
1.29 (0.63-2.64)
1.16 (0.56-2.42)
0.131
0.485
0.693
1.00
0.77 (0.56-1.06)
0.86 (0.63-1.18)
0.89 (0.65-1.23)
0.114
0.347
0.485
Endoscopist
A
B
C
1.00
1.74 (0.92-3.32)
1.76 (1.01-3.05)
0.091
0.044
1.00
1.13 (0.82-1.57)
1.44 (1.11-1.88)
0.445
0.006
Bowel Preparation
Inadequate
Adequate
Good
1.00
1.42 (0.46-4.34)
1.35 (0.44-4.10)
0.541
0.599
Endoscope Definition
Standard definition
High definition
1.00
1.42 (0.86-2.34)
0.177
1.00
0.89 (0.70-1.12)
0.311
6.11 Discussion
This was a large retrospective analysis of factors influencing ADR, MAP and other
outcome measures in UK BCSP patients undergoing screening colonoscopy. Endoscope
definition was not found to be significantly associated with either ADR or MAP on
univariate or multivariate analysis. Endoscope definition was also found not to be
significantly associated with detection of all polyps, diminutive adenomas, proximal
adenomas, proximal serrated lesions or advanced adenomas.
165
In multivariate analysis the factors associated with increased ADR and PDR were gender,
endoscopist and quality of bowel preparation. Gender and endoscopist were found to be
associated with significant differences in diminutive adenomas detection and proximal
adenoma detection. The highest age quartile was also found to be associated with a
significant increase in the odds of proximal adenoma detection. Detection of proximal
serrated lesions was only significantly influenced by endoscopist, and advanced adenoma
detection by gender and endoscopist.
Patients who undergo colonoscopy within the UK BCSP are by definition an enriched
population with positive FOBt. BCS accredited endoscopists undergo a rigorous
accreditation process with frequent review of their performance and thus are a high-
performing set of colonoscopists. The mean ADR in nationwide analysis of BCSP data is
46.5%181. In this cohort the mean ADR was 56.6%, indicating that the 3 endoscopists who
performed the procedures in this cohort were performing above the national average. In
comparison the ADR in the Buchner study, which showed a positive effect of HD
endoscopy on ADR, was much lower at 26.5%262. Thus there may be a ceiling effect in
very high performing endoscopist where there is minimal scope for improvement in
performance by using HD endoscopes, rather than SD endoscopes.
The endoscopes used in this analysis ranged from 410,000 pixels to 1.2 megapixels. A cut
off value of 500,000 pixels was used to define what constituted SD and HD endoscopes.
This is line with the ASGE technology evaluation on HD endoscopy259. It may be the case
that the main gain in terms of higher endoscope definition improving ADR occurs at lower
pixel densities than those evaluated in this study. For example there may be significant
gains when switching from a 100,000 pixel endoscope to one with 400,000 pixels.
Although endoscope definition did not influence any of the primary or secondary
outcome measures, several factors were found to be significantly associated with
increased adenoma/polyp detection, or subsets of these. Male gender is a well-
established risk factor for adenomatous polyps and CRC and this was confirmed in these
results42, 91. Surprisingly, increasing age was not found to be significantly associated with
ADR, but there was some effect on proximal colon ADR. Age is also a well-established risk
166
factor for CRC and adenomatous polyps. This has been confirmed in larger analyses of
BCS data and hence this may represent a type 2 error in this analysis.
Quality of bowel preparation has been confirmed in many studies to be an important
determinant of ADR and this was confirmed in our results85-88. In this study there was a
trend towards a significant influence on diminutive and proximal adenoma detection,
which did not reach significance. This may be explained by the very low number of cases
with inadequate bowel preparation (20). BCS patients receive a pre-procedure
appointment and pre-assessment with a BCS specialist nurse. This involves in-depth
explanation of the importance of achieving good bowel preparation for the procedure,
with detailed and clear instructions to the patient. Thus the percentage of cases with
inadequate bowel preparation is generally lower than that found in non-BCS colonoscopy
patients.
The consistent factor found to be significantly associated with all outcome measures was
the individual endoscopist. Although all 3 endoscopists in this study performed above the
national average in terms of ADR, significant differences were found between them.
Many studies have now demonstrated wide variability in ADR and MAP between
endoscopists. The seminal Barclay et al paper found a 3-fold difference in ADR between
the lowest and highest performing endoscopists and a 10-fold difference in MAP92. Corley
et al found a 7-fold difference in ADR between the lowest and highest performing
endoscopists82.
We found that there were differences between the 3 endoscopists in several outcome
measures – ADR, PDR, DimADR, ProxADR, AdvancedADR and ProxSerrDR.
Differences between endoscopists may be influenced by several factors. Withdrawal time
is closely associated with ADR91, 92, but in this study did not differ significantly between
the three endoscopists. Withdrawal technique is also likely to influence differences in
ADR and other outcome measures between colonoscopists; flushing to cleanse the
mucosal surface, careful inspection of the whole colonic mucosal surface including behind
folds and use of position changes to allow maximum distension are all likely to be
important factors. Recognition of small, subtle flat or sessile lesions will be influenced by
training and education. Proximal serrated polyps (PSP) in particular can be subtle flat
167
lesions which are easily missed and are not familiar to many endoscopists – “the eye only
sees what the mind is prepared to comprehend”. This is evidenced in studies that show
variability between individual endoscopists and hospital in the rate of PSP detection268,
269.
This study had some limitations: cases were not equally divided amongst endoscopists
and neither was the division between use of SD and HD endoscopes for an individual
endoscopist. By performing a regression analysis we hoped to control for these factors.
Very few cases had inadequate bowel preparation which may have led to an
underestimation of the influence of bowel preparation quality on some of the outcome
measures (for instance no cases with inadequate prep had proximal serrated polyps
detected).
Whilst this was not a randomised trial, it does reflect real-world data relating to the
impact of endoscope definition in BCS colonoscopy and is not subject to the potential bias
that could exist in a trial (it would be very difficult to blind an endoscopist to endoscope
resolution). The strengths of this study include a highly standardised cohort of patients,
competent and accredited endoscopists, a large cohort and prospective data recording in
a comprehensive database. The key findings are that the main factors associated with
increased ADR and other outcome measures are gender (which cannot be manipulated),
bowel preparation and endoscopist (which can). Endoscope definition was not
significantly associated with any primary or secondary outcome measure. Proximal
serrated polyps are difficult to detect and are potentially of high risk of malignant
transformation270. This may explain the failure of colonoscopy in some studies to protect
against proximal colon cancer. It is notable that in this study detection of proximal
serrated polyps was not associated with endoscope definition but did differ significantly
between endoscopists. Endoscopist C who had the highest proximal serrated polyp
detection rate also had the highest ADR and DimADR. This suggests that the technique of
mucosal evaluation and skills in recognition of subtle and diminutive lesions is associated
with detection of both diminutive adenomas, and proximal serrated lesions. Hence efforts
to improve outcomes in BCS colonoscopy should be directed at endoscopist factors such
as withdrawal technique and lesion recognition and improving the quality of bowel
preparation.
168
Chapter 7 - A randomised controlled trial of simeticone and n-acetylcysteine as a pre-procedure drink to improve
mucosal visibility during diagnostic gastroscopy – the NICEVIS Study
7.1 Introduction
Survival from upper gastrointestinal cancer is largely determined by stage at diagnosis,
with very good outcomes for patients diagnosed with early stage disease but a dismal
prognosis for the majority diagnosed with more advanced lesions. For example stage I
gastric cancer has a 5-year survival rate of 80%, compared to <5% for stage IV gastric
cancer. Thus early diagnosis is key in improving outcomes from upper gastrointestinal
cancer. There is a well-documented miss rate for oesophageal and gastric cancer at upper
GI endoscopy with studies reporting miss rates of 4-13% at index endoscopy for cancers
diagnosed on subsequent investigations including repeat endoscopy72, 73, 271-274.
Recent years we have seen a rapid growth in advanced endoscopic techniques, including
endoscopic resection (ER) of dysplasia and early cancer in the upper gastrointestinal tract.
ER can offer complete cure, and avoid major surgery35, 275, however ER can only be
considered if early lesions can be detected and characterized. By their nature early
dysplastic lesions are smaller and more subtle than more advanced cancer and are
therefore more easily overlooked.
It is common to find views in the upper gastrointestinal tract impaired by mucus and
bubbles. This can hamper the identification of subtle abnormalities, such as dysplasia
within Barrett’s oesophagus or early gastric cancer.
If views of the mucosa are found to be inadequate during endoscopy it is standard
practice to use fluid flushes/lavage of 20-50ml aliquots of a solution containing a bubble-
breaker +/- mucolytic to cleanse the mucosal surface. These are delivered from a syringe
169
via one of the endoscope channels. In some cases multiple flushes, eg 200ml, may be
required to achieve adequate views.
In Japan, where ER has been common place for many years, it has become standard
practice to use the mucosal toileting drink Gascon (Dimethylpolysiloxane, DMPS) with
Pronase prior to gastroscopy. Patients are given a 30-100 ml drink 5-10 minutes prior to
gastroscopy. Gascon acts as a defoaming agent, thereby dispersing foam and bubbles.
Pronase is a mucolytic which breaks down mucus, improving the view of the mucosal
surface
However, Pronase is not licensed for use in the United Kingdom. Because of this
endoscopists in the UK have started using alternative pre-endoscopy preparatory drinks.
The combination of simeticone and n-acetylcysteine (NAC) is used in many UK endoscopy
units.
Several previous studies have examined the effect on mucosal visibility of a pre-
procedure drink of a defoaming agent (such as DMPS or simethicone) either alone or in
combination with a mucolytic such as Pronase or NAC. The main outcomes of previous
studies are summarised in table 49. In early studies McDonald and Bertoni demonstrated
that simeticone and water alone improved mucosal visibility during gastroscopy in
comparison to no preparation. In addition, fewer flushes were required to achieve
adequate views and procedure times were reduced276, 277.
Fujii et al found that the combination of water, DMPS, sodium bicarbonate and pronase
produced the best mucosal visibility, significantly better than the same combination
without pronase278. In a similar study Kuo et al found that the same combination, albeit in
different quantities, produced the best results279.
Chang compared solutions containing two different mucolytics – pronase and NAC. No
significant difference in mucosal visibility was found between subjects given a solution
containing DMPS, sodium bicarbonate and pronase and those given one containing DMPS
and NAC280.
In contrasting results Asl et al found no significant differences in mucosal visibility
between subjects given a solution containing water, DMPS and NAC and those given one
170
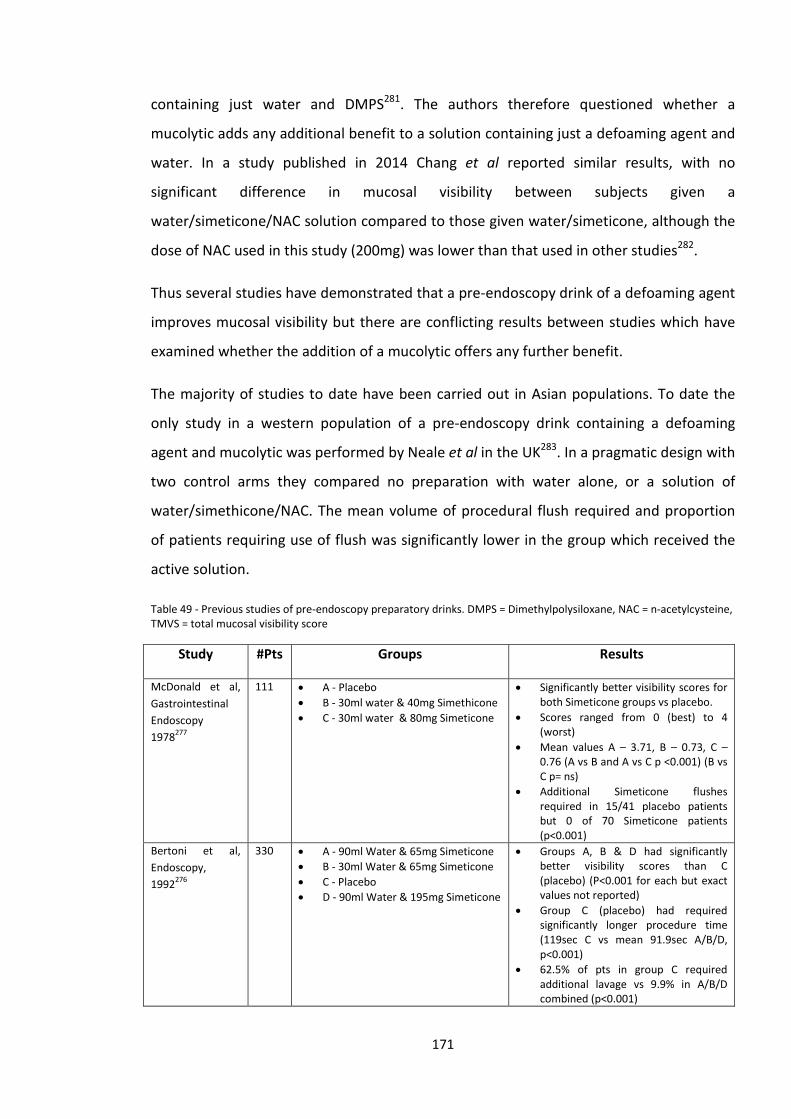
containing just water and DMPS281. The authors therefore questioned whether a
mucolytic adds any additional benefit to a solution containing just a defoaming agent and
water. In a study published in 2014 Chang et al reported similar results, with no
significant difference in mucosal visibility between subjects given a
water/simeticone/NAC solution compared to those given water/simeticone, although the
dose of NAC used in this study (200mg) was lower than that used in other studies282.
Thus several studies have demonstrated that a pre-endoscopy drink of a defoaming agent
improves mucosal visibility but there are conflicting results between studies which have
examined whether the addition of a mucolytic offers any further benefit.
The majority of studies to date have been carried out in Asian populations. To date the
only study in a western population of a pre-endoscopy drink containing a defoaming
agent and mucolytic was performed by Neale et al in the UK283. In a pragmatic design with
two control arms they compared no preparation with water alone, or a solution of
water/simethicone/NAC. The mean volume of procedural flush required and proportion
of patients requiring use of flush was significantly lower in the group which received the
active solution.
Table 49 - Previous studies of pre-endoscopy preparatory drinks. DMPS = Dimethylpolysiloxane, NAC = n-acetylcysteine, TMVS = total mucosal visibility score
Study #Pts Groups Results
McDonald et al, Gastrointestinal Endoscopy 1978277
111 • A - Placebo • B - 30ml water & 40mg Simethicone • C - 30ml water & 80mg Simeticone
• Significantly better visibility scores for both Simeticone groups vs placebo.
• Scores ranged from 0 (best) to 4 (worst)
• Mean values A – 3.71, B – 0.73, C – 0.76 (A vs B and A vs C p <0.001) (B vs C p= ns)
• Additional Simeticone flushes required in 15/41 placebo patients but 0 of 70 Simeticone patients (p<0.001)
Bertoni et al, Endoscopy, 1992276
330 • A - 90ml Water & 65mg Simeticone • B - 30ml Water & 65mg Simeticone • C - Placebo • D - 90ml Water & 195mg Simeticone
• Groups A, B & D had significantly better visibility scores than C (placebo) (P<0.001 for each but exact values not reported)
• Group C (placebo) had required significantly longer procedure time (119sec C vs mean 91.9sec A/B/D, p<0.001)
• 62.5% of pts in group C required additional lavage vs 9.9% in A/B/D combined (p<0.001)
171
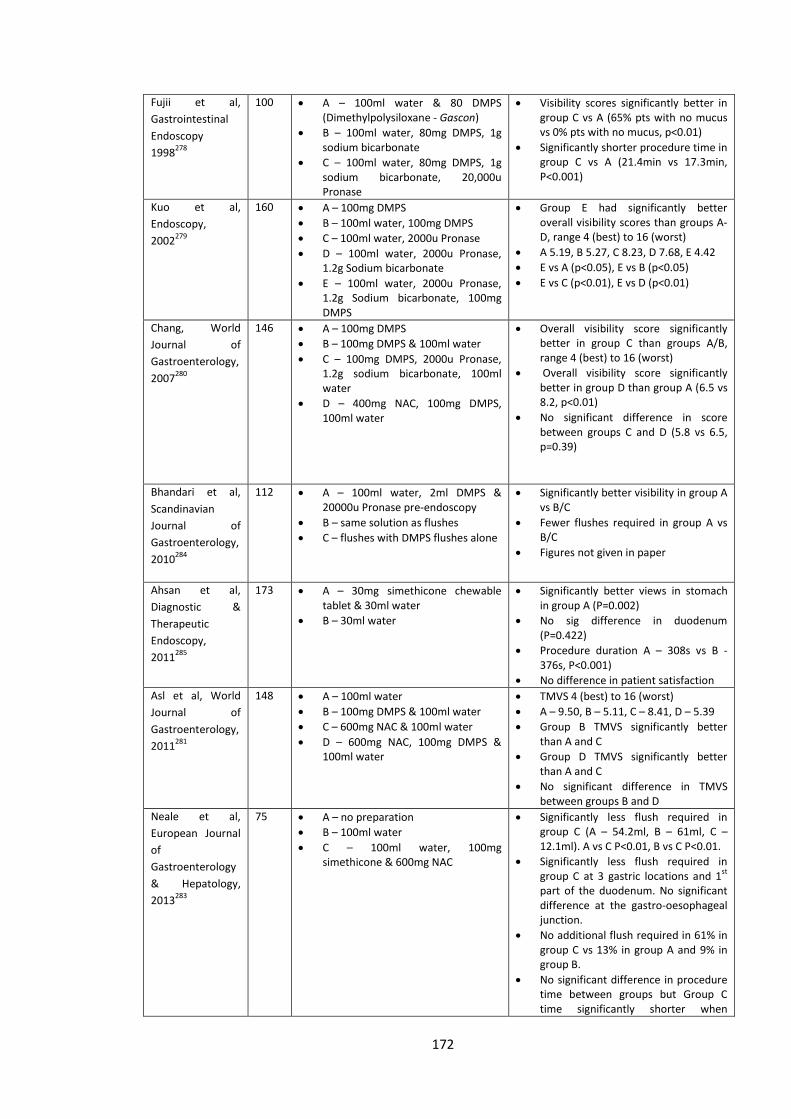
Fujii et al, Gastrointestinal Endoscopy 1998278
100 • A – 100ml water & 80 DMPS (Dimethylpolysiloxane - Gascon)
• B – 100ml water, 80mg DMPS, 1g sodium bicarbonate
• C – 100ml water, 80mg DMPS, 1g sodium bicarbonate, 20,000u Pronase
• Visibility scores significantly better in group C vs A (65% pts with no mucus vs 0% pts with no mucus, p<0.01)
• Significantly shorter procedure time in group C vs A (21.4min vs 17.3min, P<0.001)
Kuo et al, Endoscopy, 2002279
160 • A – 100mg DMPS • B – 100ml water, 100mg DMPS • C – 100ml water, 2000u Pronase • D – 100ml water, 2000u Pronase,
1.2g Sodium bicarbonate • E – 100ml water, 2000u Pronase,
1.2g Sodium bicarbonate, 100mg DMPS
• Group E had significantly better overall visibility scores than groups A-D, range 4 (best) to 16 (worst)
• A 5.19, B 5.27, C 8.23, D 7.68, E 4.42 • E vs A (p<0.05), E vs B (p<0.05) • E vs C (p<0.01), E vs D (p<0.01)
Chang, World Journal of Gastroenterology, 2007280
146 • A – 100mg DMPS • B – 100mg DMPS & 100ml water • C – 100mg DMPS, 2000u Pronase,
1.2g sodium bicarbonate, 100ml water
• D – 400mg NAC, 100mg DMPS, 100ml water
• Overall visibility score significantly better in group C than groups A/B, range 4 (best) to 16 (worst)
• Overall visibility score significantly better in group D than group A (6.5 vs 8.2, p<0.01)
• No significant difference in score between groups C and D (5.8 vs 6.5, p=0.39)
Bhandari et al, Scandinavian Journal of Gastroenterology, 2010284
112 • A – 100ml water, 2ml DMPS & 20000u Pronase pre-endoscopy
• B – same solution as flushes • C – flushes with DMPS flushes alone
• Significantly better visibility in group A vs B/C
• Fewer flushes required in group A vs B/C
• Figures not given in paper
Ahsan et al, Diagnostic & Therapeutic Endoscopy, 2011285
173 • A – 30mg simethicone chewable tablet & 30ml water
• B – 30ml water
• Significantly better views in stomach in group A (P=0.002)
• No sig difference in duodenum (P=0.422)
• Procedure duration A – 308s vs B -376s, P<0.001)
• No difference in patient satisfaction Asl et al, World Journal of Gastroenterology, 2011281
148 • A – 100ml water • B – 100mg DMPS & 100ml water • C – 600mg NAC & 100ml water • D – 600mg NAC, 100mg DMPS &
100ml water
• TMVS 4 (best) to 16 (worst) • A – 9.50, B – 5.11, C – 8.41, D – 5.39 • Group B TMVS significantly better
than A and C • Group D TMVS significantly better
than A and C • No significant difference in TMVS
between groups B and D Neale et al, European Journal of Gastroenterology & Hepatology, 2013283
75 • A – no preparation • B – 100ml water • C – 100ml water, 100mg
simethicone & 600mg NAC
• Significantly less flush required in group C (A – 54.2ml, B – 61ml, C – 12.1ml). A vs C P<0.01, B vs C P<0.01.
• Significantly less flush required in group C at 3 gastric locations and 1st part of the duodenum. No significant difference at the gastro-oesophageal junction.
• No additional flush required in 61% in group C vs 13% in group A and 9% in group B.
• No significant difference in procedure time between groups but Group C time significantly shorter when
172
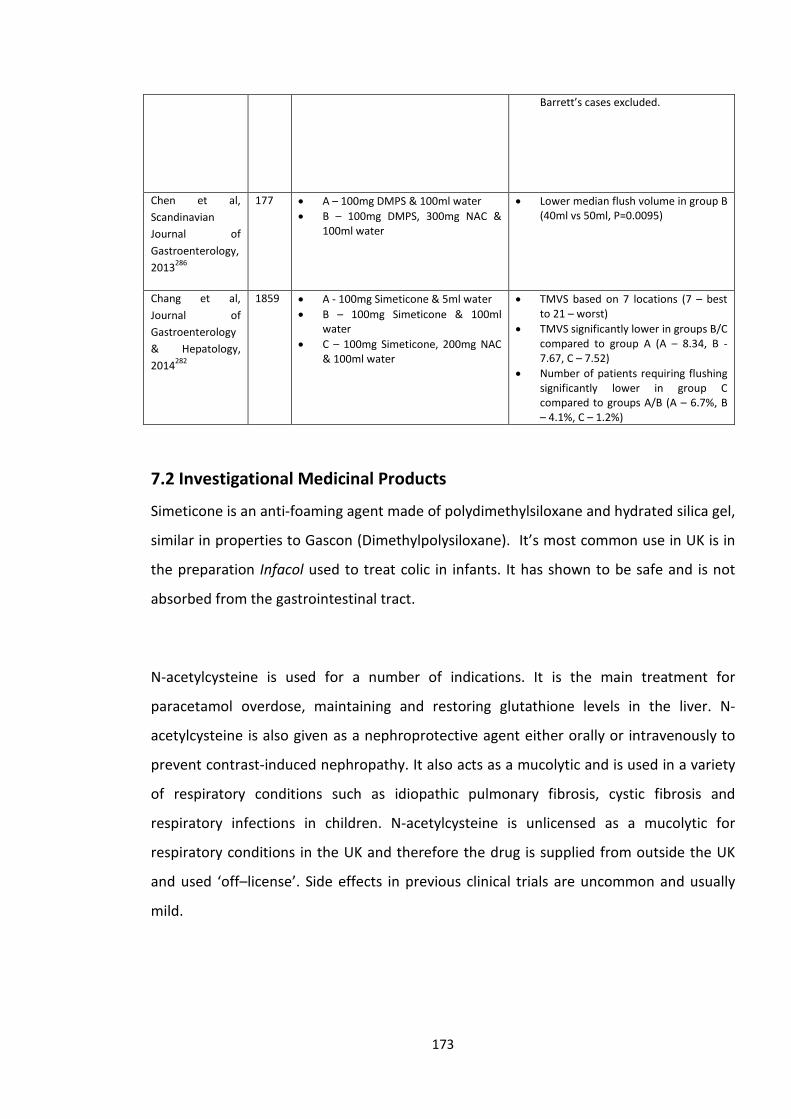
Barrett’s cases excluded.
Chen et al, Scandinavian Journal of Gastroenterology, 2013286
177 • A – 100mg DMPS & 100ml water • B – 100mg DMPS, 300mg NAC &
100ml water
• Lower median flush volume in group B (40ml vs 50ml, P=0.0095)
Chang et al, Journal of Gastroenterology & Hepatology, 2014282
1859 • A - 100mg Simeticone & 5ml water • B – 100mg Simeticone & 100ml
water • C – 100mg Simeticone, 200mg NAC
& 100ml water
• TMVS based on 7 locations (7 – best to 21 – worst)
• TMVS significantly lower in groups B/C compared to group A (A – 8.34, B -7.67, C – 7.52)
• Number of patients requiring flushing significantly lower in group C compared to groups A/B (A – 6.7%, B – 4.1%, C – 1.2%)
7.2 Investigational Medicinal Products
Simeticone is an anti-foaming agent made of polydimethylsiloxane and hydrated silica gel,
similar in properties to Gascon (Dimethylpolysiloxane). It’s most common use in UK is in
the preparation Infacol used to treat colic in infants. It has shown to be safe and is not
absorbed from the gastrointestinal tract.
N-acetylcysteine is used for a number of indications. It is the main treatment for
paracetamol overdose, maintaining and restoring glutathione levels in the liver. N-
acetylcysteine is also given as a nephroprotective agent either orally or intravenously to
prevent contrast-induced nephropathy. It also acts as a mucolytic and is used in a variety
of respiratory conditions such as idiopathic pulmonary fibrosis, cystic fibrosis and
respiratory infections in children. N-acetylcysteine is unlicensed as a mucolytic for
respiratory conditions in the UK and therefore the drug is supplied from outside the UK
and used ‘off–license’. Side effects in previous clinical trials are uncommon and usually
mild.
173
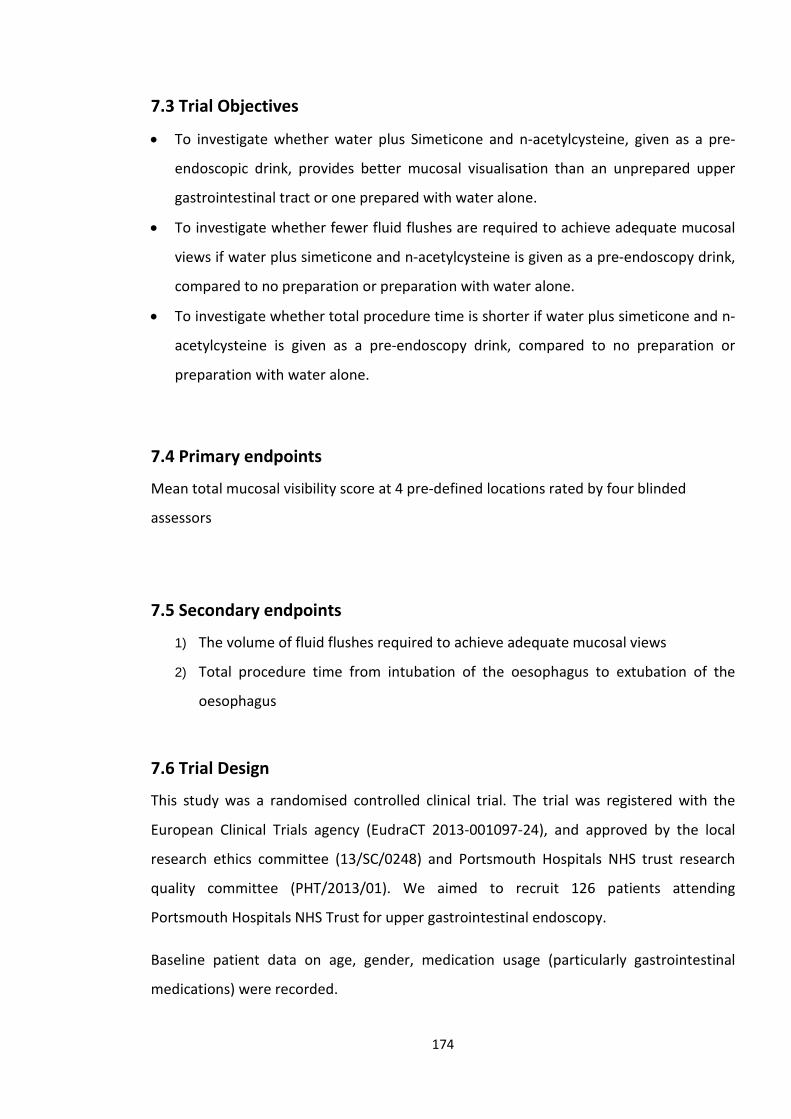
7.3 Trial Objectives
• To investigate whether water plus Simeticone and n-acetylcysteine, given as a pre-
endoscopic drink, provides better mucosal visualisation than an unprepared upper
gastrointestinal tract or one prepared with water alone.
• To investigate whether fewer fluid flushes are required to achieve adequate mucosal
views if water plus simeticone and n-acetylcysteine is given as a pre-endoscopy drink,
compared to no preparation or preparation with water alone.
• To investigate whether total procedure time is shorter if water plus simeticone and n-
acetylcysteine is given as a pre-endoscopy drink, compared to no preparation or
preparation with water alone.
7.4 Primary endpoints
Mean total mucosal visibility score at 4 pre-defined locations rated by four blinded
assessors
7.5 Secondary endpoints
1) The volume of fluid flushes required to achieve adequate mucosal views
2) Total procedure time from intubation of the oesophagus to extubation of the
oesophagus
7.6 Trial Design
This study was a randomised controlled clinical trial. The trial was registered with the
European Clinical Trials agency (EudraCT 2013-001097-24), and approved by the local
research ethics committee (13/SC/0248) and Portsmouth Hospitals NHS trust research
quality committee (PHT/2013/01). We aimed to recruit 126 patients attending
Portsmouth Hospitals NHS Trust for upper gastrointestinal endoscopy.
Baseline patient data on age, gender, medication usage (particularly gastrointestinal
medications) were recorded.
174
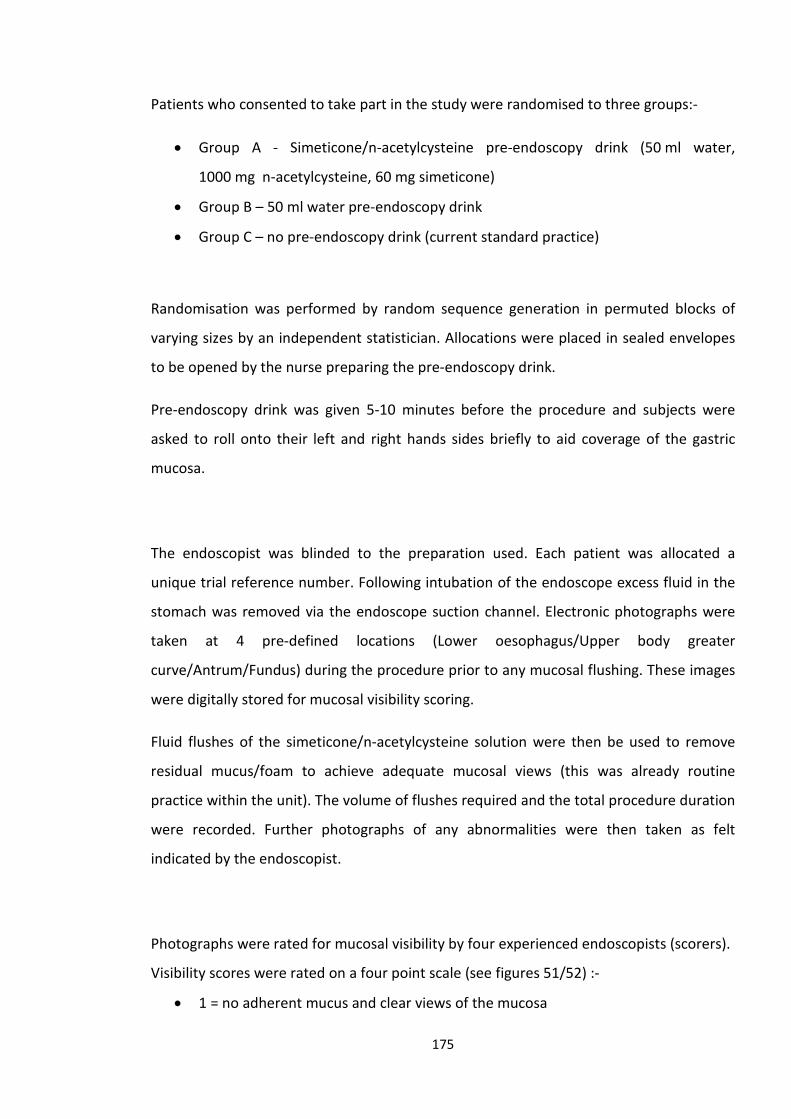
Patients who consented to take part in the study were randomised to three groups:-
• Group A - Simeticone/n-acetylcysteine pre-endoscopy drink (50 ml water,
1000 mg n-acetylcysteine, 60 mg simeticone)
• Group B – 50 ml water pre-endoscopy drink
• Group C – no pre-endoscopy drink (current standard practice)
Randomisation was performed by random sequence generation in permuted blocks of
varying sizes by an independent statistician. Allocations were placed in sealed envelopes
to be opened by the nurse preparing the pre-endoscopy drink.
Pre-endoscopy drink was given 5-10 minutes before the procedure and subjects were
asked to roll onto their left and right hands sides briefly to aid coverage of the gastric
mucosa.
The endoscopist was blinded to the preparation used. Each patient was allocated a
unique trial reference number. Following intubation of the endoscope excess fluid in the
stomach was removed via the endoscope suction channel. Electronic photographs were
taken at 4 pre-defined locations (Lower oesophagus/Upper body greater
curve/Antrum/Fundus) during the procedure prior to any mucosal flushing. These images
were digitally stored for mucosal visibility scoring.
Fluid flushes of the simeticone/n-acetylcysteine solution were then be used to remove
residual mucus/foam to achieve adequate mucosal views (this was already routine
practice within the unit). The volume of flushes required and the total procedure duration
were recorded. Further photographs of any abnormalities were then taken as felt
indicated by the endoscopist.
Photographs were rated for mucosal visibility by four experienced endoscopists (scorers).
Visibility scores were rated on a four point scale (see figures 51/52) :-
• 1 = no adherent mucus and clear views of the mucosa
175
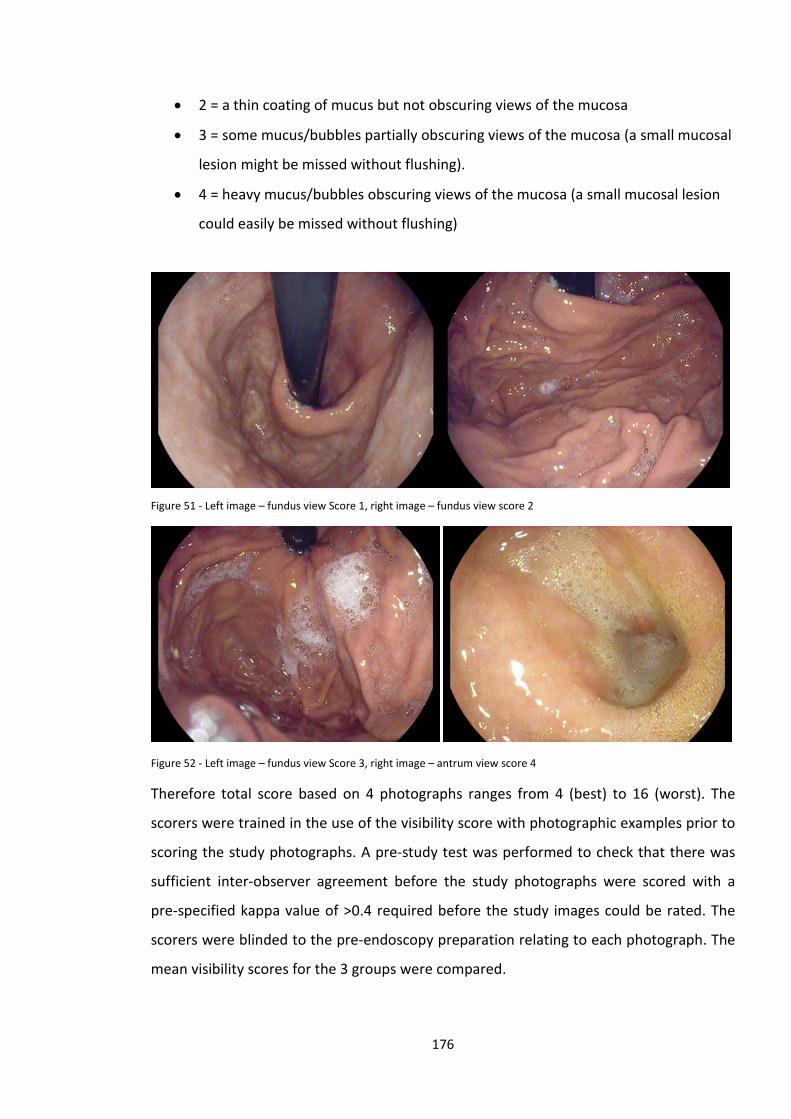
• 2 = a thin coating of mucus but not obscuring views of the mucosa
• 3 = some mucus/bubbles partially obscuring views of the mucosa (a small mucosal
lesion might be missed without flushing).
• 4 = heavy mucus/bubbles obscuring views of the mucosa (a small mucosal lesion
could easily be missed without flushing)
Figure 51 - Left image – fundus view Score 1, right image – fundus view score 2
Figure 52 - Left image – fundus view Score 3, right image – antrum view score 4
Therefore total score based on 4 photographs ranges from 4 (best) to 16 (worst). The
scorers were trained in the use of the visibility score with photographic examples prior to
scoring the study photographs. A pre-study test was performed to check that there was
sufficient inter-observer agreement before the study photographs were scored with a
pre-specified kappa value of >0.4 required before the study images could be rated. The
scorers were blinded to the pre-endoscopy preparation relating to each photograph. The
mean visibility scores for the 3 groups were compared.
176
7.7 Inclusion Criteria
Patients referred for routine or CWT pathway outpatient upper gastrointestinal endoscopy at Queen Alexandra Hospital, Cosham.
1. Minimum Age 18. No maximum age.
7.8 Exclusion Criteria
1. Cases with severe oesophagitis
2. Emergency cases (eg gastrointestinal bleeding)
3. Patients who would already receive NAC/Simeticone pre-endoscopy as part of
their standard care
4. Patients with a known stricture or stenosis (narrowing)
5. Pregnant or breastfeeding women
6. Patients with a known upper gastrointestinal malignancy
7. Patients with a previous CVA resulting in pharyngeal weakness or paralysis
8. Patients with bulbar or pseudobulbar palsy
9. Patients with a history of previous oesophageal or gastric surgery
10. Patients who are currently in another clinical trial
11. Patients with a known allergy to NAC or Simeticone
7.9 Safety Monitoring/Adverse events
All procedural adverse events were recorded. Participants were provided with a card
detailing the nature of the study medication to be shown to healthcare providers should
they have experienced any adverse events after leaving hospital. Participants were then
contacted by telephone 2-7 days after endoscopy to check for any possible delayed
adverse events. Only events occurring in the first 48 hours following the study endoscopy
were considered to be adverse events. It was anticipated that any possible adverse events
were likely to occur during the procedure, in the period immediately after the procedure,
or possibly in the 24 hours following the procedure, given that Simeticone is not absorbed
from the gastrointestinal tract and that the half-life of n-acetylcysteine is estimated to be
3.5-6.25 hours287, 288.
177
Procedures for 24 hour emergency unblinding of study group allocation were put in place
but this was not required during the study.
7.10 Selection of Participants
Patients referred to PHT for outpatient (day case) upper gastrointestinal endoscopy were
identified as possible study participants if felt eligible and meeting the inclusion criteria by
the clinician processing their referral.
7.11 Statistics & Sample size calculation
Visibility scores of 1-4 were rated for 4 locations (1 best, 4 worst) giving a total score
range 4-16. Based on the results of previous similar studies we predicted the mean score
in groups B&C to be 8.2 with a standard deviation of 2.7. The standard deviation of group
A was expected to be 1.2.
We aimed to be able to detect a 20% improvement in overall visibility score which would
be considered clinically significant based on clinical experience.
Based on a significance level of 0.017 to allow for multiple comparisons between the 3
groups and a power of 80%, a sample size of 40 patients in each group (120 in total) was
required. To allow for missing or spurious data occurring in 5% of cases the sample size
was increased to 126 (42 patients per group).
Inter-observer agreement was calculated using mean weighted Fleiss’s kappa.
Mean total mucosal visibility scores between groups were compared using one-way
analysis of variance with Tukey’s test to detect between group differences. In post-hoc
178
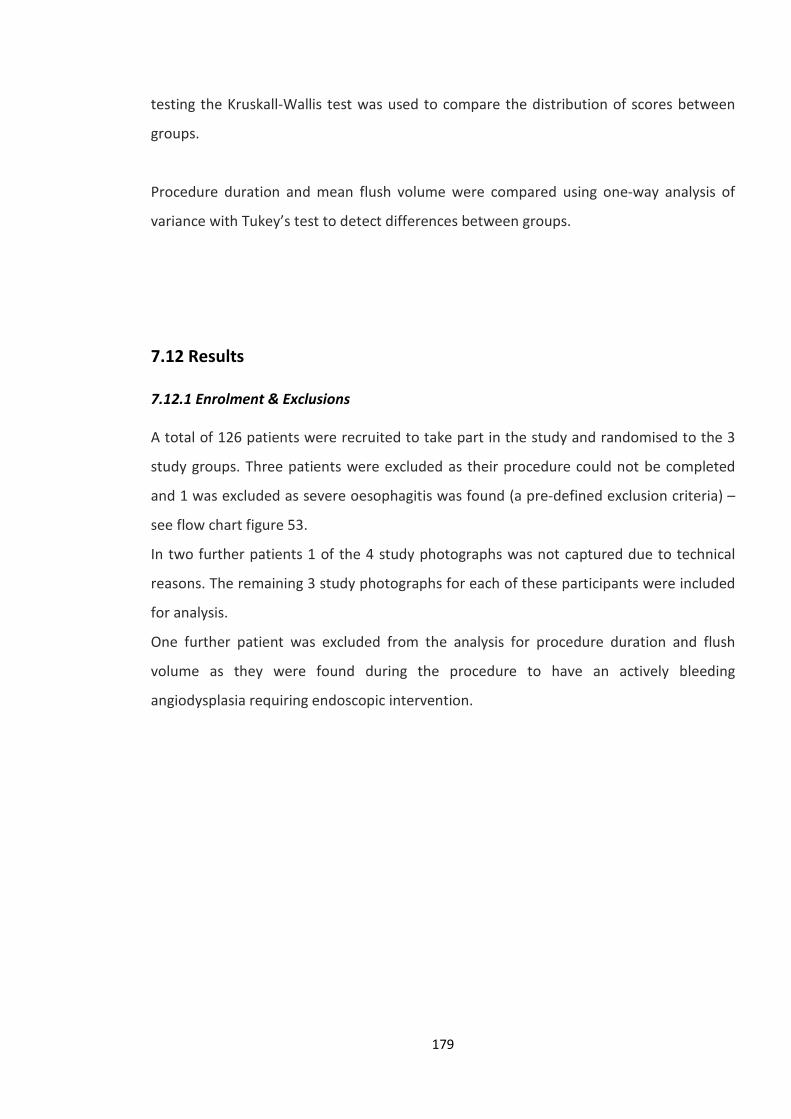
testing the Kruskall-Wallis test was used to compare the distribution of scores between
groups.
Procedure duration and mean flush volume were compared using one-way analysis of
variance with Tukey’s test to detect differences between groups.
7.12 Results
7.12.1 Enrolment & Exclusions
A total of 126 patients were recruited to take part in the study and randomised to the 3
study groups. Three patients were excluded as their procedure could not be completed
and 1 was excluded as severe oesophagitis was found (a pre-defined exclusion criteria) –
see flow chart figure 53.
In two further patients 1 of the 4 study photographs was not captured due to technical
reasons. The remaining 3 study photographs for each of these participants were included
for analysis.
One further patient was excluded from the analysis for procedure duration and flush
volume as they were found during the procedure to have an actively bleeding
angiodysplasia requiring endoscopic intervention.
179
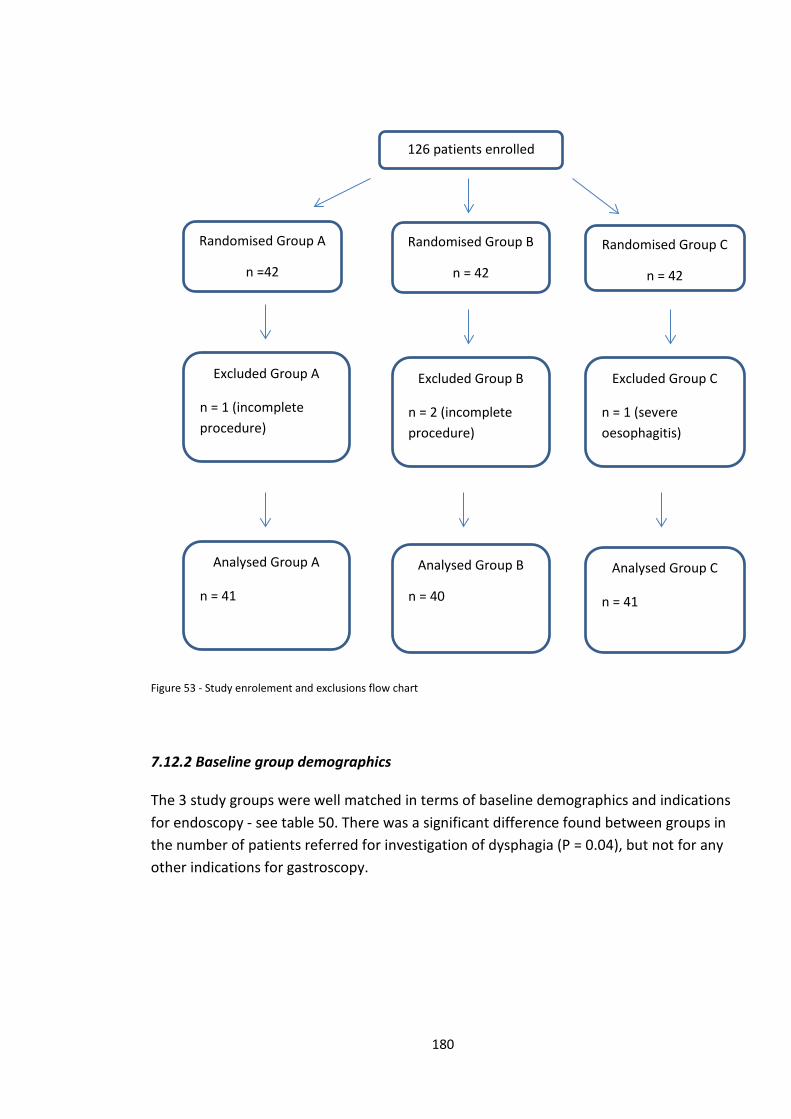
Figure 53 - Study enrolement and exclusions flow chart
7.12.2 Baseline group demographics
The 3 study groups were well matched in terms of baseline demographics and indications for endoscopy - see table 50. There was a significant difference found between groups in the number of patients referred for investigation of dysphagia (P = 0.04), but not for any other indications for gastroscopy.
Randomised Group A
n =42
Randomised Group B
n = 42
Randomised Group C
n = 42
126 patients enrolled
Excluded Group A
n = 1 (incomplete procedure)
Excluded Group B
n = 2 (incomplete procedure)
Excluded Group C
n = 1 (severe oesophagitis)
Analysed Group A
n = 41
Analysed Group B
n = 40
Analysed Group C
n = 41
180
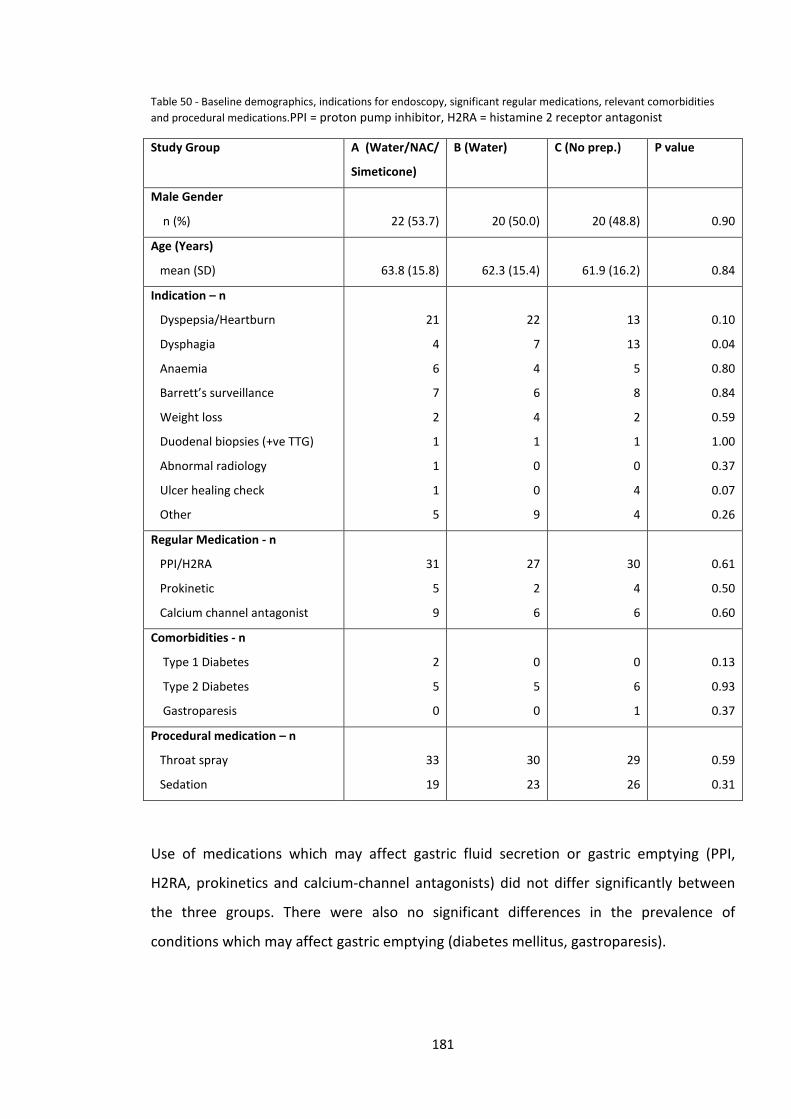
Table 50 - Baseline demographics, indications for endoscopy, significant regular medications, relevant comorbidities and procedural medications.PPI = proton pump inhibitor, H2RA = histamine 2 receptor antagonist
Study Group A (Water/NAC/
Simeticone)
B (Water) C (No prep.) P value
Male Gender
n (%)
22 (53.7)
20 (50.0)
20 (48.8)
0.90
Age (Years)
mean (SD)
63.8 (15.8)
62.3 (15.4)
61.9 (16.2)
0.84
Indication – n
Dyspepsia/Heartburn
Dysphagia
Anaemia
Barrett’s surveillance
Weight loss
Duodenal biopsies (+ve TTG)
Abnormal radiology
Ulcer healing check
Other
21
4
6
7
2
1
1
1
5
22
7
4
6
4
1
0
0
9
13
13
5
8
2
1
0
4
4
0.10
0.04
0.80
0.84
0.59
1.00
0.37
0.07
0.26
Regular Medication - n
PPI/H2RA
Prokinetic
Calcium channel antagonist
31
5
9
27
2
6
30
4
6
0.61
0.50
0.60
Comorbidities - n
Type 1 Diabetes
Type 2 Diabetes
Gastroparesis
2
5
0
0
5
0
0
6
1
0.13
0.93
0.37
Procedural medication – n
Throat spray
Sedation
33
19
30
23
29
26
0.59
0.31
Use of medications which may affect gastric fluid secretion or gastric emptying (PPI,
H2RA, prokinetics and calcium-channel antagonists) did not differ significantly between
the three groups. There were also no significant differences in the prevalence of
conditions which may affect gastric emptying (diabetes mellitus, gastroparesis).
181
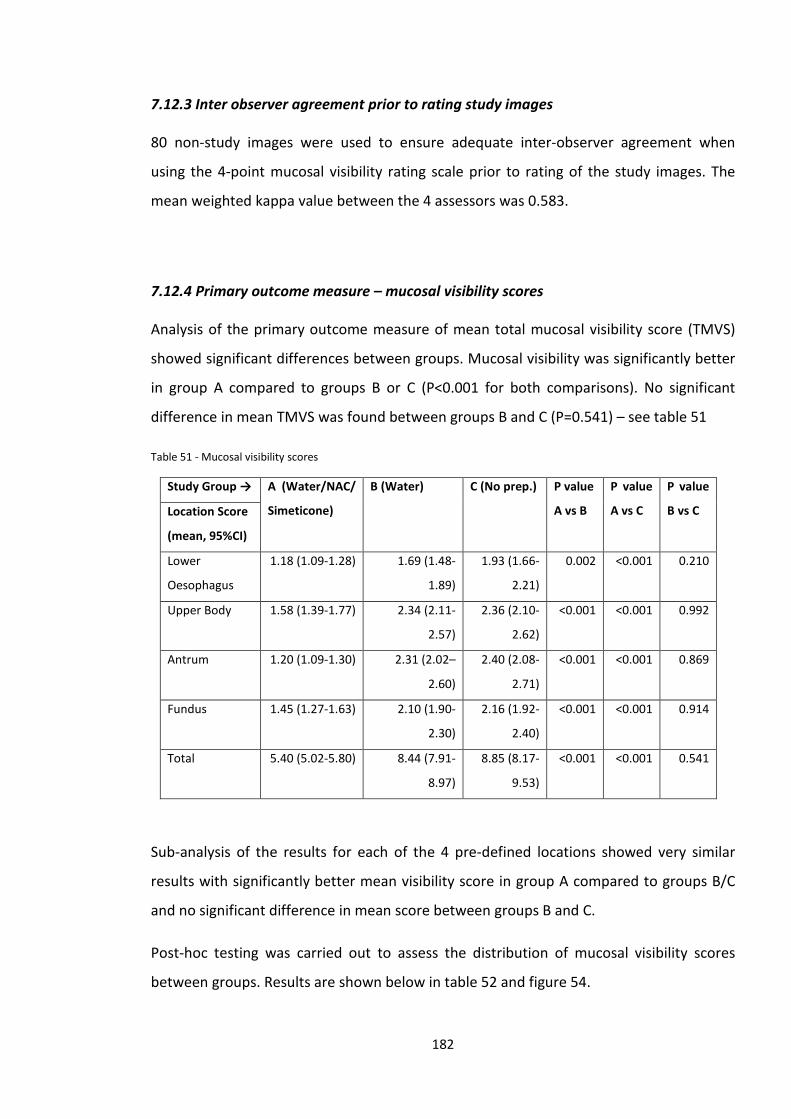
7.12.3 Inter observer agreement prior to rating study images
80 non-study images were used to ensure adequate inter-observer agreement when
using the 4-point mucosal visibility rating scale prior to rating of the study images. The
mean weighted kappa value between the 4 assessors was 0.583.
7.12.4 Primary outcome measure – mucosal visibility scores
Analysis of the primary outcome measure of mean total mucosal visibility score (TMVS)
showed significant differences between groups. Mucosal visibility was significantly better
in group A compared to groups B or C (P<0.001 for both comparisons). No significant
difference in mean TMVS was found between groups B and C (P=0.541) – see table 51
Table 51 - Mucosal visibility scores
Study Group → A (Water/NAC/
Simeticone)
B (Water) C (No prep.) P value
A vs B
P value
A vs C
P value
B vs C Location Score
(mean, 95%CI)
Lower
Oesophagus
1.18 (1.09-1.28) 1.69 (1.48-
1.89)
1.93 (1.66-
2.21)
0.002 <0.001 0.210
Upper Body 1.58 (1.39-1.77) 2.34 (2.11-
2.57)
2.36 (2.10-
2.62)
<0.001 <0.001 0.992
Antrum 1.20 (1.09-1.30) 2.31 (2.02–
2.60)
2.40 (2.08-
2.71)
<0.001 <0.001 0.869
Fundus 1.45 (1.27-1.63) 2.10 (1.90-
2.30)
2.16 (1.92-
2.40)
<0.001 <0.001 0.914
Total 5.40 (5.02-5.80) 8.44 (7.91-
8.97)
8.85 (8.17-
9.53)
<0.001 <0.001 0.541
Sub-analysis of the results for each of the 4 pre-defined locations showed very similar
results with significantly better mean visibility score in group A compared to groups B/C
and no significant difference in mean score between groups B and C.
Post-hoc testing was carried out to assess the distribution of mucosal visibility scores
between groups. Results are shown below in table 52 and figure 54.
182
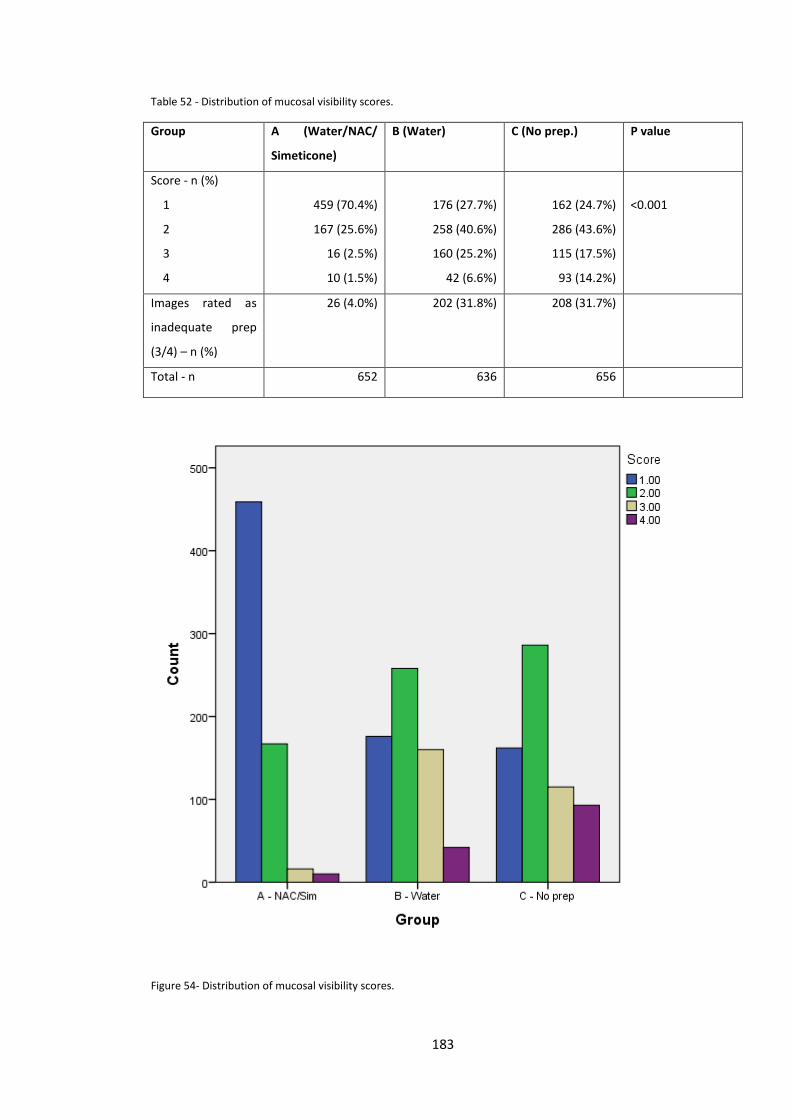
Table 52 - Distribution of mucosal visibility scores.
Group A (Water/NAC/
Simeticone)
B (Water) C (No prep.) P value
Score - n (%)
1
2
3
4
459 (70.4%)
167 (25.6%)
16 (2.5%)
10 (1.5%)
176 (27.7%)
258 (40.6%)
160 (25.2%)
42 (6.6%)
162 (24.7%)
286 (43.6%)
115 (17.5%)
93 (14.2%)
<0.001
Images rated as
inadequate prep
(3/4) – n (%)
26 (4.0%) 202 (31.8%) 208 (31.7%)
Total - n 652 636 656
Figure 54- Distribution of mucosal visibility scores.
183
There were significant differences between the 3 groups in the distribution of mucosal
visibility scores when compared using the Kruskal-Wallis test (P<0.001). 96% of images in
group A were rated as not requiring additional use of flushing to achieve adequate views,
compared to 68.2% in group B and 68.3% in group C.
The mean weighted kappa for the study images was 0.605, indicating good interobserver
agreement289.
7.12.5 Secondary outcomes – procedure duration and volume of flush used
No significant differences in mean procedure duration were found between the 3 groups
– see table 53. There was a trend towards shorter procedure duration in group A but this
did not reach statistical significance.
Mean flush volume required to achieve mucosal views during gastroscopy was 2ml for
group A compared to 31.5ml for group B and 39.2ml for group C. The difference in mean
volume between groups A and B and also groups A and C were highly statistically
significant – see table 53. No significant difference in flush volume was found between
groups B and C.
Table 53- Procedure duration and volume of intraprocedural flush required
Group A (Water/NAC/
Simeticone)
B (Water) C (No prep.) P value
A vs B
P value
A vs C
P value
B vs C
Procedure
duration, mean
(+/-SD) -
seconds
309 (+/- 129) 352 (+/- 216) 334 (+/- 118) 0.438 0.758 0.863
Flush volume,
mean (+/-SD) -
ml
2.0 (+/- 9.3) 31.5 (+/- 38.3) 39.2 (+/- 45.4) 0.001 <0.001 0.583
184
7.13 Adverse events
One serious adverse event occurred during the study. A participant developed
laryngospasm shortly after intubation of the oesophagus during gastroscopy. The
procedure was abandoned and the participant recovered quickly with no long-term
sequelae. The participant had been randomised to group B and had received water pre-
procedure. Laryngospasm is a recognised rare complication of gastroscopy and
independent review deemed that this was not related to the administration of water.
One other participant had a minor adverse event recorded (self-limiting abdominal
cramps and one episode of diarrhoea the day after gastroscopy). They had been
randomised to study group C and received no pre-gastroscopy preparation.
7.14 Discussion
This randomised controlled trial examined the impact of a pre-gastroscopy drink
containing the mucolytic agent n-acetylcysteine and defoaming agent simeticone, on
mucosal visibility during routine outpatient gastroscopy. Two control groups were used,
one receiving water, and the other no preparation. The endoscopists performing study
procedures and the 4 separate endoscopists who assessed the study images were all
blinded to group allocation. The active study medication was well tolerated by all
participants and did not result in any adverse events or reactions.
Analysis of the primary outcome showed significant improvements in mucosal visibility in
the group receiving the active study medication compared to both control groups. Thus
this study is in keeping with the findings of several previous studies in demonstrating
improvements in gastric mucosal visibility with a pre-gastroscopy drink containing a
mucolytic and a defoaming agent 278, 279, 283. This is only the second study to examine the
specific combination of simeticone and NAC in a Western population and the first to
specifically assess mucosal visibility in this group. In a post-hoc analysis only 4% of images
in the group receiving the active study medication were deemed inadequate compared to
32% in the water and no preparation groups.
185
Secondary outcome measures demonstrated a marked reduction in the volume of flush
required in group A compared to groups B/C to achieve adequate mucosal views. We
hypothesised that reduced need for flushes may reduce procedure time but although
there was a trend towards reduced time in group A this did not reach significance. This
may be due to confounding factors such as indication for endoscopy and findings during
the procedure. Barrett’s surveillance cases tend to result in a longer procedure time due
to the need to carefully assess the Barrett’s mucosa and take multiple biopsies, however
the proportion of Barrett’s cases was similar in the three study groups. A larger study may
have sufficient statistical power to show a significant difference in procedure time
between the groups. Whilst no significant difference in procedure time was
demonstrated it can be argued that for subjects in group A more time could be spent
carefully assessing a mucosal surface that was free of mucus and bubbles. In contrast in
groups B & C some of the procedure time would be spent flushing the mucosal surface
before adequate views could be achieved, thus reducing the amount of procedure time
utilised for careful mucosal inspection.
The importance of adequate bowel cleansing preparation prior to colonoscopy is well
understood and numerous studies, including the data presented in chapter 6, have
demonstrated the importance of good bowel preparation to improve adenoma
detection85-88. In contrast, at least in the West, the concept of giving preparation prior to
gastroscopy is not familiar to most endoscopists and preparation is not routinely used. In
a nationwide survey, no UK endoscopy units were routinely using a mucolytic drink prior
to gastroscopy290. Adequate preparation prior to gastroscopy is now of even greater
importance than in previous years; with improved endoscopic technology, enhacement
techniques and training endoscopist can detect and remove subtle precancerous lesions
and early cancer. However for this to be possible requires good views of the mucosal
surface.
Quality of gastroscopy is currently high on the agenda for national societies such as the
British Society of Gastroenterology291. This has been driven by the recognised miss rate
for oesophageal and gastric cancers at index endoscopy and the need to detect early
neoplasia to improve outcomes. Clearly, achieving adequate views of the mucosa is a key
186
component of performing a high quality gastroscopy, although at present this not a
quality assurance standard in the UK292.
Whereas previous studies of pre-endoscopy preparatory drinks have demonstrated
improvements in gastric mucosal visibility, this is the first study to demonstrate improved
mucosal visibility in the lower oesophagus. This is a vital area for careful inspection during
gastroscopy, particularly as the incidence of oesophageal adenocarcinoma and gastro-
oesophageal junction adenocarcinoma has risen rapidly in the UK in recent years. Early
dysplastic lesions arising in Barrett’s oesophagus, the precursor of oesophageal
adenocarcinoma, can be subtle and easily missed hence clear views of this area of the
upper GI tract are vital.
The use of mucosal visibility as the primary outcome measure of this study is of course a
surrogate marker for detection of upper gastrointestinal neoplasia. Hence the results of
this study do not prove that use of a pre-endoscopy drink containing NAC and simeticone
would improve detection of neoplasia. Due to the high prevalence of upper
gastrointestinal symptoms in the general population, most of whom have normal findings
or benign disease at endoscopy, the incidence of neoplasia in patients referred for
gastroscopy is low. Hence to conduct a study powered to detect an increase in the
diagnosis of neoplasia would require tens of thousands of patients.
There are of course downsides of giving a pre-gastroscopy drink: time to prepare the
drink lengthens the overall time to complete the procedure and may reduce the number
of cases that can be performed on an endoscopy list. In practice it takes 2-3 minutes for a
nurse to prepare and administer the drink. In this study the drink was given 5-10 minutes
prior to the procedure which led to a further delay whilst waiting for the drink to take
effect. However with careful planning patients could be administered the drink in
advance of entering the endoscopy suite. There are also cost implications. At current
prices the drink costs £1.21 per patient. A busy endoscopy unit such as Portsmouth
Hospitals NHS Trust performs around 6,000 gastroscopies per annum so this would result
in additional annual costs of around £7,000. The majority of the cost results from the use
of NAC, with simeticone costing only 8.2 pence per patient, hence the cost-effectiveness
of a solution containing just simeticone may be greater. The main concerns regarding
187
safety of administering a drink prior to endoscopy are those of potential aspiration of
fluid. In this study no adverse events related to study medication occurred. Similarly none
have been reported in other similar studies. It is not uncommon to find small to moderate
amounts of gastric fluid residue when performing gastroscopy and hence we do not feel
that the small volume of fluid used in this study significantly increase risk of aspiration.
In summary this study confirms that a pre-gastroscopy drink containing simeticone and
NAC significantly improves mucosal visibility in the lower oesophagus and stomach and
reduces the need for procedural flushing. This has the potential to become part of
standard pre-gastroscopy preparation to improve the detection of upper gastrointestinal
neoplasia and improve overall outcomes from upper gastrointestinal cancer.
188
Chapter 8 - Colonic lesion assessment skills amongst UK endoscopists
8.1 Introduction
Accurate assessment of colonic lesions is required for their optimum management during
colonoscopy. Benign adenomatous polyps should be endoscopically resected, but lesions
demonstrating endoscopic features suggestive of submucosal invasion should be
tattooed, biopsied and referred for surgical resection. Hyperplastic polyps located in the
recto-sigmoid colon have negligible malignant potential and therefore can in theory be
safely left in situ. However the practice of most colonoscopists at present is to remove all
polyps.
Data from the UK national colonoscopy audit suggest that approximately half a million
colonoscopies are performed in the UK each year81. During the course of their career
most endoscopists who perform regular colonoscopy will perform several thousand
colonoscopies, and therefore encounter and manage several thousand colonic lesions.
In the United Kingdom completion rates, sedation levels and safety are assessed as a
routine part of colonoscopy training293, monitored and enforced by the Joint advisory
Group (JAG) for gastrointestinal endoscopy. More recently the DOPyS (Direct
Observation of Polypectomy Skills) assessment 294 has been introduced. Currently neither
the JAG assessment process, nor the 2010 gastroenterology higher specialist training
curriculum include any formal training in the skills of colonic lesion assessment295.
This study aimed to assess the competence of UK gastroenterology trainees' and
established consultants' in the skills of in vivo diagnosis of colonic lesions, plus the impact
of a dedicated colonic lesion assessment training intervention.
8.2 Methods
An existing image library of 37 colonic lesions developed as part of a previous study296
was used. The 37 lesions consisted of 13 hyperplastic polyps, 15 adenomatous polyps and
189
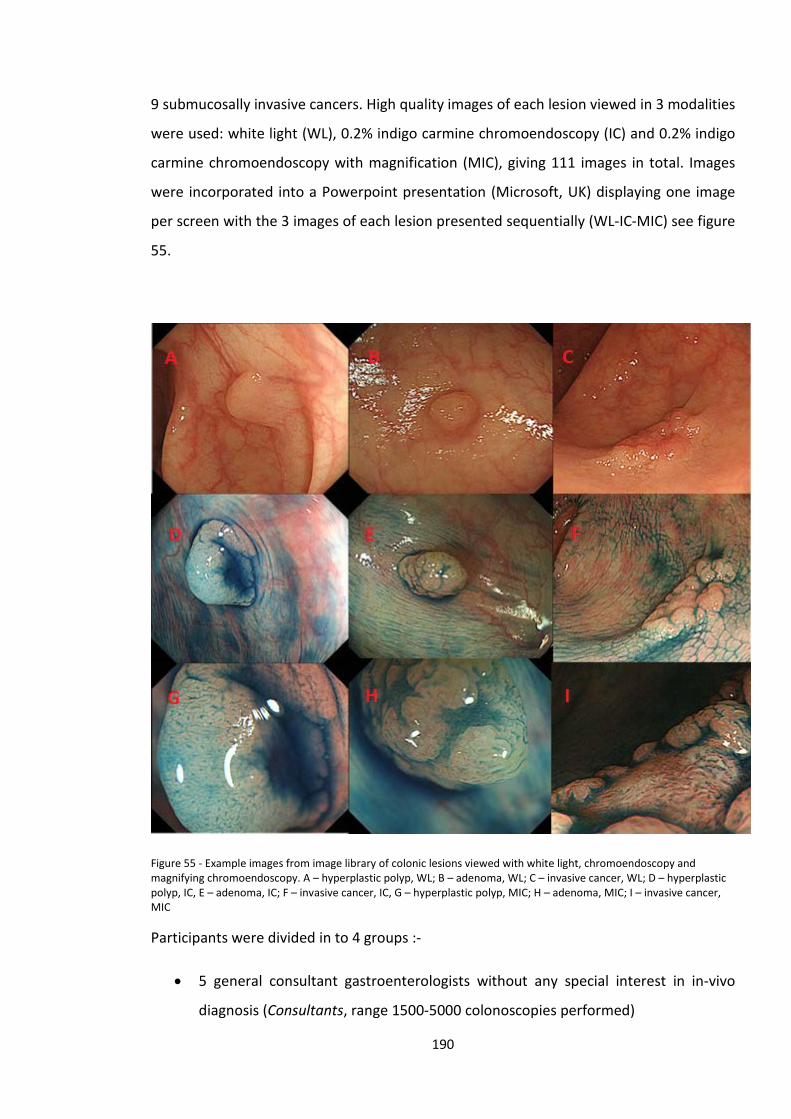
9 submucosally invasive cancers. High quality images of each lesion viewed in 3 modalities
were used: white light (WL), 0.2% indigo carmine chromoendoscopy (IC) and 0.2% indigo
carmine chromoendoscopy with magnification (MIC), giving 111 images in total. Images
were incorporated into a Powerpoint presentation (Microsoft, UK) displaying one image
per screen with the 3 images of each lesion presented sequentially (WL-IC-MIC) see figure
55.
Figure 55 - Example images from image library of colonic lesions viewed with white light, chromoendoscopy and magnifying chromoendoscopy. A – hyperplastic polyp, WL; B – adenoma, WL; C – invasive cancer, WL; D – hyperplastic polyp, IC, E – adenoma, IC; F – invasive cancer, IC, G – hyperplastic polyp, MIC; H – adenoma, MIC; I – invasive cancer, MIC
Participants were divided in to 4 groups :-
• 5 general consultant gastroenterologists without any special interest in in-vivo
diagnosis (Consultants, range 1500-5000 colonoscopies performed)
190
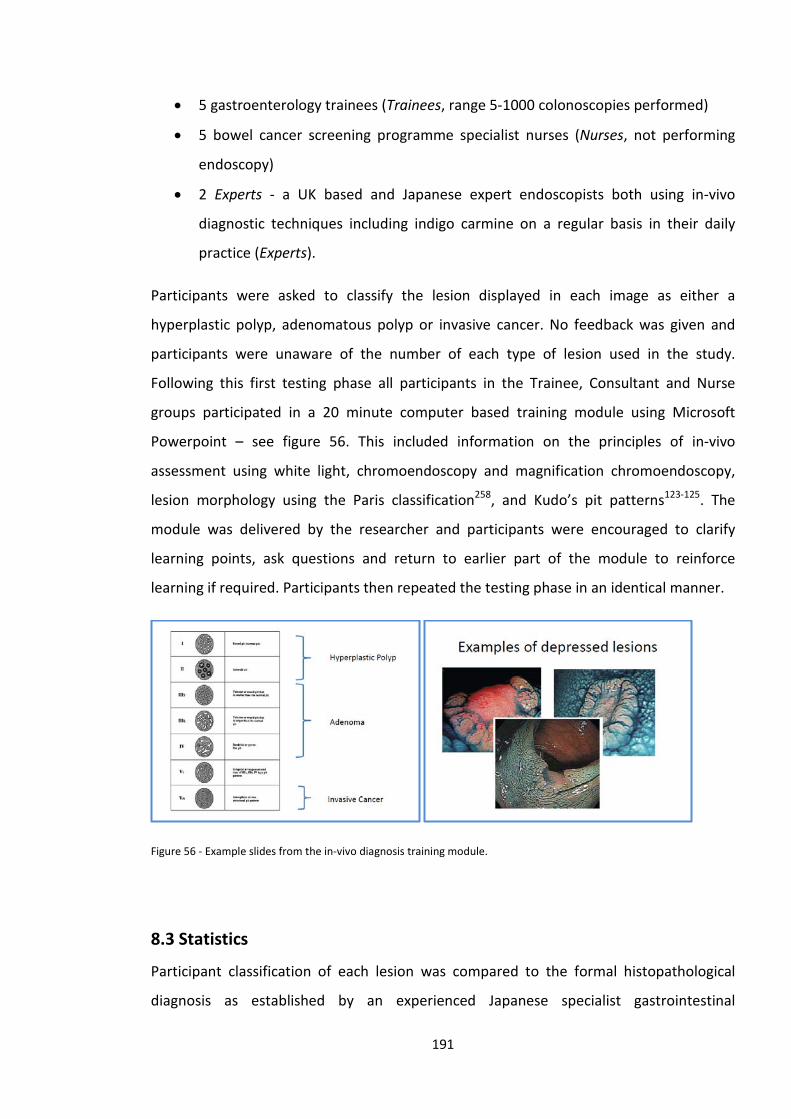
• 5 gastroenterology trainees (Trainees, range 5-1000 colonoscopies performed)
• 5 bowel cancer screening programme specialist nurses (Nurses, not performing
endoscopy)
• 2 Experts - a UK based and Japanese expert endoscopists both using in-vivo
diagnostic techniques including indigo carmine on a regular basis in their daily
practice (Experts).
Participants were asked to classify the lesion displayed in each image as either a
hyperplastic polyp, adenomatous polyp or invasive cancer. No feedback was given and
participants were unaware of the number of each type of lesion used in the study.
Following this first testing phase all participants in the Trainee, Consultant and Nurse
groups participated in a 20 minute computer based training module using Microsoft
Powerpoint – see figure 56. This included information on the principles of in-vivo
assessment using white light, chromoendoscopy and magnification chromoendoscopy,
lesion morphology using the Paris classification258, and Kudo’s pit patterns123-125. The
module was delivered by the researcher and participants were encouraged to clarify
learning points, ask questions and return to earlier part of the module to reinforce
learning if required. Participants then repeated the testing phase in an identical manner.
Figure 56 - Example slides from the in-vivo diagnosis training module.
8.3 Statistics
Participant classification of each lesion was compared to the formal histopathological
diagnosis as established by an experienced Japanese specialist gastrointestinal
191
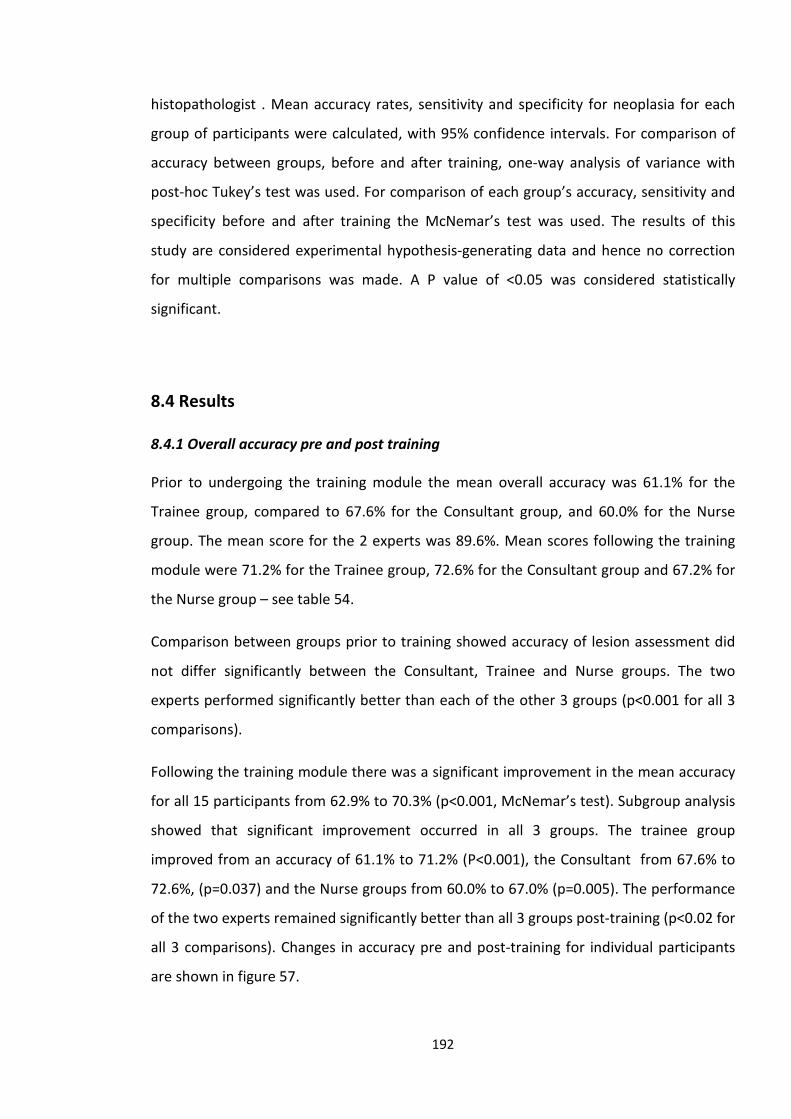
histopathologist . Mean accuracy rates, sensitivity and specificity for neoplasia for each
group of participants were calculated, with 95% confidence intervals. For comparison of
accuracy between groups, before and after training, one-way analysis of variance with
post-hoc Tukey’s test was used. For comparison of each group’s accuracy, sensitivity and
specificity before and after training the McNemar’s test was used. The results of this
study are considered experimental hypothesis-generating data and hence no correction
for multiple comparisons was made. A P value of <0.05 was considered statistically
significant.
8.4 Results
8.4.1 Overall accuracy pre and post training
Prior to undergoing the training module the mean overall accuracy was 61.1% for the
Trainee group, compared to 67.6% for the Consultant group, and 60.0% for the Nurse
group. The mean score for the 2 experts was 89.6%. Mean scores following the training
module were 71.2% for the Trainee group, 72.6% for the Consultant group and 67.2% for
the Nurse group – see table 54.
Comparison between groups prior to training showed accuracy of lesion assessment did
not differ significantly between the Consultant, Trainee and Nurse groups. The two
experts performed significantly better than each of the other 3 groups (p<0.001 for all 3
comparisons).
Following the training module there was a significant improvement in the mean accuracy
for all 15 participants from 62.9% to 70.3% (p<0.001, McNemar’s test). Subgroup analysis
showed that significant improvement occurred in all 3 groups. The trainee group
improved from an accuracy of 61.1% to 71.2% (P<0.001), the Consultant from 67.6% to
72.6%, (p=0.037) and the Nurse groups from 60.0% to 67.0% (p=0.005). The performance
of the two experts remained significantly better than all 3 groups post-training (p<0.02 for
all 3 comparisons). Changes in accuracy pre and post-training for individual participants
are shown in figure 57.
192
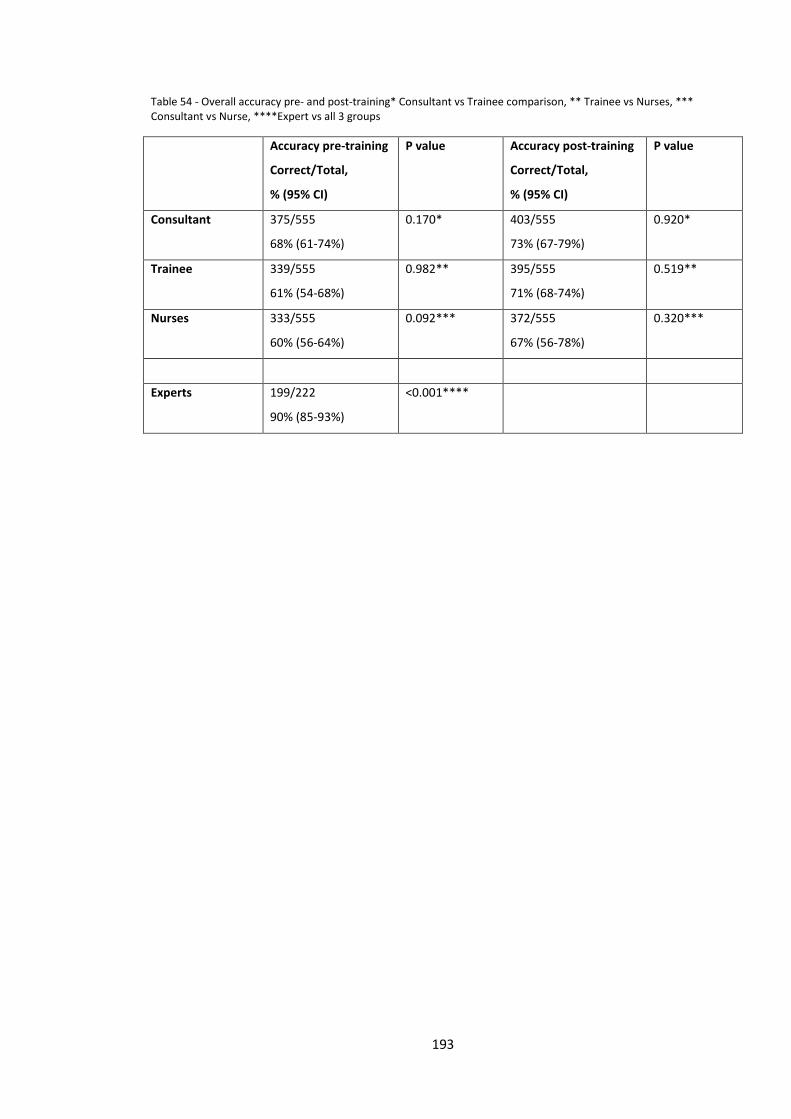
Table 54 - Overall accuracy pre- and post-training* Consultant vs Trainee comparison, ** Trainee vs Nurses, *** Consultant vs Nurse, ****Expert vs all 3 groups
Accuracy pre-training
Correct/Total,
% (95% CI)
P value Accuracy post-training
Correct/Total,
% (95% CI)
P value
Consultant 375/555
68% (61-74%)
0.170* 403/555
73% (67-79%)
0.920*
Trainee 339/555
61% (54-68%)
0.982** 395/555
71% (68-74%)
0.519**
Nurses 333/555
60% (56-64%)
0.092*** 372/555
67% (56-78%)
0.320***
Experts 199/222
90% (85-93%)
<0.001****
193
Figure 57- Overall score (max 111) pre and post training. Individual subjects represented by each line and colour-coded by group.
8.4.2 Sensitivity pre- and post-training
Mean sensitivity for neoplastic histology for the 15 participants improved from 68.3% to
73.2%, a significant increase – see table 55. When analysed by participant group, the
increase in mean sensitivity post-training was limited to the nurse group, not reaching
statistical significance for the consultant or trainee groups.
40
50
60
70
80
90
100
110
Pre-Training Post-Training
Scor
e (M
ax 1
11)
Score Pre- and Post-training
Trainee 1
Trainee 2
Trainee 3
Trainee 4
Trainee 5
Consultant 1
Consultant 2
Consultant 3
Consultant 4
Consultant 5
Nurse 1
Nurse 2
Nurse 3
Nurse 4
Nurse 5
194
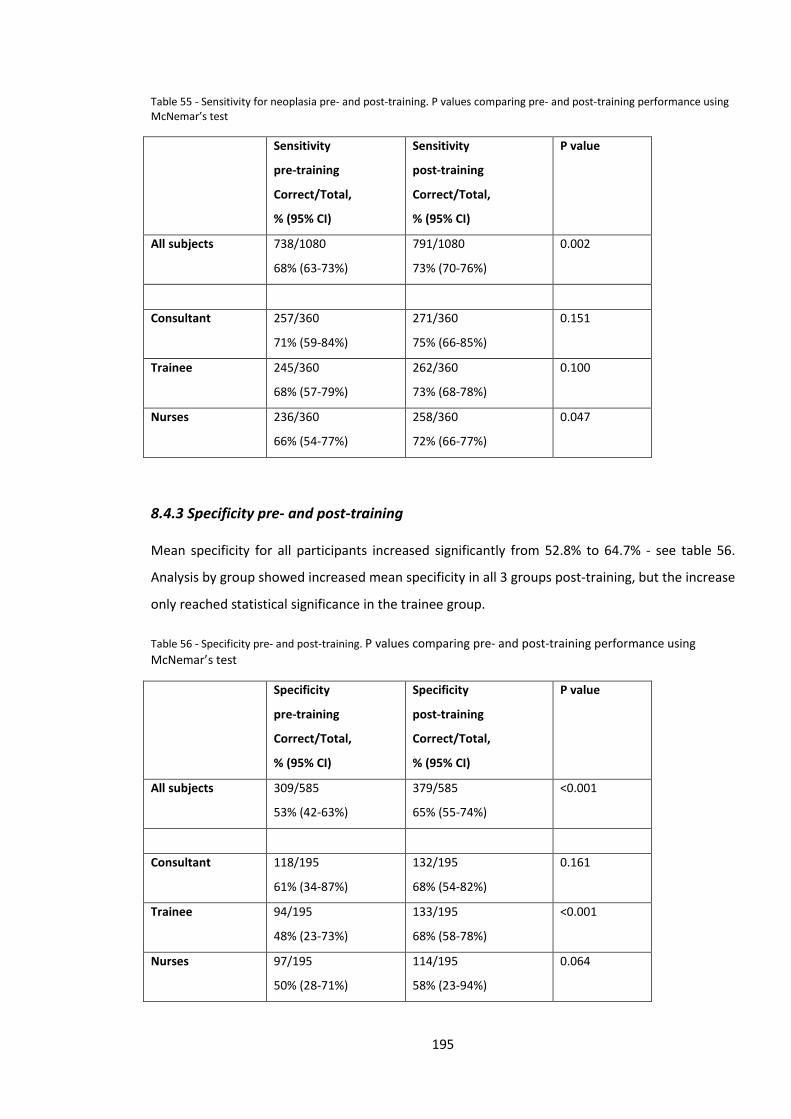
Table 55 - Sensitivity for neoplasia pre- and post-training. P values comparing pre- and post-training performance using McNemar’s test
Sensitivity
pre-training
Correct/Total,
% (95% CI)
Sensitivity
post-training
Correct/Total,
% (95% CI)
P value
All subjects 738/1080
68% (63-73%)
791/1080
73% (70-76%)
0.002
Consultant 257/360
71% (59-84%)
271/360
75% (66-85%)
0.151
Trainee 245/360
68% (57-79%)
262/360
73% (68-78%)
0.100
Nurses 236/360
66% (54-77%)
258/360
72% (66-77%)
0.047
8.4.3 Specificity pre- and post-training
Mean specificity for all participants increased significantly from 52.8% to 64.7% - see table 56.
Analysis by group showed increased mean specificity in all 3 groups post-training, but the increase
only reached statistical significance in the trainee group.
Table 56 - Specificity pre- and post-training. P values comparing pre- and post-training performance using McNemar’s test
Specificity
pre-training
Correct/Total,
% (95% CI)
Specificity
post-training
Correct/Total,
% (95% CI)
P value
All subjects 309/585
53% (42-63%)
379/585
65% (55-74%)
<0.001
Consultant 118/195
61% (34-87%)
132/195
68% (54-82%)
0.161
Trainee 94/195
48% (23-73%)
133/195
68% (58-78%)
<0.001
Nurses 97/195
50% (28-71%)
114/195
58% (23-94%)
0.064
195
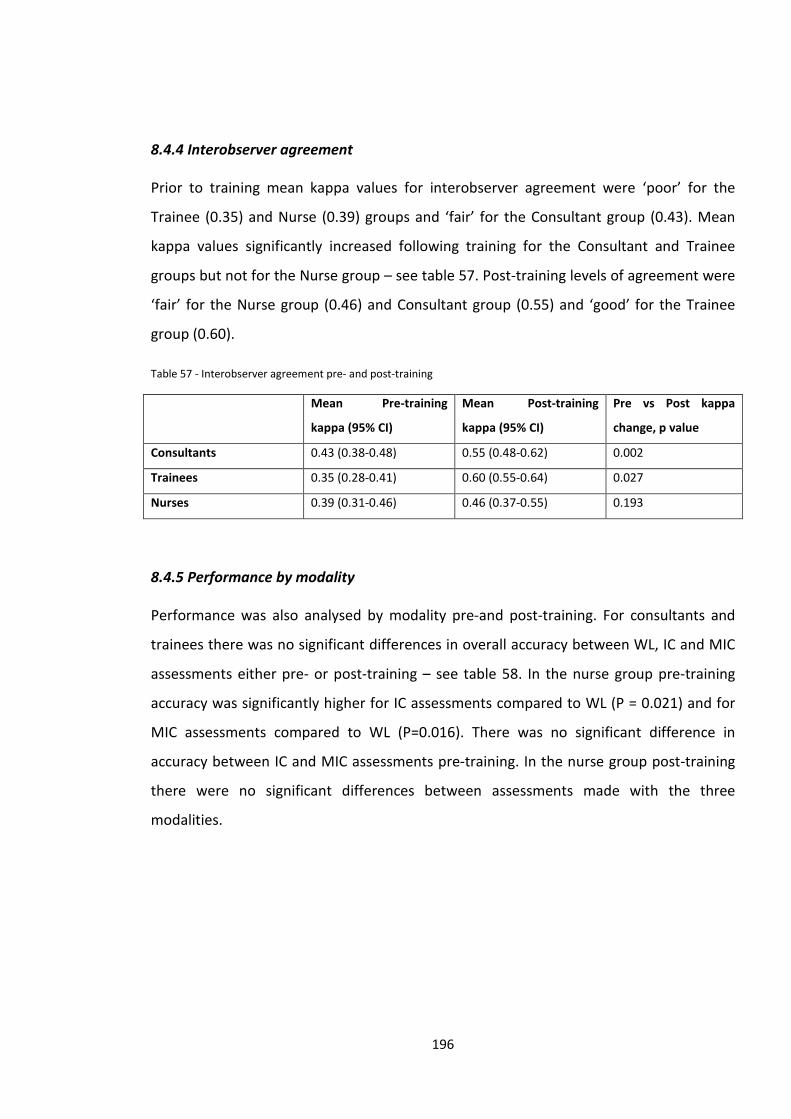
8.4.4 Interobserver agreement
Prior to training mean kappa values for interobserver agreement were ‘poor’ for the
Trainee (0.35) and Nurse (0.39) groups and ‘fair’ for the Consultant group (0.43). Mean
kappa values significantly increased following training for the Consultant and Trainee
groups but not for the Nurse group – see table 57. Post-training levels of agreement were
‘fair’ for the Nurse group (0.46) and Consultant group (0.55) and ‘good’ for the Trainee
group (0.60).
Table 57 - Interobserver agreement pre- and post-training
Mean Pre-training
kappa (95% CI)
Mean Post-training
kappa (95% CI)
Pre vs Post kappa
change, p value
Consultants 0.43 (0.38-0.48) 0.55 (0.48-0.62) 0.002
Trainees 0.35 (0.28-0.41) 0.60 (0.55-0.64) 0.027
Nurses 0.39 (0.31-0.46) 0.46 (0.37-0.55) 0.193
8.4.5 Performance by modality
Performance was also analysed by modality pre-and post-training. For consultants and
trainees there was no significant differences in overall accuracy between WL, IC and MIC
assessments either pre- or post-training – see table 58. In the nurse group pre-training
accuracy was significantly higher for IC assessments compared to WL (P = 0.021) and for
MIC assessments compared to WL (P=0.016). There was no significant difference in
accuracy between IC and MIC assessments pre-training. In the nurse group post-training
there were no significant differences between assessments made with the three
modalities.
196
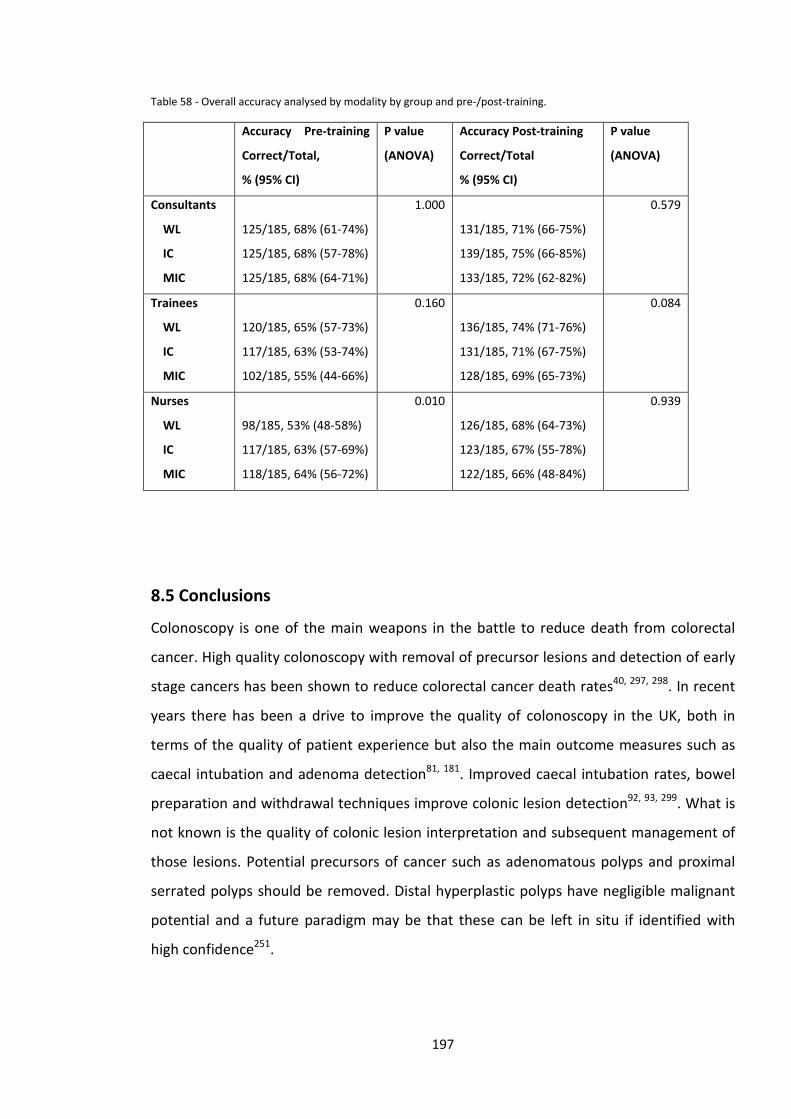
Table 58 - Overall accuracy analysed by modality by group and pre-/post-training.
Accuracy Pre-training
Correct/Total,
% (95% CI)
P value
(ANOVA)
Accuracy Post-training
Correct/Total
% (95% CI)
P value
(ANOVA)
Consultants
WL
IC
MIC
125/185, 68% (61-74%)
125/185, 68% (57-78%)
125/185, 68% (64-71%)
1.000
131/185, 71% (66-75%)
139/185, 75% (66-85%)
133/185, 72% (62-82%)
0.579
Trainees
WL
IC
MIC
120/185, 65% (57-73%)
117/185, 63% (53-74%)
102/185, 55% (44-66%)
0.160
136/185, 74% (71-76%)
131/185, 71% (67-75%)
128/185, 69% (65-73%)
0.084
Nurses
WL
IC
MIC
98/185, 53% (48-58%)
117/185, 63% (57-69%)
118/185, 64% (56-72%)
0.010
126/185, 68% (64-73%)
123/185, 67% (55-78%)
122/185, 66% (48-84%)
0.939
8.5 Conclusions
Colonoscopy is one of the main weapons in the battle to reduce death from colorectal
cancer. High quality colonoscopy with removal of precursor lesions and detection of early
stage cancers has been shown to reduce colorectal cancer death rates40, 297, 298. In recent
years there has been a drive to improve the quality of colonoscopy in the UK, both in
terms of the quality of patient experience but also the main outcome measures such as
caecal intubation and adenoma detection81, 181. Improved caecal intubation rates, bowel
preparation and withdrawal techniques improve colonic lesion detection92, 93, 299. What is
not known is the quality of colonic lesion interpretation and subsequent management of
those lesions. Potential precursors of cancer such as adenomatous polyps and proximal
serrated polyps should be removed. Distal hyperplastic polyps have negligible malignant
potential and a future paradigm may be that these can be left in situ if identified with
high confidence251.
197
Interpretation of larger colonic lesions can be difficult: Benign laterally spreading tumours
(LST) are amenable to endoscopic resection (ER). However over-enthusiastic biopsy of
these lesions has been shown to lead to submucosal fibrosis, hampering subsequent
attempts at ER300. Conversely, for lesions which have areas showing features of
submucosal invasion such as irregular Kudo pit pattern124, 125 or depressed areas258 ER
should generally not be attempted and referral for surgery should be made following
biopsy and tattooing. LSTs cannot be assessed by biopsy alone and in-vivo diagnostic skills
are vital for appropriate management to be instituted.
This picture based study examined colonic lesion assessment skills in 3 groups of
endoscopists (trainees, consultants and experts) plus UK Bowel Cancer screening nurses
who do not perform any endoscopic procedures. The results would suggest that lesion
assessment skills are not simply obtained through routine colonoscopy experience. They
are specific skills which can be learnt through focused education and training.
The results of this study demonstrate that the baseline level of lesion assessment skills is
limited for gastroenterology consultants and trainees. Overall accuracy improved
significantly for all 3 groups after a brief intervention but the magnitude of the increase in
accuracy was small. However this does demonstrate that even a brief intervention can
improve diagnostic accuracy. When sensitivity and specificity for neoplasia were assessed
there was significant improvement for the 15 subjects analysed as a whole. However,
when analysed by group, the improvement in sensitivity was only significant in the Nurse
group and improvement in specificity was only significant in the Trainee group. Specificity
for the Trainee and Nurse groups was lower pre-training than the consultant group which
may be explained by these groups being more risk-averse and concerned about under-
calling a potential neoplastic lesion. Consultants, by the nature of their job, are key
decision makers and are more used to making risk-assessments on a regular basis. It is
also notable that post-training confidence intervals were much narrower for sensitivity
than for specificity, indicating greater variability between subjects in their ability to
identify non-neoplastic lesions.
The 2 expert endoscopists who used in vivo diagnostic techniques such as indigo carmine
chromoendoscopy frequently in their usual practice showed significantly higher accuracy
198
levels than each of the other 3 groups. This is unsurprising and simply validates the
assessment tool. Prior to the training intervention there were no significant differences in
accuracy between Consultant, Trainee and Nurse groups. Post-training again there was no
difference in overall accuracy between the three non-expert groups. This is despite the
consultant group having many years and several thousand procedures greater experience
in colonoscopy and in vivo interpretation of hundreds-thousands of colonic lesions in real-
life clinical practice. The results of this study suggest that there is room for improvement
in lesion assessment amongst both trainees and experienced consultants with neither
group performing any better than non-endoscopist nurses.
Following the brief training intervention delivered to the 3 non-Expert groups the mean
accuracy of the 15 subjects combined improved significantly. Subgroup analysis showed
that a significant gain in mean accuracy was seen in all three groups, when the
performance of the 5 participants in each groups was analysed together. However, as can
be seen in figure 57, improvement was not seen for every individual participant.
Significant improvement in inter-observer agreement was also seen in the Consultant and
Registrar groups following the training intervention.
Overall the gains in accuracy seen following training were modest (from a mean of 63% to
70% for the 15 subjects overall). Previous similar studies have shown greater
improvements in accuracy using a similar brief training intervention. Raghavendra et al.,
demonstrated an improvement in accuracy from 47.6% to 90.8% in distinguishing
hyperplastic and adenomatous polyps viewed with narrow-band imaging (NBI) following a
20 minute training session301. Ignjatovic et al., performed a similar computer-based
training study and showed improvement in differentiation between hyperplastic and
adenomatous polyps viewed with NBI302. A similar study to ours using the same image
library as our study showed limited improvements with training in interpreting white light
and chromoendoscopy images of hyperplastic and adenomatous polyps296. However
improvements in accuracy in interpreting NBI images were greater. Our study does differ
from those described above in that three categories of colonic lesions were included
(hyperplastic polyps, adenomatous polyps and early invasive cancers), rather than two
(hyperplastic and adenomatous polyps) and hence the chances of a correct result from a
199
‘guess’ would be lower. The difference in results may indicate that it may be easier to
learn interpretation of NBI rather than traditional chromoendoscopy.
Apart from in the Nurse group pre-training, no significant differences in accuracy were
found when assessments made with different modalities (WL/IC/MIC) were compared, so
the potential advantage of IC chromoendoscopy for in vivo characterisation
demonstrated in many previous studies is likely to require a longer dedicated period of
experience and training. Trainees actually performed best with WL (although not
statistically different to IC/MIC) and therefore, at least initially they may find IC/MIC
images difficult to interpret despite brief training.
Whereas other studies focussed mainly on interpretation of vascular and surface
patterns, our training module also included information on overall lesion morphology
according to the Paris classification258. The amount of information included may have
been too much for the participants to acquire within a 20 minute training session.
Following training, the overall accuracy of the 3 non-expert groups fell well short of that
achieved by experts. It is likely that to become highly proficient in in-vivo assessment
requires not only learning through studying images but incorporation of advanced
imaging and chromoendoscopy techniques into an endoscopists regular daily practice
over a prolonged period of time. Mentoring and teaching during real life cases is also
likely to be an important part of the learning process.
If in-vivo diagnosis is to become a part of routine clinical care then training programmes
will need to be developed and robust methods for assessing competence established.
This study would suggest that training is more complex than a simple brief intervention,
and does not support the findings of earlier studies suggesting that in-vivo diagnosis can
be learnt in as little as 20 minutes301, 302. This would be in keeping with the results seen in
community-based in-vivo diagnosis studies where the results were sub optimal219, 226, 235,
254.
This study had some limitations: picture based studies do not always reflect real-life in-
vivo interpretation of lesions. The spectrum of lesions included a far higher proportion of
early cancers than would be encountered in everyday practice.
200
In summary our study showed gains in diagnostic accuracy of lesions viewed following a
brief training intervention. Before and after training there was no difference in mean
accuracy between consultants, registrars and nurses, however two expert endoscopists
had significantly greater accuracy in lesion characterisation.
At present, even basic in-vivo diagnostic skills and lesion assessment do not feature in the
curriculum for higher specialist trainees in gastroenterology in the UK. Given the advances
in this field over the past few years there is a strong case for lesion assessment to become
a standard part of training in colonoscopy, which should be learnt alongside technical
skills for endoscope handing and therapeutic procedures.
201
Chapter 9 - Endoscopic characterisation of small colonic polyps – comparison between medical students, registrars
and consultants and the impact of a novel web-based training intervention
9.1 Introduction
Small colonic polyp characterisation has been identified as a key goal for novel
endoscopic advanced imaging techniques and is an area of much research activity251. As
described in previous chapters, whilst experts and those with an interest in-vivo
diagnostic techniques can obtain high levels of accuracy, this level of performance has not
generally been seen in studies of non-expert endoscopists who have no particular
experience or expertise in this area.
Hence the issue of training in advanced diagnostic imaging techniques is of paramount
importance if use of these techniques is to become part of everyday practice in the
endoscopy community as a whole.
Several studies have examined the impact of brief training interventions on small colonic
polyp characterisation. The previously described studies performed by Ignjatovic and
Raghavendra both showed significant improvements in NBI characterisation in picture-
based studies following a training session lasting only 15-20 minutes301, 302. In a similar
study by Neumann et al., 4 subjects underwent a one hour i-Scan training session
followed by interpretation of 110 polyp images in batches of 22233. Feedback was given
after each image and mean accuracy improved from 73.9% in the first set to 94.3% in the
final set. Thus there appears to be a learning effect of feedback. Patel et al.,
demonstrated similar high accuracy rates following a video-based NBI training
programme with feedback after each of 80 polyp videos303. Coe et al., examined the
impact of two one-hour training sessions on the use of NBI for SCP characterisation. They
assessed real-time in-vivo characterisation accuracy of 15 endoscopists who were split
into those receiving training, and a control group, who did not receive training304. No
202
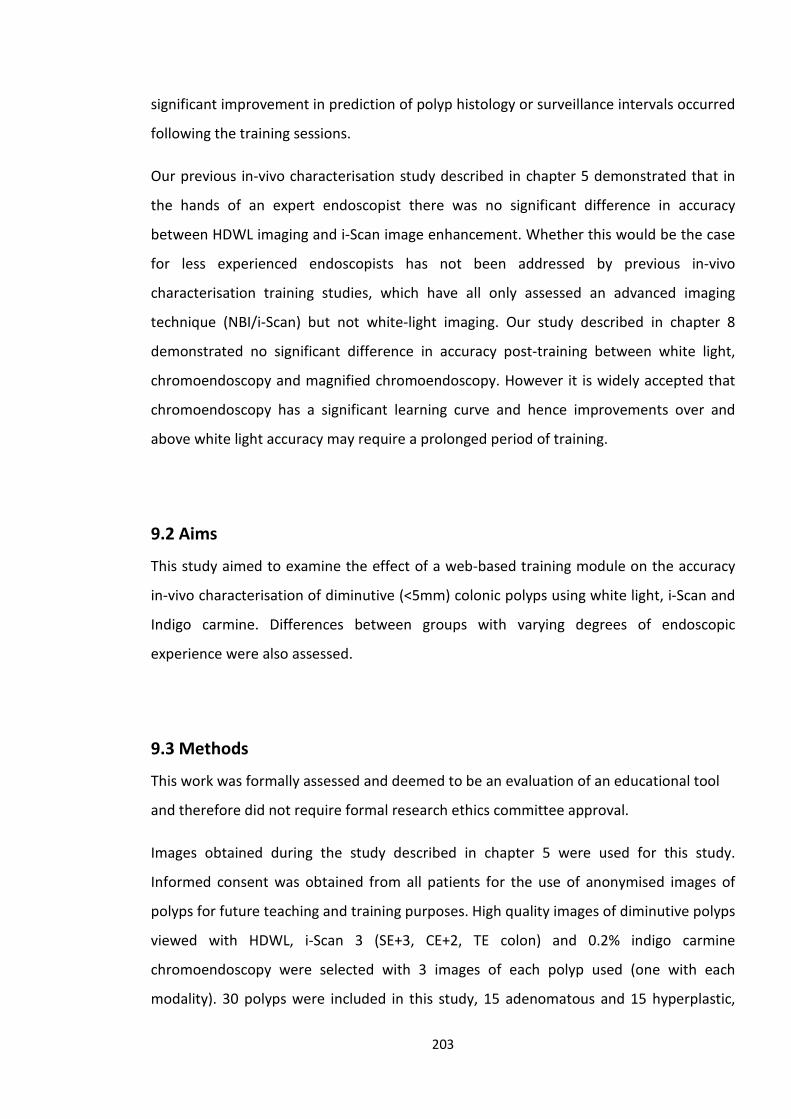
significant improvement in prediction of polyp histology or surveillance intervals occurred
following the training sessions.
Our previous in-vivo characterisation study described in chapter 5 demonstrated that in
the hands of an expert endoscopist there was no significant difference in accuracy
between HDWL imaging and i-Scan image enhancement. Whether this would be the case
for less experienced endoscopists has not been addressed by previous in-vivo
characterisation training studies, which have all only assessed an advanced imaging
technique (NBI/i-Scan) but not white-light imaging. Our study described in chapter 8
demonstrated no significant difference in accuracy post-training between white light,
chromoendoscopy and magnified chromoendoscopy. However it is widely accepted that
chromoendoscopy has a significant learning curve and hence improvements over and
above white light accuracy may require a prolonged period of training.
9.2 Aims
This study aimed to examine the effect of a web-based training module on the accuracy
in-vivo characterisation of diminutive (<5mm) colonic polyps using white light, i-Scan and
Indigo carmine. Differences between groups with varying degrees of endoscopic
experience were also assessed.
9.3 Methods
This work was formally assessed and deemed to be an evaluation of an educational tool
and therefore did not require formal research ethics committee approval.
Images obtained during the study described in chapter 5 were used for this study.
Informed consent was obtained from all patients for the use of anonymised images of
polyps for future teaching and training purposes. High quality images of diminutive polyps
viewed with HDWL, i-Scan 3 (SE+3, CE+2, TE colon) and 0.2% indigo carmine
chromoendoscopy were selected with 3 images of each polyp used (one with each
modality). 30 polyps were included in this study, 15 adenomatous and 15 hyperplastic,
203
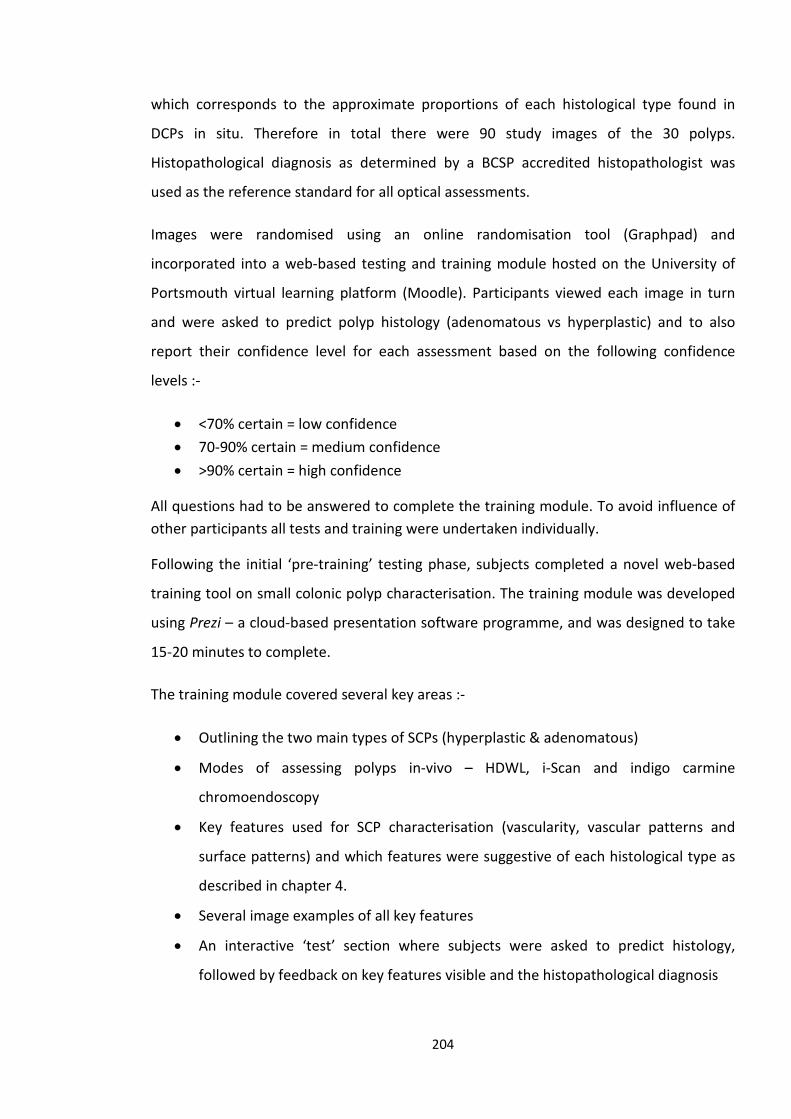
which corresponds to the approximate proportions of each histological type found in
DCPs in situ. Therefore in total there were 90 study images of the 30 polyps.
Histopathological diagnosis as determined by a BCSP accredited histopathologist was
used as the reference standard for all optical assessments.
Images were randomised using an online randomisation tool (Graphpad) and
incorporated into a web-based testing and training module hosted on the University of
Portsmouth virtual learning platform (Moodle). Participants viewed each image in turn
and were asked to predict polyp histology (adenomatous vs hyperplastic) and to also
report their confidence level for each assessment based on the following confidence
levels :-
• <70% certain = low confidence • 70-90% certain = medium confidence • >90% certain = high confidence
All questions had to be answered to complete the training module. To avoid influence of other participants all tests and training were undertaken individually.
Following the initial ‘pre-training’ testing phase, subjects completed a novel web-based
training tool on small colonic polyp characterisation. The training module was developed
using Prezi – a cloud-based presentation software programme, and was designed to take
15-20 minutes to complete.
The training module covered several key areas :-
• Outlining the two main types of SCPs (hyperplastic & adenomatous)
• Modes of assessing polyps in-vivo – HDWL, i-Scan and indigo carmine
chromoendoscopy
• Key features used for SCP characterisation (vascularity, vascular patterns and
surface patterns) and which features were suggestive of each histological type as
described in chapter 4.
• Several image examples of all key features
• An interactive ‘test’ section where subjects were asked to predict histology,
followed by feedback on key features visible and the histopathological diagnosis
204
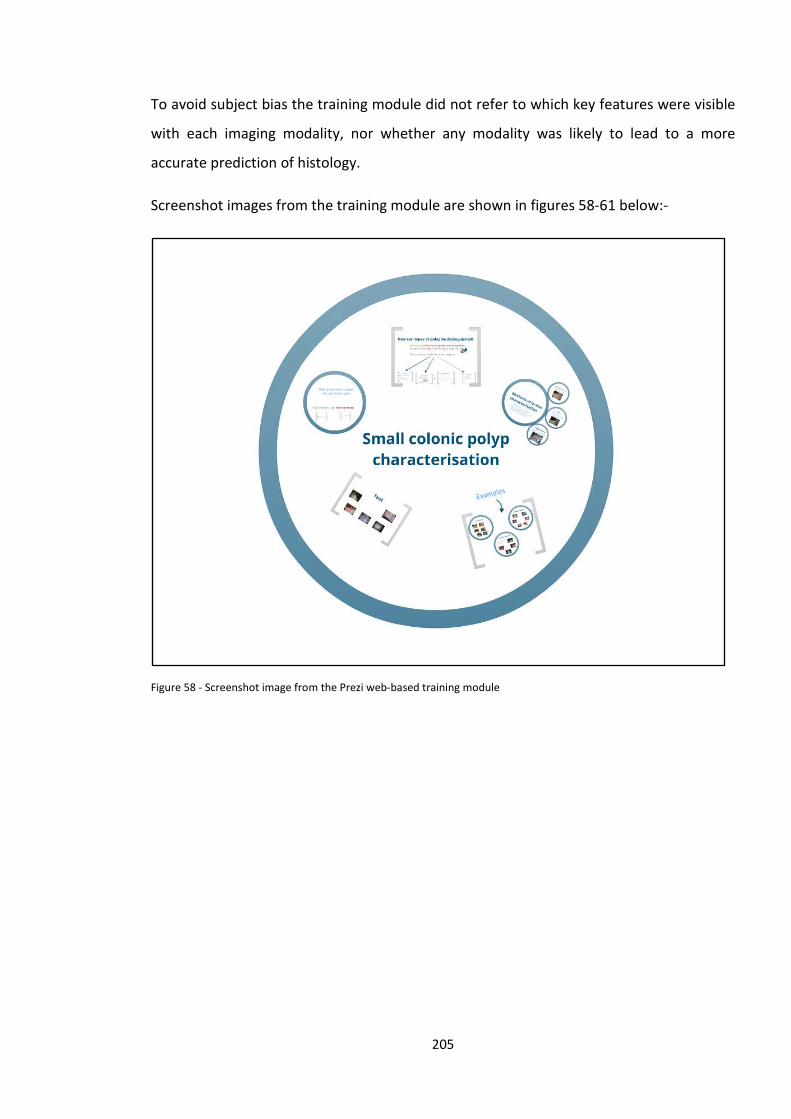
To avoid subject bias the training module did not refer to which key features were visible
with each imaging modality, nor whether any modality was likely to lead to a more
accurate prediction of histology.
Screenshot images from the training module are shown in figures 58-61 below:-
Figure 58 - Screenshot image from the Prezi web-based training module
205
Figure 59 - Screenshot image from the Prezi web-based training module
Figure 60 - Screenshot image from the Prezi web-based training module
206
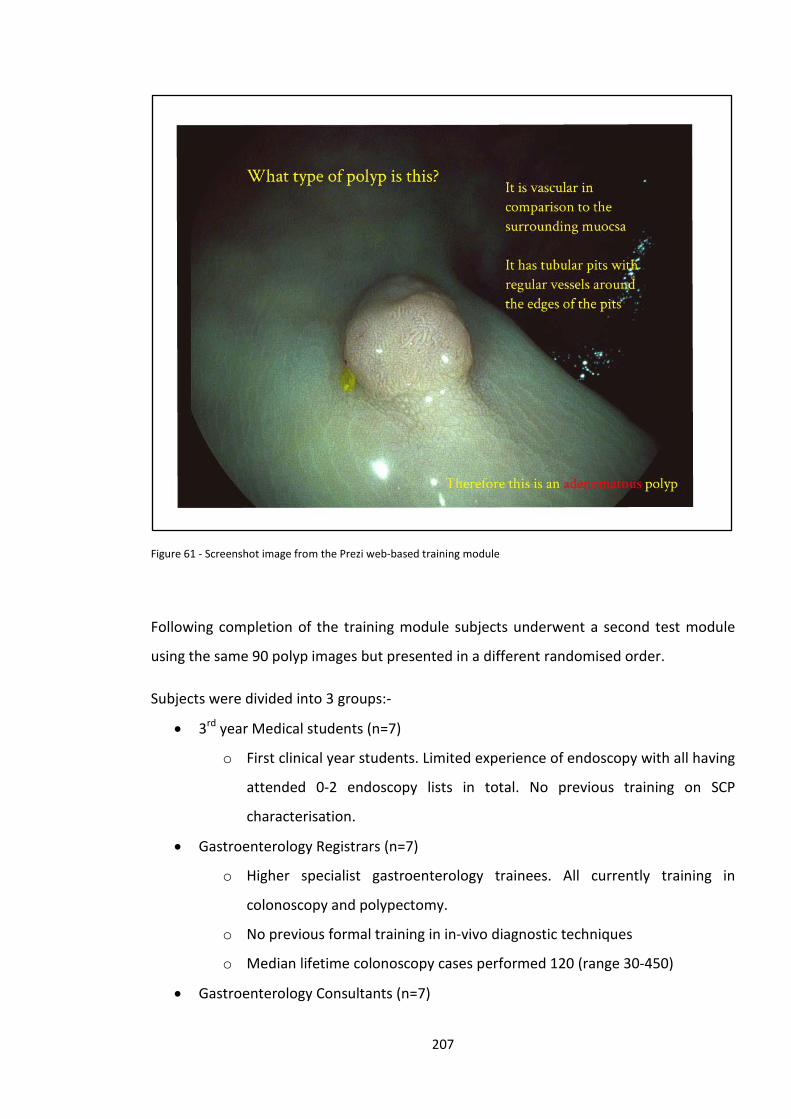
Figure 61 - Screenshot image from the Prezi web-based training module
Following completion of the training module subjects underwent a second test module
using the same 90 polyp images but presented in a different randomised order.
Subjects were divided into 3 groups:-
• 3rd year Medical students (n=7)
o First clinical year students. Limited experience of endoscopy with all having
attended 0-2 endoscopy lists in total. No previous training on SCP
characterisation.
• Gastroenterology Registrars (n=7)
o Higher specialist gastroenterology trainees. All currently training in
colonoscopy and polypectomy.
o No previous formal training in in-vivo diagnostic techniques
o Median lifetime colonoscopy cases performed 120 (range 30-450)
• Gastroenterology Consultants (n=7)
207
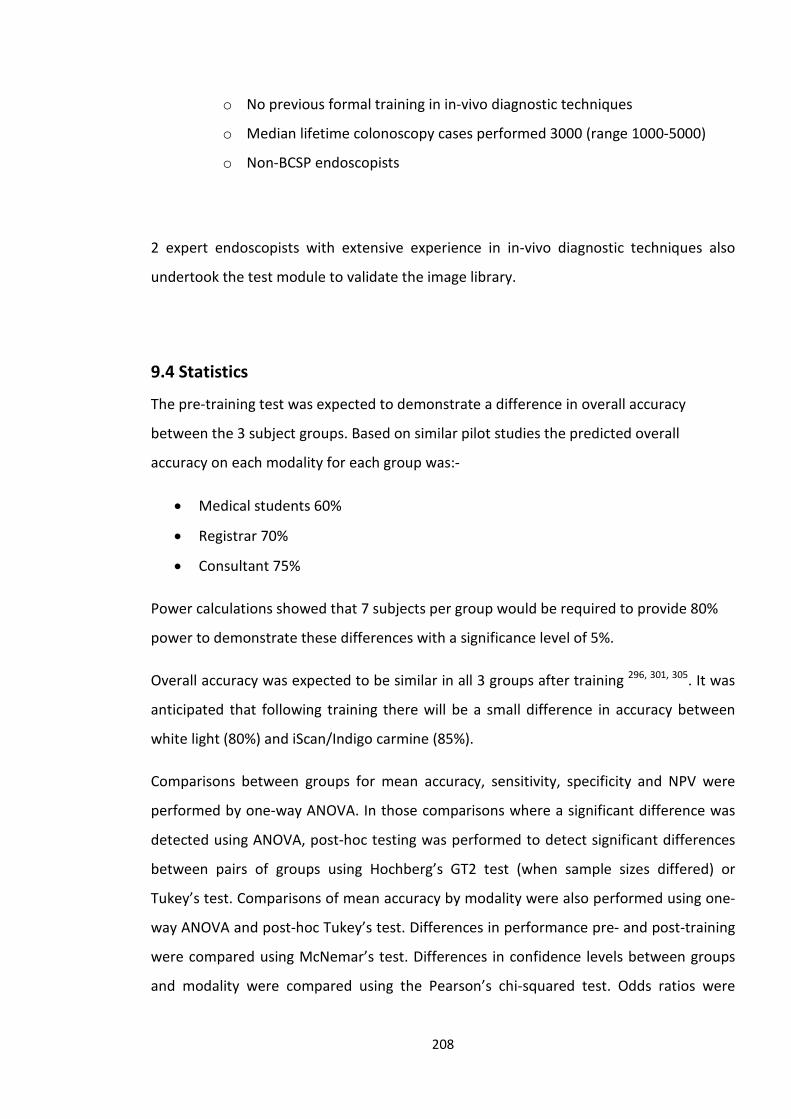
o No previous formal training in in-vivo diagnostic techniques
o Median lifetime colonoscopy cases performed 3000 (range 1000-5000)
o Non-BCSP endoscopists
2 expert endoscopists with extensive experience in in-vivo diagnostic techniques also
undertook the test module to validate the image library.
9.4 Statistics
The pre-training test was expected to demonstrate a difference in overall accuracy
between the 3 subject groups. Based on similar pilot studies the predicted overall
accuracy on each modality for each group was:-
• Medical students 60%
• Registrar 70%
• Consultant 75%
Power calculations showed that 7 subjects per group would be required to provide 80%
power to demonstrate these differences with a significance level of 5%.
Overall accuracy was expected to be similar in all 3 groups after training 296, 301, 305. It was
anticipated that following training there will be a small difference in accuracy between
white light (80%) and iScan/Indigo carmine (85%).
Comparisons between groups for mean accuracy, sensitivity, specificity and NPV were
performed by one-way ANOVA. In those comparisons where a significant difference was
detected using ANOVA, post-hoc testing was performed to detect significant differences
between pairs of groups using Hochberg’s GT2 test (when sample sizes differed) or
Tukey’s test. Comparisons of mean accuracy by modality were also performed using one-
way ANOVA and post-hoc Tukey’s test. Differences in performance pre- and post-training
were compared using McNemar’s test. Differences in confidence levels between groups
and modality were compared using the Pearson’s chi-squared test. Odds ratios were
208
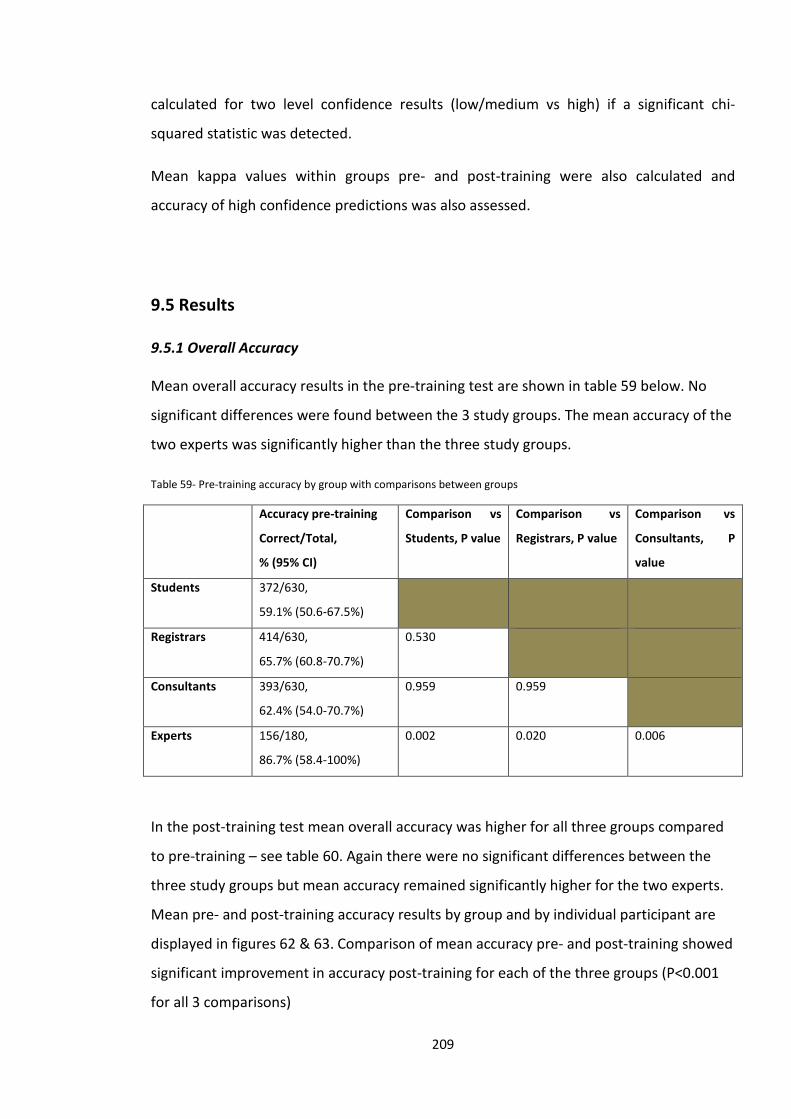
calculated for two level confidence results (low/medium vs high) if a significant chi-
squared statistic was detected.
Mean kappa values within groups pre- and post-training were also calculated and
accuracy of high confidence predictions was also assessed.
9.5 Results
9.5.1 Overall Accuracy
Mean overall accuracy results in the pre-training test are shown in table 59 below. No
significant differences were found between the 3 study groups. The mean accuracy of the
two experts was significantly higher than the three study groups.
Table 59- Pre-training accuracy by group with comparisons between groups
Accuracy pre-training
Correct/Total,
% (95% CI)
Comparison vs
Students, P value
Comparison vs
Registrars, P value
Comparison vs
Consultants, P
value
Students 372/630,
59.1% (50.6-67.5%)
Registrars 414/630,
65.7% (60.8-70.7%)
0.530
Consultants 393/630,
62.4% (54.0-70.7%)
0.959 0.959
Experts 156/180,
86.7% (58.4-100%)
0.002 0.020 0.006
In the post-training test mean overall accuracy was higher for all three groups compared
to pre-training – see table 60. Again there were no significant differences between the
three study groups but mean accuracy remained significantly higher for the two experts.
Mean pre- and post-training accuracy results by group and by individual participant are
displayed in figures 62 & 63. Comparison of mean accuracy pre- and post-training showed
significant improvement in accuracy post-training for each of the three groups (P<0.001
for all 3 comparisons)
209
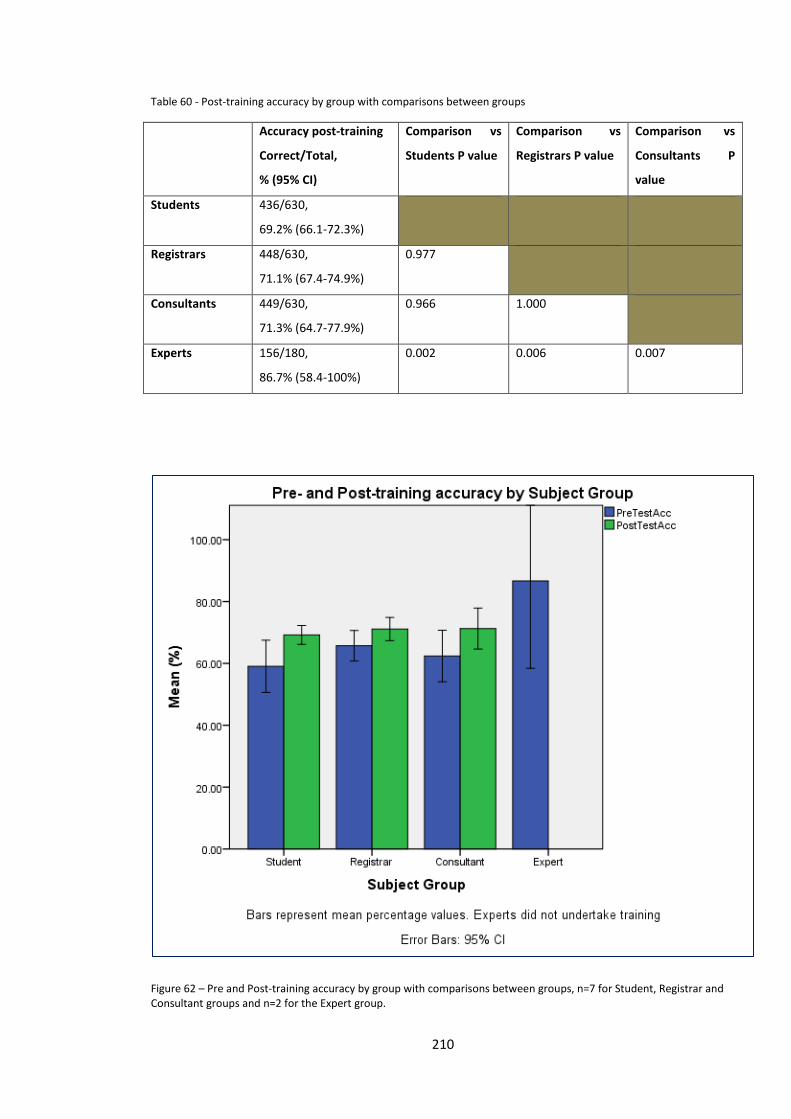
Table 60 - Post-training accuracy by group with comparisons between groups
Accuracy post-training
Correct/Total,
% (95% CI)
Comparison vs
Students P value
Comparison vs
Registrars P value
Comparison vs
Consultants P
value
Students 436/630,
69.2% (66.1-72.3%)
Registrars 448/630,
71.1% (67.4-74.9%)
0.977
Consultants 449/630,
71.3% (64.7-77.9%)
0.966 1.000
Experts 156/180,
86.7% (58.4-100%)
0.002 0.006 0.007
Figure 62 – Pre and Post-training accuracy by group with comparisons between groups, n=7 for Student, Registrar and Consultant groups and n=2 for the Expert group.
210
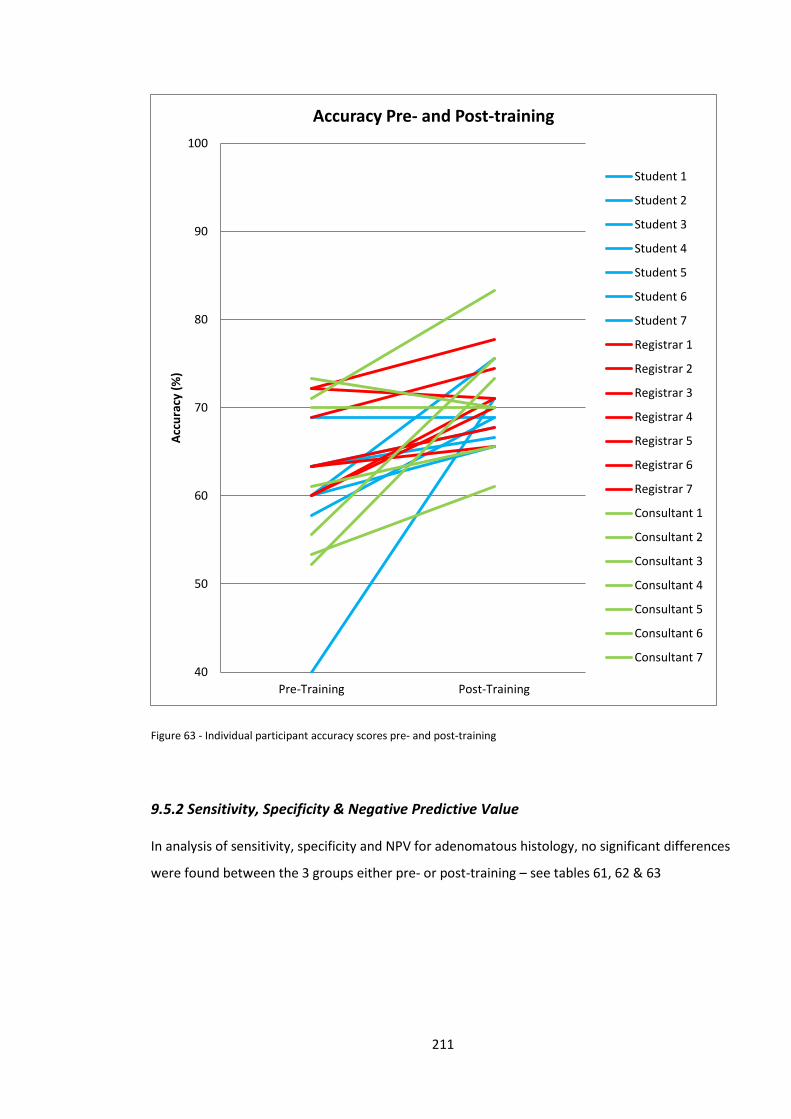
Figure 63 - Individual participant accuracy scores pre- and post-training
9.5.2 Sensitivity, Specificity & Negative Predictive Value
In analysis of sensitivity, specificity and NPV for adenomatous histology, no significant differences
were found between the 3 groups either pre- or post-training – see tables 61, 62 & 63
40
50
60
70
80
90
100
Pre-Training Post-Training
Accu
racy
(%)
Accuracy Pre- and Post-training
Student 1
Student 2
Student 3
Student 4
Student 5
Student 6
Student 7
Registrar 1
Registrar 2
Registrar 3
Registrar 4
Registrar 5
Registrar 6
Registrar 7
Consultant 1
Consultant 2
Consultant 3
Consultant 4
Consultant 5
Consultant 6
Consultant 7
211
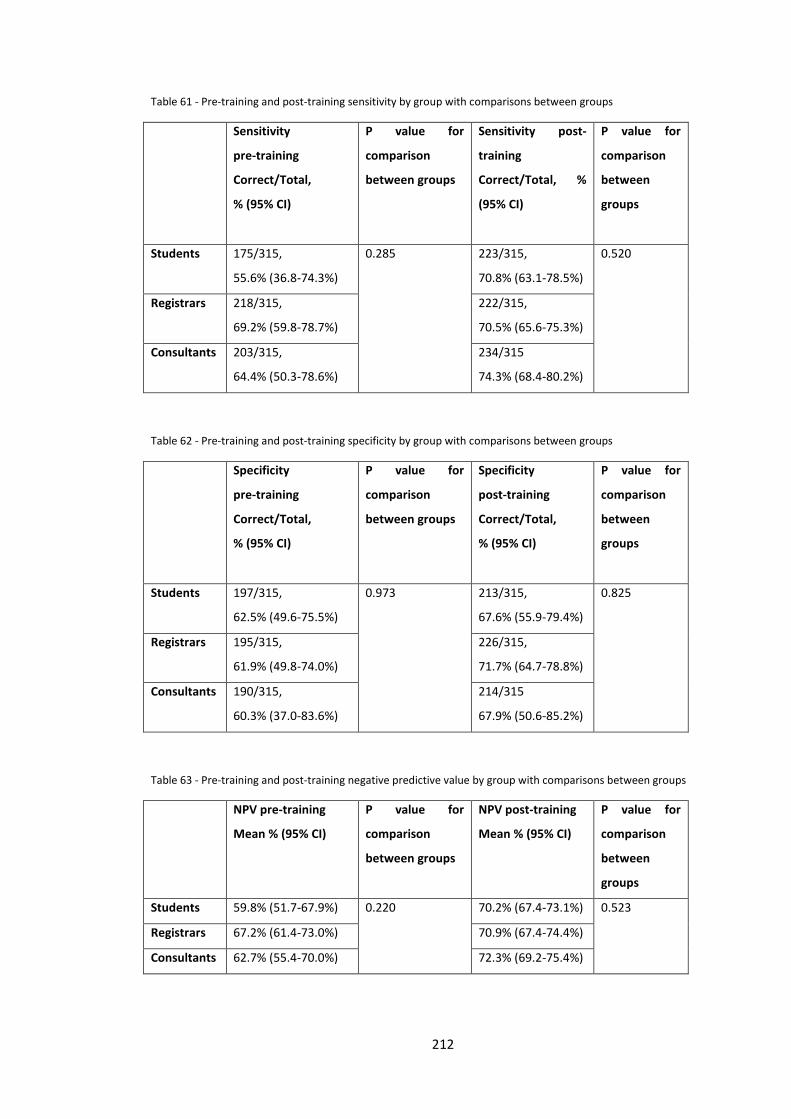
Table 61 - Pre-training and post-training sensitivity by group with comparisons between groups
Sensitivity
pre-training
Correct/Total,
% (95% CI)
P value for
comparison
between groups
Sensitivity post-
training
Correct/Total, %
(95% CI)
P value for
comparison
between
groups
Students 175/315,
55.6% (36.8-74.3%)
0.285 223/315,
70.8% (63.1-78.5%)
0.520
Registrars 218/315,
69.2% (59.8-78.7%)
222/315,
70.5% (65.6-75.3%)
Consultants 203/315,
64.4% (50.3-78.6%)
234/315
74.3% (68.4-80.2%)
Table 62 - Pre-training and post-training specificity by group with comparisons between groups
Specificity
pre-training
Correct/Total,
% (95% CI)
P value for
comparison
between groups
Specificity
post-training
Correct/Total,
% (95% CI)
P value for
comparison
between
groups
Students 197/315,
62.5% (49.6-75.5%)
0.973 213/315,
67.6% (55.9-79.4%)
0.825
Registrars 195/315,
61.9% (49.8-74.0%)
226/315,
71.7% (64.7-78.8%)
Consultants 190/315,
60.3% (37.0-83.6%)
214/315
67.9% (50.6-85.2%)
Table 63 - Pre-training and post-training negative predictive value by group with comparisons between groups
NPV pre-training
Mean % (95% CI)
P value for
comparison
between groups
NPV post-training
Mean % (95% CI)
P value for
comparison
between
groups
Students 59.8% (51.7-67.9%) 0.220 70.2% (67.4-73.1%) 0.523
Registrars 67.2% (61.4-73.0%) 70.9% (67.4-74.4%)
Consultants 62.7% (55.4-70.0%) 72.3% (69.2-75.4%)
212
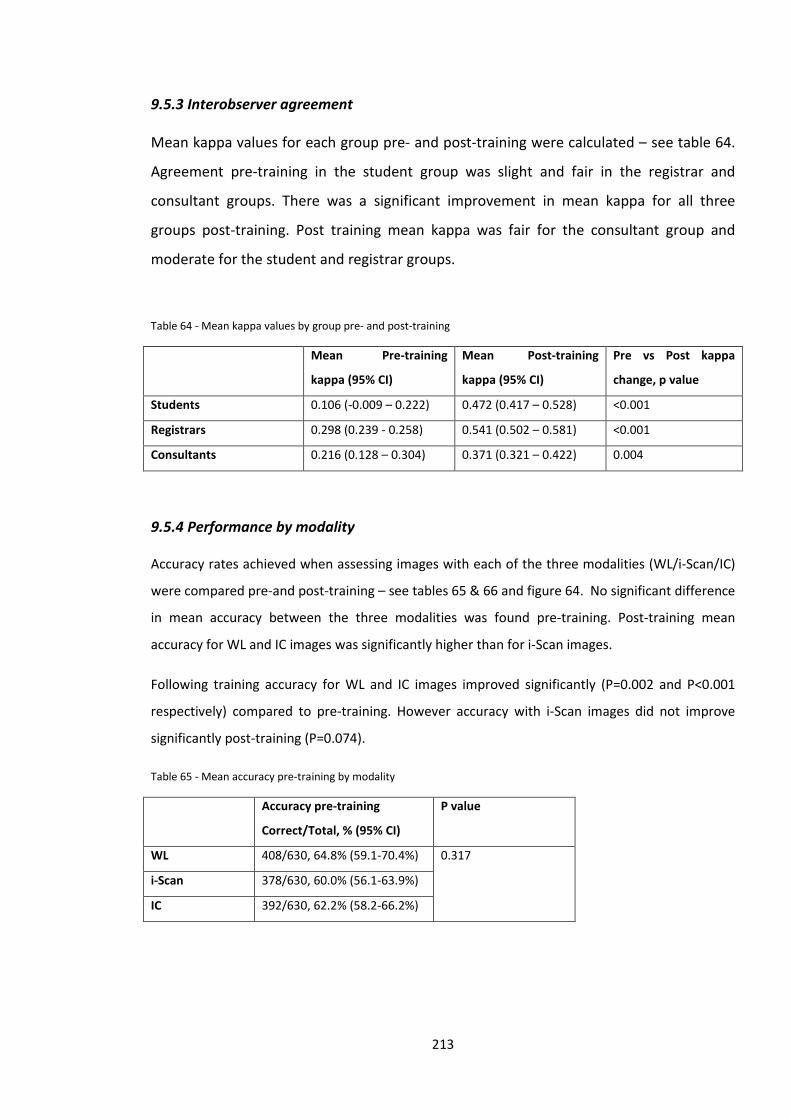
9.5.3 Interobserver agreement
Mean kappa values for each group pre- and post-training were calculated – see table 64.
Agreement pre-training in the student group was slight and fair in the registrar and
consultant groups. There was a significant improvement in mean kappa for all three
groups post-training. Post training mean kappa was fair for the consultant group and
moderate for the student and registrar groups.
Table 64 - Mean kappa values by group pre- and post-training
Mean Pre-training
kappa (95% CI)
Mean Post-training
kappa (95% CI)
Pre vs Post kappa
change, p value
Students 0.106 (-0.009 – 0.222) 0.472 (0.417 – 0.528) <0.001
Registrars 0.298 (0.239 - 0.258) 0.541 (0.502 – 0.581) <0.001
Consultants 0.216 (0.128 – 0.304) 0.371 (0.321 – 0.422) 0.004
9.5.4 Performance by modality
Accuracy rates achieved when assessing images with each of the three modalities (WL/i-Scan/IC)
were compared pre-and post-training – see tables 65 & 66 and figure 64. No significant difference
in mean accuracy between the three modalities was found pre-training. Post-training mean
accuracy for WL and IC images was significantly higher than for i-Scan images.
Following training accuracy for WL and IC images improved significantly (P=0.002 and P<0.001
respectively) compared to pre-training. However accuracy with i-Scan images did not improve
significantly post-training (P=0.074).
Table 65 - Mean accuracy pre-training by modality
Accuracy pre-training
Correct/Total, % (95% CI)
P value
WL 408/630, 64.8% (59.1-70.4%) 0.317
i-Scan 378/630, 60.0% (56.1-63.9%)
IC 392/630, 62.2% (58.2-66.2%)
213
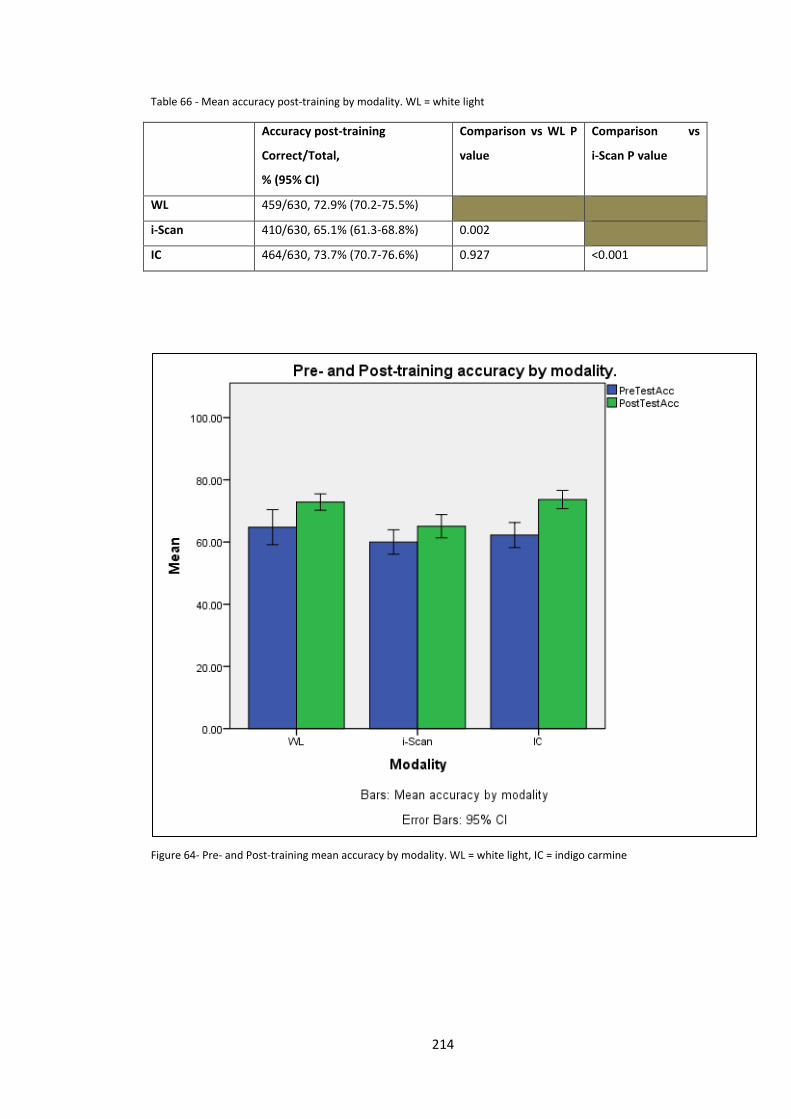
Table 66 - Mean accuracy post-training by modality. WL = white light
Accuracy post-training
Correct/Total,
% (95% CI)
Comparison vs WL P
value
Comparison vs
i-Scan P value
WL 459/630, 72.9% (70.2-75.5%)
i-Scan 410/630, 65.1% (61.3-68.8%) 0.002
IC 464/630, 73.7% (70.7-76.6%) 0.927 <0.001
Figure 64- Pre- and Post-training mean accuracy by modality. WL = white light, IC = indigo carmine
214
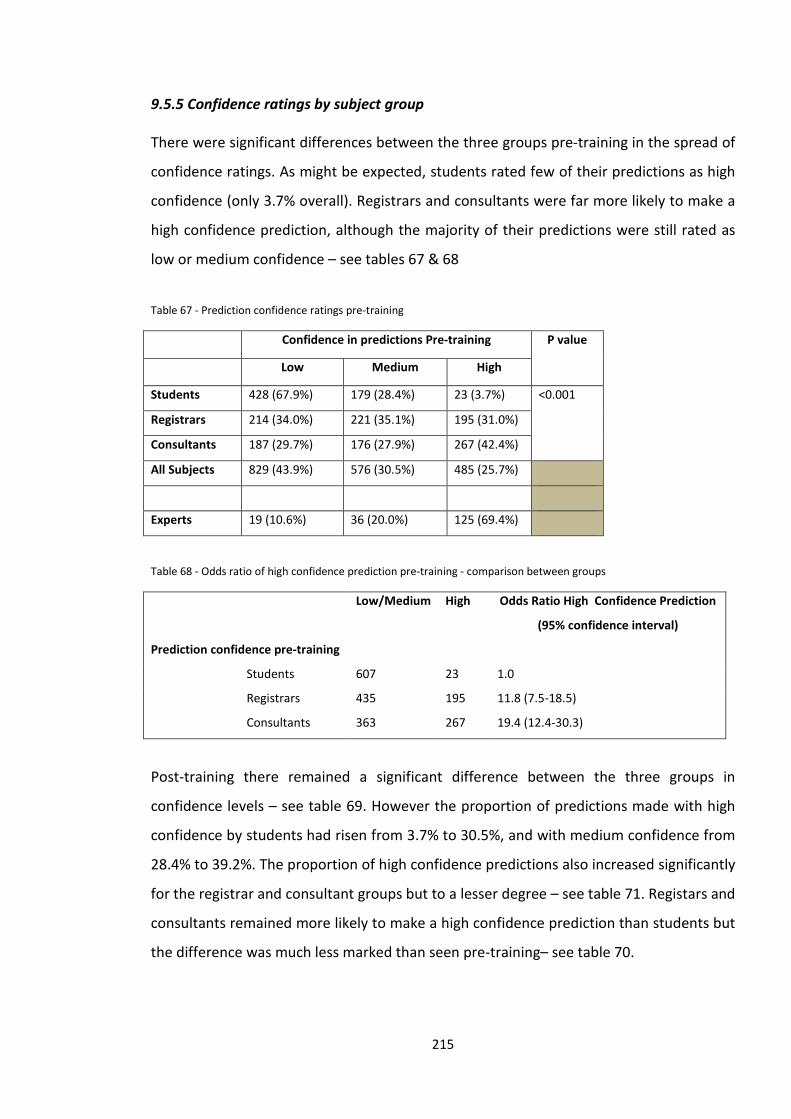
9.5.5 Confidence ratings by subject group
There were significant differences between the three groups pre-training in the spread of
confidence ratings. As might be expected, students rated few of their predictions as high
confidence (only 3.7% overall). Registrars and consultants were far more likely to make a
high confidence prediction, although the majority of their predictions were still rated as
low or medium confidence – see tables 67 & 68
Table 67 - Prediction confidence ratings pre-training
Confidence in predictions Pre-training P value
Low Medium High
Students 428 (67.9%) 179 (28.4%) 23 (3.7%) <0.001
Registrars 214 (34.0%) 221 (35.1%) 195 (31.0%)
Consultants 187 (29.7%) 176 (27.9%) 267 (42.4%)
All Subjects 829 (43.9%) 576 (30.5%) 485 (25.7%)
Experts 19 (10.6%) 36 (20.0%) 125 (69.4%)
Table 68 - Odds ratio of high confidence prediction pre-training - comparison between groups
Low/Medium High Odds Ratio High Confidence Prediction
(95% confidence interval)
Prediction confidence pre-training
Students
Registrars
Consultants
607 23 1.0
435 195 11.8 (7.5-18.5)
363 267 19.4 (12.4-30.3)
Post-training there remained a significant difference between the three groups in
confidence levels – see table 69. However the proportion of predictions made with high
confidence by students had risen from 3.7% to 30.5%, and with medium confidence from
28.4% to 39.2%. The proportion of high confidence predictions also increased significantly
for the registrar and consultant groups but to a lesser degree – see table 71. Registars and
consultants remained more likely to make a high confidence prediction than students but
the difference was much less marked than seen pre-training– see table 70.
215
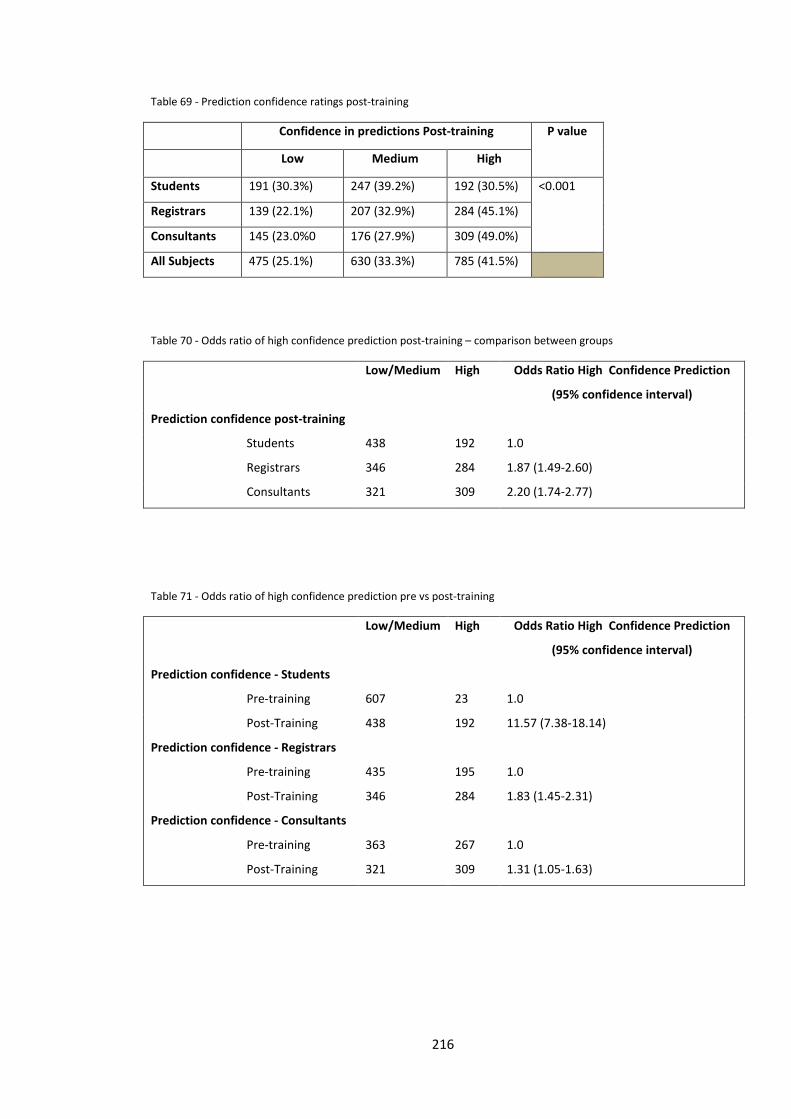
Table 69 - Prediction confidence ratings post-training
Confidence in predictions Post-training P value
Low Medium High
Students 191 (30.3%) 247 (39.2%) 192 (30.5%) <0.001
Registrars 139 (22.1%) 207 (32.9%) 284 (45.1%)
Consultants 145 (23.0%0 176 (27.9%) 309 (49.0%)
All Subjects 475 (25.1%) 630 (33.3%) 785 (41.5%)
Table 70 - Odds ratio of high confidence prediction post-training – comparison between groups
Low/Medium High Odds Ratio High Confidence Prediction
(95% confidence interval)
Prediction confidence post-training
Students
Registrars
Consultants
438 192 1.0
346 284 1.87 (1.49-2.60)
321 309 2.20 (1.74-2.77)
Table 71 - Odds ratio of high confidence prediction pre vs post-training
Low/Medium High Odds Ratio High Confidence Prediction
(95% confidence interval)
Prediction confidence - Students
Pre-training
Post-Training
Prediction confidence - Registrars
Pre-training
Post-Training
Prediction confidence - Consultants
Pre-training
Post-Training
607 23 1.0
438 192 11.57 (7.38-18.14)
435
346
363
321
195
284
267
309
1.0
1.83 (1.45-2.31)
1.0
1.31 (1.05-1.63)
216
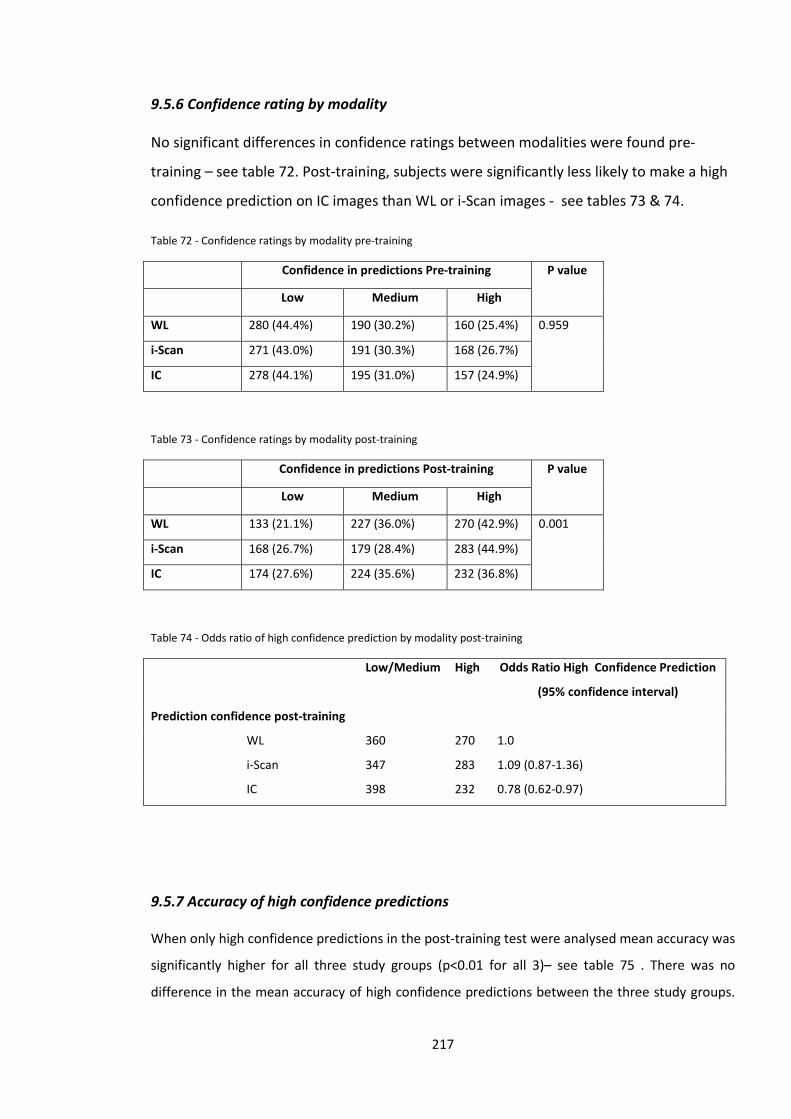
9.5.6 Confidence rating by modality
No significant differences in confidence ratings between modalities were found pre-
training – see table 72. Post-training, subjects were significantly less likely to make a high
confidence prediction on IC images than WL or i-Scan images - see tables 73 & 74.
Table 72 - Confidence ratings by modality pre-training
Confidence in predictions Pre-training P value
Low Medium High
WL 280 (44.4%) 190 (30.2%) 160 (25.4%) 0.959
i-Scan 271 (43.0%) 191 (30.3%) 168 (26.7%)
IC 278 (44.1%) 195 (31.0%) 157 (24.9%)
Table 73 - Confidence ratings by modality post-training
Confidence in predictions Post-training P value
Low Medium High
WL 133 (21.1%) 227 (36.0%) 270 (42.9%) 0.001
i-Scan 168 (26.7%) 179 (28.4%) 283 (44.9%)
IC 174 (27.6%) 224 (35.6%) 232 (36.8%)
Table 74 - Odds ratio of high confidence prediction by modality post-training
Low/Medium High Odds Ratio High Confidence Prediction
(95% confidence interval)
Prediction confidence post-training
WL
i-Scan
IC
360 270 1.0
347 283 1.09 (0.87-1.36)
398 232 0.78 (0.62-0.97)
9.5.7 Accuracy of high confidence predictions
When only high confidence predictions in the post-training test were analysed mean accuracy was
significantly higher for all three study groups (p<0.01 for all 3)– see table 75 . There was no
difference in the mean accuracy of high confidence predictions between the three study groups.
217
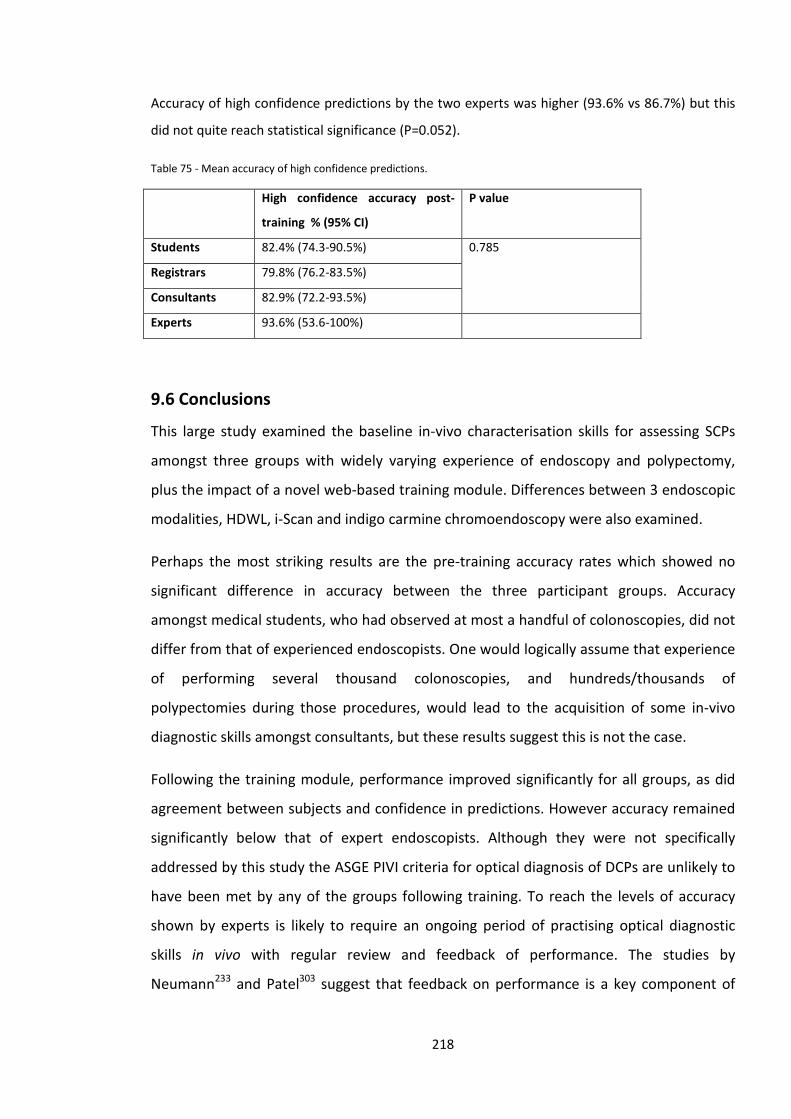
Accuracy of high confidence predictions by the two experts was higher (93.6% vs 86.7%) but this
did not quite reach statistical significance (P=0.052).
Table 75 - Mean accuracy of high confidence predictions.
High confidence accuracy post-
training % (95% CI)
P value
Students 82.4% (74.3-90.5%) 0.785
Registrars 79.8% (76.2-83.5%)
Consultants 82.9% (72.2-93.5%)
Experts 93.6% (53.6-100%)
9.6 Conclusions
This large study examined the baseline in-vivo characterisation skills for assessing SCPs
amongst three groups with widely varying experience of endoscopy and polypectomy,
plus the impact of a novel web-based training module. Differences between 3 endoscopic
modalities, HDWL, i-Scan and indigo carmine chromoendoscopy were also examined.
Perhaps the most striking results are the pre-training accuracy rates which showed no
significant difference in accuracy between the three participant groups. Accuracy
amongst medical students, who had observed at most a handful of colonoscopies, did not
differ from that of experienced endoscopists. One would logically assume that experience
of performing several thousand colonoscopies, and hundreds/thousands of
polypectomies during those procedures, would lead to the acquisition of some in-vivo
diagnostic skills amongst consultants, but these results suggest this is not the case.
Following the training module, performance improved significantly for all groups, as did
agreement between subjects and confidence in predictions. However accuracy remained
significantly below that of expert endoscopists. Although they were not specifically
addressed by this study the ASGE PIVI criteria for optical diagnosis of DCPs are unlikely to
have been met by any of the groups following training. To reach the levels of accuracy
shown by experts is likely to require an ongoing period of practising optical diagnostic
skills in vivo with regular review and feedback of performance. The studies by
Neumann233 and Patel303 suggest that feedback on performance is a key component of
218
learning optical diagnosis skills. Both these studies gave feedback after each question in
their test modules and hence ongoing learning occurred through the testing phase.
Feedback was not given in this study, and if included, may have improved performance.
Studies of brief training interventions show varying results in the accuracy achieved by
participants post-training. In this study, post-training accuracy was around 70% for all 3
groups, which may suggest that training endoscopists to achieve high accuracy rates is
more difficult than suggested in other studies. In another study using i-Scan, participants
achieved 94% accuracy for the final set of study images233. Most other training studies
have used NBI and reported post-training accuracy levels vary from 80%304, 306 to around
90%301-303. Several factors could influence post-training accuracy – ability of participants
to acquire new skills, effectiveness of the training module, imaging modality used and
difficulty of the test module.
As demonstrated in figure 64 there was notable variability between participants in the
improvement in accuracy following training. Of the 21 participants, 17 improved their
scores following training, 3 remained the same and one actually scored lower post-
training. This variability may be explained by differences between subjects in ability and
motivation to acquire new skills.
The training module devised for this study covered several factors used for optical
diagnosis – vascularity, surface patterns and vascular patterns. NBI training modules are
likely to just cover vascularity and vascular patterns and hence may be simpler and less
likely to confuse participants unfamiliar with advanced imaging techniques. The training
module in this study also covered three modalities – HDWL, i-Scan and indigo carmine
chromoendoscopy which may have added complexity and the potential to overload
participants with information.
The test module used in this study may have been more challenging than those used in
other studies. In the similar study performed by Ignjatovic et al., an expert group (one of
whom also participated in this study) achieved 95% accuracy302, compared to 86.7% in
this study. We selected high quality images for this study but did not restrict selection to
polyps which showed very obvious and typical features of either hyperplastic or
adenomatous DCPs, and hence some of the polyps included may have proven to be more
219
‘difficult’ than others. There may be a propensity in studies of this type for researchers to
select images which demonstrate very apparent features of adenomatous and
hyperplastic polyps, which may not represent the full spectrum of DCPs found in clinical
practice. This study used still images for the test module whereas other studies have used
short videos306, 307 which may enable a more accurate assessment to be made.
Whereas most other studies have only assessed training in just one endoscopic modality,
this study compared three different endoscopic modalities, and participants’ ability to
acquire optical diagnosis assessment skills with each of them. As has been discussed in
chapter 5, most published studies suggest that advanced imaging techniques or
chromoendoscopy are superior to white light endoscopy in the assessment of SCPs/DCPs.
However our in-vivo study reported in chapter 5 found that in the hands of an expert
endoscopist there was no significant difference between HDWL, i-Scan and
chromoendoscopy. The results of the study reported in this chapter suggest that this may
also be the case with non-expert endoscopists and novices (medical students). Following
the training module, accuracy with HDWL was not significantly different to that with
chromoendoscopy and was actually significantly higher than accuracy with i-Scan. This
may suggest that optical diagnosis skills with HDWL are easier to acquire than with i-Scan.
Endoscopists may have also been unfamiliar with the i-Scan image, and despite
undergoing the training module, found it more difficult to interpret than a white light
image that they would be used to seeing in everyday practice. Further studies are
required comparing advanced imaging techniques with HDWL imaging to explore whether
HDWL is a viable alternative to NBI/FICE/i-Scan for optical diagnosis. Ongoing research is
also required to determine what further training is needed for a non-expert endoscopist
to achieved optical diagnostic accuracy that can meet the ASGE PIVI criteria. This will
undoubtedly require a period of monitored in vivo training and feedback over a period of
time, in addition to computer/web based initial training. National and international
endoscopy societies will need to set out a clear training and certification process for
optical diagnosis for this to become widespread practice. At present optical diagnosis
skills do not form part of the curriculum for higher gastroenterology trainees in the UK295.
Clearly it would make sense to teach these skills alongside technical skills in endoscopy so
220
that newly qualified consultants have acquired them before entering independent
practice.
221
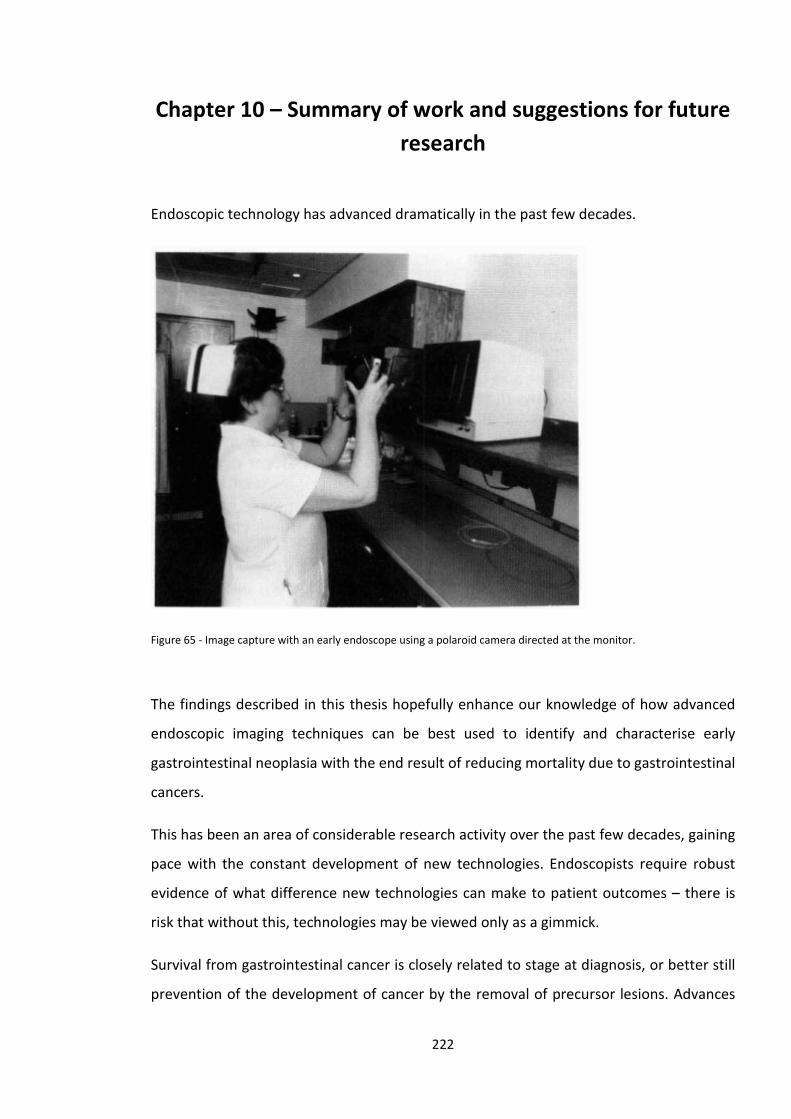
Chapter 10 – Summary of work and suggestions for future research
Endoscopic technology has advanced dramatically in the past few decades.
Figure 65 - Image capture with an early endoscope using a polaroid camera directed at the monitor.
The findings described in this thesis hopefully enhance our knowledge of how advanced
endoscopic imaging techniques can be best used to identify and characterise early
gastrointestinal neoplasia with the end result of reducing mortality due to gastrointestinal
cancers.
This has been an area of considerable research activity over the past few decades, gaining
pace with the constant development of new technologies. Endoscopists require robust
evidence of what difference new technologies can make to patient outcomes – there is
risk that without this, technologies may be viewed only as a gimmick.
Survival from gastrointestinal cancer is closely related to stage at diagnosis, or better still
prevention of the development of cancer by the removal of precursor lesions. Advances
222
in endoscopic technology have enhanced our recognition and understanding of subtle
precancerous lesions such as flat high-grade dysplasia within Barrett’s oesophagus or flat
adenomatous or serrated polyps in the colon. Once identified, accurate lesion
characterisation is crucial to inform decision making regarding appropriate management
– leave in situ, endoscopic resection or biopsy and refer for radical surgery.
The development of a novel classification system for i-Scan demonstrates that the
features of neoplastic and non-neoplastic polyps visible with i-Scan are, in broad terms,
very similar to those found with NBI and FICE. The key features that appear to be
highlighted with these 3 related advanced imaging techniques are vascularity, vascular
patterns and surface patterns. Our results suggest that the main gain when assessing
diminutive polyps is in improved sensitivity for adenomatous polyps. Endoscopists may be
limited to using one particular advanced imaging system by the availability of endoscopic
equipment within their unit. Hence, to aid adoption of optical diagnosis techniques, it
may be beneficial to develop a universal optical diagnosis characterisation system for use
with all 3 technologies (NBI, FICE and i-Scan). Before a universal system could be adopted
it would require validation in large studies in multiple centres with a variety of
endoscopists of varying degrees of experience.
The HiSCOPE study described in chapter 5 broke new ground in the field of endoscopic
characterisation of diminutive colonic polyps – HDWL endoscopy was found to be as
accurate as both i-Scan and chromoendoscopy assessment and met both PIVI criteria set
by the ASGE. This is the first time this standard has been reached using HDWL and
demonstrates that this is possible with appropriate training. Further studies of in-vivo
characterisation using HDWL in endoscopists of varying degrees of experience, are much
needed with assessment of the learning curve involved and comparison with the
performance achieved with enhancement techniques such as i-Scan. It may be the case
that in the hands of less experienced endoscopists, an image enhancement technique
improves optical assessment over HDWL. Indeed, as shown in chapter 4, i-Scan tone
enhancement was significantly more accurate than surface/contrast enhancement. It may
also be the case that use of an advanced imaging technique helps highlight vascular and
surface patterns, thus helping an endoscopist to recognise and learn these features,
which with experience are then identifiable (but more subtle) when viewed with HDWL.
223
The HiSCOPE study contrasts other colonic optical characterisation studies which
generally show inferior performance of white light assessment in comparison to image
enhancement. Indeed, despite advances in endoscope resolution, accuracy of white light
assessment does not appear to have progressed. One potential contributing factor is that
increasing endoscope resolution is leading to the detection of smaller and more subtle
lesions which pose a greater challenge when attempting to make an optical diagnosis.
This in itself is a driver for the ASGE PIVI on diminutive colonic polyps – with increasing
resolution of endoscopes, endoscopists are identifying more tiny lesions, potentially
leading to spiralling costs from endoscopic consumables and histopathology.
However the study in chapter 6 demonstrates that for high-performing BCSP
endoscopists the use of HD endoscopy does not improve adenoma detection (or several
other outcome measures) compared to SD endoscopy. Significant differences between
individual endoscopists were found, suggesting that training and technique factors may
play an important role. Good quality bowel preparation was also found to be crucial to
optimise lesion detection. The endoscopists in this study already had very high ADRs and
hence there may be a ceiling effect, with limited scope for improvement in ADR. These
results suggest that in a BCSP population, use of HD endoscopes should not be
mandatory. Overall the literature examining ADR in relation to endoscope definition
suggests that any benefit is modest.
The NICEVIS study shows that pre-procedure preparation not only applies to colonoscopy,
but is also of great importance prior to gastroscopy. Mucosal visibility was significantly
improved in patients attending for routine upper GI endoscopy by use of a simeticone/n-
acetyl cysteine drink. In the control groups there was an 8-fold increase in the number of
areas with inadequate views of the mucosa. It is worthy of note that this was the first
study of it’s kind to demonstrate a significant benefit in the oesophagus as well as the
stomach, which may have important implications for Barrett’s surveillance procedures.
Secondary outcomes showed markedly reduced need for fluid flushes during the
procedure. Although overall procedure time was not significantly reduced in the group
receiving the active drink it can be argued that in this group more of that time was spent
inspecting clear mucosa, rather than flushing to obtain clear mucosal views. The NICEVIS
224
study should lead on to a larger multi-centre study of a pre-gastroscopy drink examining
the endpoint of lesion or dysplasia detection.
Perhaps the most surprising results from this current study are those set out in chapters 8
& 9 – two studies examining in-vivo characterisation skills amongst endoscopists of
varying experience versus complete novices. The first study included a variety of colonic
lesions, including early invasive cancer, whereas the second study only included
diminutive colonic polyps. Both studies demonstrated that the performance of
experienced endoscopists was not significantly different to inexperienced endoscopists
and novices – a finding that was unexpected. This suggests that volume of endoscopic
experience does not necessarily lead to acquisition of in-vivo characterisation skills. These
results contrast those of previous studies suggesting that a brief training intervention can
enable endoscopists to achieve very high levels of accuracy (>90%). However many
studies of community based endoscopists which have included an initial training module,
followed by picture-based test have shown significantly inferior performance when those
endoscopists have embarked on polyp characterisation in vivo. This suggests that the
spectrum of polyps used in test modules in these studies do not represent those found in
clinical practice, where a greater proportion of ‘difficult’ polyps are encountered. Our
results suggest that the spectrum of polyps used in the study described in chapter 9 was
more representative of that found in clinical practice.
The results of these 2 studies suggest that specific training in in vivo characterisation is
required and needs to be incorporated into the training of all endoscopists – endoscopy
training should not focus solely on being able to pass the endoscope to the desired point,
but must also equip endoscopists with the skills to make an accurate and informed
assessment of any lesions they encounter. Both chapters demonstrate that a brief
training module can go some way to improving lesion characterisation skills, but this will
require an ongoing programme of using these skills in-vivo with feedback and reference
to histopathology. The on-line training module developed for the study in chapter 9 was
effective at improving in vivo characterisation and has the advantage that it is accessible
to endoscopists remotely, in their own time and can be revisited for clarification and
revision. This may form an important first step in teaching endoscopic characterisation
techniques, but would need expansion to include training on NBI and FICE. However in
225
addition there needs to be an ongoing culture change within UK endoscopy for this to
become a standard part of training and practice. Further studies are required to
determine the optimal methods for teaching endoscopists in vivo characterisation skills,
both in terms of training modules and also during endoscopy training lists. In time, it may
be appropriate for an examination in lesion assessment skills to become part of the
certification process for endoscopy in the UK.
It would seem logical for novice endoscopists to begin to learn the skills of in-vivo
characterisation soon after they begin training in endoscopy. This could be initially learnt
through on-line resources and image libraries. These skills and knowledge could then be
applied to real-life endoscopy whilst they are still in the training phase, so that careful
lesion assessment becomes part of usual endoscopic practice and not just a concept that
is introduced once an endoscopist has become independent in the technical aspects of
the procedure. Alongside characterisation of lesions, identification of subtle neoplastic
lesions such as dysplasia within Barrett’s oesophagus, early gastric cancer, flat
adenomatous polyps, sessile serrated lesions and dysplasia within a colitic bowel should
also be taught as part of routine endoscopic training. In this day and age it is not
acceptable to train endoscopists simply to advance the scope to the desired point – they
should be trained to identify and interpret important abnormalities along the way.
Further studies are required to establish the optimal methods for teaching the required
skills and knowledge and this should be the focus of future endoscopy-based research.
226
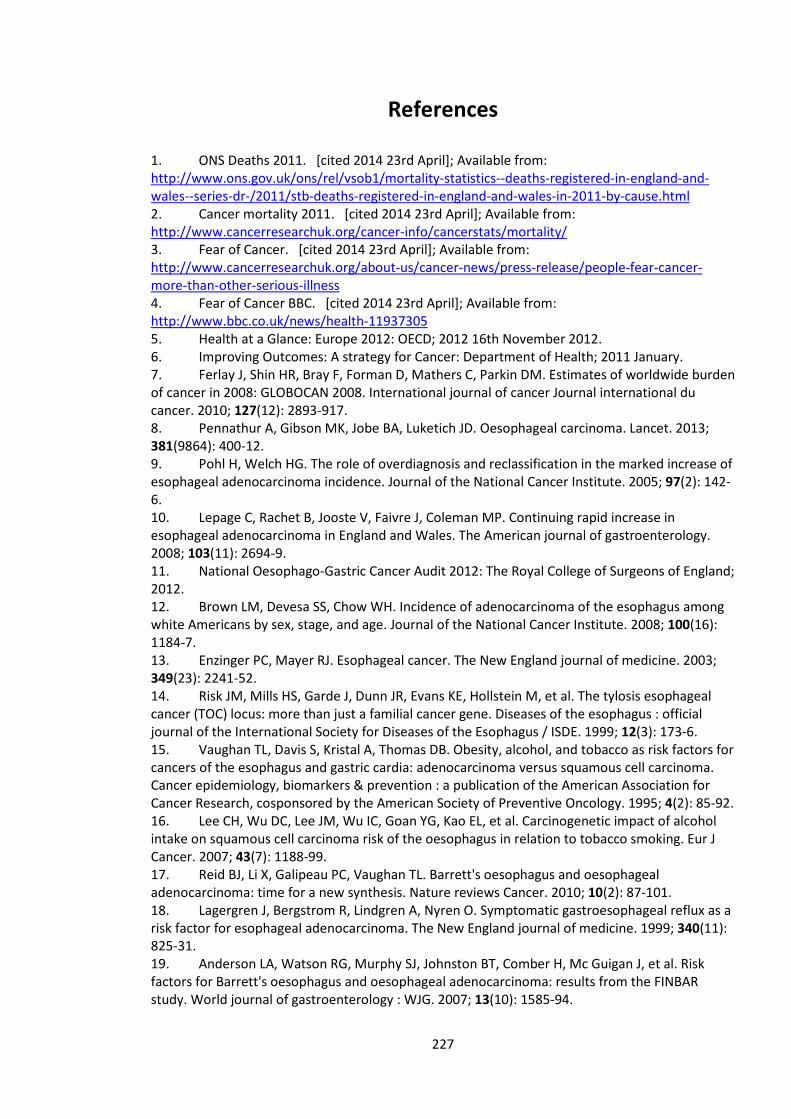
References
1. ONS Deaths 2011. [cited 2014 23rd April]; Available from: http://www.ons.gov.uk/ons/rel/vsob1/mortality-statistics--deaths-registered-in-england-and-wales--series-dr-/2011/stb-deaths-registered-in-england-and-wales-in-2011-by-cause.html 2. Cancer mortality 2011. [cited 2014 23rd April]; Available from: http://www.cancerresearchuk.org/cancer-info/cancerstats/mortality/ 3. Fear of Cancer. [cited 2014 23rd April]; Available from: http://www.cancerresearchuk.org/about-us/cancer-news/press-release/people-fear-cancer-more-than-other-serious-illness 4. Fear of Cancer BBC. [cited 2014 23rd April]; Available from: http://www.bbc.co.uk/news/health-11937305 5. Health at a Glance: Europe 2012: OECD; 2012 16th November 2012. 6. Improving Outcomes: A strategy for Cancer: Department of Health; 2011 January. 7. Ferlay J, Shin HR, Bray F, Forman D, Mathers C, Parkin DM. Estimates of worldwide burden of cancer in 2008: GLOBOCAN 2008. International journal of cancer Journal international du cancer. 2010; 127(12): 2893-917. 8. Pennathur A, Gibson MK, Jobe BA, Luketich JD. Oesophageal carcinoma. Lancet. 2013; 381(9864): 400-12. 9. Pohl H, Welch HG. The role of overdiagnosis and reclassification in the marked increase of esophageal adenocarcinoma incidence. Journal of the National Cancer Institute. 2005; 97(2): 142-6. 10. Lepage C, Rachet B, Jooste V, Faivre J, Coleman MP. Continuing rapid increase in esophageal adenocarcinoma in England and Wales. The American journal of gastroenterology. 2008; 103(11): 2694-9. 11. National Oesophago-Gastric Cancer Audit 2012: The Royal College of Surgeons of England; 2012. 12. Brown LM, Devesa SS, Chow WH. Incidence of adenocarcinoma of the esophagus among white Americans by sex, stage, and age. Journal of the National Cancer Institute. 2008; 100(16): 1184-7. 13. Enzinger PC, Mayer RJ. Esophageal cancer. The New England journal of medicine. 2003; 349(23): 2241-52. 14. Risk JM, Mills HS, Garde J, Dunn JR, Evans KE, Hollstein M, et al. The tylosis esophageal cancer (TOC) locus: more than just a familial cancer gene. Diseases of the esophagus : official journal of the International Society for Diseases of the Esophagus / ISDE. 1999; 12(3): 173-6. 15. Vaughan TL, Davis S, Kristal A, Thomas DB. Obesity, alcohol, and tobacco as risk factors for cancers of the esophagus and gastric cardia: adenocarcinoma versus squamous cell carcinoma. Cancer epidemiology, biomarkers & prevention : a publication of the American Association for Cancer Research, cosponsored by the American Society of Preventive Oncology. 1995; 4(2): 85-92. 16. Lee CH, Wu DC, Lee JM, Wu IC, Goan YG, Kao EL, et al. Carcinogenetic impact of alcohol intake on squamous cell carcinoma risk of the oesophagus in relation to tobacco smoking. Eur J Cancer. 2007; 43(7): 1188-99. 17. Reid BJ, Li X, Galipeau PC, Vaughan TL. Barrett's oesophagus and oesophageal adenocarcinoma: time for a new synthesis. Nature reviews Cancer. 2010; 10(2): 87-101. 18. Lagergren J, Bergstrom R, Lindgren A, Nyren O. Symptomatic gastroesophageal reflux as a risk factor for esophageal adenocarcinoma. The New England journal of medicine. 1999; 340(11): 825-31. 19. Anderson LA, Watson RG, Murphy SJ, Johnston BT, Comber H, Mc Guigan J, et al. Risk factors for Barrett's oesophagus and oesophageal adenocarcinoma: results from the FINBAR study. World journal of gastroenterology : WJG. 2007; 13(10): 1585-94.
227
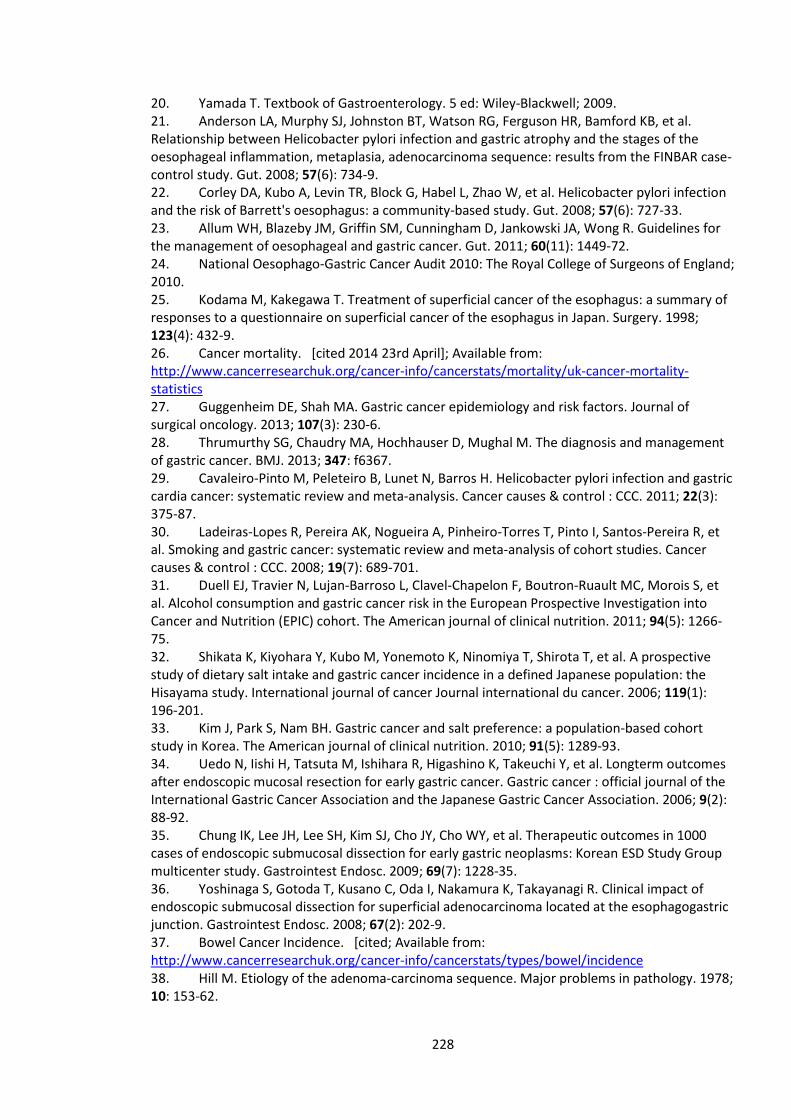
20. Yamada T. Textbook of Gastroenterology. 5 ed: Wiley-Blackwell; 2009. 21. Anderson LA, Murphy SJ, Johnston BT, Watson RG, Ferguson HR, Bamford KB, et al. Relationship between Helicobacter pylori infection and gastric atrophy and the stages of the oesophageal inflammation, metaplasia, adenocarcinoma sequence: results from the FINBAR case-control study. Gut. 2008; 57(6): 734-9. 22. Corley DA, Kubo A, Levin TR, Block G, Habel L, Zhao W, et al. Helicobacter pylori infection and the risk of Barrett's oesophagus: a community-based study. Gut. 2008; 57(6): 727-33. 23. Allum WH, Blazeby JM, Griffin SM, Cunningham D, Jankowski JA, Wong R. Guidelines for the management of oesophageal and gastric cancer. Gut. 2011; 60(11): 1449-72. 24. National Oesophago-Gastric Cancer Audit 2010: The Royal College of Surgeons of England; 2010. 25. Kodama M, Kakegawa T. Treatment of superficial cancer of the esophagus: a summary of responses to a questionnaire on superficial cancer of the esophagus in Japan. Surgery. 1998; 123(4): 432-9. 26. Cancer mortality. [cited 2014 23rd April]; Available from: http://www.cancerresearchuk.org/cancer-info/cancerstats/mortality/uk-cancer-mortality-statistics 27. Guggenheim DE, Shah MA. Gastric cancer epidemiology and risk factors. Journal of surgical oncology. 2013; 107(3): 230-6. 28. Thrumurthy SG, Chaudry MA, Hochhauser D, Mughal M. The diagnosis and management of gastric cancer. BMJ. 2013; 347: f6367. 29. Cavaleiro-Pinto M, Peleteiro B, Lunet N, Barros H. Helicobacter pylori infection and gastric cardia cancer: systematic review and meta-analysis. Cancer causes & control : CCC. 2011; 22(3): 375-87. 30. Ladeiras-Lopes R, Pereira AK, Nogueira A, Pinheiro-Torres T, Pinto I, Santos-Pereira R, et al. Smoking and gastric cancer: systematic review and meta-analysis of cohort studies. Cancer causes & control : CCC. 2008; 19(7): 689-701. 31. Duell EJ, Travier N, Lujan-Barroso L, Clavel-Chapelon F, Boutron-Ruault MC, Morois S, et al. Alcohol consumption and gastric cancer risk in the European Prospective Investigation into Cancer and Nutrition (EPIC) cohort. The American journal of clinical nutrition. 2011; 94(5): 1266-75. 32. Shikata K, Kiyohara Y, Kubo M, Yonemoto K, Ninomiya T, Shirota T, et al. A prospective study of dietary salt intake and gastric cancer incidence in a defined Japanese population: the Hisayama study. International journal of cancer Journal international du cancer. 2006; 119(1): 196-201. 33. Kim J, Park S, Nam BH. Gastric cancer and salt preference: a population-based cohort study in Korea. The American journal of clinical nutrition. 2010; 91(5): 1289-93. 34. Uedo N, Iishi H, Tatsuta M, Ishihara R, Higashino K, Takeuchi Y, et al. Longterm outcomes after endoscopic mucosal resection for early gastric cancer. Gastric cancer : official journal of the International Gastric Cancer Association and the Japanese Gastric Cancer Association. 2006; 9(2): 88-92. 35. Chung IK, Lee JH, Lee SH, Kim SJ, Cho JY, Cho WY, et al. Therapeutic outcomes in 1000 cases of endoscopic submucosal dissection for early gastric neoplasms: Korean ESD Study Group multicenter study. Gastrointest Endosc. 2009; 69(7): 1228-35. 36. Yoshinaga S, Gotoda T, Kusano C, Oda I, Nakamura K, Takayanagi R. Clinical impact of endoscopic submucosal dissection for superficial adenocarcinoma located at the esophagogastric junction. Gastrointest Endosc. 2008; 67(2): 202-9. 37. Bowel Cancer Incidence. [cited; Available from: http://www.cancerresearchuk.org/cancer-info/cancerstats/types/bowel/incidence 38. Hill M. Etiology of the adenoma-carcinoma sequence. Major problems in pathology. 1978; 10: 153-62.
228
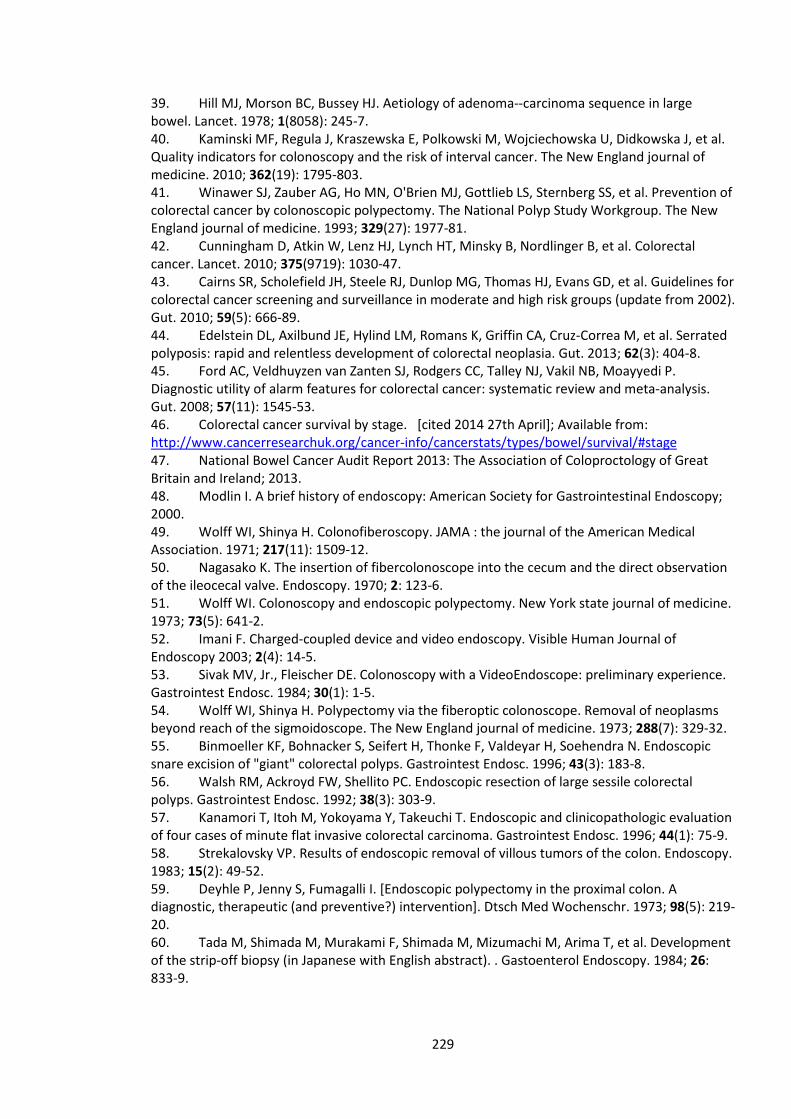
39. Hill MJ, Morson BC, Bussey HJ. Aetiology of adenoma--carcinoma sequence in large bowel. Lancet. 1978; 1(8058): 245-7. 40. Kaminski MF, Regula J, Kraszewska E, Polkowski M, Wojciechowska U, Didkowska J, et al. Quality indicators for colonoscopy and the risk of interval cancer. The New England journal of medicine. 2010; 362(19): 1795-803. 41. Winawer SJ, Zauber AG, Ho MN, O'Brien MJ, Gottlieb LS, Sternberg SS, et al. Prevention of colorectal cancer by colonoscopic polypectomy. The National Polyp Study Workgroup. The New England journal of medicine. 1993; 329(27): 1977-81. 42. Cunningham D, Atkin W, Lenz HJ, Lynch HT, Minsky B, Nordlinger B, et al. Colorectal cancer. Lancet. 2010; 375(9719): 1030-47. 43. Cairns SR, Scholefield JH, Steele RJ, Dunlop MG, Thomas HJ, Evans GD, et al. Guidelines for colorectal cancer screening and surveillance in moderate and high risk groups (update from 2002). Gut. 2010; 59(5): 666-89. 44. Edelstein DL, Axilbund JE, Hylind LM, Romans K, Griffin CA, Cruz-Correa M, et al. Serrated polyposis: rapid and relentless development of colorectal neoplasia. Gut. 2013; 62(3): 404-8. 45. Ford AC, Veldhuyzen van Zanten SJ, Rodgers CC, Talley NJ, Vakil NB, Moayyedi P. Diagnostic utility of alarm features for colorectal cancer: systematic review and meta-analysis. Gut. 2008; 57(11): 1545-53. 46. Colorectal cancer survival by stage. [cited 2014 27th April]; Available from: http://www.cancerresearchuk.org/cancer-info/cancerstats/types/bowel/survival/#stage 47. National Bowel Cancer Audit Report 2013: The Association of Coloproctology of Great Britain and Ireland; 2013. 48. Modlin I. A brief history of endoscopy: American Society for Gastrointestinal Endoscopy; 2000. 49. Wolff WI, Shinya H. Colonofiberoscopy. JAMA : the journal of the American Medical Association. 1971; 217(11): 1509-12. 50. Nagasako K. The insertion of fibercolonoscope into the cecum and the direct observation of the ileocecal valve. Endoscopy. 1970; 2: 123-6. 51. Wolff WI. Colonoscopy and endoscopic polypectomy. New York state journal of medicine. 1973; 73(5): 641-2. 52. Imani F. Charged-coupled device and video endoscopy. Visible Human Journal of Endoscopy 2003; 2(4): 14-5. 53. Sivak MV, Jr., Fleischer DE. Colonoscopy with a VideoEndoscope: preliminary experience. Gastrointest Endosc. 1984; 30(1): 1-5. 54. Wolff WI, Shinya H. Polypectomy via the fiberoptic colonoscope. Removal of neoplasms beyond reach of the sigmoidoscope. The New England journal of medicine. 1973; 288(7): 329-32. 55. Binmoeller KF, Bohnacker S, Seifert H, Thonke F, Valdeyar H, Soehendra N. Endoscopic snare excision of "giant" colorectal polyps. Gastrointest Endosc. 1996; 43(3): 183-8. 56. Walsh RM, Ackroyd FW, Shellito PC. Endoscopic resection of large sessile colorectal polyps. Gastrointest Endosc. 1992; 38(3): 303-9. 57. Kanamori T, Itoh M, Yokoyama Y, Takeuchi T. Endoscopic and clinicopathologic evaluation of four cases of minute flat invasive colorectal carcinoma. Gastrointest Endosc. 1996; 44(1): 75-9. 58. Strekalovsky VP. Results of endoscopic removal of villous tumors of the colon. Endoscopy. 1983; 15(2): 49-52. 59. Deyhle P, Jenny S, Fumagalli I. [Endoscopic polypectomy in the proximal colon. A diagnostic, therapeutic (and preventive?) intervention]. Dtsch Med Wochenschr. 1973; 98(5): 219-20. 60. Tada M, Shimada M, Murakami F, Shimada M, Mizumachi M, Arima T, et al. Development of the strip-off biopsy (in Japanese with English abstract). . Gastoenterol Endoscopy. 1984; 26: 833-9.
229
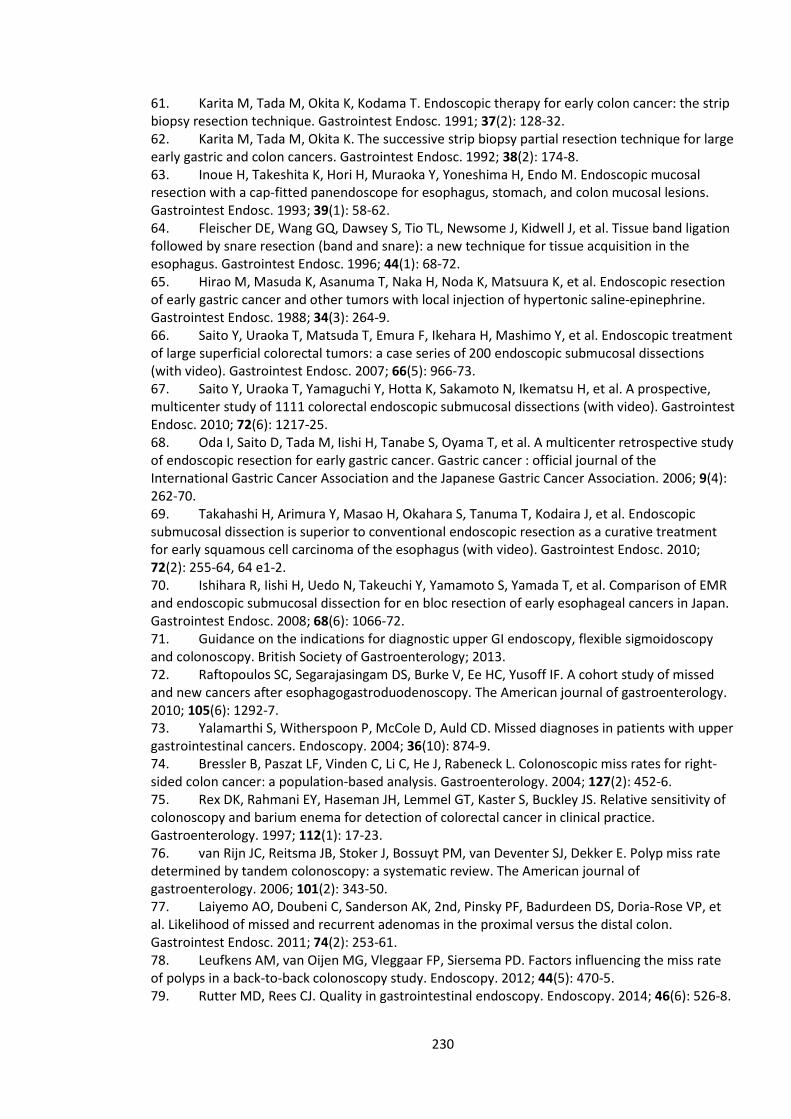
61. Karita M, Tada M, Okita K, Kodama T. Endoscopic therapy for early colon cancer: the strip biopsy resection technique. Gastrointest Endosc. 1991; 37(2): 128-32. 62. Karita M, Tada M, Okita K. The successive strip biopsy partial resection technique for large early gastric and colon cancers. Gastrointest Endosc. 1992; 38(2): 174-8. 63. Inoue H, Takeshita K, Hori H, Muraoka Y, Yoneshima H, Endo M. Endoscopic mucosal resection with a cap-fitted panendoscope for esophagus, stomach, and colon mucosal lesions. Gastrointest Endosc. 1993; 39(1): 58-62. 64. Fleischer DE, Wang GQ, Dawsey S, Tio TL, Newsome J, Kidwell J, et al. Tissue band ligation followed by snare resection (band and snare): a new technique for tissue acquisition in the esophagus. Gastrointest Endosc. 1996; 44(1): 68-72. 65. Hirao M, Masuda K, Asanuma T, Naka H, Noda K, Matsuura K, et al. Endoscopic resection of early gastric cancer and other tumors with local injection of hypertonic saline-epinephrine. Gastrointest Endosc. 1988; 34(3): 264-9. 66. Saito Y, Uraoka T, Matsuda T, Emura F, Ikehara H, Mashimo Y, et al. Endoscopic treatment of large superficial colorectal tumors: a case series of 200 endoscopic submucosal dissections (with video). Gastrointest Endosc. 2007; 66(5): 966-73. 67. Saito Y, Uraoka T, Yamaguchi Y, Hotta K, Sakamoto N, Ikematsu H, et al. A prospective, multicenter study of 1111 colorectal endoscopic submucosal dissections (with video). Gastrointest Endosc. 2010; 72(6): 1217-25. 68. Oda I, Saito D, Tada M, Iishi H, Tanabe S, Oyama T, et al. A multicenter retrospective study of endoscopic resection for early gastric cancer. Gastric cancer : official journal of the International Gastric Cancer Association and the Japanese Gastric Cancer Association. 2006; 9(4): 262-70. 69. Takahashi H, Arimura Y, Masao H, Okahara S, Tanuma T, Kodaira J, et al. Endoscopic submucosal dissection is superior to conventional endoscopic resection as a curative treatment for early squamous cell carcinoma of the esophagus (with video). Gastrointest Endosc. 2010; 72(2): 255-64, 64 e1-2. 70. Ishihara R, Iishi H, Uedo N, Takeuchi Y, Yamamoto S, Yamada T, et al. Comparison of EMR and endoscopic submucosal dissection for en bloc resection of early esophageal cancers in Japan. Gastrointest Endosc. 2008; 68(6): 1066-72. 71. Guidance on the indications for diagnostic upper GI endoscopy, flexible sigmoidoscopy and colonoscopy. British Society of Gastroenterology; 2013. 72. Raftopoulos SC, Segarajasingam DS, Burke V, Ee HC, Yusoff IF. A cohort study of missed and new cancers after esophagogastroduodenoscopy. The American journal of gastroenterology. 2010; 105(6): 1292-7. 73. Yalamarthi S, Witherspoon P, McCole D, Auld CD. Missed diagnoses in patients with upper gastrointestinal cancers. Endoscopy. 2004; 36(10): 874-9. 74. Bressler B, Paszat LF, Vinden C, Li C, He J, Rabeneck L. Colonoscopic miss rates for right-sided colon cancer: a population-based analysis. Gastroenterology. 2004; 127(2): 452-6. 75. Rex DK, Rahmani EY, Haseman JH, Lemmel GT, Kaster S, Buckley JS. Relative sensitivity of colonoscopy and barium enema for detection of colorectal cancer in clinical practice. Gastroenterology. 1997; 112(1): 17-23. 76. van Rijn JC, Reitsma JB, Stoker J, Bossuyt PM, van Deventer SJ, Dekker E. Polyp miss rate determined by tandem colonoscopy: a systematic review. The American journal of gastroenterology. 2006; 101(2): 343-50. 77. Laiyemo AO, Doubeni C, Sanderson AK, 2nd, Pinsky PF, Badurdeen DS, Doria-Rose VP, et al. Likelihood of missed and recurrent adenomas in the proximal versus the distal colon. Gastrointest Endosc. 2011; 74(2): 253-61. 78. Leufkens AM, van Oijen MG, Vleggaar FP, Siersema PD. Factors influencing the miss rate of polyps in a back-to-back colonoscopy study. Endoscopy. 2012; 44(5): 470-5. 79. Rutter MD, Rees CJ. Quality in gastrointestinal endoscopy. Endoscopy. 2014; 46(6): 526-8.
230
80. Bowles CJ, Leicester R, Romaya C, Swarbrick E, Williams CB, Epstein O. A prospective study of colonoscopy practice in the UK today: are we adequately prepared for national colorectal cancer screening tomorrow? Gut. 2004; 53(2): 277-83. 81. Gavin DR, Valori RM, Anderson JT, Donnelly MT, Williams JG, Swarbrick ET. The national colonoscopy audit: a nationwide assessment of the quality and safety of colonoscopy in the UK. Gut. 2013; 62(2): 242-9. 82. Corley DA, Jensen CD, Marks AR, Zhao WK, Lee JK, Doubeni CA, et al. Adenoma detection rate and risk of colorectal cancer and death. The New England journal of medicine. 2014; 370(14): 1298-306. 83. [cited; Available from: http://www.thejag.org.uk/downloads%5CUnit%20Resources%5CBSG%20Quality%20and%20Safety%20Indicators.pdf 84. Rex DK, Petrini JL, Baron TH, Chak A, Cohen J, Deal SE, et al. Quality indicators for colonoscopy. Gastrointest Endosc. 2006; 63(4 Suppl): S16-28. 85. Harewood GC, Sharma VK, de Garmo P. Impact of colonoscopy preparation quality on detection of suspected colonic neoplasia. Gastrointest Endosc. 2003; 58(1): 76-9. 86. Hong SN, Sung IK, Kim JH, Choe WH, Kim BK, Ko SY, et al. The Effect of the Bowel Preparation Status on the Risk of Missing Polyp and Adenoma during Screening Colonoscopy: A Tandem Colonoscopic Study. Clinical endoscopy. 2012; 45(4): 404-11. 87. Froehlich F, Wietlisbach V, Gonvers JJ, Burnand B, Vader JP. Impact of colonic cleansing on quality and diagnostic yield of colonoscopy: the European Panel of Appropriateness of Gastrointestinal Endoscopy European multicenter study. Gastrointest Endosc. 2005; 61(3): 378-84. 88. Sherer EA, Imler TD, Imperiale TF. The effect of colonoscopy preparation quality on adenoma detection rates. Gastrointest Endosc. 2012; 75(3): 545-53. 89. Munroe CA, Lee P, Copland A, Wu KK, Kaltenbach T, Soetikno RM, et al. A tandem colonoscopy study of adenoma miss rates during endoscopic training: a venture into uncharted territory. Gastrointest Endosc. 2012; 75(3): 561-7. 90. Adler A, Wegscheider K, Lieberman D, Aminalai A, Aschenbeck J, Drossel R, et al. Factors determining the quality of screening colonoscopy: a prospective study on adenoma detection rates, from 12,134 examinations (Berlin colonoscopy project 3, BECOP-3). Gut. 2013; 62(2): 236-41. 91. Lee TJ, Rees CJ, Blanks RG, Moss SM, Nickerson C, Wright KC, et al. Colonoscopic factors associated with adenoma detection in a national colorectal cancer screening program. Endoscopy. 2014; 46(3): 203-11. 92. Barclay RL, Vicari JJ, Doughty AS, Johanson JF, Greenlaw RL. Colonoscopic withdrawal times and adenoma detection during screening colonoscopy. The New England journal of medicine. 2006; 355(24): 2533-41. 93. Lee TJ, Blanks RG, Rees CJ, Wright KC, Nickerson C, Moss SM, et al. Longer mean colonoscopy withdrawal time is associated with increased adenoma detection: evidence from the Bowel Cancer Screening Programme in England. Endoscopy. 2013; 45(1): 20-6. 94. Simmons DT, Harewood GC, Baron TH, Petersen BT, Wang KK, Boyd-Enders F, et al. Impact of endoscopist withdrawal speed on polyp yield: implications for optimal colonoscopy withdrawal time. Alimentary pharmacology & therapeutics. 2006; 24(6): 965-71. 95. Corte C, Dahlenburg L, Selby W, Griffin S, Byrne C, Chua T, et al. Hyoscine butylbromide administered at the cecum increases polyp detection: a randomized double-blind placebo-controlled trial. Endoscopy. 2012; 44(10): 917-22. 96. de Brouwer EJ, Arbouw ME, van der Zwet WC, van Herwaarden MA, Ledeboer M, Jansman FG, et al. Hyoscine N-butylbromide does not improve polyp detection during colonoscopy: a double-blind, randomized, placebo-controlled, clinical trial. Gastrointest Endosc. 2012; 75(4): 835-40.
231
97. Rondonotti E, Radaelli F, Paggi S, Amato A, Imperiali G, Terruzzi V, et al. Hyoscine N-butylbromide for adenoma detection during colonoscopy: a randomized, double-blind, placebo-controlled study. Digestive and liver disease : official journal of the Italian Society of Gastroenterology and the Italian Association for the Study of the Liver. 2013; 45(8): 663-8. 98. Shah SG, Saunders BP, Brooker JC, Williams CB. Magnetic imaging of colonoscopy: an audit of looping, accuracy and ancillary maneuvers. Gastrointest Endosc. 2000; 52(1): 1-8. 99. Heigh RI, DiBaise JK, Prechel JA, Horn BJ, San Miguel S, Heigh EG, et al. Use of an electromagnetic colonoscope to assess maneuvers associated with cecal intubation. BMC gastroenterology. 2009; 9: 24. 100. East JE, Bassett P, Arebi N, Thomas-Gibson S, Guenther T, Saunders BP. Dynamic patient position changes during colonoscope withdrawal increase adenoma detection: a randomized, crossover trial. Gastrointest Endosc. 2011; 73(3): 456-63. 101. Koksal AS, Kalkan IH, Torun S, Taskiran I, Oztas E, Kayacetin E, et al. A simple method to improve adenoma detection rate during colonoscopy: altering patient position. Canadian journal of gastroenterology = Journal canadien de gastroenterologie. 2013; 27(9): 509-12. 102. Ou G, Kim E, Lakzadeh P, Tong J, Enns R, Ramji A, et al. A randomized controlled trial assessing the effect of prescribed patient position changes during colonoscope withdrawal on adenoma detection. Gastrointest Endosc. 2014; 80(2): 277-83. 103. Horiuchi A, Nakayama Y, Kato N, Ichise Y, Kajiyama M, Tanaka N. Hood-assisted colonoscopy is more effective in detection of colorectal adenomas than narrow-band imaging. Clinical gastroenterology and hepatology : the official clinical practice journal of the American Gastroenterological Association. 2010; 8(4): 379-83. 104. Hewett DG, Rex DK. Miss rate of right-sided colon examination during colonoscopy defined by retroflexion: an observational study. Gastrointest Endosc. 2011; 74(2): 246-52. 105. Suzuki S, Suzuki H, Endo M, Takemoto T, Kondo T, Nakayama K. Endoscopic Dyeing Method for Diagnosis of Early Cancer and Intestinal Metaplasia of the Stomach. Endoscopy. 1973; 5: 124-9. 106. Ida K, Hashimoto Y, Kawai K. In Vivo Staining of Gastric Mucosa Its Application to Endoscopic Diagnosis of Intestinal Metaplasia. Endoscopy. 1975; 7: 18-24. 107. Tatsuta M, Okuda S, Tamura H, Taniguchi H. Endoscopic diagnosis of early gastric cancer by the endoscopic Congo red-methylene blue test. Cancer. 1982; 50(12): 2956-60. 108. Tada M, Katoh S, Kohli Y, Kawai K. On the Dye Spraying Method in Colonofiberscopy. Endoscopy. 1976; 8: 70-4. 109. Tada M, Misaki F, Kawai K. A new approach to the observation of minute changes of the colonic mucosa by means of magnifying colonoscope, type CF-MB-M (Olympus). Gastrointest Endosc. 1978; 24(4): 146-7. 110. Kiesslich R, Fritsch J, Holtmann M, Koehler HH, Stolte M, Kanzler S, et al. Methylene blue-aided chromoendoscopy for the detection of intraepithelial neoplasia and colon cancer in ulcerative colitis. Gastroenterology. 2003; 124(4): 880-8. 111. Canto MI, Setrakian S, Willis JE, Chak A, Petras RE, Sivak MV. Methylene blue staining of dysplastic and nondysplastic Barrett's esophagus: an in vivo and ex vivo study. Endoscopy. 2001; 33(5): 391-400. 112. Canto MI, Setrakian S, Willis J, Chak A, Petras R, Powe NR, et al. Methylene blue-directed biopsies improve detection of intestinal metaplasia and dysplasia in Barrett's esophagus. Gastrointest Endosc. 2000; 51(5): 560-8. 113. Ngamruengphong S, Sharma VK, Das A. Diagnostic yield of methylene blue chromoendoscopy for detecting specialized intestinal metaplasia and dysplasia in Barrett's esophagus: a meta-analysis. Gastrointest Endosc. 2009; 69(6): 1021-8. 114. Davies J, Burke D, Olliver JR, Hardie LJ, Wild CP, Routledge MN. Methylene blue but not indigo carmine causes DNA damage to colonocytes in vitro and in vivo at concentrations used in clinical chromoendoscopy. Gut. 2007; 56(1): 155-6.
232
115. Dubuc J, Legoux J, Winnock M, Seyrig J, Barbier J, Barrioz T, et al. Endoscopic screening for esophageal squamous-cell carcinoma in high-risk patients: a prospective study conducted in 62 French endoscopy centers. Endoscopy. 2006; 38(7): 690-5. 116. Muto M, Hironaka S, Nakane M, Boku N, Ohtsu A, Yoshida S. Association of multiple Lugol-voiding lesions with synchronous and metachronous esophageal squamous cell carcinoma in patients with head and neck cancer. Gastrointest Endosc. 2002; 56(4): 517-21. 117. Tincani AJ, Brandalise N, Altemani A, Scanavini RC, Valerio JB, Lage HT, et al. Diagnosis of superficial esophageal cancer and dysplasia using endoscopic screening with a 2% lugol dye solution in patients with head and neck cancer. Head & neck. 2000; 22(2): 170-4. 118. Shimizu Y, Tukagoshi H, Fujita M, Hosokawa M, Kato M, Asaka M. Endoscopic screening for early esophageal cancer by iodine staining in patients with other current or prior primary cancers. Gastrointest Endosc. 2001; 53(1): 1-5. 119. Bhandari P, Kandaswamy P, Cowlishaw D, Longcroft-Wheaton G. Acetic acid-enhanced chromoendoscopy is more cost-effective than protocol-guided biopsies in a high-risk Barrett's population. Diseases of the esophagus : official journal of the International Society for Diseases of the Esophagus / ISDE. 2012; 25(5): 386-92. 120. Longcroft-Wheaton G, Duku M, Mead R, Poller D, Bhandari P. Acetic acid spray is an effective tool for the endoscopic detection of neoplasia in patients with Barrett's esophagus. Clinical gastroenterology and hepatology : the official clinical practice journal of the American Gastroenterological Association. 2010; 8(10): 843-7. 121. Sakai Y, Eto R, Kasanuki J, Kondo F, Kato K, Arai M, et al. Chromoendoscopy with indigo carmine dye added to acetic acid in the diagnosis of gastric neoplasia: a prospective comparative study. Gastrointest Endosc. 2008; 68(4): 635-41. 122. Tanaka K, Toyoda H, Kadowaki S, Hamada Y, Kosaka R, Matsuzaki S, et al. Surface pattern classification by enhanced-magnification endoscopy for identifying early gastric cancers. Gastrointest Endosc. 2008; 67(3): 430-7. 123. Kudo S, Hirota S, Nakajima T, Hosobe S, Kusaka H, Kobayashi T, et al. Colorectal tumours and pit pattern. Journal of clinical pathology. 1994; 47(10): 880-5. 124. Kudo S, Tamura S, Nakajima T, Yamano H, Kusaka H, Watanabe H. Diagnosis of colorectal tumorous lesions by magnifying endoscopy. Gastrointest Endosc. 1996; 44(1): 8-14. 125. Kudo S, Rubio CA, Teixeira CR, Kashida H, Kogure E. Pit pattern in colorectal neoplasia: endoscopic magnifying view. Endoscopy. 2001; 33(4): 367-73. 126. Pohl J, Schneider A, Vogell H, Mayer G, Kaiser G, Ell C. Pancolonic chromoendoscopy with indigo carmine versus standard colonoscopy for detection of neoplastic lesions: a randomised two-centre trial. Gut. 2011; 60(4): 485-90. 127. Le Rhun M, Coron E, Parlier D, Nguyen JM, Canard JM, Alamdari A, et al. High resolution colonoscopy with chromoscopy versus standard colonoscopy for the detection of colonic neoplasia: a randomized study. Clinical gastroenterology and hepatology : the official clinical practice journal of the American Gastroenterological Association. 2006; 4(3): 349-54. 128. Brooker JC, Saunders BP, Shah SG, Thapar CJ, Thomas HJ, Atkin WS, et al. Total colonic dye-spray increases the detection of diminutive adenomas during routine colonoscopy: a randomized controlled trial. Gastrointest Endosc. 2002; 56(3): 333-8. 129. Kiesslich R, von Bergh M, Hahn M, Hermann G, Jung M. Chromoendoscopy with indigocarmine improves the detection of adenomatous and nonadenomatous lesions in the colon. Endoscopy. 2001; 33(12): 1001-6. 130. Kahi CJ, Anderson JC, Waxman I, Kessler WR, Imperiale TF, Li X, et al. High-definition chromocolonoscopy vs. high-definition white light colonoscopy for average-risk colorectal cancer screening. The American journal of gastroenterology. 2010; 105(6): 1301-7. 131. Axelrad AM, Fleischer DE, Geller AJ, Nguyen CC, Lewis JH, Al-Kawas FH, et al. High-resolution chromoendoscopy for the diagnosis of diminutive colon polyps: implications for colon cancer screening. Gastroenterology. 1996; 110(4): 1253-8.
233
132. Togashi K, Konishi F, Ishizuka T, Sato T, Senba S, Kanazawa K. Efficacy of magnifying endoscopy in the differential diagnosis of neoplastic and non-neoplastic polyps of the large bowel. Diseases of the colon and rectum. 1999; 42(12): 1602-8. 133. Kato S, Fujii T, Koba I, Sano Y, Fu KI, Parra-Blanco A, et al. Assessment of colorectal lesions using magnifying colonoscopy and mucosal dye spraying: can significant lesions be distinguished? Endoscopy. 2001; 33(4): 306-10. 134. Konishi K, Kaneko K, Kurahashi T, Yamamoto T, Kushima M, Kanda A, et al. A comparison of magnifying and nonmagnifying colonoscopy for diagnosis of colorectal polyps: A prospective study. Gastrointest Endosc. 2003; 57(1): 48-53. 135. Hurlstone DP, Sanders DS, Lobo AJ, McAlindon ME, Cross SS. Indigo carmine-assisted high-magnification chromoscopic colonoscopy for the detection and characterisation of intraepithelial neoplasia in ulcerative colitis: a prospective evaluation. Endoscopy. 2005; 37(12): 1186-92. 136. Rutter MD, Saunders BP, Schofield G, Forbes A, Price AB, Talbot IC. Pancolonic indigo carmine dye spraying for the detection of dysplasia in ulcerative colitis. Gut. 2004; 53(2): 256-60. 137. Marion JF, Waye JD, Present DH, Israel Y, Bodian C, Harpaz N, et al. Chromoendoscopy-targeted biopsies are superior to standard colonoscopic surveillance for detecting dysplasia in inflammatory bowel disease patients: a prospective endoscopic trial. The American journal of gastroenterology. 2008; 103(9): 2342-9. 138. Kumagai Y, Inoue H, Nagai K, Kawano T, Iwai T. Magnifying endoscopy, stereoscopic microscopy, and the microvascular architecture of superficial esophageal carcinoma. Endoscopy. 2002; 34(5): 369-75. 139. Yagi K, Nakamura A, Sekine A. Comparison between magnifying endoscopy and histological, culture and urease test findings from the gastric mucosa of the corpus. Endoscopy. 2002; 34(5): 376-81. 140. Gono K, Yamazaki K, Doguchi N, Nonami T, Obi T, Yamaguchi M. Endoscopic Observation of Tissue by Narrowband Illumination. Optical Review. 2003; 10(4): 1-5. 141. Haidry R, Lovat L. Novel Imaging Techniques in Gastrointestinal Endoscopy in the Upper Gastrointestinal Tract. In: Erondu O, editor. Medical Imaging in Clinical Practice: Intechopen; 2013. 142. Ezoe Y, Muto M, Uedo N, Doyama H, Yao K, Oda I, et al. Magnifying narrowband imaging is more accurate than conventional white-light imaging in diagnosis of gastric mucosal cancer. Gastroenterology. 2011; 141(6): 2017-25 e3. 143. Nagahama T, Yao K, Maki S, Yasaka M, Takaki Y, Matsui T, et al. Usefulness of magnifying endoscopy with narrow-band imaging for determining the horizontal extent of early gastric cancer when there is an unclear margin by chromoendoscopy (with video). Gastrointest Endosc. 2011; 74(6): 1259-67. 144. Kiyotoki S, Nishikawa J, Satake M, Fukagawa Y, Shirai Y, Hamabe K, et al. Usefulness of magnifying endoscopy with narrow-band imaging for determining gastric tumor margin. Journal of gastroenterology and hepatology. 2010; 25(10): 1636-41. 145. Sharma P, Hawes RH, Bansal A, Gupta N, Curvers W, Rastogi A, et al. Standard endoscopy with random biopsies versus narrow band imaging targeted biopsies in Barrett's oesophagus: a prospective, international, randomised controlled trial. Gut. 2013; 62(1): 15-21. 146. Wolfsen HC, Crook JE, Krishna M, Achem SR, Devault KR, Bouras EP, et al. Prospective, controlled tandem endoscopy study of narrow band imaging for dysplasia detection in Barrett's Esophagus. Gastroenterology. 2008; 135(1): 24-31. 147. Anagnostopoulos GK, Yao K, Kaye P, Hawkey CJ, Ragunath K. Novel endoscopic observation in Barrett's oesophagus using high resolution magnification endoscopy and narrow band imaging. Alimentary pharmacology & therapeutics. 2007; 26(3): 501-7. 148. van den Broek FJ, Reitsma JB, Curvers WL, Fockens P, Dekker E. Systematic review of narrow-band imaging for the detection and differentiation of neoplastic and nonneoplastic lesions in the colon (with videos). Gastrointest Endosc. 2009; 69(1): 124-35.
234
149. Dekker E, van den Broek FJ, Reitsma JB, Hardwick JC, Offerhaus GJ, van Deventer SJ, et al. Narrow-band imaging compared with conventional colonoscopy for the detection of dysplasia in patients with longstanding ulcerative colitis. Endoscopy. 2007; 39(3): 216-21. 150. van den Broek FJ, Fockens P, van Eeden S, Stokkers PC, Ponsioen CY, Reitsma JB, et al. Narrow-band imaging versus high-definition endoscopy for the diagnosis of neoplasia in ulcerative colitis. Endoscopy. 2011; 43(2): 108-15. 151. Ignjatovic A, East JE, Subramanian V, Suzuki N, Guenther T, Palmer N, et al. Narrow band imaging for detection of dysplasia in colitis: a randomized controlled trial. The American journal of gastroenterology. 2012; 107(6): 885-90. 152. East JE, Suzuki N, Bassett P, Stavrinidis M, Thomas HJ, Guenther T, et al. Narrow band imaging with magnification for the characterization of small and diminutive colonic polyps: pit pattern and vascular pattern intensity. Endoscopy. 2008; 40(10): 811-7. 153. Rastogi A, Bansal A, Wani S, Callahan P, McGregor DH, Cherian R, et al. Narrow-band imaging colonoscopy--a pilot feasibility study for the detection of polyps and correlation of surface patterns with polyp histologic diagnosis. Gastrointest Endosc. 2008; 67(2): 280-6. 154. Henry ZH, Yeaton P, Shami VM, Kahaleh M, Patrie JT, Cox DG, et al. Meshed capillary vessels found on narrow-band imaging without optical magnification effectively identifies colorectal neoplasia: a North American validation of the Japanese experience. Gastrointest Endosc. 2010; 72(1): 118-26. 155. Pohl J, Lotterer E, Balzer C, Sackmann M, Schmidt KD, Gossner L, et al. Computed virtual chromoendoscopy versus standard colonoscopy with targeted indigocarmine chromoscopy: a randomised multicentre trial. Gut. 2009; 58(1): 73-8. 156. Longcroft-Wheaton GR, Higgins B, Bhandari P. Flexible spectral imaging color enhancement and indigo carmine in neoplasia diagnosis during colonoscopy: a large prospective UK series. European journal of gastroenterology & hepatology. 2011; 23(10): 903-11. 157. Longcroft-Wheaton G, Brown J, Cowlishaw D, Higgins B, Bhandari P. High-definition vs. standard-definition colonoscopy in the characterization of small colonic polyps: results from a randomized trial. Endoscopy. 2012; 44(10): 905-10. 158. Togashi K, Osawa H, Koinuma K, Hayashi Y, Miyata T, Sunada K, et al. A comparison of conventional endoscopy, chromoendoscopy, and the optimal-band imaging system for the differentiation of neoplastic and non-neoplastic colonic polyps. Gastrointest Endosc. 2009; 69(3 Pt 2): 734-41. 159. Kodashima S, Fujishiro M. Novel image-enhanced endoscopy with i-scan technology. World journal of gastroenterology : WJG. 2010; 16(9): 1043-9. 160. Lee CK, Lee SH, Hwangbo Y. Narrow-band imaging versus I-Scan for the real-time histological prediction of diminutive colonic polyps: a prospective comparative study by using the simple unified endoscopic classification. Gastrointest Endosc. 2011; 74(3): 603-9. 161. Hong SN, Choe WH, Lee JH, Kim SI, Kim JH, Lee TY, et al. Prospective, randomized, back-to-back trial evaluating the usefulness of i-SCAN in screening colonoscopy. Gastrointest Endosc. 2012; 75(5): 1011-21 e2. 162. Hoffman A, Sar F, Goetz M, Tresch A, Mudter J, Biesterfeld S, et al. High definition colonoscopy combined with i-Scan is superior in the detection of colorectal neoplasias compared with standard video colonoscopy: a prospective randomized controlled trial. Endoscopy. 2010; 42(10): 827-33. 163. Hoffman A, Basting N, Goetz M, Tresch A, Mudter J, Biesterfeld S, et al. High-definition endoscopy with i-Scan and Lugol's solution for more precise detection of mucosal breaks in patients with reflux symptoms. Endoscopy. 2009; 41(2): 107-12. 164. Haringsma J, Tytgat GN, Yano H, Iishi H, Tatsuta M, Ogihara T, et al. Autofluorescence endoscopy: feasibility of detection of GI neoplasms unapparent to white light endoscopy with an evolving technology. Gastrointest Endosc. 2001; 53(6): 642-50.
235
165. Kara MA, Peters FP, Ten Kate FJ, Van Deventer SJ, Fockens P, Bergman JJ. Endoscopic video autofluorescence imaging may improve the detection of early neoplasia in patients with Barrett's esophagus. Gastrointest Endosc. 2005; 61(6): 679-85. 166. Rotondano G, Bianco MA, Sansone S, Prisco A, Meucci C, Garofano ML, et al. Trimodal endoscopic imaging for the detection and differentiation of colorectal adenomas: a prospective single-centre clinical evaluation. International journal of colorectal disease. 2012; 27(3): 331-6. 167. van den Broek FJ, Fockens P, Van Eeden S, Kara MA, Hardwick JC, Reitsma JB, et al. Clinical evaluation of endoscopic trimodal imaging for the detection and differentiation of colonic polyps. Clinical gastroenterology and hepatology : the official clinical practice journal of the American Gastroenterological Association. 2009; 7(3): 288-95. 168. Kuiper T, van den Broek FJ, Naber AH, van Soest EJ, Scholten P, Mallant-Hent R, et al. Endoscopic trimodal imaging detects colonic neoplasia as well as standard video endoscopy. Gastroenterology. 2011; 140(7): 1887-94. 169. Wainwright M. Dyes in the development of drugs and pharmaceuticals. Dyes and Pigments. 2008; 76: 582-9. 170. Kiesslich R, Burg J, Vieth M, Gnaendiger J, Enders M, Delaney P, et al. Confocal laser endoscopy for diagnosing intraepithelial neoplasias and colorectal cancer in vivo. Gastroenterology. 2004; 127(3): 706-13. 171. Wallace MB, Fockens P. Probe-based confocal laser endomicroscopy. Gastroenterology. 2009; 136(5): 1509-13. 172. Buchner AM, Shahid MW, Heckman MG, Krishna M, Ghabril M, Hasan M, et al. Comparison of probe-based confocal laser endomicroscopy with virtual chromoendoscopy for classification of colon polyps. Gastroenterology. 2010; 138(3): 834-42. 173. Gupta A, Attar BM, Koduru P, Murali AR, Go BT, Agarwal R. Utility of confocal laser endomicroscopy in identifying high-grade dysplasia and adenocarcinoma in Barrett's esophagus: a systematic review and meta-analysis. European journal of gastroenterology & hepatology. 2014; 26(4): 369-77. 174. Pohl H, Rosch T, Vieth M, Koch M, Becker V, Anders M, et al. Miniprobe confocal laser microscopy for the detection of invisible neoplasia in patients with Barrett's oesophagus. Gut. 2008; 57(12): 1648-53. 175. Sharma P, Meining AR, Coron E, Lightdale CJ, Wolfsen HC, Bansal A, et al. Real-time increased detection of neoplastic tissue in Barrett's esophagus with probe-based confocal laser endomicroscopy: final results of an international multicenter, prospective, randomized, controlled trial. Gastrointest Endosc. 2011; 74(3): 465-72. 176. Kiesslich R, Goetz M, Lammersdorf K, Schneider C, Burg J, Stolte M, et al. Chromoscopy-guided endomicroscopy increases the diagnostic yield of intraepithelial neoplasia in ulcerative colitis. Gastroenterology. 2007; 132(3): 874-82. 177. Classen M, Phillip J. Electronic endoscopy of the gastrointestinal tract. Initial experience with a new type of endoscope that has no fiberoptic bundle for imaging. Endoscopy. 1984; 16(1): 16-9. 178. Morrissey JF. Thoughts on the VideoEndoscope. Gastrointest Endosc. 1984; 30(1): 43. 179. Lawrance IC, Sherrington C, Murray K. Poor correlation between clinical impression, the small colonic polyp and their neoplastic risk. Journal of gastroenterology and hepatology. 2006; 21(3): 563-8. 180. Soetikno RM, Kaltenbach T, Rouse RV, Park W, Maheshwari A, Sato T, et al. Prevalence of nonpolypoid (flat and depressed) colorectal neoplasms in asymptomatic and symptomatic adults. JAMA : the journal of the American Medical Association. 2008; 299(9): 1027-35. 181. Lee TJ, Rutter MD, Blanks RG, Moss SM, Goddard AF, Chilton A, et al. Colonoscopy quality measures: experience from the NHS Bowel Cancer Screening Programme. Gut. 2012; 61(7): 1050-7.
236
182. Payne RA. The incidence and clinical significance of rectal polyps. Annals of the Royal College of Surgeons of England. 1976; 58(3): 241-2. 183. Chapuis PH, Dent OF, Goulston KJ. Clinical accuracy in the diagnosis of small polyps using the flexible fiberoptic sigmoidoscope. Diseases of the colon and rectum. 1982; 25(7): 669-72. 184. Neale AV, Demers RY, Budev H, Scott RO. Physician accuracy in diagnosing colorectal polyps. Diseases of the colon and rectum. 1987; 30(4): 247-50. 185. Norfleet RG, Ryan ME, Wyman JB. Adenomatous and hyperplastic polyps cannot be reliably distinguished by their appearance through the fiberoptic sigmoidoscope. Digestive diseases and sciences. 1988; 33(9): 1175-7. 186. Tung SY, Wu CS, Su MY. Magnifying colonoscopy in differentiating neoplastic from nonneoplastic colorectal lesions. The American journal of gastroenterology. 2001; 96(9): 2628-32. 187. Fu KI, Sano Y, Kato S, Fujii T, Nagashima F, Yoshino T, et al. Chromoendoscopy using indigo carmine dye spraying with magnifying observation is the most reliable method for differential diagnosis between non-neoplastic and neoplastic colorectal lesions: a prospective study. Endoscopy. 2004; 36(12): 1089-93. 188. Su MY, Ho YP, Chen PC, Chiu CT, Wu CS, Hsu CM, et al. Magnifying endoscopy with indigo carmine contrast for differential diagnosis of neoplastic and nonneoplastic colonic polyps. Digestive diseases and sciences. 2004; 49(7-8): 1123-7. 189. Hurlstone DP, Cross SS, Slater R, Sanders DS, Brown S. Detecting diminutive colorectal lesions at colonoscopy: a randomised controlled trial of pan-colonic versus targeted chromoscopy. Gut. 2004; 53(3): 376-80. 190. De Palma GD, Rega M, Masone S, Persico M, Siciliano S, Addeo P, et al. Conventional colonoscopy and magnified chromoendoscopy for the endoscopic histological prediction of diminutive colorectal polyps: a single operator study. World journal of gastroenterology : WJG. 2006; 12(15): 2402-5. 191. Chiu HM, Chang CY, Chen CC, Lee YC, Wu MS, Lin JT, et al. A prospective comparative study of narrow-band imaging, chromoendoscopy, and conventional colonoscopy in the diagnosis of colorectal neoplasia. Gut. 2007; 56(3): 373-9. 192. Tischendorf JJ, Wasmuth HE, Koch A, Hecker H, Trautwein C, Winograd R. Value of magnifying chromoendoscopy and narrow band imaging (NBI) in classifying colorectal polyps: a prospective controlled study. Endoscopy. 2007; 39(12): 1092-6. 193. Pohl J, Nguyen-Tat M, Pech O, May A, Rabenstein T, Ell C. Computed virtual chromoendoscopy for classification of small colorectal lesions: a prospective comparative study. The American journal of gastroenterology. 2008; 103(3): 562-9. 194. Chang CC, Hsieh CR, Lou HY, Fang CL, Tiong C, Wang JJ, et al. Comparative study of conventional colonoscopy, magnifying chromoendoscopy, and magnifying narrow-band imaging systems in the differential diagnosis of small colonic polyps between trainee and experienced endoscopist. International journal of colorectal disease. 2009; 24(12): 1413-9. 195. Parra-Blanco A, Jimenez A, Rembacken B, Gonzalez N, Nicolas-Perez D, Gimeno-Garcia AZ, et al. Validation of Fujinon intelligent chromoendoscopy with high definition endoscopes in colonoscopy. World journal of gastroenterology : WJG. 2009; 15(42): 5266-73. 196. Dos Santos CE, Malaman D, Lopes CV, Pereira-Lima JC, Parada AA. Digital chromoendoscopy for diagnosis of diminutive colorectal lesions. Diagnostic and therapeutic endoscopy. 2012; 2012: 279521. 197. Eisen GM, Kim CY, Fleischer DE, Kozarek RA, Carr-Locke DL, Li TC, et al. High-resolution chromoendoscopy for classifying colonic polyps: a multicenter study. Gastrointest Endosc. 2002; 55(6): 687-94. 198. Apel D, Jakobs R, Schilling D, Weickert U, Teichmann J, Bohrer MH, et al. Accuracy of high-resolution chromoendoscopy in prediction of histologic findings in diminutive lesions of the rectosigmoid. Gastrointest Endosc. 2006; 63(6): 824-8.
237
199. Su MY, Hsu CM, Ho YP, Chen PC, Lin CJ, Chiu CT. Comparative study of conventional colonoscopy, chromoendoscopy, and narrow-band imaging systems in differential diagnosis of neoplastic and nonneoplastic colonic polyps. The American journal of gastroenterology. 2006; 101(12): 2711-6. 200. Sonwalkar S, Rotimi O, Rembacken BJ. Characterization of colonic polyps at conventional (nonmagnifying) colonoscopy after spraying with 0.2 % indigo carmine dye. Endoscopy. 2006; 38(12): 1218-23. 201. Ince AT, Bolukbas C, Peker O, Bolukbas F, Ovunc O. Pit pattern type analyses of colon polyps with high-resolution colonoscope. Hepato-gastroenterology. 2007; 54(73): 67-70. 202. Yoshida N, Naito Y, Inada Y, Kugai M, Inoue K, Uchiyama K, et al. The detection of surface patterns by flexible spectral imaging color enhancement without magnification for diagnosis of colorectal polyps. International journal of colorectal disease. 2012; 27(5): 605-11. 203. Machida H, Sano Y, Hamamoto Y, Muto M, Kozu T, Tajiri H, et al. Narrow-band imaging in the diagnosis of colorectal mucosal lesions: a pilot study. Endoscopy. 2004; 36(12): 1094-8. 204. Tanaka S, Oka S, Hirata M, Yoshida S, Kaneko I, Chayama K. Pit pattern diagnosis for colorectal neoplasia using narrow band imaging magnification. Digestive Endoscopy. 2006; 18(Suppl 1): S52-S6. 205. Sano Y, Ikematsu H, Fu KI, Emura F, Katagiri A, Horimatsu T, et al. Meshed capillary vessels by use of narrow-band imaging for differential diagnosis of small colorectal polyps. Gastrointest Endosc. 2009; 69(2): 278-83. 206. Wada Y, Kudo SE, Kashida H, Ikehara N, Inoue H, Yamamura F, et al. Diagnosis of colorectal lesions with the magnifying narrow-band imaging system. Gastrointest Endosc. 2009; 70(3): 522-31. 207. Tischendorf JJ, Schirin-Sokhan R, Streetz K, Gassler N, Hecker HE, Meyer M, et al. Value of magnifying endoscopy in classifying colorectal polyps based on vascular pattern. Endoscopy. 2010; 42(1): 22-7. 208. Zhou QJ, Yang JM, Fei BY, Xu QS, Wu WQ, Ruan HJ. Narrow-band imaging endoscopy with and without magnification in diagnosis of colorectal neoplasia. World journal of gastroenterology : WJG. 2011; 17(5): 666-70. 209. Singh R, Nordeen N, Mei SL, Kaffes A, Tam W, Saito Y. West meets East: preliminary results of narrow band imaging with optical magnification in the diagnosis of colorectal lesions: a multicenter Australian study using the modified Sano's classification. Digestive endoscopy : official journal of the Japan Gastroenterological Endoscopy Society. 2011; 23 Suppl 1: 126-30. 210. Gross S, Trautwein C, Behrens A, Winograd R, Palm S, Lutz HH, et al. Computer-based classification of small colorectal polyps by using narrow-band imaging with optical magnification. Gastrointest Endosc. 2011; 74(6): 1354-9. 211. Ignjatovic A, East JE, Guenther T, Hoare J, Morris J, Ragunath K, et al. What is the most reliable imaging modality for small colonic polyp characterization? Study of white-light, autofluorescence, and narrow-band imaging. Endoscopy. 2011; 43(2): 94-9. 212. Sato R, Fujiya M, Watari J, Ueno N, Moriichi K, Kashima S, et al. The diagnostic accuracy of high-resolution endoscopy, autofluorescence imaging and narrow-band imaging for differentially diagnosing colon adenoma. Endoscopy. 2011; 43(10): 862-8. 213. Sikka S, Ringold DA, Jonnalagadda S, Banerjee B. Comparison of white light and narrow band high definition images in predicting colon polyp histology, using standard colonoscopes without optical magnification. Endoscopy. 2008; 40(10): 818-22. 214. Rogart JN, Jain D, Siddiqui UD, Oren T, Lim J, Jamidar P, et al. Narrow-band imaging without high magnification to differentiate polyps during real-time colonoscopy: improvement with experience. Gastrointest Endosc. 2008; 68(6): 1136-45. 215. Rastogi A, Keighley J, Singh V, Callahan P, Bansal A, Wani S, et al. High accuracy of narrow band imaging without magnification for the real-time characterization of polyp histology and its
238
comparison with high-definition white light colonoscopy: a prospective study. The American journal of gastroenterology. 2009; 104(10): 2422-30. 216. Ignjatovic A, East JE, Suzuki N, Vance M, Guenther T, Saunders BP. Optical diagnosis of small colorectal polyps at routine colonoscopy (Detect InSpect ChAracterise Resect and Discard; DISCARD trial): a prospective cohort study. The lancet oncology. 2009; 10(12): 1171-8. 217. Rex DK. Narrow-band imaging without optical magnification for histologic analysis of colorectal polyps. Gastroenterology. 2009; 136(4): 1174-81. 218. Rastogi A, Early DS, Gupta N, Bansal A, Singh V, Ansstas M, et al. Randomized, controlled trial of standard-definition white-light, high-definition white-light, and narrow-band imaging colonoscopy for the detection of colon polyps and prediction of polyp histology. Gastrointest Endosc. 2011; 74(3): 593-602. 219. Kuiper T, Marsman WA, Jansen JM, van Soest EJ, Haan YC, Bakker GJ, et al. Accuracy for optical diagnosis of small colorectal polyps in nonacademic settings. Clinical gastroenterology and hepatology : the official clinical practice journal of the American Gastroenterological Association. 2012; 10(9): 1016-20; quiz e79. 220. Gupta N, Bansal A, Rao D, Early DS, Jonnalagadda S, Edmundowicz SA, et al. Accuracy of in vivo optical diagnosis of colon polyp histology by narrow-band imaging in predicting colonoscopy surveillance intervals. Gastrointest Endosc. 2012; 75(3): 494-502. 221. Paggi S, Rondonotti E, Amato A, Terruzzi V, Imperiali G, Mandelli G, et al. Resect and discard strategy in clinical practice: a prospective cohort study. Endoscopy. 2012; 44(10): 899-904. 222. Hewett DG, Huffman ME, Rex DK. Leaving distal colorectal hyperplastic polyps in place can be achieved with high accuracy by using narrow-band imaging: an observational study. Gastrointest Endosc. 2012; 76(2): 374-80. 223. Hewett DG, Kaltenbach T, Sano Y, Tanaka S, Saunders BP, Ponchon T, et al. Validation of a simple classification system for endoscopic diagnosis of small colorectal polyps using narrow-band imaging. Gastroenterology. 2012; 143(3): 599-607 e1. 224. Sakamoto T, Matsuda T, Aoki T, Nakajima T, Saito Y. Time saving with narrow-band imaging for distinguishing between neoplastic and non-neoplastic small colorectal lesions. Journal of gastroenterology and hepatology. 2012; 27(2): 351-5. 225. Repici A, Hassan C, Radaelli F, Occhipinti P, De Angelis C, Romeo F, et al. Accuracy of narrow-band imaging in predicting colonoscopy surveillance intervals and histology of distal diminutive polyps: results from a multicenter, prospective trial. Gastrointest Endosc. 2013; 78(1): 106-14. 226. Vu HT, Sayuk GS, Hollander TG, Clebanoff J, Edmundowicz SA, Gyawali CP, et al. Resect and Discard Approach to Colon Polyps: Real-World Applicability Among Academic and Community Gastroenterologists. Digestive diseases and sciences. 2014. 227. Teixeira CR, Torresini RS, Canali C, Figueiredo LF, Mucenic M, Pereira Lima JC, et al. Endoscopic classification of the capillary-vessel pattern of colorectal lesions by spectral estimation technology and magnifying zoom imaging. Gastrointest Endosc. 2009; 69(3 Pt 2): 750-6. 228. Kim YS, Kim D, Chung SJ, Park MJ, Shin CS, Cho SH, et al. Differentiating small polyp histologies using real-time screening colonoscopy with Fuji Intelligent Color Enhancement. Clinical gastroenterology and hepatology : the official clinical practice journal of the American Gastroenterological Association. 2011; 9(9): 744-9 e1. 229. Hoffman A, Kagel C, Goetz M, Tresch A, Mudter J, Biesterfeld S, et al. Recognition and characterization of small colonic neoplasia with high-definition colonoscopy using i-Scan is as precise as chromoendoscopy. Digestive and liver disease : official journal of the Italian Society of Gastroenterology and the Italian Association for the Study of the Liver. 2010; 42(1): 45-50. 230. Chan JL, Lin L, Feiler M, Wolf AI, Cardona DM, Gellad ZF. Comparative effectiveness of i-SCAN and high-definition white light characterizing small colonic polyps. World journal of gastroenterology : WJG. 2012; 18(41): 5905-11.
239
231. Pigo F, Bertani H, Manno M, Mirante V, Caruso A, Barbera C, et al. i-Scan high-definition white light endoscopy and colorectal polyps: prediction of histology, interobserver and intraobserver agreement. International journal of colorectal disease. 2012. 232. Han ML, Lee YC, Chen CC, Fang YJ, Lee JY, Lin TL, et al. Computer-generated surface and tone enhancements to distinguish neoplastic from non-neoplastic colon polyps less than 1 cm in diameter. International journal of colorectal disease. 2012; 27(3): 337-44. 233. Neumann H, Vieth M, Fry LC, Gunther C, Atreya R, Neurath MF, et al. Learning curve of virtual chromoendoscopy for the prediction of hyperplastic and adenomatous colorectal lesions: a prospective 2-center study. Gastrointest Endosc. 2013; 78(1): 115-20. 234. Bouwens MW, de Ridder R, Masclee AA, Driessen A, Riedl RG, Winkens B, et al. Optical diagnosis of colorectal polyps using high-definition i-scan: an educational experience. World journal of gastroenterology : WJG. 2013; 19(27): 4334-43. 235. Schachschal G, Mayr M, Treszl A, Balzer K, Wegscheider K, Aschenbeck J, et al. Endoscopic versus histological characterisation of polyps during screening colonoscopy. Gut. 2014; 63(3): 458-65. 236. Wang TD, Crawford JM, Feld MS, Wang Y, Itzkan I, Van Dam J. In vivo identification of colonic dysplasia using fluorescence endoscopic imaging. Gastrointest Endosc. 1999; 49(4 Pt 1): 447-55. 237. McCallum AL, Jenkins JT, Gillen D, Molloy RG. Evaluation of autofluorescence colonoscopy for the detection and diagnosis of colonic polyps. Gastrointest Endosc. 2008; 68(2): 283-90. 238. van den Broek FJ, van Soest EJ, Naber AH, van Oijen AH, Mallant-Hent R, Bohmer CJ, et al. Combining autofluorescence imaging and narrow-band imaging for the differentiation of adenomas from non-neoplastic colonic polyps among experienced and non-experienced endoscopists. The American journal of gastroenterology. 2009; 104(6): 1498-507. 239. Gomez V, Buchner AM, Dekker E, van den Broek FJ, Meining A, Shahid MW, et al. Interobserver agreement and accuracy among international experts with probe-based confocal laser endomicroscopy in predicting colorectal neoplasia. Endoscopy. 2010; 42(4): 286-91. 240. Sanduleanu S, Driessen A, Gomez-Garcia E, Hameeteman W, de Bruine A, Masclee A. In vivo diagnosis and classification of colorectal neoplasia by chromoendoscopy-guided confocal laser endomicroscopy. Clinical gastroenterology and hepatology : the official clinical practice journal of the American Gastroenterological Association. 2010; 8(4): 371-8. 241. Xie XJ, Li CQ, Zuo XL, Yu T, Gu XM, Li Z, et al. Differentiation of colonic polyps by confocal laser endomicroscopy. Endoscopy. 2011; 43(2): 87-93. 242. Shahid MW, Buchner AM, Heckman MG, Krishna M, Raimondo M, Woodward T, et al. Diagnostic accuracy of probe-based confocal laser endomicroscopy and narrow band imaging for small colorectal polyps: a feasibility study. The American journal of gastroenterology. 2012; 107(2): 231-9. 243. Shahid MW, Buchner AM, Raimondo M, Woodward TA, Krishna M, Wallace MB. Accuracy of real-time vs. blinded offline diagnosis of neoplastic colorectal polyps using probe-based confocal laser endomicroscopy: a pilot study. Endoscopy. 2012; 44(4): 343-8. 244. O'Brien MJ, Winawer SJ, Zauber AG, Gottlieb LS, Sternberg SS, Diaz B, et al. The National Polyp Study. Patient and polyp characteristics associated with high-grade dysplasia in colorectal adenomas. Gastroenterology. 1990; 98(2): 371-9. 245. Kulling D, Christ AD, Karaaslan N, Fried M, Bauerfeind P. Is histological investigation of polyps always necessary? Endoscopy. 2001; 33(5): 428-32. 246. Church JM. Clinical significance of small colorectal polyps. Diseases of the colon and rectum. 2004; 47(4): 481-5. 247. Rex DK, Overhiser AJ, Chen SC, Cummings OW, Ulbright TM. Estimation of impact of American College of Radiology recommendations on CT colonography reporting for resection of high-risk adenoma findings. The American journal of gastroenterology. 2009; 104(1): 149-53.
240
248. Butterly LF, Chase MP, Pohl H, Fiarman GS. Prevalence of clinically important histology in small adenomas. Clinical gastroenterology and hepatology : the official clinical practice journal of the American Gastroenterological Association. 2006; 4(3): 343-8. 249. Waye JD, Lewis BS, Frankel A, Geller SA. Small colon polyps. The American journal of gastroenterology. 1988; 83(2): 120-2. 250. Gupta N, Bansal A, Rao D, Early DS, Jonnalagadda S, Wani SB, et al. Prevalence of advanced histological features in diminutive and small colon polyps. Gastrointest Endosc. 2012; 75(5): 1022-30. 251. Rex DK, Kahi C, O'Brien M, Levin TR, Pohl H, Rastogi A, et al. The American Society for Gastrointestinal Endoscopy PIVI (Preservation and Incorporation of Valuable Endoscopic Innovations) on real-time endoscopic assessment of the histology of diminutive colorectal polyps. Gastrointest Endosc. 2011; 73(3): 419-22. 252. Lieberman DA, Rex DK, Winawer SJ, Giardiello FM, Johnson DA, Levin TR. Guidelines for colonoscopy surveillance after screening and polypectomy: a consensus update by the US Multi-Society Task Force on Colorectal Cancer. Gastroenterology. 2012; 143(3): 844-57. 253. Emura F, Saito Y, Taniguchi M, Fujii T, Tagawa K, Yamakado M. Further validation of magnifying chromocolonoscopy for differentiating colorectal neoplastic polyps in a health screening center. Journal of gastroenterology and hepatology. 2007; 22(11): 1722-7. 254. Ladabaum U, Fioritto A, Mitani A, Desai M, Kim JP, Rex DK, et al. Real-time optical biopsy of colon polyps with narrow band imaging in community practice does not yet meet key thresholds for clinical decisions. Gastroenterology. 2013; 144(1): 81-91. 255. G Longcroft-Wheaton PB. Characterisation colonic polyps using fice without optical magnification: a new classification system (N.A.C.). Gut. 2012; 61(Suppl 2): A329-A30. 256. G R Longcroft-Wheaton RM, T Uraoka, P Bhandari. A prospective study validating a novel and simple polyp classification and comparing the outcomes between a Japanese expert and Western expert in a UK setting. Gut. 2010; 59(Suppl 1): A22-A3. 257. Gaius R. Longcroft-Wheaton RJM, Toshio Uraoka, Pradeep Bhandari. Validation of a Novel Polyp Classification System and Comparison of Outcomes Between a Japanese and Western Expert: A Prospective Study. Gastrointestinal Endoscopy. 2010; 71(5): AB196. 258. The Paris endoscopic classification of superficial neoplastic lesions: esophagus, stomach, and colon: November 30 to December 1, 2002. Gastrointest Endosc. 2003; 58(6 Suppl): S3-43. 259. Bhat YM, Dayyeh BK, Chauan SS, Gottlieb KT, Hwang JH, Komanduri S, et al. High definition and high magnification endoscopes. Gastrointestinal Endosc. 2014; 80(6): 919-27. 260. East JE, Stavrindis M, Thomas-Gibson S, Guenther T, Tekkis PP, Saunders BP. A comparative study of standard vs. high definition colonoscopy for adenoma and hyperplastic polyp detection with optimized withdrawal technique. Alimentary pharmacology & therapeutics. 2008; 28(6): 768-76. 261. Pellise M, Fernandez-Esparrach G, Cardenas A, Sendino O, Ricart E, Vaquero E, et al. Impact of wide-angle, high-definition endoscopy in the diagnosis of colorectal neoplasia: a randomized controlled trial. Gastroenterology. 2008; 135(4): 1062-8. 262. Buchner AM, Shahid MW, Heckman MG, McNeil RB, Cleveland P, Gill KR, et al. High-definition colonoscopy detects colorectal polyps at a higher rate than standard white-light colonoscopy. Clinical gastroenterology and hepatology : the official clinical practice journal of the American Gastroenterological Association. 2010; 8(4): 364-70. 263. Burke CA, Choure AG, Sanaka MR, Lopez R. A comparison of high-definition versus conventional colonoscopes for polyp detection. Digestive diseases and sciences. 2010; 55(6): 1716-20. 264. Tribonias G, Theodoropoulou A, Konstantinidis K, Vardas E, Karmiris K, Chroniaris N, et al. Comparison of standard vs high-definition, wide-angle colonoscopy for polyp detection: a randomized controlled trial. Colorectal disease : the official journal of the Association of Coloproctology of Great Britain and Ireland. 2010; 12(10 Online): e260-6.
241
265. Erim T, Rivas JM, Velis E, Castro F. Role of high definition colonoscopy in colorectal adenomatous polyp detection. World journal of gastroenterology : WJG. 2011; 17(35): 4001-6. 266. Subramanian V, Mannath J, Hawkey CJ, Ragunath K. High definition colonoscopy vs. standard video endoscopy for the detection of colonic polyps: a meta-analysis. Endoscopy. 2011; 43(6): 499-505. 267. Wang HS, Pisegna J, Modi R, Liang LJ, Atia M, Nguyen M, et al. Adenoma detection rate is necessary but insufficient for distinguishing high versus low endoscopist performance. Gastrointest Endosc. 2013; 77(1): 71-8. 268. de Wijkerslooth TR, Stoop EM, Bossuyt PM, Tytgat KM, Dees J, Mathus-Vliegen EM, et al. Differences in proximal serrated polyp detection among endoscopists are associated with variability in withdrawal time. Gastrointest Endosc. 2013; 77(4): 617-23. 269. Payne SR, Church TR, Wandell M, Rosch T, Osborn N, Snover D, et al. Endoscopic detection of proximal serrated lesions and pathologic identification of sessile serrated adenomas/polyps vary on the basis of center. Clinical gastroenterology and hepatology : the official clinical practice journal of the American Gastroenterological Association. 2014; 12(7): 1119-26. 270. East JE, Vieth M, Rex DK. Serrated lesions in colorectal cancer screening: detection, resection, pathology and surveillance. Gut. 2015; 64(6): 991-1000. 271. Amin A, Gilmour H, Graham L, Paterson-Brown S, Terrace J, Crofts TJ. Gastric adenocarcinoma missed at endoscopy. Journal of the Royal College of Surgeons of Edinburgh. 2002; 47(5): 681-4. 272. Khalil Q, Gopalswamy N, Agrawal S. Missed esophageal and gastric cancers after esophagogastroduodenoscopy in a midwestern military veteran population. Southern medical journal. 2014; 107(4): 225-8. 273. Bloomfeld RS, Bridgers DI, 3rd, Pineau BC. Sensitivity of upper endoscopy in diagnosing esophageal cancer. Dysphagia. 2005; 20(4): 278-82. 274. Voutilainen ME, Juhola MT. Evaluation of the diagnostic accuracy of gastroscopy to detect gastric tumours: clinicopathological features and prognosis of patients with gastric cancer missed on endoscopy. European journal of gastroenterology & hepatology. 2005; 17(12): 1345-9. 275. Pech O, Behrens A, May A, Nachbar L, Gossner L, Rabenstein T, et al. Long-term results and risk factor analysis for recurrence after curative endoscopic therapy in 349 patients with high-grade intraepithelial neoplasia and mucosal adenocarcinoma in Barrett's oesophagus. Gut. 2008; 57(9): 1200-6. 276. Bertoni G, Gumina C, Conigliaro R, Ricci E, Staffetti J, Mortilla MG, et al. Randomized placebo-controlled trial of oral liquid simethicone prior to upper gastrointestinal endoscopy. Endoscopy. 1992; 24(4): 268-70. 277. McDonald GB, O'Leary R, Stratton C. Pre-endoscopic use of oral simethicone. Gastrointest Endosc. 1978; 24(6): 283. 278. Fujii T, Iishi H, Tatsuta M, Hirasawa R, Uedo N, Hifumi K, et al. Effectiveness of premedication with pronase for improving visibility during gastroendoscopy: a randomized controlled trial. Gastrointest Endosc. 1998; 47(5): 382-7. 279. Kuo CH, Sheu BS, Kao AW, Wu CH, Chuang CH. A defoaming agent should be used with pronase premedication to improve visibility in upper gastrointestinal endoscopy. Endoscopy. 2002; 34(7): 531-4. 280. Chang CC, Chen SH, Lin CP, Hsieh CR, Lou HY, Suk FM, et al. Premedication with pronase or N-acetylcysteine improves visibility during gastroendoscopy: an endoscopist-blinded, prospective, randomized study. World journal of gastroenterology : WJG. 2007; 13(3): 444-7. 281. Asl SM, Sivandzadeh GR. Efficacy of premedication with activated Dimethicone or N-acetylcysteine in improving visibility during upper endoscopy. World journal of gastroenterology : WJG. 2011; 17(37): 4213-7.
242
282. Chang WK, Yeh MK, Hsu HC, Chen HW, Hu MK. Efficacy of simethicone and N-acetylcysteine as premedication in improving visibility during upper endoscopy. Journal of gastroenterology and hepatology. 2014; 29(4): 769-74. 283. Neale JR, James S, Callaghan J, Patel P. Premedication with N-acetylcysteine and simethicone improves mucosal visualization during gastroscopy: a randomized, controlled, endoscopist-blinded study. European journal of gastroenterology & hepatology. 2013; 25(7): 778-83. 284. Bhandari P, Green S, Hamanaka H, Nakajima T, Matsuda T, Saito Y, et al. Use of Gascon and Pronase either as a pre-endoscopic drink or as targeted endoscopic flushes to improve visibility during gastroscopy: a prospective, randomized, controlled, blinded trial. Scandinavian journal of gastroenterology. 2010; 45(3): 357-61. 285. Ahsan M, Babaei L, Gholamrezaei A, Emami MH. Simethicone for the Preparation before Esophagogastroduodenoscopy. Diagnostic and therapeutic endoscopy. 2011; 2011: 484532. 286. Chen MJ, Wang HY, Chang CW, Hu KC, Hung CY, Chen CJ, et al. The add-on N-acetylcysteine is more effective than dimethicone alone to eliminate mucus during narrow-band imaging endoscopy: a double-blind, randomized controlled trial. Scandinavian journal of gastroenterology. 2013; 48(2): 241-5. 287. Holdiness MR. Clinical pharmacokinetics of N-acetylcysteine. Clinical pharmacokinetics. 1991; 20(2): 123-34. 288. Nolin TD, Ouseph R, Himmelfarb J, McMenamin ME, Ward RA. Multiple-dose pharmacokinetics and pharmacodynamics of N-acetylcysteine in patients with end-stage renal disease. Clinical journal of the American Society of Nephrology : CJASN. 2010; 5(9): 1588-94. 289. Landis JR, Koch GG. The measurement of observer agreement for categorical data. Biometrics. 1977; 33(1): 159-74. 290. Callaghan J, Neale JR, Boger P, Patel P. Patient preparation prior to gastroscopy: a UK wide survey. Gut. 2012; 61: Suppl 2 A271-A2. 291. Veitch A, Rutter MD. Improving quality in endoscopy: are we nearly there yet? Frontline Gastroenterology. 2015; 6(2): 127-31. 292. [cited 2015 23rd March]; Available from: http://www.thejag.org.uk/downloads%5CJAG%20Certification%20for%20trainees%5CDOPS%20Grade%20Descriptors%20-%20Diagnostic%20Upper%20GI.pdf 293. [cited 2014 26th Januray]; Available from: https://www.jets.nhs.uk/NEP/JAG/Default.aspx 294. [cited 2014 26th January ]; Available from: http://www.thejag.org.uk/downloads%5CDOPS%20Forms%20For%20International%20and%20reference%20use%20only%5CDOPyS%20v%2017.pdf 295. JRCPTB. Speciality Training Curriculum for Gastroenterology August 2010. 2010 [cited 2014 12th January]; Available from: http://www.gmc-uk.org/Gastroenterology_curriculum_2010.pdf_32486121.pdf 296. Higashi R, Uraoka T, Kato J, Kuwaki K, Ishikawa S, Saito Y, et al. Diagnostic accuracy of narrow-band imaging and pit pattern analysis significantly improved for less-experienced endoscopists after an expanded training program. Gastrointest Endosc. 2010; 72(1): 127-35. 297. Doubeni CA, Weinmann S, Adams K, Kamineni A, Buist DS, Ash AS, et al. Screening colonoscopy and risk for incident late-stage colorectal cancer diagnosis in average-risk adults: a nested case-control study. Annals of internal medicine. 2013; 158(5 Pt 1): 312-20. 298. Brenner H, Chang-Claude J, Seiler CM, Rickert A, Hoffmeister M. Protection from colorectal cancer after colonoscopy: a population-based, case-control study. Annals of internal medicine. 2011; 154(1): 22-30. 299. Lebwohl B, Kastrinos F, Glick M, Rosenbaum AJ, Wang T, Neugut AI. The impact of suboptimal bowel preparation on adenoma miss rates and the factors associated with early repeat colonoscopy. Gastrointest Endosc. 2011; 73(6): 1207-14.
243
300. Kim HG, Thosani N, Banerjee S, Chen A, Friedland S. Effect of prior biopsy sampling, tattoo placement, and snare sampling on endoscopic resection of large nonpedunculated colorectal lesions. Gastrointest Endosc. 2015; 81(1): 204-13. 301. Raghavendra M, Hewett DG, Rex DK. Differentiating adenomas from hyperplastic colorectal polyps: narrow-band imaging can be learned in 20 minutes. Gastrointest Endosc. 2010; 72(3): 572-6. 302. Ignjatovic A, Thomas-Gibson S, East JE, Haycock A, Bassett P, Bhandari P, et al. Development and validation of a training module on the use of narrow-band imaging in differentiation of small adenomas from hyperplastic colorectal polyps. Gastrointest Endosc. 2011; 73(1): 128-33. 303. Patel SG, Rastogi A, Austin G, Hall M, Siller BA, Berman K, et al. Gastroenterology trainees can easily learn histologic characterization of diminutive colorectal polyps with narrow band imaging. Clinical gastroenterology and hepatology : the official clinical practice journal of the American Gastroenterological Association. 2013; 11(8): 997-1003 e1. 304. Coe SG, Thomas C, Crook J, Ussui V, Diehl N, Wallace MB. Colorectal surveillance interval assignment based on in vivo prediction of polyp histology: impact of endoscopic quality improvement program. Gastrointest Endosc. 2012; 76(1): 118-25 e1. 305. Rastogi A, Pondugula K, Bansal A, Wani S, Keighley J, Sugar J, et al. Recognition of surface mucosal and vascular patterns of colon polyps by using narrow-band imaging: interobserver and intraobserver agreement and prediction of polyp histology. Gastrointest Endosc. 2009; 69(3 Pt 2): 716-22. 306. Rastogi A, Rao DS, Gupta N, Grisolano SW, Buckles DC, Sidorenko E, et al. Impact of a computer-based teaching module on characterization of diminutive colon polyps by using narrow-band imaging by non-experts in academic and community practice: a video-based study. Gastrointest Endosc. 2014; 79(3): 390-8. 307. Sinh P, Gupta N, Rao DS, Wani S, Sharma P, Bansal A, et al. Community gastroenterologists can learn diminutive colon polyp histology characterization with narrow band imaging by a computer-based teaching module. Digestive endoscopy : official journal of the Japan Gastroenterological Endoscopy Society. 2015; 27(3): 374-80.
244
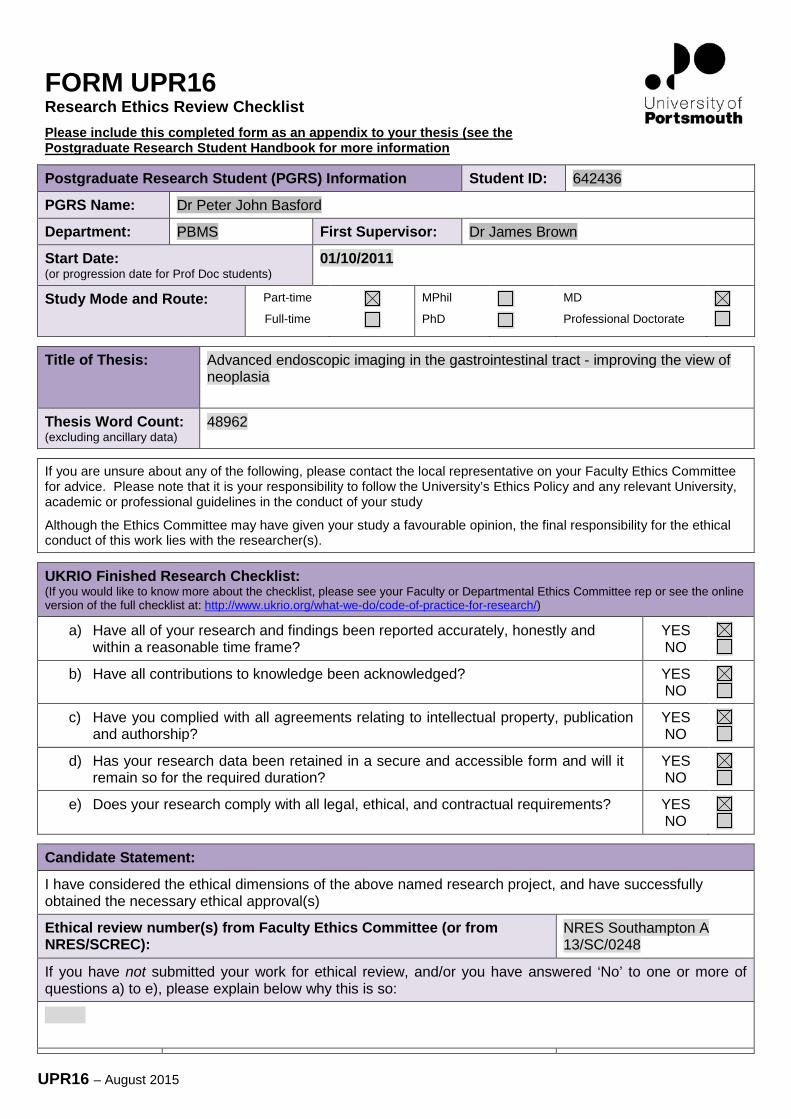
FORM UPR16 Research Ethics Review Checklist
Please include this completed form as an appendix to your thesis (see the Postgraduate Research Student Handbook for more information
Postgraduate Research Student (PGRS) Information
Student ID:
642436
PGRS Name:
Dr Peter John Basford
Department:
PBMS
First Supervisor:
Dr James Brown
Start Date: (or progression date for Prof Doc students)
01/10/2011
Study Mode and Route:
Part-time
Full-time
MPhil
PhD
MD
Professional Doctorate
Title of Thesis:
Advanced endoscopic imaging in the gastrointestinal tract - improving the view of neoplasia
Thesis Word Count: (excluding ancillary data)
48962
If you are unsure about any of the following, please contact the local representative on your Faculty Ethics Committee for advice. Please note that it is your responsibility to follow the University’s Ethics Policy and any relevant University, academic or professional guidelines in the conduct of your study
Although the Ethics Committee may have given your study a favourable opinion, the final responsibility for the ethical conduct of this work lies with the researcher(s).
UKRIO Finished Research Checklist: (If you would like to know more about the checklist, please see your Faculty or Departmental Ethics Committee rep or see the online version of the full checklist at: http://www.ukrio.org/what-we-do/code-of-practice-for-research/)
a) Have all of your research and findings been reported accurately, honestly and within a reasonable time frame?
YES NO
b) Have all contributions to knowledge been acknowledged?
YES NO
c) Have you complied with all agreements relating to intellectual property, publication and authorship?
YES NO
d) Has your research data been retained in a secure and accessible form and will it remain so for the required duration?
YES NO
e) Does your research comply with all legal, ethical, and contractual requirements?
YES NO
Candidate Statement:
I have considered the ethical dimensions of the above named research project, and have successfully obtained the necessary ethical approval(s)
Ethical review number(s) from Faculty Ethics Committee (or from NRES/SCREC):
NRES Southampton A 13/SC/0248
If you have not submitted your work for ethical review, and/or you have answered ‘No’ to one or more of questions a) to e), please explain below why this is so:
UPR16 – August 2015
Signed (PGRS):
Date: 17/12/15
UPR16 – August 2015