ADVANCED EDUCATION GUIDE - files.anzocapital.com · EVENING STAR DOJI PATTERN This pattern is also...
19
ADVANCED EDUCATION GUIDE
Transcript of ADVANCED EDUCATION GUIDE - files.anzocapital.com · EVENING STAR DOJI PATTERN This pattern is also...

ADVANCED EDUCATION GUIDE

Long-legged Doji Pattern
Gravestone Doji Pattern
Neutral Doji Pattern
Candlestick Patterns
Dragonfly Doji Pattern
Morning Star Doji Pattern
Evening Star Doji Pattern
Three Black Crows signal Pattern
Three White Soldiers Candlestick Pattern
Bearish Engulfing Pattern
Bullish Engulfing Pattern
Dark Cloud Cover Pattern
Piercing candlestick Pattern
Inverted Hammer Pattern
Shooting Star Pattern
Spinning Top Pattern
Full Disclaimer
05
06
04
03
07
08
09
10
11
12
13
14
15
16
17
18
19
CONTENTS
22 www.anzocapital.com
Trading leveraged products such as forex and CFDs carries a high level of risk and may not be suitable for all investors. You may lose all or part of your invested capital.

CANDLESTICK PATTERNS
One extension of the patterns idea in trading is candlestick patterns. So, in the Intermediate guide we looked at patterns in price action or trends and reversals. Now, we would like to take a microscope and place it over those trends or reversals.
Every trend or reversal will have a starting point; a signal that highlights the near-term direction of the asset. That signal is generally a candlestick or series of candlesticks. So we will go through the most common candlestick patterns that you can look out for to make predictions about where prices will go next. It is important to point out that these patterns tend to work best when used in shorter timeframes. So intraday trading is best for these signals.
Japanese candlesticks
Major candlestick patterns:
Let’s begin with the Doji candlestick as it is a candlestick that forms the basis of patterns and itself is a signal of market sentiment. It is very often a marker of indecision in the market as there is little distance between opening and closing prices which give the candlestick its ‘cross-line’ appearance. There are four types of doji candlesticks:
33Trading leveraged products such as forex and CFDs carries a high level of risk and may not be suitable for all investors. You may lose all or part of your invested capital.
www.anzocapital.com
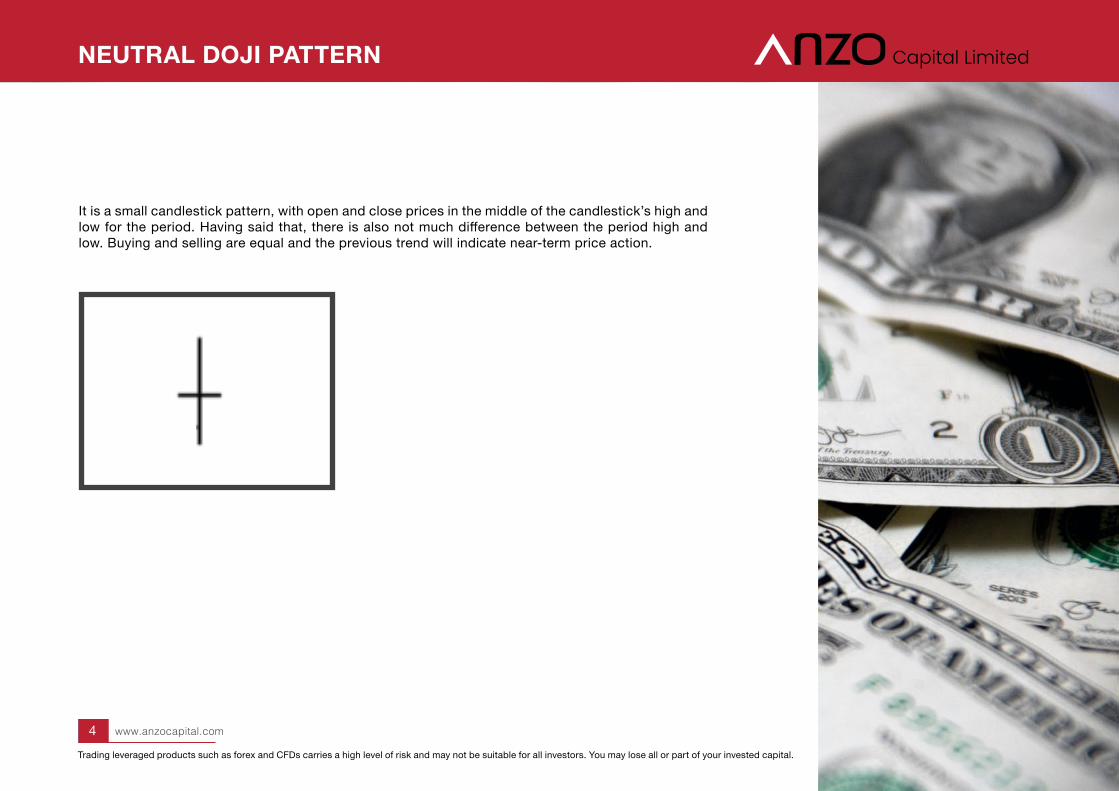
NEUTRAL DOJI PATTERN
4
It is a small candlestick pattern, with open and close prices in the middle of the candlestick’s high and low for the period. Having said that, there is also not much difference between the period high and low. Buying and selling are equal and the previous trend will indicate near-term price action.
4Trading leveraged products such as forex and CFDs carries a high level of risk and may not be suitable for all investors. You may lose all or part of your invested capital.
www.anzocapital.com

5
A long candlestick pattern, yet the asset’s open and close prices are still situated in the middle of the candle’s high and low for the period. There has been more volatility in this candlestick pattern as there is a greater differential between the period high and low. Again the previous trend provides a clue about future price direction.
5Trading leveraged products such as forex and CFDs carries a high level of risk and may not be suitable for all investors. You may lose all or part of your invested capital.
LONG-LEGGED DOJI PATTERN
www.anzocapital.com

6
Open and close prices are equal at the period low. So for the timeframe each candle represents, the low of that period sees prices open and close at the same price.
6Trading leveraged products such as forex and CFDs carries a high level of risk and may not be suitable for all investors. You may lose all or part of your invested capital.
GRAVESTONE DOJI PATTERN
www.anzocapital.com

7
The asset opens and closes at the period high. So despite a large differential in the high and low price for the period, closing price made its way back to the opening price for the period, resulting from equal supply and demand.
All these patterns are used to signal trend formation and can form entry and exit opportunities for intraday traders. If a doji candle forms around a resistance area, it can signal an exit point for the asset. Conversely, a doji appearing near support levels can signal an entry point ahead of a potential bullish move.
We can now take a look at more applied examples of the doji candlestick formation starting with Morning Star Doji and Evening Star Doji patterns.
7Trading leveraged products such as forex and CFDs carries a high level of risk and may not be suitable for all investors. You may lose all or part of your invested capital.
DRAGONFLY DOJI PATTERN
www.anzocapital.com

8
This pattern is formulated with three candlesticks and tends to be a REVERSAL signal. You will normally encounter this pattern after a large sell-off in the asset- at a market bottom. The first candle in the pattern tends to be a large bearish/ down candle that has a long distance between opening and closing price indicating dominance from sellers during the trading period. This is then followed by a doji candle which signifies indecision for the asset and that sellers have lost steam and are unable to dominate the trading period. The next candle in the pattern to follow the doji is a similar but opposite direction bullish candlestick which mirrors the first candlestick in the pattern. The doji in this pattern could be considered the candlestick which ‘puts the brakes on’ the bearish or downtrend. This pattern may not have a doji candle, but it will have a small candle similar to the Neutral Doji candles previously discussed. Confirmation of the reversal will be established with a spike in volume to coincide with a strong bullish ‘third’ candlestick. This is a BUY signal.
8Trading leveraged products such as forex and CFDs carries a high level of risk and may not be suitable for all investors. You may lose all or part of your invested capital.
MORNING STAR DOJI PATTERN
www.anzocapital.com
99Trading leveraged products such as forex and CFDs carries a high level of risk and may not be suitable for all investors. You may lose all or part of your invested capital.
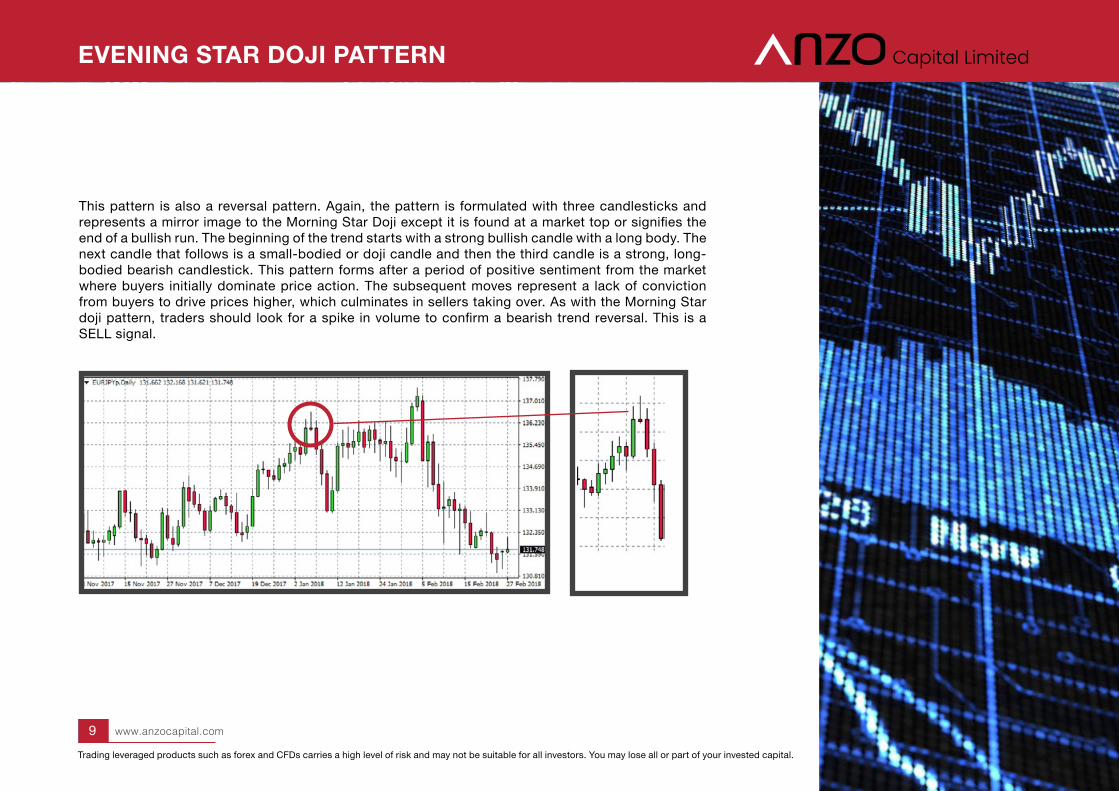
EVENING STAR DOJI PATTERN
This pattern is also a reversal pattern. Again, the pattern is formulated with three candlesticks and represents a mirror image to the Morning Star Doji except it is found at a market top or signifies the end of a bullish run. The beginning of the trend starts with a strong bullish candle with a long body. The next candle that follows is a small-bodied or doji candle and then the third candle is a strong, long-bodied bearish candlestick. This pattern forms after a period of positive sentiment from the market where buyers initially dominate price action. The subsequent moves represent a lack of conviction from buyers to drive prices higher, which culminates in sellers taking over. As with the Morning Star doji pattern, traders should look for a spike in volume to confirm a bearish trend reversal. This is a SELL signal.
www.anzocapital.com

1010Trading leveraged products such as forex and CFDs carries a high level of risk and may not be suitable for all investors. You may lose all or part of your invested capital.
Another set of reversal patterns is the Three Black Crows and Three White Soldiers Candlestick pattern. So we will start with the Three Black Crows signal- again, this pattern is generally found at the top of an uptrend, with all three candles in the pattern being long-bodied and bearish. The candles themselves are equal in size with each new opening price of the next candle below the previous candle’s opening price. This marks the beginning of downtrend and may be found near resistance areas as market participants anticipate a trend reversal.
THREE BLACK CROWS SIGNAL PATTERN
www.anzocapital.com

Trading leveraged products such as forex and CFDs carries a high level of risk and may not be suitable for all investors. You may lose all or part of your invested capital.
By contrast, the Three White Soldiers pattern is the mirror image of the Three Black Crows pattern, except, appears in a downtrend. This time, the candles are long-bodied and bullish, with each opening price above the last with wicks representing the same length. Each candle stick pushes prices higher as buyers return to the market on the signal of a reversal. This serves as a BUY signal.
1111
THREE WHITE SOLDIERS CANDLESTICK PATTERN
www.anzocapital.com

12
Another example of reversal patterns are the Engulfing Candlestick formations. These patterns contain two candlesticks: the first is a small-bodied bullish candle and the second is a long bearish candlestick. The first candle is ‘engulfed’ or completely overlapped by the second candlestick. These types of patterns are found at the top of the market where bulls begin to lose steam and sellers take over.
12Trading leveraged products such as forex and CFDs carries a high level of risk and may not be suitable for all investors. You may lose all or part of your invested capital.
BEARISH ENGULFING PATTERN
www.anzocapital.com

13
The Bullish Engulfing pattern again has two candles in its pattern the first being a small-bodied bearish candlestick and the second a long bullish candlestick. The second candle completely overlaps the first candle. It tends to occur at the end of a downtrend and a buildup of buying pressure initiates the reversal. This pattern can be used as an entry for a Buy signal.
13Trading leveraged products such as forex and CFDs carries a high level of risk and may not be suitable for all investors. You may lose all or part of your invested capital.
BULLISH ENGULFING PATTERN
www.anzocapital.com
14
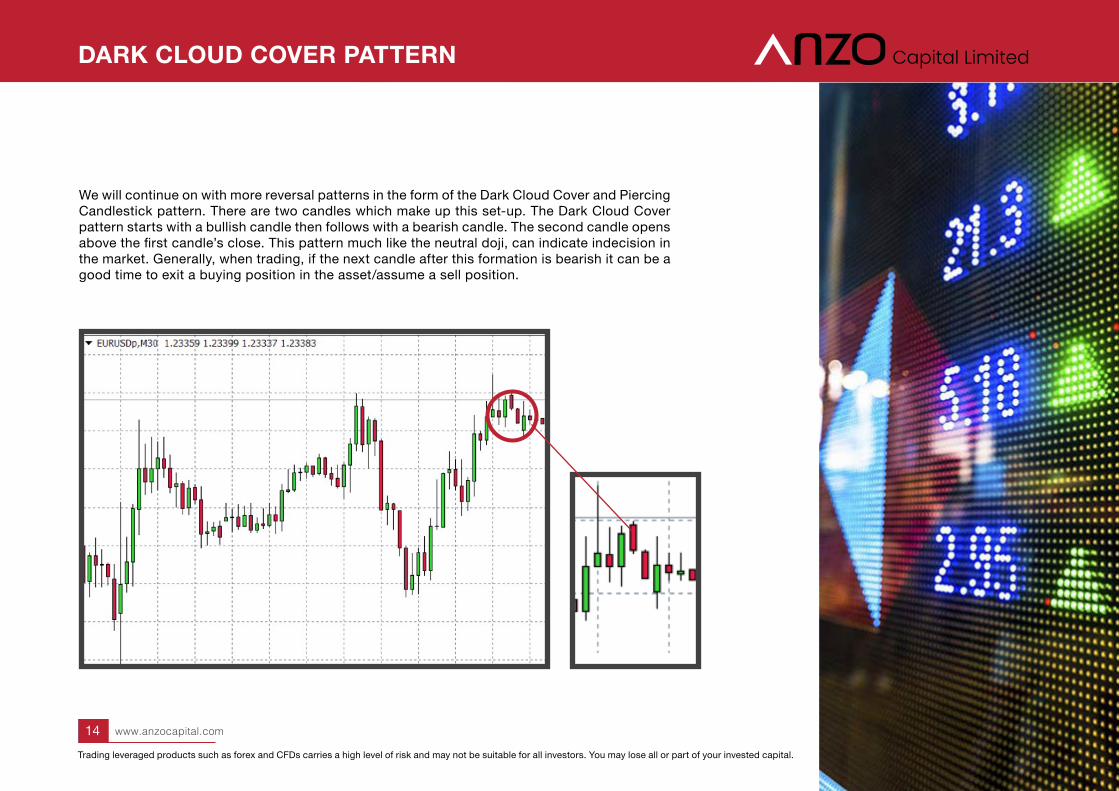
We will continue on with more reversal patterns in the form of the Dark Cloud Cover and Piercing Candlestick pattern. There are two candles which make up this set-up. The Dark Cloud Cover pattern starts with a bullish candle then follows with a bearish candle. The second candle opens above the first candle’s close. This pattern much like the neutral doji, can indicate indecision in the market. Generally, when trading, if the next candle after this formation is bearish it can be a good time to exit a buying position in the asset/assume a sell position.
14Trading leveraged products such as forex and CFDs carries a high level of risk and may not be suitable for all investors. You may lose all or part of your invested capital.
DARK CLOUD COVER PATTERN
www.anzocapital.com

15
The Piercing candlestick pattern begins with a bearish candlestick followed by a bullish candlestick; the bullish candle opens below the first candle’s close and closes above the midsection of the first candle. Traders will watch out for the next candle to be bullish before confirming the pattern as an entry point.
15Trading leveraged products such as forex and CFDs carries a high level of risk and may not be suitable for all investors. You may lose all or part of your invested capital.
PIERCING CANDLESTICK PATTERN
www.anzocapital.com

INVERTED HAMMER PATTERN
16
Let’s introduce a couple of candlesticks that provide a signal for certain market conditions and tend to form certain patterns. We start with the hammer candlestick- which can signify either bearish or bullish conditions:
Patterns which feature the hammer candlestick are: Inverted Hammer pattern and the Shooting Star pattern. They feature the ‘inverted hammer’ which is the opposite of the hammer which is the signal in this pattern. In the Inverted Hammer pattern, the open, close and low are at the lowest point of the pattern. The reason being, is a spike in buying interest after a sell-off in the asset, however, buyers were unable to force prices higher during the period which resulted in the bullish hammer closing near the opening price. This signal may occur near a market bottom.
16Trading leveraged products such as forex and CFDs carries a high level of risk and may not be suitable for all investors. You may lose all or part of your invested capital.
www.anzocapital.com
SHOOTING STAR PATTERN
17
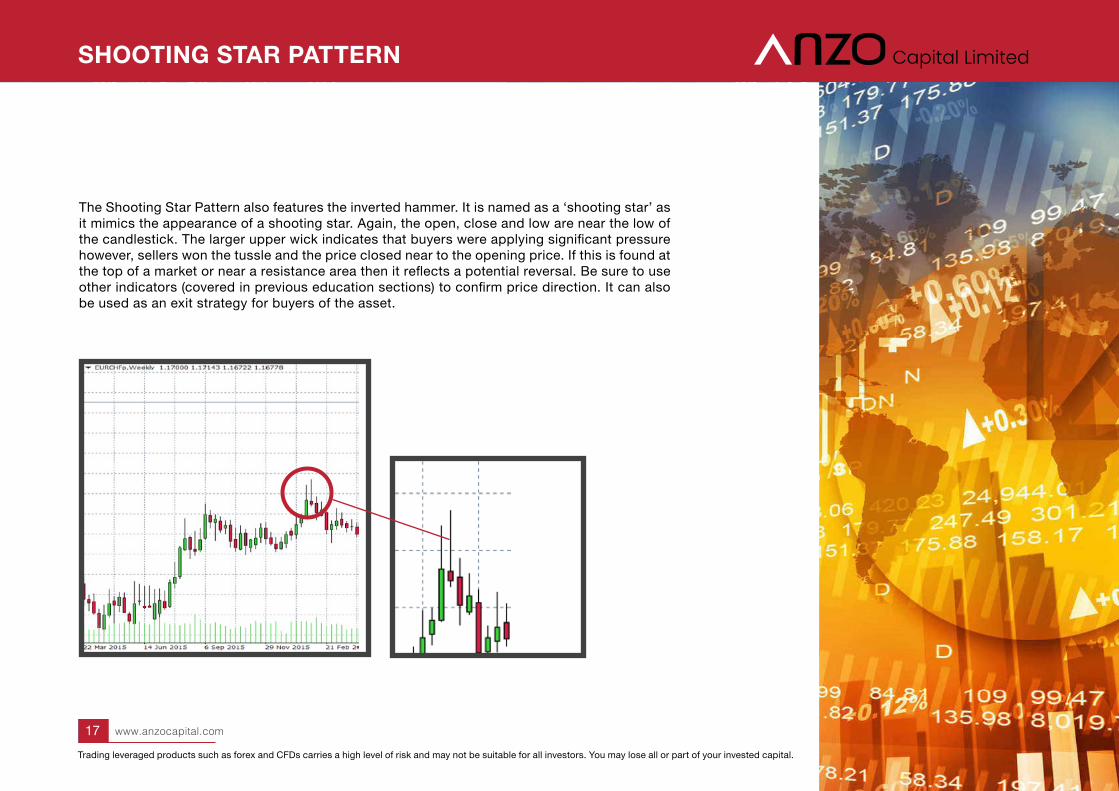
The Shooting Star Pattern also features the inverted hammer. It is named as a ‘shooting star’ as it mimics the appearance of a shooting star. Again, the open, close and low are near the low of the candlestick. The larger upper wick indicates that buyers were applying significant pressure however, sellers won the tussle and the price closed near to the opening price. If this is found at the top of a market or near a resistance area then it reflects a potential reversal. Be sure to use other indicators (covered in previous education sections) to confirm price direction. It can also be used as an exit strategy for buyers of the asset.
17Trading leveraged products such as forex and CFDs carries a high level of risk and may not be suitable for all investors. You may lose all or part of your invested capital.
www.anzocapital.com

1818Trading leveraged products such as forex and CFDs carries a high level of risk and may not be suitable for all investors. You may lose all or part of your invested capital.
SPINNING TOP PATTERN
Spinning Top pattern signals a reversal and the key signal is again one candlestick which looks like a toy spinning top- hence the name! It can be seen at the top or bottom of a trend and tends to indicate a change in sentiment. It highlights relative indecision from market participants as the small body of the candlestick shows little difference between opening and closing prices. However the large upper and lower shadows highlight a tussle between buyers and sellers. As such, the relative indecision should serve as a warning to traders and it is advisable to wait for the close of the next candle before entering into a position.
www.anzocapital.com

FULL DISCLAIMER
Anzocapital.com is part of Anzo Capital Limited, a well-capitalized firm regulated by International Financial Services Commission (IFSC), license no: IFSC/60/482/TS/18. Risk Warning: Leveraged trading in foreign currency contracts or other off-exchange products on margin carries a high level of risk and may not be suitable for everyone. We advise you to carefully consider whether trading is appropriate for you in light of your personal circumstances. You may lose more than what you invest. Information on this website is general in nature. We recommend that you seek independent financial advice and ensure you fully understand the risks involved before trading. Trading through an online platform carries additional risks. Please refer to Anzo Capital’s full Risk Disclosure.
Email: [email protected]
Trading leveraged products such as forex and CFDs carries a high level of risk and may not be suitable for all investors. You may lose all or part of your invested capital.
1919 www.anzocapital.com