Advanced Battery Diagnosis for Electric Vehicles - DiVA
90
June 2008 Tore Marvin Undeland, ELKRAFT Master of Science in Energy and Environment Submission date: Supervisor: Norwegian University of Science and Technology Department of Electrical Power Engineering Advanced Battery Diagnosis for Electric Vehicles Chudamani Lamichhane
Transcript of Advanced Battery Diagnosis for Electric Vehicles - DiVA
June 2008Tore Marvin Undeland, ELKRAFT
Master of Science in Energy and EnvironmentSubmission date:Supervisor:
Norwegian University of Science and TechnologyDepartment of Electrical Power Engineering
Advanced Battery Diagnosis for ElectricVehicles
Chudamani Lamichhane


Problem DescriptionThe breakthrough we see in hybrid and electric vehicles is due to climate change and limited oilsupplies compared to the world needs. Also the progress in battery technologies is a major factorin this. Still there are few electric vehicles produced worldwide. Think is an example of a city carwe may see all over. For manufacturer of electric vehicles, knowledge of the electric propertieswhen using different types of batteries is vital.
The primary goal of this Master project is to study battery technologies for automotive applicationsand their diagnosis methods. Most important in this project is to identify the established testprocedures to diagnosis the advanced batteries used in electric vehicles. The test procedures thathave been developed and followed by the automotive industries and research institutes shall bediscussed. The main goal is to prepare a report on battery technologies from basics to modernbattery testing technology. To verify the theoretical studies made, experimental tests of thebattery following the test algorithms and flowchart are to be carried out and result shall bediscussed in the thesis.
Supervisor: Professor Tore M Undeland
Start: 22 January 2008Deadline: 17 June 2008
Assignment given: 22. January 2008Supervisor: Tore Marvin Undeland, ELKRAFT


Preface ________________________________________________________________________ This thesis was carried out for the partial fulfillment of the requirements for the master’s degree in electrical power engineering from Norwegian University of Science and Technology (NTNU) under the supervision of Professor Tore M Undeland during the period of January 2008 to June 2008. Norwegian Government under the Quota Scheme has provided the scholarship to study this two years master’s degree course an NTNU. I was very much privileged to be a first batch student of international master’s programme of department of electric power engineering. The motivation behind choosing this project as of my master’s thesis was the breakthrough development on battery technologies and electric vehicles in recent years. This innovative technology is a part of alternative energy programme to minimize the fossil fuel consumption and thus minimize the global warming by reducing the environmental pollution from transport sector. My home country, Nepal, is landlocked and no petroleum products inside so far to the date. It has huge clean energy potential, second largest hydropower potential in the world. It is hoped that later or sooner, Nepal will have sufficient hydro electricity to charge the high power battery for full electric vehicles. So, this study and knowledge is very relevant to the emerging electric vehicle industries around the world. This report presents the battery technologies from basics to modern battery testing technology following the standard battery test algorithms and flowchart. It also discuss the established test procedures to diagnosis the advanced batteries. I enormously enjoyed on working with NTNU Norway, RWTH University of Aachen, Germany and Think Global, Norway in connection to this study. I am indebted to my supervisor Professor Tore M Undeland, who has not only been an advisor to me but also arranged the exposure visit to Aachen, Germany to see the test benches for batteries and electrical vehicles and participate on battery testing. I am very much grateful to Professor Rik W. De Donckor, Professor Dirk U. Sauer and colleagues at ISEA, RWTH Aachen University for their time to discuss with me on many issues and resources they have provided for me during my stay in Aachen, Germany. I would like to acknowledge to the Think Global, Norway for the fruitful discussion on battery technology issues in the early stage of this study. My sincere thanks go to Dr. Peter Freere from Monash University, Australia who has been with me to guide and support in one or another way from the distance. My special thanks to NTNU PhD student Giuseppe Guidi and colleagues from Energy Conversion Group in department of electric power engineering. I wish to thank my wife Irika and lovely daughter Rebeeca for their patience and moral support. June 17, 2008, Trondheim Chudamani Lamichhane
Table of Contents
1 Introduction …………………………………………………… 6 1.1 Propulsion concepts for modern vehicles…………………..……. 7 1.2 Energy storage systems for automotive applications…………….. 10
1.2.1 Flooded lead acid batteries………………………………………. 10 1.2.2 Valve regulated lead acid batteries……………………….. 11 1.2.3 Nickel/metal hydride batteries……………………………. 11 1.2.4 Lithium ion batteries………………………………………. 12 1.2.5 Other batteries…………………………………………..... 13 1.2.6 Supercapacitors……………………………………............ 14 1.2.7 Fuel cells………………………………………………….. 14
2 Battery Technology………………………………………………..16 2.1 Basic concepts and components…………………………………… 17 2.2 Classifications of cells or batteries………………………………… 18
2.2.1 Primary cells or batteries…………………………………... 18 2.2.2 Secondary or rechargeable cells or batteries……………….. 18 2.2.3 Reserve batteries…………………………………… ……... 19 2.2.4 Fuel cells…………………………………………………… 19
2.3 Operation of cell…………………………………………………… 20 2.3.1 Discharging………………………………………………….20 2.3.2 Charging……………………………………………………. 21
3 Factors Affecting the Battery Performance……………………. 23 3.1 General characteristics……………………………………………... 23 3.2 Factors affecting the battery performance…………………………. 23
3.2.1 Voltage level……………………………………………….. 24 3.2.2 Current drain of discharge…………………………………. 26 3.2.3 Temperature of battery during discharge………………….. 27 3.2.4 Service life………………………………………………… 27 3.2.5 Duty cycles………………………………………………… 28 3.2.6 Voltage regulation…………………………………………. 29 3.2.7 Charging voltage………………………………………….. 29 3.2.8 Battery age and storage condition………………………… 30 3.2.9 Effect of cells and battery design………………………… 30
2

4 Advanced Battery Test …………………………………………...31
4.1 General battery test plan …………………………………………. 31 4.2 Battery pre - test preparation………………………………………. 32 4.3 Constant current discharge test……………………………………. 32 4.4 Peak power test……………………………………………………. 32 4.5 Constant power discharge test…………………………………… 33 4.6 Variable power discharge test…………………………………… 34 4.6.1 FUDS regime……………………………………………… 34 4.6.2 DST regime………………………………………………… 35 4.7 Special performance tests…………………………………………. 35 4.8 Safety and abuse test……………………………………………… 36 4.9 Life cycle test……………………………………………………… 37 5 Electric Vehicle & Battery Test Competencies at RWTH …….. 38 5.1 Electrical drives ………………………………………………….. 39 5.2 Electrochemical energy storage systems……………………….. 40 5.3 Electrochemical impedance spectroscopy (EIS) ………..................41 5.3.1 Impedance spectroscopy working principle……………….. 41 5.3.1 Application of impedance spectroscopy…………………… 42 5.3.3 System structure and technical data of EISmeter………….. 43 5.3.4 Measurement with EISmeter………………………………. 45
6 Introduction to Impedance Based Modeling of Batteries ………48 6.1 Requirements of device models…………………………………… 48 6.2 Possible battery models…………………………………………… 49 6.2.1 Ideal models……………………………………………….. 50 6.2.2 Behavior models…………………………………………… 50 6.2.3 Equivalent circuit models…………………………………. 50 6.2.4 Physico-chemical models with spatial resolution………… 50
7 Experimental Results and Discussion ……………………………52
7.1 Battery testing…………………………………………………. 52
7.1.1 Directly measure parameters………………………………. 52 7.1.2 Derived parameters for advance battery testing ……………52
7.2 Battery test and measurement system……………………………… 55 7.3 Li- ion battery test…………………………………………………. 56
7.3.1 Design & working principle of Li-ion batteries…………… 56 7.3.2 Impedance with charge transfer and diffusion of Li-ion….. 57 7.3.3 Impedance spectra of Li-ion battery………………………. 60
7.4 Valve Regulated Lead Acid (VRLA) battery test………………….. 62 7.4.1 Design & working principle of VRLA batteries…………… 62 7.4.2 Impedance spectra of VRLA battery………………………. 64
3

8 Conclusion ……………………………………………………… 66
9 Further works……………………………………………………. 67 10 References ………………………………………………………. 68-71 11 Appendices ………………………………………………………. 72-86
Appendix A: Generic Test Plan Outline for FreedomCAR Testing Appendix B: Datasheet of Batteries Used in Experiment Appendix C: Glossary and Abbreviations
4

LIST OF FIGURES Figure 1.1 Hybrid propulsion concepts for modern vehicles ………………… 2 Figure 1.2 Cut model of combustion engine with belt-driven starter/alternator. 3 Figure 1.3 Ragone diagram for energy storage systems………………………. 5 Figure 2.1 Electrochemical operation of a cell (discharge)………………….. 16 Figure 2.2 Electrochemical operation of a cell (charge) ……………………… 17 Figure 3.1 Characteristic discharge curves …………………………………… 19 Figure 3.2 Battery discharge characteristics – voltage profiles……………….. 21 Figure 3.3 Battery discharge characteristics – voltage level ………………….. 21 Figure 3.4 Effect of temperature on battery capacity ………………………… 22 Figure 3.5 Battery service life at various discharge loads and temperature … 23 Figure 3.6 Typical voltage profile on charge and discharge ………………… 24 Figure 3.7 Effect of self discharge on battery capacity ………………………. 25 Figure 4.1 USABC Battery test flow diagram ……………………………….. 26 Figure 5.1 120 kW drive test bench ….……………………………………… 33 Figure 5.2 Complete drive test stand for vehicle ……………………………… 33 Figure 5.3 EISmeter (Left: ISEA design, Right: Commercial, Digatron) ……. 38 Figure 5.4 System structure of EISmeter …………………………………….. 39 Figure 5.5 Measured impedance spectra with different dc currents……………41 Figure 6.1 Input and output quantities of the device models …………………. 43 Figure 7.1 Standard battery test bench ………………………………………... 50 Figure 7.2 General working principle of Li-ion batteries …………………….. 52 Figure 7.3 Transmission line model of a porous electrode …………………… 53 Figure 7.1 Schematic complex-plane plots of Warburg impedances ………… 54 Figure7.2 Impedance spectra of a Li-ion battery …………………………….. 56 Figure7.3 Impedance spectra of a Li-ion battery (microcycle operation) …… 57 Figure 7.7 Impedance spectra of VRLA battery ……………………………….59 Figure 7.8: Enlarged view of the high-frequency range of figure 7.7 ………… 60 LISTS OF TABLES Table 1.1 Comparison of energy storage technologies …………………….. 10 Table 5.1 Test bench features at ISEA ……………………………………… 34 Table 5.2 SR drive specifications at ISEA ………………………………… 34 Table 6.1 Normal specifications for simulation models of battery ………… 44 Table 6.2 Comparison of different modeling approaches for energy storage
devices ……………………………………………………………..46
5

Chapter 1 Introduction Due to the increase of the global population, it is expected that the desire for individual transportation and thus the number of vehicles will grow in future. Therefore, research institutes and auto industries are investigating new vehicle concepts and developing innovating technologies to govern environmental pollution reducing the green house effect and thus minimizing the global warming.
As a first step towards energy saving vehicle concepts, the most promising technology is a hybrid electrical vehicle. It consists of a conventional internal combustion engine (ICE) combined with and electrical machine serve as a generator and at the same time as a motor offering additional torque. Furthermore, the concept requires an energy storage device on board of the vehicle. Thus, recovering the braking energy becomes possible. By applying sophisticated energy management algorithms which on the one hand control the energy flow within the power net of the vehicle and on the other hand make sure, that the combustion motor is driven in an optimal operation mode, a significant reduction of fuel consumption is possible. Now, rapid development of high power lithium ion (Li-ion) battery has shown the possibility of battery powered full electric vehicles (EVs). The development and evaluation of Li-ion battery is going parallel now. This thesis intend to discuss on battery technologies from basics to evaluation of battery performances through the standard battery test procedures followed by specialized battery diagnosis tools, electrochemical impedance spectroscopy meter (EISmeter). The part of this thesis intent to develop the knowledge on advanced battery diagnosis at NTNU and document it as an academic report. This thesis is organized in 9 chapters. Chapter 1 presents the electrical propulsion concepts for electric vehicles and energy storage systems. Chapter 2 and 3 discusses on basic battery concepts and factors affecting the battery performances. Chapters 4 and 5 covers the standard battery test flowcharts and discuss on specialized battery diagnosis tool, electrochemical impedance spectroscopy (EIS) developed by RWTH Aachen University, Germany. Chapter 6 and 7 presents the introduction knowledge on different battery models and experimental results of battery testing. Chapter 8 and 9 presents conclusions of this study and recommendation for further works to continue this project in future.
6

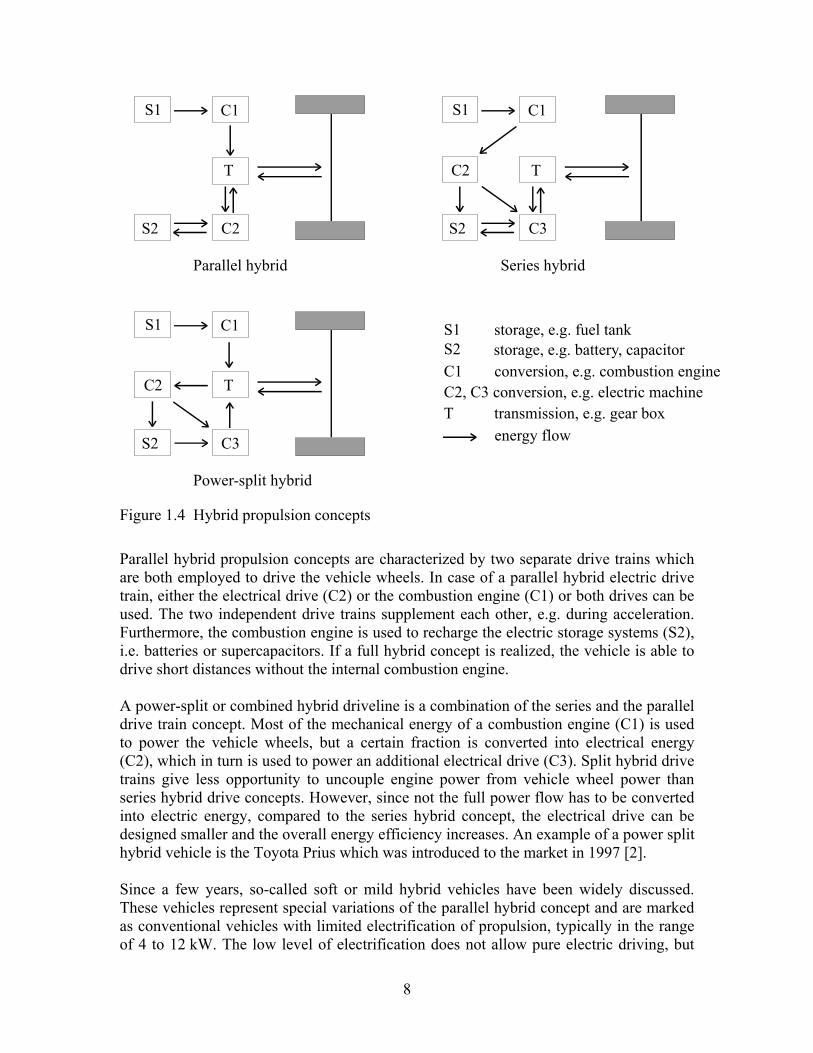
1.1 Propulsion Concepts for Electric Vehicles Alternative propulsion concepts compete with the conventional vehicle power train since a several decades, which is powered by an internal combustion engine. Beginning in the 1970s, research and small-scale production activities dedicated to battery electric vehicles were initiated. Although the early demonstration projects showed that electrical drives and the corresponding power electronics and control algorithms could fulfill the demands of automotive propulsion, the traction battery turned out to be the performance-limiting device and the most important commercialization obstacle. Especially the restricted driving range, the high cost as well as the short lifetime of the employed lead-acid batteries inhibited a wide spread of battery-powered vehicles. Despite the development of advanced battery technologies, e.g. nickel/ metal hydride (NiMH) and lithium-ion batteries (Li-Ion), which overcome most technical restrictions, the battery cost are still too high for a successful market introduction of battery electric vehicles. It has been recognized that the electrochemical energy storage as the most important problem of full-electric vehicles, several technical alternatives have been pursued. Fuel-cell electric vehicles offer the advantages of the electric power train while avoiding the problem of the restricted driving range. However, if hydrogen is used as energy source, the lack of an appropriate infrastructure, i.e. hydrogen filling stations, as well as a number of safety issues, e.g. caused by the hydrogen tank, represent other commercialization obstacles. Alternatively, methanol or gasoline can also be used as energy source for fuel-cell systems [1]. In this case, the existing filling stations can be used, but the increased complexity of the vehicle leads again to a significant cost increase. Hybrid electric vehicles combine the advantages of different propulsion concepts, e.g. of an electrical and a conventional combustion power train [2]. In general, three different basic architectures of electric hybrid vehicles can be identified: the series hybrid concept, the parallel hybrid concept and the power-split hybrid concept. In figure 1.1 the three vehicle concepts are shown. In a series hybrid driveline, all energy to the vehicle wheels is converted in a single conversion machine (C3). Such a drive train could e.g. consist of a combustion engine (C1) which works at its optimum operation point powering an alternator (C2) which in turn produces the energy for an electrical drive (C3). Excess power can be stored in a comparably small, thus affordable, traction battery (S2) which offers extra power during acceleration, enables regenerative braking and allows pure electric driving with zero local emission for a short distance. Series hybrid drivelines are advantageous in terms of component packaging and freedom of driveline control. However, due to the repeated complete conversion of the primary energy into different energy forms, the system efficiency can be problematic.
7
S1
S2
C1
T
C2
Parallel hybrid
S1
S2
C1
T
C3
Power-split hybrid
C2
S1
S2
C1
T
C3
Series hybrid
C2
S1 storage, e.g. fuel tankS2 storage, e.g. battery, capacitorC1 conversion, e.g. combustion engineC2, C3 conversion, e.g. electric machineT transmission, e.g. gear box
energy flow
Figure 1.4 Hybrid propulsion concepts Parallel hybrid propulsion concepts are characterized by two separate drive trains which are both employed to drive the vehicle wheels. In case of a parallel hybrid electric drive train, either the electrical drive (C2) or the combustion engine (C1) or both drives can be used. The two independent drive trains supplement each other, e.g. during acceleration. Furthermore, the combustion engine is used to recharge the electric storage systems (S2), i.e. batteries or supercapacitors. If a full hybrid concept is realized, the vehicle is able to drive short distances without the internal combustion engine. A power-split or combined hybrid driveline is a combination of the series and the parallel drive train concept. Most of the mechanical energy of a combustion engine (C1) is used to power the vehicle wheels, but a certain fraction is converted into electrical energy (C2), which in turn is used to power an additional electrical drive (C3). Split hybrid drive trains give less opportunity to uncouple engine power from vehicle wheel power than series hybrid drive concepts. However, since not the full power flow has to be converted into electric energy, compared to the series hybrid concept, the electrical drive can be designed smaller and the overall energy efficiency increases. An example of a power split hybrid vehicle is the Toyota Prius which was introduced to the market in 1997 [2]. Since a few years, so-called soft or mild hybrid vehicles have been widely discussed. These vehicles represent special variations of the parallel hybrid concept and are marked as conventional vehicles with limited electrification of propulsion, typically in the range of 4 to 12 kW. The low level of electrification does not allow pure electric driving, but
8

idle-stop operation as well as limited energy recovery by means of regenerative braking becomes possible. During idle-stop operation, the combustion engine is shut down when it is not needed, for example at red traffic lights. The engine is immediately and silently restarted as soon as the driver releases the brake pedal. Furthermore, to support the combustion engine during acceleration, the electric machine can provide additional torque to the wheels (launch assistance or electric boost mode). In August 2001, Toyota was the first car manufacturer to present a commercially available mild hybrid vehicle, the Toyota Crown [3]. For city traffic, Toyota reports for this vehicle a 15 % increase in fuel economy compared to the corresponding conventional vehicle [4]. The Crown is powered by a three-liter combustion engine which is supported by a belt-driven 3 kW starter/alternator. A picture of the engine, together with the starter/alternator and the power electronics is depicted in figure 1.2.
InverterDC/DC converter
CombustionEngine (3 liter)
Starter /Alternator
S / AAC
DC
DCDC
Starter/Alternator
42 VLoads
36 VBattery
14 VLoads
12 VBattery
Figure 1.5 Cut model of combustion engine with belt-driven starter/alternator and the power electronics of the Toyota Crown (left side, [4]) and schematic of the corresponding dual-voltage power supply system (right side).
Depending on the degree of electrification, i.e. on the maximum output power of the electric motor, different battery voltages are employed in hybrid vehicles. In case of the Toyota Prius, for example, a nominal battery voltage of 288 V has been chosen to power the 30 kW electric drive train. In case of the Honda Insight, the 10 kW electric drive draws its power from a 144 V battery. The architecture of the electric power supply system of the Toyota Crown is depicted in the right hand in figure 1.2. The figure shows a dual-voltage power supply system with two different voltage levels. The low voltage level is the conventional power system with an operating voltage of 14 V and a nominal battery voltage of 12 V. The second level works on 42 V and 36 V, respectively. Both voltage levels are interconnected by a DC/DC converter. Power generation as well as high power loads, e.g. air conditioning or heating systems, is connected to the new 42 V level. In case of idle-stop driving, the recuperation energy as well as the energy for electric launch assistance is supplied to or from the 42 V power system. Due to the three times higher voltage, the current needed to transmit a certain electric power is reduced by the same factor. Assuming an identical wiring harness, the
9

resistive losses that grow in proportion to the square of the current are reduced to 1/9 of the corresponding losses of the low voltage system.
1.2 Energy Storage Systems for Automotive Applications Figure 1.3 presents a Ragone diagram where energy density is plotted versus power density. The data in the figure should only be regarded as typical values. Nevertheless, the basic performance differences of the available storage systems become visible. Starting with flooded lead-acid batteries, the following sections will characterize the most important battery technologies as well as supercapacitors.
0.1
1
10
100
100 1,000 10,000Specific Power [W/kg]
Electrolytic capacitors
Supercapacitors
Li-ion
NiMHLead-acid
Spec
ific
Ene
rgy
[Wh/
kg]
Figure 1.3 Ragone diagram for energy storage systems 1.2.1 Flooded lead-acid batteries Although all advanced battery technologies offer better performance data than flooded lead-acid batteries, these batteries are by far the cheapest energy storage system (40...50 $/kWh) [5]. Therefore, flooded lead-acid batteries are still used extensively in today's automotive applications. Optimized lead-acid batteries with liquid electrolyte are currently able to provide an energy density of 40 Wh/kg and a specific power in the range of 200 W/kg at -18°C [ 4]. Compared to valve-regulated lead-acid batteries, the flooded battery design shows advantages if high operation temperatures, i.e. 50...60°C or higher, are expected for relevant time periods. In this case, the large amount of liquid electrolyte prevents the risk of drying out. When overcharged, however, flooded lead-acid batteries produce oxygen and hydrogen. Therefore, these batteries cannot be integrated in the vehicle interior. Further disadvantages of flooded batteries are the poor cycle life and the limited charge acceptance, especially at low temperatures.
10

1.2.2 Valve-regulated lead-acid batteries If higher cranking power, better charge acceptance or increased cycling performance have to be provided, valve-regulated lead-acid (VRLA) batteries are more advantageous than flooded ones. In VRLA batteries, the sulfuric acid is either gelled or fixed in an absorbent glass mat (AGM). Since the AGM design enables a lower internal resistance, these batteries are usually employed for high-power vehicle applications. Due to the compressed glass mat, AGM batteries show improved robustness against vibrations as well as less shedding of active material which is the reason for their superior cycle-life [6]. AGM batteries allow a higher flexibility of battery shape and battery position in the vehicle. Battery placing in the vehicle interior is possible since no acid can be spilled. Furthermore, due to an internal oxygen cycle reaction, only little quantities of oxygen and hydrogen gas escape from the battery. However, the internal reduction of oxygen produces heat. AGM batteries therefore face a higher risk of thermal runaway and are more sensitive to high operating temperatures than batteries with liquid electrolyte [7]. A disadvantage of AGM batteries compared to flooded batteries is cost. A price of about 100...120 $/kWh for a 36V/25Ah battery which results in a battery price of 150...180 $ including peripherals such as a battery management system is expected [8]. But even if this is nearly twice the price of a flooded battery, it is at least three to five times less expensive than NiMH or Li-ion batteries. To further improve the power capability of AGM batteries, spiral-wound cell constructions have been introduced to the market, e.g. by Johnson Controls [9] or by Exide [10]. Spiral-wound lead-acid technologies are excellent in dealing with problems of plate compression and power density. However, power-optimized batteries provide a remarkably reduced energy density. Furthermore, in the case of ultra thin electrodes, so called thin metal film technology (TMF), manufacturing cost as well as calendar life are major issues. If battery applications are characterized by a demanding energy turnover, i.e. a large number of discharging and charging cycles at a partial state of charge, lead-acid batteries quickly reach their technological limits. Depending on the specific load profile, the lifetime of a VRLA battery in a mild hybrid vehicle using launch assistance and regenerative braking will probably reach only 1...2 years. In these cases, nickel/metal hydride batteries could be employed. 1.2.3 Nickel/metal hydride batteries Nickel/metal hydride batteries excel essentially by their increased energy throughput capability. At ΔSOC ≈ 5 %, up to 300,000 shallow cycles have been reported [5]. Furthermore, excellent charge acceptance as well as outstanding power densities in the range of 1000 W/kg can be achieved. However, power at low temperatures is a significant concern. Below -20°C, the power density curve of NiMH batteries drops
11

below that of lead-acid batteries. If power is further optimized, negative effects on the already high self-discharge rate (up to 1 % per day) as well as on the calendar life, which is supposed to be 7...10 years, have to be expected. One possible improvement of NiMH batteries is a bipolar cell design. For bipolar cells, energy and power density are higher since less passive materials are needed for the battery assembly. In addition, lifetime is supposed to increase. A first prototype battery (36V/7Ah) with bipolar cell design has been presented by Hoppecke [11]. For a 36V/25Ah NiMH battery, [8] expects cost in the range of 500...800 $ for the near future (1...2 years). The potential for cost reduction is quite low since expensive raw materials rather than manufacturing determine the purchase price. Furthermore, a thermal management system has to be employed, leading to greater weight, volume, and extra cost. The thermal management system is needed because heat is produced at the end of charging and discharging cycles. In addition, the charge efficiency of NiMH batteries decreases significantly above 50°C. 1.2.4 Lithium ion batteries Li-ion batteries offer an exceptionally high energy density, which ranks even for power-optimized Li-ion batteries distinctly above all other technologies. Due to cell voltages in the range of 3...4 V, only 12 Li-ion cells have to be connected in series to build a 42 V battery. At the aforementioned cell voltage level, aqueous electrolytes are not stable. Therefore, organic electrolytes have to be employed. This should in principle lead to an increased internal resistance. However, this low conductivity of the organic electrolytes is compensated by an extremely large electrode surface. Thus, power densities up to 1,500 W/kg are possible while still providing energy densities in the range of 80...100 Wh/kg for low discharge currents [5]. Furthermore, Li-ion batteries offer a high energy efficiency, very good charge acceptance and an outstanding cycle life. More than 400,000 shallow cycles at 5 % ΔSOC can be achieved at partial state of charge and room temperature [8]. Calendar life is claimed to achieve more than ten years. However, these values have not been proven yet. Therefore, Saft and some other battery manufactures are currently performing accelerated aging tests [12]. As for NiMH batteries, the performance of Li-ion batteries also decreases noticeably with decreasing temperature. At 0°C, power capability as well as charge acceptance are reduced by 70 %. At lower temperatures, the performance diminishes even further. At the other end of the safe operating range, there is an upper temperature limit of 40...50°C. Temperatures above this limit cause irreversible degradation or may even lead to a thermal runaway. Hence, Li-ion batteries need sophisticated battery monitoring and management systems that have to be combined with reliable safety features. These additional components increase system cost. For a 36V/25Ah battery, cost in the range of 700...1000 $ as well as additional 100...300 $ for mandatory peripherals are reported [8].
12

This means that in the short-term perspective, Li-ion batteries will be more expensive than NiMH batteries. On the long run, however, Li-ion costs are expected to drop below the cost of NiMH batteries as soon as less expensive raw materials can be employed. 1.2.5 Other batteries Apart from the storage systems described so far, some additional potential candidate battery technologies have to be mentioned. First, some information on Li-polymer and Li-metal batteries is provided. After this, nickel/cadmium (NiCd) and sodium/nickel chloride batteries (NaNiCl2) are briefly discussed. Li-polymer batteries have less safety problems than their Li-ion counterparts. In these batteries, the liquid electrolyte is either fixed in a matrix of polymer material or replaced by a solid-state polymer electrolyte. This design approach leads to a highly flexible battery shape. A drawback of Li-ion polymer batteries is the increasing resistance of the polymer electrolyte for decreasing temperatures. This leads to strongly reduced performance in cold environments. At present, e.g. Delphi and Gaia [13] are developing Li-ion polymer batteries for 42 V automotive systems. Li-metal batteries employ metallic lithium as negative electrode material instead of the carbon compound materials that are used for Li-ion batteries. The metallic lithium electrode allows very high energy densities. However, in the early years of Li batteries, due to dendrites formation upon recharge, metallic lithium caused safety hazards when it was used with liquid electrolytes. Thus, modern Li-metal batteries either employ gelled or polymer electrolytes [14]. Although this might help to overcome the safety problems, the resulting high internal resistance is an important obstacle for high power applications. Therefore, Li-metal battery manufacturers like the Canadian Avestor Corporation or the German Fortu-Batterien rather focus on the electric vehicle market than on 42 V applications [15]. In principle, NiCd batteries could offer similar technical features as NiMH batteries. However, due to environmental issues, the employment of NiCd for large scale automotive applications is being rejected. NaNiCl2 batteries also referred to as “Zebra batteries”, operate at temperatures in the range of 270...350°C [16]. For frequently driven electric vehicles, the required energy for battery heating is small compared to the entire energy flow. Due to their high energy density, Zebra batteries are hence interesting for this kind of application.
13

1.2.6 Supercapacitors Compared to batteries, supercapacitors offer a distinctly increased cycle life (> 500,000 cycles at ΔSOC = 100 %) and a nearly unlimited power capability. Supercapacitors can be charged and discharged with any current profile, and even short circuit current can be withstood. For a discharge efficiency of 50 %, i.e. matched power discharge, up to 6,600 W/kg can be drawn from a 2,600 F supercapacitor. For lower discharge currents, energy densities above 5.0 Wh/kg can be achieved [17]. Supercapacitors have a wide operating temperature range (-40°C...65°C), are 100% maintenance free and robust against mechanical stress or deep discharge. Furthermore, a lifetime above 10 years can be expected [18]. Most important drawbacks of supercapacitors are their limited energy density compared to batteries, their high self-discharge rate and high cost. Although the above quoted energy density is excellent for supercapacitors, advanced Li-ion batteries currently offer at least ten times higher energy density while offering good power capability at the same time. As far as cost is concerned, Montena expects a future selling price for their supercapacitors of 10 $/1,000F which corresponds approximately to 10,000 $/kWh [19]. At first glance, this seems very expensive. However, cost related to the stored energy should not be regarded exclusively for the comparison because supercapacitors are rather employed as power cache devices. If, on the other hand, cost per kW was compared exclusively, supercapacitors would outperform all competitors.
1.2.7 Fuel-cells In the future, fuel-cells could also be employed to supply vehicle electric systems. BMW has already built a 5 kW prototype fuel-cell stack for 42 V on-board power [20]. High-power key-off loads like electrical air conditioning systems could be powered by such a stack, which is expected not to be larger than today's lead-acid batteries.
Drawbacks of fuel-cells in this application are for example the present lack of operating experience as well as high cost, especially for the membranes and the catalysts. Furthermore, system reliability under automotive conditions has not been proven yet. Finally, a fuel cell generator will still require a power assist storage device for highly dynamic load changes.
Conclusions As a summary of the previous sections, table 1.1 presents a comparison of the most interesting energy storage systems. The upcoming storage requirements in new vehicles can be divided in several groups. If at first only some electrical ancillaries have to be powered and the classic SLI (starting, lighting, ignition) functions have to be provided, flooded lead-acid or VRLA batteries are the only economical contenders.
14

Parameter VRLA NiMH Li-Ion Supercapacitor
Cells 18 ≈30 ≈12 ≈18
Specific energy (Wh/kg) 30...40 50...60 80...100 5...6
Specific power (W/kg) 250...400 700...1,000 700...1,500 6,000...10,000
Cycle life (shallow cycles) ≈150,000 ≈300,000 >400,000 >500,000
Calendar life (years) 3...4 7...10 >10 >10
Usable SOC range (%) 30...70 20...80 10...90 50...100
Operating temperature (°C) -40...+50 -20...+50 0...+40 -40...+65
Biggest problem areas weight, cycle life, charge acceptance
cost, performance at extreme temperatures
cost, safety cost, energy density, voltage stability
Table 1.1: Comparison of energy storage technologies (battery and supercapacitors) If in addition idle-stop and launch assist operation is introduced, VRLA batteries can still be employed. However, depending on the load profile, only 1...2 years lifetime can be expected. To push the limits of VRLA batteries, combinations with more advanced power sources, e.g. supercapacitors, are possible. Such combinations represent a compromise on cost and weight as well as power capability and cycle-life. If more demanding mild-hybrid applications with longer power assist periods and regenerative braking shall be realized, NiMH batteries become a more interesting perspective. Since NiMH offers appropriate functionality and reasonable lifetime, the french car manufacturer PSA is going to build their first mild-hybrid vehicle with NiMH batteries [5]. Li-ion batteries outperform all other battery technologies. However, some technical issues still have to be addressed. Furthermore, production cost has to be strongly reduced. Nevertheless, Li-ion batteries are probably the most interesting long-term alternative.
15

Chapter 2 Battery Technology 2.1 Basic Concepts and Components A battery is a device that converts the chemical energy contained in its active materials directly into electric energy by means of an electrochemical oxidation-reduction (redox) reaction. In the case of a rechargeable system, the battery is recharged by a reversal of the process. This type of reaction involves the transfer of electrons from one material to another through an electric circuit. In a non-electrochemical redox reaction, such as rusting or burning, the transfer of electrons occurs directly and only heat is involved. As the battery electrochemically converts chemical energy into electric energy, it is not subject, as are combustion or heat engines, to the limitations of the Carnot cycle dictated by the second law of thermodynamics. Batteries, therefore, are capable of having higher energy conversion efficiencies. While the term “battery” is often used, the basic electrochemical unit being referred to is the “cell.” A battery consists of one or more of these cells, connected in series or parallel, or both, depending on the desired output voltage and capacity. 1. The anode or negative electrode - which gives up electrons to the external circuit and is oxidized during the electrochemical reaction. 2. The cathode or positive electrode - which accepts electrons from the external circuit and is reduced during the electrochemical reaction. 3. The electrolyte - which provides the medium for transfer of charge as ions, inside the cells between the anode and cathode. The electrolyte is typically a liquid, such as water or other solvents, with dissolved salts, acids, or alkalis to impart ionic conductivity. Some batteries use solid electrolytes, which are ionic conductors at the operating temperature of the cell. The must advantageous combinations of anode and cathode materials are those that will be lightest and give a high cell voltage and capacity. Such combinations may not always be practical, however, due to reactivity with other cell components, polarization, handling difficulties, high cost and other deficiencies. In a practical system, the anode is selected with the following properties;
• efficiency as a reducing agent, • high columbic output ((Ah/g), • good conductivity, • stability, • ease of fabrication, and • low cost
16

Hydrogen is attractive as an anode material, but obviously, must be contained by some means, which effectively reduces its electrochemical equivalence. Practically, metals are mainly used as the anode material. Zinc has been a predominant anode because it has these favorable prosperities. Lithium, the lightest metal, with a high value of electrolytes and cell designs has been developed to control its activity. The cathode must be;
• an efficient oxidizing agent • be stable when in contact with the electrolyte, and • have a useful working voltage
Oxygen can be used directly from ambient air being drawn into the cell, as in the zinc/air battery. However, most of the common materials are metallic oxides. The electrolyte must have;
• good ionic conductivity but not be electronically conductive, as this would cause internal short-circuiting
• non reactivity with electrode materials, • little change in properties with change in temperature, • safety in handling, and • low cost
Most electrolytes are aqueous solution, but there are important exceptions as, for example, in thermal and lithium anode batteries, where molten salt and other non aqueous electrolytes are used to avoid the reaction of the anode with the electrolyte. Physically the anode and cathode electrodes are electronically isolated in the cell to prevent internal short-circuiting, but are surrounded by the electrolyte. In practical cell designs a separator material is used to separate the anode and cathode electrodes mechanically. The separator, however, is permeable to the electrolyte in order to maintain the desired ionic conductivity. In some cases the electrolyte is immobilized for a non spill design. Electrically conducting grid structures or materials may also be added to the electrodes to reduce internal resistance. The cell itself can be built in many shapes and configurations;
• cylindrical • button, • flat, and • prismatic
The cell components are designed to accommodate the particular cell shape. The cells are sealed in a variety of ways to prevent leakage and dry-out. Some cells are provided with venting devices or other means to allow accumulated gases to escape. Suitable cases or
17
containers, means for terminal connection and labeling are added to complete the fabrication of the cell and battery. 2.2 Classification of Cells or Batteries Electrochemical cells and batteries are identified as primary (non rechargeable) or secondary (rechargeable), depending on their capability of being electrically recharged. Within this classification, other classifications are used to identify particular structures or designs. 2.2.1 Primary cells or batteries These batteries are not capable of being easily or effectively recharged electrically and, hence, are discharged once and discarded. Many primary cells in which the electrolyte is contained by an absorbent or separator material (there is no free or liquid electrolyte) are termed “dry cells.” The primary battery is a convenient, usually inexpensive, lightweight source of packaged power for portable electronic and electric devices, lighting, photographic equipment, toys, memory backup, and a host of other applications, giving freedom from utility power. The general advantages of primary batteries are good shelf life, high energy density at low to moderate discharge rates, little, if any, maintenance, and ease of use. Although large high-capacity primary batteries are used in military applications, signaling, standby power, and so on, the vast majority or primary batteries are the familiar single cell cylindrical and flat button batteries. 2.2.2 Secondary or rechargeable cells or batteries These batteries can be recharged electrically, after discharge, to their original condition by passing current through them in the opposite direction to that of the discharge current. They are storage devices for electric energy and are known also as “storage batteries” or “accumulators.” The applications of secondary batteries fall into two main categories 1. Those applications in which the secondary battery is used as an energy-storage device, generally being electrically connected to and charged by a prime energy source and delivering its energy to the load on demand. Examples are automotive and aircraft systems, emergency no-fail and standby (UPS) power sources, hybrid and pure electric vehicles and stationary energy storage (SES) systems for electric utility load leveling.
2. Those applications in which the secondary battery is used or discharged essentially as a primary battery, but recharged after use rather than being discarded. Secondary batteries are used in this manner as, for example, in portable consumer electronics, power tools,
18

electric vehicles, etc., for cost savings (as they can be recharged rather than replaced), and in applications requiring power beyond the capability of primary batteries.
Secondary batteries are characterized by high power density, high discharge rate, flat discharge curves, and good low-temperature performance. Their energy densities are generally lower than those of primary batteries.
Some batteries, known as “mechanically rechargeable types,” are “recharged” by replacement of the discharged or depleted electrode usually the metal anode, with a fresh one. Some of the metal/air batteries are representative of this type of battery. 2.2.3 Reserve batteries In these primary types, a key component is separated from the rest of the battery prior to activation. In this condition, chemical deterioration or self-discharge is essentially eliminated, and the battery is capable of long-term storage. Usually the electrolyte is the component that is isolated. In other systems, such as the thermal battery, the battery is inactive until it is heated, melting a solid electrolyte, which then becomes conductive. The reserve battery design is used to meet extremely long or environmentally severe storage requirements that cannot be met with an “active” battery designed for the same performance characteristics. These batteries are used, for example, to deliver high power for relatively short periods of time like in missiles and other weapon systems. 2.2.4 Fuel cells Fuel cells, like batteries, are electrochemical galvanic cells that convert chemical energy directly into electrical energy and are not subject to the Carnot cycle limitations of heat engines. Fuel cells are similar to batteries except that active materials are not an integral part of the device (as in a battery), but are fed into the fuel cell from an integral source when power is desired. The fuel cells differ from a battery due to its capability of producing electrical energy as long as the active materials are fed to the electrodes (assuming the electrodes do not fail). The battery will cease to produce electrical energy when the limiting reactant stored within the battery is consumed. The electrode material of the fuel cell are inert in that they are not consumed during the cell reaction, but have catalytic properties which enhance the electro reduction or electro-oxidation of the reactants (the active materials). The anode active materials used in fuel cells are generally gaseous or liquid (compared with the metal anodes generally used in most batteries) and are fed into the anode side of the fuel cell. As these materials are more like the conventional fuels used in heat engines, the term “fuel cell” has become popular to describe these devices. Oxygen or air is the predominant oxidant and is fed into the cathode side of the fuel cell.
19

Fuel cells have been of interest for over 150 years as a potentially more efficient and less polluting means for converting hydrogen and carbonaceous or fossil fuel to electricity compared to conventional engines. A well known application of the fuel cell has been the use of hydrogen/oxygen fuel cell is in space vehicles for over 40 years. Use of the fuel cell in terrestrial applications has been developing slowly, but recent advances has revitalized interest in air-breathing systems for variety of applications, including utility power, load leveling, dispersed or on-site electric generators and electric vehicles. Fuel cell technology can be classified into two categories [21] 1. Direct systems where fuels, such as hydrogen, methanol and hydrazine, can react directly in the fuel cell. 2. Indirect systems in which fuel, such as natural gas or other fossil fuel, is first converted by reforming to a hydrogen-rich gas which is then fed into the fuel cell
Fuel cell systems can take a number of configurations depending on the combinations of fuel and oxidant, the type of electrolyte, the temperature of operation, and the application etc. More recently, fuel cell technology has moved towards portable applications, historically the domain of batteries, with power levels from less than 1 to about 100 watts, blurring the distinction between batteries and fuel cells. Metal/air batteries particularly those in which the metal is periodically replaced, can be considered a “fuel cell” with the metal being the fuel. 2.3 Operation of a Cell 2.3.1 Discharging The operation of a cell during discharge is also shown schematically in figure 2.1. When the cell is connected to an external load, electrons flow from the anode, which is oxidized, through the external load to the cathode, where the electrons are accepted and the cathode material is reduced. The electric circuit is completed in the electrolyte by flow of anions (negative ions) and cations (positive ions) to the anode and cathode, respectively.
20

Flow of cations
Flow of anions
Electrolyte
Cat
hode
Ano
de
Electron flow
Load +
Figure 2.1 Electrochemical operation of a cell (discharge)
The discharge reaction can be written, assuming a metal as the anode material and a cathode material such as chlorine (Cl2), as follows: Negative electrode: anodic reaction (oxidation, loss of electrons) Zn → Zn2+ + 2e Positive electrode: cathodic reaction (reduction, gain of electrons) Cl2 + 2e → 2Cl- Overall reaction (discharge): Zn + Cl2 → Zn2+ + 2Cl- (ZnCL2) 2.3.2 Charging During the recharge of a rechargeable or storage cell, the current flow is reversed and oxidation takes place at the positive electrode and reduction at the negative electrode, as show in figure 2.2. As the anode is, by definition, the electrode at which oxidation occurs and the cathode the one where reduction takes place, the positive electrode is now the anode and the negative the cathode. In the example of the Zn/Cl2 cell, the reaction on charge can be written as follows: Negative electrode: cathodic reaction (reduction, gain of electrons)
21

Zn2+ + 2e → Zn Positive electrode: anodic reaction (oxidation, loss of electrons) 2Cl - → Cl2 + 2e Overall reaction (charge): Zn2+ + 2Cl- → Zn + Cl2
cations
anions
Electrolyte
Cat
hode
Ano
de
electron
+
DC Power Supply
Figure 2.2 Electrochemical operation of a cell (charge)
22
Chapter 3 Factors Affecting the Battery Performance 3.1 General Characteristics Optimal designs and discharge conditions of the battery systems determines the specific energy of the battery. While these values can be helpful to characterize the energy output of each battery system, the performance of the battery may be significantly different under actual conditions of use, particularly if the battery is discharged under more stringent conditions than those under which it was characterized. The performance of the battery under the specific conditions of use should be obtained before any final comparisons or judgments are made.
3.2 Factors Affecting the Battery Performance
There are many factors influence the operational characteristics, capacity, energy output and performance of a battery. The effect of these factors on battery performance is discussed in this section. It should be noted that because of the many possible interactions, these effects can be presented only as generalizations and that the influence of each factor is usually greater under the more stringent operating conditions. For example, the effect of storage is more pronounced not only with high storage temperatures and long storage periods, but also under more severe conditions of discharge following the storage. After a given storage period, the observed loss of capacity (compared with a fresh battery) will usually be greater under heavy discharge loads than under light discharge loads. Similarly, the observed loss of capacity at low temperatures (compared with normal temperatures discharges) will be greater at heavy than at light or moderate discharge loads. Specifications and standards for batteries usually list the specific test or operational conditions on which the standards are based because of the influence of these conditions on battery performance. It is also known that even within a given cell or battery design, there will be performance differences from manufacturer to manufacturer and between different versions of the same battery (such as standard, heavy-duty, or premium). There are also performance variables within a production lot, and from production lot to production lot, which are inherent in any manufacturing process. The extent of the variability depends on the process controls as well as on the application and use of the battery. Manufactures’ data should be consulted to obtain specific performance characteristics.
23

3.2.1 Voltage level There are different references made to the voltage of a cell or battery:
1. The theoretical voltage is a function of the anode and cathode materials, the composition of the electrolyte and the temperature (usually stated at 250 C).
2. The open-circuit voltage is the voltage under a no-load condition and is usually a close approximation of the theoretical voltage.
3. The closed-circuit voltage is the voltage under a load condition. 4. The nominal voltage is one that is generally accepted as typical of the operating
voltage of the battery. 5. The working voltage is more representative of the actual operating voltage of the
battery under load and will be lower than the open-circuit voltage. 6. The average voltage is the central voltage during the discharge of the cell or
battery. 7. The midpoint voltage is the central voltage during the discharge of the cell or
battery. 8. The end or cut-off voltage is designated as the end of the discharge. Usually it is
the voltage above which most of the capacity of the cell or battery has been delivered. The end voltage may also be dependent on the application requirements.
Using the lead-acid battery as an example, the theoretical and open-circuit voltages are 2.1 V, the nominal voltage is 2.0 V, the working voltage is between 1.8 and 2.0 V, and the voltage is typically 1.75 on moderate and low-drain discharges and 1.5 V for engine-cranking loads. On charge, the voltage may range from 2.3 to 2.8 V.
Figure 3.1 Characteristic discharge curves [21 ]
24
When a cell or battery is discharged its voltage is lower than the theoretical voltage. The difference is caused by IR losses due to cell (and battery) resistance and polarization of the active materials during discharge. This is illustrated in Figure 3.1. In the idealized case, the discharge of the battery proceeds at the theoretical voltage until the active materials are consumed and the capacity is fully utilized. The voltage then drops to zero. Under actual conditions, the discharge curve is similar to the other curves in Figure 3.1. The initial voltage of the cell under a discharge load is lower than theoretical value due to the internal cell resistance and the resultant IR drop as well polarization effects at both electrodes. The voltage also drops during discharge as the cell resistance increases due to the accumulation of discharge products, activation and concentration, polarization, and related factors. Curve 2 is similar to curve 1, but represents a cell with a higher internal resistance or a higher discharge rate, or both, compared to the cell represented by curve 1. As the cell resistance or the discharge current is increased, the discharge voltage decreases and the discharge shows a more sloping profile. The specific energy that is delivered by a battery in practice is, therefore, lower than the theoretical specific energy of its active materials, due to: 1. The average voltage during the discharge is lower than the theoretical voltage. 2. The battery is not discharged to zero volts and all of the available ampere-hour
capacity is not utilized.
As specific energy equals Watt-hours /gram = Voltage *Ampere hours/gram
The delivered specific energy is lower than the theoretical energy as both of the components of the equation are lower: The shape of the discharge curve can very depending on the electrochemical system, constructional features, and other discharge conditions. Typical discharge curves are shown in Figure 3.2.
• The flat discharge (curve 1) is representative of a discharge where the effect of change in reaction and reaction products is minimal until the active materials are nearly exhausted.
• The plateau profile (curve 2) is representative of two-step discharge indicating a change in the reaction mechanism and potential of the active materials(s).
• The sloping discharge (curve 3) is typical when the composition of the active materials, reactants, internal resistance and so on, changes during the discharge, affecting the shape of the discharge curve similarly.
Specific examples of these curves and many other are presented in the individual chapters covering each battery system.
25

Figure 3.2 Battery discharge characteristics – voltage profiles [21]
3.2.2 Current drain of discharge As the current drain of the battery is increased, the IR losses and polarization effects increase, the discharge is at a lower voltage, and the service life of the battery is reduced.
Figure 3.3 Battery discharge characteristics – voltage level [21 ]
Figure 3.3 shows typical discharge curves as the current drain is changed. At extremely low current drain (curve 2) the discharge can approach the theoretical voltage and theoretical capacity. With increasing current drain (curve 3-5) the discharge voltage
26
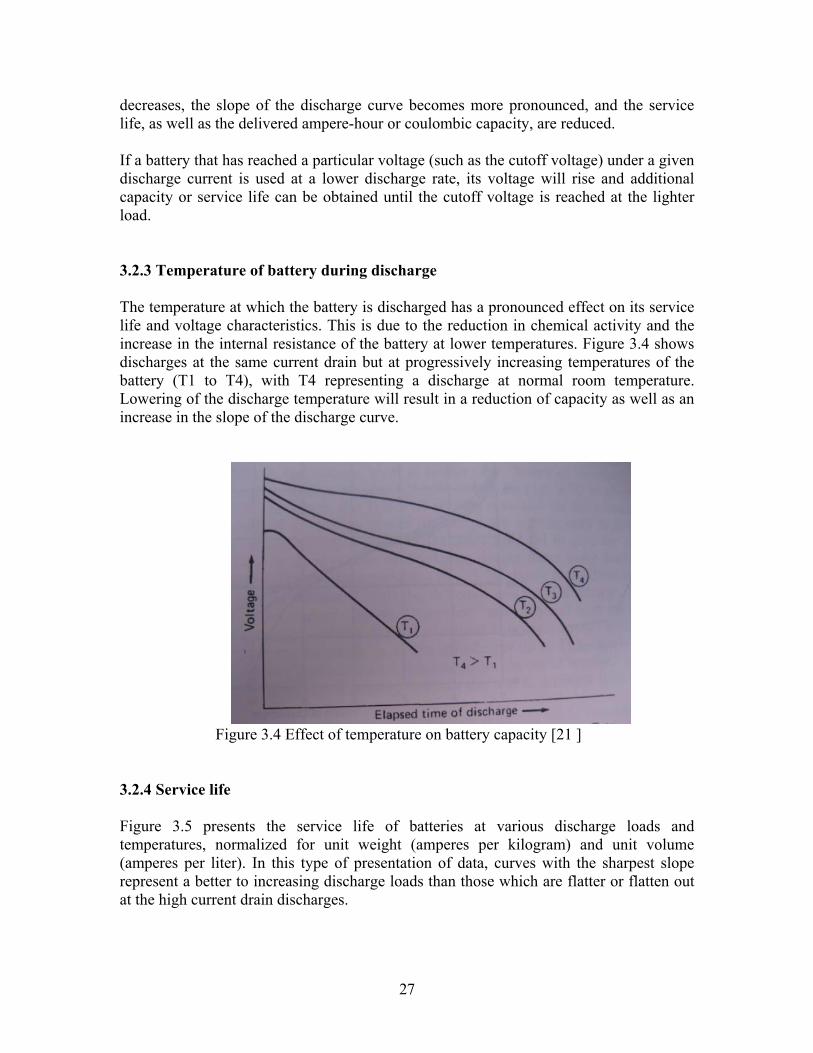
decreases, the slope of the discharge curve becomes more pronounced, and the service life, as well as the delivered ampere-hour or coulombic capacity, are reduced. If a battery that has reached a particular voltage (such as the cutoff voltage) under a given discharge current is used at a lower discharge rate, its voltage will rise and additional capacity or service life can be obtained until the cutoff voltage is reached at the lighter load. 3.2.3 Temperature of battery during discharge The temperature at which the battery is discharged has a pronounced effect on its service life and voltage characteristics. This is due to the reduction in chemical activity and the increase in the internal resistance of the battery at lower temperatures. Figure 3.4 shows discharges at the same current drain but at progressively increasing temperatures of the battery (T1 to T4), with T4 representing a discharge at normal room temperature. Lowering of the discharge temperature will result in a reduction of capacity as well as an increase in the slope of the discharge curve.
Figure 3.4 Effect of temperature on battery capacity [21 ] 3.2.4 Service life
Figure 3.5 presents the service life of batteries at various discharge loads and temperatures, normalized for unit weight (amperes per kilogram) and unit volume (amperes per liter). In this type of presentation of data, curves with the sharpest slope represent a better to increasing discharge loads than those which are flatter or flatten out at the high current drain discharges.
27

Figure 3.5 Battery service life at various discharge loads and temperature [21]
This type of data can be used to approximate the service life of a given cell or battery under a particular discharge condition or to estimate the weight or size of a battery required to meet a given service requirement. In view of the linearity of these curves on a log-log plot, mathematical relationships have been developed to estimate the performance of batteries under conditions that are not specifically stated. Peukert’s equation,
I”t = C n log I + log t = log C
where, I is the discharge rate and t the corresponding discharge time, has been used in this manner to describe the performance of a battery. The value n is the slope of the straight line. The curves are linear on a log-log plot of discharge load versus discharge time but taper off at both ends because of the battery’s inability to handle very high rates and the effect of self-discharge at the lower discharge rates. 3.2.5 Duty cycles One important consideration is the response of the battery voltage, when the discharge current is changed during the discharge, such as changing loads from receives to transmit in the operation of radio transceiver. The service life of the battery is determined when the cut-off or end voltage is reached under the higher discharge load. The average current cannot be used to determine the service life. Operating at two or more discharge loads is typical of most electronic equipment because of the different functions they must perform during use.
28

3.2.6 Voltage regulation The voltage regulation required by the equipment is most important in influencing the capacity or service life obtainable from a battery. As is apparent from the various discharge curves, design of the equipment to operate to the lowest possible end voltage and widest voltage range result in the highest capacity and longest service life. Similarly, the upper voltage limit of the equipment should be established to take full advantage of the battery characteristics. In applications where the equipment cannot tolerate the wide voltage spread and is restricted, for example, to the – 15% level, the battery with the flat discharge profile gives the longer service. On the other hand, if the batteries can be discharge, to lower cutoff voltages, the service life of the battery with the sloping discharge is extended and could exceed that of the battery with the flat discharge profile. 3.2.7 Charging voltage
If a rechargeable battery is used in conjunction with another energy source which is permanently connected in the operating circuit, allowance must be made for the battery and equipment to tolerate the voltage of the battery on charge. Figure 3.6 shows the charge and discharge characteristics of such a battery. The specific voltage profile on charge depends on such factors such as the battery system, charge rate, temperature, and so on.
Figure 3.6 Typical voltage profile on charge and discharge [21 ]
The charging source must also be designed so that its output current is regulated during the charge to provide the needed charge control for the battery.
29

3.2.8 Battery age and storage condition
Batteries are a perishable product and deteriorate as a result of the chemical action that proceeds during storage. The design, electrochemical system, temperature, and length of storage period are factors which affect the shelf life or charge retention of the battery. The type of discharge following the storage period will also influence the shelf life of the battery. Usually the percentage charge retention following storage (comparing performance after and before storage) will be lower the more stringent the discharge condition. The self-discharge characteristics of several battery systems at various temperatures are shown in figure 3.7. As self-discharge proceeds at a lower rate at reduced temperatures, refrigerated or low-temperature storage extends the shelf life and is recommended for some battery systems. Refrigerated batteries should be warmed before discharge to obtain maximum capacity.
Figure 3.7 Effect of self discharge on battery capacity [21 ]
3.2.9 Effect of Battery Design
The performance of the cells in a multi cell battery will usually be different than the performance of the individual cells. The cells cannot be manufactured identically and, although cells are selected to be “balanced,” they each encounter a somewhat different environment in the battery pack. The specific design of the multicell battery and the hardware that is used (such as packaging techniques, spacing between the cells, container material, insulation, potting compound, fuses and other electronic controls, etc. will influence the performance as they effect the environment and temperature of the individual cells. Obviously, the battery materials add to its size and weight and the specific energy or energy density if the battery will lower than that of the component cells. Accordingly, when comparing values such specific energy, in addition to being aware of the conditions (discharge rate, temperature, etc.) under which these values were determined.
30

Chapter 4 Advanced Battery Test 4.1 General Battery Test Plan Based on USABC and FreedomCAR battery test procedures [ 22, 23], most of the research institutes and automotive industries who have been working in batteries are following the similar test flow diagram as given below.
Figure 4.1 USABC Battery test flow diagram [22] In first level, the core performance of every kind of batteries is tested. If everything is found satisfactory, the test procedures proceed for cycle life test and other special performance test. The purpose and procedures of each test is discussed in this chapter below.
31

4.2 Battery Pre -Test Preparation The purpose of pre-test preparation is to assure that information required for testing a new battery is available and that tasks to be accomplished prior to actual start of testing. This test will include at least the following jobs;
1. Specific types and number of tests required 2. Battery ratings, measurements and test termination limits, provided by the
manufacturer 3. Charge procedure recommended by the manufacturer 4. Peak discharge power to be applied for DST or FUDS testing 5. Peak current or power values or other special conditions to be used during
Life cycle and Reference performance tests 6. Changes to standard test procedures (if any) to be required due to
developmental battery limitations 7. Thermal enclosure or other battery management system handling instructions
(if applicable) 8. Test laboratory Readiness Review requirement 9. Commissioning instructions and operating manual/instructions
4.3 Constant Current Discharge Test The purpose of constant-current testing is to determine the effective capacity of a test unit using very repeatable, standardized conditions. A series of current levels can be applied to simply characterize the effect of discharge rate on capacity. The battery will be charged in accordance with the method specified in the Test Plan. The battery will be put on open circuit for a period specified in the test plan to allow the battery to reach the specified starting test temperature. The preferred test sequence consists performing groups of three constant current discharge cycles (with recharge as soon as practical after discharge) at each of C3/3 amperes, C2/2 amperes, C1/1 amperes, and C3/3 amperes with the battery at 23o+-2oC at the start of discharge. For subsequent testing, the battery capacity is considered stable when three successive C3/3 discharges agree within 2 %. Each discharge will terminate when either the rated capacity or the minimum discharge voltage (or other termination condition) specified by the manufacture, whichever occurs first, is related. 4.4 Peak Power Test The purpose of this test is to determine the discharge power capability of a battery at 2/3 of its OCV at each of various depth of discharge (DOD). This procedure does not measure the actual peak power of the battery. .
32

The peak power test is to be performed at 10 depths-of discharge, from 0% DOD in 10% intervals, during a single discharge. These DOD values are achieved by successively discharging the battery from a fully charged state to each % DOD at the Base Discharge Rate. After the 90% DOD step sequence is performed, the battery is to be discharged at the Base Discharge Rate is 100% of its rated capacity (assuming this can be done without exceeding other discharge limits) [22]. This test is performed with no regenerative energy applied to the battery. At each specified DOD, discharge the battery for 30 seconds at High Test Current. The same current values are used at all 10 DOD levels. However, the battery must remain above the Discharge Voltage Limit during each step, even if the step current has to be reduced. The peak power capability (at given DOD) can be calculated by deriving the battery and equivalent IR-free voltage from measured changes in battery voltage and current at that DOD. Voltage and current for these calculations are measured just prior to and then near the end of each high test current step to obtain the V and I values for DOD. Battery resistance and IR-free voltage are computed as follows: Battery resistance: R = ∆V ٪ ∆I Battery IR-free Voltage: V IR Free = V – IR Peak Power Capability is then the minimum negative value calculated from any of the following four equations: Peak Power Capability = (-2/9), (V IR Free 2) / R or Peak Power Capability = - Discharge Voltage Limit.(V IR Free – Discharge Volt. Limit) / R or Peak Power Capability = I MAX . (V IR Free + R . I MAX) or Peak Power Capability = Actual \Power at end of step (only if voltage or current limiting occurs) 4.5 Constant Power Discharge Test The purpose of this testing is to perform a sequence of constant power discharge/charge cycles that define the voltage versus power behavior of a battery as a function of depth of discharge. This testing characterized the ability of battery to provide a sustained discharge over a range of power levels representative of electric vehicle applications. Constant power discharges are similar to constant speed vehicle operation in their effect on a battery.
33

Prior to performing this test procedure, the constant-current portion of core performance testing should be completed to verify stable capacity. The battery must be completely charged prior to each discharge, and the battery temperature at start of discharge must be at 230C+- 20 C (or the operating temperature specified by the test plan.). For a full constant-power set, the battery will be discharged at minimum of 3 power levels. The maximum power level is normally that required to remove 75% of the rated energy from the battery in hour. The reduced power levels are 2/3 and 1/3 of this maximum power level, respectively (50% and 25% of rated energy). At each power level, discharge the battery to rated capacity or the specified termination point, whichever comes first, a minimum of 2 times (i.e. 6 more discharge/charge cycles total). If the test plans so specifies, it is permissible to terminate the highest power test after 1 hour, however, this test is normally done to the rated capacity. If one of the rates of discharge results in overheating or any other condition outside the battery operating limits, do not complete the discharge at that rate. 4.6 Variable Power Discharge Test Variable power discharge testing is used to produce the effects of electric vehicle driving behavior (including regenerative braking) on the performance and life of a battery. The following two variable power discharge regimes have been testing: 4.6.1 FUDS regime This variable power discharge regime represents the best simulation available of actual power requirements from an electric vehicle. It is demanding profile with respect to the frequency of occurrence of high power peaks and ratio of maximum regenerative charging to discharge power. The battery will be charged and temperature stabilized in accordance with the manufacturer’s recommended procedure or as otherwise specified in the test plan. Commencing from full charge, the battery will be discharged by applying the FUDS power profile, scaled to a maximum test power as specified in the test plan (normally 120 W/kg for midterm batteries) [23]. This normally will be the rated capacity (in Ah) or a battery limit, such as the Discharge Voltage Limit, whichever occurs first. If the power required for any step of the profile cannot be attained, the discharge is to be terminated. No reduced power criteria exist for this test. The end-of-discharge point is based on net capacity removed (total Ah minus regeneration Ah.). The battery will be fully recharged as soon as practical in accordance with established charging procedures and temperature constraints in preparation for continuing testing.
34
4.6.2 DST regime This variable power discharge regime is simplified version of the FUDS-based power-time demand. This specific regime can effectively simulate dynamic discharging and can be implemented with equipment at most test laboratories and developers. The battery will be charged and temperature stabilized in accordance with the manufacture’s recommended procedure or as otherwise specified in the test plan. Commencing from full charge, the battery will be discharged by applying the scaled DST power profile. The 360 second DST test profiles are repeated end-to-end with no time delay (rest period) between them. The maximum permissible transition time between power steps is 1 second, and these transition times are included in the overall profile length (i.e., a DST test profile is always 360 seconds long). This discharge regime is continued until either the end-of-discharge point specified in the test plan or inability to follow the test profile within a battery limit, whichever occurs first, has been reached. End-of-discharge is normally specified as: (a) the rated capacity in Ah, for performance or Reference Performance Tests; of (b) 80% of the rated capacity in Ah, for baseline life cycle testes. The end-of-discharge point is based on net capacity removed (total Ah – regeneration Ah) [23]. 4.7 Special Performance Tests These tests are defined for certain environments and / or conditions that are either; (a) likely to be infrequently encountered or (b) only relevant to specific battery technologies. The special tests that have been defined to date are listed below.
1. Partial discharge 2. Stand (self discharge) 3. Sustained hill climb 4. Thermal performance 5. Fast charge
Partial discharge test: This test is carried out to measure the response of the battery to a series of partial discharges identify any resulting capacity loss, and verify proper charging with partial depth-of-discharge (DOD) operation. Stand test: The purpose of stand test is to measure battery capacity loss when the battery is not used for an extended period of time, analogous to the situation that occurs when a vehicle is not driven for such a period and the battery is not placed on charge. This loss, if it occurs, may be due to self-discharge, which is normally temporary, or to other mechanisms that could produce permanent or semi-permanent loss of capacity. If significant stand loss is measured, additional testing may be required to determine the cause of this behavior.
35

Sustained hill climb test: This is done to determine the maximum depth of discharge at which a battery will support a six-minute discharge at about 45 W/kg before it is completely discharged. These measurements are accomplished through a series of specially defined constant power discharge tests. Thermal performance test: The purpose of this test sequence is to characterize the effects of ambient temperature variation on battery performance. The characteristics of the battery that are affected are likely to be technology specific. Consequently, the number and types of discharge/charge cycles to be performed cannot be generalized. This procedure is generally applicable to ambient temperature battery; it may not be applicable to battery system incorporating thermal management, unless it is desired to measure the effectiveness or energy use of the thermal management system itself. The procedure can also produce results that can be used to determine the need for thermal management or the allowable operating temperature range for a battery that may later incorporate thermal management. Fast charge test: This test is one of the main characteristic that the most electric vehicle clients are interested to see to determine the fast charging capability of a battery. Normally it is done by subjecting high charging rates and determining the efficiency and other effects of such accelerated charging. The USABC goal for fast charging is to return 40% of the state of charge of the battery, starting from approximately 60% DOD, in 15 minutes. This test will normally be conducted as a series of cycles at a progression of fast charge rates beginning at approximately twice the normal (overnight) rate. For each charge rate, the following sequence of steps is performed:
1. After fully recharging the battery, discharge it to 60% DOD 2. Immediately recharge the battery at the selected charge rate until 40% of the rated
capacity (in Ah) has been returned. 3. Immediately fully discharge the battery to determine the amount of the recharge
available for use. The test series terminates when the 40% capacity in 15 minute charge rate is achieved.
4.8 Safety and Abuse Test This set of tests is performed to characterize the response of integrated battery systems to expected and worst-case accident and abuse situations. The information gained from this testing will be used to qualify their safe operation and to identify design deficiencies. Tests that address conditions associated with government regulations or expected accident-related exposures are included in the “safety” category. “Abuse” testing involves the characterization of the battery response to “worse-case” accident and unintentional abuse conditions and is ultimately performed to provide public confidence that these systems are indeed safe. Conditions to be investigated include those associated
36

with possible vehicle crashes, exposure to external environments, and electrical charger malfunction. Certainly some overlap will exist between tests appropriate for the safety and the abuse categories.
The general types of test procedures listed below are to be performed on full-size batteries or representative modules with all ancillary components that are integral to the battery pack installed. Each battery is to be fully charged and placed in a support frame that is consistent with using that battery in a generic electric vehicle. At least one fully functional battery pack is subjected to each of the selected procedures. For selected abuse testing only, any internal electrical safety devices can be bypassed. 4.9 Life Cycle Test Life cycle test defines a set of standardized procedures to determine if the expected service life (calendar and cycle) of electric vehicle batteries will satisfy the standard requirements. Both accelerated aging and normal-use conditions are employed to efficiently characterize degradation in electrical performance as a function of life and to identify relevant failure mechanisms. Because the intent is to use standard testing conditions whenever possible, results from the evaluation of different technologies should be comparable. These procedures may need to be repeated as design or material changes occur during the development process. Test units may be cells, modules, or complete battery packs. Failure statistics are desired at the lowest possible level, such that confidence in the statistical life parameters is maximized. For most technologies, it is possible to project battery life from cell or module data, particularly when these data have been obtained from pack testing using realistic battery controls. Analysis to estimate battery life from test data must be tailored to specific technologies and pack designs.
37

Chapter 5 Electric Vehicle and Battery Test Competencies at RWTH RWTH Aachen University, Germany was visited in connection to this project work to learn about test benches mainly for batteries and participate on on-going battery testing at the university laboratory. Professors, research associates, laboratory engineers and PhD students were the contact persons at institute of power electronics and electrical drives (ISEA). The institute has four research groups at ISEA which are as follows [28];
1. Power electronics 2. Electrical drives 3. Electrochemical energy storage systems 4. Electronic devices
Out of many research focus and projects under above mentioned groups, electrical drives and electrochemical energy systems are relevant to this project and briefly discussed here below. 5.1 Electrical Drives The drives group has significant experience in the field of electrical drives and system integration. For industrial companies, this knowledge is often useful in order to choose the right drive concept for their products or to assess problems with electrical drives. This group has also identified and optimized drive solutions for the many projects.
Figure 5.1.: 120 kW drive test bench Figure 5.2: Complete drive test stand for vehicle
38

120 kW drive test bench 15 kW drive test bench
• Benchmarking of machines and drives with a power up to 120 kW
• Maximum machine speed 15.000 rpm
• Maximum torque at low speed 700 Nm
• Efficiency measurements / continuous power rating
• Temperature measurements with up to 24 temperature sensors
• Graphical representation of results
• Use Induction machine
• High dynamic load control
• Nominal speed 3.600 rpm
• Maximum machine speed 12.000
• Braking energy on generator mode
Table 5.1: Test bench features at ISEA [28]
A 75 kW traction drive based on a switched reluctance machine was developed in ISEA. The transaxial design of the machine allows a very compact integration of machine, gear and differential. To integrate the drive into a vehicle, a compact water cooled power converter was designed and builds at ISEA. The control structure is based on direct average torque control (DATC) and the vehicle communication is implemented via CAN. Both efficiency and power limits of the drive system were determined on ISEA teststands [9]. The machine has maximum efficiency of 94% and in the nominal operating point system efficiency of 85%. The figure 5.1 shows the drive unit mounted on the test stands.
25 kW drive system 75 kW drive system
• Nominal speed: 517 rpm
• Nominal torque: 435 Nm
• Nominal power: 25 kW
• Supply voltage: 400 V DC
• Maximum speed: approx. 2600 rpm
• Maximum torque: approx. 700 Nm
• Overload capability: approx. 45% of the nominal power for 120 s
• Nominal Speed 3.500 rpm
• Nominal Torque 150 Nm
• Nominal Power 55 kW
• Peak Power 75 kW
• Power Supply 300 V DC
• Maximum Speed 12.000 rpm
Table 5.2: SR drive specifications at ISEA [28]
39

5.2 Electrochemical Energy Storage Systems
The main objective of this group is to support system engineers and battery manufacturers in the design of systems where batteries are used mainly for auto industries. This group has deep technical and scientific knowledge of the possible battery technologies and the system. They have been optimizing the operating conditions, identify the optimal battery technology and design or develop models which can predict the behaviour of the batteries for planning and development.
ISEA has facility of online battery management, diagnosis with regard to state of charge, ageing, and power performance and optimized charging strategies.
ISEA has developed the expertise mainly on following battery technologies;
• Lead acid batteries (flooded and VRLA)
• Lithium-ion batteries
• NiMH batteries
• NiCd batteries
Battery modeling and online diagnosis for the better battery management is other major research of the group where they have been working on following areas [28];
• Impedance based model
• Chemical model
• Ageing models
• Thermal model
• Sate of charge diagnosis
• Sate of health diagnosis
• Charge acceptance
Technical competences of ISEA on optimum integration of battery are to minimise the life cycle costs, weight, volume or environmental impact, or to maximise lifetime, efficiency and safety. In any case a reliable power supply when ever it is needed is the primary goal.
40
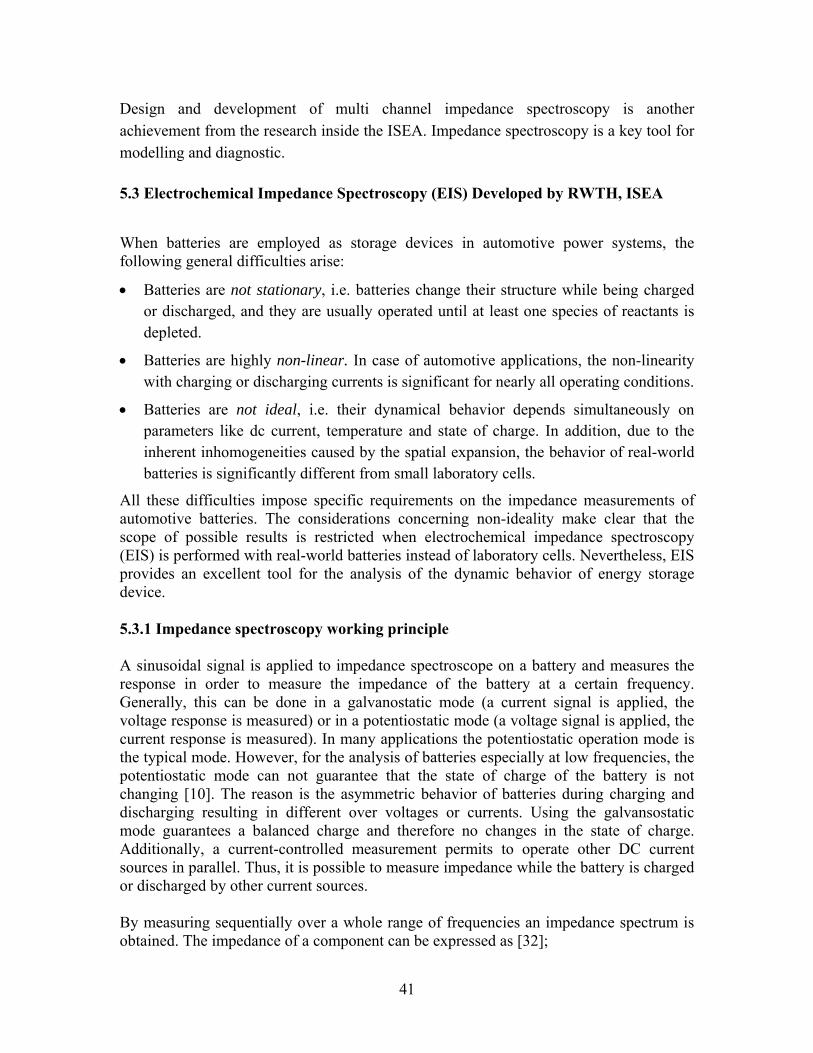
Design and development of multi channel impedance spectroscopy is another achievement from the research inside the ISEA. Impedance spectroscopy is a key tool for modelling and diagnostic.
5.3 Electrochemical Impedance Spectroscopy (EIS) Developed by RWTH, ISEA
When batteries are employed as storage devices in automotive power systems, the following general difficulties arise:
• Batteries are not stationary, i.e. batteries change their structure while being charged or discharged, and they are usually operated until at least one species of reactants is depleted.
• Batteries are highly non-linear. In case of automotive applications, the non-linearity with charging or discharging currents is significant for nearly all operating conditions.
• Batteries are not ideal, i.e. their dynamical behavior depends simultaneously on parameters like dc current, temperature and state of charge. In addition, due to the inherent inhomogeneities caused by the spatial expansion, the behavior of real-world batteries is significantly different from small laboratory cells.
All these difficulties impose specific requirements on the impedance measurements of automotive batteries. The considerations concerning non-ideality make clear that the scope of possible results is restricted when electrochemical impedance spectroscopy (EIS) is performed with real-world batteries instead of laboratory cells. Nevertheless, EIS provides an excellent tool for the analysis of the dynamic behavior of energy storage device. 5.3.1 Impedance spectroscopy working principle A sinusoidal signal is applied to impedance spectroscope on a battery and measures the response in order to measure the impedance of the battery at a certain frequency. Generally, this can be done in a galvanostatic mode (a current signal is applied, the voltage response is measured) or in a potentiostatic mode (a voltage signal is applied, the current response is measured). In many applications the potentiostatic operation mode is the typical mode. However, for the analysis of batteries especially at low frequencies, the potentiostatic mode can not guarantee that the state of charge of the battery is not changing [10]. The reason is the asymmetric behavior of batteries during charging and discharging resulting in different over voltages or currents. Using the galvansostatic mode guarantees a balanced charge and therefore no changes in the state of charge. Additionally, a current-controlled measurement permits to operate other DC current sources in parallel. Thus, it is possible to measure impedance while the battery is charged or discharged by other current sources. By measuring sequentially over a whole range of frequencies an impedance spectrum is obtained. The impedance of a component can be expressed as [32];
41
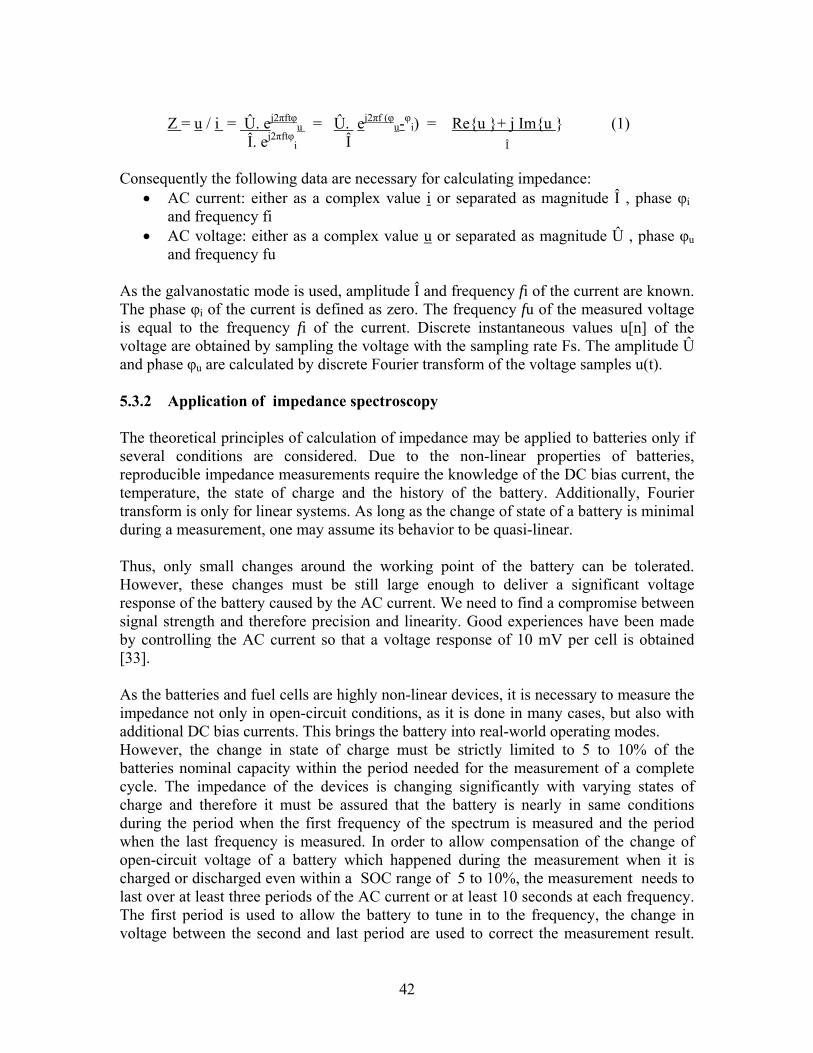
Z = u / i = Û. ej2πftφ
u = Û. ej2πf (φu-φi) = Reu + j Imu (1)
Î. ej2πftφi Î Î
Consequently the following data are necessary for calculating impedance:
• AC current: either as a complex value i or separated as magnitude Î , phase φi and frequency fi
• AC voltage: either as a complex value u or separated as magnitude Û , phase φu and frequency fu
As the galvanostatic mode is used, amplitude Î and frequency fi of the current are known. The phase φi of the current is defined as zero. The frequency fu of the measured voltage is equal to the frequency fi of the current. Discrete instantaneous values u[n] of the voltage are obtained by sampling the voltage with the sampling rate Fs. The amplitude Û and phase φu are calculated by discrete Fourier transform of the voltage samples u(t). 5.3.2 Application of impedance spectroscopy
The theoretical principles of calculation of impedance may be applied to batteries only if several conditions are considered. Due to the non-linear properties of batteries, reproducible impedance measurements require the knowledge of the DC bias current, the temperature, the state of charge and the history of the battery. Additionally, Fourier transform is only for linear systems. As long as the change of state of a battery is minimal during a measurement, one may assume its behavior to be quasi-linear.
Thus, only small changes around the working point of the battery can be tolerated. However, these changes must be still large enough to deliver a significant voltage response of the battery caused by the AC current. We need to find a compromise between signal strength and therefore precision and linearity. Good experiences have been made by controlling the AC current so that a voltage response of 10 mV per cell is obtained [33].
As the batteries and fuel cells are highly non-linear devices, it is necessary to measure the impedance not only in open-circuit conditions, as it is done in many cases, but also with additional DC bias currents. This brings the battery into real-world operating modes. However, the change in state of charge must be strictly limited to 5 to 10% of the batteries nominal capacity within the period needed for the measurement of a complete cycle. The impedance of the devices is changing significantly with varying states of charge and therefore it must be assured that the battery is nearly in same conditions during the period when the first frequency of the spectrum is measured and the period when the last frequency is measured. In order to allow compensation of the change of open-circuit voltage of a battery which happened during the measurement when it is charged or discharged even within a SOC range of 5 to 10%, the measurement needs to last over at least three periods of the AC current or at least 10 seconds at each frequency. The first period is used to allow the battery to tune in to the frequency, the change in voltage between the second and last period are used to correct the measurement result.
42

Therefore the measurement time depends on the number of frequencies per decade and the complete frequency range. 5.3.3 System structure and technical data of EISmeter The EISmeter is a modular impedance spectroscope with 14 voltage measuring channels (Figure 5.3 left). In order to obtain a large current range of -40 to 40 A DC and up to 4 A AC, four individual AC and DC current modules are included in the standard device. The voltage measurement modules were constructed with two channels on each module, so that 14 voltage measuring channels can be obtained with seven modules, which are all galvanically separated. The EISmeter is controlled by a digital signal processor (DSP) that communicated with a personal computer (PC) that serves as a graphical user interface and stores the obtained data.
Figure 5.3: EISmeter (Left: ISEA design, Right: Commercial, Digatron)
Figure 5.4 shows the simplified concept of the multi-channel EISmeter system. Data flow is between the user and the EISmeter via the PC. Within the EISmeter (interrupted lines) the functions of the DSP and the different modules are shown.
The user sets parameters for the measurement via a graphical interface of the PC, such as ideal voltage response of the connected batteries, frequency range for the measurement and DC current value. Furthermore a full program for battery cycling can be defined including current and voltage controlled charging and discharging steps. This allows analysing batteries in a fully automatic mode at different stage of charge. For proper operation, the current modules require a counter voltage between 4 and 20 V that is usually provided by the connected battery. Impedance measurements on single cell currently need an auxiliary battery to provide the AC and DC modules with the required counter voltage of 4 V. The ISEA is developing new version of EISmeter with “zero voltage” to overcome this disadvantage.
43

The DC current modules can set charge or discharge current between 0 to 10 A with a resolution of 2.44 mA. The AC current modules can set AC currents with amplitude between 0 and 1000 mA with a resolution of about 30 μA. The voltage sensor modules can measure voltages between -1.7 and 20 V on their positive channel, and between +1.7 and -20 V on the symmetrical negative channel. The system determines the impedance of connected batteries with an error or less than 2% [72]. The highest measurement frequency is 7.5 kHz. This value is determined by the sampling rate for setting new nominal values for the AC current (currently 60.6 kHz) and the requirement that at least eight current values are necessary in order to create a nearly sinusoidal current. Due to the high temperature stability of the system, measurements are possible down to several μHz. The theoretically lowest possible frequency is about 1 nHz. However, the duration of a measurement at such a low frequency exceeds the lifetime of the instrument and its operator. The voltage measurement is done by a 4-terminal measurement, as suggested in [77] in order to provide the most accurate values. Bad measurement results can be avoided by using twisted pair cables on the whole distance between the battery and the EISmeter. This reduces the impedance and sensitivity to external noise. Therefore the cables should not form loops which would act as antennas. The voltage measurement cables and the current cables should be kept separate to avoid crosstalk between the lines.
Figure 5.4 System structure of EISmeter
During construction of the EISmeter special effort was put on the safety of the system. Connected devices (i.e. batteries) must not be damaged under any circumstances. The
44

safety concept consists of two parts: Protection of the batteries and protection of the instrument. Therefore, the hardware modules themselves detect errors and report them. The EISmeter combines this with a voltage monitoring of the connected batteries. The modules are also protected with fuses and relays. Additionally, the user is always able to stop the measurement with an emergency stop button. The control of the EIS is performed by a powerful script-oriented sequencer, which allows automated experiments with many useful parameters, such as timeout, voltage and current offsets and limits, minimum measuring time and so on. The EISmeter has a graphical user interface for the allocation of the measurement channels, the AC modules and DC modules to different devices test. For the evaluation of the experimental data different tools are available for further processing using commercial tools such as MatLab. 5.3.4 Measurement with EISmeter The EISmeter was developed as a complete battery test bench to perform more tasks with regards to battery experiments than just measuring impedance. The following list shows the features which are included in the EIS meter.
• Microcycle operation
The DC modules can be used to apply small charge and discharge cycle to the devices under test at different states of charge to assure measurements of impedance spectra under steady-state conditions not influenced by the previous charging or discharging history. For impedance measurements with non-zero dc current, the ac signal is superimposed with a continuous charging or discharging current. In this case, subsequent measurements of impedance spectra can be performed until the battery is completely charged or discharged. However, battery operation in (mild, soft or full) hybrid electric vehicles cannot be described by continuous charging or discharging processes [13]. During continued charging or discharging, mass transport processes such as diffusion or migration exceedingly mask the charge transfer-reactions of the electrodes. To separate the influence of mass transport from the original electrode reaction, an improved measuring method for impedance spectra, called “microcycle approach”, is introduced [29]. Starting from a given SOC, the battery is discharged by approximately 5 % of its nominal capacity with a defined dc current. Next, the battery is immediately recharged with the same dc current magnitude over the same time period. One impedance spectrum is recorded during the discharge period, one during the charging period. Such microcycles can be repeated several times. Possible influences of diffusion or migration have been cancelled out after several microcycles. Therefore, microcycle measurements with the same dc current offset are repeated two or three times, and only the last impedance spectrum is used for the respective investigation.
45

For energy storage systems in new automotive power systems the observed current profiles, especially during idle-stop driving, resemble the dc currents during microcycle measurements. Furthermore, future automotive batteries will usually be operated at partial state of charge (PSOC, e.g. between 30 % and 90 % SOC). This also resembles the conditions of microcycle operation. Therefore, the above described microcycle approach is well suited for the parameterization of the impedance-based simulation models. With this parameterization method, at the beginning of a ride, the simulated voltage response may slightly differ from the measured battery voltage. However, it is anticipated that after some idle-stop cycles, i.e. after reaching the quasi-stationary conditions of the microcycle measurements, the battery voltage will be modeled much more precisely. Figure 5.5 shows the complex plane representation of measured impedance spectra of a 36V/27.5Ah AGM battery. The spectra have been recorded using microcycle operation for different superimposed charging and discharging currents at 70 % SOC and at room temperature. Only the last microcycle for each charging or discharging current is depicted.
-200
-100
0
0 100 200 300 400 500
Re Z [mOhm]
Im Z
[mO
hm]
chargedischarge
0.625 A
0.625 A
1.25 A
2.5 A
5 A
1.25 A2.5 A5 A
Figure 5.5 Examples of measured impedance spectra with different superimposed dc
currents (36V/27.5Ah AGM battery, 70 % SOC, room temperature) In the complex plane representation, the frequency that belongs to a measured impedance point cannot be realized. Therefore, during the analysis of impedance data, other ways of graphical representation are also frequently employed, e.g. diagrams plotting the real or the imaginary part of the complex impedance versus frequency.
46
• Half-cell measurements In order to perform measurements on an electrochemical half cell with a reference electrode, a special ultra-high impedance electrometric preamplifier is used. This was necessary because use of reference electrode requires very low currents in the nA range in order to keep the fixed potential of the electrode and prevent the electrode from destruction.
• Cyclovoltammetric (CV) measurement
Some investigations require cyclovoltammetric measurements. Therefore the potential is changed continuously with a certain ramp speed. The current is measured and analyzed later as a function of the potential and the ramp speed.
• Control of AC current amplitude to assure operation in the linear range The voltage response of an electrochemical cell has to be kept within 3-10 mV in order to operate within the linear region of the cell [33]. Typically this limit must be determined by the user and set as a parameter. By analyzing the harmonics of the applied sine wave, the EISmeter is able to adjust the AC amplitude always in a way that operates the battery in the linear range while maximizing the amplitude to assure the best measurement accuracy.
• Voltage controlled charge/discharge For full automatic battery cycling it is necessary to allow for constant voltage charging to achieve fully charged batteries. Even though the EISmeter generally works in the galvanostaic mode, a controller was implemented to allow for the constant voltage charging as well. However, it is not possible to perform impedance measurements during constant voltage period.
• Parallel connection to other battery test benches If the DC current of 40A provided by the EISmeter is not enough for the intended experiment, it is possible to connect the EISmeter in parallel with other battery test benches, e.g the products of Digatron, and perform automated experiments with the EISmeter (using the EISmeter as master).
• Portable EISmeter Currently, the EISmeter is a powerful instrument for use in the laboratory, but it is quite inconvenient for portable applications. The modular design of the EISmeter allows for flexible configuration, e.g. to build units with limited number of current and voltage channels. Together with a battery power supply a portable EISmeters especially for field measurements is available while still having the precision of the complete unit.
47

Chapter 6 Introduction to Impedance Based Modeling of Batteries
6.1 Requirements of the Device Models For a successful implementation of device models in system simulations, general specifications for these models have to be defined. Figure 6. presents a block diagram showing the input quantities, i.e. current and ambient temperature, and the output quantities of the models. The voltage response to the input current profile is the most important output quantity. In automotive system simulations, a voltage precision in the range of ± 0.5 % of the nominal voltage should be achieved [29] . Furthermore, the state of charge (SOC) and the device temperature are additional output quantities.
current
amb. temp.temp.
SOC
voltage
Figure 6.1 Input and output quantities of the device models Since the simulation models are developed for the optimization of vehicle power systems, the application focus has to be on typical automotive current profiles. For batteries in mild-hybrid vehicles, for example, currents in the range of -500 A up to +100 A or higher are expected. The storage devices will perform many shallow cycles at partial state of charge (PSOC). Therefore, the simulation models are to be designed for PSOC operation, and a microcycle approach has to be used for model parameterization. The duration of a charge/discharge cycle during idle-stop driving (including launch assistance and regenerative braking) is supposed to be in the range of two to three minutes or shorter. Thus, according to equation 6.1, the dynamic behavior of the storage devices has to be analyzed down to frequencies of approximately 1 mHz. The highest frequencies which are relevant for the energy storage devices, e.g. imposed by current ripple due to power electronic circuits, are in the kilohertz range. At these elevated frequencies, storage device behavior is solely determined by its self-inductance. Due to the linear behavior of the inductance, the maximum frequency for the impedance mea-surements can be chosen well below the highest excitation frequency in the vehicle. Thus, the upper frequency limit can be set at 6 kHz which is the highest measuring frequency of such instrumentation.
48

fπω
τ2
11== (6.1)
The simulation models have to find an appropriate compromise between precision, calculation time and parameterization effort. To realize flexibility, the simulation models should be easily adaptable to differently sized storage devices of the same technology. Therefore, all model parameters have to be defined with respect to nominal capacity or nominal current as well as the number of cells connected in series. Table 6.1 summarizes the general demands on the simulation models. However, not all models will be able to fulfill all of these demands. The investigated Li-ion batteries, for example, have not been designed for high current applications. Obviously, this limits the validity range of the corresponding simulation model. The same applies for the range of operating temperatures. The models should on principle cover the typical automotive temperature range for energy storage devices which is -30°C up to at least +50°C. However, not all storage technologies are currently able to operate in this range
Frequency range ⇔ Time range
6 kHz ...1 mHz ⇔ 25 µs...150 s
Current range -500 A ... +100 A
SOC range PSOC (e.g. 30 % < SOC < 90 %)
Temperature range -30°C ... +50°C
Voltage precision ± 0.5 % UN
Table 6.3: Normal specifications for simulation models of battery In other cases, characteristic properties of a certain storage technology may exclude meeting the demands presented in table 6.1. In case of VRLA batteries, for example, the desired voltage precision of ± 0.5 % UN, might be achieved during discharge. However, during charging, especially during high-current overcharging, the voltage response of the battery at a given SOC and temperature is not reproducible within the limits of ± 0.5 % . Thus, for these application scenarios the precision of the simulation model must also be restricted.
6.2 Possible Battery Models Depending on the individual aim of a computer simulation, models with a different level of abstraction have to be employed. The choice of these models is always a compromise between calculation time, simulation precision and parameterization effort. In the case of batteries, a classification into four categories is reasonable. Starting at the highest level of abstraction and ending at the highest level of detail, these categories are:
49

6.2.1 Ideal models
In the case of batteries, these models simply consist of an ideal voltage source that offers unlimited power. If the behavior of the energy storage device is not of interest or not supposed to influence the entire system performance, ideal voltage sources can be employed. In case the voltage drop during current flow cannot be fully neglected, the ideal voltage source is frequently combined with an ohmic resistance.
6.2.2 Behavior models
These models simulate the terminal behavior of the storage devices without rebuilding the underlying physical processes. Measured data is either fed into look-up tables or used to adapt parameters of phenomenological functions. In case of batteries, this approach is of great relevance when restricting the charge/discharge processes to quasi-stationary conditions. One of the best-known examples of a behavior model in the field of batteries is Peukert’s law. This model describes the dependence of the capacity of lead-acid batteries on the discharge current. Another category of this battery models aims at predicting the terminal voltage during quasi-stationary charging or discharging conditions. The most famous representative of the latter kind of models is proposed by Shepherd [34]. Details about Peukert’s law and the model by Shepherd as well as a discussion about further behavior models in the field of batteries can be found in [35].
6.2.3 Equivalent-circuit models
Lumped-element equivalent-circuit models rebuild the most important physico-chemical processes that determine the behavior of a certain energy storage device. These models, also termed physically-based models, do not explicitly include the spatial distribution of the internal processes. Therefore, the computation effort is higher than for black box models, but still much lower than for physico-chemical models with spatial resolution. Another important advantage of equivalent-circuit models is their high versatility. In case of energy storage devices, the basic model topology can be easily adapted to any kind of battery or capacitor technology.
6.2.4 Physico-chemical models with spatial resolution
These models rebuild the full physico-chemical process including spatial resolution by means of a set of partial differential equations (PDE). To reduce calculation effort, in the case of batteries often a homogeneous current distribution over the electrode surface is assumed. Thus, the PDE set can be restricted to one spatial dimension. Otherwise, if, for example, acid stratification in lead-acid batteries must be considered, an extension to at least two spatial dimensions becomes necessary. A one-dimensional physico-chemical model dividing a lead-acid battery into four regions: positive electrode, negative electrode, separator and free electrolyte reservoir was developed by Karden [29]. Five non-linear partial differential equations define this model. Another example of a physico-
50
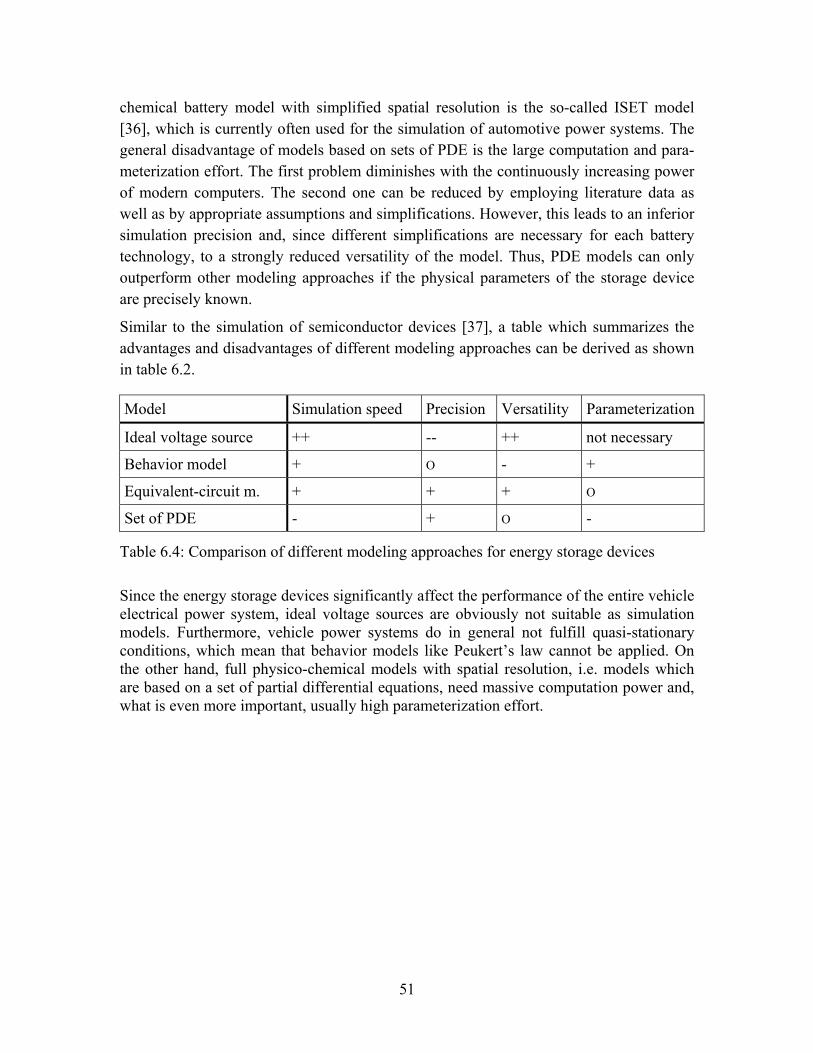
chemical battery model with simplified spatial resolution is the so-called ISET model [36], which is currently often used for the simulation of automotive power systems. The general disadvantage of models based on sets of PDE is the large computation and para-meterization effort. The first problem diminishes with the continuously increasing power of modern computers. The second one can be reduced by employing literature data as well as by appropriate assumptions and simplifications. However, this leads to an inferior simulation precision and, since different simplifications are necessary for each battery technology, to a strongly reduced versatility of the model. Thus, PDE models can only outperform other modeling approaches if the physical parameters of the storage device are precisely known.
Similar to the simulation of semiconductor devices [37], a table which summarizes the advantages and disadvantages of different modeling approaches can be derived as shown in table 6.2.
Model Simulation speed Precision Versatility Parameterization
Ideal voltage source ++ -- ++ not necessary
Behavior model + O - +
Equivalent-circuit m. + + + O
Set of PDE - + O -
Table 6.4: Comparison of different modeling approaches for energy storage devices Since the energy storage devices significantly affect the performance of the entire vehicle electrical power system, ideal voltage sources are obviously not suitable as simulation models. Furthermore, vehicle power systems do in general not fulfill quasi-stationary conditions, which mean that behavior models like Peukert’s law cannot be applied. On the other hand, full physico-chemical models with spatial resolution, i.e. models which are based on a set of partial differential equations, need massive computation power and, what is even more important, usually high parameterization effort.
51

Chapter 7 Experimental Results and Discussion on Battery Testing 7.1 Battery Testing The battery parameters important to hybrid and electric vehicles are divided into two groups;
• directly measured parameters • derived parameters for advance battery testing
Usually battery testing is done on single cell devices and the results of cell testing are extrapolated to full size batteries.
7.1.1 Directly measured parameters For a single-cell device, only three fundamental measurements are typically made as functions of time over a prescribed test sequence: the temperature of the cell and the terminal voltage and current during the various load conditions imposed on the cell. Cell temperature itself is not a goal parameter (except for the ability to operate over a defined temperature range), but cell performance of high-power batteries can vary dramatically with temperature. Most cell testing is done in test chambers at ambient temperature (typically 25 to 30°C), and accurate control of temperature is critical to repeatable results. Additionally, the characterization of temperature effects on cell performance requires accurate measurement of the device temperatures during tests conducted at higher- or lower-than-normal temperatures. All three of these parameters are typically measured at periodic intervals during a battery test sequence, though the measurement rate may be different during different parts of the sequence. 7.1.2 Derived parameters for advance battery testing Batteries are robust energy storage devices whose use may involve time responses from near steady state to fractions of seconds. Various parameters of battery performance are derived for battery test programs from the fundamental measurements of current and voltage made during specific test sequences, i.e., under transient conditions.
52

Battery power (watts): Battery Power is the instantaneous product of current and voltage and is typically expressed in watts. Battery voltage is always positive, but current can flow either out of the battery (during discharge) or into the battery (during charge), so power can be either positive or negative. Battery testers typically perform this calculation internally and report the result as measured data, though it is usually not measured in the sense that it is derived from the output of an actual power sensor. In some cases, power must be calculated externally from the measured values of current and voltage. The ability to do this usefully for step (pulse) test profiles can critically depend on the extent to which the current and voltage measurements are made at the same time. Careful design of battery test time profiles is required to ensure that the time resolution of transient measurements is always adequate. Battery capacity (Ah): Battery Capacity is a measure of charge removed from a battery, defined as the integral of battery current over time during some prescribed test sequence. Capacity is typically expressed in ampere-hours (A·h). Battery testers commonly perform this integration internally (typically as a numerical integration) and report the result as measured data, though it can also be calculated externally if a sufficient number of data points are available. Battery energy (Wh): Battery Energy is a measure of the energy removed from or added to a battery, defined as the integral of battery power over time under some prescribed test sequence. Energy is typically expressed in watt-hours (W·h). Battery testers commonly perform this integration internally (typically as a numerical integration) and report the result as measured data, though it can also be calculated externally if a sufficient number of data points are available. Battery impedance (Ω): Impedance, expressed in ohms (Ω), is a measure of the apparent relationship between battery terminal voltage (V) and battery load current (I) over a selected portion of a particular test step, which is commonly a constant current pulse several seconds in duration. It is calculated for a test pulse as
Source Impedance = ΔV/ΔI
where ΔV and ΔI are respectively the change in voltage resulting from the change in current over some or all of the test pulse. The test pulse is commonly preceded by an open-circuit condition. The sign of battery current is defined such that this quantity is always positive.
53

Battery efficiency: Battery round-trip efficiency is the ratio of discharge energy to charge energy (expressed as a percentage)over a specific test sequence where the initial and final battery states-of-charge are identical. This test sequence is typically one or more pulse profiles (sequences of discharge and charge steps) controlled such that the discharge capacity removed is equal to the charge capacity returned during each profile. Battery self-discharge (W.h/d): Self discharge is the amount of battery energy lost [typically expressed in watt-hours per day (W·h/d)] during a fixed time period when the battery is stored in an open-circuit condition. It is calculated from the results of two nearly identical tests, each of which discharges the battery at a constant current rate from a fully charged state to a minimum terminal voltage. Pulse power capability (watts): Pulse power capability is a calculation of the maximum power [typically expressed in watts (W)] that can be delivered or accepted by a battery at a given depth-of-discharge for a prescribed time without exceeding prescribed voltage limits. It is calculated from voltage measurements taken before and during (and sometimes after) execution of a current pulse, along with current measurements taken before and during the pulse.
54
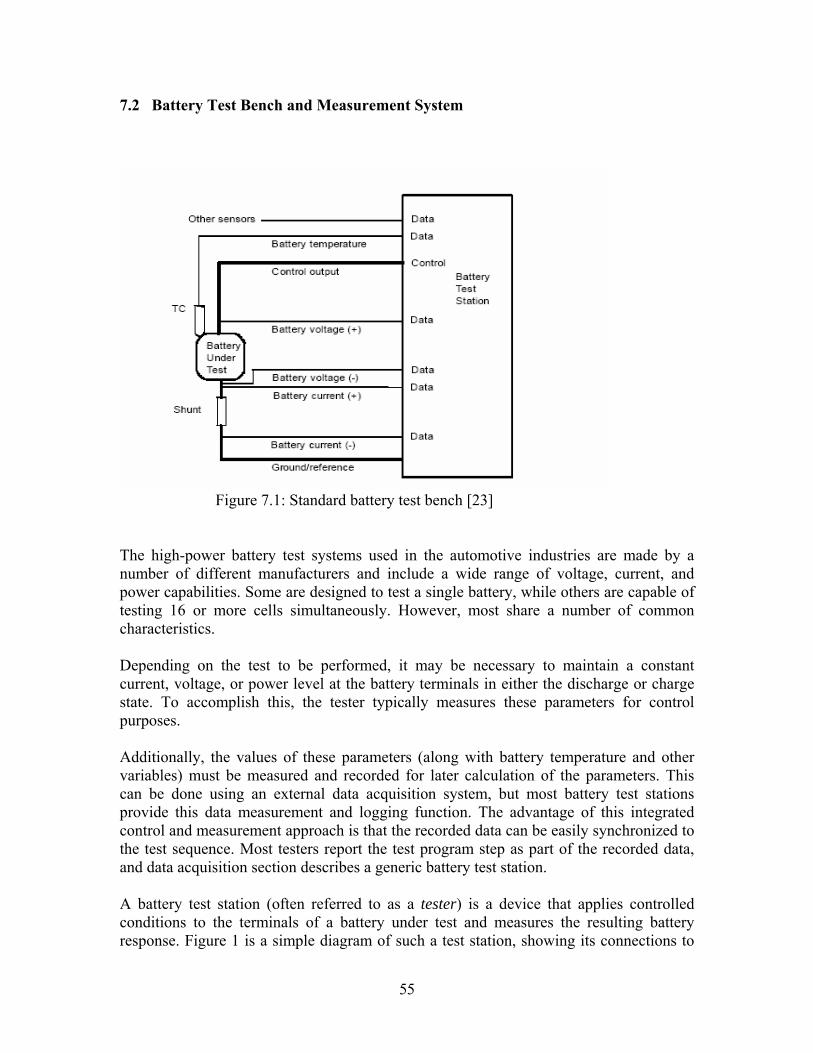
7.2 Battery Test Bench and Measurement System
Figure 7.1: Standard battery test bench [23]
The high-power battery test systems used in the automotive industries are made by a number of different manufacturers and include a wide range of voltage, current, and power capabilities. Some are designed to test a single battery, while others are capable of testing 16 or more cells simultaneously. However, most share a number of common characteristics. Depending on the test to be performed, it may be necessary to maintain a constant current, voltage, or power level at the battery terminals in either the discharge or charge state. To accomplish this, the tester typically measures these parameters for control purposes. Additionally, the values of these parameters (along with battery temperature and other variables) must be measured and recorded for later calculation of the parameters. This can be done using an external data acquisition system, but most battery test stations provide this data measurement and logging function. The advantage of this integrated control and measurement approach is that the recorded data can be easily synchronized to the test sequence. Most testers report the test program step as part of the recorded data, and data acquisition section describes a generic battery test station. A battery test station (often referred to as a tester) is a device that applies controlled conditions to the terminals of a battery under test and measures the resulting battery response. Figure 1 is a simple diagram of such a test station, showing its connections to
55

the battery to be tested. All the batteries of interest for hybrid and electric vehicle use are rechargeable, and vehicle operation involves alternating periods of discharge and charge. Thus, a tester is required to act both as a controlled load under battery discharge conditions and a controlled source of power and energy under battery charge conditions, potentially with sampling intervals can usually be varied for each step. Most test stations acquire data at a fixed rate for control purposes and record these data at programmable rates specified by the user. As indicated in figure 7.1, battery current is typically measured using a dc shunt in series with the device under test. Voltage is preferably measured directly at the battery terminals to avoid errors from line losses at the high currents required. 7.3 Lithium ion Battery 7.3.1 Design and working principle of Li-Ion batteries In general, the positive electrode of a Li-ion battery consists of lithium cobalt oxide (LiCoO2), lithium manganese oxide (LiMn2O4), or lithium nickel oxide (LiNiO2), or a hybrid material comprised thereof. Alternative materials are subject of ongoing research. The negative electrode consists of hard carbon or graphite, for example. Both electrodes work as so-called intercalation electrodes which mean that Li-ions are reversibly integrated into the crystal structures of the electrode materials. As electrolyte, non-aqueous solvents with high dielectric constants such as propylene or ethylene carbonate comprising lithium-containing salts like LiPF6, LiBF4 or LiClO4 are used [38]. However, these electrolytes generally have very high viscosity. Thus, to increase ionic conductivity, in practical systems solvents with lower viscosity are mixed [39]. Figure 7.2 and the following equations describe the charging reaction of a battery consisting of a lithium cobalt oxide cathode and a carbon anode. cathode: LiCoO2 → Li1-xCoO2 + xLi+ + xe-
anode: C + xLi+ + xe- → CLix cell reaction: LiCoO2 + C → Li1-xCoO2 + CLix
56

Figure 7.2 General working principle of Li-ion batteries [40] The equations indicate that the cell reaction simply is the migration of lithium ions between positive and negative electrodes. During charging, Li ions are removed from the cathode and are intercalated into the anode. During discharge, the described process runs vice versa. In both cases, electrons outside the battery are flowing in the same direction as the positive Li ions inside. Note that metallic lithium is not present in the system. Therefore, Li-ion cells with their intercalation electrodes are less chemically reactive, and thus are safer and offer a longer cycle life than cells using metallic lithium as electrode material. Therefore, despite their slightly lower energy density, Li-ion cells are preferably considered for the use in automotive power systems. However, uncontrolled charging and discharging, particularly with multi-cell Li-ion batteries where the cells can become unbalanced during cycling, could nevertheless result in lithium plating on the carbon electrode or decomposition of the organic electrolyte. Methods to protect the battery from these abusive electrical conditions are therefore mandatory.
7.3.2 Impedance with charge transfer and diffusion of Li-ion As in the case of supercapacitors, electrodes of batteries also consist of highly porous materials. However, due to the presence of electrode reactions, the corresponding trans-mission line model has to be modified. Figure 7.3 shows a more general model of a porous battery electrode. Apart from the already known resistance Rel and the double-layer capacitance Cdl, a passivation film, charge transfer reactions as well as diffusion processes have to be taken into account [41]. If a passivation film exists, this so-called solid/electrolyte interface (SEI) is observed as a high-frequency semi-circle in the impedance spectrum. It can be modeled by means of a parallel connection of a resistance and a capacitance (R1 and C1).
57

To represent the Faradaic reaction and the diffusion process of the reacting species, a non-linear charge transfer resistance Rct and so-called Warburg impedance ZW are employed. These model elements are connected in series and are paralleled by the double-layer capacitance Cdl of the electrode/electrolyte interface [42].
R x’ del
C x’ ddl
C’ x1 d
ZW’ x/d
R’ x1 /d
R x’ /dct
C x’ ddl
C’ x1 dR’ x1 /d
R x’ /dct
C x’ ddl
C’ x1 dR’ x1 /d
R x’ /dct
R x’ del R x’ del
ZW’ x/d ZW’ x/d
Figure 7.3 Transmission line model of a porous electrode comprising distributed
electrolyte resistance (Rel), passivation layer (R1, C1), double-layer capacitance (Cdl), charge transfer reaction (Rct) and diffusion process (ZW).
The impedance of the modified pore model is given as
⎟⎟⎠
⎞⎜⎜⎝
⎛⋅⋅=
int
elintelp coth
ZRZRZ (7.1)
with
Wctdl
11
int 1j
11j
1
ZRC
RC
Z
++
++
=ωω
(7.2)
Due to the common nature of the kinetic steps in the different battery systems, the above described model covers all existing battery chemistries and electrode designs. Compared to other modeling approaches, this versatility is one of the most important advantages of the impedance-based energy storage simulation. Although the presented topology might not model all electrochemical processes in detail, sufficient accuracy for the development of dynamic simulation models is provided. In addition, some of the depicted model elements will be negligible for many storage systems. In these cases, the model topology can be further simplified.
58

As mentioned above, the diffusion process in the pores of the electrodes or in the electrode material itself can be expressed as impedance term in electrochemistry. This term is called Warburg impedance ZW [43].
c) ZWL
ω
ReZ
–Im
Z
b) ZWI
ReZ
ω
–Im
Z
a) ZW∞
ReZ
ω
–Im
Z
Figure7.6 Schematic complex-plane plots of Warburg impedances: a) semi-infinite
diffusion layer; b) limited diffusion layer and ideal reservoir at the boundary; c) limited diffusion layer and non-permeable wall at the boundary
Three important boundary conditions for the molarity m of the reacting species need to be discussed. In all cases, geometry is regarded one-dimensional, and the reaction occurs at x = 0. Figure7.6 illustrates the three different types of Warburg impedances.
• Semi-infinite diffusion: m = m0 = const. for x → ∞
( j1j1
e22
0W −==∞
ωσ
ωDAFnmTR
Z ) (7.3)
with DAFnm
TR
2e22
0=σ (7.4)
where D is the diffusion constant of the diffusing species and Ae is the electrode surface.
• Ideal reservoir with constant molarity m0 at finite distance l: m = m0 = const. for x = l
( )
D
Dl
AFnmTR
Zω
ω
j
jtanh
e22
0WI
⋅= (7.5)
• Non-permeable wall with zero flux at finite distance l: dm/dx = 0 for x = l
59

( )
D
Dl
AFnmTR
Zω
ω
j
jcoth
e22
0WL
⋅= (7.6)
For semi-infinite diffusion, the Warburg impedance obeys |ZW∞| ~ ω–1/2 and ϕ = -45° for all frequencies. For finite diffusion, this behavior is found at sufficiently high frequencies. Note that the diffusion equation has the same mathematical form as the transmission line model of the porous electrode. Defining a diffusion resistance RD and a diffusion capacitance CD according to
eAFnm
RTDlR
220
D ⋅= (7.7)
and RT
AFnmlC e22
0D ⋅= (7.8)
the Warburg impedance of equation (7.6) 7.6 can be written as
( DDD
DW jcoth
jCR
CRZ ωω
⋅⋅= ). (7.2)
The diffusion process can be modeled by means of a ladder network too, which means that the electrical equivalent circuit can also be interpreted as a diffusion model.
7.3.3 Impedance spectra of Li-ion battery The impedance spectra from the measurements of the Li-ion battery at room temperature for different states of charge without superimposed dc current are shown in figure 7.5. For all spectra, some characteristic frequencies are given. At real impedance Re(Z) ≈ 42 mΩ, the real axis intersection of the impedance spectra is observed. For lower frequencies, all spectra show two semicircles. The first semicircle is comparably small and slightly depressed, whereas the second one is larger, nearly non-depressed and grows remarkably with decreasing state of charge. Finally, at the low-frequency end of the depicted spectra, the diffusion impedance becomes visible. At high states of charge, the diffusion impedance shows a -45°-slope, which is typical of Warburg impedance. At low states of charge, the angle of the diffusion impedance is found to be in the region of -22.5°.
60

-60
-50
-40
-30
-20
-10
0
10
2040 50 60 70 80 90 100 110 120 130 140 150 160 170
Re Z [mOhm]
Im Z
[mO
hm]
100% SOC 80% SOC 50% SOC 30% SOC
21.7 mHz
2.1 mHz
289.8 mHz
21.7 Hz
285.7 Hz
ϑ = 25°C
217.3 mHz163.0 mHz
2.1 mHz
Figure7.7 Impedance spectra of a Li-ion battery ( temp : 25 °C) Figure7.8 shows again impedance spectra at room temperature. In this case, as a further example, spectra with different superimposed charging currents at 80 % state of charge are depicted. To stay approximately at the same state of charge (ΔSOC ≈ 5 %) during the experiment, the duration of the measurement has to be decreased with increasing current. Therefore, the low-frequency limit of the spectra has been continuously increased. The depicted spectra clearly show the pronounced, non-linear current dependency of the low-frequency semicircle. This non-linearity is observed for both charging and discharging currents.
61
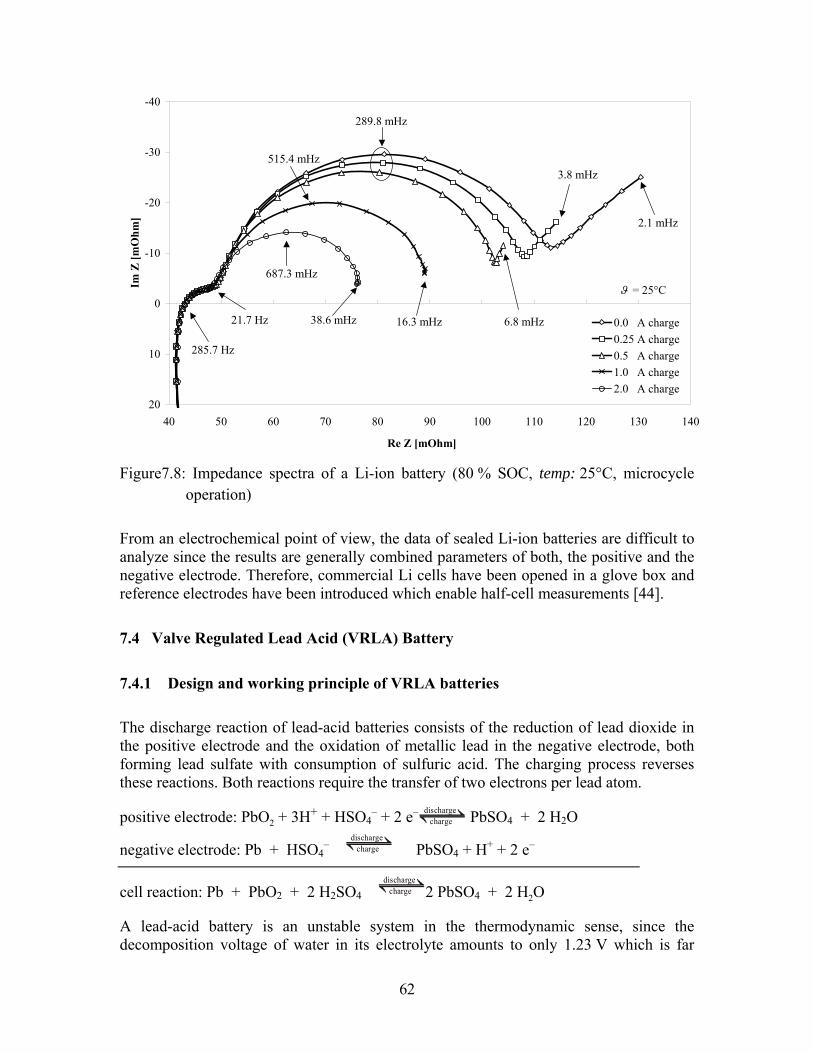
-40
-30
-20
-10
0
10
2040 50 60 70 80 90 100 110 120 130 140
Re Z [mOhm]
Im Z
[mO
hm]
0.0 A charge0.25 A charge0.5 A charge1.0 A charge2.0 A charge
2.1 mHz
ϑ = 25°C
3.8 mHz
6.8 mHz16.3 mHz38.6 mHz
289.8 mHz
515.4 mHz
687.3 mHz
21.7 Hz
285.7 Hz
Figure7.8: Impedance spectra of a Li-ion battery (80 % SOC, temp: 25°C, microcycle
operation) From an electrochemical point of view, the data of sealed Li-ion batteries are difficult to analyze since the results are generally combined parameters of both, the positive and the negative electrode. Therefore, commercial Li cells have been opened in a glove box and reference electrodes have been introduced which enable half-cell measurements [44].
7.4 Valve Regulated Lead Acid (VRLA) Battery
7.4.1 Design and working principle of VRLA batteries The discharge reaction of lead-acid batteries consists of the reduction of lead dioxide in the positive electrode and the oxidation of metallic lead in the negative electrode, both forming lead sulfate with consumption of sulfuric acid. The charging process reverses these reactions. Both reactions require the transfer of two electrons per lead atom.
positive electrode: PbO2 + 3H+ + HSO4– + 2 e– discharge
charge PbSO4 + 2 H2O
negative electrode: Pb + HSO4–
dischargecharge PbSO4 + H+ + 2 e–
cell reaction: Pb + PbO2 + 2 H2SO4 discharge
charge 2 PbSO4 + 2 H2O
A lead-acid battery is an unstable system in the thermodynamic sense, since the decomposition voltage of water in its electrolyte amounts to only 1.23 V which is far
62

below the nominal cell voltage of 2 V. Furthermore, at the high potential of the positive electrode, all metals are destroyed by oxidation and only lead can be used for the grid and the conducting elements, because the corrosion of lead generates a protecting layer of lead dioxide. However, even this layer is not perfectly stable, and corrosion causes a small continuous internal current flow. As a consequence, water decomposition and lead corrosion are to be accepted as unwanted secondary reactions in lead-acid batteries [45]. The following four secondary reactions are inherent to the lead-acid system:
• hydrogen evolution at the negative electrode, • oxygen reduction at the negative electrode, • oxygen evolution at the positive electrode and • grid corrosion at the positive electrode.
These reactions are accelerated at elevated cell voltage, especially during charging. Furthermore, according to Arrhenius’ law, the rate of grid corrosion and gas evolution is approximately doubled for a temperature increase of 10°C. In flooded batteries, oxygen and hydrogen evolution are the main overcharging reactions. A (nearly) stoichiometric ratio of the two gases escapes from the cell, and a corresponding water loss is observed. Oxygen reduction can be neglected because of the slow transport of oxygen dissolved in the liquid, and the corrosion current is also comparably small [45]. In valve-regulated lead-acid batteries (VRLA), an internal oxygen-cycle characterizes the overcharging and float-charging situation. These batteries provide small gas channels in the electrolyte allowing the gas-phase transport of oxygen to the negative electrode where it is reduced. Oxygen transport in the gas phase is half a million times faster than that in the liquid phase. To provide voids for a fast transport of oxygen, the electrolyte must be “immobilized”. This can either be achieved by converting the acid into a stiff gel or by the application of absorbent glass mat separators (AGM) which are soaked by the acid so that no liquid acid is left in the cell [45]. Since the internal resistance of the gel battery is slightly higher, the AGM design is preferred for high power applications, e.g. automotive power systems. Gelled electrolyte batteries, on the other hand, are superior in cycle applications. As a consequence of the oxygen reduction, hydrogen evolution is suppressed and the overcharge voltage is mainly governed by the positive electrode. However, a certain evolution of hydrogen at the negative electrode and grid corrosion at the positive electrode will always be present. Both parasitic overcharge reactions cause water loss, and since water cannot be refilled in sealed VRLA batteries, service life is reduced. Thus, to achieve optimum performance, special attention has to be paid to the operating temperature and the charging methods. A general problem of multi-cell VRLA batteries in (micro-)cycle applications are the slight differences between the parameters of the internal oxygen cycles of the series-connected cells. A higher reaction rate of the oxygen cycle means that a correspondingly
63

smaller portion of the current flows through the battery’s charging reaction. As a consequence, after a longer time of operation, the individual cells of the battery reach different states of charge. To avoid this effect, a certain amount of overcharging has to be provided, although this leads again to increased water loss. Thermal problems, including thermal runaway, are also often discussed in connection with VRLA batteries, because all the electrical energy that is consumed by the internal oxygen cycle is converted into heat [45]. Thus, the impedance-based simulation model of valve-regulated lead-acid batteries should also comprise a thermal battery model. The following section therefore particularly focuses on the thermal properties of VRLA batteries. 7.4.2 Impedance spectra of VRLA battery Impedance spectra with different superimposed dc currents have been measured at several 70 % SOC and temperature 27°C. These sets of spectra allow a full parameterization of the frequency domain model of the tested VRLA battery. However, not all combinations of the three parameters (temperature, SOC and dc current) can be freely combined. In the case of low temperatures, for example, only sufficiently high states of charge can be analyzed to prevent the battery from freezing. In addition, under these conditions the battery accepts only small charging currents. This means that only the discharge periods of the microcycles can be performed with the defined current magnitude whereas charging has to be realized with reduced current for a correspondingly longer period of time. If the charging current is not appropriately reduced, the battery voltage rises quickly and the electrode kinetics is governed by the gassing reactions. Figure 7.6 and Figure 7. show measured impedance spectra of a VRLA battery at a state of charge of 70 % SOC and at a temperature of 27°C for different superimposed discharge currents.
-100
-50
0
500 50 100 150 200 250 300
Re Z [mOhm]
Im Z
[mO
hm]
-0.67 A discharge-1.35 A discharge-2.70 A discharge-5.40 A discharge-10.0 A discharge
3.8 mHz
3.8 mHz
9.1 mHz21.7 mHz38.6 mHz
9.1 mHz
16.3 mHz38.6 mHz
68.7 mHz
6 kHz
Figure 7.7: Impedance spectra of VRLA battery with superimposed discharge currents
(70 % SOC, temp= 27°C)
64

-20
-10
0
100 10 20 30 40 5
Re Z [mOhm]
Im Z
[mO
hm]
0
-0.67 A discharge-1.35 A discharge-2.70 A discharge-5.40 A discharge-10.0 A discharge
38.6 mHz
500 Hz21.7 Hz
91.7 mHz
12.2 Hz
12.2 Hz9.2 Hz
9.2 Hz
Figure 7.8: Enlarged view of the high-frequency range of figure 7.7 The charging and discharging spectra in above figures cross the real axis at Re(Z) ≈ 13 mΩ. For lower frequencies, two capacitive semicircles are observed. Both semicircles are depressed. The figures provide the characteristic frequency of each semicircle, i.e. the frequencies of the data point with minimum Im(Z). This frequency increases with increasing dc current. At the same time, the low-frequency limit of the impedance measurements has been continuously increased to fulfill the microcycle conditions (ΔSOC ≈ 5 %). The impedance spectra show a non-linear current dependency of both semicircles. For the low-frequency semicircle, this dependency is strongly pronounced. In contrast to the investigated Li-ion batteries, for the investigated state of charge and within the depicted frequency range, the charging and discharging spectra of the VRLA battery do not show any diffusion characteristics.
65

Chapter 8 Conclusion The battery system is a key component in the reliable and effective performance of present and future vehicles. The sodium nickel chloride battery (ZEBRA battery) has proven a history in battery powered electric vehicles in Think city car. The requirement of high specific energy is fulfilled by ZEBRA battery but has some limitations on specific power. Similarly, NiMH battery has been powering the most of the hybrid electric vehicles with its high energy density and specific gravity. But, it also has limitation of lower volumetric energy density and higher self discharge. That’s why, it is not suitable to full electric vehicles. Now, Li-ion batteries are introduced in the automotive markets with many benefits compare to other battery technologies. It has shown very promising features to fulfill the energy and power demand for battery powered full electric vehicles. Battery diagnosis is very important to the automotive industries to assure to meet the requirements of performance, life and safety of vehicles. The USABC and FreedomCAR test procedures are found useful to follow the advanced battery testing. The commercially available battery tester is a quick and cheap option to investigate the core performance of the battery but specialized and sophisticated test equipment and tools are also available to test the batteries. Different battery models mainly based on impedance based models are used for this specialized tool. The electrochemical impedance spectroscopy meter (EISmeter) is more than a simple impedance spectroscope. It is a complete test bench for different electrochemical power sources and is very suitable to test batteries of different chemistries. All special features which are needed for a precise analysis of batteries are including in one unit. A high stability of the measurement devices allows for measurements at very low frequencies in the range μHz or even lower frequencies. DC current channels and the possibility for parallel operation with other battery test benches allow for measurements under charging and discharging loads. The high number of measurement channels allows for real parallel measurements on various cells or modules at a time. To follow the flowchart and algorithms that have been developed by USABC and FreedomCAR is an easy way to investigate battery performance and life. Climate chambers of wide temperature range is appropriate for artificial aging of battery and test with impedance spectroscope, measuring the impedance of battery, where higher the impedance, older the battery can be verified and hence battery life can be predicted.
66

Chapter 9 Further Works Despite the development of advanced battery technologies, e.g. lithium-ion batteries (Li-Ion), which overcome most technical restrictions to fulfill the energy and power demand of electric vehicles but still the technology is not matured and large commercial productions has just been started by some battery manufacturers. Battery is the main but weakest part of the electric vehicles. To validate the performance of the battery supplied by the manufacturer and to assure the electric vehicle costumers, proper battery testing and diagnosis is necessary. To develop battery models, algorithms and simulation for different battery technologies is another future task to validate the test results from the measurements using battery tester. Conventional electrochemical impedance spectroscopy meter (EISmeter) demands rather large, heavy and expensive measurement equipment which is therefore not suitable for onboard automotive applications. Development of cheap and portable EISmeter will be a future work. Fuel-cell electric vehicles offer the advantages of the electric power train while avoiding the problem of the restricted driving range. However, if hydrogen is used as energy source, the lack of an appropriate infrastructure, i.e. hydrogen filling stations, as well as a number of safety issues, e.g. caused by the hydrogen tank, represent other commercialization obstacles. To study on these issues will be the next recommended future work.
67

References [1] MIZSEY, E. NEWSON: Comparison of different vehicle power trains. J. Power
Sources 102, 2001, pp. 205-209
[2] D. HERMANCE, S. SASKAI: Hybrid electric vehicles take to the streets. IEEE
Spectrum, Nov.1998, pp. 48-52
[3] C.M. SHEPHERD: Design of primary and secondary cells. II. An equation
describing battery discharge. J. of the Electrochemical Society 112, 1955, pp.
657-664
[4] TOYOTA MOTOR CORPORATON: Toyota Hybrid System-Mild (THS-M). Press
Release at Electric Vehicle Symposium (EVS 18), Berlin, Germany, 2001
[5] M. ANDERMAN: In search of a battery to power advanced vehicles. Advanced
Automotive Battery Conf. (AABC 02), Las Vegas, USA, 2002
[6] K. TAKAHASHI, H. YASUDA, H. HASEGAWA, S. HORIE, K. KANETSUKI: Eight years
of experience with valve-regulated batteries for automotive use. J. of Power
Sources, 53, 1995, pp. 137-141
[7 K. PETERS: Design options for automotive batteries in advanced car electrical
systems. J. of Power Sources, 88, 2000, pp. 83-9
[8] R. NELSON: Valve-regulated lead-acid batteries. Tutorial at the Advanced
Automotive Battery Conf. (AABC 02), Las Vegas, USA, 2002
[9] OPTIMA BATTERIES: L5-36 V engineering sample battery deep cycle design – user
manual. Optima Batteries, Inc., Aurora, CO, USA, 2001
[10] F. TRINIDAD, F. SÁEZ, J. VALENCIANO: High power valve regulated lead-acid
Batteries for new vehicle requirements. J. of Power Sources, 91, 2001, pp. 24-37
[11] D. OHMS, G. SCHÄDLICH: NiMH-batteries in modular bipolar design for
application in advanced board net structures and HEV. Handout at Electrical
Vehicle Symposium (EVS 18), Berlin, 2001
[12] K. NECHEV: Improvements in Saft Li ion technology for HEV and 42 V systems.
Advanced Automotive Battery Conf. (AABC 02), Las Vegas, USA, 2002
[13] GAIA AKKUMULATORENWERKE: Light-weight polymer power. Handout at the
68

Electric Vehicle Symposium (EVS 18), Berlin, Germany, 2001
[14] R. PARADIS: Will lithium-metal polymer batteries be the next big thing to hit the
EV and HEV market? Electric & Hybrid Vehicle Technology 2000, pp. 79-81
[15] FORTU BATTERIEN: We create mobile energy. Handout at the Electric Vehicle
Symposium (EVS 18), Berlin, Germany, 2001
[16] J.L. SUDWORTH: The sodium/nickel chloride (ZEBRA) battery. J. of Power
Sources, 100, 2001, pp. 149-163
[17] A. BURKE: Ultracapacitors. Tutorial at the Advanced Automotive Battery
Conference. (AABC 02), Las Vegas, USA, 2002
[18] A. BURKE, M. MILLER: Update of ultracapacitor technology and hybrid vehicle
applications: passenger cars and transit busses. Electric Vehicle Symposium (EVS
18), Berlin, Germany, 2001
[19] A. SCHNEUWLY: BOOSTCAP double-layer capacitors as power source for
automotive applications. Advanced Automotive Battery Conference. (AABC 02),
Las Vegas, USA, 2002
[20] J. TACHTLER, T.DIETSCH, G. GÖTZ: Fuel cell auxiliary power unit – innovation for
the electric supply of passenger cars. Fuel Cell Power for Transportation, Proc.
SAE 2000 World Congress, Detroit, USA, 2000
[21] D. LINDEN, T. B. REDDY, Handbook of Batteries, Third edition, 2001
[22] USABC Electric Vehicle Battery Test Procedures Manual, US Department of
Energy/INEEL, Revision 2, January 1996
[23] FreedomCAR Battery Test Manual for Power Assist Hybrid Electric Vehicles, US
Department of Energy/INEEL, October 2003.
[24] Advanced Technology Development Program, For Lithium-Ion Batteries,
FreedomCAR & Vehicle Technologies Program, July 2006
[25] IEEE Guide for Selecting and Use of Battery Monitoring Equipment in Stationary
Applications, IEEE Power Engineering Society, November 2005
[26] C. LAMICHHANE, Energy Storage Systems in Electric Vehicles, Master’s
Project Report, NTNU, 2007
69

[27] Lithium Battery Evaluation and Research Accelerated Life Test Direction,
Publishable Final Report, RWTH-ISEA, November 2006
[28] http://www.isea.rwth-aachen.de/isea2/index.php?lang=engl, 05/05/2008
[29] E. KARDEN, S. BULLER, R.W. DE DONCKER: A method for measurement and
interpretation of impedance spectra for industrial batteries. J. of Power Sources
85, 2000, pp. 72-78
[30] Electrochemical Impedance Spectroscopy for Battery Research and Development,
Technical Report 31, Solartron Analytical, 1996
[31] M. E, ORTUZAR, Design , Implementation and Evaluation of an Auxiliary
Energy System for Electric Vehicles, Based on Ultracapacitor and Buck-Boost
Converter, Ph.D Thesis, July 2005
[32] BLANKE, H. et.al. The Art of Impedance Spectroscopy on Batteries and Fuel
Cells, Symposium Impedanzspektroskopie, May 2006
[33] MacDonald, J.R. Impedance Spectroscopy, Wiley, 2005, New Jersey
[34] C.M. SHEPHERD: Design of primary and secondary cells. II. An equation
Describing battery discharge. J. of the Electrochemical Society 112, 1955, pp.
657-664
[35] W. SCHLEUTER: Ein Beitrag zur Beschreibung des elektrischen Verhaltens von
Blei-, Nickel-Cadmium- und Nickel-Eisen-Akkumulatoren. Dissertation, RWTH
Aachen, 1982
[36] P. CASELITZ, R. JUCHEM: Computer aided design of battery management systems
for automobiles - a model for lead-acid batteries. SAE Technical Paper Series No.
980309, ISSN 0148-7191
[37] S. SCHRÖDER: Circuit-simulation models of high-power devices based on
semiconductor physics. Dissertation, RWTH Aachen, 2002
[38] N. SATO: Thermal behavior analysis of lithium-ion batteries for electric and
Hybrid vehicles. J. of Power Sources 99, 2001, pp. 70-77
[39] Y. NISHI: Lithium-ion secondary batteries: past 10 years and the future. J. of
Power Sources 100, 2001, pp. 101-106
70
[40] S. BULLER, E. KARDEN, R.W. DE DONCKER: 42 V-Bordnetz: Anforderungen an
Die Energiespeicher. Institute for International Research (IIR), Germany, 2001
[41] A. MARTINENT, B. LE GORREC, C. MONTELLA, R. YAZAMI: Three-electrode button
cell for EIS investigation of graphite electrode. J. of Power Sources 97-98, 2001,
pp. 83-86
[42] D. QU: The ac impedance studies for porous MnO2 cathode by means of modified
transmission line model. J. of Power Sources, 102, 2001, pp. 270-276
[43] J.R. MACDONALD (ed.): Impedance spectroscopy, emphasizing solid materials and
systems. John Wiley & Sons, 1987, ISBN 0-471-83122-0
[44] G. NAGASUBRAMANIAN: Two- and three-electrode impedance studies on 18650
Li-ion cells. J. of Power Sources 87, 2000, pp. 226-229
[45] D. BERNDT: Valve-regulated lead-acid batteries. J. of Power Sources, 95, 2001,
pp. 2-12
71

Appendices
72

Appendix A:
73
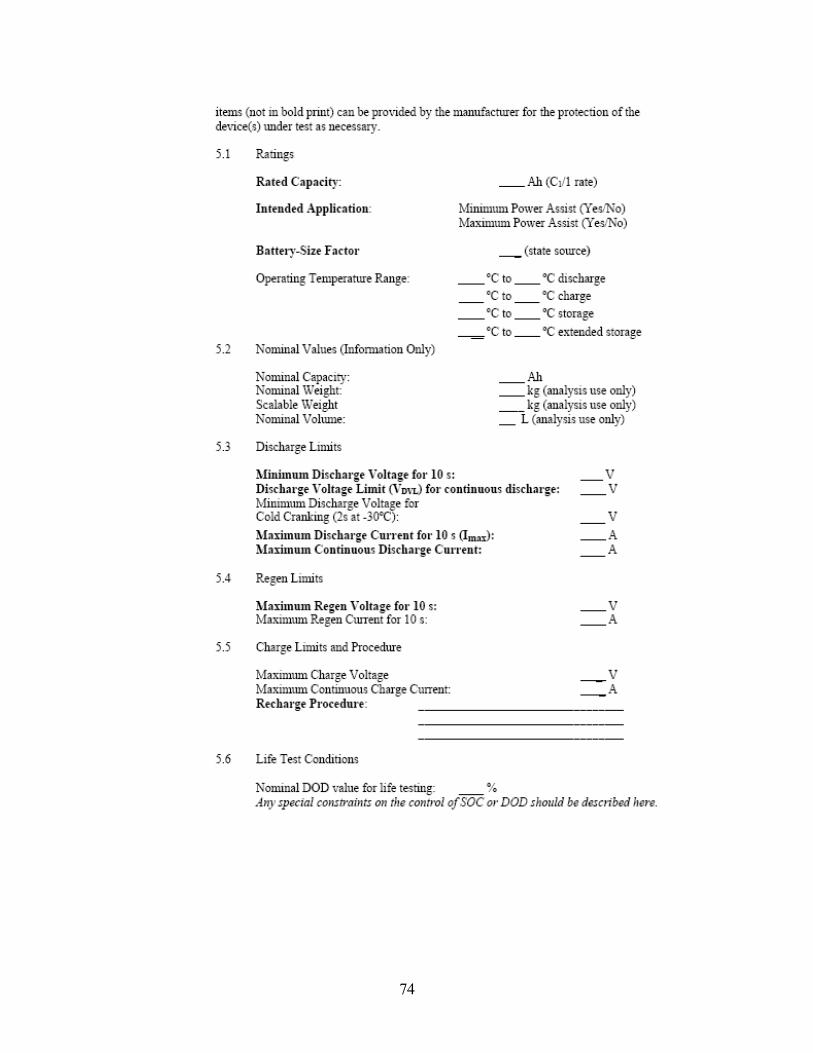
74

75

76

77

78

79

80

81
82

Appendix B: Datasheet of Batteries Used in Experiment Li-ion battery Rated capacity [Ah] 5 Minimum capacity [Ah] 4.6
Nominal voltage [V] 3.6
Maximum charging voltage [V] 4.1 Overcharge protection [V] 4.2 Minimum discharge voltage [V] 2.5 Overdischarge protection [V] 2.2 Series resistance ESR [mΩ] 60 Maximum charging current [A] 5 Maximum discharge current [A] 10 Charging temperature [°C] 0...50 Discharge temperature [°C] -20...60 Weight [g] 150 Volume [l] 0.066
VRLA battery Rated capacity [Ah] 27.5 Nominal voltage [V] 36 Typ. charging voltage [V] 43.2 (2.4 V/cell) Minimum discharge voltage [V] 27.0 (1.5 V/cell) Energy density (50 W) [Wh/kg] 34 Energy density (100 W) [Wh/kg] 31 Energy density (250 W) [Wh/kg] 28 Energy density (500 W) [Wh/kg] 26 Energy density (1000 W) [Wh/kg] 20 Power density (-25°C, 80 % SOC, 50s) [W/kg] 214 Operating temperature [°C] -35...50 Weight [kg] 28 Volume [l] 11.7 (L5 container)
83

Appendix C: Glossary and Abbreviations Anode the electrode in an electrochemical cell at which oxidation takes
place. During discharge, the negative terminal of the cell is the anode; however, during charge, the positive terminal of the cell is the anode. For rechargeable batteries, the electrodes are normally referred to according to the reactions that occur during discharge. average power (kW) Total energy withdrawn (or returned) from (or to) a battery divided by the time of discharge (or charge).
Available Energy the discharge energy available over the DOD range where both the
discharge and regen pulse power goals for a given mode are precisely met. This energy is measured using a C1/1 constant current discharge rate
Available Power the discharge pulse power at which the usable energy is equal to the available energy goal for a given mode
Calendar life The length of time a battery can undergo some defined operation before
failing to meet its specified end-of-life criteria.
Capacity C (Ah) The total number of Ampere-hours that can be withdrawn from a fully
charged battery under specified conditions. C1/1 Rate a current corresponding to the manufacturer’s rated capacity (in
ampere-hours) for a one-hour discharge. For example, if the battery’s rated one-hour capacity is 10Ah, then C1/1 is 10A.
Charge any condition in which energy is supplied to the device rather than
removed from the device. Charge includes both recharge and regen conditions.
ChargeRate Ci /X (A) The current applied to a battery to restore its available
capacity. The current can be expressed in amperes, but more commonly it is normalized to the rated capacity (C) of the battery, and expressed as Ci/X, where i is the hour rate for the rated capacity, and X is a time specification, usually in hours. If i is not given, it is assumed to be the same as X. For example, the 10-hour charge rate of a 500-ampere-hour battery (rated at the 5-hour discharge rate) is expressed as= 50 amperes = C5 /10 rate. In contrast, the capacity of the same battery rated at the 3-hour discharge rate might be 450 Ampere-hours, giving a 10-hour charge rate of 450/10 = 45A = C3 /10 rate.
84

Core PerformanceTests The minimal set of tests that must be initially performed on
every test unit, and which is a subset of the general performance characterization tests
Cycle The period commencing from the start of one charge/discharge to
the start of the next charge/discharge where said period includes discharge time, open-circuit time, and charge time. The depth of discharge (or percentage of capacity) associated with each cycle must be specified.
Cycle Life The number of cycles, each to specified discharge and charge
termination criteria, such as depth-of-discharge, under a specified charge and discharge regime, that a battery can undergo before failing to meet its specified end-of-life criteria. deep discharge A qualitative term indicating the withdrawal of a significant percentage of capacity (typically, 80 percent or more).
Depth-of-Discharge DOD (%) The ratio of the net Ampere-hours discharged from
a battery at a given rate to the rated capacity. discharge Spontaneous conversion of chemical potential energy into electrical energy within a cell, which results from allowing the passage of direct current. discharge regime Schedule used for battery discharge that follows a particular current (or power) versus time sequence. Recharge segments may be included.
Electrode The conducting body that contains active materials and through
which current enters or leaves a cell. Electrolyte The medium that provides ion transport between the positive and
negative electrodes of a cell. It may participate directly in the charge/discharge reactions.
End of Life (EOL) a condition reached when the device under test is no longer capable of
meeting the FreedomCAR goals. This is normally determined from HPPC test results scaled using the
End of Test a condition where life testing is halted, either because criteria specified in the test plan are reached, or because it is not possible to continue testing.
Fully Charged The condition reached by a device when it is subjected to the
manufacturer’s recommended recharge algorithm. This state is defined as 100% State of Charge, or 0% Depth of Discharge.
85
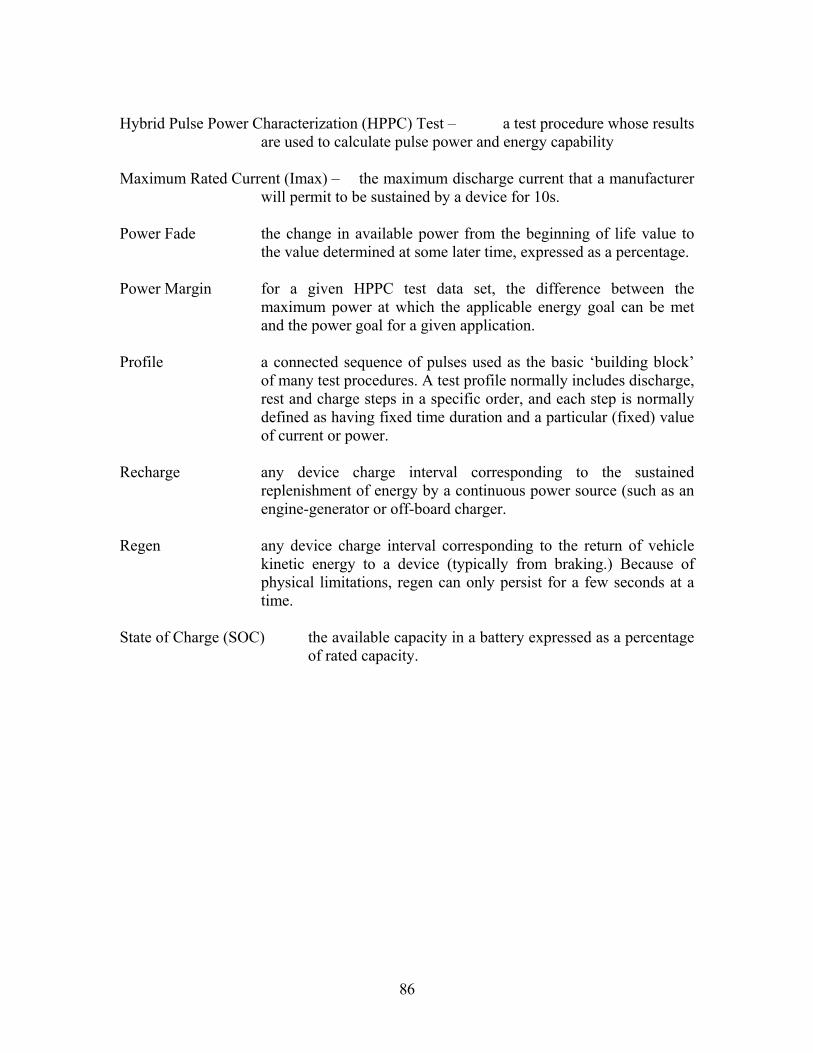
Hybrid Pulse Power Characterization (HPPC) Test – a test procedure whose results
are used to calculate pulse power and energy capability Maximum Rated Current (Imax) – the maximum discharge current that a manufacturer
will permit to be sustained by a device for 10s. Power Fade the change in available power from the beginning of life value to
the value determined at some later time, expressed as a percentage. Power Margin for a given HPPC test data set, the difference between the
maximum power at which the applicable energy goal can be met and the power goal for a given application.
Profile a connected sequence of pulses used as the basic ‘building block’
of many test procedures. A test profile normally includes discharge, rest and charge steps in a specific order, and each step is normally defined as having fixed time duration and a particular (fixed) value of current or power.
Recharge any device charge interval corresponding to the sustained
replenishment of energy by a continuous power source (such as an engine-generator or off-board charger.
Regen any device charge interval corresponding to the return of vehicle
kinetic energy to a device (typically from braking.) Because of physical limitations, regen can only persist for a few seconds at a time.
State of Charge (SOC) the available capacity in a battery expressed as a percentage
of rated capacity.
86