ADVANCED AIRCRAFT PERFORMANCE MODELING …€¦ · system requires planning of traffic flows that...
12
Paper presented at 24th Digital Avionics System Conference, Washington D.C. October 30 – November 3, 2005 ©2005 - The European Organisation for the Safety of Air Navigation (EUROCONTROL). All rights reserved. The content represents the Author’s own views which do not necessarily reflect EUROCONTROL’ official position ADVANCED AIRCRAFT PERFORMANCE MODELING FOR ATM: ENHANCEMENTS TO THE BADA MODEL Angela Nuic, Chantal Poinsot, Mihai-George Iagaru Eurocontrol Experimental Centre, Brétigny sur Orge, France Eduardo Gallo, Francisco A. Navarro, Carlos Querejeta Boeing Research & Technology Europe Madrid, Spain Abstract An efficient Air Traffic Management (ATM) system requires planning of traffic flows that rely on accurate estimation of aircraft performances. New operational concepts, that will ensure seamless management of the forecasted growth of air traffic and provide increased capacity, are based on aircraft trajectory prediction. An aircraft performance model is the core of trajectory computation and therefore plays a central role in the development and evaluation of the future ATM systems. The Eurocontrol Experimental Centre conducts a number of activities in the domain of aircraft performance modeling, which are performed within the scope of B ase of A ircraft Da ta (BADA). This paper briefly introduces BADA, its purpose, application and users. Then it focuses on the BADA model structure and addresses various aspects of aircraft performance modeling for ATM applications. Details on ongoing research effort that looks into enhancements of the BADA model are provided. The work is undertaken in cooperation with Boeing Research & Technology Europe (BR&TE). The advanced approach to aircraft performance modeling is based on exploiting today’s aircraft performance resources, data and software, that were not available in the past when BADA was initially developed. Encouraging results that demonstrate significant improvement in BADA aircraft performance model capabilities are presented in the paper. Introduction An efficient Air Traffic Management (ATM) system requires planning of traffic flows that rely on accurate estimation of aircraft performances. New operational concepts, that will ensure seamless management of the forecasted growth of air traffic and provide increased capacity, are based on aircraft trajectory computation. An aircraft performance model is the core of trajectory prediction and therefore plays a central role in the development and evaluation of the future ATM systems (see e.g. [1], [2] and [3]). There are several existing approaches to aircraft performance modeling to support various needs for aircraft trajectory prediction and simulation. Kinetic approaches model aircraft forces, while kinematic approaches directly model the path characteristics of the aircraft without attempting to model the underlying physics. Depending on the approach and techniques used in modeling there are different forms of Aircraft Performance Models (APM). Typical examples that are used today are introduced and described in [2]. B ase of A ircraft Da ta (BADA) is an aircraft performance database based on the kinetic approach to aircraft performance modeling that has been developed and maintained by the Eurocontrol Experimental Centre (EEC). The information provided in BADA is designed for use in trajectory simulation and prediction in ATM research as well as for modeling and strategic planning in ground ATM operations. Historically, within the EEC, the accuracy of aircraft performance modeling was of significant importance to achieve realistic aircraft performances in a simulation environment. This paper focuses on research effort and the latest achievements in the domain of aircraft performance modeling undertaken by the EEC within the scope of BADA. The paper is structured in three parts. In the first part, an overview of the BADA model
Transcript of ADVANCED AIRCRAFT PERFORMANCE MODELING …€¦ · system requires planning of traffic flows that...

Paper presented at 24th Digital Avionics System Conference, Washington D.C. October 30 – November 3, 2005
©2005 - The European Organisation for the Safety of Air Navigation (EUROCONTROL). All rights reserved. The content represents the Author’s own views which do not necessarily reflect EUROCONTROL’ official position
ADVANCED AIRCRAFT PERFORMANCE MODELING FOR ATM: ENHANCEMENTS TO THE BADA MODEL
Angela Nuic, Chantal Poinsot, Mihai-George Iagaru Eurocontrol Experimental Centre, Brétigny sur Orge, France
Eduardo Gallo, Francisco A. Navarro, Carlos Querejeta Boeing Research & Technology Europe Madrid, Spain
Abstract
An efficient Air Traffic Management (ATM) system requires planning of traffic flows that rely on accurate estimation of aircraft performances. New operational concepts, that will ensure seamless management of the forecasted growth of air traffic and provide increased capacity, are based on aircraft trajectory prediction. An aircraft performance model is the core of trajectory computation and therefore plays a central role in the development and evaluation of the future ATM systems.
The Eurocontrol Experimental Centre conducts a number of activities in the domain of aircraft performance modeling, which are performed within the scope of Base of Aircraft Data (BADA).
This paper briefly introduces BADA, its purpose, application and users. Then it focuses on the BADA model structure and addresses various aspects of aircraft performance modeling for ATM applications.
Details on ongoing research effort that looks into enhancements of the BADA model are provided. The work is undertaken in cooperation with Boeing Research & Technology Europe (BR&TE). The advanced approach to aircraft performance modeling is based on exploiting today’s aircraft performance resources, data and software, that were not available in the past when BADA was initially developed.
Encouraging results that demonstrate significant improvement in BADA aircraft performance model capabilities are presented in the paper.
Introduction An efficient Air Traffic Management (ATM)
system requires planning of traffic flows that rely
on accurate estimation of aircraft performances. New operational concepts, that will ensure seamless management of the forecasted growth of air traffic and provide increased capacity, are based on aircraft trajectory computation. An aircraft performance model is the core of trajectory prediction and therefore plays a central role in the development and evaluation of the future ATM systems (see e.g. [1], [2] and [3]).
There are several existing approaches to aircraft performance modeling to support various needs for aircraft trajectory prediction and simulation. Kinetic approaches model aircraft forces, while kinematic approaches directly model the path characteristics of the aircraft without attempting to model the underlying physics. Depending on the approach and techniques used in modeling there are different forms of Aircraft Performance Models (APM). Typical examples that are used today are introduced and described in [2].
Base of Aircraft Data (BADA) is an aircraft performance database based on the kinetic approach to aircraft performance modeling that has been developed and maintained by the Eurocontrol Experimental Centre (EEC). The information provided in BADA is designed for use in trajectory simulation and prediction in ATM research as well as for modeling and strategic planning in ground ATM operations.
Historically, within the EEC, the accuracy of aircraft performance modeling was of significant importance to achieve realistic aircraft performances in a simulation environment.
This paper focuses on research effort and the latest achievements in the domain of aircraft performance modeling undertaken by the EEC within the scope of BADA.
The paper is structured in three parts. In the first part, an overview of the BADA model

structure and aspects of the model identification process are given, followed by information on the state-of-the-art of the current BADA version. The second part is dedicated to the research work on the model enhancements. It describes approach and methodology and provides results of the BADA model improvement. Conclusions are summarized in the third part.
BADA Model overview
Model Structure and Main Features The APM adopted by BADA is based on a
mass-varying, kinetic approach. This approach models an aircraft as a point and requires modeling of underlying forces that cause aircraft motion.
The structure of BADA APM is represented in figure 1.
Figure 1 Structure of BADA APM
As depicted in figure 1, the BADA APM is
structured in 5 models, namely Actions, Motion, Operations, Limitations and Aircraft Characteristics. The dependencies among the models are represented with dashed arrows (which point towards the models that the one at the origin of the arrow depends upon).
Actions This model allows computing the forces acting
on the aircraft which cause its motion. There are three categories of actions: aerodynamic (namely drag D and lift L), propulsive (thrust T) and gravitational (weight W). Since BADA accounts for mass variation, the propulsive model provides an associated model to compute fuel consumption F.
Motion Total Energy Model or TEM relates the
geometrical, kinematic and kinetic aspects of the aircraft motion, allowing the aircraft performances and trajectory to be calculated. TEM equates the rate of work done by forces acting on the aircraft to the rate of increase in potential and kinetic energy, that is:
( )..vmvhWvDT +=− (1)
where h is altitude, .h is vertical speed, v is true
airspeed (TAS) and m is aircraft mass. To facilitate calculations, equation (1) can be
rearranged and vertical speed expressed as
ESFvmg
DTh ⋅
−=.
(2)
where g is the gravity and 1
1−
+=
dhdv
gvESF (3)
is the energy share factor.
The variation of mass is accounted for through the fuel consumption model:
Fm −=.
(4)
Equations (2) and (4) together form an Ordinary Differential Equations (ODE) system which can be posed with the respective initial or boundary conditions at each flight segment to compute the aircraft motion in that interval. The computed aircraft trajectory is, then, the result of concatenating the solutions of a sequence of such motion problems.
Operations Although the ODE system above governs any
possible aircraft motion, different ways of operating the aircraft result in different trajectories. For instance, flying constant Mach number leads to the following specific form [4] of equation (3):
12
21
−
+= M
gRESF Tβκ (5)
where κ is the air adiabatic index, R is the specific gas constant, βT is the temperature gradient of the particular atmosphere layer considered, M is Mach number. Analogously, flying constant calibrated airspeed (CAS) leads to a different form of equation (3) and
<<model>> Aircraft Characteristics
<<model>> APM
<<model>> Actions
<<model>> Motion <<model>>
Operations <<model>>Limitations

so on for other flight regimes other than constant CAS/Mach.
The Operations model is responsible for capturing those aspects (such as the ESF), which are neither directly related to actions nor motion laws, but which are necessary to incorporate into the problem of computing aircraft motion, the knowledge about the way in which the aircraft is operated.
The Operations model is conceived to fill the gap between the Actions and Motion models. Thus, provided that the way of operating the aircraft is known (e.g. constant CAS), the Operations model provides the features that are needed to bring actions and motion together thereby closing the mathematical problem to compute the resulting aircraft trajectory –e.g. the model expressed in (5).
Limitations Limitations restrict the aircraft behavior in
order to keep it between certain limits to safeguard the safe operation of the aircraft, or limit the equipment degradation. The applicable limitations have been classified into four categories, namely geometrical, kinematic, dynamic and environmental. Geometrical limitations include the maximum certified altitude, maneuver limited altitude etc. Kinematic limitations refer to speed limitations such as maximum operating airspeed/Mach (VMO/MMO), low and high speed buffet, landing gear and flaps speed limits and the speeds that serve to define maneuver envelope. Dynamic limitations include throttle limits for standard ratings and aircraft weights such as the maximum takeoff weight (MTOW), maximum payload (MPL) etc. Finally, environmental limitations include stand for the environmental envelope.
Aircraft Characteristics Each aircraft is described with a set of
coefficients which represent characteristics used by the previous models, but that are intrinsic to the aircraft, such as the aerodynamic reference area, wing span, etc.
Model Instances for Specific Aircraft Once aircraft model components, structure and
algorithms are defined, identification of a model instance for a specific aircraft type can take place.
This process specifies corresponding aircraft model parameters and coefficients aiming to achieve the best fit between calculated and reference aircraft performance data.
Aircraft Performance Reference Data Aircraft type identification depends and
heavily relies on availability, type and quality of aircraft performance reference data.
In the past, the main sources of aircraft performance reference data were Aircraft Operation Manuals (AOMs), published by aircraft manufacturers or operating airlines. From aircraft performance modeling perspective, AOMs provide valuable information on aircraft limitations, performances and operating procedures for all aircraft types that have ever been put in operation.
Aircraft performances are given in form of integrated flight profiles that specify time, distance and fuel to climb/descent to/from specific flight level. Data is given for number of flight levels, with variable altitude step that sometimes results in low number of data points. Depending on source AOM, time to climb or decent is rounded to minute which inevitably reduces precision of the data. Due to the intended purpose of AOM, aircraft performance data for nominal aircraft operating speeds in climb, cruise and descent is only provided.
Nowadays, aircraft manufacturers develop aircraft performance engineering programs that can provide a high quality aircraft performance reference data. These programs allow generation of reference data for complete range of aircraft operating conditions in terms of weight, speeds, ISA and associated operating regimes with high level of data granularity (number of data points) and data precision. Currently, such programs exist for limited number of aircraft types (e.g. INFLT/REPORT Boeing Performance Software, PEP Airbus Performance Engineering Program. However, it is to expect that, in the future, similar capabilities will be provided for all aircraft types.
Existence of this type of data opens new horizons in the domain of aircraft performance modeling which is demonstrated in this paper.
Aircraft Model Instance Identification BADA represents an aircraft as a point and
requires modeling of the resulting longitudinal

forces affecting this point – thrust and drag, while fuel flow is modeled as a function of thrust.
As the original aircraft data for thrust, drag and thrust specific fuel consumption was, and still is not easily available, a choice was made to use aircraft profile data for BADA aircraft model identification.
The ODE system formed by equations (2) and (4), together with equation (6) below provides the way to compute flight profiles based on BADA, once the model coefficients for thrust, drag and fuel consumption are known.
γcos.
⋅= vr (6)
where .r is the horizontal speed and γ is the flight
path angle. The objective of model identification process
is to obtain the optimum coefficients from a set of known flight data points. Since the ODE system is the law that governs trajectory generation according to BADA model, it can be used for coefficient identification purposes (left side values of expressions (2), (4) & (6) are the observed values while right side values are the predicted values by means of the BADA model).
The better the expressions above predict the
observed derivatives .h and
.r , the more accurately
the trajectory resulting from integration of such derivatives will fit the observed ones.
Adopted optimization solution is least squares (LS) solution that minimizes the sum of square
errors (SSE) of vertical speed .h as defined in
expression:
( )∑=
−−=
n
ii
i
iii
i
ih
ESFgm
vDThSSE
1
2
. (7)
where the referred errors are the differences
between the observed (reference) values of .h and
the predicted ones. n is the total number of data samples through all the trajectories considered for the given aircraft type.
To measure goodness of a specific model, the RMS metric defined as RMS=(SSE/n) ½ is used. This metric provides a measure of how well a specific model fits the reference data used to derive the model in terms of vertical speed.
A similar approach is taken for optimization of the fuel flow. In that case, the SSE is computed as
∑=
+=
n
iii
mFmSSE
1
2.
. (8)
Current BADA model The current BADA model was first developed
in the early 1990’s taking into consideration existing aircraft reference data availability, computing resources and target applications requirements. The main requirement at the time was to realistically simulate en-route aircraft behavior under nominal operating conditions. From user’s perspective ensuring large coverage of aircraft types was another important objective for BADA to meet.
Aircraft types coverage The latest version of BADA provides 99.14%
coverage of the European fleet mix [4]. 88 aircraft types are developed from original aircraft data and are referred to as original models. Additional 204 aircraft types may be simulated as being equivalent to an original model.
Model structure Current BADA defines models for aircraft
forces (aerodynamic and propulsive), limitations and operations for en-route and Terminal Maneuvering Area (TMA) operations.
Drag for aircraft clean and non-clean configurations, thrust and fuel flow models for maximum climb, maximum cruise and descent thrust levels for three engine types (jet, turboprop and piston) are provided.
Governed by TEM, operations model supports simulation of flight regimes where any two of three variables of thrust, speed or vertical speed can be controlled, while third one is calculated.
Standard airline procedure models for climb, cruise and descent, parameterized by BADA, are also provided.
Limitations model defines maximum speeds and altitudes, minimum speeds at different aircraft configurations including low speed buffeting.
Further details on the current BADA model are provided in reference document [4].

Model identification and accuracy levels Aircraft profile data used for identification of
the current BADA aircraft models (3.x family) come from AOMs or aircraft performance software data sources that are available at Eurocontrol. The type and quality of the available reference data vary in function of aircraft type. In principle, available data with the best quality is used to identify the aircraft model coefficients. The existing aircraft models are regularly updated, provided that the better quality data becomes available.
The latest version of BADA (3.6) provides native model instances for 88 aircraft types. 56 of them are generated using AOM type of reference data and represent 27% of the European air traffic. Remaining 32 aircraft models are based on the aircraft performance engineering programs data and account for 55% of the European traffic.
The coefficient optimization tools, appropriate fitting schemes and modeling techniques have been developed to identify the aircraft model coefficients from different types of the reference data. The objective of the model identification is to obtain as small as possible value of RMS error for vertical speed and fuel consumption.
To ensure that obtained coefficients robustly represent aircraft behavior over normal operation conditions, a variety of flight profiles that cover operations of aircraft for different speeds, aircraft masses and ISA conditions are required. These can be specified as:
• descent profiles at ISA for nominal aircraft weight at low, nominal and high speed
• climb profiles at ISA and off ISA conditions (up to ISA +20) for min, nominal and max aircraft weight at low, nominal and high speed
• cruise fuel flow data at ISA conditions for min, nominal and max aircraft weight at nominal speed
The available aircraft performance reference data does not always cater for this requirement of aircraft flight envelope coverage. In this case an aircraft model can be identified, but its fidelity can only be assessed and guaranteed for the range of reference data conditions.
Most of the aircraft types currently modeled in BADA demonstrate mean RMS error in vertical speed lower than 100 feet per minute [fpm], over previously specified normal operation conditions. This corresponds to mean error of vertical speed lower then 5% for operational range of flight envelope under assumption that 2000 fpm is an average vertical speed value. Fuel consumption is modeled with mean error lower than 5% for the same conditions. An example of vertical speed RMS error in fpm for 13 climb (CL) profiles of a wide body aircraft in BADA 3.6 is given in table 1.
Table 1. Mean RMS Errors in ROC over 13 Climb Profiles
CL 1 2 3 4 5 6 7 8 9 10 11 12 13
RMS [fpm]
74 52 29 98 69 47 72 63 77 94 86 71 83
Model limitations The advanced model optimization tools and
newly available high quality reference data have been used to study ability of the current BADA model to capture aircraft performances over the whole flight envelope and to identify levels of accuracy that are achievable.
For this reason, two model instances (two sets of coefficients) based on the current BADA model structure and algorithms were developed for a number of aircraft models using same type and source of the reference data, but covering different range of operating conditions.
First model instance was obtained from the reference data covering the normal operations range as specified before (in total 25 climb and descent flight profiles). The second model instance was developed by using 324 flight profiles covering complete aircraft speed and weight flight envelope from ISA+0 up to ISA+30 conditions. The accuracy of the model was analyzed in terms of mean RMS and absolute error in vertical speed.
In the first case, current BADA model have demonstrated its ability to ensure good level of accuracy for range of aircraft normal operating conditions with RMS vertical speed error less then 100 fpm.
In the latter case, when model tried to capture aircraft behavior over the whole flight envelope,

overall RMS vertical speed error increased to 300 fpm or more depending on aircraft type.
A graphical example of absolute error in vertical speed under ISA+0 conditions for the two model instances is depicted in Figure 2 and 3 for B744 aircraft.
Figure 2 shows absolute error over 18 profiles in climb and descent, covering aircraft normal operation envelope for the first model instance.
Figure 2. Absolute Error of .h [fpm] for 18 climb
and descent profiles, ISA+0, Mach 0.48-0.88
The absolute error in vertical speed for
majority of the data points remains below 100 fpm.
Figure 3 shows absolute error over 81 profiles in climb and descent, covering complete aircraft envelope for the second model instance.
Figure 3. Absolute Error of .h [fpm] for 195
Climb &Descent Profiles, ISA+0, Mach 0.26-0.9
As it can be seen from the central part of the graph, representing normal operating conditions, the absolute error is still around 100 fpm. However, the absolute error increases towards the edges of the flight envelope and becomes greater then 300 fpm.
These results demonstrate the current BADA model’s ability to accurately model aircraft performances for normal operation conditions. Accuracy decrease at the marginal parts of the flight envelope indicates that similar level of accuracy can not be provided for a complete flight envelope, with current model structure and algorithms.
This has been identified as one of the areas of the future model improvement and will be further discussed in the continuation of the paper.
Towards BADA 4.0
Time for Enhancement Since the time BADA was first developed,
applications relying on APM have broadened significantly with new requirements to provide more and better features to support the increasing analysis and operational needs in ATM.
The new requirements relate to accuracy of the modeled aircraft performances, the coverage of the complete aircraft operation envelope, the flight phases that can be represented, and the type of operations that an APM can support.
To satisfy those requirements, today’s availability of aircraft manufacturer’s performance software facilitates the automated use of better quality reference data.
On top of that, computing technology has evolved in such a way that currently available computing capabilities have outdated the previous need to over-rationalize the necessary computing resources.
Finally, Object Oriented Programming (OOP) and adoption of the Unified Modeling Language (UML) as the industry-wide modeling standard, now make easier to develop well-defined models and manage complexity.
All the above circumstances now enable a different approach to aircraft performance modeling
M
Hp
Hp
M

and will be used to support enhancement of the BADA model.
Advanced Model Engineering for BADA Advanced Model Engineering for BADA
(AMEBA) is an on-going research effort that supports definition of the next-generation BADA APM (referred to as BADA 4.0). The work is performed in cooperation with Boeing Research & Technology Europe by taking advantages of today’s aircraft performance reference data, computing capabilities and modeling techniques.
Main objectives are to provide a realistic, accurate, and complete aircraft performance model:
• capable of supporting accurate computation of the geometric, kinematic and kinetic aspects of the aircraft behavior
• applicable to a wide set of aircraft types, over the entire operation envelope, and in all phases of flight
• with reasonable complexity, maintainability and computing requirements
• susceptible of being identified from profile data
The execution of AMEBA is divided in two phases. Phase 1, Improvement, has already been executed. Phase 2, Extension, is under its way.
This paper presents details of the Phase 1, which focuses on improvement of model accuracy for en-route operations. For this purpose, new models for thrust, drag and fuel consumption have been developed and validated using aircraft manufacturer raw data.
Modeling Premises AMEBA focuses on ‘modeling’ activities in
two senses: physical and systemic. Physical modeling involves the analysis of the underlying physical laws governing aircraft behavior and identification of the physical variables upon which aircraft performance is to be represented together with the selection of appropriate mathematical models to relate them. Systemic modeling refers to the way of organizing the APM architecture (structure and functions) as a system so functional requirements are met (e.g. provision of drag, thrust and fuel flow), together with an adequate balance of
model performance with respect to non-functional requirements (e.g. realism, accuracy, complexity, completeness, maintainability, etc).
With the aim to achieve the best possible compromise among all the requirements that the future BADA model should satisfy, the following premises have been considered, based on state-of-the-art knowledge and techniques:
i) An in-depth review of Flight Dynamics fundamentals underlying aircraft behavior has been conducted, under no simplifying assumptions other than those reasonable in the ATM context (e.g. no sideslip). This allows the model development to remain as generic as possible until further simplifications are introduced by applications for specific purposes.
ii) Dimensional Analysis (DA) techniques [8] were applied to identify the right physical dependencies for the mathematical models created to represent the required aircraft performances (drag, thrust, fuel consumption, etc). Use of proper physical dependencies allows the elaboration of mathematical models that obtain higher accuracy with a smaller number of coefficients.
Additionally, DA techniques allow isolating the model interfaces (which are based on the right physical dependencies) from the particular modeling and implementation decisions adopted (i.e. the specific mathematical models chosen to relate physical variables). This helps to discover the ‘natural’ architecture of the APM and minimizes the impact of future changes.
Finally, through the application of DA techniques, the physical relationships are obtained in terms of dimensionless variables. This facilitates analysis and comparisons, prevents mistakes and, provided an adequate selection of dimensionless terms, allows discovering physical similarity relationships.
iii) Use of Object Oriented Modeling (OOM) principles to identify the right roles and responsibilities of the different components encompassing the APM architecture.
OOM principles effectively allow managing complexity and prevent taking inappropriate design decisions, thus leading to a more robust model organization.
Methodology The methodology followed during the
AMEBA modeling effort using above described premises is now explained.
Starting point After the review of aircraft performance
fundamentals new dependencies for drag, thrust and fuel consumption models have been obtained through DA techniques.
i) Drag is calculated through the drag coefficient CD, expressed as a function of lift coefficient CL and Mach number1 M as
D=½κp0SδM2CD CD=f(CL,M) (9)
where δ=p/p0 is the pressure ratio, p being the local pressure and p0 the standard pressure at mean sea level (MSL).
ii) Thrust is calculated through the new dimensionless thrust coefficient CT as
T/δ=WMTOW CT (10)
where WMTOW is the maximum takeoff weight and, for idle thrust (IDLE) CT has the form
CT=f(M,δ) (11)
while for maximum takeoff (MTKOF), maximum climb (MCMB) and maximum cruise (MCRZ) engine ratings2, CT represents the so-called generalized thrust model, which depends on the Mach number and the throttle parameter δT
CT=f(M,δT) (12)
In those cases, separate laws for δT are provided for the off-ISA atmosphere conditions characterized by ∆TISA below and above the so-called blink point3 TBP:
δT=f(M,δ) for ∆TISA <TBP (13)
1 Compressibility effects have been taken into account by means of the Prandtl-Glauert compressibility correction factor PG=(1-M2) ½ to enhance the accuracy of the aerodynamic model. 2 For the sake of simplicity, only the thrust coefficient for jet, turbofan and turboprop engines is presented. In all those cases, the physical dependencies are the same and the concept of engine rating is applicable. This concept is introduced to enhance the accuracy and realism of the propulsion model. 3 Blink point is the design temperature at which the engine throttle starts to be limited by temperature. In almost all modern jet engines, it is ISA+10.
δT=f(M,θT) for ∆TISA≥ TBP (14)
where θT= [1+M2( κ-1)/2]θ is the total temperature ratio; θ=T/T0 being the temperature ratio, T the local temperature and T0 the standard one at MSL.
iii) Fuel consumption is calculated through the new dimensionless fuel coefficient CF as:
F=LHV-1WMTOW a0δθ½CF CF=f(M,CT) (15)
where a0 is the sound speed at MSL and LHV is the lower heating value.
Step 1 – Model Selection Once the true physical dependencies where
determined in terms of physical (dimensionless) variables, as shown in the previous section, step 1 of the methodology focused on selecting appropriate mathematical model specifications for those dependencies.
The use of polynomial functions was preferred to keep complexity under manageable limits. Several candidate model specifications, of different number and combination of terms, were fitted by least square techniques. The data used to fit these models was raw drag, thrust, and fuel consumption from a selection of six different Boeing airplanes of different size and technology. This data is composed of a fine grid of experimental numbers covering the whole operational envelope.
Standard statistical metrics, such as the RMS and the maximum signed difference (SMAX)4, were used to assess the fitting accuracy of the different model specifications for each individual aircraft. Aggregate metrics, namely the mean of the RMS and maximum unsigned difference (UMAX) for the six aircraft considered, remove the particularities of individual aircrafts.
These aggregated metrics were used to evaluate the accuracy of the different proposed model specifications. The needed accuracy was a subjective decision (variable for each model), and the selected models obtain that accuracy with the minimum possible number of coefficients. At the begging of the process, it was not possible to set the exact target value for the model accuracy and number of coefficients. The new models were tested
4 As the fitting errors obtained by least squares are randomly positive or negative, their mean is always very close to zero. This is the reason why only RMS and SMAX were used.

and analyzed in an attempt to obtain the best compromise between the model accuracy and number of coefficients. Multiple trials were performed to find the specific terms that provided the necessary level of accuracy with the minimum number of terms.
The selected polynomials for generalized thrust CT resulted in 6 terms with maximum powers of two.
The flat rating model for throttle parameter δT has 7 terms and power of two while temperature-limited rating model has 9 terms and power of two. Fuel flow model results in 7 terms and power of 3.
For the drag polar model, a slightly higher number of terms (15 coefficients, and powers of 7) has been necessary to account for the big increases in drag caused by compressibility and buffeting effects that occur at high M and CL values, respectively.
A careful and throughout analysis of results led to the decision to keep these models as the ones that provide a good compromise between accuracy and complexity.
Step 2 – Model Identification Scheme In this step a model identification scheme was
developed, based on the model specifications obtained in step 1. Reference performance data considered this time was trajectory data generated with Boeing performance software, instead of raw data for thrust, drag and fuel flow.
The reference trajectories were selected as the combinations of:
• different aircraft masses (ranging from OEW to MTOW)
• ISA conditions (ranging from ISA-20 to ISA+30)
• constant CAS/Mach speed schedules from 45% to 100% of maximum operating speed (VMO) and Mach (MMO)
• IDLE, MCMB and MCRZ engine ratings
Up to a total of 1690 trajectories were considered for each aircraft so as to represent the whole operation envelope.
Used fitting scheme optimizes at the same time drag and thrust coefficients through the application of the TEM equation with vertical speed as the
observed variable, and drag and thrust as the modeled ones. Fuel coefficients are obtained later on in a decoupled way. For the sake of maintainability, it is worth it to notice that the identification process is fully automated and no human intervention is required.
Step 3 – Sensitivity Analysis When building physical models, an essential
issue is to determine up to which point the model ability to capture the underlying phenomenon depends on the reference data used to fit its coefficients. Assessing this influence is important in order to avoid overfitting5 as well as to determine the minimum set of reference data needed to obtain an acceptable model instance.
Bearing that in mind, a sensitivity analysis was conducted, starting with the reference set of Step 2, which remained as the validation set through the entire exercise. Then, selected trajectories where progressively discarded, paying attention to the fact that the remaining ones kept distributed over the whole operation envelope. As the number of trajectories decreased, they continued to cover the complete flight envelope, but in an ever coarser way when compared with the fine grid represented by the initial set of trajectories.
Each time that a number of trajectories were removed, the model identification scheme of Step 2 was applied again with the remaining ones as the reference trajectory data set. The resulting models where assessed against the validation set using analogous metrics as in Step 1 applied to several performance aspects, namely vertical speed, drag, thrust and fuel consumption.
The results showed that no significant accuracy degradation occurred until the number of trajectories fall bellow 324. A noticeable fact is that, as expected from the analytical review, only one ISA condition was needed to cope with the model identification of thrust engine rating models below the blink point.
5 A model is said to exhibit overfitting if the accuracy of model predictions is very good when reproducing the reference data used to fit its coefficients but degrades significantly when reproducing other data different than the reference one.

Step 4 – Comparison vs. Current Model Finally, a comparison was carried out between
the new drag, thrust and fuel models and the ones specified in current BADA with the aim to, first, assess how the new and current models perform over the whole aircraft operation envelope and, second, determine an upper limit of the improvement achievable with the new models versus the current ones.
To that end, the all current and new models were fitted using the model identification scheme of Step 2 with the same reference data set, which was the minimum one determined over the Step 3. The validation dataset of Step 3 for each aircraft type was considered as the ‘true data’. A total of 18 Boeing plus 4 McDonnell Douglas aircraft where considered in the analysis. In parallel, 3 additional aircraft types of a different aircraft manufacturer were analyzed.
Model Improvement Results The results obtained from all the 25 aircraft
used in the comparison performed in Step 4 are presented in terms of vertical speed, drag, MCMB thrust and fuel consumption. Sample graphics below are provided for the B773 aircraft model.
Vertical Speed Error Over the complete operations envelope, the average error in vertical speed is reduced by a margin of 451%, from 314 fpm in current 3.x to 70 fpm in BADA 4.0. As average values of vertical speed are around 2000 fpm, the average error is well below 5%.
Color maps for both BADA 3.x and 4.0 models represent the B773 vertical speed error in function of Mach and pressure altitude, for ISA+15.
Figure 4. Absolute Error of .h [fpm] – BADA 3.x
Figure 5. Absolute Error of .h [fpm] – BADA 4.0
Drag Coefficient Error
The average error is reduced by a margin of 577%, from a drag coefficient CD error of 0.0116 to 0.00201. As average values of the drag coefficient are around 0.02, the average error is below 10%.
Thrust Error The average error for MCMB is reduced by of
375%, from a thrust coefficient CT error of 0.0208 to 0.00556. Average CT values are between 0.1 and 0.35, so the mean error is well below 10%. Similar numbers are obtained for MCRZ rating.
Color maps represent the B773 MCMB thrust coefficient error at ISA+15, as a function of the Mach number and the pressure altitude.
Figure 6. Absolute Error CT – BADA 3.x
Figure 7. Absolute Error CT – BADA 4.0
Hp
M
Hp
M
Hp
M
Hp
M
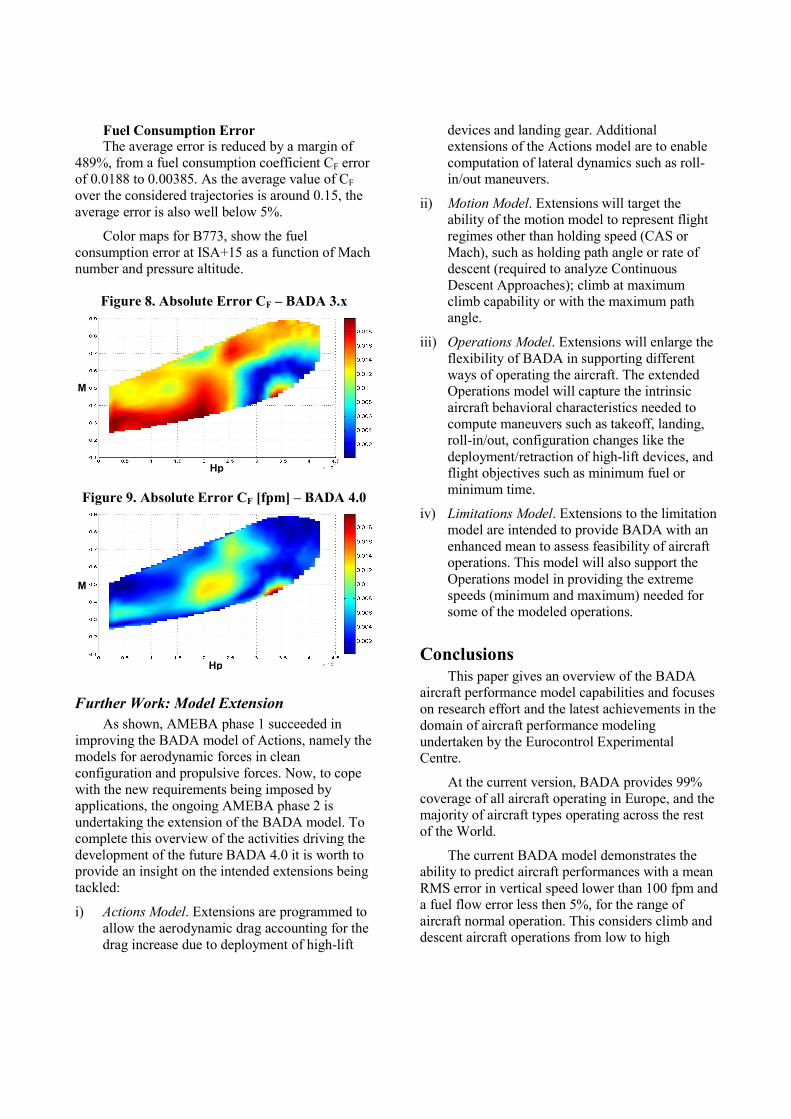
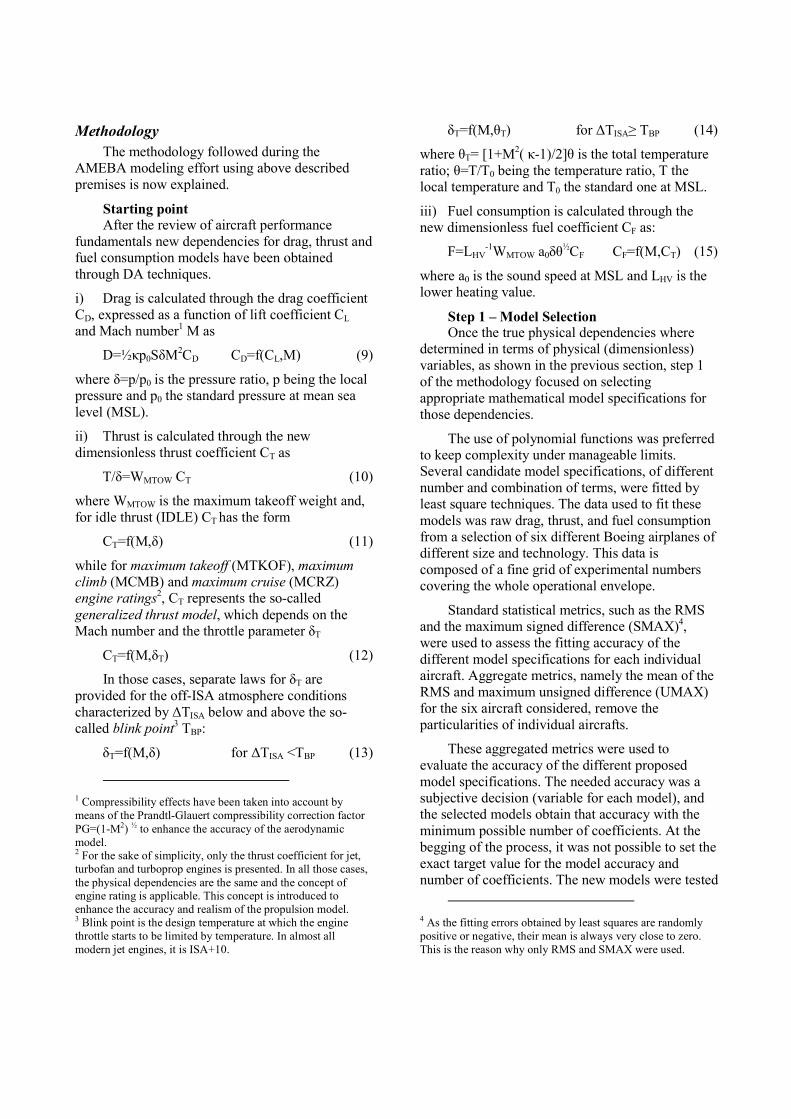
Fuel Consumption Error The average error is reduced by a margin of
489%, from a fuel consumption coefficient CF error of 0.0188 to 0.00385. As the average value of CF over the considered trajectories is around 0.15, the average error is also well below 5%.
Color maps for B773, show the fuel consumption error at ISA+15 as a function of Mach number and pressure altitude.
Figure 8. Absolute Error CF – BADA 3.x
Figure 9. Absolute Error CF [fpm] – BADA 4.0
Further Work: Model Extension As shown, AMEBA phase 1 succeeded in
improving the BADA model of Actions, namely the models for aerodynamic forces in clean configuration and propulsive forces. Now, to cope with the new requirements being imposed by applications, the ongoing AMEBA phase 2 is undertaking the extension of the BADA model. To complete this overview of the activities driving the development of the future BADA 4.0 it is worth to provide an insight on the intended extensions being tackled:
i) Actions Model. Extensions are programmed to allow the aerodynamic drag accounting for the drag increase due to deployment of high-lift
devices and landing gear. Additional extensions of the Actions model are to enable computation of lateral dynamics such as roll-in/out maneuvers.
ii) Motion Model. Extensions will target the ability of the motion model to represent flight regimes other than holding speed (CAS or Mach), such as holding path angle or rate of descent (required to analyze Continuous Descent Approaches); climb at maximum climb capability or with the maximum path angle.
iii) Operations Model. Extensions will enlarge the flexibility of BADA in supporting different ways of operating the aircraft. The extended Operations model will capture the intrinsic aircraft behavioral characteristics needed to compute maneuvers such as takeoff, landing, roll-in/out, configuration changes like the deployment/retraction of high-lift devices, and flight objectives such as minimum fuel or minimum time.
iv) Limitations Model. Extensions to the limitation model are intended to provide BADA with an enhanced mean to assess feasibility of aircraft operations. This model will also support the Operations model in providing the extreme speeds (minimum and maximum) needed for some of the modeled operations.
Conclusions This paper gives an overview of the BADA
aircraft performance model capabilities and focuses on research effort and the latest achievements in the domain of aircraft performance modeling undertaken by the Eurocontrol Experimental Centre.
At the current version, BADA provides 99% coverage of all aircraft operating in Europe, and the majority of aircraft types operating across the rest of the World.
The current BADA model demonstrates the ability to predict aircraft performances with a mean RMS error in vertical speed lower than 100 fpm and a fuel flow error less then 5%, for the range of aircraft normal operation. This considers climb and descent aircraft operations from low to high
Hp
M
Hp
M

operating speeds (as operated by airlines) at weights ranging from minimum to maximum weight and ISA+0 to ISA+20 conditions.
The research work was performed in cooperation with BR&TE to investigate how and to what extend enhancements of the BADA aircraft performance model are possible by exploiting today’s aircraft performance resources, data and software that were not available in the past, when the BADA was initially developed.
Encouraging results are obtained which demonstrate that substantial room for improvement exists in terms of model accuracy over the complete aircraft operation envelope.
New developed models for drag, thrust and fuel ensured significant improvement in modeling the vertical speed. For a validation set of 25 aircraft types the mean error in vertical speed is less then 70 fpm and the fuel flow error well below 5% for the complete aircraft operations envelope. This considers climb and descent aircraft operations from minimum to maximum operating speeds (VMO/MMO), aircraft weights ranging from Operational Empty Weight to Maximum Take off weight and ISA-20 to ISA+30 conditions.
The modeling of underlying aircraft forces has been improved and ensuring accurate estimation of drag, thrust and fuel consumption. The more realistic and accurate modeling of forces and fuel will enable the computation of new flight regimes such as climb at maximum climb capability or minimum fuel, that where untreatable with the current model.
The work on the BADA model enhancement is continuing. The aim is to supply BADA with the necessary capabilities to support TMA (Terminal Maneuvering Area) operations involving non-clean aerodynamic configurations, as well as the airport related operations, such as take-off, landing and taxiing.
Acknowledgments The authors wish to express their gratitude to
all BADA users, who for many years, provided their feedback on BADA as well as constructive input for the definition of the BADA development strategy.
References [1] Eurocontrol ATM Strategy for the Years 2000+, 2003, Brussels, Belgium.
[2] Suckhov, Alexander et al., 2003, Aircraft Performance Modeling for Air Traffic Management Applications, 5th USA/Europe Seminar on ATM R&D Budapest, Hungary.
[3] Swierstra, S., S. Green, 2003, “Common Trajectory Prediction Capability for Decision Support Tools”, 5th USA/Eurocontrol ATM R&D Seminar, Budapest, Hungary.
[4] Eurocontrol, 2004, Coverage of European Air Traffic with BADA 3.6, EEC Note No. 13/04.
[5] Eurocontrol, 2004, User Manual for the Base of Aircraft Data (BADA) Revision 3.6, EEC Note No. 10/04.
[6] ICAO DOC-7488/3. International Standard Atmosphere. 2000.
[7] Hoffman, Eric, 1993, Contribution to Aircraft Performance Modeling for ATC use, EEC Report No.258.
[8] Thomas Szirtes. Applied Dimensional Analysis and Modeling. McGraw-Hill. 1997.
Contact information [email protected]
http://www.eurocontrol.fr/projects/bada
24th Digital Avionics Systems Conference October 30, 2005