
Advanced Aerodynamic Design of Passive Porosity …mln/ltrs-pdfs/NASA-aiaa-2001-0249.pdfporosity...
30
39th AIAA Aerospace Sciences Meeting & Exhibit 8-11 January 2001 / Reno, NV For permission to copy or republish, contact the American Institute of Aeronautics and Astronautics 1801 Alexander Bell Drive, Suite 500, Reston, VA 20191 AIAA 2001-0249 Advanced Aerodynamic Design of Passive Porosity Control Effectors C.A. Hunter, S.A. Viken, R.M. Wood, and S.X.S. Bauer NASA Langley Research Center Hampton, Virginia
Transcript of Advanced Aerodynamic Design of Passive Porosity …mln/ltrs-pdfs/NASA-aiaa-2001-0249.pdfporosity...

39th AIAA Aerospace SciencesMeeting & Exhibit
8-11 January 2001 / Reno, NVFor permission to copy or republish, contact the American Institute of Aeronautics and Astronautics
1801 Alexander Bell Drive, Suite 500, Reston, VA 20191
AIAA 2001-0249
Advanced Aerodynamic Design ofPassive Porosity Control EffectorsC.A. Hunter, S.A. Viken, R.M. Wood, and S.X.S. BauerNASA Langley Research CenterHampton, Virginia

AIAA 2001-0249
1
American Institute of Aeronautics and Astronautics
ADVANCED AERODYNAMIC DESIGN OF PASSIVE POROSITY CONTROL EFFECTORS
Craig A. Hunter*, Sally A. Viken**, Richard M. Wood, and Steven X.S. Bauer*†
NASA Langley Research CenterHampton, Virginia
Abstract
This paper describes aerodynamic design work aimed atdeveloping a passive porosity control effector systemfor a generic tailless fighter aircraft. As part of thiswork, a computational design tool was developed andused to layout passive porosity effector systems forlongitudinal and lateral-directional control at a low-speed, high angle of attack condition. Aerodynamicanalysis was conducted using the NASA Langleycomputational fluid dynamics code USM3D, inconjunction with a newly formulated surface boundarycondition for passive porosity. Results indicate thatpassive porosity effectors can provide maneuver controlincrements that equal and exceed those of conventionalaerodynamic effectors for low-speed, high-alpha flight,with control levels that are a linear function of porousarea. This work demonstrates the tremendous potentialof passive porosity to yield simple control effectorsystems that have no external moving parts and willpreserve an aircraft’s fixed outer moldline.
Introduction
Since 1990, the aeronautics research community hasexplored novel concepts for aircraft shaping andaerodynamic control [1-9]. These concepts seek toincrease aerodynamic performance, improvesurvivability, and reduce weight and complexity byeliminating the breaks, gaps, hinges, and mechanicalcomponents found in conventional aircraft controleffector designs and replacing them with a combinationof blended control surfaces, smart materials, and flowcontrol actuators. The result of this design approach isa continuous or even fixed outer moldline aircraft thatis able to morph its effective aerodynamic shape andprovide maneuver control in a smooth, continuous,organic manner, similar to the methods birds and fishuse in nature. While promising, much of the recentresearch in this area has focused on fundamental flowphysics and material/actuator development, and manycontrol effector concepts remain unproven at realisticfull scale flight conditions at this time [10-13].
One exception in this area is the passive porosityconcept, which was originally developed in the early1980s as a means of shock - boundary layer interaction
control [14-19]. Based on the initial control effectorresearch reported by Bauer [17], passive porosity hasevolved into an extensively tested and well provenaerodynamic flow control technology with a wide rangeof capabilities and applications [1,20-23]. The passiveporosity concept consists of a porous outer surface, aplenum, and a solid inner surface, as shown in Figure 1.Pressure differences between high- and low-pressureregions on the outer surface “communicate” through theplenum, thereby modifying the pressure loading on theouter surface. In concert with this pressurecommunication, there is a small amount of masstransfer into and out of the plenum that changes theeffective aerodynamic shape of the outer surface.
When regions with a large pressure difference areconnected by a passive porosity system, it has thepotential to act as a control effector. For example,connecting a low-pressure region on the upper surfaceof an aircraft with a corresponding high-pressure regionon the lower surface of the aircraft would reduce thepressure difference between the two regions, decreasingthe local normal force and translating the center ofpressure. Applied strategically to different areas of anaircraft, as shown in Figure 2, this can result in anextremely powerful control effector system capable ofgenerating a variety of forces and moments. Thegeneral idea would be to equip an aircraft with anumber of porous cavities and interconnected plenumsthat could be controlled and actuated by valves or othersimple devices, as illustrated in Figure 3. Compared toa traditional control effector such as a trailing edge flap,passive porosity has no external moving parts, itpreserves the vehicle outer moldline, and it shouldprovide better performance by generating a controlforce that varies linearly with vehicle lift in apredictable manner [1].
In the past, passive porosity has been applied to existingaircraft configurations, working within the limitationsand constraints of aircraft designed to use conventionalcontrol effectors. While much of this work has beensuccessful, the full potential of passive porosity controleffectors can best be explored with a clean-sheetapproach – one using an aircraft design that is suitablefor advanced aerodynamic control effectors and can beconfigured to exploit the working principles of passive
* Configuration Aerodynamics Branch** Flow Physics and Control Branch† Associate Fellow AIAA
Copyright © 2001 by the American Institute of Aeronautics andAstronautics, Inc. No copyright is asserted in the United States underTitle 17, US Code. The US Government has a royalty-free license toexercise all rights under the copyright claimed herein for governmentpurposes. All other rights are reserved by the copyright owner.
AIAA 2001-0249
2
American Institute of Aeronautics and Astronautics
porosity. This paper describes aerodynamic designwork aimed at developing a passive porosity controleffector system for such an aircraft, based on a simpletailless fighter concept. In the current investigation, thefocus has been narrowed to address longitudinal andlateral-directional maneuver control at low-speed, highangle of attack conditions. Future studies will extendthis design work to more general maneuvering in otherregimes.
Nomenclature
α, ΑΟΑ Angle of Attack, degreesBL, y Butt Line (spanwise) Coordinate, inchesc Aerodynamic Chord (local), inchesCL Lift CoefficientCD Drag CoefficientCY Sideforce CoefficientCl Rolling Moment CoefficientCm Pitching Moment CoefficientCn Yawing Moment CoefficientCG Center of GravityCP Pressure CoefficientFS, x Fuselage Station (axial) Coordinate, inchesφ Forebody Polar Angle, degreesm Porous Surface Net Mass Flux, slug/secM Mach NumberR Computation ResidualRo Initial Computation ResidualWL, z Water Line (vertical) Coordinate, inches
Aircraft Configuration
The aircraft used in this investigation is based onfighter configurations developed under the Air ForceWright Lab “Aero Configuration/Weapons FighterTechnology” (ACWFT) program [24]. The goal of thisprogram was to develop multi-mission fighter aircraftconfigurations with advanced technologies andperformance characteristics capable of addressing post-year-2000 needs and threats. Special emphasis wasplaced on the design and performance of advancedaerodynamic control effectors for tailless or reduced-tail concepts. Through a combination of wind-tunneltesting, performance analyses, and trade studies, aconcept was selected for design refinement, resulting inthe ACWFT 1204 configuration shown in Figure 4.
For the current study, a simplified aircraftconfiguration, dubbed “S1204”, was developed byextracting salient features of the basic 1204 planformand outer mold line to form an analytically definedgeometry (required for future studies involvingreshaping). To reduce complexity, the 1204’s cockpitand engine inlets were removed, and the exhaust nozzlewas faired over. In addition, the 1204’s NACA64-series airfoil shape was replaced with a simpler 4%
thick bi-convex airfoil. The resulting S1204configuration is shown in Figure 5. As developed, theS1204 configuration preserves the relevantcharacteristics of the ACWFT 1204 and is a goodgeneric testbed for advanced aerodynamic controleffector concepts, making it well suited for the presentinvestigation. Prior to the work discussed in this report,preliminary CFD analysis was conducted on the S1204configuration at a variety of flow conditions to verifythat its aerodynamic performance was consistent withthe original ACWFT 1204.
Computational Fluid Dynamics Simulation
The NASA Langley unstructured computational fluiddynamics code “USM3D” [25] was used for Navier-Stokes analysis in this study. Within the tetrahedralcell-centered, finite volume flow solver, inviscid fluxquantities are computed across each cell face usingRoe’s flux-difference splitting scheme. A novelreconstruction process is used for spatial discretization,based on an analytical formulation for computinggradients within tetrahedral cells. Solutions areadvanced to a steady state condition using an implicitbackward-Euler time-stepping scheme.
Within USM3D, turbulence closure is given by theSpalart-Allmaras one-equation model [26]. This modelsolves a single local transport equation for the turbulentviscosity. The turbulence model can be integrateddown to the wall, or can be coupled with a turbulentboundary layer wall function to reduce the number ofcells in the sublayer region of the boundary layer. Thelatter approach was used here.
Computational Model
The VGRID/GridTool software system [27,28] wasused to generate the unstructured grids for this study.VGRID uses an advancing-front method for generatingEuler tetrahedral grids, and an advancing-layer methodfor thin-layer tetrahedral viscous grids required forNavier-Stokes analysis. In defining the computationaldomain, boundaries are represented by bi-linear surfacepatches that are constructed in GridTool based on user-specified geometries. Grid characteristics like cellspacing and stretching are also specified in GridTool bythe placement of cell “sources”.
A surface mesh is generated in VGRID by triangulatingeach surface patch with a two-dimensional (2D) versionof the advancing-front method. Triangulated surfacepatches then form the initial “front” for the generationof three-dimensional (3D) tetrahedral volume cells bythe advancing-layer and advancing-front methods.Smooth variation of grid spacing is achieved by solvinga Poisson equation on a cartesian background grid,using the GridTool-defined cell sources as inputs.

AIAA 2001-0249
3
American Institute of Aeronautics and Astronautics
Two grids were developed for this study: a semi-spangrid suitable for longitudinal control analysis, and afull-span grid intended for lateral-directional controlanalysis. The semi-span grid with symmetry plane isshown in Figure 6, and the full-span surface mesh isshown in Figure 7. In both cases, the computationaldomain extended roughly 10-14 mean aerodynamicchord lengths from the aircraft CG in all directions.The semi-span grid contained a total of 961481tetrahedral cells and 168390 nodes, and the full spangrid contained twice that amount.
Boundary Conditions
Outer boundaries of the computational domain weretreated as characteristic inflow/outflow surfaces withfreestream conditions specified by Mach number,Reynolds Number, flow angle, and static temperature(the semi-span case used a reflection boundarycondition at the symmetry plane). For comparison withthe ACWFT database, low-speed high angle of attackconditions of M = 0.14 and α = 28° were selected foranalysis. Reynolds number was chosen to match the1×106/ft - 2×10⁶/ft conditions of the various ACWFTwind tunnel tests.
Aircraft surfaces were treated as no-slip viscousboundaries. In cases involving the application ofpassive porosity control effectors, selected patches onthe aircraft surface were treated as porous surfacesusing the newly implemented porosity boundarycondition in USM3D. The boundary condition isstructured to allow any number of surface patches tocommunicate through a common plenum, withprovisions for up to eight independent plenums.Specific details of this boundary condition will be givenin a forthcoming paper [29], so only a basic overviewwill be given here.
The USM3D porous boundary condition is an extensionof the theory developed by Bush [30] to model flowthrough a screen. Bush’s original model was derived topass information across a coterminous boundaryseparating an external flow and an internal plenum. Inthe revised approach used in USM3D, the Bush modelwas re-formulated as a surface boundary condition forthe external flow, thus eliminating the need to grid andcompute flow within a plenum. Conservation lawsfrom steady, one-dimensional (1D), isentropic, andadiabatic gas dynamics are used to model flow throughthe porous surface, in conjunction with the assumptionof a constant plenum pressure and the requirement ofzero net mass flow through the porous surface. Part ofthe solution procedure involves a feedback iteration toupdate the plenum pressure and drive net mass flow tozero. Because of the 1D equations used in theboundary condition, only the surface porosity level isspecified, not the actual porous hole geometry (circular
holes of 0.020-0.050 inch diameter are typically used inwind tunnel and flight applications of passive porosity).Based on previous aerodynamic testing [1,17,22], aporosity level of 22% openness was used in this study.
The porous boundary condition has been validated bycomparing computational results to experimental dataobtained for a GA(W)-1 wing with leading-edgeporosity [1] and a 5 caliber, tangent-ogive forebodywith circumferential porosity [22]. In both cases,computational results showed remarkable agreementwith experimental force and pressure data [29].
Solution Procedure
All solutions presented in this paper were obtained byrunning USM3D on the “Von Neumann” Cray C-90 atNASA Ames, using 10 processors in multi-task mode.Typical cases needed 6000-8000 cycles for fullconvergence. Semi-span computations required about175 megawords of memory and 60-85 hours ofcomputer time. Full span cases required double thoseamounts. During the computation, global CFL numberranged from 5 to approximately 30.
Convergence was judged by several methods. The firstinvolved tracking the solution residual until it droppedseveral orders of magnitude and leveled out, as shownin Figure 8(a). Integrated aerodynamic performancecoefficients shown in Figure 8(b) were also used toverify convergence. Finally, in cases using the passiveporosity boundary condition, average porous surfacepressure, plenum pressure, and porous surface net massflow were tracked. Typical histories of theseparameters are shown in Figures 8(c) and 8(d).
Baseline Results
Results for the baseline S1204 configuration atM = 0.14 and α = 28° are given in Figures 9 and 10.Figure 9 shows pressure coefficient (CP) contours overthe upper and lower surface of the aircraft, and Figure10 uses particle traces to illustrate the vortical flowfield about the upper surface of the aircraft. Theseresults are typical for a chined body at high angle ofattack, and are in excellent agreement with the ACWFTflow visualization results obtained by McGrath, et al[31]. Two large vortices track along the upper surfaceof the forebody (red and green traces), and wing flow ischaracterized by a spanwise vortex originating fromeach leading-edge wing-body junction (blue traces).These vortical flows create significant low-pressureregions along the aircraft’s upper surface, with a typicalCP level of about –2. As expected, the lower surface ofthe aircraft is dominated by high-pressure, with CP
ranging from approximately 0 to 1. This combinationof low- and high-pressure regions is ideal for theapplication of passive porosity.

AIAA 2001-0249
4
American Institute of Aeronautics and Astronautics
Control Effector Design
As discussed in the introduction, the basic premise of apassive porosity control effector system involvesconnecting low- and high-pressure regions of an aircraftto alter surface loading and generate maneuver control.This can be accomplished by allowing pressure to alterthe surface loading directly, or by controlling asecondary flow (such as a vortex) which in turn alterssurface loading. In general, connecting low-pressureupper surface regions with high-pressure lower surfaceregions tends to have the largest effect on flow in thelow-pressure (upper surface) region. The high-pressure(lower surface) region typically shows little or nochange, and basically acts as an unlimited high-pressuresource [1,17,20,22]. Thus, the design of a passiveporosity control effector system involves two basicsteps: (1) identifying “target” regions on the aircraft’supper surface where the application of high-pressurewill generate a desired force or moment, and(2) identifying corresponding high-pressure “source”regions on the aircraft’s lower surface. In the case ofthe S1204, where the entire lower surface containshigh-pressure at high angle of attack, source regionscan be chosen to simplify overall systems integration.
Design Tool
For a particular target region on an aircraft’s uppersurface, the effect of applying passive porosity willdepend on several factors: the pressure distribution, thelocal surface geometry, and the location and momentarm relative to the aircraft CG. While the effect ofthese factors is easy to visualize in simple cases, it canpose a significant design challenge for complexgeometries and arbitrary surface shapes. In order tostreamline the design process, a simple computationaltool was developed to help identify target areas for theapplication of passive porosity on an aircraft uppersurface. Using USM3D solution and grid files asinputs, the tool surveys the surface geometry andconfiguration layout of low-pressure, upper-surfaceregions and calculates the potential forces and momentsthat would be generated if the local surface pressurecoefficient were raised to a specified target level. Forthe present investigation, CP = 0 (freestream pressure)was deemed a suitable target value.
Results from the design tool are shown in Figure 11(a)and 11(b), for nose-down pitch and yaw, respectively(moments referenced to the stability axes). In eachplot, potential increments in moment are plotted perunit area over the aircraft upper surface. It is importantto note that results from the design tool do not indicatethe direct effects of applying passive porosity; rather,they indicate the effect of raising local pressure on theupper surface. Passive porosity is simply one methodof accomplishing this, either by direct loading orthrough the control of secondary flows.
Results in Figure 11(a) indicate that target areas fornose-down pitch control are the forebody and leading-edge wing-body junction regions (forward of theaircraft CG). Low-pressure in these regions is due tovortical flows, and control of these flows is key toobtaining nose-down pitch. Potential yaw controlincrements in Figure 11(b) show a similar result, andindicate that “asymmetric” control of the vortical flowsis required for yaw generation. At the α = 28°condition, stability-axes yaw depends heavily on bothyaw and roll about the body axes. Raising pressure onone side of the forebody will effect body-axes yaw,while raising pressure on the upper surface of one wingwill effect body-axes roll. Combined, these momentswill contribute to yaw in the stability-axes.
Control Effector Configurations
Based on the design analysis, ten passive porosityconfigurations were developed to effect pitch and yawcontrol. Target regions on the aircraft upper surfacewere mated with corresponding source regions on thelower surface (i.e., lower surface porosity was a directprojection of upper surface porosity). From a systemsstandpoint, this approach would minimize the amountof complexity involved in connecting upper and lowersurface regions by a common plenum, making it a goodstarting point for design.
Five proposed pitch control configurations are shown inthe top row of Figure 12. Configurations P1 and P2apply porosity to the forebody region, starting at thenose and going back to FS = 147 (covering 33% of theforebody area) and FS = 298 (covering 100%),respectively. Configuration P3 applies porosity to theleading-edge wing-body junction region, forward of theaircraft CG at FS = 365. Configurations P4 and P5 arecombinations of the P1, P2, and P3 designs.
Five proposed yaw control configurations are shown inthe bottom row of Figure 12. Configurations Y1 andY2 are asymmetric counterparts of the P1 and P2configurations, covering 17% and 50% of the totalforebody area, respectively. The Y3 configuration issimilar to the P3 configuration, except that porosityextends further back to 50% chord, and is applied to theleft wing only. Finally, the Y4 and Y5 configurationsare combinations of the Y1, Y2, and Y3 designs.
A single plenum was used to connect upper and lowersurface porosity in the P1, P2, Y1, Y2, and Y3configurations. Two separate plenums were used forthe P3 case, one for each wing-body junction region.Three separate plenums were used in the P4 and P5cases, one for the forebody region, and one for eachwing-body junction region. Similarly, two separateplenums were used in the asymmetric Y4 and Y5 cases,one for the forebody, and one for the left wing.

AIAA 2001-0249
5
American Institute of Aeronautics and Astronautics
Longitudinal Control
Results for the P1 configuration are shown in Figures13-16. Comparing the CP contours in Figure 13 withthose of the baseline configuration (Figure 9), it isobvious that the application of passive porosity resultedin a large overall increase in local pressure on theforward upper surface of the forebody, but pressure onthe lower surface was virtually unchanged (asexpected). Figure 14 gives a plot of surface CP versuspolar angle around the forebody at FS = 100, for thebaseline and P1 configurations. At this location, theupper surface pressure in the P1 configuration is nearlyconstant at CP ≈ –0.65, leveling out the suction peaks ofthe baseline configuration.
Downstream of the porous region, the upper surfacepressure distribution is very similar to the baseline case.Looking at the particle traces depicted in Figure 15, itappears that passive porosity delayed onset of theforebody vortices; instead of rolling up at the nose, thevortices formed downstream of the porous region, asindicated by the red particle traces. Crossflowstreamlines at FS = 100 are shown in Figure 16(a) and16(b), for the baseline and P1 configurations,respectively. Based on the information shown here, itwould seem that passive porosity prevented windwardflow from rolling into vortices as it separated across thechine. This is likely a direct result of mass transfer outof the upper porous surface, which blunted the effect ofthe chine, filled in the wake on the leeward side of theforebody, and deterred the formation of secondaryflows.
Results for the P2 configuration are shown in Figures17-20. In this case, the application of passive porosityprovided a notable increase in upper surface pressure onthe entire forebody, and also increased pressure in theleading-edge wing-body junction region. As a result,formation of the forebody and wing-body junctionvortices was greatly inhibited. Instead of the distinctvortex families seen in the baseline and P1 cases,particle traces for the P2 configuration roll up into alarger, less organized vortex system on each side of theaircraft (see Figure 18).
An upper surface CP plot for the P3 configuration, withpassive porosity applied to the leading-edge wingregion forward of the CG, is given in Figure 21. Theseresults show that the application of passive porosityincreased pressure and smoothed out pressure gradientsin the leading-edge wing-body junction region. This isconfirmed by the CP plot in Figure 22 (taken at thespanwise location BL = –100), which shows that thewing’s suction peak was leveled off to a near constantvalue over much of the upper surface, while the lowersurface pressure was largely unaffected. Based on thevortical flow field depicted in Figure 23, it appears that
passive porosity completely eliminated the wing-bodyjunction vortices seen in the previous configurations.Here, blue particle traces originating from the wing-body junction region roll into the forebody vortices,which are better defined and more coherent than thebaseline case.
Results for the P4 and P5 configurations are shown inFigures 24-27. As expected, these configurationsincorporate flow features and characteristics from thebasic P1-P3 porosity layouts. The P5 configurationshows the most striking results; by combining fullforebody porosity from P2 with wing porosity from P3,major pressure gradients on the upper surface of the P5configuration appear to be completely blended out.Accordingly, particle traces for the P5 configuration inFigure 27 show a lack of the strong vortical flowspresent in earlier cases, with only minor rollup over theaft portion of the aircraft.
Pitch Increments
Nose-down pitch control effectiveness for the fivepassive porosity configurations is summarized in Figure28, along with data for selected ACWFT pitch controleffectors [24]. The passive porosity control effectorsprovided nose-down pitch increments ranging from∆Cm = –0.089 for the P1 configuration to ∆Cm = –0.31for the P5 configuration, comparing favorably to therange of ACWFT devices and conventional controls.Both the P2 and P5 configurations provided enoughnose-down pitch increment to reach “absolute” nose-down control, countering the configuration’s inherentnose-up pitching moment at the M = 0.14, α = 28°condition. With increments of ∆Cm = –0.243 and∆Cm = –0.31, respectively, the P2 and P5 configurationsroughly equaled or exceeded the ∆Cm = –0.25 providedby the conventional ACWFT elevons deflected to 60°.
Associated Lift Increments
Lift increments for the P1-P5 configurations are shownin Figure 29, along with estimates made from theACWFT data [24]. Like the ACWFT forebody devices,the porous configurations generate nose down pitch byreducing local lift on the aircraft forebody, whichreduces overall lift in each case. This is in contrast toconventional aft-mounted pitch effectors, whichincrease overall lift. Relative to the baselineconfiguration’s CL = 1.748, the P1, P3, and P4configurations reduced lift by 6-13%. These levelscompare favorably to the ACWFT forebody devices,which reduced lift by 4-17% for similar nose-downpitch levels. The P2 and P5 configurations reduced liftby larger amounts – 17% and 26%, respectively – butthese reductions are commensurate with the larger pitchincrements provided by these configurations.

AIAA 2001-0249
6
American Institute of Aeronautics and Astronautics
Pitch Control Trends
Using the baseline and porous results obtained here asguidance, one can construct the trends given inFigure 30, which show that the passive porosity pitchsystem provides control effect that varies linearly withporous forebody area. These results indicate that asimple means of controlling the open porous area on theforebody (such as the sliding plates or louvers shown inFigure 3) would yield a passive porosity effector systemwith linear, variable pitch control.
Lateral-Directional Control
Results for the Y1 and Y2 yaw control configurationsare presented in Figures 31-36. As asymmetriccounterparts of the P1 and P2 configurations, thepressure and flow field results seen here are consistentwith earlier discussion. The partial porosity of the Y1configuration is seen to raise pressure on theforward-left upper surface region of the forebody anddelay the onset of the vortex on that side, while the fullporosity of the Y2 configuration raised pressure on theentire left side of the forebody upper surface and nearlyeliminated the vortex on that side. CP plots for the Y2configuration at FS = 100 and 220 (Figures 35 and 36)more clearly show the asymmetric effect of passiveporosity. While pressure on the left upper surfaceregion of the forebody (180-270°) changedconsiderably from the baseline case, the remainder ofthe forebody surface pressure was unaffected to a largeextent. This demonstrates the capability of passiveporosity to act as a localized control effector.
Results for the Y3 configuration are shown in Figures37 and 38, and are in line with previous results seen forthe similar P3 configuration. The application of passiveporosity to the forward half of the left wing is seen tohave a notable effect on the upper surface pressuredistribution shown in Figure 37. Porosity smoothed outpressure gradients in the wing-body junction area,eliminated the wing-body junction vortex, and raisedthe overall wing upper surface pressure. As shown inFigure 39, the wing suction peak was reduced andupper surface pressure was leveled off to a nearconstant value of CP ≈ –0.9 at the BL = –100 location.
Upper surface CP plots and particle traces for thecomposite Y4 and Y5 configurations are given inFigures 40-43. These results are amalgamations ofearlier results seen for the Y1-Y3 configurations,combining the various elements from each case. Notsurprisingly, the Y5 configuration appears to give thebest results, by combining full forebody porosity (Y2)with wing porosity (Y3) on the left side of the aircraft.Particle traces in Figure 43 show only weak signs ofvortical flow along the left side of the aircraft, withslow rollup aft of the wing.
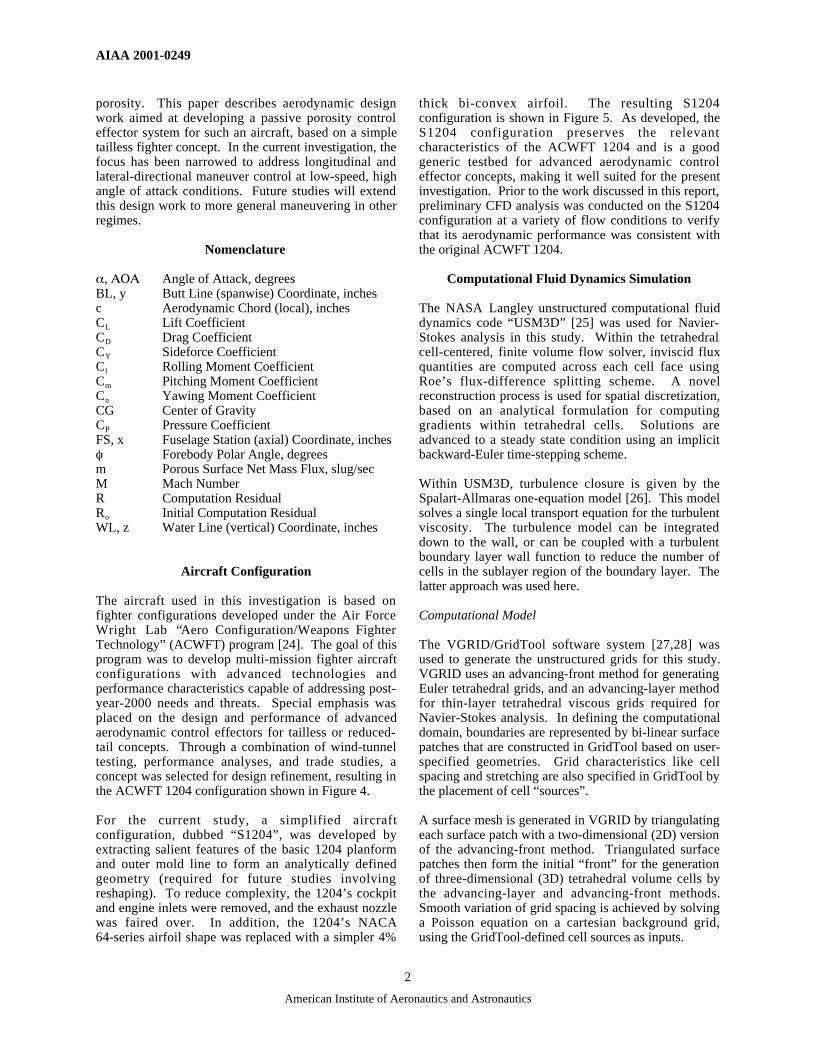
Yaw Increments
Yaw control effectiveness for the Y1-Y5 configurationsis summarized in Figure 44, along with ACWFTcontrol effector and historical data [24]. The passiveporosity control effectors provided yaw incrementsranging from ∆Cn = 0.012 to 0.051, compared with thelevels of 0.018 to 0.020 for conventional ruddercontrols on the F-15 and F/A-18, and 0.011 to 0.025 forthe various ACWFT devices. While the Y1 and Y3configurations provided yaw increments in line with theACWFT devices and conventional rudders, the Y2, Y4,and Y5 configurations performed significantly better,generating 2-5 times more yaw than the other effectors.
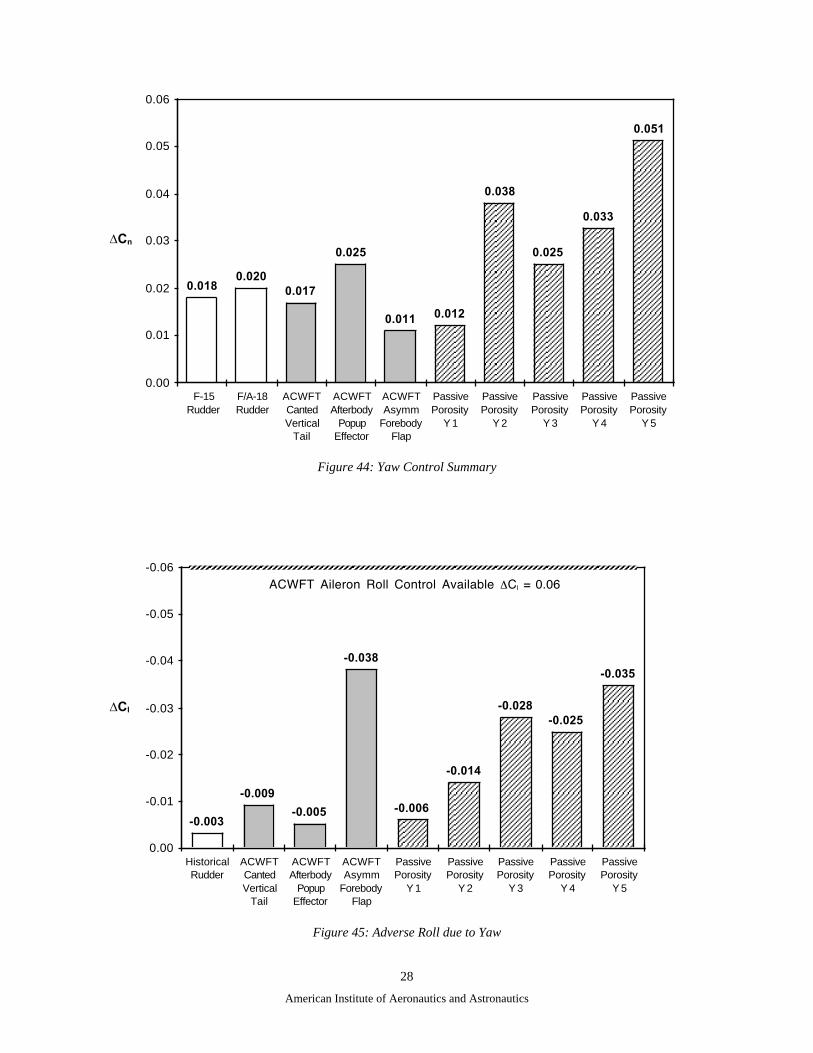
Associated Forces and Moments
Adverse roll increments are presented in Figure 45,which shows that roll levels generated by the Y1-Y5porous yaw control effectors are in line with otherACWFT devices [24], and well within the ∆Cl = 0.06level of corrective roll authority available from theACWFT aileron system. The porous yaw controleffectors also induced nose-down pitch and liftincrements, summarized in the table below.
Table 1: Assoc. Pitch & Lift Increments, Y1-Y5 Configs.
Y1 Y2 Y3 Y4 Y5
∆Cm -0.035 -0.121 -0.060 -0.098 -0.180
∆CL -0.030 -0.114 -0.149 -0.179 -0.226
Ideally, the generation of yaw should be accomplishedwith as little net sideforce as possible. Figure 46 showssideforce increments generated by the Y1-Y5 porousconfigurations compared to estimates from ACWFTdata and typical historical levels [24]. Increments of∆CY = 0.029-0.039 for the Y1, Y3, and Y4 cases fallbelow the sideforce levels of the ACWFT devices andconventional rudders for equal or greater yawincrements, indicating that the porous configurationsare more effective at producing yaw. The Y2 and Y5configurations produced larger sideforce increments, of0.076 and 0.105 respectively, but these levels areconsistent with the larger amounts of yaw produced bythese control effectors. In reality, the Y2 and Y5configurations produce about the same amount ofsideforce for a given yaw as the other porous cases.
Yaw Control Trends
As in the previous discussion of pitch control effectors,the baseline and Y1-Y5 data were used to constructcontrol trends, shown in Figure 47. Like the pitch case,the passive porosity system is seen to provide yawcontrol increments that vary linearly with porousforebody area.

AIAA 2001-0249
7
American Institute of Aeronautics and Astronautics
Concluding Remarks
Advanced aerodynamic design and analysis of passiveporosity control effectors has been conducted in thisinvestigation. Using a generic tailless fighter aircraftconcept, Navier-Stokes CFD and aerodynamic designtools were applied to develop control effectors capableof generating longitudinal and lateral-directionalcontrol for low-speed high angle of attack conditions.Specific conclusions and comments are as follows:
1. For longitudinal (pitch) control, the P1-P5 passiveporosity effectors provided nose-down pitch incrementsthat were competitive with ACWFT devices andconventional controls. Two of the porousconfigurations actually produced large enough pitchincrements to effect absolute nose-down control at thehigh-alpha condition, equaling or exceeding the controlauthority provided by conventional elevons. The pitchcontrol came with reductions in overall lift rangingfrom 6 to 26%. Passive porosity pitch control effectorswere seen to provide control increments that were alinear function of porous forebody area.
2. In terms of lateral-directional control, the Y1 and Y2porous control effector configurations generated yawincrements in the range of conventional rudder controlsand ACWFT devices. The remaining three porousconfigurations had yaw increments that were 2-5 timesgreater than the other effectors. All of the porousconfigurations generated acceptable levels of adverseroll, and provided less sideforce for a given yaw thanconventional rudders and ACWFT devices. Yawcontrol increments were also seen to form a linear trendwith porous forebody area.
3. This work demonstrates the tremendous potential ofpassive porosity to yield simple control effectorsystems that have no external moving parts and willpreserve an aircraft’s fixed outer moldline. Based onthe linear behavior observed in this study for low-speedhigh-alpha conditions, a fully implemented variablegeometry passive porosity system (using simple slidingplates or louvers to control porous area) would be ableto provide continuous increments in nose-down pitchcontrol ranging from ∆Cm = 0 to –0.3, and yaw controlincrements ranging from ∆Cn = –0.05 to 0.05.
4. Though the current study focused on low-speedhigh-alpha conditions, the passive porosity controleffector concept applies equally well to other flightregimes, including low-lift conditions or other caseswhere pressure differentials on an aircraft surface aresmall. In these instances, planform layout and surfacecontouring may be used to modify local pressuregradients, and become a key part of control effectordesign. As such, development of full-envelope passiveporosity control effectors may require new planformsand surface shapes.
Acknowledgements
The authors would like to thank Neal Frink, PareshParikh, and Shahyar Pirzadeh for their help and supportwith USM3D, VGRID, and ViGPlot, all part of theTetrahedral Unstructured Software System “TetrUSS”developed at NASA Langley.
References
1. Wood, R.M. and Bauer, S.X.S. “AdvancedAerodynamic Control Effectors”. SAE Paper,1999-01-5619, October 1999.
2. Scott, M., Montgomery, R., and Weston, R.“Subsonic Maneuvering Efectiveness of HighPerformance Aircraft which Employ Quasi-StaticShape Change Devices”. SPIE 3326-24, 1998.
3. Dorsett, K.M. and Mehl, D.R. “Innovative ControlEffectors (ICE)”. Wright Laboratory ReportWL-TR-96-3043, January 1996.
4. McGowan, A.R., Horta, L.G., Harrison, J.S., andRaney, D.L. “Research Activities Within NASA'sMorphing Program” NATO-RTO Workshop onStructural Aspects of Flexible Aircraft Control,Ottawa, Canada, October 18-21, 1999.
5. Kudva, J.N., Martin, C.A., Scherer, L.B., Jardine,A.P., McGowan, A.R., Lake, R.C., Sendeckyj,G.P., and Sanders, B.P. “Overview of theDARPA/AFRL/NASA Smart Wing Program”.SPIE Paper 3674-26, March 1999.
6. Pack, L.G., and Joslin, R.D. “Overview of ActiveFlow Control at NASA Langley Research Center”.SPIE Paper 3326-24, 1998.
7. Donovan, J.F., Kral, L.D., and Cary, A.W. “ActiveFlow Control Applied to an Airfoil”.AIAA 98-0210, January 1998.
8. Seifert, A. and Pack, L.G. “Oscillatory Control ofSeperation at High Reynolds Numbers”.AIAA 98-0214, January 1998.
9. Nae, C. “Synthetic Jet Influence on a NACA 0012Airfoil at High Angles of Attack”. AIAA 98-4523.
10. Lachowicz, J.T., Yao, C., and Wlezien, R.W.“Scaling of an Oscillatory Flow-Control Device”.AIAA 98-0330, January 1998.
11. Ho, C.M. and Tai, Y.C. “Review: MEMS and itsApplications for Flow Control”. Journal of FluidsEngineering 118(3), 1996.

AIAA 2001-0249
8
American Institute of Aeronautics and Astronautics
12. Joslin, R., Horta, L., and Chen, F. “TransitioningActive Flow Control to Applications”.AIAA 99-3575, June 1999.
13. Kral, L., Donovan, J., Cain, B., and Cary, A.Numerical Simulation of Synthetic Jet Actuators”.AIAA 97-1824, 1997.
14. Raghunathan, S. "Passive Control of Shock -Boundary Layer Interaction". Progress inAerospace Sciences, Volume 25, 1988.
15. Nagamatsu, H.T., Trilling, T.W., and Bossard, J.A."Passive Drag Reduction on a Complete NACA0012 Airfoil at Transonic Mach Numbers".AIAA 87-1263, June 1987.
16. McCormick, D.C. "Shock - Boundary LayerInteraction Control with Low-Profile VortexGenerators and Passive Cavity". AIAA 92-0064,January 1992.
17. Bauer, S.X.S., and Hernandez, G. "Reduction ofCross-Flow Shock-Induced Separation with aPorous Cavity at Supersonic Speeds".AIAA 88-2567, June 1988.
18. Raghunathan, S. "Passive Shockwave BoundaryLayer Control Experiments on a Circular ArcModel". AIAA 86-0285, January 1986.
19. Nagamatsu, H.T., Brower, W.B., Bahi, L., andMarble, S.K. “Investigation of Passive ShockWave / Boundary Layer Control for TransonicAirfoil Drag Reduction”. First Annual report forNASA Grant NSG1624, 10/1/79 to 9/30/80.
20. Wood, R. M.; Banks, D. W.; and Bauer, S. X. S.:Assessment of Passive Porosity with Free andFixed Separation on a Tangent Ogive Forebody.AIAA 92-4494, 1992.
21. Wilcox, F. J. “Experimental Investigation of theEffects of a Porous Floor on Cavity Flow Fields atSupersonic Speeds”. NASA TP 3032, 1990.
22. Bauer, S. X. S. and Hemsch, M.J. “Alleviation ofSideforce on Tangent-Ogive Forebodies UsingPassive Porosity”. Journal of Aircraft , Vol 31, No2, p354-361. March-April 1994.
23. NASA Langley Research Center, Office ofExternal Affairs. “NASA Contributions to F/A-18E/F: Centerpiece of US Navy's Carrier-BasedFighter/Attack Fleet Updated with NASAAeronautics Technology”. FS-1999-08-46-LaRC,August 1999.
24. O’Neil, P.J., Krekeler, G.C., Billman, G.M., andCreasman, F. “Aero Configuration / WeaponsFighter Technology (ACWFT) – SummaryTechnical Report”. Wright Labs WL-TR-95-3002,December 1994.
25. Frink N. “Tetrahedral Unstructured Navier-StokesMethod for Turbulent Flows”. AIAA Journal, Vol.36, No. 11, pp 1975-1982. November 1998.
26. Spalart, P.R., and Allmaras, S.R. “A One-EquationTurbulence Model for Aerodynamic Flows”.AIAA 92-0439, January 1992.
27. Pirzadeh, S. “Progress Toward a User-OrientedUnstructured Viscous Grid Generator”.AIAA 96-0031, January 1996.
28. Samareh, J. “GridTool: A Surface Modeling andGrid Generation Tool”. Proceedings of theWorkshop on Surface Modeling, Grid Generation,and Related Issues in CFD Solutions.NASA CP-3291, May 1995.
29. N. Frink, D. Bonhaus, V. Vatsa, S. Bauer,E. Nielsen, and A. Tinetti. “A Boundary Conditionfor Simulation of Flow over Porous Surfaces”.Extended abstract for the 19th AIAA AppliedAerodynamics Conference to be held in Anaheim,California, June 11-14, 2001.
30. Bush, R. H. “Engine Face and Screen Loss Modelsfor CFD Applications”. AIAA 97-2076, June 1997.
31. B. McGrath, D. Neuhart, G. Gatlin, and P. O’Neil.“Low-speed Longitudinal AerodynamicCharacteristics of a Flat-Plate Planform Model ofan Advanced Fighter Configuration”.NASA TM-109045, March 1994.

9
American Institute of Aeronautics and Astronautics
Porous!Outer!Surface
Solid!Inner!Surface
Plenum!Region
External Flow
Figure 1: Passive Porosity Concept
Forebody: Pitch/Yaw Control
Wings: Roll/Pitch/Yaw ControlTail/Afterbody: Pitch/Yaw Control
Figure 2: Passive Porosity Aerodynamic Control Effector Concept
Sliding Cover Plates
Control Valve!
Connecting Plenum
Louvers
Figure 3: Passive Porosity Control Effector Schematic

10
American Institute of Aeronautics and Astronautics
Figure 4: ACWFT 1204 Configuration
BL 198
BL -198
FS!298
FS!0
FS!493
FS!690
FS!365
WL 125
WL 58WL 93
S1204
Wing Details4% t/c Bi-Convex Airfoil!Area: 425 sq ft!LE/TE Sweep: 30°!MAC: 182 IN
Overall DetailsLength: 690 IN!Wing Span: 396 IN!CG: FS = 365 IN (30% MAC)!Chine Angle: 12°!
Figure 5: Simplified S1204 Configuration

11
American Institute of Aeronautics and Astronautics
Figure 6: Semi-span S1204 Computational Grid
Figure 7: Full-span S1204 Surface Mesh

12
American Institute of Aeronautics and Astronautics
-3.0
-2.5
-2.0
-1.5
-1.0
-0.5
0.0
0.5
0 1000 2000 3000 4000 5000 6000 7000
log
(R/R
o)
Iteration
-1.0
-0.5
0.0
0.5
1.0
1.5
2.0
0 1000 2000 3000 4000 5000 6000 7000
CLCDCm
Iteration
8(a) Residual 8(b) Forces and Moments
-0.3
-0.2
-0.1
0.0
0.1
0.2
0.3
0 1000 2000 3000 4000 5000 6000 7000
Avg SurfacePlenum
Cp
Iteration
-0.04
-0.03
-0.02
-0.01
0.00
0.01
0.02
0.03
0.04
0 1000 2000 3000 4000 5000 6000 7000
Iteration
«m
8(c) Porous BC Pressures 8(d) Porous Surface Net Mass Flow
Figure 8: Typical Convergence History
m

13
American Institute of Aeronautics and Astronautics
1.0
0.0
-1.0
-2.0
-3.0
-4.0
Cp
Upper Surface
Lower Surface
Figure 9: Upper and Lower Surface Pressure Coefficient – Baseline Configuration (M = 0.14, α = 28°)
Figure 10: Upper Surface Vortex Flow – Baseline Configuration (M = 0.14, α = 28°)

14
American Institute of Aeronautics and Astronautics
-6.0
-5.0
-4.0
-3.0
-2.0
-1.0
0.0
∆Cm per unit area x 105
-7.0
11(a) Nose-down Pitching Moment
1.50
1.25
1.00
0.75
0.50
0.25
0.00
∆Cn per unit area x 105
11(b) Yawing Moment
Figure 11: Target Areas for Passive Porosity – Baseline S1204 Upper Surface
Y4 Y5Y3Y1 Y2
P4 P5P3P1 P2
Figure 12: Passive Porosity Control Effector Configurations.P1-P5 for Nose-down Pitch Control, Y1-Y5 for Yaw Control.
Shaded regions indicate upper and lower surface porosity.

15
American Institute of Aeronautics and Astronautics
1.0
0.0
-1.0
-2.0
-3.0
-4.0
Cp
Upper Surface
Lower Surface
Figure 13: Upper and Lower Surface Pressure Coefficient – P1 Pitch Control ConfigurationDashed lines indicate porous regions.
-2.0
-1.5
-1.0
-0.5
0.0
0.50 45 90 135 180 225 270 315 360
BaselineP1 Porous
Cp
φ
FS 100
POROUS REGION
z
y
Figure 14: Comparison of Forebody Surface Pressure Coefficient at FS = 100Baseline and P1 Pitch Control Configuration

16
American Institute of Aeronautics and Astronautics
Figure 15: Upper Surface Vortex Flow – P1 Pitch Control ConfigurationDashed lines indicate porous regions.
16(a) Baseline Configuration
16(b) P1 Pitch Control Configuration
Figure 16: Crossflow Streamlines at FS = 100

17
American Institute of Aeronautics and Astronautics
1.0
0.0
-1.0
-2.0
-3.0
-4.0
Cp
Figure 17: Upper Surface Pressure Coefficient – P2 Pitch Control Configuration
Figure 18: Upper Surface Vortex Flow – P2 Pitch Control Configuration

18
American Institute of Aeronautics and Astronautics
-2.0
-1.5
-1.0
-0.5
0.0
0.50 45 90 135 180 225 270 315 360
BaselineP2 Porous
Cp
φ
FS 100
POROUS REGION
z
y
Figure 19: Comparison of Forebody Surface Pressure Coefficient at FS = 100Baseline and P2 Pitch Control Configuration
-2.0
-1.5
-1.0
-0.5
0.0
0.50 45 90 135 180 225 270 315 360
BaselineP2 Porous
Cp
φ
FS 220
POROUS REGION
z
y
Figure 20: Comparison of Forebody Surface Pressure Coefficient at FS = 220Baseline and P2 Pitch Control Configuration

19
American Institute of Aeronautics and Astronautics
1.0
0.0
-1.0
-2.0
-3.0
-4.0
Cp
Figure 21: Upper Surface Pressure Coefficient – P3 Pitch Control Configuration
-3.0
-2.5
-2.0
-1.5
-1.0
-0.5
0.0
0.5
1.00.0 0.25 0.50 0.75 1.0
BaselineP3 Porous
Cp
x/c
POROUSREGION
BL -100
Figure 22: Comparison of Wing Surface Pressure Coefficient at BL = –100Baseline and P3 Pitch Control Configuration
Figure 23: Upper Surface Vortex Flow – P3 Pitch Control Configuration

20
American Institute of Aeronautics and Astronautics
1.0
0.0
-1.0
-2.0
-3.0
-4.0
Cp
Figure 24: Upper Surface Pressure Coefficient – P4 Pitch Control Configuration
Figure 25: Upper Surface Vortex Flow – P4 Pitch Control Configuration
1.0
0.0
-1.0
-2.0
-3.0
-4.0
Cp
Figure 26: Upper Surface Pressure Coefficient – P5 Pitch Control Configuration

21
American Institute of Aeronautics and Astronautics
Figure 27: Upper Surface Vortex Flow – P5 Pitch Control Configuration
-0.025
-0.089
-0.243
-0.102
-0.175
-0.310
-0.250
-0.120
-0.060
-0.35
-0.30
-0.25
-0.20
-0.15
-0.10
-0.05
0.00ACWFTElevons@ 60°
ACWFTForebody
Flaps
ACWFTForebodyFences
ACWFTTE Flaps
@ 30°
PassivePorosity
P 1
PassivePorosity
P 2
PassivePorosity
P 3
PassivePorosity
P 4
PassivePorosity
P 5
∆Cm
Figure 28: Nose-down Pitch Control Summary
Level Required for Absolute Nose-down Control

22
American Institute of Aeronautics and Astronautics
0.057
-0.104
-0.305
-0.185-0.234
-0.450
0.198
-0.289
-0.064
-0.60
-0.40
-0.20
0.00
0.20
0.40
0.60
ACWFTElevons@ 60°
ACWFTForebody
Flaps
ACWFTForebodyFences
ACWFTTE Flaps
@ 30°
PassivePorosity
P 1
PassivePorosity
P 2
PassivePorosity
P 3
PassivePorosity
P 4
PassivePorosity
P 5
∆CL
Figure 29: Associated Lift Increments
-0.4
-0.3
-0.2
-0.1
0.00 20 40 60 80 100
∆Cm
Percent Porous Region of Forebody
P1
P2
P3
P4
P5
Figure 30: Nose-down Pitch Control Trend
Note: Porous region starts from nose. The baseline and P3 configurations have 0% porous forebody area, the P1 and P4configurations have 33% porous forebody area, and the P2 and P5 configurations have 100% porous forebody area.

23
American Institute of Aeronautics and Astronautics
1.0
0.0
-1.0
-2.0
-3.0
-4.0
Cp
Figure 31: Upper Surface Pressure Coefficient – Y1 Yaw Control Configuration
Figure 32: Upper Surface Vortex Flow – Y1 Yaw Control Configuration
1.0
0.0
-1.0
-2.0
-3.0
-4.0
Cp
Figure 33: Upper Surface Pressure Coefficient – Y2 Yaw Control Configuration

24
American Institute of Aeronautics and Astronautics
Figure 34: Upper Surface Vortex Flow – Y2 Yaw Control Configuration
POROUS REGION-2.0
-1.5
-1.0
-0.5
0.0
0.50 45 90 135 180 225 270 315 360
Baseline
Y2 Porous
Cp
φ
FS 100
z
y
Figure 35: Comparison of Forebody Surface Pressure Coefficient at FS = 100Baseline and Y2 Yaw Control Configuration

25
American Institute of Aeronautics and Astronautics
POROUS REGION-2.0
-1.5
-1.0
-0.5
0.0
0.50 45 90 135 180 225 270 315 360
Baseline
Y2 Porous
Cp
φ
FS 220
z
y
Figure 36: Comparison of Forebody Surface Pressure Coefficient at FS = 220Baseline and Y2 Yaw Control Configuration
1.0
0.0
-1.0
-2.0
-3.0
-4.0
Cp
Figure 37: Upper Surface Pressure Coefficient – Y3 Yaw Control Configuration
Figure 38: Upper Surface Vortex Flow – Y3 Yaw Control Configuration

26
American Institute of Aeronautics and Astronautics
-3.0
-2.5
-2.0
-1.5
-1.0
-0.5
0.0
0.5
1.00.0 0.25 0.50 0.75 1.0
BaselineY3 Porous
Cp
x/c
POROUS REGION
BL -100
Figure 39: Comparison of Wing Surface Pressure Coefficient at BL = –100Baseline and Y3 Yaw Control Configuration
1.0
0.0
-1.0
-2.0
-3.0
-4.0
Cp
Figure 40: Upper Surface Pressure Coefficient – Y4 Yaw Control Configuration
Figure 41: Upper Surface Vortex Flow – Y4 Yaw Control Configuration

27
American Institute of Aeronautics and Astronautics
1.0
0.0
-1.0
-2.0
-3.0
-4.0
Cp
Figure 42: Upper Surface Pressure Coefficient – Y5 Yaw Control Configuration
Figure 43: Upper Surface Vortex Flow – Y5 Yaw Control Configuration
28
American Institute of Aeronautics and Astronautics
0.025
0.011 0.012
0.038
0.025
0.033
0.051
0.0180.020
0.017
0.00
0.01
0.02
0.03
0.04
0.05
0.06
F-15Rudder
F/A-18Rudder
ACWFTCantedVertical
Tail
ACWFTAfterbody
PopupEffector
ACWFTAsymm
ForebodyFlap
PassivePorosity
Y 1
PassivePorosity
Y 2
PassivePorosity
Y 3
PassivePorosity
Y 4
PassivePorosity
Y 5
∆Cn
Figure 44: Yaw Control Summary
-0.038
-0.006
-0.014
-0.028-0.025
-0.035
-0.005
-0.009
-0.003
-0.06
-0.05
-0.04
-0.03
-0.02
-0.01
0.00HistoricalRudder
ACWFTCantedVertical
Tail
ACWFTAfterbody
PopupEffector
ACWFTAsymm
ForebodyFlap
PassivePorosity
Y 1
PassivePorosity
Y 2
PassivePorosity
Y 3
PassivePorosity
Y 4
PassivePorosity
Y 5
∆Cl
ACWFT Aileron Roll Control Available ∆Cl = 0.06
Figure 45: Adverse Roll due to Yaw

29
American Institute of Aeronautics and Astronautics
0.058
0.029
0.076
0.0390.033
0.105
0.059
0.0410.040
0.00
0.02
0.04
0.06
0.08
0.10
0.12
HistoricalRudder
ACWFTCantedVertical
Tail
ACWFTAfterbody
PopupEffector
ACWFTAsymm
ForebodyFlap
PassivePorosity
Y1
PassivePorosity
Y2
PassivePorosity
Y3
PassivePorosity
Y4
PassivePorosity
Y5
∆CY
Figure 46: Comparison of Sideforce Increments
0.00
0.01
0.02
0.03
0.04
0.05
0.06
0 10 20 30 40 50
∆Cn
Percent Porous Region of Forebody
Y1
Y2
Y3
Y4
Y5
Figure 47: Yaw Control Trend
Note: Porous region starts from nose. The baseline and Y3 configurations have 0% porous forebody area, the Y1/Y4configurations have 17% porous forebody area, and the Y2/Y5 configurations have 50% porous forebody area.