Advance Market Commitments for Vaccines Against … fileWe make adjustments for lower marketing...
45
Advance Market Commitments for Vaccines Against Neglected Diseases: Estimating Costs and Effectiveness Ernst R. Berndt, Rachel Glennerster, Michael R. Kremer, Jean Lee, Ruth Levine, Georg Weizsäcker, and Heidi Williams CID Working Paper No. 127 July 2006 © Copyright 2006 Ernst R. Berndt, Rachel Glennerster, Michael R. Kremer, Jean Lee, Ruth Levine, Georg Weizsäcker, Heidi Williams, and the President and Fellows of Harvard College at Harvard University Center for International Development Working Papers
Transcript of Advance Market Commitments for Vaccines Against … fileWe make adjustments for lower marketing...
Advance Market Commitments for Vaccines Against Neglected Diseases: Estimating Costs and Effectiveness
Ernst R. Berndt, Rachel Glennerster, Michael R. Kremer, Jean Lee, Ruth Levine, Georg Weizsäcker, and Heidi Williams
CID Working Paper No. 127 July 2006
© Copyright 2006 Ernst R. Berndt, Rachel Glennerster, Michael R. Kremer, Jean Lee, Ruth Levine, Georg Weizsäcker, Heidi Williams, and the President and
Fellows of Harvard College
at Harvard UniversityCenter for International DevelopmentWorking Papers
1
Advance Market Commitments for Vaccines Against Neglected Diseases: Estimating Costs and Effectiveness1
Ernst R. Berndt
MIT Sloan School of Management and National Bureau of Economic Research (NBER)
Rachel Glennerster MIT Abdul Latif Jameel Poverty Action Lab
Michael R. Kremer
Harvard University, Brookings Institution, Center for Global Development, and NBER
Jean Lee Harvard University
Ruth Levine
Center for Global Development
Georg Weizsäcker London School of Economics
Heidi Williams
Harvard University
1 We thank Pia Bruce, Iain Cockburn, Joseph DiMasi, Amy Finkelstein, Heather Freeman, Henry Grabowski, Hannah Kettler, Andrew Metrick, Blair Sachs, and two anonymous referees for their helpful comments and input, as well as other participants in the Pull Mechanisms Working Group of the Global Health Policy Research Network, a program of the Center for Global Development supported by the Bill & Melinda Gates Foundation. We are especially grateful to Henry Grabowski for his generosity in sharing the pharmaceutical sales revenue data with us. All errors and opinions are those of the authors. Contact: Berndt, MIT Sloan School of Management, [email protected], 617-253-2665 (phone), 617-258-6855 (fax).

2
Advance Market Commitments for Vaccines Against Neglected Diseases: Estimating Costs and Effectiveness
Abstract The G8 is considering committing to purchase vaccines against diseases concentrated in low-income countries (if and when desirable vaccines are developed) as a way to spur research and development on vaccines for these diseases. Under such an “advance market commitment,” one or more sponsors would commit to a minimum price to be paid per person immunized for an eligible product, up to a certain number of individuals immunized. For additional purchases, the price would eventually drop to close to marginal cost. If no suitable product were developed, no payments would be made. We estimate the offer size which would make revenues similar to the revenues realized from investments in typical existing commercial pharmaceutical products, as well as the degree to which various model contracts and assumptions would affect the cost-effectiveness of such a commitment. We make adjustments for lower marketing costs under an advance market commitment and the risk that a developer may have to share the market with subsequent developers. We also show how this second risk could be reduced, and money saved, by introducing a superiority clause to a commitment. Under conservative assumptions, we document that a commitment comparable in value to sales earned by the average of a sample of recently launched commercial products (adjusted for lower marketing costs) would be a highly cost-effective way to address HIV/AIDS, malaria, and tuberculosis. Sensitivity analyses suggest most characteristics of a hypothetical vaccine would have little effect on the cost-effectiveness, but that the duration of protection conferred by a vaccine strongly affects potential cost-effectiveness. Readers can conduct their own sensitivity analyses employing a web-based spreadsheet tool. JEL: I18, O19, O31, O38 Keywords: advance market commitment; R&D; pharmaceuticals; vaccines

3
1. Introduction
Compared to the social need, there is a dearth of research and development (R&D) on
vaccines for diseases concentrated in low-income countries. One commonly cited estimate is that
half of all global health R&D in 1992 was undertaken by private industry – but that less than five
percent of that was spent on diseases specific to poor countries (WHO, 1996).
Biotechnology and pharmaceutical (“biopharmaceutical”) firms that operate under a profit-
maximizing business model are likely reluctant to invest in R&D for such diseases if they fear they
may be unable to sell a vaccine at prices that would cover their risk-adjusted costs. Low anticipated
prices reflect both the poverty of the relevant populations as well as at least two severe distortions
in markets for vaccines for these diseases.
First, governments and other institutions that buy vaccines for these diseases (such as
bilateral and multilateral aid agencies) face a time-inconsistency problem. Once biopharmaceutical
companies have invested in the R&D necessary to develop vaccines, governments and international
organizations often use their powers as dominant purchasers and arbiters of intellectual property
rights to keep prices close to marginal cost. Because the largest part of the industry’s expenditures
lies in the initial R&D cost (while the variable costs of production are typically modest), near-
marginal cost pricing likely implies negative total profits from the investment, thereby deterring
industry from investing in the first place.
Second, the knowledge generated by research on these diseases is an international public
good. Because the benefits of scientific and technological advances spill over to many nations,
none of the many small countries that would benefit from vaccines for diseases like malaria,
tuberculosis, or HIV have an incentive to encourage research by unilaterally offering to pay higher
prices.

4
One proposal which could potentially address both market failures would be for purchasers
(for example, foreign aid donors) to undertake advance market commitments for desired vaccines –
to commit, in advance of product development and licensure, to fully or partially finance vaccine
purchases for poor countries at a pre-specified price. As we discuss in Section 2, such
commitments could create market incentives for firms to develop needed vaccines. If no vaccine is
developed, no donor funds would be spent.
This type of policy initiative has recently been gathering momentum. A working group
convened by the Center for Global Development in Washington, DC, with financial support from
the Bill & Melinda Gates Foundation, recently released a report exploring the details of how such a
commitment could be implemented (Barder et al., 2005). In November 2004 Britain’s Chancellor
of the Exchequer, Gordon Brown, announced that the UK government, working in cooperation
with other donors, would be willing to enter into an advance market commitment for a malaria
vaccine (Brown, 2004); the Chancellor later announced that the UK will also explore the use of
advance market commitments for HIV vaccines. In December 2005 the G7 finance ministers
announced an agreement to work with others on developing a pilot advance market commitment
(HM Treasury, 2005), and further statements of support were issued by several countries at the July
2006 G8 Summit in St. Petersburg, Russia (G8 Information Centre, 2006).
In this article, we first provide a brief background on the structure of advance market
commitments (Section 2). We then estimate what size of a commitment would provide a market
comparable to those of existing biopharmaceuticals (Section 3), discuss the cost-effectiveness of
commitments for vaccines against three diseases concentrated in low-income countries (malaria,
tuberculosis, and HIV/AIDS) (Section 4), and conduct sensitivity analyses of such commitments
under various contract models and assumptions (Section 5).
5
To preview our results, we find that a commitment to pay $13-$15 per person immunized
for the first 200 million people would provide a market comparable in size to the net present value
(NPV) of revenues earned by the average of a sample of recently launched commercial products,
adjusted for lower marketing costs. If sponsors wished to generate a similar level of competition as
has been observed in vaccine markets in recent years, a price of $22-$25 would likely be more
appropriate (depending on the disease). We use these benchmark commitment sizes along with
estimates of the benefits of such a commitment (measured in terms of reduced disease burden) to
estimate the cost-effectiveness of such commitments for the cases of malaria, tuberculosis, and
HIV/AIDS. We show that under a reasonably conservative set of assumptions, a commitment of
this size would be highly cost effective from a public health perspective for any of these diseases.
For example, a malaria commitment of $15 for the first 200,000,000 individuals immunized would
cost less than $15 per year of life saved; for tuberculosis a commitment of similar magnitude would
cost $31 per year of life saved; and for HIV/AIDS, $17.
We also examine the more complex issue of the value of the commitment in accelerating
the development and distribution of a vaccine, using malaria as an example, and find that even in
the extreme case in which a commitment accelerated vaccine development by only one year and
adoption in poor countries by only two years, a malaria commitment would cost about $80-$90 per
additional year of life saved—still less than commonly-cited cost-effectiveness benchmarks for
health interventions in poor countries.
2. Brief background on advance market commitments
As described in the Introduction, this paper focuses on two issues related to advance
market commitments: first, what size of a commitment would provide a market comparable to
those of existing biopharmaceuticals (Section 3); and second, how cost-effective would such
6
commitments be under various contract models and assumptions (Sections 4 and 5). Other issues
relevant to advance market commitments are discussed elsewhere; for example, Kremer and
Glennerster (2004) discuss the rationale behind such commitments as well as design details, and
Berndt and Hurvitz (2005) discuss some of the legal and economic practicalities of structuring
advance market commitments.
In this section we describe the basic structure of advance market commitments, and then
discuss one design issue of particular relevance for estimating the appropriate size of such
commitments – namely, the treatment of second and subsequent market entrants.
Basic structure of advance market commitments
The basic structure of an advance market commitment is that sponsors commit (in advance
of product development and licensure) to fully or partially finance purchases of vaccines for poor
countries at a pre-specified price. A program sponsor or coalition of sponsors that potential
investors in R&D would find credible (i.e. sponsors that are financially solvent and thought to be
unlikely to renege on a commitment) would sign a contract underwriting a guaranteed price for the
vaccine supplier. Poor countries would decide whether to buy a given product at a low and
affordable price (say, $1 per treatment), and sponsors would guarantee to top-up to a higher price
(say, $15 per treatment) – thus providing market returns for the developer which are comparable to
other average-revenue biopharmaceutical products. Once the full number of treatments has been
purchased at the guaranteed price, the supplier would, in return, be committed to either selling
further treatments at an affordable price in the long-term, or to licensing the technology to other
manufacturers. Although not part of the contract, there would be nothing to stop the original
sponsors or other donors from covering the $1 price on behalf of poor countries at the time of
purchase.
7
For private firms, this type of advance market arrangement would reduce the political risk
that firms would be forced to sell their product at a very low price, and thus would give investors
confidence about the returns they could expect if the relevant scientific challenges were overcome.
It is important to note that advance market commitments would not eliminate all risk to developers.
In particular, the scientific challenges and associated risks (as in markets for diseases prevalent in
rich countries) would be considerable, and the risk of failure high. But advance market
commitments would greatly reduce the risks that are particular to markets for diseases concentrated
in poor countries—especially the risk that once R&D investments had been made, a company
would face enormous pressure to sell the product at a very low price. In terms of R&D allocation
decisions, advance market commitments would therefore put diseases like malaria or tuberculosis
on a more equal footing with health conditions prevalent in affluent populations.
Second and subsequent market entrants
In calculating the commitment size necessary to put vaccines for diseases common in low-
income countries on an equal footing (in terms of research incentives) with products for diseases
prevalent in rich countries, a key design question is how an advance market commitment would
deal with second and subsequent market entrants. As discussed by Kremer and Glennerster (2004),
advance market commitments can potentially be structured in a variety of ways to cover the case in
which more than one vaccine is developed – ranging from, on one hand, giving no preference at all
to the first vaccine (relative to later entrants) to, on the other hand, providing the entire reward to
the developer of the first qualifying vaccine Appropriately balancing various considerations would
require judgment calls on the part of sponsors about how they wanted to design the commitment,
but it is worth briefly mentioning several relevant issues, both static and dynamic.
8
From the perspective of static efficiency, if a superior product becomes available it should
be used. From a dynamic standpoint rewards to individual developers should ideally reflect the
marginal value of each vaccine to society; while it is difficult to precisely measure that marginal
value, a system should aim to generate at least a rough correspondence between innovation
incentives and the value of the innovation. Once a qualifying vaccine is developed, the incremental
benefit of subsequent vaccines will typically be smaller, suggesting that in most cases it will
typically be appropriate to provide smaller rewards for subsequent vaccines than for the initial
vaccine, particularly if the subsequent vaccine is developed significantly later (in which case a
large portion of R&D expenditures for the subsequent entrant would have been incurred after the
successful launch of the first product was clear). It is also worth noting that providing favorable
treatment to subsequent products will tend to reduce incentives for the first developer, holding
constant the total size of a commitment: to the extent funds are used for subsequent developers,
they cannot be used to provide incentives for the first developer. Moreover, the provision of
incentives for subsequent developers will likely also lead to reduced expected revenues for the first
developer on commercial markets outside the advance market commitment. Overall, these
considerations suggest that R&D on subsequent vaccines should only be rewarded if it leads to
products with some superior characteristics.
Along these lines, the Center for Global Development report (Barder et al., 2005)
recommends a mechanism similar to the “clinical superiority” clause embodied in the US Orphan
Drug Act. The US Orphan Drug Act, which went into effect in 1983, created a number of financial
incentives for biopharmaceutical companies to develop drugs for diseases such as Huntington’s,
ALS (Lou Gehrig’s disease), and muscular dystrophy – diseases which affect fewer than 200,000
people in the US and therefore have a limited market. The primary attraction for companies under
this legislation was a promise of seven years of market exclusivity – unless a follow-on product
9
was approved that was deemed to be “clinically superior.” The legal interpretations of this clause
are beyond the scope of this paper, but in summary a product can be deemed clinically superior if it
has shown greater effectiveness on a clinically meaningful endpoint – the demonstration of which
most often requires direct comparative clinical trials.2 It is worth noting that the legal
interpretations of this superiority clause (in particular, the “same vs. different” issue of whether two
structurally similar drugs may be deemed “different” enough to justify multiple approvals for a
given disease) have at times been controversial – for example, in the case of two drugs approved
under the US Orphan Drug Act for human growth hormone (for legal analyses see Bohrer and
Prince, 1999; Rin-Laures and Janofsky, 1991).3 We here do not focus on such issues, but note that
they would need to be carefully crafted in the design of advance market contracts.
This superiority clause approach accomplishes a number of the goals we discussed above:
first, it fashions incentives to appropriately reward development of the initial vaccine; second, it
creates incentives to improve on the original vaccine; and third, it delivers the best available
vaccines to patients.
To obtain a sense of how such a clause has worked in practice and how frequently
clinically superior products have been approved, we examined the example of the US Orphan Drug
Act. As of January 2006, approximately 280 drugs have been approved under the Act4 – only
around three of which (two treatments for multiple sclerosis, one for coagulation factor IX) were
allowed as second entrants to markets for which a previous drug had been approved under the US
2 For more information on the regulatory structure of the US Orphan Drug Act, see the website of the US Food and Drug Administration (FDA)’s Office of Orphan Products (http://www.fda.gov/orphan/lawsregs.html, accessed 30 May 2006). 3 Rin-Laures and Janovsky (1991) note the following regarding clinical superiority in the context of the US Orphan Drug Act: “A second drug is superior if it is (1) more effective, (2) safer, or (3) otherwise makes a major contribution to patient care, such as providing an oral form of the drug that is usually administered intravenously. This is an appropriate policy because it promotes research on safer or more effective versions of a drug that would otherwise be chilled by the presumption of ‘sameness.’”
10
Orphan Drug Act.5 These figures imply that over the entire period during which the US Orphan
Drug Act has been in place (that is, since 1983) only one percent of drugs that have been approved
were approved as subsequent market entrants anytime over the time period. In the next section we
examine how having such a clause in an advance market commitment would be taken into account
in estimating the necessary size of a market commitment.
3. Estimates of the appropriate size of a vaccine market commitment6
Before delving into the details of various approaches to calculating market size, it is worth
first noting that at least for vaccines that are currently in fairly early stages of development, and for
which no single firm has a clear lead, larger commitment sizes will in expectation lead more firms
to enter and more resources to be invested by each participating firm in the search for a vaccine. No
single magic commitment size is the “correct” amount needed to incentivize research, below which
no research will take place and above which further resources will be wasted. As in standard
markets, many different biotechnology and pharmaceutical firms will make a series of decisions
about which projects to pursue, how far to take them, whether to continue pursuing them in the face
of setbacks, and which personnel to assign to the projects. These decisions will be influenced by
the size of the commitment as well as by the number of competitors with whom a firm expects to
potentially share revenue. At least to a first approximation, new firms will enter (and existing firms
will invest more) until the net present value of investment for the marginal firm drops to zero. In
expectation, increases in commitment size will be competed away through additional entry while
more entry will on average increase the probability that a workable vaccine is developed and
4 On drug approvals under the US Orphan Drug Act, see the website of the US Food and Drug Administration (FDA)’s Office of Orphan Products (http://www.fda.gov/orphan/designat/list.htm, accessed 30 May 2006). 5 Information on subsequent market entrants approved under the “clinically superior” clause was obtained by a phone conversation with Peter Vaccari, RPh, RAC of the US Food and Drug Administration.

11
increase the speed with which it is produced. Donors contemplating an increase in commitment
size must trade off the risk of inefficient duplication of effort against the benefit of a shortened
expected wait for a vaccine and the possibility of obtaining a better vaccine due to more entrants.
Rather than attempt to guess how much it would cost to develop a vaccine for a disease
such as HIV, our strategy is therefore to ask how large a commitment would be needed to give
developers incentives comparable to product markets for diseases prevalent in rich countries. To
outline our approach as described in this section, we first estimate the net present value (NPV) of
revenues earned by a sample of recently launched commercial pharmaceutical products. We then
adjust this figure to account for the fact that developers of a vaccine under an advance market
commitment would likely have lower marketing costs, and thus require somewhat lower revenues
to generate the same incentive to invest in R&D.7 We also adjust for the fact that the revenue from
the commitment may potentially be shared between several successful developers (whereas our
revenue figures are for individual products).
Analysis of sales revenue data
The most recent comprehensive evidence of sales revenues for biopharmaceutical products
is a paper by Grabowski et al. (2002) in which the authors report on 118 new chemical entities
(NCEs) that were introduced into the US pharmaceutical market between 1990 and 1994.8 An
important finding in the Grabowski et al. paper is that the revenue distribution over the sample set
6 For details on the sales revenue data used in this section, see the Appendix. This data is also available upon request from the authors. 7 See Berndt et al. (2003)for other approaches and further discussion. 8 Grabowski et al. (2002) note this is a comprehensive sample of the NCEs originating from and developed by the pharmaceutical industry that were introduced into the US in the 1990 to 1994 time period. Due to data limitations we are unable to address whether the sales revenues of this sample of self-originated NCEs is a representative sample of the sales revenues of all commercial pharmaceutical products. Sales revenue data from a larger sample of products is available from (for example) IMS Health or Scott Levin Associates, but is very expensive. Further work could attempt to pursue this and other potential sources of larger samples of sales revenue data.
12
of products is not only widely distributed, but is also highly skewed.9 In particular, in the
Grabowski et al. sample the top selling 10 percent of products earn approximately half of the total
market revenues (in terms of worldwide sales). Using separate estimates of the cost of
pharmaceutical development, Grabowski et al. also find that sales revenues of the median NCE are
insufficient to break even, implying the mean sales revenue may provide a more reliable estimate
of what level of expected revenues may be effective in spurring industry investment.
We obtained the sales revenue data compiled by Grabowski et al. (2002). The analysis
presented in Grabowski et al. utilized this sales data in combination with estimates on the cost of
pharmaceutical development in order to estimate total returns; we do not use those cost of
development estimates nor any other cost of development estimates in our benchmark market size
analysis. As discussed above, our strategy is to use sales revenue data alone to estimate the size of
commitment needed to generate a market comparable in size to the sales revenues of products in
the Grabowski et al. sample.
To transform the revenue stream into a net present value, we assume an estimated industry-
wide real cost of capital (that is, earnings foregone on other investment opportunities) of eight
percent, close to the annual average return on the stock market (Siegal, 1998).10 This real rate of
eight percent is equivalent to a nominal cost of capital of eleven percent, assuming three percent
inflation. Using the sales revenue data together with this assumption of an eight percent real cost
of capital, the NPV of revenues (pre-tax, and gross of plant, equipment, promotion and marketing,
9 This finding is consistent with the findings of analogous earlier work on products introduced in the 1980s, such as that reported in Grabowski and Vernon (1990). 10 Siegal (1998) estimates that the annual average return on the stock market over the time period from 1946-1998 was 7.8 percent (p. 318). We approximate this to eight percent for our analysis. We do not use the average return for pharmaceutical companies because – for a number of reasons – returns from an advance market commitment (which is public sector sponsored) would likely differ from returns in other private sector markets.
13
production, and distribution costs) derived over the life cycle of the average product in the
Grabowski et al. sample is $3.44 billion (in 2004 dollars).11
The revenues reported by Grabowski et al. (2002) are partially spent on marketing. Since
under a vaccine market commitment a potential vaccine manufacturer would likely need to spend
considerably less than average on marketing, we take this into account and consequently adjust
downward the above total revenue figure. Rosenthal et al. (2002) estimate that, relative to sales,
expenditures on promotion by US pharmaceutical companies have remained fairly constant at
about 15 percent of revenues, and have fallen slightly since 1998.12 It is plausible, however, that
promotion/sales ratios are lower in Europe and elsewhere globally. In this sense the 15 percent
number can be interpreted as an upper bound of what should be deducted from the overall market
commitment size. Furthermore, in the US the 15 percent ratio is partly the result of an accounting
nuance in which values of free samples given to physicians by drug representatives are assessed at
average retail price, not manufacturer's production costs. For most drugs, relative to average retail
price manufacturers' marginal drug production costs are quite low. Moreover, samples comprise
about 50 percent of drug manufacturer's total promotional costs in the US (see Rosenthal et al.,
2002). Given these considerations, reducing the commitment size by ten percent as a rough
adjustment for promotional/marketing expenditures seems appropriate. After this adjustment, the
11 The appropriate level at which to set the cost of capital is somewhat controversial. Grabowski et al. (2002) assume a real cost of capital of eleven percent, and previous analyses by two of the present authors (Kremer and Glennerster, 2004) used this assumption in calculating the NPV of revenues from existing commercial products. In this current work, our preferred estimates use an assumed eight percent real cost of capital for two reasons. First, eight percent is close to the annual average return on the stock market (Siegal, 1998). Second, this allows for consistency in our analysis between estimating the NPV of revenues of existing products and estimating the NPV of revenues under a vaccine market commitment. With an eleven percent real cost of capital, the NPV of revenues for the average product would be $2.81 billion rather than $3.44 billion. 12 It is worth noting some argue that in fact marketing and related promotion expenditures are a much higher percent of revenues; Angell (2004), for example, argues they may be as high as 36 percent of revenues. While precise measurement of this ratio is inherently difficult (and controversial, given difficulties in allocating some educational and R&D activities as partly promotional), we note that the larger percentages, such as those cited by Angell, typically refer to total selling and general administrative (S&GA) expenses.
14
program would need to pay out $3.1 billion to match the average revenue brought in by existing
NCEs.
Although it is difficult to formalize into a rigorous analysis, a useful benchmarking
exercise for our market size estimate is provided by the rules of thumb venture capitalists and
pharmaceutical analysts say they use in thinking about new potential products. These opinions can
arguably serve as one rough check on our estimates as derived above. A common perception
among analysts and potential developers (as well as many in industry) is that large
biopharmaceutical companies need to anticipate annual sales of $500 million or more in years with
peak sales in order to be willing to invest in R&D for a new product (see Robbins-Roth, 2000).
Assuming the typical product life cycle as in Grabowski et al. (2002) and a real cost of capital of
eight percent, after adjusting down by ten percent for lower marketing costs this rule-of-thumb
corresponds to an NPV of about $3.38 billion, a number fairly close to that which our procedure
yields.13
Potential market size adjustments
While revenues for existing products arguably give us a good sense of the market size
sufficient to generate the development of new products, there are several ways in which an advance
market commitment differs from a standard market, and in calculating the appropriate commitment
size sponsors may wish to adjust for some of these differences. In this sub-section we discuss
several potential adjustments – such as that some vaccines may have received substantial direct
public or philanthropic support, and the risk that a developer might have to share the market with
another product. Wherever possible we draw on the historical record in order to estimate how large
These S&GA expenditures include non-marketing related general administration, and therefore likely overstate total marketing and related promotion expenditures. 13 With an 11 percent real cost of capital (as in Grabowski et al., 2002), this figure changes from $3.38 billion to $2.76 billion.
15
an adjustment would be necessary to reflect these differences between an advance market
commitment and a standard market.
While many biopharmaceutical products included in the Grabowski et al. (2002) data have
benefited from public and nonprofit investment in R&D in their development, certain diseases that
are likely to be the focus of advance market commitments may arguably have attracted more than
average attention from governmental and philanthropic sponsors. Research into a malaria vaccine,
for example, has received significant financial support from the Malaria Vaccine Initiative, which
in turn is supported by the Bill & Melinda Gates Foundation. Because this direct funding offsets
some of the costs of development, the appropriate commitment size would be smaller. The
magnitude of this adjustment would differ across diseases. A commitment could also potentially
be designed so as to explicitly adjust the reward based on the amount of direct funding that had
been received from various donors prior to the announcement of the advance market commitment.
(Subsequent funders could presumably work out – directly, with developers – arrangements they
felt were appropriate.)
Similarly, the commitment size should take into account how far along in the development
pipeline a vaccine is—namely, the more developed a vaccine is, the lower the appropriate
commitment size relative to our revenue-based estimates. Again, this adjustment would be
calculated on a disease-by-disease basis. For products such as a rotavirus vaccine which are in
very advanced stages of development, the necessary size of a commitment could be much smaller;
for intermediate stage products such as a malaria vaccine (where, as we discuss in Section 4, there
are already candidate vaccines) the size of a commitment may need to be adjusted downward; and
for very early-stage vaccines such as for HIV or tuberculosis the benchmark market size estimates
we discuss here may be appropriate.

16
On the other hand, the revenue data we use (by its nature) covers existing products and
thus includes the “low-hanging fruit” of products that were relatively easier to develop. To the
extent that there is a general consensus that developing (for example) an HIV vaccine is more
technologically challenging than developing the typical product, the appropriate commitment size
would be greater. As no one knows how much it will cost to develop these vaccines, any
adjustment of this kind would necessarily involve considerable judgment calls.
The Center for Global Development Working Group (Barder et al., 2005) recommended
setting a commitment comparable in size to the net present value of revenues for an average new
chemical entity. If the value of the market were set at this level, firms would be willing to enter
(assuming technological opportunities were similar to those for typical developed country
products) but would not be willing to accept a high risk of having to share the market, or a high risk
of being beaten to the market by another vaccine. Thus, in equilibrium we would expect entry, but
at a lower level than in average, standard markets.
If sponsors wish to create incentives designed to generate the typical level of competition
in the vaccine market, a larger commitment would be needed. The more likely a commitment is to
be split between different products (i.e. the more subsequent entrants there are likely to be) the
larger the commitment needed to generate the same incentive for investing in R&D to develop a
vaccine.
If sponsors wish to spur enough entry that multiple products are likely to be developed, it
may be appropriate to set the commitment size such that a successful vaccine developer could
anticipate receiving revenue similar to that in the Grabowski et al. (2002) revenue data even with
substantial competition and sharing of the market.
The commitment size necessary to encourage a particular amount of entry (with the goal of
either advancing the date a vaccine is developed or leading to the development of superior

17
vaccines) depends on the rules of the commitment regarding subsequent developers. One problem
is that in the absence of a superiority clause, a larger commitment size could potentially lead to
entry of firms aiming for an earlier vaccine or a better vaccine, but it could also lead to entry of
firms seeking merely to produce a “me too” product so as to obtain revenue that would otherwise
go to competitors. As discussed in Section 2, our benchmark assumption is based on the Center for
Global Development proposal (Barder et al., 2005), under which a commitment would allow
competition from subsequent entrants, but only if qualifying under a clinical superiority clause (for
at least some populations). Including a clinical superiority clause would accomplish the goals of
appropriately rewarding development of the initial vaccine, creating incentives to improve on the
original vaccine, and delivering the best available vaccines to patients. From the perspective of a
developer who perceives having a substantial chance either of being first or being superior, a
superiority clause has the advantage of reducing the likelihood of having to share the market with a
subsequent non-superior entrant. Under a commitment with a superiority clause a developer who is
far behind in a race and does not anticipate their product being superior for at least some
populations will drop out of the race. This is socially efficient because there is little value to society
of having a second vaccine that is no better than the first.
To illustrate, suppose that sponsors wanted to generate sufficient entry such that each
potential developer would expect that if they succeed in developing a qualifying product, they
would be competing with one other qualifying product – either by sharing the market or by
engaging in a race to produce a licensed qualifying product with another firm that would ultimately
produce such a product. Suppose also that sponsors wanted to provide each firm with an amount of
revenue comparable to that obtained by the typical new chemical entity. In that case, it would be
necessary to apply an adjustment factor of two – thus offering twice the amount discussed above,
or slightly more than $6 billion.
18
Sponsors might reasonably wish to offer each successful developer expected revenues
similar to our $3.1 billion benchmark while also encouraging a similar degree of entry as currently
found in other vaccine markets. Below we examine the number and timing of entrants in the
markets for nine recently developed vaccines (hepatitis A, hepatitis B, haemophilus influenzae type
b [Hib], meningococcal, pneumococcal, varicella, rubella, measles and mumps).14 We calculate
how many vaccines were developed for a given disease within a six year window of the first
entrant being licensed, and how many of these subsequent entrants would likely have been
considered superior to the initial entrant. This allows us to examine the cost of inducing a certain
amount of entry of “high social utility” products (i.e. the original entrant in addition to superior
products) depending on the amount of revenue committed and the rules of the program.
In our data, on average 2.3 vaccines were developed for each disease in the six year
window after approval of the first vaccine (or 2.6 if we use data from pre-1980, which is arguably
inappropriate given that in the 1960s and 1970s the vaccine industry was much less consolidated
than it is today). We use a somewhat arbitrary cut off of six years for two reasons. First, under an
advance market commitment the original developer need not worry about sharing the market with a
vaccine which will be approved six years later because the commitment will likely be exhausted by
that time; second, being six years behind in such a race would arguably deter subsequent
developers from undertaking heavy investments. Because a large proportion of development
expenditure occurs in the final few years before a vaccine is approved, a similar argument holds (to
a lesser degree) for years two through six as well.15
14 We collected data from a number of sources (primarily historical documents from the US Centers for Disease Control and US Food and Drug Administration) on vaccine approvals and characteristics (efficacy, number of doses, etc.) that could be used to determine whether a given non-initial entrant would likely have been considered superior. Documentation of our data and assumptions is available upon request from the authors. 15 For example, survey data suggests that Phase III clinical trials represent approximately two-thirds of the costs of development (DiMasi et al., 2003).
19
For example, it seems likely that if a superiority clause is in place, a developer may be
unlikely to proceed with phase III trials if a vaccine has already been approved under an advance
market commitment and the developer does not believe its vaccine will qualify under a superiority
clause. This represents an efficiency gain and also means the commitment size need not be adjusted
upwards (because donors have no interest in stimulating another vaccine that is no better than the
first). In calculating our adjustment factor we therefore place a lower weight on entrants who enter
two to six years after the initial approval.16 Taking into account this weighting for products which
would likely have been considered non-superior, the average number of (weighted) entrants is 1.69
using data since the 1980s (or 2.14 including data from the 1960s and 1970s). In other words the
commitment size would have to be 69 (or, respectively, 114) percent larger in order to provide
revenues similar to that from the typical new chemical entity for each product while also generating
a level of competition historically associated with the vaccine industry.
This calculation is also instructive is estimating the value of the superiority clause. Without
a superiority clause it would be necessary to compensate initial developers more for the risk of
sharing the market with a second, possibly non-superior entrant. Based on our data as described
above, without a superiority clause the adjustment factor would need to be 2.33 (using data from
the 1980s forward), relative to our 1.69 estimate with a superiority clause. On the base of a
benchmark $3.1 billion NPV revenues per product, this translates into a commitment size of $5.24
billion with a superiority clause and $7.22 billion without a superiority clause—implying that the
superiority clause may save donors $1.98 billion while creating the same incentive to develop the
first vaccine or vaccines judged likely to be superior.
16 Specifically, a weight of 0.25 is applied to non-superior products entering between two and six years after the initial entrant. This assumption was informed by estimates of the percentage of expenses spent on various phases of clinical trials as well as the assumption that entrants less than two years out would likely not abandon their late phase II and phase III trials which together are estimated to represent approximately three-fourths of the costs of development (DiMasi et al., 2003).

20
On a separate point, it is also worth noting that if donors wish to encourage subsequent
market entrants (for example, to obtain a vaccine with a higher rate of efficacy), it would be
possible to add additional market commitments (for the same disease) at a later date with this goal
specifically in mind. Since we estimate that the bulk of the NPV of revenue associated with a
successful product under an advance market commitment comes within the first three to five years,
it is unlikely that the possibility of such subsequent commitments would substantially affect the
calculations.
In Table 1, we report the necessary NPVs of sales that would make the total market for a
desired vaccine comparable to that of five different representative products from the Grabowski et
al. (2002) sample, corresponding to the averages of the five upper deciles of the sales distribution.17
(Specifically, in the first decile, the reported number represents the average among the top selling
10 percent of NCEs. For the second decile, it is the average of the next 10 percent, etc.).
The average product lies in the fourth decile of sales, and it can be seen in the table that the
top two deciles of the distribution generate the largest portions of sales revenues. Therefore, if the
development of a vaccine were considered of very high social value it might be seen as appropriate
to attempt to create an incentive that matched some of the best selling drugs for rich country
diseases as a way to generate the multiple large scale research projects we observe for (for
example) diseases such as hypertension or cancer. The size of the commitment needed to match
these markets would need to be substantially increased given the skewed distribution of revenues
seen in the data.18
17 Figures for the 1st decile, 2nd decile, and average product are taken directly from Grabowski et al.’s data. Deriving the 3rd, 4th, and 5th decile figures required slight approximation due to data limitations. Details on these calculations are available from the authors. 18 It is noteworthy that very few of the products in the Grabowski et al. (2002) sample are likely to be vaccines. Among existing vaccines, the hepatitis B vaccine may provide the best comparison to our hypothetical malaria vaccine, as it is a relatively new antigen that has seen a widespread increase in demand during the last decade. As evidence of a demand-induced R&D activity, Finkelstein (2004) reports an increase in R&D investment on hepatitis B vaccines in response to the Advisory Committee on Immunization

21
To summarize our work in this section, an estimate of the net present value of revenues
that a vaccine advance market commitment would need to offer in order to match existing
commercial products would be $3.1 billion, in year 2004 dollars. Because the starting year of
purchases under the program is highly uncertain, the commitment should be indexed to account for
inflation; here we express all monetary values in 2004 dollars. In this section we also discussed
various reasons why donors may wish to adjust this benchmark figure upwards (for example,
because of potential subsequent, superior market entrants) or downwards (for example, because of
more directly-financed R&D than for a typical disease prevalent in developed countries); for the
remainder of this paper we focus on the benchmark $3.1 billion figure, but as we discuss in Section
4 readers can make calculations with adjusted figures using our web-based spreadsheet tool.
4. Cost effectiveness of a vaccine advance market commitment
We now consider the net present value of revenue and health cost-effectiveness estimates
that would be generated by a vaccine advance market commitment for three specific diseases
(malaria, tuberculosis, and HIV/AIDS) under various scenarios. These estimates have been
generated by a spreadsheet tool (available online at
http://post.economics.harvard.edu/faculty/kremer/vaccine.html) that allows the user to manipulate
all relevant variables in a flexible way, thereby permitting the generation and analysis of a large
number of different scenarios.
In the discussion below we provide details on the case of malaria as an illustration of the
type of calculations and assumptions that are necessary for this work. In Section 5, we also focus
Practice (ACIP) recommendation in 1991 to give hepatitis B immunization to US infants. Immunization rates strongly increased thereafter, to almost 90 percent, and a significant number of additional clinical trials were conducted. The worldwide market for hepatitis B vaccines currently lies at around $1 billion annually, which makes the set of all hepatitis B vaccines comparable in market size to a single product with a NPV of sales (assuming an eight percent real cost of capital) of approximately $6.49 billion. Details of this calculation are available from the authors.

22
on the example of malaria in illustrating to which parameters the cost effectiveness results are and
are not sensitive. We chose to focus on malaria since it is a disease for which it is relatively more
straightforward to make assumptions about who would be vaccinated and how, because (as we
discuss below) there are natural existing delivery systems through which to reach the two target
risk groups (namely, children under the age of five and woman pregnant for the first time). In
contrast, for diseases such as HIV and tuberculosis there are complex questions about who should
be vaccinated that are beyond the scope of this paper. However, as we make clear below, most of
the general conclusions below apply to vaccines for any of the three diseases.
To obtain concrete cost effectiveness numbers we also need to consider a particular set of
contract provisions and vaccine characteristics including assumptions about which countries would
participate in the program, vaccine adoption rates, and sources of additional revenue to the vaccine
supplier (e.g. travelers’ or military purchases). These parameters and assumptions can be modified
in the spreadsheet, thus allowing the user to investigate the impact of alternative contract
parameters and different assumptions regarding take-up, disease burden, etc. For example, the
spreadsheet allows the user to assess the revenue and cost-effectiveness consequences of different
combinations of price, quantity, and vaccine characteristics. Based on the user inputs as well as
recent data compiled on disease burden and population, the spreadsheet outputs the cost per
disability adjusted life year (DALY) saved by the program and the NPV of revenues that would
accrue to the vaccine supplier.19
Since the values of revenues and cost per DALY saved are expressed in real terms at the
time the vaccine is developed, even though altering the years until a vaccine is developed will
change the nominal price paid, it will not alter the results of the calculations presented here.
19 Disability adjusted life years, or DALYs, are a commonly used metric which attempt to account for both life lost due to premature death and the loss of healthy life resulting from disease morbidity or disability.

23
The calculations presented in this section are intended to demonstrate that, once a vaccine
is developed, purchasing vaccine at the pre-specified price would be a very cost-effective
expenditure. In Section 5 we examine cost-effectiveness in the context of a somewhat more
complex issue – namely, the value of the commitment in accelerating the development and
distribution of a vaccine.
As a benchmark for cost-effectiveness comparisons, we note that health interventions in
the poorest countries are generally regarded as highly cost effective if they cost less than $100 per
DALY saved (World Bank, 1993).20 More recently a country’s gross national product (GNP) per
capita has also been used as a benchmark (GAVI, 2004; WHO, 2000a) and in the United States, the
cost-effectiveness threshold is estimated to be as high as $50,000 to $100,000 per DALY saved
(Neumann et al., 2000). As an alternative benchmark, even at the lowest of recently negotiated
estimates of prices for antiretroviral drug treatments for HIV, the cost of purchasing and delivering
antiretrovirals using a directly observed treatment short-course (DOTS) is estimated to cost $613
per year of treatment.21
To summarize our results, we find that under a reasonably conservative set of assumptions,
a commitment to pay $15 per person immunized for a malaria vaccine (or $5 per dose for a three-
dose vaccine) for the first 200 million people immunized (as recommended by the Center for
Global Development report [Barder et al., 2005]) would cost less than $15 per DALY saved,
including both purchase and delivery costs of the vaccine. Sales under the program would provide
about $3.2 billion in total NPV of revenues to the vaccine developer, comparable to the $3.1 billion
20 In 2004 dollars, this would be approximately $128. 21 Although estimates of the cost of antiretroviral treatment per year of life saved are sensitive to assumptions about the cost of delivery and the epidemiological effects of treatment (which could be either positive or negative, depending on behavioral response), the 2001 call by 133 Harvard faculty members for antiretroviral treatment (Adams et al., 2001) estimated that purchasing and delivering antiretrovirals using a DOTS approach would cost $1,100 per year. That analysis assumes an average cost of $650 per patient per year for costs of antiretrovirals. Adjusting that analysis for the lowest of the recently negotiated estimates of

24
in total NPV of revenues of the average product as discussed in Section 3. If sponsors wanted to
generate more competition, compensate developers for the risk that they might have to share the
market and increase the likelihood of a vaccine being developed more quickly, they could offer a
price of $28 per person immunized for the first 200,000,000 people immunized. Even in the
absence of potentially moving forward the date of vaccine development, this would generate a
market of $5.2 billion and cost less than $21 per DALY saved. This result is derived from baseline
assumptions which are detailed below for the case of malaria.
Although we here do not focus on the details of our calculations for tuberculosis and
HIV/AIDS (these assumptions are described in detail in the spreadsheet tool), it is worth briefly
summarizing our main results for these diseases. For tuberculosis, under conservative assumptions
similar to those for malaria and a similar contract design, our simulations suggest that a
commitment to purchase a tuberculosis vaccine at $13 per person immunized for the first 200
million people immunized would cost $31 per DALY saved and would generate $3.3 billion in
total NPV of revenues to the vaccine developer.22 For the case allowing subsequent entrants under
a superiority clause, the analogous figures are a slightly higher but still modest cost per DALY
saved (less than $44) and $5.2 billion in total NPV of revenues to the vaccine developers.
For HIV/AIDS, again using conservative assumptions and a similar contract (namely, $14
per person immunized for the first 200 million people immunized), our simulations suggest that a
commitment to purchase an HIV vaccine would cost less than $17 per DALY saved and would
generate about $3.3 billion in total NPV of revenues to the vaccine developer.23 For the case
antiretroviral costs, $140 per year (McNeil, 2004), suggests a cost per year of treatment of approximately $613. 22 Our simulated tuberculosis vaccine would protect with 60% efficacy for 20 years, and would be adopted at rates consistent with current DPT3 rates among infants and a rate of 30% by older cohorts. 23 Several important departures from the assumptions described below for the malaria vaccine simulation are that we assume that the HIV vaccine would be delivered to school-age children at a cost of $2 per dose; that adults would adopt the vaccine at a rate of 30% in countries in which the vaccine becomes available under the program; and the vaccine would protect with 60% efficacy for 20 years.
25
allowing subsequent entrants under a superiority clause, the analogous figures are $21 per DALY
saved and $5.2 billion in total NPV of revenues to the vaccine developers. Sensitivity analyses for
the malaria case are presented in Section 5, but we note that sensitivity analyses for the HIV/AIDS
and tuberculosis cases produce similar results.
Case study: Malaria
` The World Health Organization (WHO) estimates that more than 300 million people
contract clinical malaria every year, and that 1.1 million annually die of the disease (WHO, 2001).
Children who survive severe cases of malaria may suffer learning disorders and brain damage,
although those who reach age five acquire some immunity. Those with this limited natural
immunity rarely die from malaria, but often later in life they become weak and lethargic with the
disease, thus experiencing losses in welfare and productivity. Almost all malaria cases occur in
low-income countries, and about 90 percent of the victims live in sub-Saharan Africa (WHO,
2000b).
The scientific challenges in developing an effective malaria vaccine are formidable, but in
recent years several candidate malaria vaccines have progressed to phase II clinical trials –
including at least three being studied in target (pediatric) populations in field settings (Ballou et al.,
2004). For example, a candidate vaccine from GlaxoSmithKline Biologicals (with support from
the Malaria Vaccine Initiative, the Bill & Melinda Gates Foundation, and the Mozambique
Ministry of Health) recently completed phase IIb trials, where the vaccine’s efficacy against severe
malaria disease was found to be 58 percent (Alonso et al., 2004). Two other candidate vaccines
currently being tested in pediatric populations include a vaccine candidate being led by the Walter
Reed Army Institute of Research (WRAIR), with support from the US Agency for International
Development (USAID), GlaxoSmithKline Biologicals, and Statistics Collaborative Inc.; as well as
26
a vaccine candidate being assessed by the University of Oxford, with support from the Gates
Malaria Partnership at the London School of Hygiene and Tropical Medicine, and the Wellcome
Trust.24
Many steps remain before these or other candidate malaria vaccines would be ready for
widespread use. Vaccine advance market commitments can provide financial incentives to pull
these candidate vaccines through costly phase III clinical trials and other steps required for
licensure, towards final delivery.
As discussed in Section 2, the appropriate size of an advance market commitment would
vary by disease depending on a number of factors, including how much R&D on candidate
products is being funded through directly-financed mechanisms. For the case of malaria, obviously
it is impossible to predict whether the leading GlaxoSmithKline candidate vaccine will be
successful in clinical trials. If the GlaxoSmithKline candidate vaccine is successful, a market size
commitment smaller than our benchmark size of $3.1 billion would likely be appropriate in light of
extensive directly financed R&D. On the other hand, in the case in which this GlaxoSmithKline
candidate vaccine is not successful, donors may wish to have an advance market commitment in
place to encourage the development of other candidate products – and in that case, the benchmark
commitment size of $3.1 billion may be appropriate. Such a commitment could be put in place
either now or after the realization of (for example) Phase III outcomes on the GlaxoSmithKline
candidate vaccine. Such design issues are beyond the scope of this paper, so here we simply
analyze the case in which the GlaxoSmithKline candidate vaccine is not successful, for which the
benchmark $3.1 billion commitment size may be appropriate.
24 For details on these and other candidate malaria vaccines, see Ballou et al. (2004), the World Health Organization’s website (http://www.who.int/vaccine_research/documents/en/malaria_table.pdf, accessed 30 May 2006), and the Malaria Vaccine Initiative (MVI) website (http://www.malariavaccine.org/ab-current_projects.htm, accessed 30 May 2006).
27
Contract provisions
We consider a commitment that would offer an initial price of $15 per person (in 2004
dollars) for the first 200 million people immunized, after which the price would drop to $1 per
person immunized.
Following the public health literature, we apply a default annual discount rate of three
percent to future DALYs saved and future expenses to the program sponsor. Firms, however, may
discount future revenues at a higher rate reflecting the cost of capital. We consider a real rate of
eight percent, close to the annual average return on the stock market (Siegal, 1998).
Vaccine characteristics
In our base case, we consider a three-dose, 60 percent effective vaccine that would protect
for five years and could be added to the standard package of vaccines that are delivered under the
WHO’s Expanded Programme on Immunization (EPI). That package, which includes three
contacts with each child, costs $15, or $5 for every contact (World Bank, 1993). The majority of
this cost is due to delivery costs, as the price of the six traditional EPI vaccines is very low. The
World Bank estimated that adding the one-dose yellow fever vaccine and the fairly expensive
three-dose hepatitis B vaccine to the EPI package would increase the cost of the package by 15
percent, or $2.25, including both the purchase price and the delivery cost (World Bank, 1993).
Both yellow fever and hepatitis B were expensive vaccines, so we assume that the incremental cost
of adding a three-dose vaccine to the EPI package would be no more than $0.75. However, as
discussed in the sensitivity analysis below, even at several multiples of this cost, delivery would
still be quite inexpensive. (Note that in the spreadsheet tool, extra delivery costs can be specified
for vaccines that are not compatible with the EPI schedule, but in the base case for malaria
discussed here we consider vaccines that are in conformity with the EPI schedule.)
28
Vaccine efficacy reflects the percentage of infections that are prevented by immunization,
and defaults to 60 percent. The duration of protection reflects the number of years after
immunization that the vaccine protects against infection, and defaults to five years.
Countries covered
An important set of assumptions concerns the countries that will participate in the program,
i.e. the populations for which the vaccine doses will be purchased. This selection has a
considerable impact on the effectiveness of the program, because the burden of malaria and vaccine
adoptions rates differ widely across countries. In the spreadsheet tool, we allow selection by
several different criteria, including a gross national income (GNI) per capita cutoff ($1000, the
cutoff currently used by the Vaccine Fund25, is the default), a ‘manual’ selection of countries, and a
minimum disease prevalence cutoff. In the baseline case presented here we use the $1000 GNI per
capita cutoff to define eligibility, and from there assume that eligible countries will participate if
vaccination is cost-effective (i.e. less than $100 per DALY saved) at delivery cost in that country.
That is, we assume that countries in which vaccination would not be cost-effective at delivery cost
would not participate in the program. In addition, China is not included in the program because its
GNI will soon surpass the $1000 cutoff, and because falciparum malaria, the most deadly form of
malaria, is only a problem for a tiny fraction (less than 1 percent) of China’s population.
Adoption
Obtaining cost-effectiveness estimates for a vaccine requires us to make additional
assumptions about the adoption patterns for the vaccine. Because there is little historical data to
25 The Vaccine Fund is the financing arm to the Global Alliance for Vaccines and Immunization (GAVI). The Vaccine Fund offers support to qualifying governments of the world’s poorest countries for: (1) new and under-used vaccines; (2) funding to help governments strengthen their basic immunization services; and (3)
29
guide assumptions, in general we make conservative assumptions about take-up rates. In addition,
the robustness checks we will present in Section 5 suggest our estimates are relatively insensitive to
assumptions about adoption.
Adoption of the vaccine will likely gradually increase over several years and eventually
reach a steady-state level. In our base case scenario we consider a linearly increasing take-up path
that takes seven years to reach the steady state. In this base case, the uptake rates for new cohorts
(infants) are set to the country-by-country immunization rates for the diphtheria-pertussis-tetanus
three-dose vaccine (DPT3) reported by the WHO (2002), plus five percentage points. This
assumes that the immunization rates would be at least as high as the current DPT3 rates if the
vaccine could be added to the EPI schedule. We argue it is appropriate to assume the addition of
five percentage points to the current DPT3 rates for several reasons, including the likely increase in
immunization rates that will result from the recent influx of financial support for immunizations
(for example, from the Bill & Melinda Gates Foundation), economic development that will likely
increase immunization rates (for example, due to increased urbanization), and immunization rates
that may be higher if parents value immunization more if a malaria vaccine were available. The
spreadsheet also allows the user to base uptake rates on diphtheria-pertussis-tetanus first-dose
(DPT1) or measles coverage rates, or to specify a single rate for all countries.
In the transition years of the program, there may be backlog immunizations of children
who have not yet acquired natural immunity to the disease. Given that expanding the program
beyond those relatively easy to reach will be difficult, we assume that only a minority of this
population will be reached. Specifically, we assume that 10 percent of the children aged 0-4 will
be immunized.
safe injection equipment in the form of auto-disable syringes and safe disposal boxes. More information is available online at http://www.vaccinealliance.org (accessed 30 May 2006).
30
Women temporarily lose their natural immunity to malaria during their first pregnancy, and
thus we include some immunizations of pregnant women. The number of pregnant women who are
in their first pregnancy and thus need to be vaccinated is approximated by taking one fourth of
annual births.26 The default immunization rate for this population is set to the tetanus toxoid (TT2)
rate reported by the WHO (2002) plus five percentage points (for reasons described above). The
tetanus toxoid vaccine is already given to pregnant women and thus can serve as a proxy for the
access to and demand for vaccinations in that subpopulation.
Additional revenues
The vaccine developer would also receive revenue outside of program purchases, such as
private purchases in covered countries and purchases in non-covered countries (such as the
travelers’ and military markets in high-income countries, as well as middle-income countries where
malaria is prevalent).
In the base case we project a total market of $750 million in NPV of revenues (2004
dollars) in high- and middle-income countries. This estimate is based on annual purchases of
malaria prophylaxis drugs, as presumably people would be willing to pay comparable amounts for
a malaria vaccine as for malaria prophylaxis drugs. An estimate from the popular press (Reuters,
2003) and correspondence with Pfizer suggest that the annual market for malaria prophylaxis drugs
from sales to travelers and tourists from industrialized countries and the military could be as much
as $200 million, but others cite much lower figures. If a vaccine captured $100 million in peak
sales and the profile of sales over time followed that of a typical pharmaceutical in the Grabowski
et al. (2002) sample, the total net present value of those sales would be about $750.7 million.27
26 The average fertility rate (births per woman) in low-income countries in 2002 was four (World Bank, 2005), hence our assumption of one-fourth of total births being first pregnancies. 27 With an 11 percent real cost of capital (as in Grabowski et al., 2002), this figure changes from $750.7 million to $613.9 million. Note that for both of these figures, we have not subtracted out 10 percent for
31
Adding in $100 million of additional revenues from private sales in low- and middle-income
countries yields a default of $850 million in net present value of revenues outside the commitment
program.
Baseline results
Given the assumptions outlined above, along with a recent collection of data from the
World Health Organization (1997) and the US Bureau of the Census (2002) on disease burden and
fertility, as well as estimates of the distribution of the burden of disease by age and gender, the
spreadsheet tool projects the total discounted number of DALYs that would be saved by the
program. It also calculates the total cost, including delivery costs, and the revenues to the vaccine
supplier from purchases at the initial (high) price. The purchases at the subsequent lower price are
ignored for the NPV calculations because the low price would presumably be close to the marginal
cost of production and because for later sales it is increasingly less likely that the supplier would
remain the same.
We then calculate the expected number of DALYs that would be saved by the program
each year by multiplying the number of immunizations by vaccine efficacy and by the DALY
burden of disease faced by members of the population immunized over their lifetime or the lifetime
of the vaccine. The cost of the program in each year is calculated as the number of vaccinations
multiplied by the total cost of each vaccination (purchase price and delivery cost). As discussed
above, we follow the public health literature and discount both future DALYs saved and future
expenditures to the program sponsor at a real discount rate of three percent. The total discounted
revenue to the supplier in each year is calculated as the number of purchases at the initial price
multiplied by the initial price, discounted at the real cost of capital of eight percent. In order to
lower marketing expenditures, as we did for our previous work, as that correction would here seem inappropriate.
32
evaluate the appropriateness of the size of the price commitment, one can then compare the NPV of
revenues from a new vaccine to the adjusted distribution of revenues from a sample of existing
commercial products, as detailed in Section 3.
These calculations may underestimate the cost-effectiveness of the vaccine. For example,
these calculations do not include any epidemiological “herd” benefits—that is, vaccinating a
significant fraction of the population may slow the spread of a disease, and thus benefits may spill
over to the unvaccinated. They also do not include health benefits to people in middle- and high-
income countries, or benefits to adults in low-income countries who purchase a vaccine privately.
They assume that the vaccine would be given randomly throughout a country and thus do not factor
in any benefits of targeting vaccine delivery within countries to areas that have the most severe
disease problems. Finally, these calculations do not include the benefits of increasing vaccination
rates for other diseases that might result from parents bringing their children into clinics to
vaccinate them against malaria.
For a given set of specified assumptions, the main outputs of the spreadsheet tool are the
total NPV of revenues that would accrue to the vaccine supplier and the cost per DALY of the
vaccine, both in 2004 dollars. Under the base case assumptions described above, a commitment to
pay $15 per person immunized for the first 200 million individuals immunized would produce a
total NPV of revenue of $3.2 billion (in 2004 dollars), comparable to the $3.1 billion benchmark
for the average existing NCE as discussed in Section 3.
The spreadsheet tool also reports the annual number of vaccinations in the steady state, the
annual number of DALYs saved in the steady state, and the overall cost per DALY saved. Under
the baseline assumptions, over 54 million people would be immunized annually, saving almost 14
million DALYs per year in the steady state. Overall, the program would cost less than $15 per

33
DALY saved, which is highly cost effective relative to, for example, the $100 per DALY cost-
effectiveness standard.
5. Sensitivity analyses
In this section, we discuss the cost-effectiveness of a vaccine market commitment program
when the base case assumptions are varied. The sensitivity analyses reported below also highlight
the key aspects of a vaccine that make it cost effective and that therefore should be carefully
considered in the choice of eligibility criteria for a product to be purchased under the program.
The cost-effectiveness of the vaccine is relatively insensitive to changes in assumptions
about efficacy, take-up rates, and the per immunized-person price offered. For example, a malaria
vaccine that was only 50 percent effective would still cost less than $20 per DALY. Figure 1 shows
the relationship between efficacy and cost per DALY, holding constant all other inputs, including
the set of countries participating in the program. Even a 30 percent effective vaccine would be
highly cost-effective.
If adoption of the vaccine is very slow, the program would still remain very cost-effective
from a public health perspective and would still provide a considerable amount of revenue to the
vaccine developer – although somewhat less revenue than in the case of a more rapidly adopted
vaccine, since under this type of contract the value of payments for the high-price vaccine doses
declines as a result of discounting when these vaccinations are pushed further into the future. If it
takes fifteen years for adoption to reach steady-state levels and adoption only reached levels 10
percentage points below the DPT3 rates, the program would still cost less than $20 per DALY
saved and would generate $2.7 billion in NPV of revenue for biopharmaceutical companies (in
2004 dollars).

34
A vaccine commitment would also be cost-effective at the time of vaccine development
under a wide range of contract provisions. For example, to match the revenues of drugs falling
between the 70th and 80th percentile and generating a market roughly comparable to $3.61 billion in
net present value of sales, a commitment could offer $17 per person immunized for the first 200
million people immunized, at a cost of about $16 per DALY saved. To match the revenues of drugs
falling between the 80th and 90th percentile and generating a market roughly comparable to $5.73
billion in net present value of sales, a commitment could offer $25 per person immunized for the
first 250 million people immunized, at a cost of about $23 per DALY saved. As discussed below,
if raising the price offered per person immunized accelerated the vaccine development time, a
larger commitment might prove more attractive than a smaller one.
Cost-effectiveness is sensitive to assumptions about the number of doses and the duration
of protection. Vaccines with relatively low efficacy will still be cost effective if they can be
delivered with the current (three-dose) EPI vaccine package, because adding one additional vaccine
to this package is relatively inexpensive. In the baseline case, we have assumed a $0.75 cost of
adding a three-dose vaccine, although even at several multiples of this the delivery would be quite
inexpensive. For example, assuming an incremental delivery cost of triple that amount ($2.25 per
person immunized) increases the cost per DALY saved to about $20 if the set of countries included
is held fixed, and augments the cost per DALY by only pennies if we assume that only countries in
which the vaccine would be cost-effective at delivery cost adopt the vaccine. In contrast, delivery
outside the EPI schedule would be relatively costly. For example, at our assumed cost of $5 per
dose, adding two doses outside of the EPI schedule would bring the cost per DALY to about $60
per DALY saved if the set of participating countries is held constant, or about $25 per DALY if
countries with low disease burdens opt out because delivery of the vaccine would not be cost-
effective.
35
Similarly, cost-effectiveness is sensitive to changing assumptions about the duration of
protection. Because malaria primarily kills children under the age of five who have not yet gained
natural immunity, the cost per DALY increases rapidly for vaccines that provide less than five
years of protection. For example, if a vaccine provided only two years of protection, the cost per
DALY saved would rise to $26. A lesson to be learned from these sensitivity analyses is that,
when specifying the product profile, any vaccine commitment for malaria should take these dosing
and protection duration issues into account.
Cost-effectiveness in the case of accelerated development and distribution
The above calculations demonstrate that once a vaccine is developed, purchasing vaccine
at the pre-specified price would be a very cost-effective expenditure. There is little reason to fear,
therefore, that a vaccine commitment would tie donors to future purchases that would not be
worthwhile, if a vaccine were developed. We now examine a somewhat more complex issue –
namely, the value of the commitment in accelerating the development and distribution of a
vaccine. To assess this, we need to make assumptions about what would have happened in the
absence of a commitment.
In the absence of a price commitment both development and adoption of the vaccine could
be pushed further into the future. Although it is difficult to know how much a vaccine commitment
would speed up vaccine development, one indication that the effect may be substantial comes from
the Orphan Drug Act. While only ten new orphan drugs were discovered in the decade prior to the
Orphan Drug Act, 200 were discovered in the next decade (Grabowski, 2003). A vaccine
commitment is also likely to substantially accelerate access in the poorest countries since the
sponsor’s price is paid on a per-person immunized basis. In contrast, when the hepatitis B vaccine
was introduced at $30 per dose, it was rarely used in low-income countries (Muraskin, 1995;

36
Galambos, 1995). More generally, the historical record suggests adoption of new vaccines in poor
countries could be delayed by 10 to 15 years in the absence of a market commitment.28 Given the
substantial burdens of diseases such as HIV, malaria, and tuberculosis, the health benefits of
speeding development and adoption of such vaccines would be considerable.
If a vaccine market commitment advanced vaccine development by ten years and
accelerated access in poor countries by ten years, it would still cost only about $23 per additional
DALY saved. Even in the extreme case in which a price commitment accelerated vaccine
development by only one year and adoption in poor countries by only two years, the program
would cost about $80-$90 per additional DALY saved—still slightly less than the oft-cited $100
per DALY cost-effectiveness threshold for the poorest countries. The analogous figures for the
larger commitment size we derived in the presence of a superiority clause are $38 per additional
DALY saved if the commitment advanced vaccine development by ten years and accelerated
access in poor countries by ten years, and $163 per additional DALY saved if the commitment
accelerated vaccine development by only one year and adoption in poor countries by only two
years. (These figures are all relative to the absence of any commitment.)
By a similar line of reasoning, if increases in the size of the commitment accelerated
development of a vaccine, it may be worthwhile to undertake a larger commitment. As previously
discussed, paying $25 per person for the first 250 million people immunized rather than $15 per
person for the first 200 million people would roughly meet the average net present value of
28 We estimate delays in access based on the historical record, but one could argue that the circumstances would be different now or in the future. However, if one believes that even in the absence of a commitment, donors would immediately buy a vaccine and distribute it at an on-patent price comparable to the initial price offered under the vaccine commitment, then the cost of purchasing and distributing the vaccine would be the same with or without a vaccine commitment, and any benefits of accelerated development associated with announcing a commitment in advance would be without cost in the ultimate price tag for a vaccine. In this case, if the money will be spent on the vaccine anyway, it is clearly more cost-effective to reap the benefits of faster development by announcing this policy in advance and entering into a vaccine commitment. Conversely, if one believes that companies would have to give away a vaccine in poor countries at cost, it is difficult to argue that a vaccine commitment would not be critical in advancing vaccine development.

37
products between the 80th and 90th percentiles of existing commercial products. The larger
commitment would cost less than $100 per additional DALY saved if it advanced development and
adoption by only three years relative to the smaller commitment, and would cost about $23 per
DALY saved overall.
It is also possible to ask what benefits -- in terms of faster vaccine development or gains in
efficacy -- would make our larger market size estimate (with a superiority clause, $5.24 billion)
“worth it” in terms of the additional DALYs saved costing less than $100. We estimate that a 10%
increase in our benchmark efficacy assumption (that is, moving from 60% to 70% efficacy) would
be worth it in this sense. Alternatively, if development and adoption of the vaccine were speeded
by three years this larger market size would in this sense also be worthwhile.
6. Conclusions
A variety of simulations suggest that under a wide range of values, an advance market
vaccine commitment may be sufficient to stimulate substantial research towards a desired vaccine,
and from a public health perspective still be extremely cost-effective. Our estimates suggest that a
commitment of $3.1 billion in 2004 dollars in net present value of sales would be comparable to
the value of sales earned by the average of a sample of recently launched commercial products,
adjusted for lower marketing costs. Of course in expectation, the larger the commitment, the more
biopharmaceutical firms will enter the search for a vaccine, and the faster a vaccine is likely to be
developed. We have also discussed a number of other factors (such as the stage of product
development, or the amount of R&D which has been financed directly) that donors may want to
consider when designing the appropriate size of an advance market commitment.
We have focused here on the example of a malaria vaccine; however, as discussed
throughout our general analysis applies more broadly. In particular, estimates for HIV and

38
tuberculosis vaccines analogous to those presented here for malaria can be derived via the
downloadable spreadsheet tool.
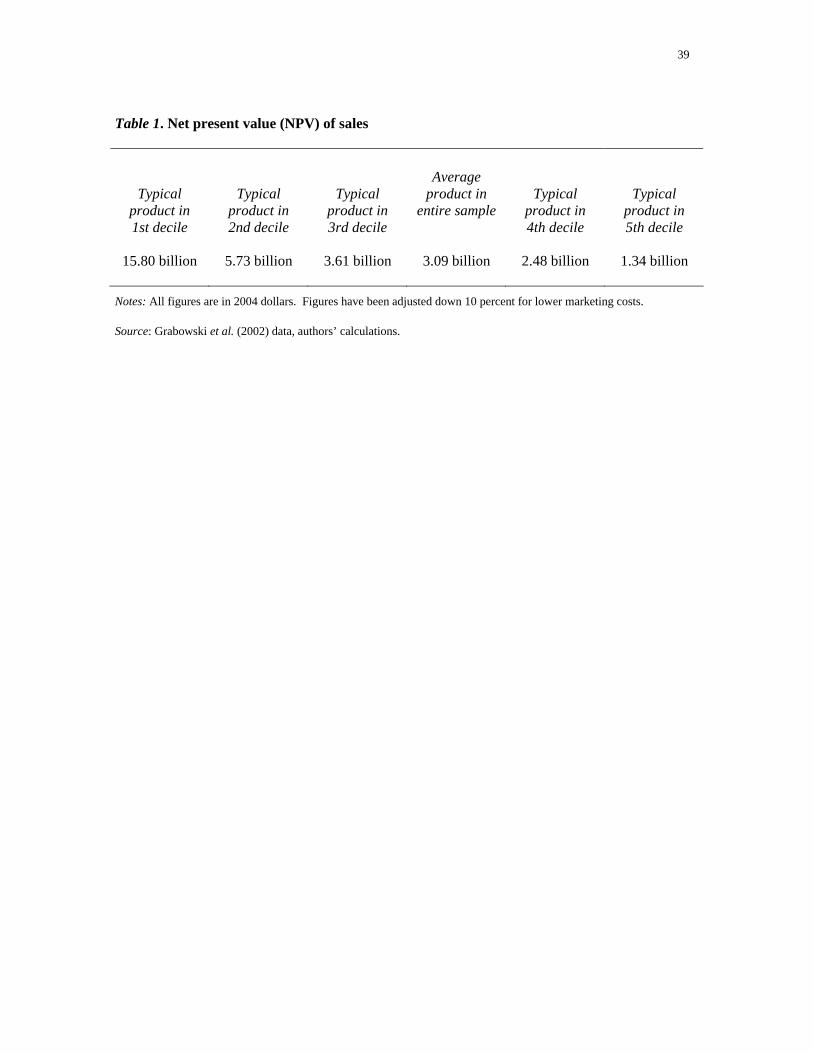
39
Table 1. Net present value (NPV) of sales
Typical product in 1st decile
Typical
product in 2nd decile
Typical
product in 3rd decile
Average product in
entire sample
Typical
product in 4th decile
Typical
product in 5th decile
15.80 billion
5.73 billion 3.61 billion 3.09 billion 2.48 billion 1.34 billion
Notes: All figures are in 2004 dollars. Figures have been adjusted down 10 percent for lower marketing costs.
Source: Grabowski et al. (2002) data, authors’ calculations.
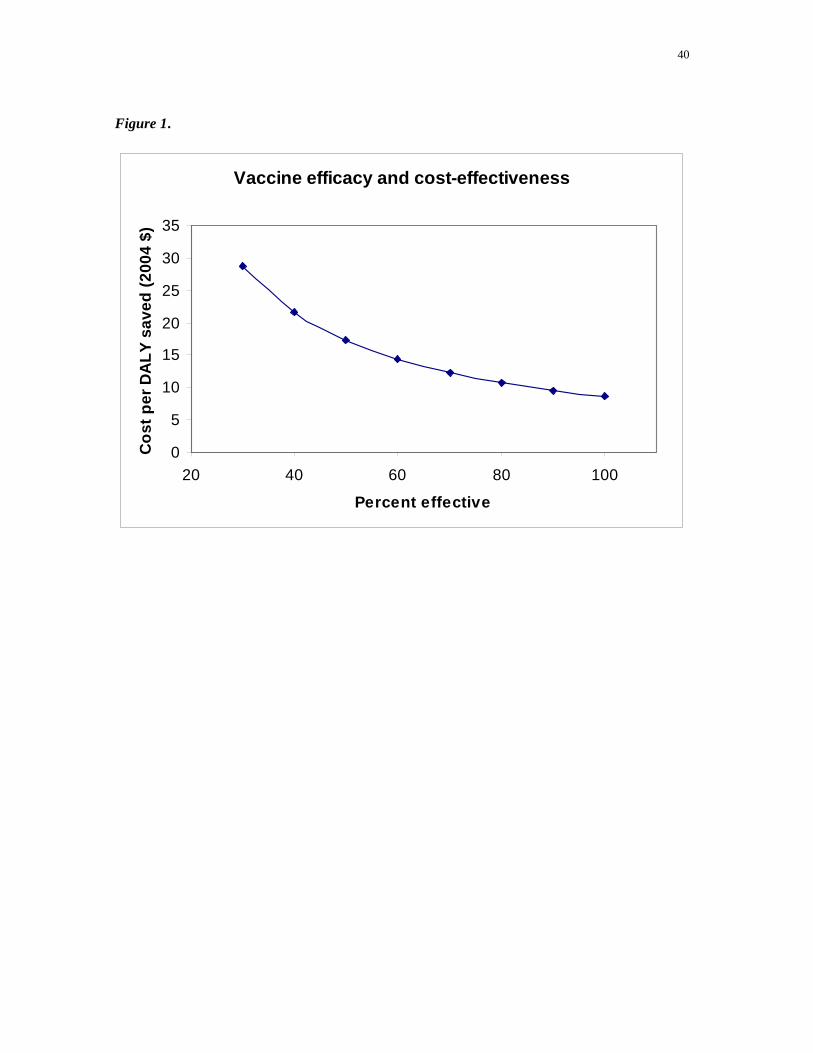
40
Figure 1.
Vaccine efficacy and cost-effectiveness
0
5
10
15
20
25
30
35
20 40 60 80 100
Percent effective
Cos
t per
DA
LY s
aved
(200
4 $)

41
Appendix
This table presents the sales revenue data underlying our analysis in Section 3. Special thanks to Henry Grabowski for generously sharing this data with us.
Mean Product
Product in Top Decile Year
Sales
NPV of Sales (8% real cost
of capital)
NPV of Sales
(11% real cost of capital)
Sales
NPV of Sales (8% real cost
of capital)
NPV of Sales
(11% real cost of capital)
t = -1 0.0 0.0 0.0 0.0 0.0 0.0t = 0 0.0 0.0 0.0 0.0 0.0 0.0t = 1 (launch) 83.0 83.0 83.0 293.5 293.5 293.5t = 2 155.6 144.1 140.2 545.6 505.2 491.5t = 3 211.6 181.4 171.7 791.0 678.2 642.0t = 4 267.6 212.4 195.7 1094.8 869.1 800.5t = 5 325.7 239.4 214.5 1447.7 1064.1 953.6t = 6 371.6 252.9 220.5 1729.4 1177.0 1026.3t = 7 414.7 261.3 221.7 2000.4 1260.6 1069.5t = 8 434.5 253.5 209.3 2200.5 1284.0 1059.9t = 9 457.4 247.1 198.5 2381.2 1286.5 1033.3t = 10 457.8 229.0 179.0 2503.5 1252.4 978.7t = 11 444.4 205.8 156.5 2539.2 1176.1 894.3t = 12 441.4 189.3 140.0 2587.2 1109.6 820.9t = 13 416.2 165.3 119.0 2582.1 1025.4 738.1t = 14 391.8 144.1 100.9 2565.9 943.5 660.8t = 15 307.8 104.8 71.4 1989.8 677.4 461.6t = 16 232.1 73.2 48.5 1486.0 468.4 310.6t = 17 185.7 54.2 35.0 1188.8 347.0 223.8t = 18 148.5 40.1 25.2 951.0 257.0 161.3t = 19 118.8 29.7 18.2 760.8 190.4 116.3t = 20 95.1 22.0 13.1 608.6 141.0 83.8sum 5961.3 3132.8 2561.8 32247.0 16006.4 12820.2Sum in 2004$ 6539.4 3436.6 2810.3 35374.3 17558.7 14063.5Less 10% (for lower marketing expenditures)
5885.5 3092.9 2529.3 31836.9 15802.8 12657.2
Notes: All figures are in millions of year 2000 dollars, except as noted otherwise. The sales distribution for the mean product, as presented above, was scaled for several cases discussed in this paper such that the peak (year 10) sales were equal to the following: $500 million for the “industry outsider” estimate, $100 million for the outside-of-program purchases market estimate, and $865.2 million for the hepatitis B vaccine market estimate. Details of these calculations are available upon request from the authors.

42
References Adams G et al. “Consensus Statement on Antiretroviral Treatment for AIDS in Poor Countries.” 2001. Available online: http://www.hsph.harvard.edu/bioethics/pdf/consensus_aids_therapy.pdf [accessed 30 May 2006] Alonso P et al. “Efficacy of the RTS, S/AS02A Vaccine Against Plasmodium Falciparum Infection and Disease in Young African Children: Randomised Controlled Trial.” Lancet 2004, 364(9443): 1411-1420. Angell M. The Truth About Drug Companies. Random House: New York, NY, 2004. Ballou W et al. “Update on the clinical development of candidate malaria vaccines.” American Journal of Tropical Medicine and Hygiene 2004, 71(2 Supplement): 239-247. Barder O et al. Making Markets for Vaccines. Center for Global Development: Washington, DC, 2005. Available online: http://www.cgdev.org/section/initiatives/_active/vaccinedevelopment/ [accessed 30 May 2006] Berndt E, Hurvitz J. “Vaccine advance-purchase agreements for low-income countries: Practical issues.” Health Affairs 2005, 24(3): 653-665. Berndt E et al. “Estimating the Required Volume of a Malaria Vaccine Commitment.” Mimeo: Cambridge, MA, 2003. Bohrer R, Prince J “A tale of two proteins: The FDA's uncertain interpretation of the Orphan Drug Act.” Harvard Journal of Law & Technology 1999, 12(2): 364-417. Brown G. “Speech by the RT Gordon Brown MP, Chancellor of the Exchequer at the BBC World Service Trust conference.” 24 November, 2004. Available online: http://www.hm-treasury.gov.uk./newsroom_and_speeches/press/2004/press_94_04.cfm [accessed 30 May 2006] DiMasi J et al. “The Price of Innovation: New Estimates of Drug Development Costs.” Journal of Health Economics 2003, 22: 151-185. Finkelstein A. “Static and Dynamic Effects of Health Policy: Evidence from the Vaccine Industry.” Quarterly Journal of Economics 2004, 119(2): 527-564. G8 Information Centre. “G7/G8 Summit Meetings, St. Petersburg Summit Documents: Fight Against Infectious Disease.” 2006. Available online: http://www.g7.utoronto.ca/summit/2006stpetersburg/infdis.html [accessed 23 July 2006] Galambos L. Networks of Innovation: Vaccine Development at Merck, Sharp & Dohme, and Mulford, 1895-1995. Cambridge University Press: Cambridge, 1995. Global Alliance for Vaccines and Immunization (GAVI). “Health, Immunization, and Economic Growth, Research Briefing #2, Vaccines are Cost-effective: A Summary of Recent Research.” 2004. Available online:

43
http://www.gavialliance.org/General_Information/Immunization_informa/Economic_Impact/vacc_cost.php [accessed 30 May 2006] Grabowski H. “Increasing R&D Incentives for Neglected Diseases – Lessons from the Orphan Drug Act.” Mimeo: Duke University, 2003. Grabowski H, Vernon J. “A New Look at the Returns and Risks to Pharmaceutical R&D.” Management Science 1990, 36: 804-821. Grabowski H, Vernon J, DiMasi J. “Returns on Research and Development for 1990s New Drug Introductions.” PharmacoEconomics 2002, 20 (Supplement 3): 11-29. HM Treasury. “Statement by G7 Finance Ministers and Central Bank Governors.”2-3 December, 2005. Available online: http://www.hm-treasury.gov.uk/otherhmtsites/g7/news/g7_statement_031205.cfm [accessed 30 May 2006] Kremer M, Glennerster R. Strong Medicine: Creating Incentives for Pharmaceutical Research on Neglected Diseases. Princeton University Press: Princeton, NJ, 2004. McNeil D. “Plan to Bring Generic AIDS Drugs to Poor Nations.” New York Times 2004, April 6: F06. Muraskin W. The War Against Hepatitis B: A History of the International Task Force on Hepatitis B Immunization. University of Pennsylvania Press: Philadelphia, PA, 1995. Neumann P et al. “Are Pharmaceuticals Cost-Effective? A Review of the Evidence.” Health Affairs 2000, 19(2): 92-109. Reuters. “Pfizer Announces Potential Malaria Discovery.” June 17, 2003. Rin-Laures L-H, Janofsky D “Recent developments concerning the Orphan Drug Act.” Harvard Journal of Law & Technology 1991, 4(Spring): 269-299. Robbins-Roth C. From Alchemy to IPO: The Business of Biotechnology. Perseus Publishing: Boulder, CO, 2000. Rosenthal M et al. “Promotion of Prescription Drugs to Consumers.” New England Journal of Medicine 2002, 346(7): 498-505. Siegal J. Stocks for the Long Run. McGraw Hill: New York, NY, 1998. United States Bureau of the Census. International Data Base, Table 028: “Age-Specific Fertility Rates and Selected Derived Measures.” 2000. Available online: http://www.census.gov/ipc/www/idbnew.html [accessed 30 May 2006] World Bank. Disease Control Priorities in Developing Countries. Oxford Medical Publications, Oxford University Press for the World Bank: New York, NY, 1993.
44
World Bank. World Development Indicators. World Bank: Washington, DC, 2005. World Health Organization (WHO). Investing in Health Research and Development: Report of the Ad Hoc Committee on Health Research Relating to Future Intervention Options. WHO: Geneva, 1996. World Health Organization (WHO). “World Malaria Situation in 1994, Part I.” Weekly Epidemiological Record 1997, 72(36): 269-274. World Health Organization (WHO). “Less-Used Vaccines against Major Diseases Are Cost-Effective, Researchers Conclude.” Bulletin of the World Health Organization 2000, 78(2): 274. World Health Organization (WHO). World Health Report 2000. WHO: Geneva, 2000. World Health Organization (WHO). World Health Report 2001. WHO: Geneva, 2001.
World Health Organization. “Vaccines, Immunizations, and Biologicals: Statistics and Graphs.” 2002. Available online: http://www.who.int/vaccines-surveillance/StatsAndGraphs.htm [accessed 31 March 2006]