Adult Social Care: a systems analysis and a better way … Socia... · Vanguard Education Ltd...
28
Vanguard Education Ltd Villiers House 1 Nelson St. Buckingham MK18 1BU www.lean-service.com Adult Social Care: a systems analysis and a better way forward John Seddon, December 2005
Transcript of Adult Social Care: a systems analysis and a better way … Socia... · Vanguard Education Ltd...
Vanguard Education Ltd Villiers House 1 Nelson St. Buckingham MK18 1BU www.lean-service.com
Adult Social Care: a systems analysis and a better way forward
John Seddon, December 2005
1
Introduction and overview Adult Social Care is currently under considerable scrutiny. It has been the subject of a Green Paper1 outlining its future; the King’s Fund Inquiry2 and others have published reports into the current state of affairs; and many local authorities propose adult care as a significant source for Gershon3 efficiency savings. This report looks at the current situation and uses Vanguard studies to illustrate both the real causes of the problems and better solutions for the design and management of Adult Social Care services. The report is structured as follows: Page 1) More consensus on the problem than the solution 2
A review of the Green Paper and recent studies shows consensus on the need for change but not on what to do.
2) A different way of looking at the problem 5
Vanguard’s approach is to study the organisation as system. The purpose is to obtain knowledge about the ‘what and why’ of current performance so that subsequent changes can be made with confidence that improvement will ensue.
3) What the systems approach reveals about current
performance 9 Case material from local authorities illustrates the nature and causes of sub-optimisation. By the same token taking this perspective reveals the scope for improvement, which is considerable.
4) Redesigning services using systems principles 16
Early adopters of the systems approach show significant results in terms of efficiency, service and employee morale. The approach is to design the services against demand and hence drive out waste. To achieve this requires completely rethinking how the service is designed and, especially, how roles and measures are designed.
5) Towards a facilitative regulatory regime 20
The current regulatory regime is found to be part of the problem, a principal cause of waste. The nature and scope of the regime need to change to facilitate the considerable improvements that can be achieved, rather than preventing them, as at present.
Appendix: Summary of current regulatory requirements 21 A summary of current regulatory requirements placed on Adult Social Care.
2
1) More consensus on the problem than the solution The Green Paper The Department of Health’s Green Paper, Independence, well-being and choice: our vision for the future of social care for adults in England1, published in March this year, accepts that ‘sometimes social care is not provided as it should be’, the biggest problem being that the care provided frequently generates dependence rather than independence. However, the paper focuses not on the way services are delivered but on the modifications that are to prepare for ongoing demographic and other changes - people are less likely to live in close-knit family groups offering reciprocal support, communities are becoming more diverse and thus require different services, people expect more control and choice over their lives, and so on. The Green Paper aims to deal with these changes through a 10-15 year programme focused on giving recipients of care more control (for example with individual budgets and direct payments), improving levels of service by spreading good practice, and increasing strategic commissioning of work with the voluntary and community sector as well as local health services. While those in Adult Social Care have found much to praise in the objectives of the Green Paper, the cost-neutral basis for the changes has been roundly criticised. Indeed, the Adults Interagency Group (a grouping of 17 adult social care organisations, including the LGA, charities such as Age Concern and Help the Aged and representatives of carers and the NHS) states that members ‘fundamentally disagree with the assumption underpinning the Green Paper that this vision will be cost neutral.’ 4 It argues that social care is underfunded and that adult services are being delivered against a difficult background of rising numbers of over-65s and sufferers from dementia, increased life expectancies of people with complex disabilities, reductions in housing-support funding and a low-paid, undertrained workforce. In addition, the Department of Health’s enthusiasm for direct payments is not shared by all within the sector. One problem is that direct payment causes complicated tax issues because in paying for a carer a user will be acting as an employer. More fundamentally, the reason users give for accepting direct payment is not that they want choice but that the current system does not work. They believe that by organising care themselves they have a greater chance of getting what they want. A better solution would be to address the problems in the social care system to eliminate the need for direct payments. As we shall see, even getting to the stage of being able to receive direct payments requires clients to go through numerous assessments, multiple handovers and a series of eligibility tests. While direct payments might save time in the delivery or choice of carer, they will not solve the many problems in reaching that point in the first place. Demographic changes Britain’s population is ageing as a result of falling birth rates and rising life expectancy. There is wide consensus that as a result considerable investment will be needed in elderly care. The London School of Economics, the University of Leicester and the Joseph Rowntree Foundation5 have all predicted that the cost of elderly care will rise by more than 300 per cent in real terms between 2000 and 2050 as a consequence of demographic changes: for example, the number of over-85s - those most likely to need care - is likely
3
nearly to quadruple to 4 million in the period. Likewise, as discussed in the Green Paper, the Government expects the need for adult social care to rise consistently. King’s Fund The King’s Fund Inquiry2, published in June 2005, found ‘major shortcomings’ in the current system, disadvantaging older people and their carers. People were found to experience restricted access to care and support, limited choice and control over services, risk from untrained staff, hardship caused by inadequate funding, and controversy about who pays for long-term care. The King’s Fund says that prospects for improvement for the next generation of older people are bleak. The main pressures are the increasing proportion of elderly in the population, the ageing of black and ethnic minority populations, and poor health, especially dementia, among disadvantaged groups. Local Government Association (LGA) The pressures experienced by councils are described by David Rogers, chair of the LGA’s Community Wellbeing Board, who said: ‘At current levels councils must either tighten eligibility criteria or increase council tax. Councils face real difficulties shifting resources from overpressurised intensive resources to preventative ones, where the payoff can be large but is not immediate.’ In addition, the LGA’s research6 into social service finance for 2004-05 found that authorities spent 6 per cent more on social services than the government allocated to them. Although this was mainly due to children’s services, there were still major problems in adult services where 36 per cent of authorities overspent on elderly care. Local authorities currently set the band level of need at which they will accept users and give access to care. The criteria for each band are set nationally by the Department of Health (DoH) in guidance issued to local councils called Fair Access to Care Services (FACS). The percentage of authorities setting each band as the minimum level of need for entry are: low 6 per cent, moderate 36 per cent, substantial 53 per cent, critical 5 per cent. In other words, presently people in six out of 10 authorities are only supported if their needs are substantial or critical. In addition, 12 per cent of authorities are planning to tighten further eligibility criteria for older people as a result of budget pressures. Adult social care is thus a postcode lottery: depending on where people live, they may receive social care with low need or no help until they are critical. On the ground eligibility criteria are subject to interpretation; social workers may inflate needs to increase the likelihood of someone getting help. Gershon To compound the problem of underfunding, many councils are planning to make cuts in adult social care budgets as they attempt to meet their Gershon efficiency targets3. Adult social care’s position as councils’ top target for government-ordered efficiency gains was underlined by figures published in August 2005 showing that more than £110 million was saved from the service in the previous year. Therefore, of almost £760 million eked out of council budgets last year, nearly 15 per cent came from adult social care.
4
Analysing the first set of Annual Efficiency Statements submitted to the Office of the Deputy Prime Minister by councils in April, the Institute of Public Finance7 found that £374m of the expected £1.15bn savings in 2005-2006 will come from adult social services and corporate activities. Social services directors intend to expand the use of direct payments to users, promote independent living and focus on commissioning services from private sector providers to achieve savings of £180m. SPAIN The Social Policy Ageing and Information Network (SPAIN), a group of 21 older people’s organisations, reported in July8 that funding shortages were leading to cuts in crucial services for older people. Cleaning and housework, respite, transport and mobility aids can make or break an older person’s independence, but these were being cut back across the country. The number of households receiving home care had gone down by a quarter since 1997. The SPAIN charities report8 hearing from many older people who are distressed about living in dirty housing, waiting months for a bath or being trapped at home because they have no access to a basic wheelchair ramp or grab rail. Many 24-hour carers are forced to go without a break for months because there is insufficient funding for respite. Elderly people say the help they receive at home is rushed and they are not told when the visits will be. The Age Concern website shows many examples of such problems and delays. The SPAIN report recommends increased funding for social care in the next spending review. It wants more money for local authorities and a long-term strategy for improving quality and choice of care to combat staff shortages, care-home shortages, staff retention problems and provide crucial services in the home. SPAIN finds that the elderly are being denied social-services care because funding is being diverted to young people. Elderly care is the ‘poor relation’, accounting for just under half of council care budgets despite providing nearly two-thirds of the clients Claims of underfunding are of long standing. An earlier SPAIN report9 in February 2002 warned of lives being put at risk because of chronic funding shortages. That report highlighted a lack of preventive services and low cost ceilings on individual care packages for the elderly, resulting in inadequate levels of care, poor quality, inflexible services and restricted choice. Meanwhile, charities, families and even service users themselves had to subsidize the shortfalls in local authority funding. One result was that 700,000 older patients had experienced problems and delays in leaving hospital in the previous year. Problems reported in 2002 are equally common today. Summary There is, it seems, a wide consensus on the problem. The current system shows many features of failure, and we can only anticipate growing demand. But none of the solutions on offer has consensual support. Government is naturally reluctant to commit to increased expenditure; service providers doubt whether direct payments will make a positive contribution.

5
2) A different way of looking at the problem Vanguard’s expertise is in helping service organisations make the change from a ‘command-and-control’ to a ‘systems’ approach to the design and management of work. Henry Ford and Alfred Sloan developed the first mass-production systems for the manufacture of automobiles in the early 20th century, and the principles and methods associated with this approach (‘command-and-control’) have now become prevalent in service organisations around the world. Systems thinking is a different approach to the design and management of work that was first developed in the pioneering work of Toyota in manufacturing. Vanguard has pioneered the application of the systems approach to service organisations. The figure below compares and contrasts key aspects of the two approaches:
Command-and-Control Thinking
Systems Thinking
Top down Perspective Outside in
Functional specialisation Design Demand, value and flow
Separated from the work Decision-making Integrated with the work
Budget, targets, standards, activity and productivity Measures
Designed against purpose, demonstrate variation
Extrinsic - carrot and stick Motivation Intrinsic - pride
Make the budget and manage the people Management ethos Act on the system
Figure 1: Command-and-control versus systems thinking System principles provide a better way to design and manage work. While command-and-control designs build in waste and other forms of sub-optimisation, systems methods provide the means to remove waste and continually work for both optimisation of service to customers and efficiency in service delivery - in other words, improved service at reduced cost. To move from a command-and-control to a systems approach to the design and management of work requires a fundamental shift in management thinking - for it is the way that managers think about the design and management of work (see the figure above) that determines how the organisation (the system) operates, and thus how it performs. Because the foundations of change lie in changing thinking, the Vanguard approach to change - all change - is to work through a process of learning for leaders and staff. A by-product of the Vanguard method for change is an uplift in morale throughout the organisation - for both front line workers and managers - because they are engaged directly and actively in learning how to understand their organisation as a system, and then applying
6
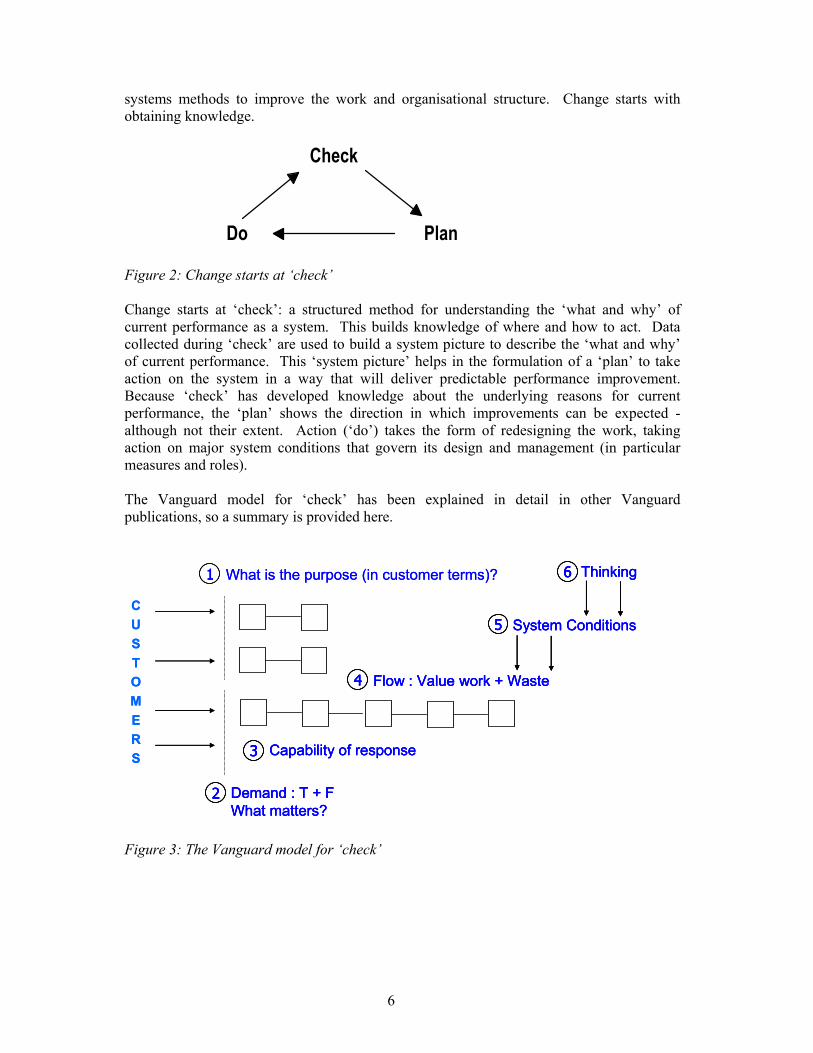
systems methods to improve the work and organisational structure. Change starts with obtaining knowledge.
Check
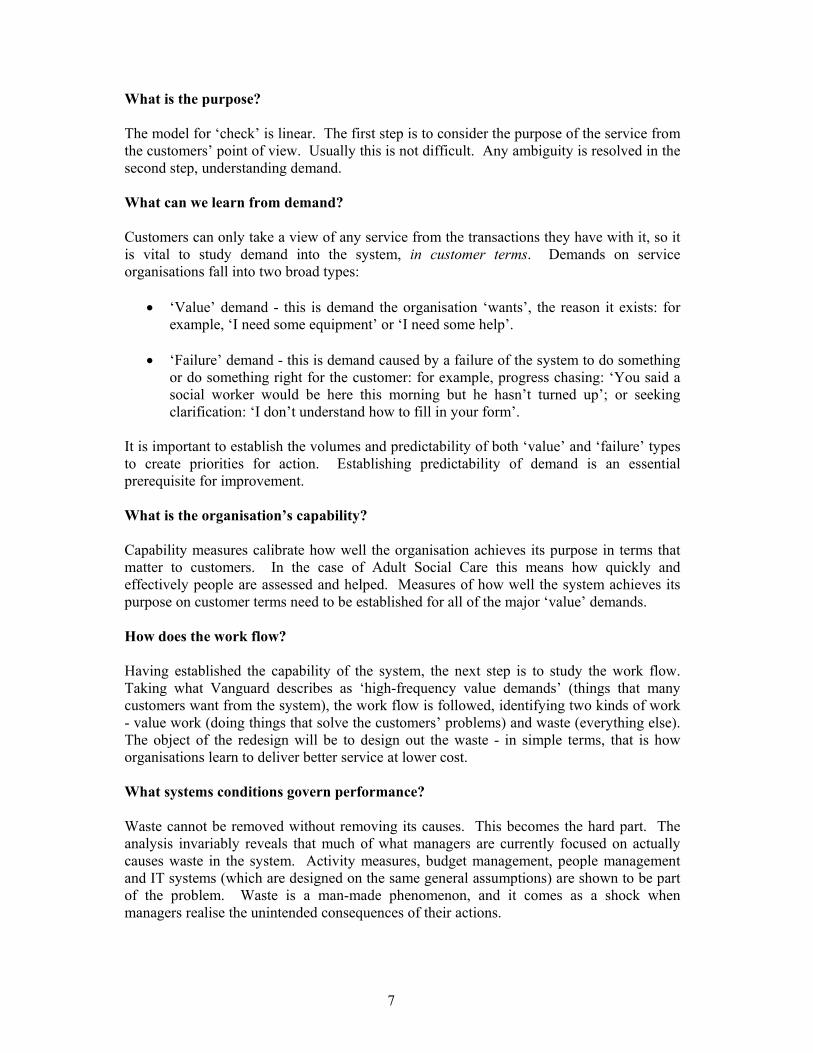
PlanDo Figure 2: Change starts at ‘check’ Change starts at ‘check’: a structured method for understanding the ‘what and why’ of current performance as a system. This builds knowledge of where and how to act. Data collected during ‘check’ are used to build a system picture to describe the ‘what and why’ of current performance. This ‘system picture’ helps in the formulation of a ‘plan’ to take action on the system in a way that will deliver predictable performance improvement. Because ‘check’ has developed knowledge about the underlying reasons for current performance, the ‘plan’ shows the direction in which improvements can be expected - although not their extent. Action (‘do’) takes the form of redesigning the work, taking action on major system conditions that govern its design and management (in particular measures and roles). The Vanguard model for ‘check’ has been explained in detail in other Vanguard publications, so a summary is provided here.
What is the purpose (in customer terms)?1
Flow : Value work + Waste4
Capability of response3
Demand : T + FWhat matters?
2
Thinking6
System Conditions5CUSTOMERS
What is the purpose (in customer terms)?11
Flow : Value work + Waste4 Flow : Value work + Waste44
Capability of response3 Capability of response33
Demand : T + FWhat matters?
2 Demand : T + FWhat matters?
22
Thinking6 Thinking66
System Conditions5 System Conditions55CUSTOMERS
Figure 3: The Vanguard model for ‘check’
7
What is the purpose? The model for ‘check’ is linear. The first step is to consider the purpose of the service from the customers’ point of view. Usually this is not difficult. Any ambiguity is resolved in the second step, understanding demand. What can we learn from demand? Customers can only take a view of any service from the transactions they have with it, so it is vital to study demand into the system, in customer terms. Demands on service organisations fall into two broad types:
• ‘Value’ demand - this is demand the organisation ‘wants’, the reason it exists: for example, ‘I need some equipment’ or ‘I need some help’.
• ‘Failure’ demand - this is demand caused by a failure of the system to do something
or do something right for the customer: for example, progress chasing: ‘You said a social worker would be here this morning but he hasn’t turned up’; or seeking clarification: ‘I don’t understand how to fill in your form’.
It is important to establish the volumes and predictability of both ‘value’ and ‘failure’ types to create priorities for action. Establishing predictability of demand is an essential prerequisite for improvement. What is the organisation’s capability? Capability measures calibrate how well the organisation achieves its purpose in terms that matter to customers. In the case of Adult Social Care this means how quickly and effectively people are assessed and helped. Measures of how well the system achieves its purpose on customer terms need to be established for all of the major ‘value’ demands. How does the work flow? Having established the capability of the system, the next step is to study the work flow. Taking what Vanguard describes as ‘high-frequency value demands’ (things that many customers want from the system), the work flow is followed, identifying two kinds of work - value work (doing things that solve the customers’ problems) and waste (everything else). The object of the redesign will be to design out the waste - in simple terms, that is how organisations learn to deliver better service at lower cost. What systems conditions govern performance? Waste cannot be removed without removing its causes. This becomes the hard part. The analysis invariably reveals that much of what managers are currently focused on actually causes waste in the system. Activity measures, budget management, people management and IT systems (which are designed on the same general assumptions) are shown to be part of the problem. Waste is a man-made phenomenon, and it comes as a shock when managers realise the unintended consequences of their actions.

8
How does thinking need to change? The work on ‘check’ reveals the relationship between thinking and performance. To improve performance it is necessary to change the system, and to change the system people must be prepared to change the way they think. Demand, capability and flow having been established in ‘check’, it is possible to set up the broad lines of a redesign focusing solely on carrying out value work - what matters to the customer. As people work on a design that will achieve that, it becomes apparent that current ideas about roles and measures have to be dropped in favour of better ones.
9
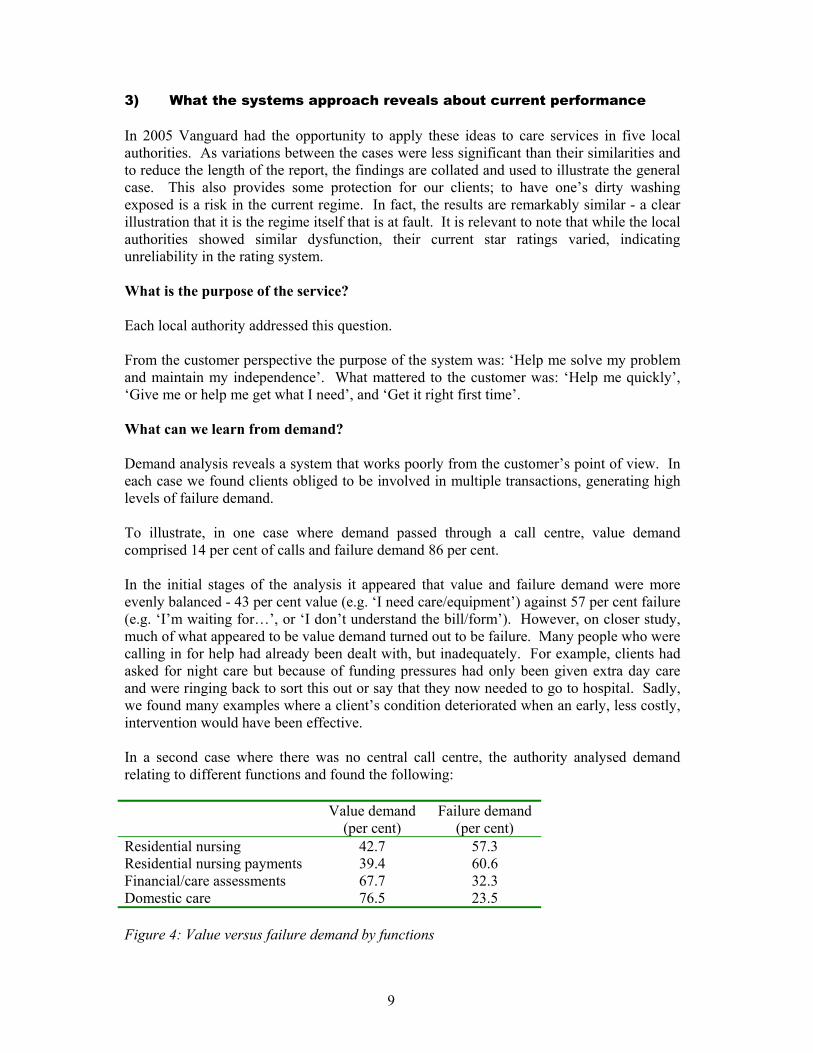
3) What the systems approach reveals about current performance In 2005 Vanguard had the opportunity to apply these ideas to care services in five local authorities. As variations between the cases were less significant than their similarities and to reduce the length of the report, the findings are collated and used to illustrate the general case. This also provides some protection for our clients; to have one’s dirty washing exposed is a risk in the current regime. In fact, the results are remarkably similar - a clear illustration that it is the regime itself that is at fault. It is relevant to note that while the local authorities showed similar dysfunction, their current star ratings varied, indicating unreliability in the rating system. What is the purpose of the service? Each local authority addressed this question. From the customer perspective the purpose of the system was: ‘Help me solve my problem and maintain my independence’. What mattered to the customer was: ‘Help me quickly’, ‘Give me or help me get what I need’, and ‘Get it right first time’. What can we learn from demand? Demand analysis reveals a system that works poorly from the customer’s point of view. In each case we found clients obliged to be involved in multiple transactions, generating high levels of failure demand. To illustrate, in one case where demand passed through a call centre, value demand comprised 14 per cent of calls and failure demand 86 per cent. In the initial stages of the analysis it appeared that value and failure demand were more evenly balanced - 43 per cent value (e.g. ‘I need care/equipment’) against 57 per cent failure (e.g. ‘I’m waiting for…’, or ‘I don’t understand the bill/form’). However, on closer study, much of what appeared to be value demand turned out to be failure. Many people who were calling in for help had already been dealt with, but inadequately. For example, clients had asked for night care but because of funding pressures had only been given extra day care and were ringing back to sort this out or say that they now needed to go to hospital. Sadly, we found many examples where a client’s condition deteriorated when an early, less costly, intervention would have been effective. In a second case where there was no central call centre, the authority analysed demand relating to different functions and found the following:
Value demand (per cent)
Failure demand (per cent)
Residential nursing 42.7 57.3 Residential nursing payments 39.4 60.6 Financial/care assessments 67.7 32.3 Domestic care 76.5 23.5 Figure 4: Value versus failure demand by functions
10
These data are illustrative. In every one of the five cases we discovered high levels of failure demand. Failure demand consumes resources and drives up costs. Poor service is costly. Failure demand was easier to study when we were able to investigate demand consolidated into call centres. Failure demand is indicative of poor service design. But before getting into the detail of the design it is necessary to establish how well the system achieves its purpose. What is the organisation’s capability? How long does it take to assess what someone needs and provide it? The bald answer is that no one knows. In no case did we find end-to-end data representing the client’s view of the service - how long it took from first contact to receiving the necessary care. It is simply not measured. Instead the system relies on functional measures, so much data is available on how quickly specialist functions make appointments or assessments and provide services once agreed, but nothing is known about how long the complete process takes from the client’s point of view. In each case the teams conducting the analysis had to spend considerable time piecing together data from both paper and electronic sources, a number of different ones for each client, to calculate the end-to-end capability of the system. In one case it was found to take an average of 20 days from a client’s first successful contact to receiving help but it could, predictably1, take as long as 80 days. These figures excluded the time taken for a client to make contact at the start or to sort out financial matters at the end of the process. In a second case it took an average of 68 days from requesting help to receiving it and it could, predictably, take as long as 230 days. In services like the provision of walk-in showers - a high-frequency demand - it could take years. In a third case the time taken from first contact to meeting needs was: Domestic care - average 110 days, longest 253 days Residential nursing - average 78 days, longest 160 days. These numbers are not unusual. But of greater importance is that no one knows or calculates a figure that represents the reality of the service from the client’s point of view. All the cases showed alarming end-to-end times and wide variation. Understanding the causes of variation - the factors that extend end-to-end process time - means studying ‘how the work works’, starting with flow.
1 The upper limit of predictability is established statistically. The wide variation in performance is caused by features of the current design.
11
How does the work flow? The purpose of studying work flow is to distinguish between two types of work: value work - doing what is required to meet the demand - and waste - which is everything else. Analysis of work flows in all of the cases showed high levels of waste. In every case we found a complicated picture. One team labelled the map it built of the work flow as ‘the London Underground’, depicting clients going round and round in order to get what they needed. Clients might spend two weeks trying to get through to a call centre or being referred to it by the hospital, GP or out-of-hours social services team. The call centre or service function would treat them as a new case whether they had any history with social services or not (in fact 80 per cent of customers are already known to social services and even more to their GP), and details were repeatedly taken and logged. Gaining access to the system is only the start. Once inside, the customer is referred to another service team to conduct an initial assessment. And it goes on; in every case we found multiple handovers in assessment. Once a care plan is completed and, for example, home care is required, the case is referred to a purchasing function to find a provider - internal or commercial (‘block’) provider - with availability. The care provider will then assess the service user once again and, finally, deliver the care. This is not the end, however. Four to six weeks after the start of the care a review of the service user’s progress is carried out, requiring more administration (regardless of client need). There is a further review within 12 months to meet government targets. Once care is being delivered, the finance department invoices the client and, if necessary, chases up payment. A common cause of failure demand is that the financial assessment may be carried out after the start of care so the client has no idea how much it will cost. If as is often the case they cannot pay, the process goes through another loop as they call to cancel care or request a reduction in hours. In one case we found that users had to go through an average of 81 steps to obtain domestic and 82 steps for residential care. Of the actions carried out, only 5 per cent comprised value (i.e. were directly related to the purpose of obtaining care) and 95 per cent waste. System conditions Adult Social Care is subject to a far-reaching regulatory regime. In common with other regulatory regimes that have grown up in recent years, it specifies many things managers have to do. For example, the regime requires measurement and reporting against functional measures (e.g. Targets and standards for appointments, assessment and so on) rather than end to end. Hence the common phenomenon that each function in a service is hitting its individual processing or assessment targets while the customer is still spending months travelling through the system. The preoccupation with functional budgets creates a system that works to keep people out, rather than solve their problem. Eligibility criteria and a functional view of the work multiply assessments and hence waste. A plethora of constantly changing assessment
12
criteria set down for social workers are a significant factor in inhibiting good adult social care. A summary of the current regulatory regime is included in the Appendix. Here I summarise observations on the relationship between regulations and performance. Reliability of star ratings Services operating as poorly as described above can still be awarded the full three stars by the Commission for Social Care Inspection (CSCI) because the measures of speed in assessment and provisioning are functional, relating to individual services and activities, not to the whole client experience end to end. As it happens, while the star ratings for these cases varied from zero to three their systems did not: from the client point of view they all showed similar systemic dysfunction. The unreliability of the ratings is underlined by the observation that official improvements are not reflected in results on the ground. Between 2002 and 2004, the number of zero- and one-star rated councils fell consistently each year (by 8-5-5 per cent and 50-36-27 per cent respectively) while the number of councils awarded two or three stars increased (35-49-55 per cent and 7-11-13 per cent). On the other hand the Vanguard studies support the conclusion of the Kings Fund and others that the system is failing, irrespective of individual ratings. Organisation design Local authorities have been encouraged to follow centrally-conceived ideas about organisation design. In common with other services, Adult Social Care has been encouraged to establish call centres as a first point of contact. The idea was that call centres would provide equality of access. Yet in practice, as we have found with other local authority services, the call centres are stuffed with failure demand. All these services illustrate the same phenomenon: a definition of an ineffective service is that it generates high levels of failure demand. Moving the work elsewhere (into a call centre) does nothing to remove the failure demand or improve service; it simply adds and institutionalises a layer of cost. In social-care call centres ‘equality of access’ has been translated as ‘everyone has the right to an assessment’. This triggers the plethora of forms to be filled in. The consequence is that the system assesses everyone whether they need it (or ask for it) or not. It makes the system a ‘provisioning’ system, not a problem-solving system. In one case we found that at first contact 50 per cent of customers expressed the desire to remain independent, simply needing help with minor matters such as shopping, bathing and cleaning. However, these calls were being met by a provisioning system, so service agents would typically ask: ‘Would you like someone to come in for a couple of days a week?’ Their job was to move the work to the ‘right’ department, not listen to clients and help them solve their problem. Once in the system the client would be subjected to multiple assessments, for both care and finance. In short, the design works to multiply the numbers of people receiving inappropriate care.
13
IT systems The growth of reporting demands has generated increasing pressures on councils to buy IT systems for record keeping, document management and reporting. The consequence is functional duplication of IT systems, and the systems process cases not people. Because of inevitable problems with use many people keep written records for their own use. It has recently been mandated by government that clients of Adult Social Care should be subjected to a ‘single shared assessment’ and that this should be accessible in electronic form. It is a plausible idea. In the cases we worked with there were various examples of what managers called ‘single shared assessment’, some using IT systems, some not. In practice none was truly single; all exhibited the problems described here. The IT solution being promulgated (which we have yet to see in practice) currently includes extraordinarily long questionnaires: a one-size-fits-all solution that will predictably lead to overspecification in the work (collecting data that has no relevance to the current problem) and, hence, client dissatisfaction. It is expected that adherence will be inspected for, not efficacy or efficiency. The costs of the IT ‘solution’ are likely to far exceed the value. Regulation of provisioning Regulations also govern the way provisioning of services works. At one district council we found that 60 per cent of all demand was for level-access showers. There is a regulatory requirement for every shower to have a detailed specification and three quotes from builders. It would be far simpler and cheaper to work with one supplier who just did the work, without specifications and quotes. Concerns about management control could easily be met by simple safeguards to avoid potential fraud in working with a single-source supplier. In any case, how ‘in control’ are the managers of the present systems? Targets and budgets Performance on specific targets has to be reported by function to a large number of inspection agencies (see Appendix). The targets drive each function to deal with a client in ways that meet their numbers, not client needs. This is the principal cause of multiple handovers, adding to costs and worsening service. Repeated assessments are also caused by each service function being focused on protecting their budget. Which in turn causes handovers: if clients are not eligible according to the function’s specific activity, they are passed on to other functions for further assessment. Whenever a client is passed on, a function can close the case, meeting targets. Managers worry about, and so monitor, case loads; encouraging staff to close cases. This reinforces the episodic nature of the relationship between the clients and service providers. Some of the targets are bizarre. Local authorities are required to report on the number of people receiving 20 hours, more than 20 hours, or more than 10 hours of home help. But they are not required to report on people who are receiving smaller packages. Setting an arbitrary measure drives perversity into the system because employees get paid attention to if someone thinks their numbers don’t look right. Measuring big packages means that people focus on those, at the expense of providing the immediate, preventive care that would often obviate the need for the big packages in the first place.
14
The regulatory regime is wide and pervasive. Inspections, targets and assessment criteria are everywhere. Yet from the client perspective the judgement in unequivocal: the system is failing. The performance problems are system problems. It is as statistician W.E. Deming taught 50 years ago: 95 per cent of causes of variation in performance are attributable to the system, the way work is designed and managed. The stated purpose of the regulatory regime is to promote independence, but by designing a system that focuses on eligibility and, hence, protecting provision, the costs of provision rise. The unintended consequence is a system that creates greater dependence on social services. We found that many users who simply wanted good advice were unnecessarily given provision, and others ended up in care homes when it was similarly inappropriate. Government strategy is to ‘reduce need and enable’, the putative goal being to increase independence. However, we found examples where care workers would historically inflate the need in order to meet their ‘reduction’ targets; their concern being for their client. In the same way targets cause ‘revolving door’ cases, in and out of hospital. Hospitals are targeted on getting people out; their administrative procedures for notifying social services are often not efficient. The design of social services organisations (as described here) also meant inefficient handling of hospital requests. The classifications and, hence, reporting of bed usage in different facilities (acute, community, rehabilitation) meant each was focused more on meeting its targets than providing services to those in need. Consequently people were kept in when they should have been out of hospital, or released when they should have been kept in. The plethora of forms associated with who pays for a service also caused delays to service provision and thus delayed solving the client’s problem, increasing the likelihood of readmission. In provisioning, the contracted care organisations are paid per hour of provision, so there is no incentive to reduce amounts of care. The underlying logic of outsourcing is that contractors can’t be trusted; they have to be controlled and inspected. This not only adds cost but stops contractors being treated as part of the system. Care workers should be a useful source of information - the thermostat in the system. Because the contract is based on hours worked, not the degree of independence/improvement achieved (this is deemed to be the province of ‘in-house’ staff) this does not happen; rather, the consequences are that work is duplicated and undervalued carers are more likely to leave, adding to the problems for the client. In practice, ‘reduce need and enable’ becomes ‘extend needs and disable’, the de facto purpose of this system. From Vanguard’s work in these councils, a worrying picture emerges: lengthy, indeed alarming, amounts of time taken up in assessment and provision, raising the administrative costs of provision, yielding a poor quality service, and, moreover, drivings up the eventual cost of the care. Of greatest concern is the evidence that failing to meet the needs of people early increases the overall cost of provision - the longer people wait, the more likely their condition is to deteriorate. While the system thus perversely amplifies the demand for more expensive support, managers are obliged by targets to limit admissions to residential care. So the wrong people get in while others are turned away or made to wait.

15
What matters to people who need help is the speed with which they get it. That should be the concern of policymakers too - faster support delivers both lower costs and better service. There is plenty of scope for improvement; significant savings can be made in the administration of care as well as provisioning. A better service would remove the costs associated with users becoming more needy because of failure to intervene early. It would also create greater independence among users, a central aim of policy.
16
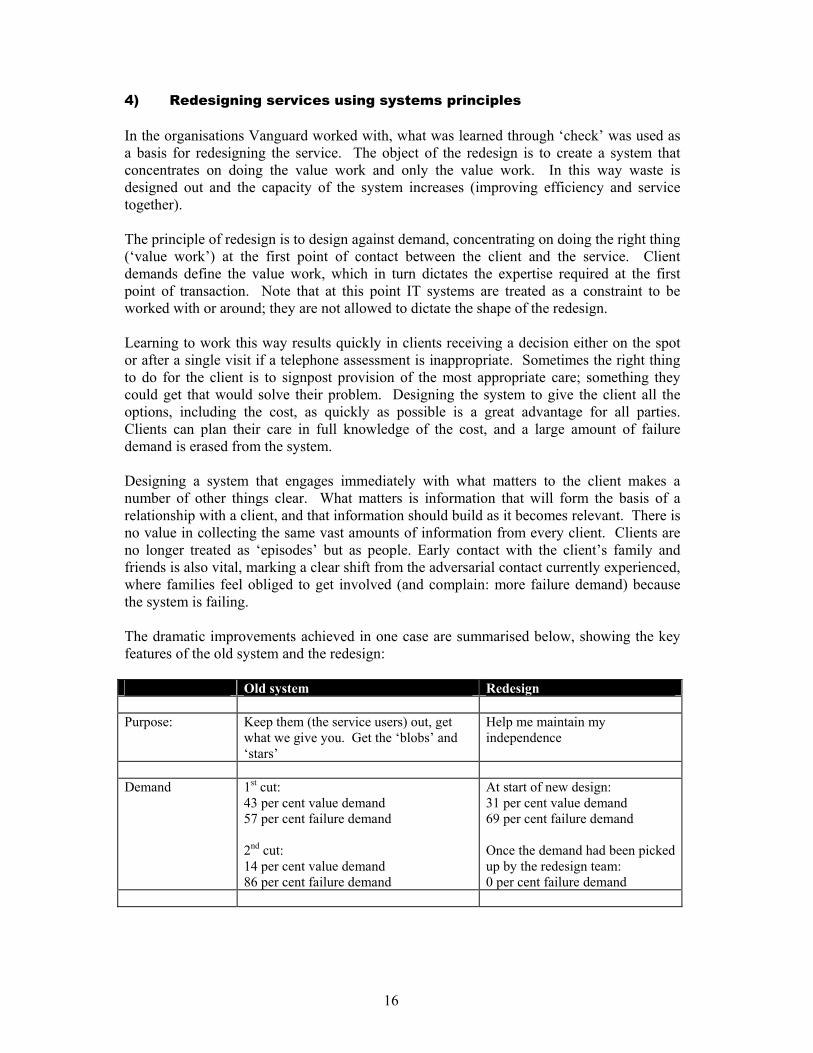
4) Redesigning services using systems principles In the organisations Vanguard worked with, what was learned through ‘check’ was used as a basis for redesigning the service. The object of the redesign is to create a system that concentrates on doing the value work and only the value work. In this way waste is designed out and the capacity of the system increases (improving efficiency and service together). The principle of redesign is to design against demand, concentrating on doing the right thing (‘value work’) at the first point of contact between the client and the service. Client demands define the value work, which in turn dictates the expertise required at the first point of transaction. Note that at this point IT systems are treated as a constraint to be worked with or around; they are not allowed to dictate the shape of the redesign. Learning to work this way results quickly in clients receiving a decision either on the spot or after a single visit if a telephone assessment is inappropriate. Sometimes the right thing to do for the client is to signpost provision of the most appropriate care; something they could get that would solve their problem. Designing the system to give the client all the options, including the cost, as quickly as possible is a great advantage for all parties. Clients can plan their care in full knowledge of the cost, and a large amount of failure demand is erased from the system. Designing a system that engages immediately with what matters to the client makes a number of other things clear. What matters is information that will form the basis of a relationship with a client, and that information should build as it becomes relevant. There is no value in collecting the same vast amounts of information from every client. Clients are no longer treated as ‘episodes’ but as people. Early contact with the client’s family and friends is also vital, marking a clear shift from the adversarial contact currently experienced, where families feel obliged to get involved (and complain: more failure demand) because the system is failing. The dramatic improvements achieved in one case are summarised below, showing the key features of the old system and the redesign: Old system Redesign Purpose: Keep them (the service users) out, get
what we give you. Get the ‘blobs’ and ‘stars’
Help me maintain my independence
Demand 1st cut:
43 per cent value demand 57 per cent failure demand 2nd cut: 14 per cent value demand 86 per cent failure demand
At start of new design: 31 per cent value demand 69 per cent failure demand Once the demand had been picked up by the redesign team: 0 per cent failure demand
17
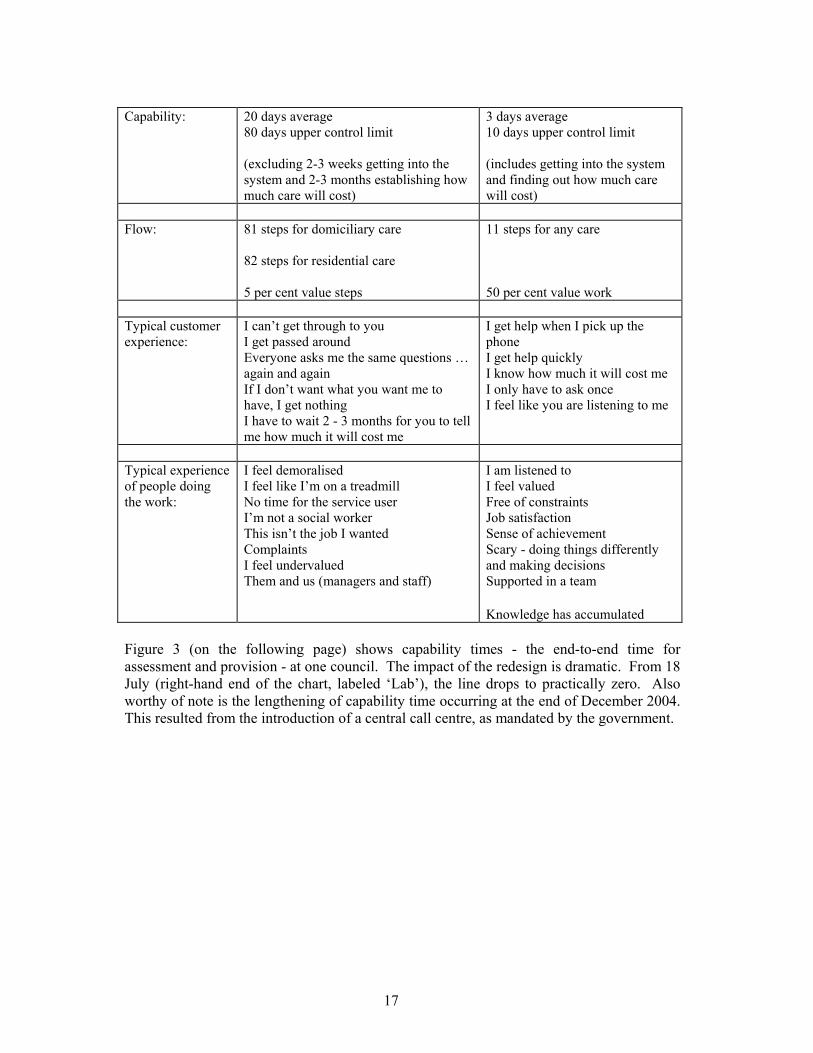
Capability: 20 days average
80 days upper control limit (excluding 2-3 weeks getting into the system and 2-3 months establishing how much care will cost)
3 days average 10 days upper control limit (includes getting into the system and finding out how much care will cost)
Flow: 81 steps for domiciliary care
82 steps for residential care 5 per cent value steps
11 steps for any care 50 per cent value work
Typical customer experience:
I can’t get through to you I get passed around Everyone asks me the same questions … again and again If I don’t want what you want me to have, I get nothing I have to wait 2 - 3 months for you to tell me how much it will cost me
I get help when I pick up the phone I get help quickly I know how much it will cost me I only have to ask once I feel like you are listening to me
Typical experience of people doing the work:
I feel demoralised I feel like I’m on a treadmill No time for the service user I’m not a social worker This isn’t the job I wanted Complaints I feel undervalued Them and us (managers and staff)
I am listened to I feel valued Free of constraints Job satisfaction Sense of achievement Scary - doing things differently and making decisions Supported in a team
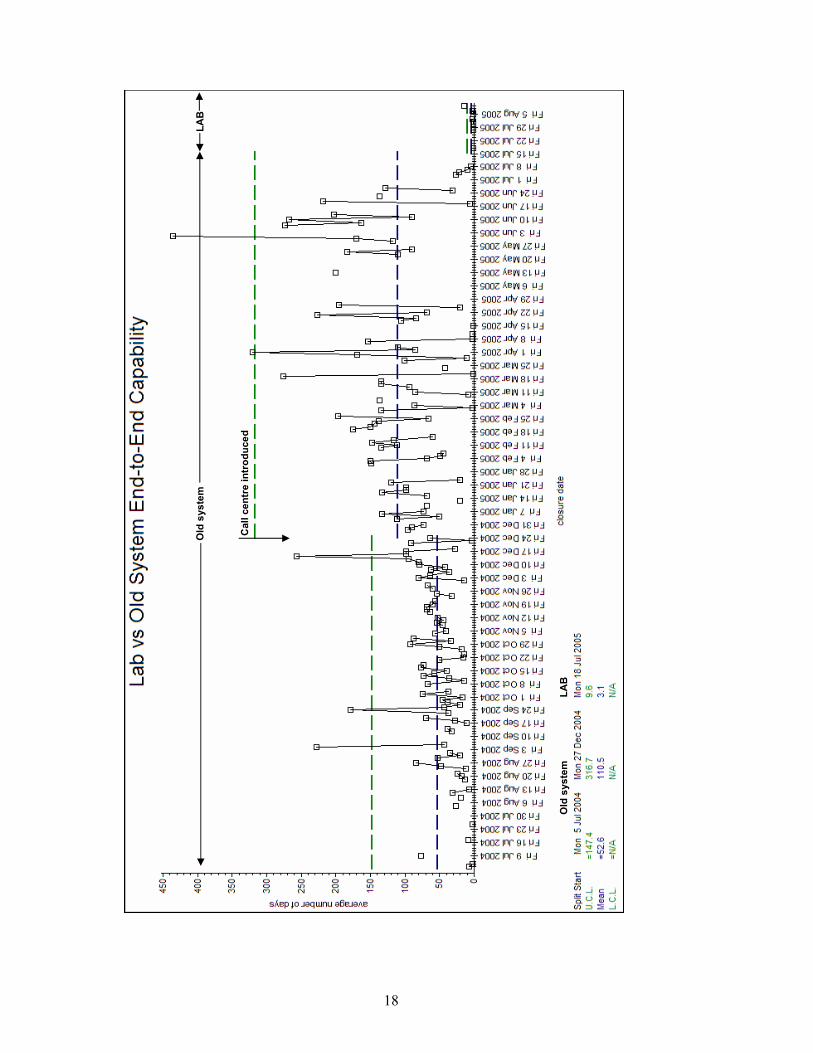
Knowledge has accumulated Figure 3 (on the following page) shows capability times - the end-to-end time for assessment and provision - at one council. The impact of the redesign is dramatic. From 18 July (right-hand end of the chart, labeled ‘Lab’), the line drops to practically zero. Also worthy of note is the lengthening of capability time occurring at the end of December 2004. This resulted from the introduction of a central call centre, as mandated by the government.
18
Old
sys
tem
LA
B
Old
sys
tem
LA
B
Cal
l cen
tre
intr
oduc
ed
19
In every case redesign has resulted in clients receiving assessments and having their needs met in days. Clients’ dignity and independence are optimised at the same time as the administrative costs of assessment and provision significantly fall. But more importantly the cost of care provisioning goes down too. For example, it became clear in ‘check’ that placements to care homes were often unnecessary, being made for expedient rather than physical reasons. A wrong placement was likely to lead to increased dependency and long-term problems. Redesign leads to a reduction in failure demand. In one case it fell by 45 per cent as the number of calls dealt with at the first point of contact rose. Clients report being very pleased with the service; many frequent users have been astonished at the change. Since as with all local authority services current budgeting processes are fragmented, the impact of the redesign on costs cannot yet be fully determined. But each of the following has a positive impact on costs:
• reduced failure demand • more ‘information’ and ‘help’ demands being met at the first point of transaction,
cutting the need for provision • faster assessment • faster and appropriate provisioning.
In the larger picture, independence is maintained as clients’ problems are more speedily resolved. Redesign also has a massive impact on staff morale. Perhaps the most poignant illustration is the comment made by a social worker after the first week of working in the new design. She said: ‘Do you know, it’s been the first time in so long that I can say I have actually spent the week as a social worker?’ Conclusion The root cause of the delays, high cost and poor matching of need that is the reality for many old people of social care is not underqualified social workers or a lack of funding, but rather a poorly designed system. Adopting a systems approach to the problems results in significant improvements. Removing waste from the system expands capacity as well as improving the quality of care, allowing the service to deal with the projected increase in demand without additional funding.
20
5) Towards a facilitative regulatory regime In every local authority service we have studied the current regulatory regime is part of the problem. In attempts to control and improve Adult Social Care ministers have unintentionally made the service worse for both clients and service providers. In systems terms the regulatory regime is a cause of waste. Consider the costs associated with:
• Writing specifications • Inspecting for compliance • Preparing for inspections • Wrong specifications, causing failure demand and making the work worse • Low morale.
It will be tempting to address the issues by rewriting the current specifications. However, in systems terms this simply serves to ‘do the wrong thing righter’. The important thing is to determine what is the right thing to do. Because the new system uses different measures in a different way, in every case the redesign, while showing beneficial results for both clients and the organisation, placed managers in the tension of being unable to comply with reporting requirements. To meet those requirements, they were obliged to maintain a bureaucracy of no relevance to the improvement or management of the work. In one case the requirement to comply with an inspector’s (unhelpful) requirement took precedence over the work described herein. The regime is one of fear. Elsewhere2 I have argued that the current regime has the wrong focus. Public sector managers need to change, of that there is little doubt. But helping them change requires placing the locus of control with them, not the specifiers and inspectors. In its general form inspection should be limited to asking a single question: ‘What measures are you using to understand and improve performance?’ The emphasis is explicitly on both understanding and improvement because too many ‘improvement’ initiatives begin without any measures aimed at obtaining understanding (knowledge) beforehand. Of course this regime would require education of inspectors so they could work beyond the ‘tick-box’. The savings achieved by dismantling the specifications and inspection industry would only be surpassed by the benefits to services that would ensue if people were free to do the right thing.
2 “Freedom from Command and Control”, Vanguard Press, 2003.
21
Appendix: Summary of current regulatory requirements Councils are currently required to report the following: To the Commission for Social Care Inspection (CSCI):
• Delivery and Improvement Statements (DIS) • Performance Assessment Frameworks (PAF), of which some are Key Thresholds
(KT) • Be subjected to a CSCI inspection to receive a star rating.
To the Audit Commission:
• Best Value Performance Indicators (BVPI) • The Comprehensive Performance Assessment (CPA)
To the Department of Health:
• Referrals, Assessments and Packages of Care (RAP). There are currently 26 PAFs that Councils must report on, five of which are KTs. But the situation is constantly changing: for example, between 2004-05 and 2005-06, CSCI is removing two PAFs, adding two and adjusting the method of calculating seven, and also increasing the number of PAFs which are also KTs to 10. The changing nature of the targets makes it hard for social workers to keep track of what statistics they must produce and waste time not only calculating the measurements but keeping up to date with what they are. A PAF is a measurement of some aspect of the system, for example time taken from presenting to assessment3. A KT sets a benchmark level for a PAF and if this figure is not met it affects the council star rating and thus will influence the way the authority chooses to provide services, for example if the limit of people in residential care is achieved no further provision will be made. The DIS is the overall reporting tool from councils to the CSCI, including all adult social care statistical data such as PAFs. In the DIS, the councils must also detail achievements in the past year against improvement targets, strategies to deliver improvements in the coming year with targets, additional information to monitor progress with national targets for DH policy branches and with the use of grants. Alongside the last year’s statistical data, councils must plan and forecast data in the self-assessment part of the DIS. There is considerable overlap between the measures. For example, the length of time from first contact with new clients to the start of the first assessment is covered by A9 in the RAP to the Department of Health, D55 PAF to CSCI (and this PAF is also a KT) and BVPI 195 to the Audit Commission. Other overlapping measures include the number of older people who are helped to live at home in P2s in the RAP to DH, by C32 to the CSCI and by
3 The measure associated with time to assessment is unusually complex. It averages the percentage where the time taken from first contact to beginning of assessment is less than or equal to two days, and the percentage where the time taken from first contact to completion of assessment is less than or equal to twenty eight days.
22
BVPI 54 to the Audit Commission; and acceptable waiting times for care packages in A8 in the RAP, D56 as a PAF and BVPI 196 (which is also a KT). The presence of these targets makes the priority for social care staff to act in a way to meet the targets rather than concentrating on what is best for the service user. For example if staff are measured on how many assessments they can complete in a certain time, they are encouraged to quickly get through an assessment and hand it over to the next team in the system so it is no longer ‘on their books’. This may fulfill the assessment criteria but means that assessments are not always completed accurately, the applicant’s real needs are not identified or they are handed over to the wrong person. In the long run this wastes time and effort as the applicant has to be reassessed and handed over between more people, so it takes longer for them to receive care Targets also lead to the set-up of specialist review and assessment teams. For example, the KT of sufficient clients receiving a review (PAF D40) leads to the creation of specialist review teams and the target to provide sufficient services to carers (PAF C62) has caused Carers Assessment Teams to be set up. These teams are separated from core work, and thus divert funds from customers. Compiling the data itself requires significant resources in hours spent by staff. Although no records are kept of how long social workers spend filling in forms, social workers report spending three or four hours filling in paperwork after a one-hour visit to a customer. Single Assessment Procedure In March 2001, the National Service Framework for Older People (NSF) was used to introduce the Single Assessment Process (SAP) which aimed to ensure that older people were not subject to multiple assessments by different agencies. The Centre for Policy on Ageing was commissioned by the Department of Health to help councils implement SAP. Detailed guidance was published in January 2002 and the deadline for implementation of SAP was set as April 2004. DoH believes that SAP will cut red tape: ‘Through greater commonality in assessment procedures, appropriate professional involvement in SAP and more information sharing, practice will improve and duplication be minimized.’ However, by introducing more procedures to go through, DoH then feels that that the SAP itself requires monitoring. The SAP requires a three-stage activity:
• Initial assessment • Overview assessment • Service assessment - if services are actually given
Social services need to prove they are carrying out this procedure, and they are encourged to use accredited tools to do so and do it electronically. There are at least six DoH-accredited assessment tools (including CAT, EASY, FACE MDS) and numerous other assessment tools not accredited by the DoH as councils are permitted to create their own assessment tool.
23
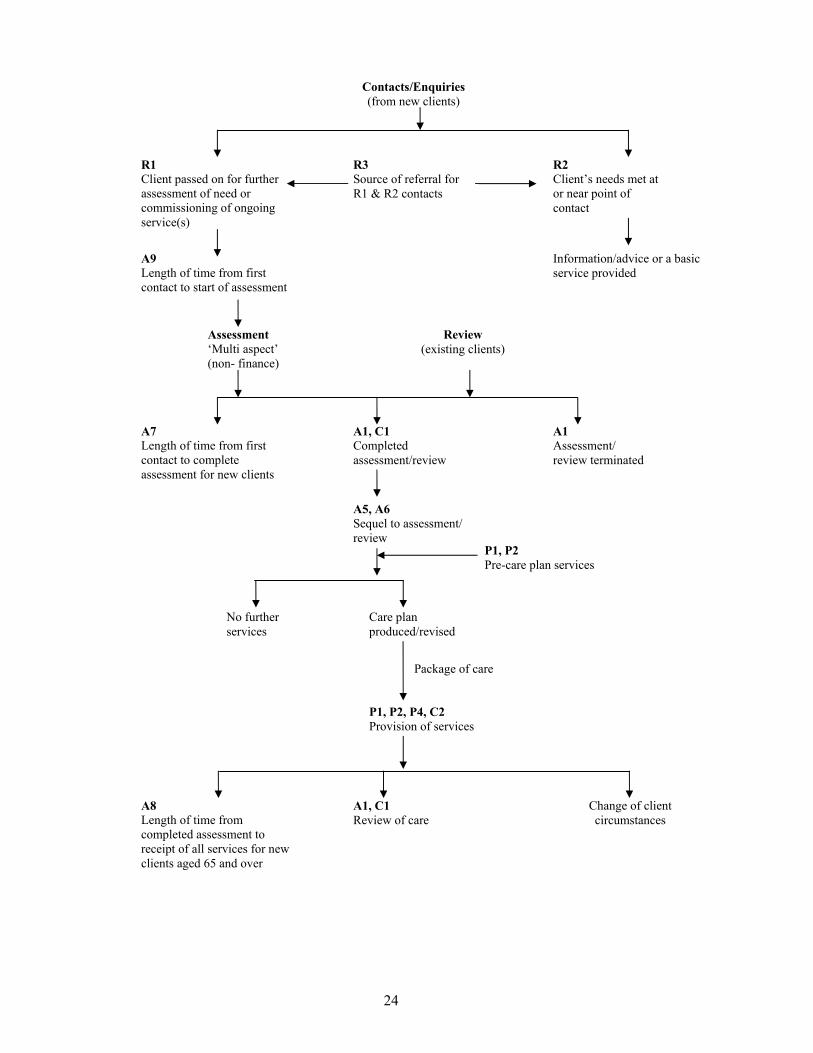
SAPs are further complicated because large-scale assessments have not been carried out recently and many committees that set the SAP within councils want to create a comprehensive assessment. This has lead to large assessment documents which attempt to record a substantial amount of information: for example FACE (Functional Analysis of the Care Environment) provides a 16-page document to assess older people while the MDS assessment tool comprises a 44-page document which records virtually every aspect of the client’s life. Little of this is actually necessary. Social workers visiting an applicant can usually record all the information they need on half a page of A4. Thus using a complicated tool to conduct a SAP defeats the whole purpose of the exercise which was to simplify assessment, require older people to answer fewer questions and diminish paperwork for social workers. The complications seen are the result of the specifications and compliance regime. Comparison shows that the simpler and more client-focused redesigns put in place at the five councils care are capable of meeting all the SAP objectives. Referrals, Assessments and Packages of Care The following returns were required by DoH in 2004-05: Referrals - three returns - covering the number of new clients. This covers activities before formal assessment such as first contact when an ongoing service is commissioned, the customer’s needs are dealt with at the contact point or before being sent for a formal assessment. Each activity with each client is counted as ‘an episode’. Assessments - six returns - including the number of assessments completed, length of time from first contact to start and end of assessment, time from assessment completion to receipt of all services. All these returns must be broken down into time bands, by referral category, age group and primary client type and ethnicity. Packages of care - four returns - detailing the number of clients receiving a service or ‘on the books’ during the year. Again this must be broken down into ethnicity, service type, primary client type and age group. A new category was introduced in 2004-05: Carers - two returns - number of carers for whom an assessment or review were completed; or received services during the year. As the document states, some returns will be used in the calculation of Audit Commission, PAF and Best Value indicators. RAP Flowchart The DoH issued a 126-page document on definitions, what to count and how to fill in the proformas for RAP returns in the year April 1 2004 to March 31 2005. This document contains a flowchart which illustrates just how overcomplicated and overassessed the government departments have made the process of providing care.
24
A1, C1 Completed assessment/review
A7 Length of time from first contact to complete assessment for new clients
A1 Assessment/ review terminated
Assessment ‘Multi aspect’ (non- finance)
P1, P2 Pre-care plan services
Package of care
P1, P2, P4, C2 Provision of services
A1, C1 Review of care
A8 Length of time from completed assessment to receipt of all services for new clients aged 65 and over
Change of client circumstances
Contacts/Enquiries (from new clients)
R3 Source of referral for R1 & R2 contacts
R1 Client passed on for further assessment of need or commissioning of ongoing service(s)
R2 Client’s needs met at or near point of contact
A9 Length of time from first contact to start of assessment
Information/advice or a basic service provided
Review (existing clients)
A5, A6 Sequel to assessment/ review
Care plan produced/revised
No further services
25
Care Standards The government’s enthusiasm for further targets and assessments is very often counterproductive, as illustrated by the effect of the introduction of Care Standards. This central government initiative has added overheads to the recruitment of carers with further training and accreditation required. This means in practice that it is no longer economically viable to hire carers who can work less than 20 hours per week. Previously, a commercial organisation delivering home care services to one council was able to hire carers to work as little as four hours per week. Often these were carers who were keen to work a single night shift. Since the council had great difficulty attracting carers, particularly those prepared to work night shifts, the initiative has been quite detrimental. Council star-rating system The CSCI awards each social services department a star rating from zero to three stars. The star assessment includes evidence from inspections and reviews, monitoring and performance indicators. The ratings are built up from four judgments that are published alongside the star rating, and as can be seen, half of the judgments relate to adult services:
1) Children services - serving people well 2) Children services - capacity for improvement 3) Adult services - serving people well 4) Adult services - capacity for improvement
The social star rating is designed to be compatible with performance information for both the NHS and other local government services and also to feed directly into the local government comprehensive performance assessment (CPA). The CPA, introduced in 2003, fulfils the same function as social services stars, but for all local government services. A council must receive a good star rating for social services in order to receive the highest CPA rating, so the performance of adult social services is important to the council’s overall rating. The star rating relates back to the PAFs and KTs because a council cannot receive three stars if it fails to reach the KTs. The social services sector has voiced its concerns to the government. In September 2004 the Association of Directors of Social Services (ADSS) called on social care inspectors and the government to simplify the inspection and performance monitoring requirements. The ADSS has warned that social services departments face a ‘mounting burden of demands’ from various inspectorates and auditors, which are not properly co-ordinated. It wants CSCI, Ofsted, the Audit Commission and government departments to tackle the issue. David Johnstone, director of social services at Devon Council, said: ‘We are concerned that far from getting a lighter touch inspection regime, there’s actually a more extensive performance monitoring framework being brought in.’ Alongside the PAF, additional performance measures were being added to social services departments’ twice-yearly DIS, he said, while more reporting requirements for social services were being included in NHS local development plans. He concluded: ‘When inspectorates talk about a lighter touch they are just talking about the formal inspection model, but there's a huge burden of reporting and monitoring over and above that.’
26
Under the government’s policy to implement a proportionate approach to inspection, the highest performing councils achieving three stars have experienced fewer inspections and reduced monitoring. Conversely, poorly performing councils, earning zero or one stars, are subject to more assessments and inspections. Inspection Bodies The CSCI, which collects DIS, PAF, KTs and awards the star ratings, was launched in April 2004, incorporating the work formerly done by:
• The Social Services Inspectorate (SSI) • SSI/Audit Commission Joint Review Team • The National Care Standards Commission (NCSC) • The DoH (in monitoring PAFs).
Despite the recent formation of the CSCI, John Reid, then the Secretary of State for Health, announced in March10 that by 2008, CSCI and the Healthcare Commission would merge to form a single entity. While CSCI regulates adult social care services provided by local authorities and independent care providers, the Healthcare Commission regulates the quality of the NHS and independent health care services. No doubt this merger will necessitate a further raft of coordinated assessment criteria meaning that social workers will have to come to terms with a further set of assessment tools. Meanwhile, the government is already working with CSCI on how the Green Paper’s desired outcomes - improved health, quality of life, economic well-being, choice, dignity, freedom from discrimination and contributing to society - can be inspected in practice. It is likely that the Green Paper will result in more inspection.
27
References 1) Independence, well-being and choice: our vision for the future of social care for
adults in England. Department of Health. Published 21 March 2005. 2) The Business of Caring: King’s Fund Inquiry into care services for older people in
London. King’s Fund. Published June 2005. 3) Releasing resources to the front line: Independent Review of Public Sector
Efficiency. Sir Peter Gershon. Published July 2004. 4) Green Paper on Adult Social Care. IAG press release 1 August 2005. 5) Future demand for long-term care in the UK: A summary of projections of long-
term care finance for older people to 2051. By Raphael Wittenberg, Adelina Comas-Herrera, Linda Pickard and Ruth Hancock. Published by the Joseph Rowntree Foundation September 2004.
6) Social services finance 2004/05: a survey of local authorities. Published by the
LGA on 6 July 2005. 7) Annual Efficiency Statements - July summary report. Institute of Public Finance,
25 July 2005. 8) What price care in old age? SPAIN, July 2005. 9) Under-funding in elderly social care. SPAIN, February 2002. 10) Reid confirms planned merger of Healthcare Commission and Commission for
Social Care Inspection. Department of Health.


![[5] Rpp Tematik 1bu Erna](https://static.fdocuments.net/doc/165x107/5571fbbe497959916995b190/5-rpp-tematik-1bu-erna.jpg)