Adtran DSU/CSU (9035013) - CA...
62
Adtran DSU/CSU SPECTRUM Enterprise Manager Device Management Supports Management Module SM-ADT1000 Titlepae Titlepae Titlepae Titlepae
-
Upload
truonghuong -
Category
Documents
-
view
217 -
download
1
Transcript of Adtran DSU/CSU (9035013) - CA...

Adtran DSU/CSU
SPECTRUM Enterprise ManagerDevice Management
Supports Management Module SM-ADT1000
TitlepaeTitlepaeTitlepaeTitlepae

S P E C T R U M E n t e r p r i s e M a n a g e r Page 2 A d t r a n D S U / C S U
Noti ceAprisma Management Technologies, Inc. (Aprisma), reserves the right to makechanges in specifications and other information contained in this document withoutprior notice. The reader should in all cases consult Aprisma to determine whetherany such changes have been made.
The hardware, firmware, or software described in this manual is subject to changewithout notice.
IN NO EVENT SHALL APRISMA, ITS EMPLOYEES, OFFICERS, DIRECTORS,AGENTS, OR AFFILIATES BE LIABLE FOR ANY INCIDENTAL, INDIRECT,SPECIAL, OR CONSEQUENTIAL DAMAGES WHATSOEVER (INCLUDING BUTNOT LIMITED TO LOST PROFITS) ARISING OUT OF OR RELATED TO THISMANUAL OR THE INFORMATION CONTAINED IN IT, EVEN IF APRISMA HASBEEN ADVISED OF, KNOWN, OR SHOULD HAVE KNOWN, THE POSSIBILITYOF SUCH DAMAGES.
Copyright © February 2001 by Aprisma Management Technologies. All rightsreserved.
Printed in the United States of America.
Order Number: 9035013
Aprisma Management Technologies, Inc.121 Technology DriveDurham NH 03824
SPECTRUM, the SPECTRUM IMT/VNM logo, DCM, IMT, and VNM are registeredtrademarks, and SpectroGRAPH, SpectroSE RVER, Inductive ModelingTechnology, Device Commu nications Manager, and Virtual Network Machi neare trademarks of Aprisma or its affiliates. The Adtran and Adtran ATLAS devicesare registered trademarks of Adtran, Inc.
Ethernet is a trademark of Xerox Corporation.
Virus Discla imerAprisma makes no representations or warranties to the effect that the LicensedSoftware is virus-free.
Aprisma has tested its software with current virus checking technologies. However,because no anti-virus system is 100% reliable, we strongly caution you to writeprotect and then verify that the Licensed Software, prior to installing it, is virus-freewith an anti-virus system in which you have confidence.
Restri cted Right s Noti ce(Applicable to licenses to the United States Government only.)
1. Use, duplication, or disclosure by the Government is subject to restrictions asset forth in subparagraph (c) (1) (ii) of the Rights in Technical Data andComputer Software clause at DFARS 252.227-7013.
Aprisma Management Technologies, Inc., 121 Technology Drive NH 03824
2. (a) This computer software is submitted with restricted rights. It may not beused, reproduced, or disclosed by the Government except as provided inparagraph (b) of this Notice or as otherwise expressly stated in the contract.
(b) This computer software may be:
(1) Used or copied for use in or with the computer or computers for whichit was acquired, including use at any Government installation to whichsuch computer or computers may be transferred;
(2) Used or copied for use in a backup computer if any computer for whichit was acquired is inoperative;
(3) Reproduced for archival or backup purposes;
(4) Modified, adapted, or combined with other computer software, providedthat the modified, combined, or adapted portions of the derivativesoftware incorporating restricted computer software are made subjectto the same restricted rights;
(5) Disclosed to and reproduced for use by support service contractors inaccordance with subparagraphs (b) (1) through (4) of this clause,provided the Government makes such disclosure or reproductionsubject to these restricted rights; and
(6) Used or copied for use in or transferred to a replacement computer.
(c) Notwithstanding the foregoing, if this computer software is publishedcopyrighted computer software, it is licensed to the Government, withoutdisclosure prohibitions, with the minimum rights set forth in paragraph (b) ofthis clause.
(d) Any other rights or limitations regarding the use, duplication, or disclosureof this computer software are to be expressly stated in, or incorporated in,the contract.
(e) This Notice shall be marked on any reproduction of this computer software, inwhole or in part.
S P E C T R U M E n t e r p r i s e M a n a g e r Page 3 A d t r a n D S U / C S U
ContentsINTRODUCTION 5
Purpose and Scope ........................................................5Required Reading ...........................................................5Supported Devices..........................................................6
IQ Series ..............................................................6DSU Series/TSU Series .......................................6T1 Multiplexers .....................................................6Total Access System............................................6DSU/CSU and ISDN Rackmount Solutions..........7ATLAS Series .......................................................7
The SPECTRUM Model ..................................................7
TASKS 10
DEVICE VIEW 11
Interface Device View ...................................................11Interface Icons ..............................................................12Interface Icon Subviews Menu......................................13Interface Status View ....................................................13
Secondary Address Panel .........................................14Chassis Device View ....................................................14
Chassis Module Icons ...............................................14Module Identification Labels ..................................15Interface Labels .....................................................15Chassis Module Icon Subviews Menu ...................15General Option Card Module Detail View ..............15
Module LED Front Panel Detail View ....................16
DEVICE TOPOLOGY VIEWS 17
Device Topology View ..................................................17Sub-Interfaces Topology View ......................................18DevTop Chassis View...................................................18
APPLICATION VIEWS 19
Main Application View...................................................19Supported Applications .................................................20
Common Applications ...............................................20Device-Specific Applications .....................................21
Adtran Frame Relay Performance Application(AdFRPerformApp) ................................................22History Control Information View ...........................22Current PVC (Permanent Virtual Circuit) Status Table
View ................................................................22Interval PVC Status Table View.............................23Interval Port Status Table View .............................23Interval Port Error Table View................................24Interval History Time Table View ...........................24Daily PVC Status Table View ................................25Daily Port Status Table View .................................27Daily Port Error Table View ...................................28Daily History Time Table View...............................29
Adtran DS1 Application (AdtranDS1App) .....................30

C o n t e n t s C o n t e n t s
S P E C T R U M E n t e r p r i s e M a n a g e r Page 4 A d t r a n D S U / C S U
Adtran DS1 Alarm Event Table View .....................30Adtran DS1 Threshold Crossing Alert Table View .31
DSU IQ Configuration Application (DSUIQConfigApp) .33System Configuration Information View.................33Network Port Configuration View ...........................34DTE Port Configuration View .................................35PVC Configuration Table View ..............................35Dial Backup (DBU) Configuration View..................36
IQ Probe Configuration Application (IQProbeConfigApp) .38
Adtran TSU ESP Application (AdTSUESPApp) ............39TSU ESP Status View............................................39Test Operation View ..............................................40Unit Configuration View .........................................41
Trap Host Address Table ...................................41Network Configuration View...................................42DBU Configuration View ........................................42ISDN DBU Configuration View...............................43
ISDN Service Profile ID (SPID) Table ................44ISDN Local Directory Number (LDN) Table........44
Port Configuration View .........................................44Test Configuration View.........................................45Dial Configuration View..........................................45
Adtran Administrative Application (AdAdminApp) .........45Adtran ATLAS 800 Interface Application (AdATL800IfApp)
45Atlas 800 Management Group View ......................45Atlas 800 Physical Table View...............................46
Adtran ATLAS General Option Card Application(AdATLGenOCApp) ...............................................46
General Option Card Interface Table View ........... 46General Option Card Overall Module Status Table
View................................................................ 47Adtran ATLAS Front Panel Group Application
(AdATLFrPnlApp) .................................................. 48LCD Display View.................................................. 48CSU LED Group View ........................................... 48Module LED Table View........................................ 49
Adtran ATLAS V35Nx4 Application (AdATLV35x4App) 50The ATLAS V35Nx56 Interface Table Index ......... 50
PERFORMANCE VIEWS 53
Device Performance View ............................................ 54Port Performance View ................................................ 54
CONFIGURATION VIEWS 55
Device Configuration View ........................................... 55Interface Configuration View ........................................ 56DLCI_Port Configuration View ..................................... 56
ADTRAN PRODUCT VIEW 58
Product Identification Information View ................. 58Channel Information View ..................................... 58
Channel Bank Information Group ...................... 58Channel Unit Information Group ........................ 58
MODEL INFORMATION VIEW 60
INDEX 61

S P E C T R U M E n t e r p r i s e M a n a g e r Page 5 A d t r a n D S U / C S U
Introduction
This section introduces the SPECTRUM Device Management documentation for the Adtran series of devices.
This introduction contains the following topics:
• Purpose and Scope
• Required Reading
• Supported Devices (Page 6)
• The SPECTRUM Model (Page 7).
Purpose and ScopeUse this document as a guide for managing the Adtran devices described on Page 6 with SPECTRUM management module SM-ADT1000. This document describes the icons, menus, and views that enable you to remotely monitor, configure, and troubleshoot Adtran devices through software models in your SPECTRUM database.
Information specific to SM-ADT1000 is what is primarily included in this document. For general information about device management using SPECTRUM and explanations of SPECTRUM
functionality and navigation techniques, refer to the topics listed under Required Reading.
Required ReadingTo use this documentation effectively, you must be familiar with the information covered by the other SPECTRUM online documents listed below.
• Getting Started with SPECTRUM for Operators
• Getting Started with SPECTRUM for Administrators
• How to Manage Your Network with SPECTRUM
• SPECTRUM Views
• SPECTRUM Menus
• SPECTRUM Icons
• SPECTRUM Software Release Notice

I n t r o d u c t i o n S u p p o r t e d D e v i c e s
S P E C T R U M E n t e r p r i s e M a n a g e r Page 6 A d t r a n D S U / C S U
Supported DevicesSPECTRUM management module SM-ADT1000 currently allows you to model the Adtran Family of devices which includes Frame Relay Performance Monitoring devices, Multiplexers, and Enterprise Integrated Access devices. The following series of devices are supported:
IQ SeriesThe IQ Series of performance monitoring devices provide performance statistics of a Frame Relay network.
• DSU IQ Supports 56/64k Frame Relay and 100 DLCIs. EIA-232 and V.35 DTE Interfaces.
• TSU IQ Supports T1/FT1 Frame Relay access. Single V.35 DTE Interface. 100 DLCIs supported.
• TSU IQ+ Supports T1/FT1 Frame Relay access and TDM voice. DSX-1 and V.35 DTE Interfaces. 100 DLCIs supported.
• IQ Probe Frame aware monitoring device that fits between router and existing DSU/CSU. Frame Relay utilizing EIA-232, V.35, EIA-530, and X.21 Interfaces.
DSU Series/TSU Series• DSU IV ESP All-rate DSU/CSU with
embedded SNMP, EIA-232 and V.35 DTE Interfaces.
• TSU ESP Single port T1/FT1 DSU/CSU. Single V.35 DTE interface, automatic or manual Dial Backup. LAN to LAN bridging, Frame Relay circuit termination.
T1 Multiplexers• TSU 120e T1/FT1 multiplexer with
synchronous V.35 DTE interface and DSX-1 PBX port. Built-in 10 BaseT Ethernet interface.
• TSU 600e Channel bank replacement device. Six expansion with 12 to 24 ports per chassis. Integrated 10BaseT port. Supports up to 24 DTE interfaces.
Total Access System• Total Access 850
Features for voice and data, VoDSL, IP router, management, and a path to ATM. Capability to access ports on or off using inband management, turn features, functions, and access ports.

I n t r o d u c t i o n T h e S P E C T R U M M o d e l
S P E C T R U M E n t e r p r i s e M a n a g e r Page 7 A d t r a n D S U / C S U
DSU/CSU and ISDN Rackmount Solutions• Smart 16/16e Shelf
Rackmount system that holds up to 16 DSU, ISU, and TSU products.
ATLAS SeriesScalable integrated access systems that support voice, data, and video applications.
• ATLAS 800 A multi-function integrated access device. Eight slot modular platform with two network interfaces configurable for T1, DSX-1 or PRI operation. 10BaseT Ethernet interface. Functions as T1/T3 bandwidth manager, ISDN access switch, remote access concentrator and Digital Access Cross-Connect System (DACS).
• ATLAS 800PLUS Has the same functionality as the ATLAS 800 with additional Frame Relay voice, data concentration, switching, and Integral 10BaseT and IP Router. Supports external routers via V.35 or T1.
• ATLAS 550 Similar functionality to the ATLAS 800 but has six slot modular chassis. Two network interface slots (one T1/PRI module included in chassis). Functions as a multi-T1 IAD, ISDN switch, Frame Relay concentrator/switch.
The SPECTRUM ModelThe model type for the Adtran devices is AdtranDev. This model represents all of the Adtran devices except for the Atlas Series.
The model type for the Atlas Series is the AtlasDev.
Modeling results in the creation of Device icons that represent the devices and Application icons that represent their supported applications.
The Device icons contain double-click zones and provide access to Icon Subviews menus that let you perform device management activities such as those listed in Tasks on Page 10.
As Figure 1 shows, the appearance of the Device icons varies slightly depending on the kind of view it appears in.

S P E C T R U M E n t e r p r i s e M a n a g e r Page 8 A d t r a n D S U / C S U
Figure 1: Device Icons
The device-specific Icon Subviews menu options available from the Device icon are listed in Table 1.
Table 1: Icon Subviews Menu Options
Small Device Icon appearsin Topology and Applications views
Large Device Icon appears inDevice Topology, Location, andDevice Interface views
Option Accesses the...
Device Device View (Page 11)
Device Topology Device Topology Views (Page 17)
Application Application Views (Page 19)
Configuration Configuration Views (Page 55)
Product Information
Adtran Product View (Page 58)
Fault Isolation Fault Isolation Configuration Options view, which is described in the SPECTRUM Views documentation.
Model Information
Model Information View (Page 60)
Primary Application
Menu options that let you select either Gen Bridge App or MIB-II as the primary application.

S P E C T R U M E n t e r p r i s e M a n a g e r Page 9 A d t r a n D S U / C S U
The rest of this document covering the Adtran management module is organized as follows.
• Tasks (Page 10)
• Device View (Page 11)
• Device Topology Views (Page 17)
• Application Views (Page 19)
• Performance Views (Page 53)
• Configuration Views (Page 55)
• Adtran Product View (Page 58)
• Model Information View (Page 60)
The Adtran ATLAS devices also contain a Chassis Device View (Page 14) and a DevTop Chassis View (Page 18).

S P E C T R U M E n t e r p r i s e M a n a g e r Page 10 A d t r a n D S U / C S U
Tasks
This section contains an alphabetical list of device management tasks, with each task providing one or morelinks to views that let you perform the task.
Administrative Information (check)• Model Information View (Page 60)
Alarm Thresholds (set)• Interface Icon Subviews Menu (Page 13)
Configuration Information (check/change)• Configuration Views (Page 55)• System Configuration Information View
(Page 33)• Network Port Configuration View (Page 34)• DTE Port Configuration View (Page 35)• PVC Configuration Table View (Page 35)• Dial Backup (DBU) Configuration View
(Page 36)• Unit Configuration View (Page 41)• Network Configuration View (Page 42)• DBU Configuration View (Page 42)• ISDN DBU Configuration View (Page 43)• Port Configuration View (Page 44)
• Test Configuration View (Page 45)• Dial Configuration View (Page 45)
IP Address (find/change)• Device View (Page 11)• Secondary Address Panel (Page 14)
Network Type (check)• Network Type Label (Page 13)
Performance (check)• Device View (Page 11)• Interface Icons (Page 12)• Performance Views (Page 53)
Port Status (check/change)• Interface Status View (Page 13)
Topology (check)• Device Topology Views (Page 17)

S P E C T R U M E n t e r p r i s e M a n a g e r Page 11 A d t r a n D S U / C S U
Device View
This section describes the Device view and subviews available for models of Adtran devices in SPECTRUM.
Access: From the Icon Subviews menu for the Deviceicon, select Device .
Interface Device ViewThis view (Figure 2) uses icons and labels to represent the device and its components, such as modules, ports, and applications. The view provides dynamic configuration and performance information for each of the device’s serial and network I/O ports, which are represented by Interface icons in the bottom panel of the view. The middle panel of the view displays a Device icon, which lets you monitor the device operation and access other device-specific views.
Figure 2: Interface Device View
SpectroGRAPH: Router Device: Model Name
File View HelpTools
Model NameContactDescriptionLocation
Sys Up TimeManufacturerDevice TypeSerial Number
Network Address
Interface Description
Find Phy Addr
Interface Options PanelDevice Icon
AdtranDev
Model Name
1T1
0:0:1D:F:FD:B6
Adtran
0.0.0.0
ON
5SFTWARLPBK
0:0:1D:F:FD:B6
0.0.0.0
ON
9ATM8023
0:0:1D:F:FD:B6
zn1
0.0.0.0
ON
512AAL5
UAAL5
0.0.0.0
ON
2ethernet
Adtran
0.0.0.0
ON
6ATM port
0.0.0.0
ON
ATM7A1
0.0.0.0
ON
ATM7B1
0.0.0.0
ON
otherAdtran
0.0.0.0
ON
ATM
0.0.0.0
ON
ATM8B1
0.0.0.0
ON
ATM8B2
0.0.0.0
ON
ATM8B3
0.0.0.0
ON
ATM
0.0.0.0
ON
10
2783905 2783909
11
7
3 4
8
Interface Icons
Bookmarks
Model Name of type AdtranDev of Landscape node: Primary
Primary Application Gen Bridge App

D e v i c e V i e w I n t e r f a c e I c o n s
S P E C T R U M E n t e r p r i s e M a n a g e r Page 12 A d t r a n D S U / C S U
Interface IconsFigure 3 shows a close-up of an Interface icon from the Device view. Most of the informational labels on the icon also provide double-click access to other views, as explained in the following label descriptions.
Figure 3: Interface Icon
Interface Number LabelThis label displays the interface (port) number.
IF Status LabelThis label displays the current status of the interface for the primary application selected, e.g., Gen Rtr App or MIB-II App. Table 2 lists the possible label color representations. Note that the color of the label also depends on the interface’s current Administrative Status, which you set in the Interface Status View (Page 13). This view can be accessed by double-clicking the label.
Interface Type LabelThis label identifies the interface type (Ethernet, ATM, etc.). Double-click this label to access the Interface Configuration View (Page 56).
c
fg
b
1ethernet
0:0:1D:F:FD:B6
1
a
a Interface Number Label
b IF Status Label
c Interface Type Label
d Network Type Label
e Physical Address Label
f IP Address Label
g Gauge Label
fxp0
0.0.0.0
d
e
ON Table 2: Interface Status Label Colors
ColorOperational
StatusAdministrative
StatusLabelText
Green up up ON
Blue down down OFF
Yellow down up OFF
Red testing testing TEST

D e v i c e V i e w I n t e r f a c e I c o n S u b v i e w s M e n u
S P E C T R U M E n t e r p r i s e M a n a g e r Page 13 A d t r a n D S U / C S U
Network Type LabelThis label identifies the type of network to which the interface is connected. Double-click the label to open the Model Information view for the interface.
Physical Address LabelThis label displays the physical (MAC) address of the interface. Double-click this label to open the IF Address Translation Table.
IP Address LabelThis label displays the IP address for the interface. Double-click this label to open the Secondary Address Panel (Page 14), which lets you change the address and mask for the interface.
Gauge LabelThis label displays whichever performance statistic has been selected in the Gauge Control Panel for this device’s interfaces. (Refer to the SPECTRUM Views document for information about the Gauge Control Panel.) Double-click this label to open the Port Performance View (Page 54).
Interface Icon Subviews MenuTable 3 lists the device-specific interface Icon Subviews menu options and the views to which they provide access.
Interface Status ViewAccess: From the Icon Subviews menu for the Interfaceicon in the Device view, select IF Status .
This view provides information on the operational status of the interface and allows you to enable or disable the port.
Table 3: Interface Icon Subviews Menu
Option Accesses the...
Detail Interface Detail view, which displays packet, error, and discard breakdown statistics for the interface.
IF Status Interface Status View (Page 13).
IF Configuration Interface Configuration View (Page 56).
IF Address Translation Table
Interface Address Translation Table, which identifies the physical and network address for the interface.
Secondary Address Panel
Secondary Address Panel (Page 14).
Thresholds Interface Threshold view, which lets you set the on/off alarm thresholds for load, packet rate, error rate, and % discarded for the interface.
Model Information
Model Information View (Page 60).

D e v i c e V i e w C h a s s i s D e v i c e V i e w
S P E C T R U M E n t e r p r i s e M a n a g e r Page 14 A d t r a n D S U / C S U
Operational StatusThe current state of the interface (Up, Down, Unknown, Dormant , NotPresent , Lower LayerDown).
This button allows you to select the desired administrative state of the interface (On, Off , or Testing ).
Secondary Address PanelAccess: From the Icon Subviews menu for the Interfaceicon in the Device view, select Secondary Address Panel .
This panel provides a table of IP addresses and masks obtained from the Address Translation table within the device’s firmware. You can change the current address displayed in the IP Address field by selecting an entry from the table in this panel and clicking the Update button.
Chassis Device ViewAccess: From the Icon Subviews menu for Adtran Deviceicon, select Device > Chassis.
This view provides information about the status of module and module ports, and allows you to
determine the type and status of said modules and module ports installed on the switch.
Figure 4: Chassis Device View
Chassis Module IconsThese icons (Figure 5) represent the physical modules as installed in the chassis.
Administrative Status SpectroGRAPH: Device: IP Address
Primary Application
System Up Time
Manufacturer
Device Type
Serial Number
Network AddressModel Name
ContactDescription
Location
File View HelpTools
4 1ONMODULE
2 ON 3 ON 4ON 5Off 6Off 7Off 8Off
Bookmarks
online
2MODULE
online
0CONTROL
5ON 6 Off 3Off 4 ON 5Off 6 Off 7Off 8Off
1 ON 2ON 3ON 4ON 5Off 6 Off 7Off 8Off
1ON 2 3 4 ON Off Off
1ÿþýüûú
online
3ÿþýüûú
online
5ÿþýüûú
online
ONONON
ONON

S P E C T R U M E n t e r p r i s e M a n a g e r Page 15 A d t r a n D S U / C S U
Figure 5:Figure 5:Figure 5:Figure 5: Chassis Module Icon Chassis Module Icon Chassis Module Icon Chassis Module Icon
Module Identification LabelsThese labels display the following information:
Slot Number Label - The location of the mod-ule within the chassis.
Model Type Label - The type of network interface module in the chassis slot.
Interface LabelsThese labels display the following information:
Interface Type Label - The number and type for this interface.
Interface Status Label - The current operat-ing status of this interface. The status is shows as either online (green), or offline (blue).
Chassis Module Icon Subviews MenuThe Icon Subviews menu selections specific to the Chassis Module for each device within the Adtran Atlas chassis is:
Module Notes - Opens the Module Notes win-dow, which allows you to write and save notes for the selected module within this Chassis view.
Module Detail-Opens the General Option Card Module Detail View.
Module LED Status- Opens the Module LED Front Panel Detail View
General Option Card Module DetailViewAccess: From the Icon Subviews menu for the ModuleType Label in the Chassis Device view, select Module DetailView.
Module IndexThe index number of the Option Card Module.
1 2 3 4 5 6 7 8
Typical Line Module
Slot#Interface Number
Interface status
Access to theInterface Label
Icon Subviews Men u
Module Status
Module Type
Access to Chassis ModuleIcon Subviews Menu
ON ON ON ON ON ON ON ON4
CONTROL
online

S P E C T R U M E n t e r p r i s e M a n a g e r Page 16 A d t r a n D S U / C S U
Overall StatusIndicates the overall status of the module. Possible values are OK, ONLINE, TESTING, DOWNLOAD, FLASH_DOWNLOAD, ERROR, and ALARM.
Module LED Front Panel Detail ViewAccess: From the Icon Subviews menu for the ModuleType Label in the Chassis Device view, select Module LEDStatus.
Slot IndexThe index number of the slot.
Card StatusThe status of the Module LED card.
Online StatusIndicates whether the module is online or offline.
Test StatusIndicates whether the module is in test mode or not.

S P E C T R U M E n t e r p r i s e M a n a g e r Page 17 A d t r a n D S U / C S U
Device Topology Views
This section describes the Device Topology view available for models of the Adtran devices.
Device Topology ViewAccess: From the Icon Subviews menu for the Deviceicon, select DevTop .
The Device Topology view (Figure 6) shows the connections between a modeled device and other network entities. The lower panel of the view uses Interface icons to represent the device’s serial, network, and I/O ports. These icons provide the same information and menu options as those in the Device View (Page 11). If a device is connected to a particular interface, a Device icon appears on the vertical bar above the Interface icon along with an icon representing the network group that contains the device.
Figure 6: Device Topology View
File View HelpTools
1Ethernet
0:0:1D:F:FD:B6
0.0.0.0
ON 2ATM
0:0:1D:F:FD:B6A2
0.0.0.0
ON 3ATM
0:0:1D:F:FD:B6
CPU
0.0.0.0
ON
Bookmarks
gy
Graphic ofAdtran Device
Model Name of type AdtranDev of Landscape node: Primary

D e v i c e T o p o l o g y V i e w s S u b - I n t e r f a c e s T o p o l o g y V i e w
S P E C T R U M E n t e r p r i s e M a n a g e r Page 18 A d t r a n D S U / C S U
Sub-Interfaces Topology ViewAccess: From the Icon Subview menu for an Interface icon whose interface contains sub-interfaces, select Sub-Interfaces.
When present, the endpoints associated with multiplexed, physical connections are modeled by SPECTRUM as sub-interfaces. This includes, for example, Permanent Virtual Circuits (PVCs) on a physical ATM interface and DCL circuits on a physical Frame Relay interface. In this case, the Sub-Interfaces View displays a DLCI port icon which provides access to port information.
DevTop Chassis ViewAccess: From the Icon Subviews menu for the Deviceicon, select DevTop>Chassis .
The lower panel of the DevTop Chassis view uses Interface icons to represent the device’s serial/network I/O ports. The port labels in this view provide the same information and menu options as those described under the Interface Icons (Page 12).
Refer to the SPECTRUM Views documentation for more information on the Device Topology views.

S P E C T R U M E n t e r p r i s e M a n a g e r Page 19 A d t r a n D S U / C S U
Application Views
This section describes the main Application view and the associated application-specific subviews available formodels of Adtran devices in SPECTRUM.
Access: From the Icon Subviews menu for the Deviceicon, select Application .
Main Application ViewWhen a device model is created, SPECTRUM automatically creates models for each of the major and minor applications supported by the device. The main Application view identifies all of these application models, shows their current condition status, and provides access to application-specific subviews. Figure 7 shows this view in the Icon mode. If you prefer the List mode, which displays applications as text labels, select View > Mode > List.
For more information on this view, refer to MIBs and the Application View documentation.
Figure 7: Main Application View
SpectroGRAPH: Application: Model Name
Model Name
Contact
Description
Location
Network Address System Up Time
Manufacturer
Device Type
Serial Number
File View Tools Bookmarks
Model Name of type of AdtranDev of Landscape : Primary
Help

A p p l i c a t i o n V i e w s S u p p o r t e d A p p l i c a t i o n s
S P E C T R U M E n t e r p r i s e M a n a g e r Page 20 A d t r a n D S U / C S U
Supported ApplicationsSPECTRUM’s applications can be grouped within two general categories as follows:
• Common Applications, below• Device-Specific Applications (Page 21)
Common ApplicationsFor the most part, these applications represent the non proprietary MIBs supported by your device. Listed below (beneath the title of the document that describes them) are some of the common applications currently supported by SPECTRUM.
• Bridging Applications- Spanning Tree- Static- Transparent- PPP Bridging- Source Routing- Translation
• Routing Applications- Generic Routing- Repeater- AppleTalk- DECnet- Open Shortest Path First
• MIB II Applications- SNMP- IP- ICMP- TCP- System2- UDP
• Miscellaneous Applications- FDDI- Point to Point- DS 1- RS-232- WAN- Frame Relay- Token Ring- DLSW- APPN- Ethernet- Fast Ethernet- ATM Client- DHCP
Note:Note:
The documents listed are available for viewing at:
www.aprisma.com/manuals/

A p p l i c a t i o n V i e w s S u p p o r t e d A p p l i c a t i o n s
S P E C T R U M E n t e r p r i s e M a n a g e r Page 21 A d t r a n D S U / C S U
Device-Specific ApplicationsSPECTRUM imports the following device-level proprietary MIBs into its database for all Adtran devices:
• ADTRAN-MIB• ADTRAN-DS1-MIB• ADTRAN-ATLAS800-MIB• ADTRAN-ATLAS-GENERAL-OPTIONCARD-
MIB• ADTRAN-ATLAS-INTERFACE-MIB• ADTRAN-ATLAS-FRONTPANEL-MIB• ADTRAN-ATLAS-V35NX4-MIB• ADTRAN-DSUIV-MIB• ADTRAN-TSUESP-MIB• ADTRAN-TSU120e-MIB• ADTRAN-TSU600e-MIB• ADTRAN-DSUIQ-MIB• ADTRAN-TSUIQ-MIB• ADTRAN-IQPROBE-MIB• ADTRAN-FRPerform-MIB• ADTRAN-Smart16CTL-MIB
These MIBs can be used in conjunction with SPECTRUM’s optional customization products (referred to as the Level I Tool Kits) to create
application models and views that display the condition of selected MIB objects.
The views and subviews available for Adtran device-specific applications are described in the rest of this section, grouped by major applications as listed below:
• Adtran Frame Relay Performance Application (AdFRPerformApp) (Page 22)
• Adtran DS1 Application (AdtranDS1App) (Page 30)
• DSU IQ Configuration Application (DSUIQConfigApp) (Page 33)
• IQ Probe Configuration Application (IQProbeConfigApp) (Page 38)
• Adtran TSU ESP Application (AdTSUESPApp) (Page 39)
• Adtran Administrative Application (AdAdminApp) (Page 45)
The following applications are available only for Adtran ATLAS devices:
Note:Note:
Aprisma Management Technologies can provide training, technical assistance, and custom engineering support services for creating application models and their associated views.

A p p l i c a t i o n V i e w s A d t r a n F r a m e R e l a y P e r f o r m a n c e A p p l i c a t i o n ( A d F R P e r f o r m A p p )
S P E C T R U M E n t e r p r i s e M a n a g e r Page 22 A d t r a n D S U / C S U
• Adtran ATLAS 800 Interface Application (AdATL800IfApp) (Page 45)
• Adtran ATLAS General Option Card Application (AdATLGenOCApp) (Page 46)
• Adtran ATLAS Front Panel Group Application (AdATLFrPnlApp) (Page 48)
• Adtran ATLAS V35Nx4 Application (AdATLV35x4App) (Page 50)
Adtran Frame RelayPerformance Application(AdFRPerformApp)This application provides the following subviews:
• History Control Information View (Page 22)• Current PVC (Permanent Virtual Circuit) Status
Table View (Page 22)• Interval PVC Status Table View (Page 23)• Interval Port Status Table View (Page 23)• Interval Port Error Table View (Page 24)• Interval History Time Table View (Page 24)• Daily PVC Status Table View (Page 25)• Daily Port Status Table View (Page 27)• Daily Port Error Table View (Page 28)• Daily History Time Table View (Page 29)
History Control Information ViewAccess: From the Icon Subviews menu for theAdFRPerformApp icon, select History Control.
History Interval LengthThis value selects the sampling interval period for data collected in the interval table. Possible values are min5 , min10 , min15 , min20 , and min30 .
Current Interval RemainingSeconds remaining in the current interval.
Completed IntervalsThe number of completed intervals in interval tables.
Completed DaysThe number of completed days in the day table.
Current PVC (Permanent VirtualCircuit) Status Table ViewAccess: From the Icon Subviews menu for theFRPerformApp icon, select PVC Status .
If.Status IndexThe interface status index.
PVC StateThe current state for this PVC.

A p p l i c a t i o n V i e w s A d t r a n F r a m e R e l a y P e r f o r m a n c e A p p l i c a t i o n ( A d F R P e r f o r m A p p )
S P E C T R U M E n t e r p r i s e M a n a g e r Page 23 A d t r a n D S U / C S U
Interval PVC Status Table ViewAccess: From the Icon Subviews menu for theFRPerformApp icon, select Interval PVC Status .
If.PVC Slot IndexThe interface PVC slot index.
State ChangeThe number of state changes for this PVC for the interval.
Inactive TimeThe time in seconds the PVC has been in the inactive state for the interval.
Frames RxThe number of Frames the PVC has received for the interval.
Frames TxThe number of Frames the PVC has transmitted for the interval.
Bytes RXThe number of bytes the PVC has received for the interval.
Bytes TxThe number of bytes the PVC has transmitted for the interval.
Interval Port Status Table ViewAccess: From the Icon Subviews menu for theFRPerformApp icon, select Interval Port Status .
If. Slot IndexThe slot index.
Frames RxThe number of Frames the port received for the interval.
Frames TxThe number of Frames the port transmitted for the interval.
Bytes RxThe number of bytes the port received for the interval.
Bytes TxThe number of bytes the port transmitted for the interval.
Avg Thruput TxThe average throughput the port transmitted for the interval.
Avg Thruput RxThe average throughput the port received for the interval.

A p p l i c a t i o n V i e w s A d t r a n F r a m e R e l a y P e r f o r m a n c e A p p l i c a t i o n ( A d F R P e r f o r m A p p )
S P E C T R U M E n t e r p r i s e M a n a g e r Page 24 A d t r a n D S U / C S U
Max Thruput TxThe maximum throughput the port transmitted for the interval.
Max Thruput RxThe maximum throughput the port received for the interval.
Avg Utilization TxThe average utilization the port transmitted for the interval.
Avg Utilization RxThe average utilization the port received for the interval.
Full Status RxThe number of PVC signalling full status frames received.
Full Status TxThe number of PVC signalling full status frames transmitted.
Link Integrity Only RxThe number of PVC signalling link integrity only frames received.
Link Integrity Only TxThe number of PVC signalling link integrity only frames transmitted.
Asynchronous Status Frames RxThe number of single PVC status frames received.
Interval Port Error Table ViewAccess: From the Icon Subviews menu for theFRPerformApp icon, select Interval Port Error .
Port.SlotIndexThe port slot index number.
Unavailable TimeThe time in seconds the port is unavailable due to a physical or frame relay outage.
CRC ErrorsThe number of frames received with CRC errors.
Abort FramesThe number of frames received without proper flag termination.
Octet ViolationsThe number of frames received with a bit count not divisible by eight.
Discarded FramesThe number of frames discarded by the IQ unit.
Interval History Time Table ViewAccess: From the Icon Subviews menu for theFRPerformApp icon, select Interval History Time .

A p p l i c a t i o n V i e w s A d t r a n F r a m e R e l a y P e r f o r m a n c e A p p l i c a t i o n ( A d F R P e r f o r m A p p )
S P E C T R U M E n t e r p r i s e M a n a g e r Page 25 A d t r a n D S U / C S U
Time Slot IndexThe history time slot index number.
Slot Time TotalThe total time in seconds this interval slot represents.
Time StampThe time the interval started.
Daily PVC Status Table ViewAccess: From the Icon Subviews menu for theFRPerformApp icon, select Daily PVC Status.
If.PVC.Slot IndexThe PVC slot index number
State ChangeThe number of state changes on the PVC for the day.
Inactive TimeThe time in seconds the PVC has been in the inactive state.
Frames RxThe number of frames the PVC received for the day.
Frames TxThe number of frames the PVC transmitted for the day.
Bytes RxThe number of bytes the PVC transmitted for the day.
Avg Thruput TxThe average throughput the PVC transmitted for the day.
Avg Thruput RxThe average throughput the PVC received for the day.
Max Thruput TxThe maximum throughput the PVC transmitted for the day.
Max Thruput RxThe maximum throughput the PVC received for the day.
Avg Utilization TxThe average utilization the PVC transmitted for the day.
Avg Utilization RxThe average utilization the PVC received for the day.
Max Utilization TxThe maximum utilization the PVC transmitted for the day.

A p p l i c a t i o n V i e w s A d t r a n F r a m e R e l a y P e r f o r m a n c e A p p l i c a t i o n ( A d F R P e r f o r m A p p )
S P E C T R U M E n t e r p r i s e M a n a g e r Page 26 A d t r a n D S U / C S U
Max Utilization RxThe maximum utilization the PVC received for the day.
FECN RxThe number of Forward Explicit Congestion Notifications (FECNs) the PVC received for the day.
FECN TxThe number of FECNs the PVC transmitted for the day.
BECN RxThe number of Backward Explicit Congestion Notifications (BECNs) the PVC received for the day.
BECN TxThe number of BECNs the PVC transmitted for the day.
DE RxThe number of DEs the PVC received for the day.
DE TxThe number of DEs the PVC transmitted for the day.
CR RxThe number of CRs the PVC received for the day.
CR TxThe number of CRs the PVC transmitted for the day.
Min Frame Size RxThe minimum frame size the PVC received for the day.
Min Frame Size TxThe minimum frame size the PVC transmitted for the day.
Max Frame Size RxThe maximum frame size the PVC received for the day.
Max Frame Size TxThe maximum frame size the PVC transmitted for the day.
Avg Frame Size RxThe average frame size the PVC received for the day.
Avg Frame Size TxThe average frame size the PVC transmitted for the day.
Lost FramesThe number of lost frames on the PVC for the day. Applies only if the sequence numbering is enabled for the PVC.

A p p l i c a t i o n V i e w s A d t r a n F r a m e R e l a y P e r f o r m a n c e A p p l i c a t i o n ( A d F R P e r f o r m A p p )
S P E C T R U M E n t e r p r i s e M a n a g e r Page 27 A d t r a n D S U / C S U
Remote Lost FramesThe number of remote lost frames on the PVC for the day. Applies only if sequence numbering is enabled for the PVC.
Max DelayThe maximum delay on the PVC for the day. Applies only if delay measurement or PVC diagnostics are enabled for the PVC.
Min DelayThe minimum delay on the PVC for the day. Applies only if delay measurement or PVC diagnostics are enabled for the PVC.
Avg DelayThe average delay on the PVC for the day. Applies only if delay measurement or PVC diagnostics are enabled for the PVC.
Daily Port Status Table ViewAccess: From the Icon Subviews menu for theFRPerformApp icon, select Daily Port Status .
Frames RxThe number of Frames the port received for the day.
Frames TxThe number of Frames the port transmitted for the day.
Bytes RxThe number of bytes the port received for the day.
Bytes TxThe number of bytes the port transmitted for the day.
Avg Thruput TxThe average throughput the port transmitted for the day.
Avg Thruput RxThe average throughput the port received for the day.
Max Thruput TxThe maximum throughput the port transmitted for the day.
Max Thruput RxThe maximum throughput the port received for the day.
Avg Utilization TxThe average utilization the port transmitted for the day.
Avg Utilization RxThe average utilization the port received for the day.

A p p l i c a t i o n V i e w s A d t r a n F r a m e R e l a y P e r f o r m a n c e A p p l i c a t i o n ( A d F R P e r f o r m A p p )
S P E C T R U M E n t e r p r i s e M a n a g e r Page 28 A d t r a n D S U / C S U
Max Utilization TxThe maximum utilization the port received for the day
Max Utilization TxThe maximum utilization the port transmitted for the day.
Full Status RxThe number of PVC signalling full status frames received.
Full Status TxThe number of PVC signalling full status frames transmitted.
Link Integrity Only RxThe number of PVC signalling link integrity only frames received.
Link Integrity Only TxThe number of PVC signalling link integrity only frames transmitted.
Asynchronous Status Frames RxThe number of single PVC status frames received.
Daily Port Error Table ViewAccess: From the Icon Subviews menu for theFRPerformApp icon, select Daily Port Error .
Port.SlotIndexThe port slot index number.
Unavailable TimeThe time in seconds the port is unavailable due to a physical or frame relay outage.
CRC ErrorsThe number of frames received with CRC errors.
Abort FramesThe number of frames received without proper flag termination.
Octet ViolationsThe number of frames received with a bit count not divisible by eight.
Discarded FramesThe number of frames discarded by the IQ unit.
Length ErrorsThe number of frames received that is less than 5 bytes or greater than 4500 bytes.
EA ViolationsNumber of frames received with errors in the EA field of the frame relay header.
Encapsulation ErrorThe number of frames destined for the IQ IP stack that does not meet the FRF.3 IA.

A p p l i c a t i o n V i e w s A d t r a n F r a m e R e l a y P e r f o r m a n c e A p p l i c a t i o n ( A d F R P e r f o r m A p p )
S P E C T R U M E n t e r p r i s e M a n a g e r Page 29 A d t r a n D S U / C S U
Inactive DLCIThe number of frames received while the PVC is in the inactive state.
Invalid DLCIThe number of frames received with a DLCI value less than 16 or greater than 1007, not including PVC signaling frames.
UnroutableThe number of frames received on a management DLCI destined for the IQ unit that have the wrong IP address.
Signal Down TimeThe time in seconds the signaling state has been down.
Signal ErrorsThe number of PVC signaling frames received with protocol violations.
Signal Time OutThe number of PVC signaling frames received with protocol violations.
Signal State ChangeThe number of state changes for the PVC signaling protocol. This includes transactions from down state to up state and vice versa.
Daily History Time Table ViewAccess: From the Icon Subviews menu for theFRPerformApp icon, select Daily History Time.
Time Slot IndexThe time slot index number.
Slot Time TotalThe time in seconds this day slot represents.
Time StampThe date the time slot started. (Month-Day)

A p p l i c a t i o n V i e w s A d t r a n D S 1 A p p l i c a t i o n ( A d t r a n D S 1 A p p )
S P E C T R U M E n t e r p r i s e M a n a g e r Page 30 A d t r a n D S U / C S U
Adtran DS1 Application(AdtranDS1App)This application provides the following subviews:
• Adtran DS1 Alarm Event Table View (Page 30)• Adtran DS1 Threshold Crossing Alert Table
View (Page 31)
Adtran DS1 Alarm Event Table ViewAccess: From the Icon Subviews menu for theAdtranDS1App icon, select Alarm Event .
Alarm IndexThe index value which uniquely identifies the DS1 interface.
Alarm EnableAllows you to enable or disable the generation of DS1 Alarm Traps for line status event changes. Can be set to dslAlarmOFF or dslAlarmON .
Line EventThis bit map variable indicates state changes in the DS1 line status variable (dsx1LineStatus). When a line status bit changes state, the corresponding line event bit is set in this variable. If armed, setting the event will generate an Alarm Trap. After reporting the events in an Alarm Trap
or Get response, the device clears the reported events. The various alarm event bit positions are:
Line ArmThis bit map variable arms or disarms an individual or group of events identified in Line
Table 4: Alarm Event Bit Positions
1 No Alarm Present
2 Far end LOF (Yellow Alarm)
4 Near end sending LOF Indication
8 Far end sending AIS (Blue Alarm)
16 Near end sending AIS
32 Near end LOF (Red Alarm)
64 Near End Loss of Signal
128 Near end is looped
256 E1 TS16 AIS
512 Far End Sending TS16 LOMF
1024 Near End Sending TS16 LOMF
2048 Near end detects a test code
4096 any line status not defined here

A p p l i c a t i o n V i e w s A d t r a n D S 1 A p p l i c a t i o n ( A d t r a n D S 1 A p p )
S P E C T R U M E n t e r p r i s e M a n a g e r Page 31 A d t r a n D S U / C S U
Event as a source for generation of DS1 Alarm Trap. The variables are the same as those listed in Table 4.
Adtran DS1 Threshold Crossing AlertTable ViewAccess: From the Icon Subviews of the AdtranDS1Appicon, select Alert Table .
Alert IndexThe index value which uniquely identifies the DS1 interface.
Alarm EnableThis allows you to enable or disable the generation of DS1 Alert Traps for Performance Monitor Threshold Crossing Alerts.
Current AlertThis DS1 performance status variable indicates Threshold Crossing Alerts for a Near End Current 15 minute interval. An alert bit is set in this variable when the value of the Current Table object exceeds the Threshold Value. This variable contains the sum of alert values.
Total AlertThis DS1 performance status variable indicates Threshold Crossing Alerts for a Near End Total performance variables. An alert bit is set in this variable when the value of the Total Table object exceeds the Threshold Value. This variable contains the sum of alert values. See Table 5 for the bit position values.
Table 5: Threshold Crossing Alert bit position values
ES Errored Seconds
SES Severely Errored Seconds
SEFS Severely Errored Framing Seconds
UAS Unavailable Seconds
CSS Controlled Slip Seconds
PCV Path Coding Violations
LES Line Errored Seconds
BES Bursty Errored Seconds
DM Degraded Minutes
LCV Line Code Violations

A p p l i c a t i o n V i e w s A d t r a n D S 1 A p p l i c a t i o n ( A d t r a n D S 1 A p p )
S P E C T R U M E n t e r p r i s e M a n a g e r Page 32 A d t r a n D S U / C S U
Far Current AlertThis DS1 performance status variable indicates Threshold Crossing Alerts for a Near End Total performance variables. An alert bit is set in this variable when the value of the Total Table object exceeds the Threshold Value. This variable contains the sum of alert values. See Table 5 for the bit position values.
Far Total AlertThis DS1 performance status variable indicates Threshold Crossing Alerts for a Far End Current 15 minute interval. An alert bit is set in this variable when the value of the Far End Total Table object exceeds the Threshold Value. This variable contains the sum of alert values. See Table 5 for the bit position values.
Total ArmThis DS1 performance status variable indicates Threshold Crossing Alerts for a Near End Total performance variables. An alert bit is set in this variable when the value of the Total Table object exceeds the Threshold Value. This variable contains the sum of alert values. See Table 5 for the bit position values.
Far Current ArmThis DS1 performance status variable indicates Threshold Crossing Alerts for a Near End Total
performance variables. An alert bit is set in this variable when the value of the Total Table object exceeds the Threshold Value. This variable contains the sum of alert values. See Table 5 for the bit position values.
Far Total ArmThis DS1 performance status variable indicates Threshold Crossing Alerts for a Near End Total performance variables. An alert bit is set in this variable when the value of the Total Table object exceeds the Threshold Value. This variable contains the sum of alert values. See Table 5 for the bit position values.
A p p l i c a t i o n V i e w s D S U I Q C o n f i g u r a t i o n A p p l i c a t i o n ( D S U I Q C o n f i g A p p )
S P E C T R U M E n t e r p r i s e M a n a g e r Page 33 A d t r a n D S U / C S U
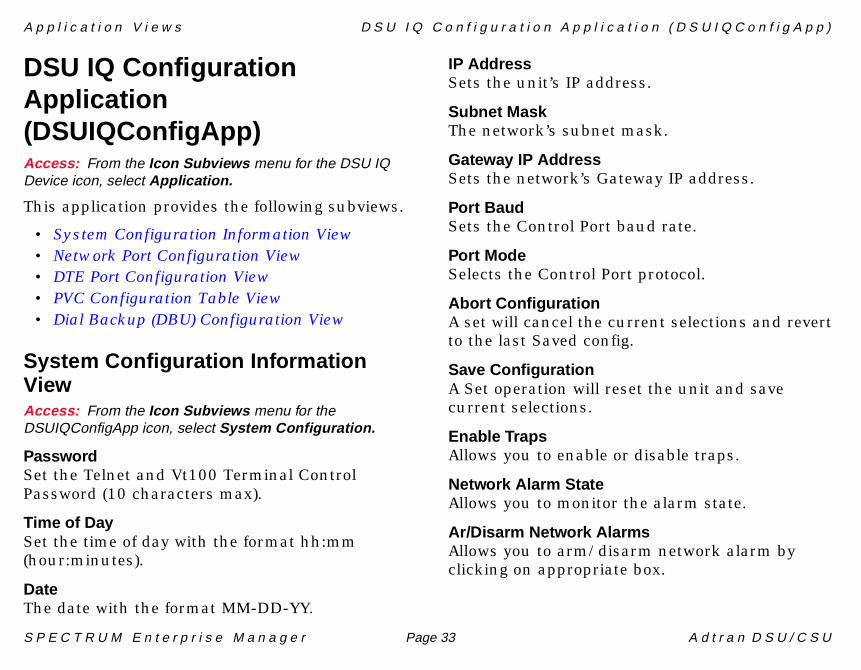
DSU IQ ConfigurationApplication(DSUIQConfigApp)Access: From the Icon Subviews menu for the DSU IQDevice icon, select Application.
This application provides the following subviews.
• System Configuration Information View• Network Port Configuration View• DTE Port Configuration View• PVC Configuration Table View• Dial Backup (DBU) Configuration View
System Configuration InformationViewAccess: From the Icon Subviews menu for theDSUIQConfigApp icon, select System Configuration.
PasswordSet the Telnet and Vt100 Terminal Control Password (10 characters max).
Time of DaySet the time of day with the format hh:mm (hour:minutes).
DateThe date with the format MM-DD-YY.
IP AddressSets the unit’s IP address.
Subnet MaskThe network’s subnet mask.
Gateway IP AddressSets the network’s Gateway IP address.
Port BaudSets the Control Port baud rate.
Port ModeSelects the Control Port protocol.
Abort ConfigurationA set will cancel the current selections and revert to the last Saved config.
Save ConfigurationA Set operation will reset the unit and save current selections.
Enable TrapsAllows you to enable or disable traps.
Network Alarm StateAllows you to monitor the alarm state.
Ar/Disarm Network AlarmsAllows you to arm/disarm network alarm by clicking on appropriate box.

A p p l i c a t i o n V i e w s D S U I Q C o n f i g u r a t i o n A p p l i c a t i o n ( D S U I Q C o n f i g A p p )
S P E C T R U M E n t e r p r i s e M a n a g e r Page 34 A d t r a n D S U / C S U
Network Port Configuration ViewAccess: From the Icon Subviews menu for theDSUIQConfigApp icon, select Network Port Configuration.
Port Loop RateThe rate for the DDS interface.
Port Clock SourceThe timing source for the DDS interface.
DLCI 1 ModeSets the mode for the management DLCI 1.
DLCI 2 ModeSets the mode for the management DLCI 2.
DLCI 1 PVC ModeSets the DLCI for management PVC 2. (Range 16 - 1007)
DLCI 2 PVC ModeSets the DLCI for management PVC 2. (Range 16 - 1007)
Port SignalingThe signaling type for the frame relay management interface. Types include: none , conLMI , ansiT1617D , ituTQ933A , and auto .
Link Integrity Poll Timer, T391Sets the polling interval in seconds for the frame relay management.
LMI Status Polling Counter, N391Sets the interval between full status polls for the frame relay management interface.
Error Threshold, N392Sets the error count for the frame relay management interface.
Error Window, N393Sets the error window (number of polling events) for the frame relay interface.
History IntervalsSets the number of history intervals for storage.
History Intervals AvailableReturns the number of history intervals allowed based on the maximum number.
Sampling RateSets the minute intervals. Five minute intervals from 5 to 30.
Maximum PVC Supported.Sets the maximum PVCs supported by the IQ unit. (Range 1 - 100)

A p p l i c a t i o n V i e w s D S U I Q C o n f i g u r a t i o n A p p l i c a t i o n ( D S U I Q C o n f i g A p p )
S P E C T R U M E n t e r p r i s e M a n a g e r Page 35 A d t r a n D S U / C S U
DTE Port Configuration ViewAccess: From the Icon Subviews menu for theDSUIQConfigApp icon, select DTE Port Configuration.
Port InterfaceAllows you to select the DTE Port Interface type.
Port RateSelects the DTE Port Rate.
CTS OptionSelects the Clear to Send (CTS) Option.
CD OptionSelects the Carrier Detect (CD) option. Options are forcedOn and normal .
DSR OptionSelects the Data Set Ready (DRS) option.
Flow ControlDetermines how the IQ device will respond to congestion during DBU operation. If set to none, the IQ will drop frames during DBU operation when severe congestion occurs. If set for hardware, the IQ will vary the DTE TC clock in during periods of severe congestion.
Port Management, DLCISets the DTE Port management DLCI. (Range 16 - 1007)
Management PVCControls the presence of the DTE management PVC.
Timeout, T392Sets the timeout in seconds between polling intervals from 5 to 30 seconds.
Error Events, N392Sets the number of error events for the frame relay management from 1 to 10.
Error Window, N393Sets the error window (polling events) for the frame relay management.
Signaling ResponseDetermines how the IQ device will respond to polls from the DTE device during network failure. If set to always on, the IQ will respond to polls during a network failure.
PVC Configuration Table ViewAccess: From the Icon Subviews menu for theDSUIQConfigApp icon, select PVC Configuration.
Config IndexThe index identifier for this PVC entry.
DLCI AddressThe address for this PVC entry, ranging from 16 to 1007.

A p p l i c a t i o n V i e w s D S U I Q C o n f i g u r a t i o n A p p l i c a t i o n ( D S U I Q C o n f i g A p p )
S P E C T R U M E n t e r p r i s e M a n a g e r Page 36 A d t r a n D S U / C S U
CIRThe Committed Information Rate (CIR) for this PVC in Kbps.
Sequence Num OptionThe sequence number allows the IQ to detect lost frames across the frame relay service. This option should be disabled for PVCs that do not have IQ on both ends.
Delay Pkt OptionDelay Packet Option for this PVC allows the IQ to sample round trip delay across the frame relay service. This option should be disabled for PVCs on both ends.
DBU DLCIThis object is used when this PVC entry is used for dial backup.
Dial Backup (DBU) Configuration ViewAccess: From the Icon Subviews menu for theDSUIQConfigApp icon, select DBU Configuration.
DBU OptionThis specifies whether the unit automatically enters dial backup mode or waits for manual setup.
DBU ModeThis option specifies the dial backup operating mode for the unit as originate or answer . One must be set to originate and the other end to answer.
Out of Service OptionThis enables the unit to enter backup mode if an out-of-service condition is detected from the network. Can be set to enable or disable .
Loss of Receive Signal OptionThis enables the unit to enter backup mode when a loss of receive signal is detected from the network. Can be set to enable or disable .
Loss of Sealing Current OptionThis enables the unit to enter backup mode when a loss of sealing current is detected from the network.
Loss of LMI OptionThis enables the unit to enter backup mode when the network PVC signaling state goes down.
Pass CheckThis allows the unit to send and verify a dial backup passcode for an additional level of security. When enabled, the originate unit sends the passcode and the answer unit checks the passcode before the backup configuration is considered valid.

A p p l i c a t i o n V i e w s D S U I Q C o n f i g u r a t i o n A p p l i c a t i o n ( D S U I Q C o n f i g A p p )
S P E C T R U M E n t e r p r i s e M a n a g e r Page 37 A d t r a n D S U / C S U
Pass CodeThis sets the dial backup passcode used to provide an additional level of security. A passcode of 1 to 10 digit characters can be set. If enabled, the originate unit sends the passcode and the answer unit checks the passcode to verify the connection.
Answer AlwaysThis enables or disables Answer Always for Dial Backup operation. If enabled, the answer unit answers any incoming calls regardless of failed conditions.
Beeper OptionThis option enables or disables the audible alarm when the IQ unit goes into dial backup mode.
Phone NumberThis option is used to set a phone number to place a DBU call. This allows for up to 5 different numbers to be set.
Start LockoutThis option selects the hour to begin disabling dial backup operation when daily or weekend lockout mode is inactive.
End LockoutThis option selects the hour to end dial backup lockout when daily or weekend lockout mode is active.
Weekend LockoutThis option enables or disables Weekend Lockout for Dial Backup operation. If enabled, no backup will occur from midnight Friday to midnight Saturday.
Daily LockoutThis enables or disables Daily Lockout for Dial Backup operation. If enabled, no backup will occur between Lockout Start hour and Lockout End hour.
Auto Restore TimerThis option selects the amount of time that the DSUIQ circuit must be active before the unit switches from backup to normal mode of operation. The timer value is in minutes from 0 to 60. A zero value disables the automatic restore.
Redial CountThis allows the selection of the number of times the unit will redial the Far End unit when attempting to go to backup and a busy or reorder condition occurs. Redial count can be set for a maximum of 60.
Fail TimeoutThis option allows the selection of the amount of time that the dedicated circuit failure condition is active before attempting to enter dial backup
A p p l i c a t i o n V i e w s I Q P r o b e C o n f i g u r a t i o n A p p l i c a t i o n ( I Q P r o b e C o n f i g A p p )
S P E C T R U M E n t e r p r i s e M a n a g e r Page 38 A d t r a n D S U / C S U
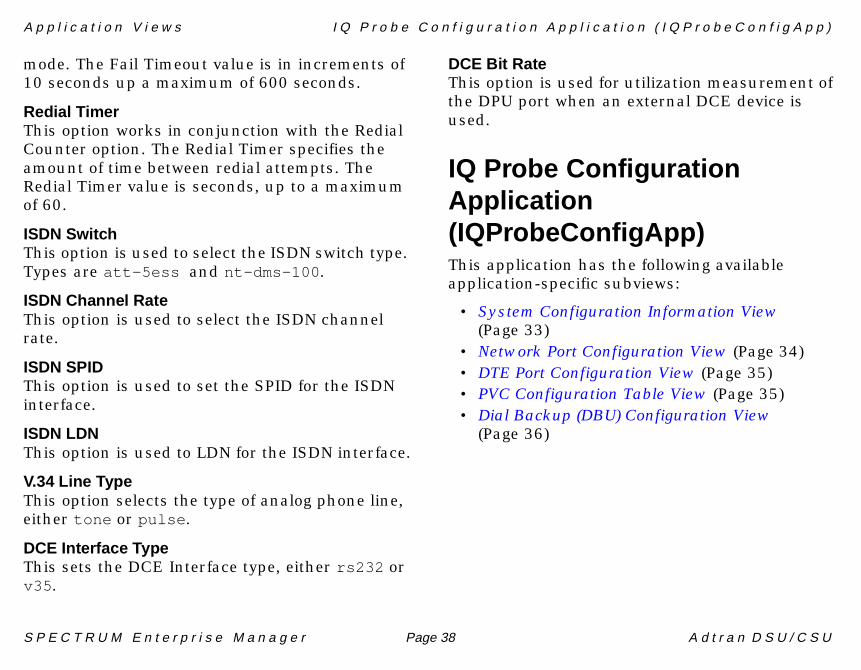
mode. The Fail Timeout value is in increments of 10 seconds up a maximum of 600 seconds.
Redial TimerThis option works in conjunction with the Redial Counter option. The Redial Timer specifies the amount of time between redial attempts. The Redial Timer value is seconds, up to a maximum of 60.
ISDN SwitchThis option is used to select the ISDN switch type. Types are att-5ess and nt-dms-100 .
ISDN Channel RateThis option is used to select the ISDN channel rate.
ISDN SPIDThis option is used to set the SPID for the ISDN interface.
ISDN LDNThis option is used to LDN for the ISDN interface.
V.34 Line TypeThis option selects the type of analog phone line, either tone or pulse .
DCE Interface TypeThis sets the DCE Interface type, either rs232 or v35 .
DCE Bit RateThis option is used for utilization measurement of the DPU port when an external DCE device is used.
IQ Probe ConfigurationApplication(IQProbeConfigApp)This application has the following available application-specific subviews:
• System Configuration Information View (Page 33)
• Network Port Configuration View (Page 34)• DTE Port Configuration View (Page 35)• PVC Configuration Table View (Page 35)• Dial Backup (DBU) Configuration View
(Page 36)

A p p l i c a t i o n V i e w s A d t r a n T S U E S P A p p l i c a t i o n ( A d T S U E S P A p p )
S P E C T R U M E n t e r p r i s e M a n a g e r Page 39 A d t r a n D S U / C S U
Adtran TSU ESP Application(AdTSUESPApp)Access: From the Icon Subviews menu for the Adtran TSUESP device icon, select Application .
This application provides the following subviews.
• TSU ESP Status View (Page 39)• Test Operation View (Page 40)• Unit Configuration View (Page 41)• (Page 41)• DBU Configuration View (Page 42)• ISDN DBU Configuration View (Page 43)• Port Configuration View (Page 44)• Test Configuration View (Page 45)• Dial Configuration View (Page 45)
TSU ESP Status ViewAccess: From the Icon Subviews menu for theAdTSUESPApp icon, select TSU ESP Status.
Unit StateThis status contains the current TSU ESP operational state.
Self TestThis allows you to start a TSU ESP self-test operation.
Clear HistoryAllows you to reset the status history alarms, errors, and tests.
Last Command StatusIndicates the result of the last command executed.
DTE Port StatusThe TSU ESP DTE port status.
DTE Port DataThe TSU ESP DTE port data.
ESP DBU CardThe type of ESP Dial Backup Card installed in the TSU ESP unit.
ESP LAN CardThe type of ESP LAN Card installed in the TSU ESP unit.
Dialing StatusThis status variable indicates dialing status information. The status is a bit mapped sum, multiple bits can be active simultaneously.
Current StatusThe current status of the TSU ESP. See Table 6.

A p p l i c a t i o n V i e w s A d t r a n T S U E S P A p p l i c a t i o n ( A d T S U E S P A p p )
S P E C T R U M E n t e r p r i s e M a n a g e r Page 40 A d t r a n D S U / C S U
Status HistoryThe TSU ESP status history of alarms, errors, and tests. It is a bit map represented as a sum, multiple bits can be active simultaneously. See Table 6 for values.
Test Operation ViewAccess: From the Icon Subviews menu for theAdTSUESPApp icon, select Test Operation.
DTE LoopbackThis allows you to turn the TSU ESP DTE loopback either on or off.
Test PatternUsed to select TSU ESP test pattern. Options are allOnes , pattern511 , noPattern , and allZeroes .
Cancel All TestsThis allows you to cancel all tests.
Remote LoopbackUsed to select the remote TSU ESP loopback test function.
Test Pattern ResultsThe TSU ESP test pattern results.
Table 6: Alarm Indicators
Value Definition
noAlarm No alarm present
RcvYellow Received Yellow Alarm
XmtYellow Transmit Yellow Alarm
RcvBlue Receive Blue Alarm
XmtBlue Transmit Blue Alarm
RcvRed Receive Red Alarm
RcvLos Receive Loss of Signal
LocalLB Local Loopback
RemoteLB Remote Loopback
XmtPattern Transmit Pattern Generation
CodeViol Code Violation
RcvBPVS Receive Bipolar Violations
FrmBitErrs Frame Bit Errors
PhaseLock Phase Lock Loop Alarm
DialBackup Dial Backup

A p p l i c a t i o n V i e w s A d t r a n T S U E S P A p p l i c a t i o n ( A d T S U E S P A p p )
S P E C T R U M E n t e r p r i s e M a n a g e r Page 41 A d t r a n D S U / C S U
Unit Configuration ViewAccess: From the Icon Subviews menu for theAdTSUESPApp icon, select Unit Configuration.
Reset DS1 Performance StatsAllows you to reset all performance statistics.
ModeThe mode of the TSU ESP.
Modem InitialisationA Set operations performs TSU ESP modem initialization.
Chain in Port Phone NumberThe Chain in Port phone number used to reach the network manager.
Global Trap SettingAllows you to enables or disable the TSU ESP from sending ADLP traps.
PasscodeThe passcode string used for authentication of ADLP messages between T-Watch and TSU ESP.
TSU ESP TimeThe current TSU ESP time value. A sequence of ASCII characters encoded as HR- hr, MN-Minute, SC-Second. For example, HRMNSC = 123059.
TSU ESP DateThe current TSU ESP date value. A sequence of ASCII characters encoded as MN-Month, DY-Day, TR-year. For example, MNDYYR = 073193.
Chain in Port ConnectionThe Chain in Port connection.
Factory RestoreAllows you to reload the factory options.
Enable TrapsThis option enables the unit to send SNMP Trap messages for alarm conditions. The SNMP Traps are sent to stations specified in the Trap IP Address table. The options are disable , send mib2 standard traps , or enable all traps , including TSU ESP enterprise specific.
Trap Host Address Table
IndexThe corresponding index that identifies the stored Trap Host Address.
IP AddressThe Host Trap IP Address.

A p p l i c a t i o n V i e w s A d t r a n T S U E S P A p p l i c a t i o n ( A d T S U E S P A p p )
S P E C T R U M E n t e r p r i s e M a n a g e r Page 42 A d t r a n D S U / C S U
Network Configuration ViewAccess: From the Icon Subviews menu for theAdTSUESPApp icon, select Network Configuration.
Yellow AlarmEnable or disable the TSU ESP to send a Yellow Alarm. Select yelAlmEnable or yelAlmdisable .
Performance ReportsAllows you to enable or disable the TSU ESP to send performance reports. Select prmdisable or prmenable .
Line Build OutAllows you to select the TSU ESP transmission Line Build Out. Options are lineBOauto , lineBO00 , lineBO75 , lineBO150 , and lineBO225 .
Clock SourceThis sets the network transmit clock source to network , internal or dte .
Network Framing FormatThis sets the network framing format to D4, ESF, or auto .
Network Line CodeThis option sets the network line code to B8ZS or ami .
T1 Bit StuffingAllows you to enable or disable TSU ESP T1 bit stuffing.
Receiver SensitivityThis sets the network receiver sensitivity to normal or extended .
DBU Configuration ViewAccess: From the Icon Subviews menu for theAdTSUESPApp icon, select DBU Configuration.
DBU ModeThis specifies the dial backup operating mode for the unit as originate or answer.
Weekend LockoutThis allows you to select whether the weekend lockout feature is lockout enabled or lockout disabled .
Enable DBU (by hour)This selects the hour to resume enabling the entry into dial backup operation when daily or weekend lockout mode is inactive.
Disable DBU (by hour)This selects the hour to disable dial backup operation when daily or weekend lockout mode is active.

A p p l i c a t i o n V i e w s A d t r a n T S U E S P A p p l i c a t i o n ( A d T S U E S P A p p )
S P E C T R U M E n t e r p r i s e M a n a g e r Page 43 A d t r a n D S U / C S U
Number to Dial OptionThis offers a selection of stored numbers for the unit to automatically dial. if the primary TSU ESP line fails, and the TSU ESP is set to originate, the TSU ESP dials the numbers in chronological order to setup the dial backup line. Option huntFromNumber1 performs a circular hunt operation through the list of phone numbers in the phone number table. Option dialNumber1only will only select phone number 1 in the table for dialing.
Auto Restore TimerThis selects the amount of time that the TSU ESP circuit must be active before the unit switches from backup to normal mode of operation. The never setting disables the automatic restore, meaning that TSU ESP operation must be restored manually.
Redial CountThis allows the selection of the number of times the unit will redial the Far End unit when attempting to go to backup and a busy or reorder condition occurs. Redial count can be set for a maximum of 99.
Redial TimerThis option works in conjunction with the Redial Counter Option. The Redial Timer specifies the amount of time between redial attempts.
Fail TimeoutThis allows the selection of the amount of time that the dedicated circuit failure is active before attempting to enter dial backup mode.
Pattern VerificationThis option is used to select the DBU pattern verification option average.
Physical InterfaceThis option is used to select the physical interface option available for the External DCE DBU module.
This opens the ISDN DBU Configuration View, which is described below.
ISDN DBU Configuration ViewISDN NetThis option is used to select the company to provide switched Digital Service. When US Sprint is selected, an automatic Echo Canceller Suppressor tone is emitted by the TSU ESP unit when dialing. Options are att-5ess , nt-dms-100 , and national-isdn1 .
ISDN Options

A p p l i c a t i o n V i e w s A d t r a n T S U E S P A p p l i c a t i o n ( A d T S U E S P A p p )
S P E C T R U M E n t e r p r i s e M a n a g e r Page 44 A d t r a n D S U / C S U
ISDN RateThis is used to select Nx56 kbps or Nx56 kbps as the backup
Number of ISDN B ChannelsThis selects the number of ISDN B channels to be bonded together as a dial backup connection.
ISDN Service Profile ID (SPID) Table
IndexThe corresponding index that identifies the stored ISDN SPID number.
ISDN SPID NumberThe stored ISDN SPID number.
ISDN Local Directory Number (LDN) Table
IndexThe index that identifies the stored ISDN LDN number.
ISDN LDN NumberThe stored ISDN LDN number.
Port Configuration ViewAccess: From the Icon Subviews menu for theAdTSUESPApp icon, select Port Configuration.
DSO RateSelects DS0 rate 56 kbps or 64 kbps.
DSO ChannelsSelects alternating or consecutive DS0 channels.
DTE Transmit Clock SourceSelect internal, external, or internal-invert TSU ESP clock source.
Inband ModeAllows you to select TSU ESP inband mode.
Start Channel Number (1-24)Select start channel number of Fractional T1.
Number of Channels (1-24)Allows you to select the number of channels in Fractional T1.
DataAllows you to enable or disable TSU ESP data inversion. Options are normalData and invData .
CTSAllows you to enable or disable TSU ESP forced DTS. Options are normalCTS or forceCTSon .
DSRAllows you to select whether TSU ESP DSR is forced on. Options are normalDSR or forcedDSR.
DCDAllows you to select whether TSU ESP DCD is forced on. Options are normalDCD or forcedDCD .

A p p l i c a t i o n V i e w s A d t r a n A d m i n i s t r a t i v e A p p l i c a t i o n ( A d A d m i n A p p )
S P E C T R U M E n t e r p r i s e M a n a g e r Page 45 A d t r a n D S U / C S U
Test Configuration ViewAccess: From the Icon Subviews menu for theAdTSUESPApp icon, select Test Configuration.
Test Timeout (secs)This sets the length of time the TSU ESP remains in a test before automatically exiting. The time is in seconds. A zero value disables the timeout operation.
Answer TestThis DBU test option enables the unit to answer a dial backup call to perform a DBU Connection test. When enabled, and not in dial backup, the unit will answer an incoming call and loopback the DBU receiver to the DBU transmitter.
Dial Configuration ViewAccess: From the Icon Subviews menu for theAdTSUESPApp icon, select Dial Configuration.
IndexThe index the identifies the stored phone number.
Phone NumberThe stored phone number.
Adtran AdministrativeApplication (AdAdminApp)This application has the following device- specific subview:
• Adtran Product View (Page 58)
Adtran ATLAS 800 InterfaceApplication (AdATL800IfApp)The application provides the following application-specific subviews:
• Atlas 800 Management Group View (Page 45)• Atlas 800 Physical Table View (Page 46)
Atlas 800 Management Group ViewIfIndexThe value of this object is equal to the value of if from the Interfaces table of MIB II.Index
SlotThe physical slot in the Atlas identified by IfIndex.
PortThe physical port in the Atlas identified by IfIndex.

A p p l i c a t i o n V i e w s A d t r a n A T L A S G e n e r a l O p t i o n C a r d A p p l i c a t i o n ( A d A T L G e n O C A p p )
S P E C T R U M E n t e r p r i s e M a n a g e r Page 46 A d t r a n D S U / C S U
Atlas 800 Physical Table ViewSlotThe physical slot in the Atlas.
PortThe physical port in the Atlas.
IndexThe index value of the port.
Complete StatusA bit-encoded variable that gives the overall status of the Atlas Product. It is encoded as follows
There may be multiple bits set based on the current state of the different option cards and modules.
Adtran ATLAS General OptionCard Application(AdATLGenOCApp)This application provides the following application-specific subviews:
• General Option Card Interface Table View (Page 46)
• General Option Card Overall Module Status Table View (Page 47)
General Option Card Interface TableViewIndexThis variable indicates the interface number of a particular port on an option card within the ATLAS product.
Slot NumberThis variable indicates the slot number of a particular option card within the ATLAS product.
Table 7: Status Values
Value Definition
OK 0x01
ONLINE 0x02
TESTING 0x04
FLASH DOWNLOAD
0x08
ERROR 0x10
ALARM 0x20

A p p l i c a t i o n V i e w s A d t r a n A T L A S G e n e r a l O p t i o n C a r d A p p l i c a t i o n ( A d A T L G e n O C A p p )
S P E C T R U M E n t e r p r i s e M a n a g e r Page 47 A d t r a n D S U / C S U
Port NumberThis variable indicates the port number of a particular port on an option card within the ATLAS product.
Specific Card OID ReferenceThis variable indicates the OID that points to the specific MIB that references this particular type of Option Card with the ATLAS product.
Part NumberThis variable indicates the part number for a particular option card within the ATLAS product.
Serial NumberThis variable indicates the serial number for a particular option card within the Atlas product.
Hardware RevThis variable indicates the hardware rev for a particular option card within the ATLAS product.
Port NameThis variable indicates the port name for a particular port located on an option card within the ATLAS product.
Test StatusThis variable indicates the port test status for a particular port located on an option card within the ATLAS product. Values are On, Off, and Nonapp
Module StateThis variable indicates the state of an option card within the ATLAS product, either online or offline. Valid values are On and Off .
Module StatusThis variable indicates the hardware module status for an option card located within the ATLAS product. Options are Online , Offline , NoResponse , UnresponsiveOffline , NotReady , and Restarting .
General Option Card Overall ModuleStatus Table ViewIndexAn index into the General Option Card Module Index. This number corresponds to the slot number into which the Option Card has been placed.
Overall StatusA bit-encoded variable that gives the overall status of the Option Card. See Table 7 for a listing of values. There may be multiple bits set based on the current state of the option card.

A p p l i c a t i o n V i e w s A d t r a n A T L A S F r o n t P a n e l G r o u p A p p l i c a t i o n ( A d A T L F r P n l A p p )
S P E C T R U M E n t e r p r i s e M a n a g e r Page 48 A d t r a n D S U / C S U
Adtran ATLAS Front PanelGroup Application(AdATLFrPnlApp)This application provides the following application-specific subviews:
• LCD Display View (Page 48)• CSU LED Group View (Page 48)• Module LED Table View (Page 49)
This application contains ASN.1 objects that store the current state of all LEDs and the LCD display on the Atlas products.
LCD Display ViewAccess: From the Icon Subviews menu for theAdATLFrPnlApp icon, select LCD Display.
LCDThe message that is currently displayed on the Atlas LCD.
SysLedThis variable indicates the status of the System LED. When the system LED changes state, this variable changes accordingly. The system LED states are as follows as listed in the table below.
CSU LED Group ViewAccess: From the Icon Subviews menu for theAdATLFrPnlApp icon, select CSU LED Group .
OKThe status of the CSU OK LED.
Table 8: System LED States
State Status
OK Green
Error Red
Warning Yellow
Flash Update Flashing Green
Flash Error Flashing Red
Off Off
Table 9: CSU OK LED Status
State Status
OK Green
Flash Flashing Green
Off Off

A p p l i c a t i o n V i e w s A d t r a n A T L A S F r o n t P a n e l G r o u p A p p l i c a t i o n ( A d A T L F r P n l A p p )
S P E C T R U M E n t e r p r i s e M a n a g e r Page 49 A d t r a n D S U / C S U
TestThe status of the CSU Test LED. When the state changes, this variable changes accordingly.
ErrorThe CSU Error LED status. When the state changes, this variable changes accordingly.
AlarmThe CSU Alarm LED Status.
Module NumberThe number of module slots that are located on the Atlas product.
Module LED Table ViewAccess: From the Icon Subviews menu for theAdATLFrPnlApp icon, select Module LED.
IndexIndicates which slot is indicated on the Atlas 800 product.
StatusThe status of the card located in the slot determined by the Index variable.
Table 10: CSU Test LED Status
State Status
Test in Progress Yellow
Flash Flashing Yellow
Off Off
Table 11: CSU Error State
State Status
Error Red
Flash Flashing Red
Off Off
Table 12: CSU Alarm LED Status
State Status
Alarm Red
Flash Flashing Red
Off Off

A p p l i c a t i o n V i e w s A d t r a n A T L A S V 3 5 N x 4 A p p l i c a t i o n ( A d A T L V 3 5 x 4 A p p )
S P E C T R U M E n t e r p r i s e M a n a g e r Page 50 A d t r a n D S U / C S U
OnlineIndicates whether the card located in the slot determined by the Index is online or offline.
TestIndicates whether the card located in the slot determined by the Index is in a test mode or not.
Adtran ATLAS V35Nx4Application (AdATLV35x4App)This application provides the following application-specific subview:
• The ATLAS V35Nx56 Interface Table Index (Page 50)
The ATLAS V35Nx56 Interface TableIndexThis variable indicates the interface number of a particular V35Nx56 port within the ATLAS product. This number will be the same as the ifIndex located in the MIB-II interface table.
NumberThis variable indicates the slot number of a V35Nx4 Option card within the ATLAS product.
Port NumberThis variable indicates the port number of a particular port on a V35Nx4 Option card within the ATLAS product.
AlarmStatusThis 4 bit-encoded variable indicates the current state of the alarms that can occur on a V35Nx4 Option Card. This variable is encoded as follows:
Table 13: Online LED Status
State Status
Online Green
Flashing Flashing Green
Offline Off
Table 14: Module Test Status
State Status
Test in Progress Green
Flashing Flashing Red
Off Off

A p p l i c a t i o n V i e w s A d t r a n A T L A S V 3 5 N x 4 A p p l i c a t i o n ( A d A T L V 3 5 x 4 A p p )
S P E C T R U M E n t e r p r i s e M a n a g e r Page 51 A d t r a n D S U / C S U
There may be multiple bits set based on the current state of the option card. If a bit is set, then the alarm is active, else it is not active.
StatusThis bit-encoded variable indicates the current state of the DTE leads that are located in an interface on a V35Nx4 Option Card. This variable is encoded as follows: There may be multiple bits set based on the
current state of the option card. If a bit is set, then the lead is active, else it is not active.
DataRateThis variable indicates the current data rate of an interface on a V35Nx4 Option card.
PLLFifoStatusThis bit-encoded variable indicates the current state of the PLL/Fifo Status for an interface on a
Table 15: Alarm Status
NO EXT CLK ALARM
0x1
ZERO ALARM 0x2
PLL ALARM 0x4
SLIP ALARM 0x8
Table 16: DTE Status
RTS 0x001
CTS 0x002
DTR 0x004
DSR 0x008
DCD 0x010
RI 0x020
TD 0x040
RD 0x080
EC 0x100

A p p l i c a t i o n V i e w s A d t r a n A T L A S V 3 5 N x 4 A p p l i c a t i o n ( A d A T L V 3 5 x 4 A p p )
S P E C T R U M E n t e r p r i s e M a n a g e r Page 52 A d t r a n D S U / C S U
V35Nx4 Option Card. This variable is encoded as follows:
There may be multiple bits set based on the current state of the option card. If a bit is set, then the status is active, else it is not active.
Table 17: PLL/FiFo Status
LOCK 0x01
RXE 0x02
RXF 0x04
TXE 0x08
TXF 0x10

S P E C T R U M E n t e r p r i s e M a n a g e r Page 53 A d t r a n D S U / C S U
Performance Views
This section provides brief descriptions of the Performance views available for the Adtran DSU/CSU devices inSPECTRUM.
Performance views display performance statistics in terms of a set of transmission attributes, e.g., cell rates, frame rates, % error, etc. A typical view is shown in Figure 8. The instantaneous condition of each transmission attribute is recorded in a graph. The statistical information for each attribute is presented in the adjacent table.
Generally, you determine performance at the device level through Performance views accessed from the Device and Application icons. You determine performance at the port/interface level through Performance views accessed from Interface icons.
For more information on Performance views, refer to the SPECTRUM Views documentation.
The following paragraphs list the performance attributes displayed for each Performance view supported by this management module.
Figure 8: Performance View
SpectroGRAPH: Type
Model Name
Contact
Description
Location
Network Address System Up Time
Manufacturer
Device Type
Serial Number
Log
100.0
10.00
1.00
0.10
0.01
000:40:0 0:30:0 0:20:0
Value Average Peak Value
* Frame Rate
% Delivered
% Forwarded
% Transmit
% Error
DetailGraph Properties Scroll to Date-Time
File View Tools Bookmarks
% Discarded*Frames per second
Jk2 of type of AdtranDev of Landscape node: Primary
Primary Application

S P E C T R U M E n t e r p r i s e M a n a g e r Page 54 A d t r a n D S U / C S U
Device Performance ViewAccess: From the Icon Subviews menu for the Deviceicon, select Performance .
Current and historical frame transmission information is provided via the following attributes.
• Frame Rate• % Delivered• % Forwarded• % Transmit• % Error• % Discarded
Port Performance ViewAccess: From the Icon Subviews menu for the DeviceInterface icon, select Performance .
Current and historical packet transmission information is provided via the following attributes.
• Load• Packet Rate• % Error• % Discarded
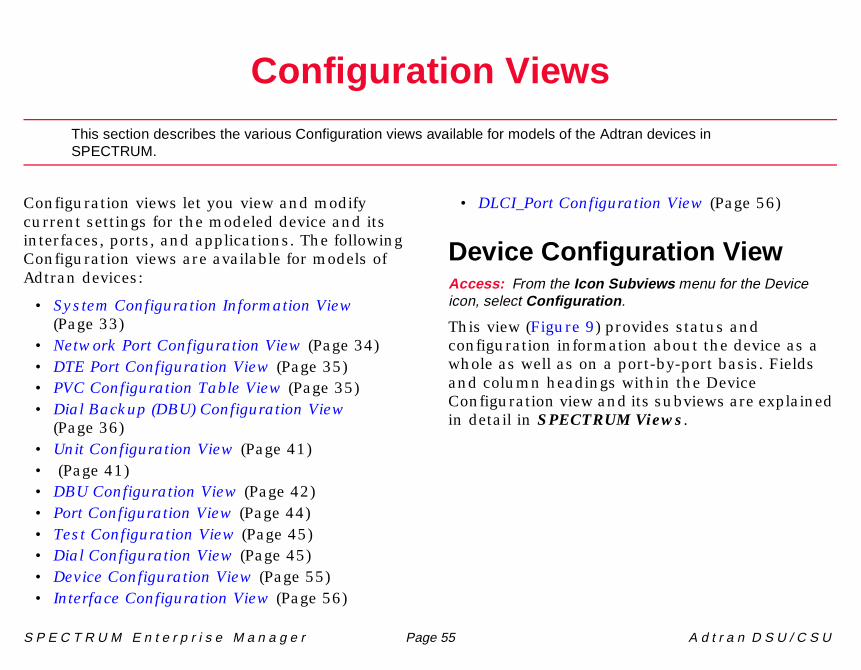
S P E C T R U M E n t e r p r i s e M a n a g e r Page 55 A d t r a n D S U / C S U
Configuration Views
This section describes the various Configuration views available for models of the Adtran devices inSPECTRUM.
Configuration views let you view and modify current settings for the modeled device and its interfaces, ports, and applications. The following Configuration views are available for models of Adtran devices:
• System Configuration Information View (Page 33)
• Network Port Configuration View (Page 34)• DTE Port Configuration View (Page 35)• PVC Configuration Table View (Page 35)• Dial Backup (DBU) Configuration View
(Page 36)• Unit Configuration View (Page 41)• (Page 41)• DBU Configuration View (Page 42)• Port Configuration View (Page 44)• Test Configuration View (Page 45)• Dial Configuration View (Page 45)• Device Configuration View (Page 55)• Interface Configuration View (Page 56)
• DLCI_Port Configuration View (Page 56)
Device Configuration ViewAccess: From the Icon Subviews menu for the Deviceicon, select Configuration .
This view (Figure 9) provides status and configuration information about the device as a whole as well as on a port-by-port basis. Fields and column headings within the Device Configuration view and its subviews are explained in detail in SPECTRUM Views.

S P E C T R U M E n t e r p r i s e M a n a g e r Page 56 A d t r a n D S U / C S U
Figure 9: Device Configuration View
Interface Configuration ViewAccess: From the Icon Subviews menu for an Interfaceicon in the Device view, select IF Configuration .
This view provides the following information for the selected interface:
Operation StatusThe current operational state of the interface (Up, Down, Unknown, Dormant , NotPresent ).
The desired operational state of the interface (up, down, or testing ).
Last ChangeThe System UpTime value when the interface entered its current operational state.
IP Address/Network MaskThis window provides a list of the user-defined names and IP addresses for the interface.
Physical AddressThe Ethernet (MAC) address of the interface.
BandwidthThe estimated bandwidth of the interface, measured in bits per second. For interfaces that do not vary in bandwidth, or no accurate estimate can be made, a nominal bandwidth is provided.
Packet SizeThe largest packet that can be transmitted or received by the port, displayed in octets.
Queue LengthThe length of the outbound packet queue, in packets.
DLCI_Port Configuration ViewAccess: From the Icon Subviews menu for a DLCI icon inthe DevTop Sub-Interface View, select Port Configuration.Admin. Status
JK2 of Type AdtranDev of Landscape X Primary
Primary Application
System Up Time
Interface Type
Interface Index
Serial Number
IP AddressModelÿContactDescriptionLocation
File ÿ View HelpÿTools
Contact Status
Primary Address
Number of Interfaces
Device Configuration View
Interface Configuration TableSort Find Update
Redundancy and Model Reconfiguration Options Interface Address Translation
Index Description Type Bandwidth Physical Address Operation Status
Bookmarks
i
SpectroGRAPH::

C o n f i g u r a t i o n V i e w s D L C I _ P o r t C o n f i g u r a t i o n V i e w
S P E C T R U M E n t e r p r i s e M a n a g e r Page 57 A d t r a n D S U / C S U
This view provides Port Polling/Logging, Performance, Detail and Service Information. Pressing the Help button opens a view that provides a detailed description of this view.

S P E C T R U M E n t e r p r i s e M a n a g e r Page 58 A d t r a n D S U / C S U
Adtran Product View
This section describes the Adtran Product view available for models of Adtran devices in SPECTRUM.
Access: From the Icon Subviews menu for the AdtranDevice icon, select Product Information .
Product Identification InformationViewThis view displays the following information.
Adtran Product Part NumberThe Adtran product part number.
Adtran Product CLEI CodeThe Adtran product CLEI code.
Product RevisionThe Adtran product revision number.
Product Physical AddressThis variable octet strings contains the Adtran physical address assigned to this product. For example, the octet sequence, 16 02 03 01, specifies channel bank number 16, digroup number 2, DSO channel slot number 3, position 1. This object value is commonly reported in SNMP traps to identify the product’s location.
Product Serial NumberThe Adtran product serial number.
Product Software VersionThe Adtran product software version number.
Channel Information ViewAccess: Within the Product Identification Information View,click the Channel Information button.
Channel Bank Information GroupThis view displays the following information.
Language Location IdentifierThe Common Language Location Identifier.
Frame IdentifierThe Channel Bank Frame Identifier.
Channel Unit Information Group
Number of ChannelsThis value contains the number of channels used by the product. For example, a Card Office
A d t r a n P r o d u c t V i e w D L C I _ P o r t C o n f i g u r a t i o n V i e w
S P E C T R U M E n t e r p r i s e M a n a g e r Page 59 A d t r a n D S U / C S U
Channel Unit Data Port (OCUDP) operating with 56 Kbps with Error Correction enabled uses two time slots; an Nx56 Channel Unit uses N slots, etc.

S P E C T R U M E n t e r p r i s e M a n a g e r Page 60 A d t r a n D S U / C S U
Model Information View
This section provides a brief overview of the Model Information view.
This view displays administrative information about the device and its applications and lets you set thresholds and alarm severity for the device.
Figure 10 shows a sample Model Information view. The layout of this view is the same for all model types in SPECTRUM but some information will vary depending on the model it defines. Refer to SPECTRUM Views for a complete description of this view.
Figure 10: Model Information View
Primary Application
System Up Time
Manufacturer
Device Type
Serial Number
Network AddressModel NameContactDescriptionLocation
MM Version Number
MM Name
MM Part Number
General Information
Model Created By
Model Type
Model Creation Time
Model State
Security String
Communication Information
Community Name
DCM TimeOut
DCM Retry
Poll/Log InformationPoll Interval
Polling StatusCondition
Condition Value
Contact Status
Lost Child Count
Value When Yellow
Value When Orange
Value When Red
Last Successful Poll
Log Ratio
LOGGED POLLED
Model Information View
SpectroGRAPH: Model Name
File View Tools Bookmarks Help
Jk2 of type AdtranDev of Landscape: Primary
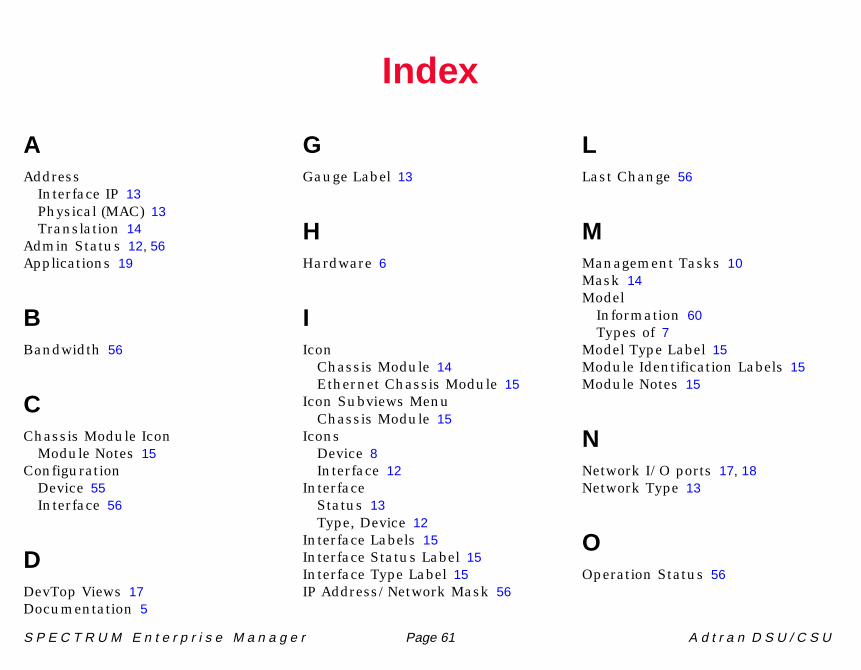
S P E C T R U M E n t e r p r i s e M a n a g e r Page 61 A d t r a n D S U / C S U
Index
AAddress
Interface IP 13Physical (MAC) 13Translation 14
Admin Status 12, 56Applications 19
BBandwidth 56
CChassis Module Icon
Module Notes 15Configuration
Device 55Interface 56
DDevTop Views 17Documentation 5
GGauge Label 13
HHardware 6
IIcon
Chassis Module 14Ethernet Chassis Module 15
Icon Subviews MenuChassis Module 15
IconsDevice 8Interface 12
InterfaceStatus 13Type, Device 12
Interface Labels 15Interface Status Label 15Interface Type Label 15IP Address/Network Mask 56
LLast Change 56
MManagement Tasks 10Mask 14Model
Information 60Types of 7
Model Type Label 15Module Identification Labels 15Module Notes 15
NNetwork I/O ports 17, 18Network Type 13
OOperation Status 56

I n d e x I n d e x
S P E C T R U M E n t e r p r i s e M a n a g e r Page 62 A d t r a n D S U / C S U
PPacket Size 56Performance Statistics 13, 53Physical Address 56Port Number, Device 12
QQueue Length 56
RRestricted Rights Notice 2
SSerial ports 17, 18Slot Number Label 15Statistics
Routing Frame Transmission 54
TThreshold Information 13Trademarks 2Troubleshooting 10