
adsorption of betacyanin on yarns
24
ADSORPTION OF BETACYANIN ON YARNS NURUL AIN BINTI IBRAHIM Thesis submitted in partial fulfilment of the requirements for the award of the degree of Bachelor of Chemical Engineering (Biotechnology) Faculty of Chemical & Natural Resources Engineering UNIVERSITI MALAYSIA PAHANG JULY 2015 ©NURUL AIN BINTI IBRAHIM (2015)
Transcript of adsorption of betacyanin on yarns

ADSORPTION OF BETACYANIN ON YARNS
NURUL AIN BINTI IBRAHIM
Thesis submitted in partial fulfilment of the requirements
for the award of the degree of
Bachelor of Chemical Engineering (Biotechnology)
Faculty of Chemical & Natural Resources Engineering
UNIVERSITI MALAYSIA PAHANG
JULY 2015
©NURUL AIN BINTI IBRAHIM (2015)

v
ABSTRACT
In textile industry, synthetic colourant is widely used as it is much cheaper and has high
stability but the use of synthetic dye poses a great concern and threat to the environment
when discharged. Thus, to overcome the problem, natural colourant is introduced as a
substitute to synthetic colourant. Peel of Hylocereus polyrhizus or red-purple fleshed
dragon fruits could be an attractive and potential source of red colourant for textile
industry as the peel possess high content of betacyanin. Despite the potential, as a natural
colourant, betacyanin cannot adheres well with certain types of fabric. This study
provides determination of suitable yarns to be dyed with dragon fruit peel. Betacyanin
was extracted from dragon fruit peel by simple water extraction at 100°C and adsorption
process was carried out by soaking polyester cotton, rayon, and rayon coolmax yarns into
stock solution for optimum time at 90 minutes. Langmuir and Freundlich isotherm models
were applied in order to describe the equilibrium at different parameters and isotherm
constants. Root mean square error and chi square analysis were used to test the models’
goodness of fit by non-linear regression due to the bias in using the correlation coefficient
resulting from linearization. Freundlich model gave the best result for the adsorption
isotherm. The applicability of Freundlich isotherm model showed the heterogeneous
adsorption surface with sites have different energies of adsorption as the Freundlich
model assumes. The result also have demonstrated the potency of dragon fruit peel as a
source of natural colouring agents for dyeing of yarns by conventional techniques and
perhaps more advanced techniques.

vi
ABSTRAK
Dalam industri tekstil, pewarna sintetik digunakan secara meluas kerana ia adalah jauh
lebih murah dan mempunyai kestabilan yang tinggi. Akan tetapi penggunaan pewarna
sintetik telah menimbulkan kebimbangan dan ancaman kepada alam sekitar apabila
dilepaskan ke sungai. Oleh itu, bagi mengatasi masalah tersebut, pewarna asli telah
diperkenalkan sebagai pengganti. Kulit dari Hylocereus polyrhizus atau buah naga yang
mempunyai isi merah-ungu mempunyai potensi sebagai pewarna merah asli untuk
industri tekstil kerana kulit buah naga tersebut dikatakan mempunyai kandungan
betacyanin yang tinggi. Walaubagaimanapun, betacyanin tidak “melekat” dengan baik
dengan beberapa jenis kain. Kajian ini dibuat untuk menentukan kain yang sesuai untuk
diwarnakan dengan kulit buah naga. Betacyanin diekstrak daripada kulit buah naga
dengan menggunakan air pada 100°C dan proses penjerapan telah dijalankan dengan
merendam benang kapas poliester, rayon, dan coolmax rayon ke dalam ekstrak dalam
masa optimum 90 minit. Langmuir dan Freundlich model isoterma digunakan untuk
menggambarkan keseimbangan pada parameter yang berbeza dan pemalar isoterma.
Kesalahan root mean square dan analisis chi square digunakan untuk menguji goodness
of fit pada setiap model kerana berat sebelah dalam menggunakan pekali korelasi yang
terhasil daripada linear. Model Freundlich memberikan hasil yang terbaik untuk isoterma
penjerapan dalam kajian ini. Hasil kajian juga telah menunjukkan potensi kulit buah naga
sebagai sumber pewarna semula jadi untuk pencelupan benang dengan teknik
konvensional dan teknik yang lebih maju.

vii
TABLE OF CONTENTS SUPERVISOR’S DECLARATION .............................................................................. i
STUDENT’S DECLARATION ................................................................................... ii
DEDICATION ............................................................................................................ iii
ACKNOWLEDGEMENT ............................................................................................iv
ABSTRACT .................................................................................................................. v
ABSTRAK ...................................................................................................................vi
LIST OF FIGURES ......................................................................................................ix
LIST OF TABLES ..................................................................................................... xii
CHAPTER 1 ................................................................................................................. 1
1.1 Motivation and Problem Statement .................................................................. 1
1.2 Objective ......................................................................................................... 2
1.3 Scope of This Research ................................................................................... 2
1.4 Organisation of This Thesis ............................................................................. 3
CHAPTER 2 ................................................................................................................. 5
2.0 Overview ........................................................................................................ 5
2.1 Natural Colourant ............................................................................................ 5
2.2 Betalain and Betacyanin Pigment .................................................................... 7
2.3 Dragon Fruit .................................................................................................... 8
2.4 Yarn .............................................................................................................. 14
2.4 Adsorption .................................................................................................... 23
2.5 Environmental Issues in Textile Industry ....................................................... 28
2.6 Spectrophotometric Analysis ......................................................................... 33
2.7 Fourier Transform Infrared Spectroscopy ...................................................... 37
2.8 Scanning Electron Microscope ...................................................................... 41
2.9 Process of Mordanting ................................................................................... 42
CHAPTER 3 ............................................................................................................... 47
3.0 Introduction ................................................................................................... 47
3.1 Raw Materials ............................................................................................... 47
3.2 Apparatus ...................................................................................................... 47
3.3 Equipment ..................................................................................................... 47
3.4 Overview of Processes .................................................................................. 48
3.5 Preparation of Stock Solution ........................................................................ 50
3.6 Process of Mordanting ................................................................................... 53
3.7 Determination of Equilibrium Time ............................................................... 54
3.8 Process of Adsorption ................................................................................... 54
3.9 UV-Vis Analysis ........................................................................................... 56
3.10 Quantification of Dye Adsorbed .................................................................... 57
3.11 Freundlich and Langmuir Isotherm Models ................................................... 58
3.12 Fourier Transform Infrared Spectroscopy (FTIR) .......................................... 58
3.13 Scanning Electron Microscope (SEM) .......................................................... 58
3.14 Desorption Process ....................................................................................... 59
3.15 Error Analysis ............................................................................................... 59
CHAPTER 4 ............................................................................................................... 60
4.1 Introduction ................................................................................................... 60
4.2 Determination of Equilibrium Time ............................................................... 60
4.3 Adsorption Analysis at Various Dilution Factors ........................................... 63
4.4 Langmuir Isotherm ........................................................................................ 68

viii
4.5 Freundlich Isotherm ...................................................................................... 71
4.6 Comparison between Isotherm Models .......................................................... 74
4.7 Error Analysis ............................................................................................... 75
4.8 Morphological Study ..................................................................................... 76
4.9 Structural Analysis ........................................................................................ 83
4.10 Contact Angle Measurement ......................................................................... 86
4.11 Desorption Process ........................................................................................ 88
CHAPTER 5 ............................................................................................................... 91
5.1 Conclusion .................................................................................................... 91
5.2 Future Works ................................................................................................ 92
REFERENCES............................................................................................................ 93
APPENDICES ............................................................................................................ 99
APPENDIX A: EQUILIBRIUM TIME ANALYSIS ............................................... 99
APPENDIX B: ADSORPTION ANALYSIS ......................................................... 100
APPENDIX C: FREUNDLICH ISOTHERM ANALYSIS .................................... 102
APPENDIX D: LANGMUIR ISOTHERM ANALYSIS ........................................ 103

ix
LIST OF FIGURES
Figure 2. 1: Dragon fruit plants ..............................................................................8
Figure 2. 2: Dragon fruit white flower that blooms at night........................................9
Figure 2. 3: White-fleshed dragon fruit, Hylocereus undatus ......................................9
Figure 2. 4: A red-fleshed dragon fruit, Hylocereus polyrhizus. ................................10
Figure 2. 5: A colourful spun yarn .........................................................................14
Figure 2. 6: Filaments of yarns .............................................................................15
Figure 2. 7: Scanning Electron Microscope picture of a bend in a high-surface area
polyester fibre. ....................................................................................................17
Figure 2. 8: Cotton field in Spain ..........................................................................18
Figure 2. 9: A Scanning Electron Microscope of polyester fibres. .............................21
Figure 2. 10: Cross sectional images of Coolmax....................................................22
Figure 2. 11: Adsorptive process ...........................................................................23
Figure 2. 12: Determination of Freundlich isotherm constant ..................................26
Figure 2. 13: Determination of Langmuir isotherm constant ....................................27
Figure 2. 14: Untreated effluents from a dyeing unit flowing into a canal in Tamil Nadu
..........................................................................................................................28
Figure 2. 15: Wavelength and amplitude ................................................................34
Figure 2. 16: Wavelength and frequency ................................................................34
Figure 2. 17: UV-Vis Spectrophotometer................................................................36
Figure 2. 18: A disposable plastic cuvette ..............................................................37
Figure 2. 19: Block diagram of a FTIR Spectrometer ..............................................39
Figure 2. 20: A FTIR Spectrometer ........................................................................39
Figure 2. 21: A typical laboratory scanning electroscopy microscope instrument .......41
Figure 2. 22: Yarns washed before being mordanted ...............................................43
Figure 2. 23: Molecular structure of potassium alum ..............................................45
Figure 3. 1: Flow diagram of research methods of adsorption of betacyanin on yarns 49
Figure 3. 2: Flow diagram of preparation of stock solution ......................................50
Figure 3. 3: Dragon fruit peels extraction with water at 100ºC .................................51
Figure 3. 4: Dragon fruit was prepared to be centrifuged ........................................51
Figure 3. 5: Dragon fruit extract after being centrifuged .........................................52
Figure 3. 6: Test tubes containing dye solution and yarns ........................................52
Figure 3. 7: Yarns being soaked in 25% mordant solution and heated in waterbath ....53

x
Figure 3. 8: Flow diagram of determination of equilibrium time ...............................54
Figure 3. 9: shows 15 tubes containing 20 ml of dye solution of different dilution factors
with yarns ...........................................................................................................55
Figure 3. 10: Yarns soaked in dye solutions are left in incubator shaker at 100rpm and
25°C for 90 minutes .............................................................................................56
Figure 3. 11: Liquid samples from each tubes is taken into cuvettes for UV-Vis analysis
..........................................................................................................................57
Figure 4. 1: A graph of betacyanin concentration versus time ..................................62
Figure 4. 2: Graph of betacyanin content versus dilution factor ...............................64
Figure 4. 3: Graph of amount of dye adsorbed on yarn versus dilution factor ............66
Figure 4. 4: Three different types of yarns (a) polyester cotton, (b) rayon coolmax, and
(c) rayon left to dry after dying process. .................................................................67
Figure 4. 5: Polyester cotton Langmuir isotherm graph ...........................................69
Figure 4. 6: Rayon Langmuir isotherm graph .........................................................69
Figure 4. 7: Rayon coolmax Langmuir isotherm graph ............................................70
Figure 4. 8: Polyester cotton Freundlich isotherm graph .........................................72
Figure 4. 9: Rayon Freundlich isotherm graph .......................................................72
Figure 4. 10: SEM images under 1000x magnification of untreated polyester cotton
surface ...............................................................................................................77
Figure 4. 11: SEM images under 1000x magnification of treated polyester cotton
surface ...............................................................................................................78
Figure 4. 12: SEM images under 1000x magnification of dyed polyester cotton surface
..........................................................................................................................78
Figure 4. 13: SEM images under 1000x magnification of untreated rayon surface ......79
Figure 4. 14: SEM images under 1000x magnification of treated rayon surface .........80
Figure 4. 15: SEM images under 1000x magnification of dyed rayon surface .............80
Figure 4. 16: SEM images under 1000x magnification of untreated rayon coolmax
surface ...............................................................................................................81
Figure 4. 17: SEM images under 1000x magnification of treated rayon coolmax surface
..........................................................................................................................82
Figure 4. 18: SEM images under 1000x magnification of dyed rayon coolmax surface 82
Figure 4. 19: FTIR of (a) untreated, (b) treated, and (c) dyed polyester cotton ...........84
Figure 4. 20: FTIR of (a) untreated, (b) treated, and (c) dyed rayon .........................84
Figure 4. 21: FTIR of (a) untreated, (b) treated, and (c) dyed rayon coolmax ............85
Figure 4. 22: FTIR of dyed (a) rayon coolmax, (b) polyester cotton, and (c) rayon .....86
Figure 4. 23: Water droplet on untreated rayon coolmax .........................................87

xi
Figure 4. 24: Polyester cotton two weeks after dyeing .............................................89
Figure 4. 25: Rayon yarns two weeks after dyeing ...................................................89
Figure 4. 26: Rayon coolmax two weeks after dyeing ..............................................90

xii
LIST OF TABLES
Table 2. 1: Fatty acids composition in Hylocereus polyrhizus seeds ............................ 12
Table 2. 2: Proximate compositions of dragon fruit peel pectin ................................... 13
Table 2. 3: Studies that fit Freundlich isotherm model ................................................. 30
Table 2. 4: Studies that fit Langmuir isotherm model ................................................... 31
Table 2. 5: Studies that fit Freundlich - Langmuir isotherm model............................... 32
Table 2. 6: Regions of the Infrared Spectrum for Preliminary Analysis (Lambert et al.
1998) ........................................................................................................................... 40
Table 2. 7: Chemical and physical properties of alum ................................................. 46
Table 3. 1: Water and dye ratio for dilution factor ..................................................55
Table 4. 1: Effect of optical density values for polyester cotton, rayon, and rayon
coolmax. ...................................................................................................................... 60
Table 4. 2: Optical density of dye adsorption on polyester cotton, rayon, and rayon
coolmax ....................................................................................................................... 61
Table 4. 3: Betacyanin Concentration Adsorbed in Each Yarns ................................... 61
Table 4. 4: Initial reading absorbance at 560nm wavelength setting for five dilution
factors ......................................................................................................................... 63
Table 4. 5: Final reading absorbance at 560nm wavelength setting for five dilution
factors ......................................................................................................................... 63
Table 4. 6: Difference between initial and final reading absorbance and betacyanin
content adsorbed on yarns. .......................................................................................... 64
Table 4. 7: Amount of dye adsorbed on three different yarns at five different factors ... 65
Table 4. 8: Langmuir constants for three types of yarns ............................................... 70
Table 4. 9: Freundlich constants for three types of yarn .............................................. 73
Table 4. 10: Langmuir and Freundlich constants for three different yarns ................... 74
Table 4. 11: Error analysis of Freundlich and Langmuir ............................................. 76
Table 4. 12: Surface properties for three types of yarns ............................................... 86
Table 4. 14: Optical density result of sample after desorption process ......................... 88

1
CHAPTER 1
INTRODUCTION
1.1 Motivation and Problem Statement
Colour is perceived as quality indicator and is one of the most determining
attributes to sell a product. Dyed fabrics have been produced in all cultures dated back
centuries ago. Dyed textile material from Egypt could be dated to 3200 BC, in India dyed
textiles were dated at 2000 BC but the durability of this product is limited (Saxena &
Raja, 2014). Before the emerging of synthetic colourant, various plants served as sources
for colourants such as indigo plant, madder, turmeric and so forth (Saxena & Raja, 2014).
The development of synthetic colourant at the beginning of twentieth century create more
producible techniques of application and distinctively lowering the cost of dyed fabrics.
In textile industry, synthetic colourant has been used commercially as it is
cheaper, more vibrant and has high stability. However, discharge of coloured effluent to
the rivers poses major aesthetic and ecological threat to environment specifically the
aquatic ecosystems, thus attracting environment-conscious consumers towards the use of
natural colourant (Mittal et al., 2007). The textile industry is also regarded as one of the
greatest generators of liquid effluent as this industry uses high amount of water in dying
process (Ulson de Souza et al., 2008). There is also growing consciousness about
biological and organic value of eco-friendly products attracting interest of consumers
towards the use of natural colourant in textile industry (Rajendran & Selvi, 2014). To
counter these concerns, natural colourant has been preferred in recent years, leaving
synthetic colourants behind, due to realization that it is way safer and eco-friendly (Kumar
& Sinha, 2004).
Natural betacyanin has attracted great attention over the past years (Cai et al.,
2006). Often times, dragon fruit peel is regarded as waste and an ecological burden to
society to dispose them (Bhatnagar et al., 2015) but it is suggested to have abundant
amount of betalain forming enzyme as the flesh had, since it is found that the betacyanin
pattern is similar with the flesh (Stintzing et al., 2002). Since the discovery, betacyanin

2
content in Hylocereus polyrhizus or red-fleshed dragon fruit peel has been the new focus
for the next source of red natural colourant. The peel of the fruit exhibit high content the
pigment with high stability at neutral pH (Naderi et al., 2010). However, due to their
natural properties, betacyanin pigment cannot adheres well in certain types of yarns.
Three types of yarns which are polyester cotton, rayon, and rayon coolmax are
selected to study the affinity of betacyanin pigment from Hylocereus polyrhizus to these
fabric yarns. Freundlich and Langmuir adsorption isotherm models were introduced to
determine which yarns has the highest feasibility of using natural colourant from
Hylocereus polyrhizus peel.
Currently, there is no recent study of adsorption of betacyanin from dragon fruit
on fabric yarns. Hylocereus is rich in mucilaginous substances (Naderi et al., 2010),
restricting colour yield as well as adsorption on fabric yarns. Other downside is the lower
stability of the betacyanin pigment restricting the application of colour on certain yarns.
1.2 Objective
Based on the study background and problem statements described in the previous
section, the objectives are to study the affinity of betacyanin pigments to three types of
yarns, to describe the adsorption process using Freundlich and Langmuir isotherm
models, as well as to study the wash fastness of yarns in desorption process.
1.3 Scope of This Research
The following scopes have been identified in order to achieve the objectives:
Betacyanin pigment was extracted from Hylocereus polyrhizus, a red-
fleshed dragon fruit by using water extraction at 100°C.
Different types of yarns namely polyester cotton, rayon, and rayon
coolmax provided by Pusat Tenun Pahang were experimented.
The adsorption equilibrium time was determined by studying the liquid
samples for 120 minutes at 15 minutes interval.
3
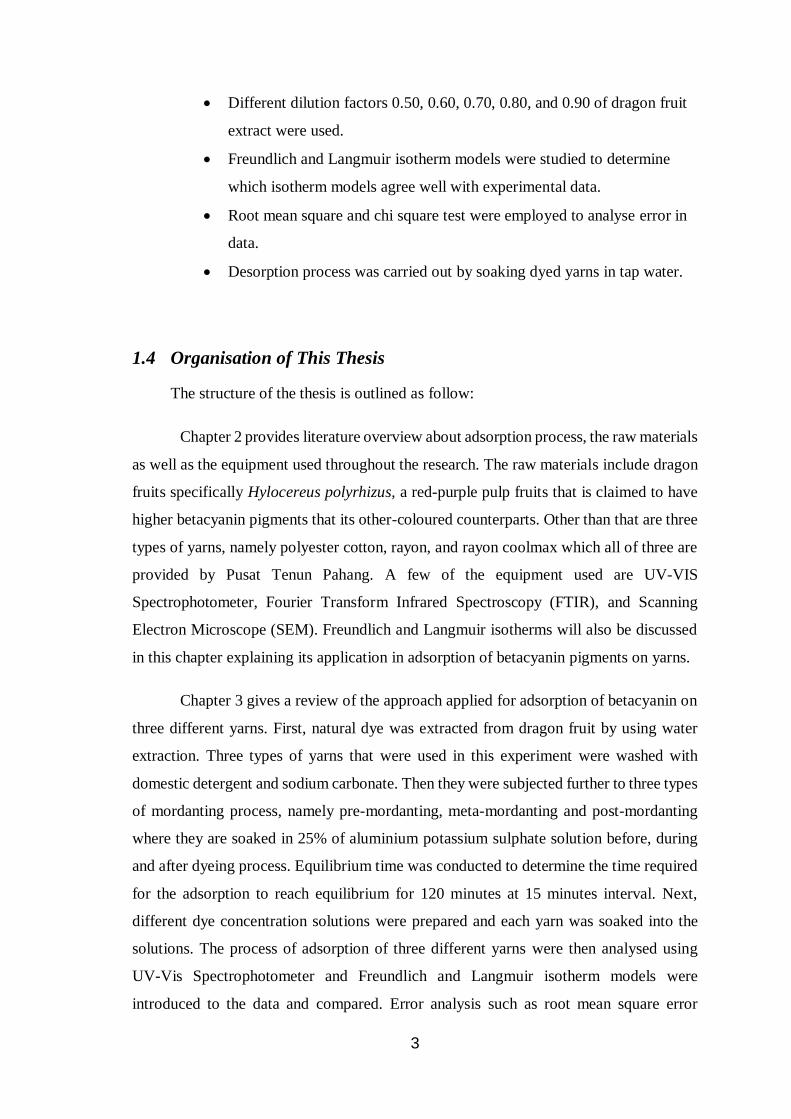
Different dilution factors 0.50, 0.60, 0.70, 0.80, and 0.90 of dragon fruit
extract were used.
Freundlich and Langmuir isotherm models were studied to determine
which isotherm models agree well with experimental data.
Root mean square and chi square test were employed to analyse error in
data.
Desorption process was carried out by soaking dyed yarns in tap water.
1.4 Organisation of This Thesis
The structure of the thesis is outlined as follow:
Chapter 2 provides literature overview about adsorption process, the raw materials
as well as the equipment used throughout the research. The raw materials include dragon
fruits specifically Hylocereus polyrhizus, a red-purple pulp fruits that is claimed to have
higher betacyanin pigments that its other-coloured counterparts. Other than that are three
types of yarns, namely polyester cotton, rayon, and rayon coolmax which all of three are
provided by Pusat Tenun Pahang. A few of the equipment used are UV-VIS
Spectrophotometer, Fourier Transform Infrared Spectroscopy (FTIR), and Scanning
Electron Microscope (SEM). Freundlich and Langmuir isotherms will also be discussed
in this chapter explaining its application in adsorption of betacyanin pigments on yarns.
Chapter 3 gives a review of the approach applied for adsorption of betacyanin on
three different yarns. First, natural dye was extracted from dragon fruit by using water
extraction. Three types of yarns that were used in this experiment were washed with
domestic detergent and sodium carbonate. Then they were subjected further to three types
of mordanting process, namely pre-mordanting, meta-mordanting and post-mordanting
where they are soaked in 25% of aluminium potassium sulphate solution before, during
and after dyeing process. Equilibrium time was conducted to determine the time required
for the adsorption to reach equilibrium for 120 minutes at 15 minutes interval. Next,
different dye concentration solutions were prepared and each yarn was soaked into the
solutions. The process of adsorption of three different yarns were then analysed using
UV-Vis Spectrophotometer and Freundlich and Langmuir isotherm models were
introduced to the data and compared. Error analysis such as root mean square error

4
(RMSE) and chi square test were employed to analyse error in experimental data. Surface
morphology of untreated, treated and dyed yarns were studied using Scanning Electron
Spectroscopy (SEM) and functional group of each yarn fibres was determined by using
Fourier Transform Infrared Spectroscopy (FTIR). Yarns were also studied by using
contact-angle instrument to determine whether they are hydrophilic or hydrophilic in
nature.
Chapter 4 reviews the result for each experiment and analysis in Chapter 3.
Chapter 5 draws together a summary of the thesis and outlines the future work
which might be derived from the result developed in this work.

5
CHAPTER 2
LITERATURE REVIEW
2.0 Overview
This chapter lays out the details and information of terms, materials, equipment,
as well as the process involved in this study.
2.1 Natural Colourant
The use of synthetic colourant is getting less favourable than natural colourant as
it is known to be a major source of environmental pollution and their excessive use has
led serious health hazards and poses threats to environment (Bulut & Akar, 2012). Natural
colourant is described as colourant obtained from biological material (Harivaindaran et
al., 2008) and is considered as non-carcinogenic, easily biodegradable, and non-toxic for
human health (Das et al., 2011). The colourant can be extracted by means of either one
or combination of mechanical retention, covalent chemical bonds formation or complexes
with salts or metal formations, physical absorption, or by solutions (Harivaindaran et al.,
2008). This type of colourant has attracted attention of researchers, industrialist, as well
as environmental enthusiast to be used in variety of products including textiles and food
as it is energy saving and environmental friendly (Khan, et al., 2014). Also, Kulkarni &
Aradhya, (2005) and Anwar et al., (2009) reported that natural colourant from plants
contains antimicrobial, antioxidant and anticarcinogenic activities which make it as an
ideal alternatives to be implemented in industries. Besides, introducing natural colourants
in diet can help reducing the risk of cardiovascular diseases, cancer as well as diseases
associated with ageing (Delgado-vargas et al., 2000). According to Harivaindaran et al.,
(2008), this colourant obtained from mother earth has a world market worth £2.5
billion/year.

6
2.2.1 Application of Natural Colourant on Textiles
The use of non-allergic, non-toxic, as well as eco-friendly natural colourant has
become the utmost important issue in textiles (Samanta & Agarwal, 2009). Synthetic
colourants, although are abundant at very economical price, they however produce skin
allergy and other harmfulness to human body. Thus, there has been revival of the growing
interest on the application of natural colourants on the application of dying textiles.
However, Samanta and Agarwal (2009) stated that colourants extracted naturally produce
very uncommon, soothing, and soft shades as compared to synthetic colourants but
nevertheless there is a few reasons why scientist and researchers are interested to study
the potential of natural colourant;
1. Wide viability of natural colourants and their huge potential
2. Availability of experimental evidence for allergic and toxic effects of some
synthetic dyes, and non-toxic and non-allergic effects of natural colourants
3. Specialty colours and effects of natural dyes produced by craftsman and artisans
for their exclusive technique and specialty work
4. Availability of scientific information on chemical characterizations of different
natural colourants, including their purification and extraction
5. Availability of knowledge base and database on application of natural colourants
on different textiles
2.1.2 Colour Fastness Properties of Natural Dyed Textiles
Colour fastness is described as the resistance of a material to change any of its
colour characteristics (Samanta & Agarwal, 2009). This properties can be rated by loss
of colour intensity in original sample and it also can be expressed by staining scale by
tinting or staining white material by the colour of original fabric (Samanta & Agarwal,
2009). Light fastness, wash fastness, and rub fastness are usually considered in any
textiles. As most natural colourants have poor light stability, colours in natural dyed
textiles after days or years usually different from their original colours. Some colourants
also undergo changes in hue after multiple washing due to presence of alkali in detergents
or washing substances.

7
2.2 Betalain and Betacyanin Pigment
Pigments other than green in plants act as important cues to pollinators to find
their hosts as animals rely on colour to identify and judge edible tissues and the plant’s
degree of ripeness (Stintzing & Carle, 2004). One of this pigments is called betalain.
Betalain is characterised as water-soluble yellow, red or violet natural pigments with anti-
oxidative properties and is sensitive to high temperature, basic or very acidic pH, light,
air (oxygen), and high water activity (Cai et al., 2005; Cai et al., 1998; Herbach et al.,
2006). This pigment can be found in the vacuole of plant cell and in some higher fungi
(Strack, Vogt, & Schliemann, 2003). It has vital role in plant physiology, visual attraction
for pollinators and seed dispersers, as well as defining plant’s aesthetic value (Stintzing
& Carle, 2004). Betalain were thought to be flavonoids that were first extracted from red
beet Beta vulgaris and mainly used in food colouring (Harivaindaran et al., 2008), but it
is in group of nitrogenous compound (Strack, Vogt, & Schliemann, 2003) and a secondary
metabolites derived from the amino acid L-tyrosine (Gandía-Herrero & García-Carmona,
2005). Interestingly, betalain occurs only in the plants from 10 families in the order
Caryophyllales (Cai et al., 2005) and this pigment comprises of red-purple betacyanins
and yellow betaxanthins, as determined by the nature of betalamic acid addition residue
(Gandia-Herrero et al., 2005) Betacyanin is the major component, taking 95% of the
betalain extract (Harivaindaranet al., 2008).
Betacyanin pigment possess an indole-2-carboxylic acid moiety, which is N-
linked to a pyridine dicarboxylic acid group, through an acetyl group 1 and occurs as
glycosides (Daniel, 2006). It is the main component of the red pigments in fruits
especially in red beet Beta vulgaris (Harivaindaran et al., 2008), dragon fruit Hylocereus
polyrhizus (Stintzing et al., 2002), as well as in flowers such as in Bougainvillea sp.
(Kugler et al., 2007). Betacyanin is claimed to have colouring power competitive to
synthetic colourants (Cassano et al., 2007) and the pigment from Beta vulgraris is
commercially exploited for food colouring (Azeredo et al., 2007). It is also claimed that
betacyanin has antioxidant capacity and antiradical potential (Escribano et al., 1998) and
it can prevent oxidative process in human body, which contribute to the symptoms of a
few of degenerative diseases (Strack et al., 2003). Betacyanin pigments extracted from
dragon fruit specifically Hylocereues polyrhizus has attracted interests among scientists
and researchers as natural colourant especially for food application (Tang & Norziah,
2007).

8
2.3 Dragon Fruit
Pitaya or commonly known as dragon fruit, strawberry pear, and “buah naga” in
Malaysia is the fruit of several cactus species most importantly of the genus Hylocereus.
The dragon fruit plant is a climbing cacti with angular stems and mostly white, fragrant,
night-blooming flowers as shown in Figure 2.1 and Figure 2.2. The fruit skin is covered
with bracts, or “scales” – hence the name dragon fruit (Wu et al., 2006). The plants are
grown in the open in the tropical areas and cultivated under subtropical conditions
(Wybraniec & Mizrahi, 2002). According to Wybraniec and Mizrahi (2002), there are
about 16 species of Hylocereus identified in Central America and Mexico, and
Hylocereus undatus, a white-fleshed dragon fruit, as shown in Figure 2.3, is commonly
used as garden plant in the tropical world and Hylocereus polyrhizus, a red-fleshed dragon
fruit is cultivated for domestication.
Figure 2. 1: Dragon fruit plants

9
Figure 2. 2: Dragon fruit white flower that blooms at night
Figure 2. 3: White-fleshed dragon fruit, Hylocereus undatus

10
2.3.1 Hylocereus polyrhizus
Red-purple fleshed dragon fruits, with scientific name of Hylocereus polyrhizus,
or also known as red pitaya or pitahaya which means “the scaly fruit” is originated from
Latin America and it is a member of the Cactaceae family, order of Caryophyllales and
from the genus Hylocereus (Stintzing et al., 2002). Figure 2.4 shows red-fleshed dragon
fruit that can be found in abundance during hot weather in Malaysia.
Figure 2. 4: A red-fleshed dragon fruit, Hylocereus polyrhizus.
This particular fruit is majorly cultivated in several countries like Vietnam,
Malaysia, Taiwan, China, and Israel and is highly appealing in European and United
States market (Harivaindaran et al., 2008). In Israel, the pulp is used to make red-violet
ice cream and has potential to make low-temperature dairy drinks (Wybraniec & Mizrahi,

11
2002). The red-fleshed fruit is becoming popular in Malaysia (Hoaet al., 2006) because
of its appealing red colour, unique shape, pleasant taste, as well as its high functional
properties (Phebe et al., 2009). The peel is red with green or red scales, and the red flesh
is described as juicy and delicate as well as contains plentiful of small and soft black seeds
well-dispersed (Jamilah et al., 2011). Jamilah et al. (2011) also stated that various dragon
fruit based products such as beverages, jams, and dried fruits are commercially produced
in Malaysia.
2.3.2 Composition
Dragon fruit comprises of its red and scaly mesocarp or peel, a red-purple flesh or
pulp as well as minute and well-dispersed black seeds. According to Luo et al., (2014),
the flesh of Hylocereus polyrhizus represents 90.66% of the total composition, of which
29.77% were triterpenoids and 16.46% were steroids. Its extract was characterized by a
high content of β-amyrin (15.87%), α-amyrin (13.90%), octacosane (12.2%), γ-sitosterol
(9.35%), octadecane (6.27%), 1-tetracosanol (5.19%), stigmast-4-en-3-one (4.65%), and
campesterol (4.16%).
Ruzainah et al., (2009) claimed that Hylocereus polyrhizus contains a good source
of antioxidant vitamins such as β-carotene and ascorbic acid (vitamin C) as well as water-
soluble fibre. Nurul and Asmah (2013) also reported phenolic and flavonoid content in
Hylocereus polyrhizus’ flesh. Dragon fruit has many black seeds and Ariffin et al., (2009)
had conducted analysis of fatty acids composition of the seed oils as shown in Table 2.1
and the seeds contains high percent of linoleic acid and a small percent of myristic acid.

12
Table 2. 1: Fatty acids composition in Hylocereus polyrhizus seeds
Component Quantity
Myristic acid 0.20%
Palmitic acid 17.90%
Stearic acid 5.49%
Palmitoleic acid 0.91%
Oleic acid 21.60%
Cis-vaccenic acid 3.14%
Linoleic acid 49.60%
Linolenic acid 1.21%
2.3.2.1 Pectin from Dragon Fruit
According to Levigne et al., (2002), pectin is the methylated ester of
polygalacturonic acid that contains 1,4-linked α-D-galacturonic acid residues. Dragon
fruit’s peel has high content of pectin. The peel consists of 22% of the whole fruit weight,
with moisture content of approximately 92.7% according to Jamilah et al., (2011). The
peel is often regarded as waste materials resulting and are normally discarded and may
cause an environmental problem, particularly water pollution. The peel is suggested to be
used in the production of pectin, which would then increase the potential return for the
dragon fruit juice processing industry (Ramli et al., (2012). The pectin extracted is
proposed as thickening agent or as moisturizer in cosmetic products (Stintzing et al.,
2002).
Ismail et al., (2012) reported 14.96% of pectin yield extracted with 0.03 M
hydrochloric acid, Tang et al., (2012) reported 10.40-16.76% of pectin yield extracted
with 40% citric acid and Chong et al., (2010) reported 14.86% of pectin yield extracted
with 0.1N citric acid. Table 2.3 shows proximate compositions of dragon fruit peel pectin
based on dry weight basis (g/100g) as reported by Muhammad et al., (2014).

13
Table 2. 2: Proximate compositions of dragon fruit peel pectin
Component Composition of dragon fruit pectin
(%)
Moisture 7.81 ± 0.10
Ash 4.73 ± 0.09
Total fat 0.04 ± 0.01
Protein 1.15 ± 0.03
Dietary fibre 62.76 ± 0.05
Others (by difference) 23.51 ± 0.06
*Data expressed as means ± standard deviation of triplicate analysis.
2.3.3 Quantification of Betacyanin Content
Wybraniec and Mizrahi (2002) had proposed the betacyanin content
quantification by using spectrophotometer at wavelength of 560nm against a blank of
deionized water. The betacyanin content is then calculated by applying following
equation;
𝐵𝑒𝑡𝑎𝑐𝑦𝑎𝑛𝑖𝑛 𝐶𝑜𝑛𝑡𝑒𝑛𝑡 (𝐵𝐶) = 𝐴∗𝐷𝐹∗𝑀𝑊∗1000
ɛ∗𝐿 ----- (Equation 2.1)
where,
A = adsorption value at the adsorption maximum (560nm)
DF = dilution factor
MW = molecular weight of betacyanin (550 g/mol)
ɛ = molar extinction coefficient of betacyanin (60,000 L mol-1 cm-1)
L = path length of the cuvette (1 cm)
14
2.4 Yarn
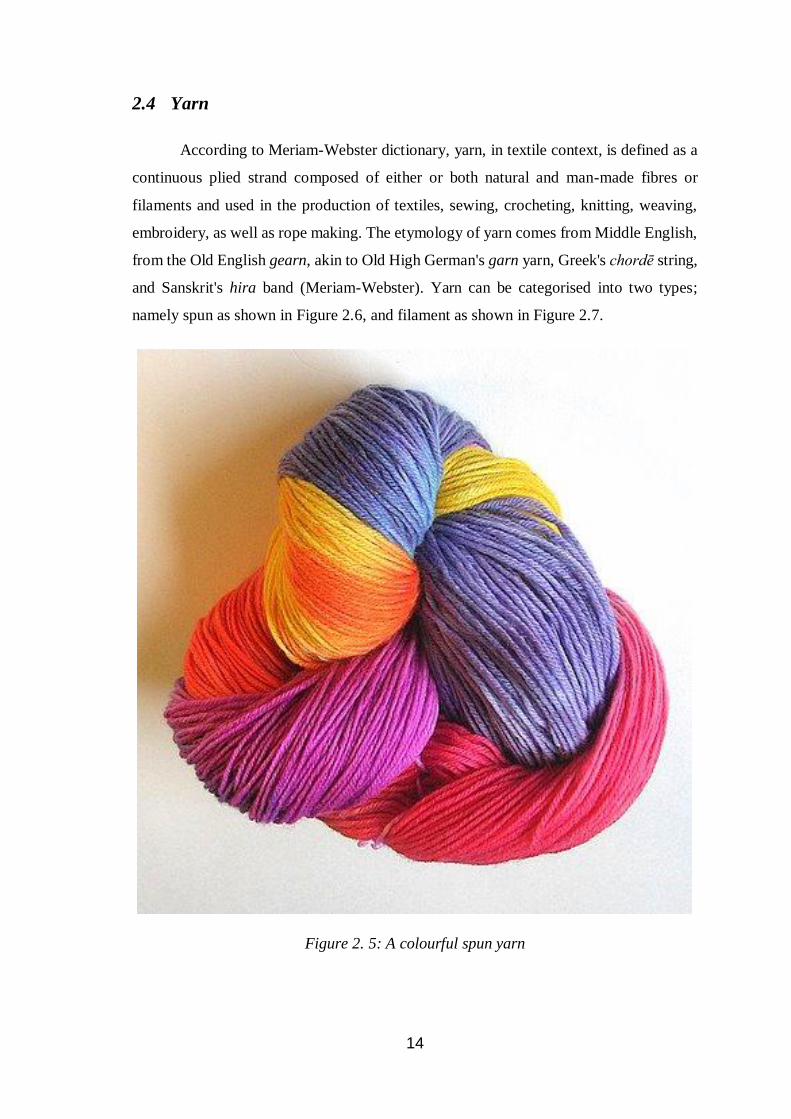
According to Meriam-Webster dictionary, yarn, in textile context, is defined as a
continuous plied strand composed of either or both natural and man-made fibres or
filaments and used in the production of textiles, sewing, crocheting, knitting, weaving,
embroidery, as well as rope making. The etymology of yarn comes from Middle English,
from the Old English gearn, akin to Old High German's garn yarn, Greek's chordē string,
and Sanskrit's hira band (Meriam-Webster). Yarn can be categorised into two types;
namely spun as shown in Figure 2.6, and filament as shown in Figure 2.7.
Figure 2. 5: A colourful spun yarn

15
Figure 2. 6: Filaments of yarns
2.4.1 Materials of Yarn
Materials where yarn can be made of can be categorised into two types, which
are; yarns made from natural fibres, and yarns made from synthetic fibres. Natural yarns
is usually spun because it is appropriate for their structures (Alagirusamy & Das, 2010).
They also require extra-careful handling than synthetic yarns because they can more
easily shrink, felt, stain, shed, fade, stretch, wrinkle, or be eaten by moths. Natural yarns
can be animal based such as fur and wool from alpaca, sheep, llama, and commonly silk,
and can be plant based such as bamboo, cotton, and corn fibres. Natural yarns have the
advantage of being slightly elastic and very breathable, while trapping a great deal of air,
making for a fairly warm fabric.
Synthetic fibres come in three basic forms: staple, tow, and filament. Staple is
defined as cut fibres, generally sold in lengths up to 120mm. While tow is a continuous
"rope" of fibres consisting of many filaments loosely joined side-to-side, filament is a
continuous strand consisting of anything from one filament to many. Synthetic fibres are


