Redalyc.Morpho-anatomy, imbibition, viability and germination of ...

HAL Id: tel-01575960https://tel.archives-ouvertes.fr/tel-01575960
Submitted on 22 Aug 2017
HAL is a multi-disciplinary open accessarchive for the deposit and dissemination of sci-entific research documents, whether they are pub-lished or not. The documents may come fromteaching and research institutions in France orabroad, or from public or private research centers.
L’archive ouverte pluridisciplinaire HAL, estdestinée au dépôt et à la diffusion de documentsscientifiques de niveau recherche, publiés ou non,émanant des établissements d’enseignement et derecherche français ou étrangers, des laboratoirespublics ou privés.
Adsorption and imbibition of binary liquids innanoporous solids
Sujeet Dutta
To cite this version:Sujeet Dutta. Adsorption and imbibition of binary liquids in nanoporous solids. Physics [physics].Université Rennes 1, 2016. English. �NNT : 2016REN1S129�. �tel-01575960�

ANNÉE 2016
THÈSE / UNIVERSITÉ DE RENNES 1 sous le sceau de l’Université Bretagne Loire
pour le grade de
DOCTEUR DE L’UNIVERSITÉ DE RENNES 1 Mention : Physique
Ecole doctorale (Sciences de la Matière)
Sujeet DUTTA Préparée à l’unité de recherche UMR 6251, IPR
Institut de Physique de Rennes UFR Sciences et Propriété de la Matière
Adsorption and imbibition of binary liquids in nanoporous solids
Thèse rapportée par : Sujeet Dutta Benoit COASNE Chercheur, CNRS, Laboratoire Interdisciplinaire de Physique / rapporteur
Jean LE BIDEAU Professeur, Université de Nantes / rapporteur et soutenue à Rennes le 2 Decembre 2016 devant le jury composé de :
Benoit COASNE Chercheur, CNRS, Laboratoire Interdisciplinaire de Physique / rapporteur
Jean LE BIDEAU Professeur, Université de Nantes / rapporteur
Patrick HUBER Principal investigator, Technische Universität Hamburg-Harburg / examinateur
Denis MORINEAU Directeur de recherche, CNRS, Université de Rennes 1 / examinateur
Ronan LEFORT Maîtres des conférences, Université de Rennes 1 / directeur de thèse

ii

Table of contents
Chapter 1Introduction
I Confinement effects at equilibrium . . . . . . . . . . . . . . . . . . . . . . . 3A Structure and thermodynamics . . . . . . . . . . . . . . . . . . . . 3
A.1 Effect on melting point of pure liquids . . . . . . . . . . . 3A.2 Effects on density . . . . . . . . . . . . . . . . . . . . . . . 4
B Effects on molecular dynamics . . . . . . . . . . . . . . . . . . . . . 5B.1 Glass-transition temperature . . . . . . . . . . . . . . . . 5B.2 Finite size and surface effects . . . . . . . . . . . . . . . . 6B.3 Self-diffusion dynamics . . . . . . . . . . . . . . . . . . . . 8
C Confinement effect on binary liquids . . . . . . . . . . . . . . . . . 8II Confinement systems out of equilibrium . . . . . . . . . . . . . . . . . . . . 11
A Adsorption phenomena . . . . . . . . . . . . . . . . . . . . . . . . . 11B Imbibition phenomena . . . . . . . . . . . . . . . . . . . . . . . . . 15
III Thesis case . . . . . . . . . . . . . . . . . . . . . . . . . . . . . . . . . . . 20A Choice of model system . . . . . . . . . . . . . . . . . . . . . . . . 20
A.1 Binary liquids without miscibility gap . . . . . . . . . . . 20B Porous materials . . . . . . . . . . . . . . . . . . . . . . . . . . . . 20C Properties of bulk TBA:TOL mixtures . . . . . . . . . . . . . . . . 22
C.1 tert-butyl alcohol (TBA) . . . . . . . . . . . . . . . . . . . 22C.2 Toluene (TOL) . . . . . . . . . . . . . . . . . . . . . . . . 22C.3 Hydrogen-bonding network in TBA . . . . . . . . . . . . . 24C.4 Dynamics of bulk TBA:TOL mixtures . . . . . . . . . . . 25C.5 Binary liquid-gas equilibria . . . . . . . . . . . . . . . . . 26C.6 Surface tension measurements of binary liquid mixtures . . 28
D Properties of host matrices . . . . . . . . . . . . . . . . . . . . . . . 29
iii

Table of contents
D.1 MCM-41 . . . . . . . . . . . . . . . . . . . . . . . . . . . 29D.2 SBA-15 . . . . . . . . . . . . . . . . . . . . . . . . . . . . 29D.3 CMK-3 . . . . . . . . . . . . . . . . . . . . . . . . . . . . 29D.4 Vycor R© . . . . . . . . . . . . . . . . . . . . . . . . . . . . 30D.5 Brief description of synthesis techniques . . . . . . . . . . 30D.6 Microstruture . . . . . . . . . . . . . . . . . . . . . . . . . 31D.7 Crystalline structure . . . . . . . . . . . . . . . . . . . . . 32D.8 Pore size, volume and specific surface area . . . . . . . . . 35D.9 Summary of properties . . . . . . . . . . . . . . . . . . . . 37
E State of the art . . . . . . . . . . . . . . . . . . . . . . . . . . . . . 37IV Organization of thesis . . . . . . . . . . . . . . . . . . . . . . . . . . . . . . 40
Chapter 2Nuclear Magnetic Resonance study of binary liquids in nanoconfinement
I Scientific background and motivation . . . . . . . . . . . . . . . . . . . . . 50II Fundamentals of NMR . . . . . . . . . . . . . . . . . . . . . . . . . . . . . 51III 1H Magic Angle Spinning NMR (1H MAS NMR) of TBA and TOL mix-
tures in nanoconfinement . . . . . . . . . . . . . . . . . . . . . . . . . . . . 52A Motivation for the application of MAS NMR . . . . . . . . . . . . . 52B Experiment . . . . . . . . . . . . . . . . . . . . . . . . . . . . . . . 54C Results and discussion . . . . . . . . . . . . . . . . . . . . . . . . . 55
IV Pulsed Field Gradient Stimulated Echo NMR(PFG-STE NMR) . . . . . . . . . . . . . . . . . . . . . . . . . . . . . . . . 58A Brief description . . . . . . . . . . . . . . . . . . . . . . . . . . . . 58B Experiment . . . . . . . . . . . . . . . . . . . . . . . . . . . . . . . 59C Results and discussion . . . . . . . . . . . . . . . . . . . . . . . . . 60
C.1 MCM-41 . . . . . . . . . . . . . . . . . . . . . . . . . . . 60C.2 SBA-15 . . . . . . . . . . . . . . . . . . . . . . . . . . . . 62
V Conclusion . . . . . . . . . . . . . . . . . . . . . . . . . . . . . . . . . . . . 67
Chapter 3Dynamic vapour sorption study of binary gas adsorption in nanopores
I Scientific background and motivation . . . . . . . . . . . . . . . . . . . . . 72II Fundamentals of vapour sorption . . . . . . . . . . . . . . . . . . . . . . . 73III Experimental procedure . . . . . . . . . . . . . . . . . . . . . . . . . . . . 74
iv

IV MCM-41: Results and discussion . . . . . . . . . . . . . . . . . . . . . . . 76A Low partial pressure region . . . . . . . . . . . . . . . . . . . . . . 76
A.1 Calculating the grand canonical partition function . . . . 76A.2 The multi-component BET model . . . . . . . . . . . . . . 79A.3 Composition of the first monolayer . . . . . . . . . . . . . 82A.4 Application of the Multi-component BET to adsorption
isotherms . . . . . . . . . . . . . . . . . . . . . . . . . . . 82B Capillary Condensation . . . . . . . . . . . . . . . . . . . . . . . . . 84C High partial pressure region . . . . . . . . . . . . . . . . . . . . . . 87
V CMK-3: Results and discussion . . . . . . . . . . . . . . . . . . . . . . . . 88A Low-partial pressure region . . . . . . . . . . . . . . . . . . . . . . 89B Capillary condensation . . . . . . . . . . . . . . . . . . . . . . . . . 92C High Partial Pressure region . . . . . . . . . . . . . . . . . . . . . . 94
VI Conclusion . . . . . . . . . . . . . . . . . . . . . . . . . . . . . . . . . . . . 96
Chapter 4Spontaneous imbibition of binary liquids into a nanoporous network
I Scientific background and motivation . . . . . . . . . . . . . . . . . . . . . 104II Fundamentals of spontaneous imbibition . . . . . . . . . . . . . . . . . . . 105III Experiments and results . . . . . . . . . . . . . . . . . . . . . . . . . . . . 106
A Spontaneous imbibition study through gravimetry . . . . . . . . . . 106A.1 Experiment . . . . . . . . . . . . . . . . . . . . . . . . . . 107A.2 Results . . . . . . . . . . . . . . . . . . . . . . . . . . . . 108
B Spontaneous imbibition study through neutron radiography . . . . 112B.1 Experiment . . . . . . . . . . . . . . . . . . . . . . . . . . 114B.2 Results . . . . . . . . . . . . . . . . . . . . . . . . . . . . 116
IV Conclusion . . . . . . . . . . . . . . . . . . . . . . . . . . . . . . . . . . . . 126
Chapter 5General Conclusion and future perspectives
v

Table of contents
vi

1
Introduction
1

Chapter 1. Introduction
Heterogeneous systems consisting of liquid-gas, solid-gas, solid-liquid interfaces havebeen long studied and applied to vast array of technological use in areas such as petroleumrefining68, catalysis71, water desalination56, pharmaceuticals6 and so on. Gradually thecomplexity of such systems kept increasing with the advent of materials engineered to pro-vide greater surface area of activity and functionality. In the class of heterogeneous sys-tems one of the best known are porous materials. Zeolites and metal-organic frameworks,which are often functionalized for achieving specific goals are widely used in chemicalindustry, and nowadays with a growing focus on environmental issues finding applicationin CO2 storage and filtration17,22,43 of industrial gases are good examples of the growthin scope of porous materials with ultra-high specific surface areas.
Nanoporous materials with pore diameters ranging from 2 − 50nm, comparable to afew molecular layers are quite well known and studied widely. It has been demonstratedpreviously that confining liquid or gas molecules in such nanopores with specific geometriesat the nanoscale could lead to great modification in physical properties of the confinedmolecules compared to their free bulk state. The pore architecture and competitionbetween liquid-wall and liquid-liquid molecular interactions (Van der Waals, hydrogen-bonding, π − π stacking etc) might induce ordering and phase separation or completedisorder. Confinement induced structuration have been shown to cause modification incrystallization and glass transition temperatures of the confined species57. Thus the notionof average physical properties such as density, viscosity or surface tension of bulk liquidsneeds to be applied with caution while dealing with nanoconfined systems.
Confinement induced structuration have been shown to cause modification in dynamicproperties from the sub-nanometre length scale (conformational changes in moleculargroups) to micrometre scale (translation self-diffusion)38. With the availability of everadvancing methods for characterization of soft-matter, confinement induced phenomenahave been investigated quite thoroughly for single-component systems. The current sci-entific interest tends towards the study of multi-component systems with ever increasingcomplexity. While a lot of questions have been addressed well for systems showing a misci-bility gap, much remains desired to understand the role played by competing liquid-liquidand liquid-wall interactions in the structure and dynamics of multi-component systemsshowing a negligible miscibility gap.
These questions extend to two kind of systems, one which are at thermodynamic equi-librium, dynamics of which characterized by molecular vibrations, rotations and transla-tional self-diffusion and other which are out of equilibrium characterized by flow propertiesof confined materials through nanochannels, where the pore architecture and chemical en-vironment might play a role in modifying the flow characteristics in confinement comparedto bulk state. In the current chapter we discuss the various confinement induced phenom-ena occurring at nanoscale discovered so far and the scientific case of this thesis whichattempts to answer some of the unanswered questions in this field.
2

I. Confinement effects at equilibrium
I Confinement effects at equilibrium
A Structure and thermodynamics
A.1 Effect on melting point of pure liquids
The best known formalism describing the change in melting of a confined liquid from itsbulk phase is given by the Gibbs-Thomson equation61.
∆Tm = 4σSLTmd∆Hfρs
Where ∆Tm = Tconfined−Tbulk, the melting temperatures in confined and bulk phasesrespectively, σSL is the energy of interaction between confined liquid and pore-wall. Tm isthe melting temperature of the bulk liquid, ∆Hf is the liquid’s enthalpy of fusion and ρs isthe solid density. d is the diameter of pore with which ∆Tm has an inverse proportionalitydependence.
The above formalism have been demonstrated well for confined organic liquids incontrolled pore glasses (CPG)40 as shown in the figure 1.1 of ∆Tm versus 1/d values. Thisformalism has been quite successful in confined systems where the pore-diameter is greaterthan 20 times the Van der Waals diameter of the confined molecule69 where the liquid-liquid intermolecular interactions reminiscent of bulk-like conditions dominate. Howeveras we proceed to smaller pores deviation from Gibbs-Thompson formalism begins as theliquid-wall interactions begin to dominate modifying the crystallization characteristicssignificantly and leading to formation of amorphous glassy phases which shall be discussedin subsequent sections.
Figure 1.1: Variation of ∆Tm versus pore diameter for various organic liquids confined incontrolled pore gasses.40
3

Chapter 1. Introduction
A.2 Effects on density
As we approach to pore sizes for confinement close to a few nano-metres, we are reachinga spatial dimension equivalent to a few molecular layers. The notion of average propertiessuch as density or viscosity becomes less obvious at such scales unlike their free bulkstate as it strongly depends on the structural characteristics of confined liquids which arecontrolled by the pore architecture and surface properties.
By a combination of vapour sorption and neutron scattering, the density of tolueneconfined in various porous silica matrices and its influence on the glass transition temper-ature obtained by complementary calorimetry experiments has been reported as shownin figure 1.2 and the result summarized in a table below the figure9.
Figure 1.2: Relative density change of toluene in confinement with respect to bulk plottedagainst temperature, the point of deviation from monotonic density decrease indicatesglass transition temperature. The values of density and glass transition temperature oftoluene in different nanoporous silica matrices are listed in the table below9
We observe here a general trend of decrease in density with decreasing pore diameter,the results are most pronounced as we approach a pore size of ≈ 2 nm which is basicallyequivalent to about two molecular layers of toluene. An increase in free volume due togreater steric hindrance might be attributed to the difficulty in packing molecules closerto each other and thus decrease in density. We find that with decreasing pore size goeshand-in-hand an increase in glass transition temperature which the authors have reportedto be due to reduction in mean-square displacement of molecules with decreasing porediameter.
4

I. Confinement effects at equilibrium
B Effects on molecular dynamicsB.1 Glass-transition temperature
Depending on the rate of cooling and structural characteristics of a molecule, liquids mayundergo crystallization or form a disordered system with exceptionally slow dynamics.This state known as a supercooled liquid is in a metastable state which finally reaches toan equilibrium state called glassy state. The relaxation time of glassy state far exceedstypical experimental observation times.
Unlike crystallization or melting which are first-order and represent a thermodynamicchange, glass transition is a kinetic process and second-order changee. Figure 1.3 shows thedifference between glass transition temperature or Tg and the crystallization temperatureTm and the effect of cooling rate on Tg 18.
Figure 1.3: Comparison of crystallization and glass transition phenomena shown as changeof volume enthalpy as a function of temperature. The effect of two different cooling rates(a and b) respectively and its influence on Tg.18
Based on their relaxation times, glass-forming liquids are characterized as "strong"liquids, exhibiting Arrhenius behaviour or "fragile" liquids which have an increased acti-vation energy of α-relaxation time in the vicinity of glass transition showing deviationsfrom Arrhenius behaviour. This degree of deviation from Arrhenius behaviour is knownas "Angell’s fragility" (f)18, given by the following equation.
f = d(logτ)d(Tg/T ) |T=Tg
Where τ is the relaxation time. Figure 1.4 shows the fragility of different liquidsbased on Angell’s model and classifies them into strong and fragile. We notice thatorganic liquids tend to be much more fragile, the category of interest in the nanoconfinedsystems to be discussed in this thesis.
5

Chapter 1. Introduction
Figure 1.4: Fragility of various liquids expressed as log (viscosity) as a function of Tg/T 18
One of the best known models to describe behaviour of liquids around Tg was givenby the Adam-Gibbs model5, according to which a liquid’s relaxation time depends on itsentropy of configuration such that the activation energy of transition (∆EA) is inverselyproportional to the entropy of configuration (Sconfig)23.
∆EA ∝1
Sconfig
According to the model, any molecular re-configuration which is typical in a transi-tion, involves rearrangement of molecules belonging to a subsystem called "cooperativelyrearranging region" (CRR), the dynamics of which are characterised by a distance knownas cooperativity distance. Thus the glassy dynamics of a liquid can be influenced stronglyby the finite sample size if it coincides with the cooperativity length, an occurrence notuncommon for liquids in nanoconfinement.
B.2 Finite size and surface effects
As we keep decreasing the volume of a glass-forming liquid such that its length scalebecomes smaller than a typical cooperatively rearranging region, the activation energy ofcooperative relaxation is supposed to decrease compared to the bulk state because thenumber of particles involved are lesser. The α-relaxation time τα is related to activationenergy of cooperative relaxation as23
EA(T )T
∝ log[τατ0
]Thus τα relaxation time decreases with activation energy, indicating faster molecular
dynamics as a consequence of finite size. The effects on glass-transition temperature have
6

I. Confinement effects at equilibrium
been quite inconclusive so far and depending on the system, it might either increase,decrease or stay the same. Figure 1.5 (a) shows the trend of monotonic decrease in Tg 41with decreasing pore-size in controlled pore glasses for two organic liquids while figure1.5 (b) shows a non-monotonic change from decreasing to increasing for Tg of tolueneconfined in ordered silica nanopores MCM-41 and SBA-1558.
Figure 1.5: (a) Monotonic decrease in Tg of o-terphenyl and benzyl alcohol in controlled-pore glasses41 (b) Non-monotonic change in Tg of toluene in MCM-41 and SBA-15 poresshown by the points. The arrows represent region of glass transition.58
The role played by surface topology on the glassy dynamics has been previously inves-tigated with molecular dynamics simulations65. Surface roughness of confinement wallswas found to induce greater relaxation than bulk state, while a smaller relaxation timewas reported for smooth walls. In either case, relaxation dynamics approached closer tobulk-like behaviour as we go farther from confining walls and towards the centre.
The interplay of finite size and surface effects could thus play a strong role in governingthe glass transition temperatures, the smaller are the pores, greater is the expected devi-ation from bulk glassy dynamics. However the positive or negative deviation shall dependon the surface roughness. Figure 1.5(a) and (b) are two opposite cases in this regard. Theincrease in Tg upon decreasing pore size in (b) indicates the existence of smooth pore wallsfor the mesoporous silica used to confine toluene, which in this case is known to be truefor the material MCM-41, which has cylindrical, long and quite smooth pore walls. Onthe other hand, in the case of CPGs (a), we notice the opposite occurence, i.e. decreasein the Tg, which had been proposed to be as a result of the molecular structure of theconfining liquids, which in this case due to their bulky nature might be harder to packtogether, resulting into an increase in free volume of the confined liquid and eventually adepression in Tg.
7

Chapter 1. Introduction
B.3 Self-diffusion dynamics
Its not only the glassy dynamics of molecules which is affected by finite size effects but alsothe self-diffusion dynamics i.e. molecular motion concerning displacement of moleculesfrom their positions. In figure 1.6 we see the decrease of diffusivity (translational diffusioncoefficient) of cyclopentane under confinement in MCM-41 silica nanopores found bynuclear magnetic resonance measurements, compared to its bulk state, a gap which onlybroadens as the temperature approaches the melting point7.
Figure 1.6: Comparison of diffusivity of bulk cyclopentane (hollow diamonds) and underconfinement in MCM-41. Solid black circles represent complete filling, while triangles andsquares represent partial filling7.
The effect of nanoconfinement does not always necessarily lead to a slowing down ofdynamics. Stray Field Gradient 15N NMR diffusometry of pyridine confined in MCM-41silica pores reveals that a fast exchange between pyridine molecules in the monolayerand in the core exceeds the diffusion coefficient of bulk pyridine24. Figure 1.7 shows theschematic representation of diffusion process.
C Confinement effect on binary liquidsWe now move closer to the subject of this thesis, i.e. addressing the fundamental issuesregarding effects of nanoconfinement on binary liquid mixtures. Two types of systemscome into picture here, one where a partial miscibility gap between the mixture compo-nents exists and the other where no miscibility gap exists. Of the two, the former one hasbeen better explored in previous works.
From a structural point of view triethylamine(TEA)/water binary liquid mixtures,which show a miscibility gap, were confined in 60 nm anodized aluminium oxide were
8

I. Confinement effects at equilibrium
Figure 1.7: Pyridine confined in an MCM-41 pore. (a)-(c) showing increasing pore fill-ing. (1) Surface diffusion (2) Adsorption and desorption (3) Isotropic diffusion, exchangebetween monolayer and core24.
investigated using small angle neutron scattering46. The analysis of neutron scatteringform factor showed presence of inhomogenities in the medium filling up the pores whichwas best explained by a model of phase separation of water and TEA into a core-shellstructure, such that a few nanometres thick water layer or shell adsorbs on the pore-wallwhile TEA makes up the core. Figure 1.8 shows the best fits of neutron scattering formfactor of TEA/water mixtures confined in AAO nanopores by the model of core-shellassembly as shown in the accompanying diagram.
Figure 1.8: Neutron scattering form factor of TEA/D2O mixture in AAO at three differenttemperatures shown by open circles. The solid lines show best fits based on a TEA-watercore-shell structure while the dashed line shows fit based on model of water-TEA core-shell. On the right is a diagrammatic representation of core-shell assembly inside AAOnanopores.46
A system of water-isobutyric acid (iBA) has been shown to have different extent ofmiscibility based on the temperature and mixture composition67. 1H pulsed field gradientNMR measurments on water-iBA mixtures confined in MCM-41 pores revealed a bi-exponential decay of magnetization as the system approached closer to 39 ◦C as shown infigure 1.9 (a), indicating the existence of two populations with different dynamics. Theexperimental observations were interpreted as evolution of the mixture from a completely
9

Chapter 1. Introduction
miscible system at low temperatures to a phase-separated one at higher temperature asshown in figure 1.9(b).
(a)
(b)
Figure 1.9: (a)Stimulated spin-echo attentuation from PFG NMR. From 39 ◦C and abovethe sigle component echo-attenuation is replaced by a two-component one.(b)Variousphases of isobutyric acid-water mixture confined in controlled pore glass while transition-ing from (a) liquid mixture of isobutyric acid and water at temperatures below 39 ◦C to(d) separation of components to a two-phase structure. Water along the pore wall, whileisobutyric acid is in the centre.67
The available literature on confinement induced effects on binary liquids showing a lowmiscibility gap is relatively scarce when compared to the cases discussed above. Water-glycerol mixtures confined in MCM-41 pores of 2.1 nm diameter, i.e. roughly equivalent towidth of two molecular layers have been investigated by differential scanning calorimetry(DSC) measurements66. DSC scans reveal that the glass transition temperature changedwith changing water composition until roughly 20% by wt. of water in the solution,beyond which it barely changes with increasing water concentration as shown in figure
10

II. Confinement systems out of equilibrium
1.10, unlike the bulk mixtures where water has a plasticization effect that causes Tg todecrease with increasing concentration. The authors report the likelihood of a phaseseparation between water and glycerol, such that water owing to its greater ability offorming hydrogen-bonding interactions with the silica pore surface, preferentially adsorbson the pore wall and the glass-transition of system under confinement is governed byglycerol in the core. At the same time, the broadening of Tg was explained by breakingdown of glycerol-clusters.
Figure 1.10: DSC scans of water-glycerol systems confined in MCM-41 nanopores ofdiameter 2.1 nm.66
We shall now discuss systems different that ones discussed so far in one aspect that,instead of being in a static thermodynamic equilibrium they are out of equilibrium.
II Confinement systems out of equilibrium
A Adsorption phenomenaBesides systems in static equilibrium which relate very well to nanoconfined liquids,equally interesting are the issues revolving around systems in dynamic equilibrium, bywhich in this section we particularly refer to adsorption phenomena. Gas molecules froman infinite reservoir occupy a given surface simply through physical interactions, suchthat at any give time there is an exchange of molecules between the gas phase and theadsorbed phase giving rise to a dynamic equilibrium as shown in figure 1.1134.
As the relative pressure of the adsorbing gas or its chemical potential increases, greaternumber of molecules are adsorbed on the surface.
One of the most widely studied adsorption models is the Langmuir model developedby Irvin Langmuir in 1916 applied to adsorption of single monolayer45. This model wasmade for adsorption on a flat surface, assuming a certain fixed number of sites available for
11

Chapter 1. Introduction
Figure 1.11: Schematic representation of the dynamic equilibrium process of adsorption.34
adsorption, each site capable of holding only one adsorbing particle/molecule and with nointeractions between individual sites. From a statistical physics approach21, the averagenumber of particles adsorbed on the surface of a substrate by Langmuir model gives us
〈N〉 = N0 × x× C1 + Cx
Where N0 is the number of sites available for adsorption C = exp ε
KBTalso known
as the Langmuir constant, x = P/P0 is the partial pressure of the adsorbing gas and ε isthe energy per adsorbed particle. Useful theoretical contributions have been made in theunderstanding of single component as well as multi-component monolayer adsorption48.The use of an extended Langmuir isotherm has been reported to interpret binary gasmixture adsorption in graphitized carbon black STH-2. The extended Langmuir isothermmodel assumes an ideal mixture with no interaction between adsorbed components12. Theequation is written as:
〈Ni〉 = N0i × Ci × yi × P1 + CiyiP + Cj(1− yi)P
Where 〈Ni〉 is the number of particles adsorbed of the ith component, N0i is the totalnumber of available sites for adsorption for component i, Ci and Cj are the Langmuirconstants for the two components respectively, while P is the pressure of adsorbing gasmixture. In figure 1.12 (a) we see the fit of adsorption of simple gases in STH-2 by Lang-muir adsortion isotherm, while in figure 1.12 (b) is presented the amount of CH4 adsorbedin STH-2 in a CH4 − C2H6 mixture48.
The authors observe a deviation of the fit from experimental points and attribute itto be a consequence of nonideality of the adsorbed phase mixture, a deviation from oneof the assumptions. Another important reason could possibly be the difference in value ofN0i, such that N0i 6= N0j which leads to differing total adsorption capacities for the twocomponents because of their unequal molecular diameters.
Most adsorption processes however are better described by the Brunauer, Emmett
12

II. Confinement systems out of equilibrium
(a)
(b)
Figure 1.12: (a)Adsorption isotherms of methane, carbon-dioxide and ethane shown insymbols. Fit of isotherms by the Langmuir model of monolayer adsorption shown bysolid line. (b) Amount of methane adsorbed (square points) in STH-2 in a binary gasadsorption of methane and ethane. Dashed line is the fit of experimental points usingextended Langmuir model, while solid line is the fit of Ideal Adsorbed Solution Theorymodel.48
and Teller adsorption isotherm model, popularly known as the BET theory14. The BETtheory has the same basic assumptions as the Langmuir model, except that adsorptionis not confined anymore to the first monolayer and in fact consists of the presence ofan adsorbed monolayer above which exists a liquid film of multiple molecular layers inequilibrium with the gas reservoir. The BET model is discussed more in detail in chapter3. The average number of adsorbed particles on a substrate consisting of N0 equivalentsites is given by:
〈N〉 = N0xC
(1 + (C − 1)x)(1− x)
13

Chapter 1. Introduction
Where C = exp(ε0 − εlKT
)is the BET constant and x = P/P0 is the partial pressure of
the adsorbing gas with respect to a reference pressure. ε0 and εl are the energy particleof the one adsorbed directly on the surface and one constituting the liquid-film above itrespectively.
Applicable only to low partial pressures where formation of first monolayers wouldtake place for adsorption in porous materials, the BET theory is used widely to charac-terise porous materials, basically to obtain specific surface areas of such materials. Hill(1946) made one of the earliest approaches in understanding multimolecular adsorptionby extending the BET theory to a multicomponent system, assuming adsorbed phasemixture to be ideal and the number of molecular layers which could form on a substrateto be finite instead of infinite as assumed in BET theory for single component system.
S. Amali et al.8 utilized Hill’s multimolecular adsorption model35 in order to interpretthe adsorption of toluene-water mixtures on a certain soil known as Yolo silt loam. Siltbeing porous in nature has the ability to adsorb gases such as toluene and increase soiltoxicity.
Figure 1.13 shows the fit of multimolecular BET (MBET) adsorption model withexperimental points showing the amount of volatile organic compound adsorbed in aVOC-water binary gas mixture8. The fraction of water is represented in terms of relativehumidity (RH). Fits of the curves help obtain heat of adsorption of each component,weight of the monolayer adsorbed and the number of adsorbed layers, denoted here byn. We note here that the MBET model either underestimates or overestimates the quan-tity of VOC adsorbed with significant deviation at high relative vapour pressure of theVOCs. Thus the need for a better model to understand adsorption of multicomponentgas mixtures remains highly desirable to interpret such complex systems.
Figure 1.13: Amount of toluene and trichloro ethylene (TCE) adsorbed on silt loam inbinary systems of toluene-water and TCE-water. Squares and triangles represent experi-mental points at different values of RH, solid lines are multimolecular BET (MBET) fitsof experimental points. The value of n, number of adsorbed monolayers, is achieved frombest fit of the experimental points.8
The competition between local (Van der Waals, hydrogen bonds) and long range (elec-
14

II. Confinement systems out of equilibrium
trostatic) interactions between adsorbed liquid phase molecules and host matrix could betuned to achieve self organization and structuration at the nanoscale as shown in previousexamples of binary liquids in confinement. This has raised considerable interest in thethermodynamics of phase separation under nanoconfinement.
M.W. Maddox et al. developed Grand Canonical Monte Carlo simulations to predictbinary mixture adsorption of equimolar methane/nitrogen and methane/propane mixturesin bucky-tubes which are carbon nanotubes with pore width ≈ 5 nm53. It was foundthat the component with stronger specific interaction with pore wall was preferentiallyadsorbed over the other which was qualitatively in agreement with the Ideal AdsorbedSolution Theory (IAST). Figure 1.14 is a plot of selectivity of propane in the adsorptionof methane/propane adsorption in bucky tubes.
Figure 1.14: Selectivity of propane in propane/methane binary gas adsorption in doublebuckytube with pore size 4.8 nm. Propane adsorption is more selective at lower pressure.53
Jeong-Ho Yun et al. report a combination of experimental and theoretical approachto predict binary gas adsorption of alkane mixtures of methane and ethane in MCM-41at different binary gas compositions74. IAST and GCMC could very well predict theadsorption isotherms. Figure 1.15 shows the adsorption isotherms of pure componentsand of mixture at various compositions.
We now proceed to discuss some of the developments made in the area of systems inconfinement but completely out of thermodynamic equilibrium.
B Imbibition phenomenaThe study of flow and transport phenomena through macroscopic channels has beenwell explained since decades. A transport of gas molecules through porous matrices iswell explained by Knudsen diffusion. The capillary rise action of liquids in macroscopiccapillaries is governed by a balance between capillary pressure (given by Young-Laplaceequation? and hydrostatic pressure acting upon it given by31.
∆p = 2σ cos θr
= ρgh (1.1)
15

Chapter 1. Introduction
Figure 1.15: Adsorption of methane (CH4) and ethane (C2H6) binary gas mixtures inMCM-41. The adsorption of pure components are denoted by NCH4 and NC2H6 , whilethe mixture adsorption is denoted by NT . Open symbols represent different mixturecompositions while black dots and solid line represent calculated isotherm from GCMCand IAST theories respectively.74
Where ∆p is the capillary pressure, σ is the surface tension of the liquid, r is the poreradius, ρ is the density of the liquid, g = 9.8 m/s2 is the acceleration due to gravity andhis the rise in liquid level inside the capillary.
The volumetric flow rate of a liquid through a porous material of thickness d andpressure difference ∆p across its two ends is given by the Darcy equation16 as follows:
V = −κA∆pηd
(1.2)
Where κ = φ08τ r
2 is a proportionality constant known as the hydraulic permeability of
16

II. Confinement systems out of equilibrium
the material31. φ0 is the volume porosity of the matrix and τ is known as tortuosity ofthe pores.
Porous materials such as Vycor, a monolithic nanoporous silica, do not have straightcylindrical channel, instead there exists a network of meandering pores distributed isotrop-ically. Tortuosity is a structural parameter of the matrix and is crudely defined as theratio of total length of a curved path (lC) to the distance between its two ends (lE).
τ = lClE
Obviously τ > 1 and thus the volumetric flow rate is reduced to Vτ. Considering that
a porous block filled up to a height h is equivalent to a fully filled block of thickness h,we can replace the thickness of porous block in equation 1.2 with the rise level of liquidgiven by the Young-Laplace equation (1.1) and inserting the result in equation 1.2 by theexpression we have
V =(φ0
8τ r2)(2Aσ cos θ
ηrh
)The volumetric flow rate can also be written in terms of the time dependent rise of
liquid level as?
h(t) =√σ cos θ2φaη
I√t (1.3)
Such dependence of rise level on the square root of time is well understood for acentury already11,52,70. However the most common reference to it is by the name ofLucas-Washburn law20,72 and shall be called as such to keep in line with the usage inmajority of available literature. Here we notice two new terms, φa or the apparent porosityaccounting for the reduction in porosity caused by rapid adsorption of at least a monolayerof water adsorbed from atmospheric moisture in the form of humidity. Considering thehighly hydrophilic nature of silica, this is a well-known occurring and has to be taken intoaccount while interpreting experimental observations37.
The term I is known as imbibition strength31. It depends only on the structuralcharacteristics of the porous matrix and is given by:
I = r2h
r
√φ0
rLτ(1.4)
Where rh and rL are known as the hydrodynamic pore radius and Laplace radius re-spectively. rh is associated to the stick and slip flow of liquids through pores19 and is theradial distance from centre of pore to the point where velocity of liquid layers is equal tozero. rL is the reduced radius of the pore due to formation of pre-adsorbed water layer(s)due to ambient humidity.
Given the cross-sectional area A of a porous block is constant, equation 4.2 could bere-written in terms of mass gain as a function of time.
17

Chapter 1. Introduction
m(t) = ρA
√φaσ cos θ
2η I√t (1.5)
Thus we find that both rise level and mass gain due to spontaneous imbibition ofliquid into a porous block increases as a square root of time multiplied by a pre-factor.
h(t) = CH√t and m(t) = CM
√t
Where CH =√
σ cos θ2φaη
I and CM = ρA√
φaσ cos θ2η I
Thus CH and CM give a measure of flow dynamics of liquids, their values being de-pendent on the physical properties of the liquids at a given temperature as well as thestructural properties of the porous block.
As we approach the nanoscale (2− 50nm), the size of capillaries are already just somemolecular layers wide. Thus one may expect pore architecture and chemical environmentto cause a modification in the flow properties from the above discussed Lucas-Wasburnflow dynamics applicable for macroscopic scale. However it has been well investigatedin a number of different studies on imbibition of single-component liquids that the LC-dynamics hold true equally well even for flow through nanopores.
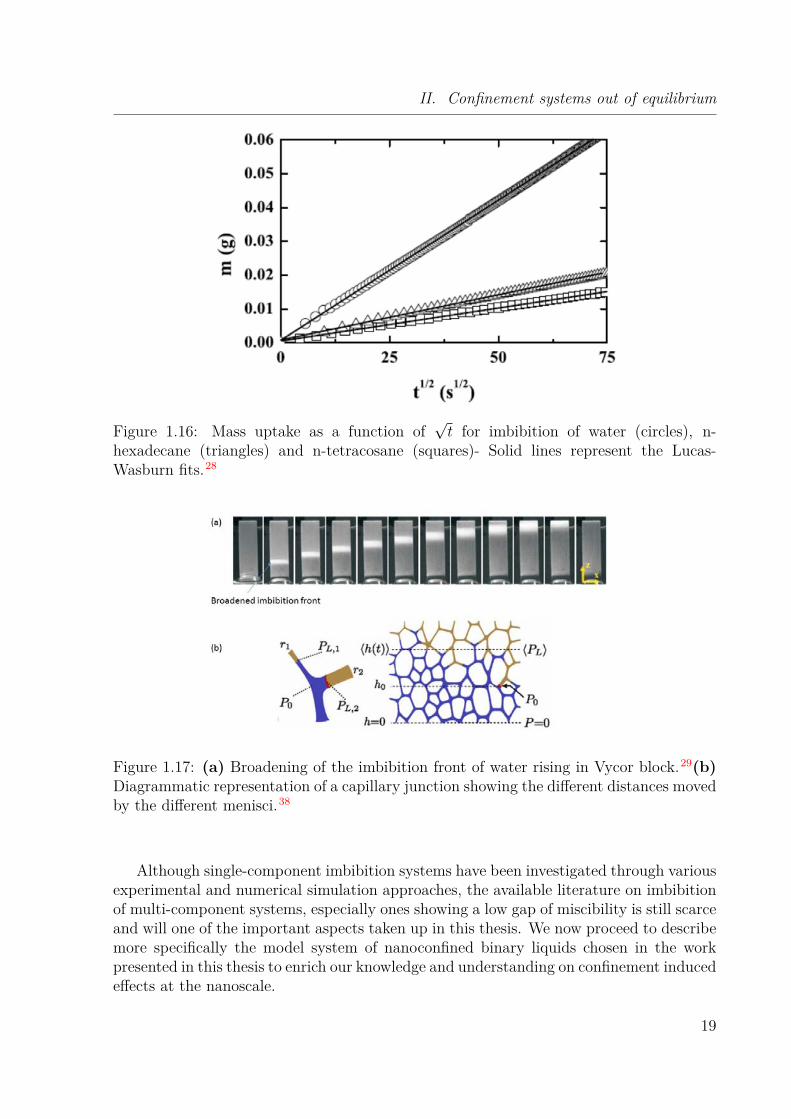
Simon Gruener et al. have thoroughly investigated the spontaneous imbibition of waterand certain rod-like liquid crystal(namely 80CB) in Vycor with pore diameter of 7-8 nm28.Dynamics of capillary invasion were found to exhibit square root of time dependence givenby the Lucas-Washburn law. Figure 1.16 shows the imbibition of water and two straight-chain alkanes into Vycor monitored by mass uptake of the liquids as a function of
√t.
The mass gain for all experiments increased proportionally to√t and the proportionality
constant, also known as imbibition coefficient could be simply calculated fromm versus√t
curves. Although we would expect bulk liquid properties such as density, surface tensionand viscosity to be subjected to finite size and surface effects under nanoconfinement, theflow properties could be easily predicted based on laws applied at the macroscopic scale.
However, very interesting phenomena have been reported for imbibition through nano-pores which is unlikely to occur at the macroscopic scale. The rise level of water imbibitioninto a Vycor block was observed using visible light and neutron radiography and it wasfound that the imbibition front was broadened instead of being one sharp interface andthat this broadening width itself was found to increase as a
√t29. The explanation of
such observation was provided using molecular dynamics simulations using a pore-networkmodel29,64. At a junction of nano-capillaries of unequal diameters, the menisci rise furtherahead in capillaries of smaller diameters due to greater Young-Laplace pressure. Howeverthe motion of advancing menisci is momentarily arrested when the hydrostatic pressure inthe junction becomes greater than Young-Laplace pressure on those menisci. The motionof these arrested menisci resume when the liquid has moved by a certain distance in thosecapillaries which were still filling up. This distance moved follows the Lucas-Washburndynamics and varies as a square root of time. Figure 1.17(a) shows the visible light imagesof front broadening for imbibition of water in Vycor. Figure 1.1729 (b) shows a typicalcapillary junction where menisci arrest takes place38.
18
II. Confinement systems out of equilibrium
Figure 1.16: Mass uptake as a function of√t for imbibition of water (circles), n-
hexadecane (triangles) and n-tetracosane (squares)- Solid lines represent the Lucas-Wasburn fits.28
Figure 1.17: (a) Broadening of the imbibition front of water rising in Vycor block.29(b)Diagrammatic representation of a capillary junction showing the different distances movedby the different menisci.38
Although single-component imbibition systems have been investigated through variousexperimental and numerical simulation approaches, the available literature on imbibitionof multi-component systems, especially ones showing a low gap of miscibility is still scarceand will one of the important aspects taken up in this thesis. We now proceed to describemore specifically the model system of nanoconfined binary liquids chosen in the workpresented in this thesis to enrich our knowledge and understanding on confinement inducedeffects at the nanoscale.
19

Chapter 1. Introduction
III Thesis caseThe experimental activities and their interpretation carried out in the framework of thisthesis was with the objective to deepen our understanding of the confinement inducedeffects on structural and dynamic behaviour of a binary liquid mixture which shows nogap of miscibility at the macroscopic scale. The spatial area of confinement, its surface-topology of pores, the overall pore-architecture and chemical environment of pore walls(hydrophilic/hydrophobic) are essential criteria to which these binary liquids will be putthrough to understand their influence on the molecular organization and dynamics. Thismakes choice of an appropriate model system essential for both the binary liquids andhost matrices.
A Choice of model system
A.1 Binary liquids without miscibility gap
Hydrocarbons make good examples of complex molecules, which depending on their chem-ical nature might be able to might be able to display capability of having more than onekind of molecular interaction (Van der Waals, hydrogen-bonding, π − π interactions...).It is the interplay of these specific interactions between confined molecules and the hostmatrix which eventually should govern the structural and dynamic aspects of confinedmixtures and therefore the choice of liquids for confinement are based on the multiplicityof intermolecular interactions displayed by the chosen components. Most importantly thebinary liquid mixture must be completely miscible at macroscopic scale.
Keeping the above considerations in mind we choose our model system to be a binaryliquid mixture of two hydrocarbons to be confined inside suitable nanoporous matrices.The first liquid is tert-butyl alcohol (C4H9OH), which by the virtue of its chemical struc-ture consists of a polar hydroxyl group and nonpolar branched aliphatic chain giving it ahybrid character. The second liquid is toluene (C7H8), an aromatic compound, which isaprotic in nature. All throughout this Ph.D thesis tert-butyl alcohol will be referred byits acronym TBA while toluene will be referred by the acronym TOL.
B Porous materialsThe second important aspect in choice of a model system is finding the appropriate hostmatrix. Fulfillment of the following criteria are quite essential for this purpose, a materialwhich has thermal and chemical stability over the temperature range in which the liquidsare aimed to be studied, the pore walls must be infinitely hard compared to the filled liquidor at least mechanically stable enough to withstand pore-filling without any deformation,be chemically nonreactive to the confined molecules, have a well-defined topology andfinally the dimensions of confinement should provide a highly reduced spatial volumewhile at the same time not completely diminish the possibility of phenomena such asphase transitions, order-disorder, cooperative dynamics etc, characteristic of bulk-phase.
In the last century a diverse range of porous materials offering confinement in diametersless than 50 nm have been developed. Broadly we classify them as microporous materials,
20

III. Thesis case
having pore diameters less than 2 nm and mesoporous materials, those with pore diametersbetween 2-50 nm.
Amongst the most widely used microporous materials are zeolites, which are inor-ganic crystalline compounds, with a three-dimensional framework made up of silicon,aluminium, oxygen and metal ions, along with small molecules such as water in the struc-ture, their general formula given as Mx/y[(AlO2)x(SiO2)y].zH2O
51. Where x and y areintegers such that y/x ≥ 1, M stands for the metal ion and n its valence while z arethe number of water molecules. Zeolites have a very ordered structure and high specificsurface area, combined high thermal and chemical stability, all of which could be tunedas per specific needs by modifying the basic composition. This makes them extremelyuseful today in the industry for catalysis, production of petrochemicals, energy storageand harvesting, detergents, agriculture and a foreseeable future in medical applications.
The second most important and more recent class of microporous materials are metal-organic frameworks (MOF). Unlike the purely inorganic nature of zeolites, MOFs arehybrid crystalline compounds made up of metal ions or their clusters linked via organicmolecules (linkers) producing highly ordered crystalline structure in one, two or threedimensions73. MOFs lead zeolites in both, ability of tuning the structure and achievingtailor-made functional properties because of the wide range of metal ions and organiclinkers available15. This can render MOFs with high surface selective properties, whichin addition to large specific surface areas have lot of potential applications in future,ranging from catalysis, energy conversion to capture and separation of green-house gasesand volatile organic compounds. However this flexibility comes as a price as the organiccomponent of MOFs makes it prone to chemical instability and lacks the thermal andmechanical robustness of zeolites36,59. Nevertheless, improvements in the prevention ofstructural breakdown and increased thermal stability have gradually taking place.
We now move ahead to mesoporous materials, which have made their way into thechemical industry as well since couple of decades already and now find applications in ionexchange, water desalination, gas sensing and catalysis, with potential applications in fuelcells, photovoltaics and drug delivery. A major share of mesoporous materials are basedon silicon and aluminium oxides. Beside them, porous silicon membranes, porous carbonand recently introduced polymer based mesoporous-materials are widely studied as well.The possibility to achieve high porous volume and specific surface area along with thediverse range of topologies that can be achieved makes these materials very interestingfrom the standpoint of understanding effect of pore architecture on local and long-rangestructural properties of confined liquids. Being inorganic in nature, silica and aluminaare chemically very stable towards organic compounds
A great advantage of mesoporous materials when it comes to the study of structure anddynamics of molecules under confinement is the possibility to develop pore-architectureswith highly-ordered geometry, uniform pore size, tunable chemical nature of pore walls,while at the same time achieve spatial dimensions conducive for examining the role playedby the balanced of molecular interactions between host matrix and confined liquid on itsphysical properties, which makes them the preferred materials for confining TBA:TOLmixtures to study the effects of nanoconfinement.
Mesorporous materials,which shall be referred to as nanoporous materials in this the-sis henceforth, for confinement of TBA and TOL were chosen on two grounds, firstly, for
21

Chapter 1. Introduction
structural and dynamic studies of TBA:TOL mixtures at thermodynamic equilibrium, forwhich the most suitable choices were MCM-41 nanoporous silica from the Mobil Compo-sition of Matter series44, Santa Barbara Amorphous-15 (SBA-15)75 nanoporous silica andits carbon analogue CMK-3 from the Carbon Molecular Sieves series63. All three consistof highly ordered parallel cylindrical pores exhibiting strong two-dimensional periodic ar-rangement. Secondly, for studying dynamics of TBA:TOL mixtures at out-of-equilibriumconditions, i.e. under flow through nanochannels. The most suitable material for thispurpose was Vycor R© monolithic nanoporous silica because of its highly wettable surfaceand possibility of rendering it into specific geometric shapes and sizes47.
In the subsequent sections we will discuss physical properties of TBA, TOL, theirmixtures and morphological characteristics of MCM-41, SBA-15, CMK-3 and Vycor.
C Properties of bulk TBA:TOL mixtures
C.1 tert-butyl alcohol (TBA)
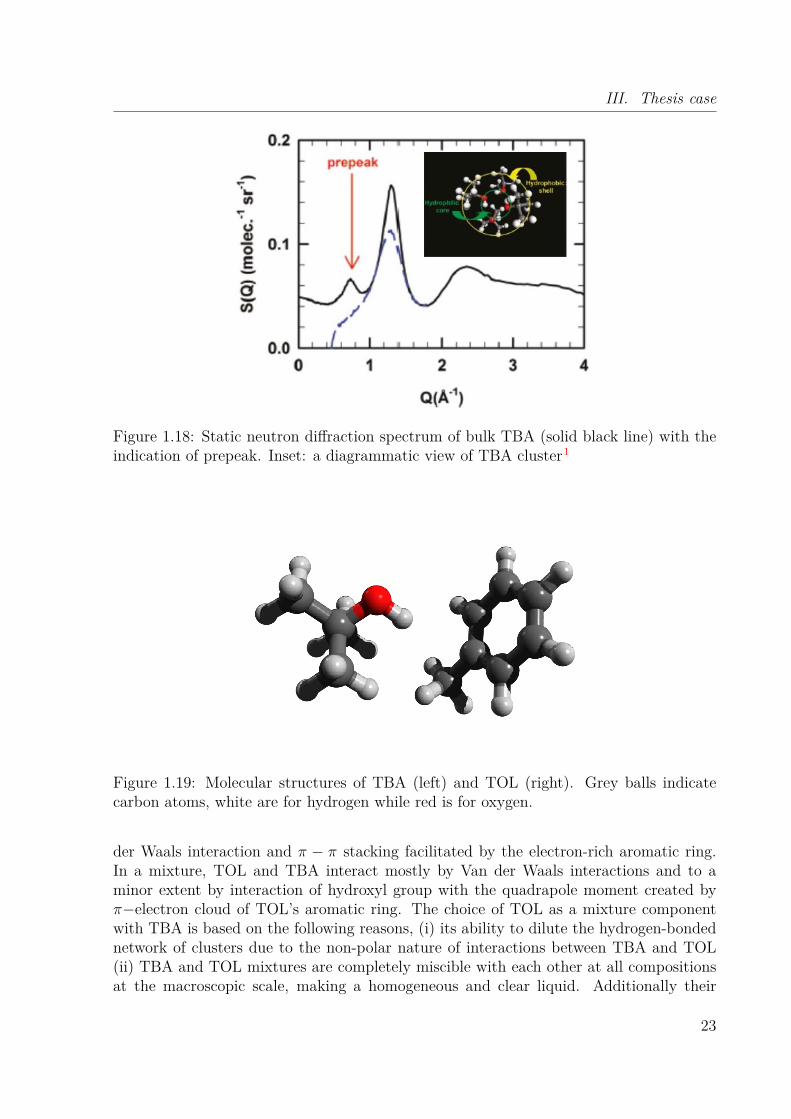
Tert-butyl alcohol or 2-methyl-propan-2-ol is one of the simplest alcohols that can undergoself-association in bulk liquid state to form micellar clusters. This clustering is possibleby a combination of steric-hindrance provided by bulky tert-butyl and hydrogen-bondinginteractions form the hydroxyl group such that the clusters are centred at the hydrophilic-OH groups while the hydrophobic tert-butyl groups are on the exterior. A numberof studies have reported that these clusters can correlate with each other, giving riseto long range structural order, a signature of which is found in the pair correlation inthe form of a prepeak of the static structure factor observed by neutron diffraction andsimulations1,25,32. Figure 1.18 shows a diagrammatic representation of hydrogen-bondedcluster in TBA in the inset and its effect on the neutron diffraction patten of bulk TBA,seen as the appearance of a prepeak1.
The Van der Waal’s molecular diameter of TBA is ≈ 4.2Å26. Its small size combinedwith the ability of molecular self-association has made TBA an interesting molecule tostudy confinement induced phenomena.However while using TBA one must exercise cau-tion with temperature of working as it crystallizes into plastic phases below its meltingpoint (25 ◦C) which necessitates it to be kept at temperature sufficiently high during ex-periment to prevent losing its liquid character.
C.2 Toluene (TOL)
Our second liquid of choice, toluene is an aromatic, aprotic and hydrophobic compoundwith a Van der Waals molecular diameter of ≈ 4.7Å26, which is equivalent to TBA. UnlikeTBA, TOL is a glass forming liquid, which shows a strong non-Arhennian dependenceof its viscosity with temperature. Its glass transition temperature is at −160 ◦C foundby differential scanning calorimetry and neutron scattering measurements. Figure 1.19shows the molecular structure of TOL along with that of TBA for comparison.
The intermolecular interactions amongst TOL molecules are largely dominated by Van
22
III. Thesis case
Figure 1.18: Static neutron diffraction spectrum of bulk TBA (solid black line) with theindication of prepeak. Inset: a diagrammatic view of TBA cluster1
Figure 1.19: Molecular structures of TBA (left) and TOL (right). Grey balls indicatecarbon atoms, white are for hydrogen while red is for oxygen.
der Waals interaction and π − π stacking facilitated by the electron-rich aromatic ring.In a mixture, TOL and TBA interact mostly by Van der Waals interactions and to aminor extent by interaction of hydroxyl group with the quadrapole moment created byπ−electron cloud of TOL’s aromatic ring. The choice of TOL as a mixture componentwith TBA is based on the following reasons, (i) its ability to dilute the hydrogen-bondednetwork of clusters due to the non-polar nature of interactions between TBA and TOL(ii) TBA and TOL mixtures are completely miscible with each other at all compositionsat the macroscopic scale, making a homogeneous and clear liquid. Additionally their
23

Chapter 1. Introduction
equivalent molecular diameters reduce the effect of their relative size difference on con-finement induced phenomena and depends strongly on the nature of interactions betweenthe confined molecules and the host matrix.
A remarkable effect of the role played by TOL in diluting TBA hydrogen-bondednetwowk of clusters is observed by the inability of TBA to crystallize below 25 ◦C byhaving as little as 10% by volume of TOL in the mixture. The following section discussessome of the physical properties of bulk TBA:TOL mixtures relevant for understandingthe scientific results presented in subsequent chapters of this thesis.
C.3 Hydrogen-bonding network in TBA
TBA TOL bulk liquid mixtures have been studied in the past by Abdel Hamid et al.by a combination of neutron scattering and Raman spectroscopy1,4,32. As discussed inthe brief description of TBA, the pre-peak seen in the static structure factor is a resultof correlation between TBA molecules at different scales, firstly between individual TBAmolecules forming associated n-mers (dimer,hexamer etc), secondly the correlation ofTBA and its n-mers into nanoclusters and thirdly the existence of correlation betweensuch nano-clusters. It was observed that by adding TOL to TBA, the intensity of thispre-peak decreases and continues to decrease with increasing amount of TOL up to nearcomplete suppression at high TOL composition as shown in figure 1.201. This is one firstindication of the influence of a hydrophobic molecule on the hydrogen-bonded network ofTBA, which appears to diminish.
Figure 1.20: Suppression of pre-peak (inset) in the static structure factor of TBA:TOLmixtures obtained from neutron diffraction experiments. x denotes the volume fractionof TBA. Notice the significant lowering of pre-peak intensity even at x ≈ 0.7.1
The authors examine this possibility by using Raman spectroscopy, which reveals
24

III. Thesis case
the existence of various populations of associated TBA molecules as shown in figure1.21 (a). We observe an increase in the population of tetramers and hexamers withincreasing volume fraction of TBA, which are capable of forming larger TBA clusters.An obvious consequence of increase in the hydrogen-bonded network is change in theelectronic environment of a TBA hydroxyl group, which undergoes increasingly strongerelectron shielding in large associated TBA clusters. The evidence of this is observed in theproportional decrease of 1H NMR chemical shift (δ(−OH)) of TBA hydroxyl group withits decreasing composition in the mixture up to xTBA ≈ 0.2 as shown in figure 1.21 (b),beyond which a more rapid decrease in its value is observed as the hydrophobic interactionsof TBA-TOL dominates over hydrogen-bonding interactions amongst TBA such that itsclusters break down and mostly TBAmonomers exist, which are not electronically shieldedas much strongly.
Figure 1.21: (a) The population fraction of hydrogen-bonded TBA clusters as a functionof its molar fraction in TBA:TOL mixtures shown by symbols. The solid lines are guidefor eye. (b) Chemical shift of -OH group of TBA as a function of its molar fraction forTBA:TOL mixtures shown by white circles and blue line. The blue triangles are predictedvalues from Raman spectroscopy. The red line, open circles on it and red triangles belongto TBA-methyl cyclohexane mixture which is not relevant for the current discussion.1
The effect of mixture composition on the extent of hydrogen-bonded cluster networkcan be expected to have consequences on the dynamics of TBA and TOL molecules whencompared to their free state as discussed in the following section.
C.4 Dynamics of bulk TBA:TOL mixtures
Translational self-diffusion coefficients of TBA and TOL molecules in TBA:TOL bulk mix-tures were studied previously using pulsed-field gradient stimulated echo NMR (PFG-STENMR), a nuclear magnetic resonance technique highly suited for self-diffusion dynamicsstudies, details of which will be given in the next chapter.
Figure 1.22 shows the diffusion coefficients of TBA (full circles) and TOL (open circles)in TBA:TOL mixtures as a function of TBA volume fraction. We notice that the diffusion
25

Chapter 1. Introduction
coefficients of TOL are greater by a factor of about 1.5 for most concentrations in spiteof the two molecules having comparable Van der Waals diameter. The hydrogen-bondedclusters of TBA have a much larger hydrodynamic radii, thus diffusing much slower athigh TBA compositions. Obviously the steric restriction experienced by TOL at highTBA concentration reduces its diffusion coefficient as well.
Figure 1.22: Translational diffusion coefficients of toluene (open circles) and tert-butanol(solid circles) in their bulk binary solutions.32
As the concentration of TBA decreases, the size of hydrogen-bonded clusters continueto break down allowing faster dynamics to both molecules such that they nearly convergeat high TBA dilution.
Within the context of phenomena at thermodynamic equilibrium its not only interest-ing to understand the nature of binary liquids but also phenomena corresponding to theinteraction of their binary gas mixture with a nanoporous substrate.
C.5 Binary liquid-gas equilibria
In understanding phenomena involving gas-solid interaction such as adsorption, it is im-perative to have accurate information of gas mixture composition in order to correctlycharacterise multi-component adsorption. In this section we report the TBA:TOL bi-nary gas composition at any given temperature from its corresponding known binaryliquid composition utilizing well-established theoretical knowledge on thermodynamics ofliquid-vapour equilibria.
The activity coefficients γTBA and γTOL of TBA and TOL respectively could be cal-culated through the Margules model for binary liquids54as shown in equations 1.6 and
26

III. Thesis case
1.7.γTBA = exp
((A+ 3B)(1− x)2 − 4B(1− x)3
RT
)(1.6)
γTOL = exp(
(A+ 3B)x2 + 4Bx3
RT
)(1.7)
x is the volume fraction of TBA in the TBA:TOL liquid mixture. The coefficients A andB have been determined empirically by Martinez-Soria et al60 where the thermodynamicdata for liquid-vapour equilibrae of TBA:TOL are available. The saturation pressures ofpure components were calculated from Antoine equation as shown in equation 1.8.
P sati = a1i exp
(− a2i
T + a3i
)(1.8)
The Antoine constants for TBA and TOL ani were obtained from the literature62. Uti-lizing the values of γi and P sat
i obtained from equations 1.6, 1.7 and 1.8 respectively, wecalculate the volume fraction of TBA y in the binary gas from Henry’s law62.
1y
= 1 + 1− xx
P satTOL
P satTBA
γTBAγTOL
(1.9)
In figure 1.23 we see how yTBA varies with xTBA at room temperature.
Figure 1.23: Volume(mole) fraction of TBA y in the binary gas at thermodynamic equi-librium with the liquid solution with volume fraction of TBA x at T=35 ◦C. The dashedline is a guide for the eye.
We now proceed to discuss briefly how the bulk properties of TBA:TOL mixturesvary with change of mixture composition. The viscosities and densities of TBA:TOLmixtures have been reported previously in the literature for different temperatures. In thefollowing section we report the bulk surface tensions of TBA:TOL mixtures determinedexperimentally at two different temperatures.
27

Chapter 1. Introduction
C.6 Surface tension measurements of binary liquid mixtures
The Pendant Drop Technique was used to determine bulk surface tensions of TBA, TOLand their mixtures for the liquid-air interface at 25 ◦C and 35 ◦C respectively33. Thistechnique analysis the drop profile, which is a balance between Laplace pressure, whichtries to give the drop a spherical shape and hydrostatic pressure due to gravitation whichpulls it down. The setup consisted of a light source, an optical camera and a drop sus-pended between them with the aid of a micro-syringe (figure 1.24). The drop profile isdescribed by a series of equations (Hansen and Rodsrud 1990)shown below obtained fromYoung-Laplace equation, the numerical fit of which to the drop shape captured by thecamera gives us the surface tension33.
dθ
ds= 2− βy − sin θ
x
dx
ds= cos θ
dy
ds= sinθ
Where β is related to the surface tension σ as
σ = ρ× g × r20/β
Where ρ is the mass density of the liquid/liquid mixture, g is acceleration due togravity and r0 is the radius of curvature at lowest point of the pendant drop.
Figure 1.24: Experimental setup of pendant drop method for determination of surfacetension.
The experimental values of surface tensions obtained for the bulk mixtures will be usedin subsequent chapters. Having discussed the information on physical properties of TBAand TOL mixtures relevant to the scientific discussions of this thesis, we now proceed tothe description of host matrices used for studying confinement induced effects on thesebinary mixtures.
28

III. Thesis case
D Properties of host matrices
D.1 MCM-41
Mobil Composition of Matter-41 or popularly known as MCM-41 is a nanoporous sil-ica developed by Mobil research group in 199244. With a pore size ranging between2-4nm, it provides a spatial dimension of confinement highly suitable for understandingthe role played by a balance of interactions between adsorbate-adsorbate and adsorbate-adsorbent on the structure and dynamics of confined matter. Its a highly crystallinematerial, with great two-dimensional periodicity of its pores. MCM-41 materials havecylindrical parallel pores and are known to have quite narrow pore-size distribution withvery little inter-connections between pores49. This makes it a preferred material for study-ing nanoconfinement phenomena. Additionally it is chemically quite inert and has beenin use already for a long time in chemical industry, especially for catalysis, gas separa-tion and adsorption. Its presence in the powder form makes its manipulation easier forstructural and dynamic studies in the filled state using a variety of techniques such asdiffraction, NMR, vapour sorption etc.
D.2 SBA-15
Santa Barbara Amorphous-15 type material or SBA-15 is a nanoporous silica which likeMCM-41 has highly ordered parallel pores present in a hexagonal arrangement. Thesynthesis technique of SBA-15, a sol-gel process75, details of which shall be given laterin this section, facilitates the formation of larger pores having pore diameters between8-9nm and greater wall thickness than MCM-41. This additional wall-thickness givesimproved thermo-mechanical properties13 highly desirable for functions like catalysis andgas separation. The larger pore size allows for confining great amount of adsorbate whichprovides a greater gradient in the nature of interactions occurring at the pore-wall andcore of the adsorbed material. SBA-15 pores have been to exhibit a unique feature ofhaving corrugated pores walls and tortuous pores along their length instead of straightcylindrical, giving rise to regions of microporosity39. Such tortuous profile of pore increasesthe overall pore-length from end to end which makes it an interesting material to studyself-diffusion phenomena of molecules confined in its pores over longer time scales.
D.3 CMK-3
CMK-3, a Carbon Molecular Sieves type of material is a carbon-replica of SBA-15, usingit as a template for its structure42. CMK-3 materials naturally have a reduced porediameter (3.5-6nm) compared to SBA-15, as the carbon walls formation takes place atthe interior of SBA-15 pores. CMK-3 pores are reported to have inter-connection betweenits pores though narrow channels, which gives rise to a significant microporosity. Its porewalls are completely made of carbon resembling carbon-nanotubes, larger in diameterthough. This changes the chemical nature of pore walls when compared to SBA-15 fromhydrophilic to hydrophobic which makes it more interesting to investigate the role playedby specific interactions between the confined molecules and pore-wall in being able toswitch the structural and dynamic characteristics of confined molecules.
29

Chapter 1. Introduction
D.4 Vycor R©
Vycor is a monolithic silica glass provided by Corning Inc. While it is mostly silica(96%), Vycor does constitute certain amount of boron trioxide (4%). The pores of Vycorwhich instead of being cylindrical or long enough to give a nano-rod like appearance area complex network of highly disordered meandering pores31. The pore diameter variesbetween 7-10nm) generally, but larger variations are not unlikely. Vycor is a material withhigh thermo-mechanical stability. Vycor is a fairly well machinable materials, making itpossible to create specific geometries desirable for rheological studies via radiography,optical methods and as membranes or blocks for fluid dynamics studies under pressurizedliquids or simply capillary rise action. Being made of silica, Vycor pore walls are highlywetting, i.e. the contact angle made by a confined liquid with the pore wall is almost zero.Vycor usually has a sizeable pore distribution in the form of several capillary bridges andbranching of larger pores into narrower ones, which produces some interesting rheologicaleffects which shall be discussed in chapter 4.
D.5 Brief description of synthesis techniques
D.5.1 MCM-41: The synthesis technique of MCM-41 powder has been long estab-lished50 and was used to synthesize in our laboratory at the Institut de Physique deRennes, with morphological specifications found most suitable in the context of this work.
MCM-41 is synthesized using a hydrothermal synthesis method where cationic surfac-tants present in a basic medium self-assemble into rod-like micelles arranged in a hexag-onal lattice to form a template in which silica molecules assisted by water condense insubsequent stages, such that we have highly ordered rod-like structures made of silicamolecules30.
The pore morphology depends strongly on the length of carbon chain of the surfac-tant used. For the synthesis of MCM-41 C-16 type nanoporous matrix we use hexade-cyltrimethylammonium bromide (CH3(CH2)15N(Br)(CH3)3, (Alrich C16TABr 98%), awater-soluble cationic surfactant as the template material, 4.8 g of which was dissolvedin 240 ml of distilled water. The mixture was stirred at 700rpm at 40 ◦C until a clearsolution was obtained. The importance of stirring above temperature was to acceleratethe chemical kinetics. In the following step aqueous ammonia solution to change the pHof solution from acidic (≈ 5.4) to basic (≈ 11). 20 ml of the silica source tetraethyl-siloxane (Si(OC2H5)4 TEOS Aldrich 98%) was added thereafter. The temperature wasmaintained at 40 ◦C for next two hours for the reaction to complete.
A white precipitate is formed at the end of reaction process which was filtered byBuchner filtration using 300 ml of distilled water to remove any remaining reactants. Thefiltered powder was dried in an oven for 17 hours at 90 ◦C to remove adsorbed water.In the final step remaining surfactant molecules were eliminated by calcining the powdergradually from room temperature to 550 ◦C over a period of 5 hours and then maintainingat this temperature for 5 more hours. The final result was 5 g of MCM-41 white, uniformpowder.
30

III. Thesis case
D.5.2 SBA-15: SBA-15 was synthesized in our laboratory following one of the mostcited synthesis routes available13. Preparation of SBA-15 is followed by a sol-gel processwhere an amphiphilic non-ionic triblock copolymer is used as a template around whichthe silica precursor is polymerized.
4 g of the the polymeric template material called Pluronic (P123) was dissolved in asolution of 125 g distilled water and 25 g of hydrochloric acid (38%) in order to provide anacidic medium. The solution was prepared by stirring at 40 ◦C for 3 hours following which8.6 g of the silica precursor (TEOS) was added. This was followed by ten more minutesof vigorous stirring after which the stirring was stopped and the solution was aged for thenext 24 hours with temperature maintained at 40 ◦C.
Thereafter the solution was aged without stirring for 24 hours again at 100 ◦C underreflux conditions which resulted into formation of a white precipitate. A Buchner filtrationprocess similar to that in MCM-41 was carried out with 300 ml of distilled water at roomtemperature to remove residual reactants. The filtrate was pre-dried at room temperaturefor 24 hours and subsequently oven dried at 550 ◦C for 18 hours to obtain SBA-15 powder.
D.5.3 CMK-3: CMK-3 materials were synthesized in the laboratory using SBA-15 asthe starting material42. A solution of 1.25 g sucrose and 0.14 g sulphuric acid was made in5 g water. Sucrose is the source of carbon forming material, while SBA-15 is the template.1 g of SBA-15 was added to the sucrose solution and heated in an oven at 100 ◦C for sixhours, followed by six more hours of heating at 160 ◦C. Under these conditions sucroseundergoes polymerization in the pores of SBA-15 which serve as a template. 0.8 g and0.09 g of additional sucrose and sulphuric acid were added to ensure complete coverage ofsilica surface with hydrocarbon material.
The resulting material was subjected to pyrolysis treatment at 900 ◦C for six hoursunder a nitrogen flux to prevent oxidization and effectively remove all hydrogen fromthe polymer covering pore-walls and converting it into purely carbon walls. Unlike usualsynthesis routes, the silica template was not removed in order to retain the ordered struc-ture. However the aim of synthesis, which was to produce carbon pore-walls was met.The resulting CMK-3 powder as a consequence retains certain amount of silica mostlypresent in external surfaces such exterior of pore walls.
Figure 1.25 (a) shows the diagrammatic representation of synthesis of ordered nanoporoussilica (MCM-41 or SBA-15) depending on the template material used. Figure 1.25 (b)shows the use of SBA-15 template for synthesizing CMK-3 matrix.
D.6 Microstruture
In this section we discuss briefly the microstructure studies conducted on MCM-41 andSBA-15 using Scanning Electron Microscopy (SEM) and Transmission Electron Microscopy(TEM). SEM images are obtained a beam of electrons which are scattered from a givensurface, thus giving important information on the particle morphology with a resolutionof ≈ 10 nm. On the other hand, TEM is a technique in which a focused beam of electronsis transmitted through a very thin membrane of sample revealing important informationat a length scale of ≈ 1 nm The measurements were conducted in the framework of Dr.
31

Chapter 1. Introduction
Figure 1.25: (a)Synthesis route of ordered nanoporous silica. The micellar templateforming material is either CTAB (C16TABr) or Pluronic (123) (HO − (CH2CH2O)20 −(CH2CHO)70− (CH2CH2O)20−H) for synthesizing MCM-41 or SBA-15 respectively27.(b) Use of SBA-15 as a template for polymerizing sucrose in acidic medium provided bysulphuric acid, following by subsequent pyrolysis to obtain CMK-3. It is important tonote here that the CMK-3 synthesized in the laboratory retains its silica template unlikeshown in figure.
Ramona Mhanna’s doctoral thesis at the Institut de Physique de Rennes 55.
Figure 1.26 (a) shows the SEM images of MCM-41 agglomerates which are roughlyhexagonal in shape. The particle size was found to be roughly 1 µm. Figure 1.26 (b)shows the TEM images of MCM-41 in two orientations, one with axis of viewing parallelto cylindrical pore channels (A) and second perpendicular to pore channels (B). Thehexagonal two-dimensional lattice arrangement of pores are highlighted by the red spotsin (A), while their parallel arrangement is highlighted by red lines in (B).55
Figure 1.27 (a) shows SBA-15 particle-agglomerates which in contrast to MCM-41appear slender and longer indicating a greater pore-length to pore diameter ratio. Figure1.27 (b) (D) (on right) shows arrangement of SBA-15 pores parallel to each other (redlines) similar to MCM-41.55
D.7 Crystalline structure
In the following section we discuss the structural information on the lattice arrangementof the ordered porous matrices synthesized in our laboratory, i.e. MCM-41, SBA-15 andCMK-3 derived from powder x-ray diffraction measurements. The small wavelength andhigh intensity of x-rays combined with its ability to elastically scatter with electron cloudsmake them an indispensable tool for accurate determination of crystalline structures atthe molecular level down to few angstroms.
The experiments were carried out at 25 ◦C using an x-ray wavelength of λ = 1.54Å55.
32

III. Thesis case
Figure 1.26: (a) SEM images of MCM-41 featuring particles of hexagonal geometry. (b)TEM images of MCM-41 particles in axis of viewing parallel (A) and perpendicular (B)to the pore-axis.55
Figure 1.27: (a) SEM images of SBA-15 featuring long particle size, an indication of largerpore-length to diameter ratio. (b) TEM images of SBA-15 particles in axis of viewingparallel (C) and perpendicular (D) to the pore-axis.55
The scattering angle θ, i.e. the angle with respect to the sample at which a detectordetects scattered x-ray is related to the scattering vector q by the equation q = 4π sin θ
λ,
33

Chapter 1. Introduction
which is in turn related to the inter-planar distance d between lattice planes by the Braggequation as d = 2nπ
q.
Figure 1.2855 shows the x-ray diffraction patterns of MCM-41, SBA-15 and CMK-3.The Bragg reflections (1 0), (1 1), (2 0) and (2 1), which characteristics of hexagonallattice arrangement were observed for MCM-41, which is commensurate with its TEMimages discussed in previous section. The most intense peak at (1 0) reflection primarilyrepresents the arrangement of pores. The inter-planar distance for this reflection d(10) wasreported to be 3.8 nm for MCM-41. The lattice parameter a(10) is related to inter-planar
distance by the relation a = 2d(10)√3
.
Figure 1.28: Powder X-ray diffraction patterns of MCM-41 (blue), SBA-15 (red) andCMK-3 (cyan). The Bragg reflections are indicated for MCM-41. In the inset is given adiagrammatic representation of hexagonal arrangement of pores and the lattice parame-ter.55
The Bragg reflections of SBA-15 show a P6mm type of ordering, which natruallypersists in CMK-3. The shifting of Bragg peaks to lower Q values in comparison toMCM-41 indicate a larger pore structure. The absolute scattered intensity of CMK-3peaks were reportedly lower than SBA-15 by five orders of magnitude and the author haspresented a magnified view of the diffraction pattern for clarity. Such lowering of intensitycan be attributed to two things, firstly, CMK-3 is mostly carbon, an element of low-atomicnumber and consequently very low form factor. As x-ray diffraction is sensitive to theelectron density of an atom, low atomic number elements like carbon equally sensitive
34

III. Thesis case
to x-rays as silicon. Secondly, a loss of pore ordering observed by the disappearance offourth Bragg peak for CMK-3 might as well be an additional reason for overall diminishedintensity of Bragg peaks.
D.8 Pore size, volume and specific surface area
One of the most efficient tools for pore morphology characterisation is vapour sorption.Adsorption of molecules is a highly gradual process in thermodynamic equilibrium. Whileadsorption of first molecular layer on the surface of a substrate at low pressures of theadsorbing gas can help determine the specific surface area of the pores, adsorption up tocomplete filling of pores by condensation of vapours into liquid helps obtain the porous vol-ume of the substrate. In this section is reported the use of nitrogen adsorption isotherms at77 K carried out on MCM-41, SBA-15 and CMK-3 using an ASAP Micromeretics instru-ment and on Vycor using a Quantachrome R©ASiQwinTMinstrument in order to determineessential information on its pore characteristics.
Figure 1.2955 shows the nitrogen vapour sorption isotherms of MCM-41 and two vari-ants of SBA-15 ((A) and (C). A Brunauer, Emett and Teller (BET) analysis14 of theisotherms at low relative pressures (0.15 ≥) where the volume of nitrogen gas adsorbedV at a relative pressure P/P0 is related to the volume of nitrogen necessary to make amonolayer Vm by the following expression.
1V ×
[P0P− 1
] = 1CVm
+ C − 1VmC
P
P0
Where C is known as the BET constant which gives the extent of thermodynamicaffinity of a surface for the adsorbing molecules. Fitting the above linear equation of
1V ×
[P0P− 1
] versus P/P0 gives the slope dfracC − 1VmC and intercept 1CVm
needed to
obtained volume occupied by a monolayer, from which the specific surface area occupiedby the adsorbed species can be determined.
On the other hand, volume uptake per gram of sample in figure 1.29 directly gives ameasure of the sample porosity.
Figure 1.30 (a) and (b) show the nitrogen vapour sorption isotherms for CMK-3 andVycor respectively. It must be noted that the y-axis here does not represent volume uptakeby the sample and is instead the volume of nitrogen using in the bath of experimentalsetup for vapour sorption.
Observing the shapes of isotherms we notice that MCM-41 and SBA-15 have a sim-ilarity in their shapes. Such isotherms are characteristic of type IV sorption-isotherms,in which a gradual linear mass rise corresponding to formation of first monolayers takesplace, which is followed by an immediate step rise at a certain pressure known as capil-lary condensation pressure, beyoond which the adsorbing vapour molecules condense intoliquid state and occupy the porous volume completely.
The adsorption isotherm for Vycor on the other hand resembles more a type II isothermwhere the monolayer build up continues till quite high relative pressures which is followedby a smoother capillary condensation.
35

Chapter 1. Introduction
Figure 1.29: Nitrogen vapour sorption isotherms of MCM-41 (blue) and two variants ofSBA-15 (A)(red) and (C) (red) at 77 K up to a relative pressure 0.95 to the saturationpressure.55
Figure 1.30: Nitrogen vapour sorption isotherms of CMK-3(a) and Vycor(b). The y-axis does not represent absolute volume uptake of the samples, instead are a measure ofnitrogen used in the bath for experiment.
36

III. Thesis case
We notice that the adsorption isotherm for CMK-3 has elements of type IV isotherm,seen by its gradual linear volume uptake, which is followed by a step increase in volumeuptake. However unlike MCM-41 and SBA-15, this step rise does not occur at a singlerelative pressure but over a certain relative pressure range. We shall discuss this issuemore in detail in chapter 3. At present, we focus more specifically on use of the nitrogen-adsorption isotherm for determination of specific surface area and volume porosity of theporous matrix.
Additionally another important use of nitrogen vapour sorption isotherms is the de-termination of pore-size and its distribution for our porous matrices. One of the mostpreferred analysis technique for determining the same was given by Barret, Joyner andHalenda, the analysis technique known popularly as the BJH treatment10 which assumespores to be cylindrical and is based on the Kelvin equation which relates pore size tocapillary condensation pressure. In figures 1.2955 and 1.30 we clearly observe that thecapillary condensation step does not occur sharply on one pressure, but smeared over apressure range, which is very little for MCM-41 and SBA-15, but significant for CMK-3.The pore size distributions of SBA-15(A)55, CMK-3 (laboratory synthesized) and Vycorsample (commercial) are shown in figure 1.31 (a), (b) and (c) respectively. We observethat SBA-15 has quite a uniform pore size even though the pore size distribution is notvery narrow. Vycor on the other hand has quite narrow pore size distribution (blue curveand open squares), while CMK-3 has the largest pore size distribution ranging from mi-croporosity to macroporosity, thus the most probable pore diameter (5.6Å) was found tobe different than the average pore diameter (3.9Å)
D.9 Summary of properties
In the table below are listed the pore morphological properties of the chosen host matricesfor confinement which are most relevant to the scientific discussions presented in thisthesis.
Host matrix BET specific surface area Volume porosity Pore diameter(m2 g−1) (cm3 g−1) (nm)
MCM-4155 960 0.67 3.4SBA-1555 822 1.07 7.8CMK-3 368 0.22 3.9(average),5.6 (most probable)Vycor 104 0.22 9.08
0.32(vol/vol)
E State of the artThe structural and dynamic studies of TBA:TOL mixtures in MCM-41 and SBA-15 poreshave already been reported using a combination of neutron scattering techniques anddifferential scanning calorimetry in the works of Ramona Mhanna et al. and Abdel Hamidet al.2–4,55
Ramona Mhanna et al. prepared isotopic mixtures of TOL (TOL-H and TOL-D),TBA (TBA-H and TBA-D) and TBA:TOL (TBA-H/D and TOL-H/D) mixtures in order
37

Chapter 1. Introduction
(a)
(b)
(c)
Figure 1.31: Pore size distribution of SBA-15(a)55, CMK-3(b) and Vycor(c) obtained fromBJH-treatment of the nitrogen vapour sorption isotherms.
to have the same neutron scattering length density as silica, a method known as contrastmatching55. Thus upon filling SBA-15 pores completely with this mixture, the systemmust appear as a homogeneous bulk silica without any pores as a consequence of whichone expects extinction of the neutron diffraction Bragg peaks of SBA-15. While this was
38

III. Thesis case
true for contrast matched TOL or TBA pure liquids (1.32(a)), in the case of TBA:TOLmixtures the persistence of (1 0) Bragg reflection characteristic of hexagonal arrange-ment of pores indicated presence of an inhomogeneity inside the pores (1.32(b)). Theexperimental neutron diffraction pattern could be well explained by a core-shell modelof phase separation (1.32(c)), made up of a one-monolayer thick TBA-shell and a coremade up of TOL. Interestingly the opposite case, i.e. a TOL shell and a core of TBAcould not fit with the experimental observations which was rationalized by TBA’s abilityto form hydrogen-bonded network which might extend to forming such H-bonds with thehydrophilic silica. Existence of this TOL-TBA core-shell model was demonstrated earlierfor confinement in MCM-41 pores as well3.
Figure 1.32: (a) Contrast matched TBA and TOL leading to near extinction of SBA-15Bragg peaks.(b) Persistence of Bragg-peak upon filling pores with TBA:TOL contrast matched mix-ture. Evidence of inhomogeneity.(c)Core-shell model showing TBA forming the shell and TOL constituting the core.32,55
Abdel Hamid et al. combine neutron scattering and DSC to reveal the existenceof two different glass transitions for TBA:TOL mixtures confined in silica nanopores(MCM-41,SBA-15) indicating the presence of two region with different relaxation dynam-ics2. Additionally a slowdown in the TBA liquid relaxation dynamics and suppressionof glassy modes was observed. The above mentioned TOL-TBA core-shell model gives apossible explanation of the existence of two regions with different glassy dynamics, eventhough their thicknesses vary from one (monolayer shell) to few molecular layers. Thephase-separation of TBA and its possible interaction with the silica surface provides anexplanation for the slowing down of its dynamics. Figure 1.33 shows the differential of
39

Chapter 1. Introduction
DSC thermograms of TBA:TOL mixtures of variations compositions denoted by the vol-ume fraction x of TBA, confined in MCM-41 pores. We notice clearly the emergenceof two separation glass transition temperatures, indicated by the peaks, as for mixturecompositions as low as x = 0.065.
Figure 1.33: Derivative of heat flow versus temperature for TBA:TOL mixtures as wellas pure liquids confined in MCM-41. The arrows point to the existence of two differentpeaks indicating two separate Tgs.2
IV Organization of thesisThe application of neutron diffraction as mentioned in the previous section has broughtessential structural information on the nature of molecular ordering and phase separationof TBA:TOL mixtures confined in ordered silica nanopores, which have been equally wellsupported from the investigations made on the dynamics of these nanoconfined binaryliquids. In the current thesis, we approach TBA:TOL binary systems from a differentperspective than has been adopted so far to find whether we converge with what has beenalready established while simultaneously deepening our understanding of these systemsby answering some completely new questions.
Chapter 2 deals with systems in static equilibrium conditions. It presents a nuclearmagnetic resonance study of TBA:TOL binary liquids confined in MCM-41 and SBA-15pores. 1H Magic Angle Spectroscopy NMR has been used to seek information from astructural point of view by investigating the nature of molecular interactions present in
40

BIBLIOGRAPHY
the nanoconfined TBA:TOL mixtures. Pulsed Field Gradient NMR technique has beenutilized to investigate the influence of nanoconfinement on the self-diffusion dynamics ofour binary liquids when compared to the bulk state.
Chapter 3 extends the approach to dynamic equilibrium studies by analyzing theadsorption characteristics of TBA:TOL binary gas mixture adsorbing in MCM-41 andCMK-3 pores. A thermodynamic model is developed in order to explain the role playedby competing intermolecular interactions between adsorbing species of a multi-componentgas and the pore surface which leads to structural organization under nanoconfinement.
Chapter 4 tests whether the established effects on structure and dynamics of nanocon-fined binary liquids under equilibrium (static and dynamic) hold equally true under out ofequilibrium conditions by investigating the spontaneous imbibition of TBA:TOL binaryliquids through a network of silica nanopores by using gravimetric and neutron radiogra-phy methods.
Bibliography
[1] A R Abdel Hamid, Ronan Lefort, Y Lechaux, Alain Moréac, Aziz Ghoufi, ChristianeAlba-Simionesco, and Denis Morineau. Solvation effects on self-association and seg-regation processes in tert-butanol-aprotic solvent binary mixtures. The journal ofphysical chemistry. B, 117(35):10221–30, sep 2013.
[2] Abdel Razzak Abdel Hamid, Ramona Mhanna, Pierre Catrou, Yann Bulteau, Ro-nan Lefort, and Denis Morineau. Multiple Glass Transitions of Microphase Sepa-red Binary Liquids Confined in MCM-41. The Journal of Physical Chemistry C,120(20):11049–11053, may 2016.
[3] Abdel Razzak Abdel Hamid, Ramona Mhanna, Ronan Lefort, Aziz Ghoufi, Chris-tiane Alba Simionesco, Bernhard Frick, and Denis Morineau. Micro-Phase Separationof Binary Liquids Confined in Cylindrical Pores. The Journal of Physical ChemistryC, page acs.jpcc.6b01446, apr 2016.
[4] Razzak Abdelhamid Abdel, C Alba-Simionesco, B Frick, Aziz Ghoufi, Ronan Lefort,Ramona Mhanna, Alain Moréac, and Denis Morineau. Mesoscopic order of bulk andnanoconfined H-bonded binary liquid mixtures. In "Structure of disordered systems"opening celebration of the new 7C2 spectrometer, Saclay, France, 2013.
[5] Gerold Adam and Julian H Gibbs. On the temperature dependence of coopera-tive relaxation properties in glass-forming liquids. The journal of chemical physics,43(1):139–146, 1965.
[6] Shashishekar P Adiga, Chunmin Jin, Larry A Curtiss, Nancy A Monteiro-Riviere,and Roger J Narayan. Nanoporous membranes for medical and biological ap-plications. Wiley interdisciplinary reviews. Nanomedicine and nanobiotechnology,1(5):568–81, jan.
41

BIBLIOGRAPHY
[7] Dagfinn W Aksnes, Kjersti Førland, and Michael Stöcker. 1 h nmr relaxation anddiffusion studies of cyclohexane and cyclopentane confined in mcm-41. Microporousand mesoporous materials, 77(1):79–87, 2005.
[8] S Amali, Lis Wollesen Petersen, and DE Rolston. Modeling multicomponent volatileorganic and water vapor adsorption on soils. Journal of hazardous materials,36(1):89–108, 1994.
[9] Fabrice Audonnet, Nancy Brodie-Linder, Denis Morineau, Bernhard Frick, and Chris-tiane Alba-Simionesco. From the capillary condensation to the glass transition ofa confined molecular liquid: Case of toluene. Journal of Non-Crystalline Solids,407:262–269, sep 2015.
[10] Elliott P Barrett, Leslie G Joyner, and Paul P Halenda. The determination of porevolume and area distributions in porous substances. i. computations from nitrogenisotherms. Journal of the American Chemical society, 73(1):373–380, 1951.
[11] James Munsie Bell and FK Cameron. The flow of liquids through capillary spaces.The Journal of Physical Chemistry, 10(8):658–674, 1906.
[12] Pilar Brocos, Alfredo Amigo, and M Guadalupe Lemus. Extended Langmuir Isothermfor Binary Liquid Mixtures. (14):4261–4266, 2001.
[13] Nancy Brodie-Linder, Gilberte Dosseh, Christiane Alba-Simonesco, Fabrice Audon-net, and Marianne Impéror-Clerc. Sba-15 synthesis: Are there lasting effects of tem-perature change within the first 10min of teos polymerization? Materials chemistryand physics, 108(1):73–81, 2008.
[14] Stephen Brunauer, P. H. Emmett, and Edward Teller. Adsorption of Gases in Mul-timolecular Layers. Journal of the American Chemical Society, 60(2):309–319, feb1938.
[15] Sachin Chavan, Jenny G Vitillo, Diego Gianolio, Olena Zavorotynska, BartolomeoCivalleri, Søren Jakobsen, Merete H Nilsen, Loredana Valenzano, Carlo Lamberti,Karl Petter Lillerud, et al. H 2 storage in isostructural uio-67 and uio-66 mofs.Physical chemistry chemical physics, 14(5):1614–1626, 2012.
[16] Henry Darcy. Les fontaines publiques de la ville de Dijon: exposition et application...Victor Dalmont, 1856.
[17] Filip de Clippel, Asim L. Khan, Angels Cano-Odena, Michiel Dusselier, KatrienVanherck, Li Peng, Steffen Oswald, Lars Giebeler, Steven Corthals, Bart Kenens,Joeri F. M. Denayer, Pierre A. Jacobs, Ivo F. J. Vankelecom, and Bert F. Sels. CO2 reverse selective mixed matrix membranes for H 2 purification by incorporation ofcarbonÃ??silica fillers. J. Mater. Chem. A, 1(3):945–953, 2013.
[18] Pablo G Debenedetti and Frank H Stillinger. Supercooled liquids and the glasstransition. Nature, 410(6825):259–267, 2001.
42

BIBLIOGRAPHY
[19] Peter Debye and Jerome Daen. Stability considerations on nonviscous jets exhibitingsurface or body tension. Physics of Fluids (1958-1988), 2(4):416–421, 1959.
[20] DI Dimitrov, A Milchev, and K Binder. Capillary rise in nanopores: molecu-lar dynamics evidence for the lucas-washburn equation. Physical review letters,99(5):054501, 2007.
[21] B. Diu. Éléments de physique statistique. Collection Enseignement des sciences.Hermann, 1989.
[22] Baojuan Dou, Qin Hu, Jinjun Li, Shizhang Qiao, and Zhengping Hao. Adsorptionperformance of VOCs in ordered mesoporous silicas with different pore structuresand surface chemistry. Journal of hazardous materials, 186(2-3):1615–24, feb 2011.
[23] Jeppe C Dyre, Tina Hechsher, and Kristine Niss. A brief critique of the adam–gibbsentropy model. Journal of Non-Crystalline Solids, 355(10):624–627, 2009.
[24] E. Gedat, A. Schreiber, G. H. Findenegg, I. Shenderovich, H.-H. Limbach, andG. Buntkowsky. Stray field gradient NMR reveals effects of hydrogen bonding ondiffusion coefficients of pyridine in mesoporous silica. Magnetic Resonance in Chem-istry, 39(S1):S149–S157, dec 2001.
[25] Aziz Ghoufi, Ivanne Hureau, Denis Morineau, Richard Renou, and Anthony Szym-czyk. Confinement of tert -Butanol Nanoclusters in Hydrophilic and HydrophobicSilica Nanopores. The Journal of Physical Chemistry C, 117(29):15203–15212, jul2013.
[26] Aziz Ghoufi, Ivanne Hureau, Denis Morineau, Richard Renou, and Anthony Szym-czyk. Confinement of tert-butanol nanoclusters in hydrophilic and hydrophobic silicananopores. The Journal of Physical Chemistry C, 117(29):15203–15212, 2013.
[27] LT Gibson. Mesosilica materials and organic pollutant adsorption: part a removalfrom air. Chemical Society Reviews, 43(15):5163–5172, 2014.
[28] Simon Gruener and Patrick Huber. Imbibition in mesoporous silica: rheological con-cepts and experiments on water and a liquid crystal. Journal of Physics: CondensedMatter, 23(18):184109, 2011.
[29] Simon Gruener, Zeinab Sadjadi, Helen E Hermes, Andriy V Kityk, Klaus Knorr,Stefan U Egelhaaf, Heiko Rieger, and Patrick Huber. Anomalous front broadeningduring spontaneous imbibition in a matrix with elongated pores. Proceedings of theNational Academy of Sciences of the United States of America, 109(26):10245–50,jun 2012.
[30] Michael Grün, Iris Lauer, and Klaus K Unger. The synthesis of micrometer-andsubmicrometer-size spheres of ordered mesoporous oxide mcm-41. Advanced Materi-als, 9(3):254–257, 1997.
43

BIBLIOGRAPHY
[31] Simon Alexander Grüner. Rheology and Dynamics of Simple and Complex Liquidsin Mesoporous Matrices. 2010.
[32] Abdel Razzak Abdel Hamid. Nanoségrégation d’un liquide binaire confiné dans desmatériaux mésoporeux. PhD thesis, Université Rennes 1, 2012.
[33] FK Hansen and G Rødsrud. Surface tension by pendant drop: I. a fast standardinstrument using computer image analysis. Journal of colloid and interface science,141(1):1–9, 1991.
[34] HZ Hassan, AAMohamad, Y Alyousef, and HA Al-Ansary. A review on the equationsof state for the working pairs used in adsorption cooling systems. Renewable andSustainable Energy Reviews, 45:600–609, 2015.
[35] Terrell L Hill. Statistical mechanics of multimolecular adsorption. i. The Journal ofChemical Physics, 14(4):263–267, 1946.
[36] Patricia Horcajada, Christian Serre, María Vallet-Regí, Muriel Sebban, FrancisTaulelle, and Gérard Férey. Metal–organic frameworks as efficient materials for drugdelivery. Angewandte chemie, 118(36):6120–6124, 2006.
[37] P. Huber, S. Grüner, C. Schäfer, K. Knorr, and a. V. Kityk. Rheology of liquids innanopores: A study on the capillary rise of water, n-Hexadecane and n-Tetracosanein mesoporous silica. The European Physical Journal Special Topics, 141(1):101–105,feb 2007.
[38] Patrick Huber. Soft matter in hard confinement: phase transition thermodynamics,structure, texture, diffusion and flow in nanoporous media. Journal of Physics:Condensed Matter, 27(10):103102, 2015.
[39] M Imperor-Clerc, P Davidson, and A Davidson. Existence of a microporous coronaaround the mesopores of silica-based sba-15 materials templated by triblock copoly-mers. Journal of the American Chemical Society, 122(48):11925–11933, 2000.
[40] Catheryn L Jackson and Gregory B McKenna. The melting behavior of organicmaterials confined in porous solids. The Journal of Chemical Physics, 93(12):9002–9011, 1990.
[41] Catheryn L Jackson and Gregory B McKenna. The glass transition of organic liquidsconfined to small pores. Journal of Non-Crystalline Solids, 131:221–224, 1991.
[42] Shinae Jun, Sang Hoon Joo, Ryong Ryoo, Michal Kruk, Mietek Jaroniec, ZhengLiu, Tetsu Ohsuna, and Osamu Terasaki. Synthesis of new, nanoporous carbonwith hexagonally ordered mesostructure. Journal of the American Chemical Society,122(43):10712–10713, 2000.
[43] Santanu Karan, Zhiwei Jiang, and Andrew G Livingston. MEMBRANE FILTRA-TION. Sub-10 nm polyamide nanofilms with ultrafast solvent transport for molecularseparation. Science (New York, N.Y.), 348(6241):1347–51, jun 2015.
44

BIBLIOGRAPHY
[44] CT Kresge, ME Leonowicz, WJ Roth, JC Vartuli, JS Beck, et al. Ordered meso-porous molecular sieves synthesized by a liquid-crystal template mechanism. nature,359(6397):710–712, 1992.
[45] Irving Langmuir. The adsorption of gases on plane surfaces of glass, mica and plat-inum. Journal of the American Chemical society, 40(9):1361–1403, 1918.
[46] Ronan Lefort, J-L Duvail, T Corre, Y Zhao, and Denis Morineau. Phase separationof a binary liquid in anodic aluminium oxide templates: a structural study by smallangle neutron scattering. The European physical journal. E, Soft matter, 34(7):71,jul 2011.
[47] P Levitz, G Ehret, SK Sinha, and JM Drake. Porous vycor glass: The microstructureas probed by electron microscopy, direct energy transfer, small-angle scattering, andmolecular adsorption. The Journal of chemical physics, 95(8):6151–6161, 1991.
[48] Ming Li, Erling Xu, Tingliang Wang, and Juan Liu. Adsorption equilibria of binarygas mixtures on graphitized carbon black. Langmuir, 28(5):2582–2588, 2012.
[49] Hong-Ping Lin and Chung-Yuan Mou. " tubules-within-a-tubule" hierarchical orderof mesoporous molecular sieves in mcm-41. Science, 273(5276):765, 1996.
[50] Benedikt Lindlar, Andreas Kogelbauer, Patricia J Kooyman, and Roel Prins. Syn-thesis of large pore silica with a narrow pore size distribution. Microporous andmesoporous materials, 44:89–94, 2001.
[51] GQ Lu and Xiu Song Zhao. Nanoporous materials: science and engineering, vol-ume 4. World Scientific, 2004.
[52] Richard Lucas. Ueber das zeitgesetz des kapillaren aufstiegs von flüssigkeiten. Colloid& Polymer Science, 23(1):15–22, 1918.
[53] M W Maddox, S L Sowers, K E Gubbins, and Olin Hall. Molecular Simulation ofBinary Mixture Adsorption in Buckytubes and MCM-41. 32:23–32, 1996.
[54] Vicente Martínez-Soria, M. Pilar Peña, and Juan B. Montón. Vapor-Liquid Equilibriafor the Binary Systems tert -Butyl Alcohol + Toluene, + Isooctane, and + Methyl-cyclohexane at 101.3 kPa. Journal of Chemical & Engineering Data, 44(1):148–151,1999.
[55] Ramona Mhanna. Confinement-induced of binary liquids with interactions. PhDthesis, Université de Rennes 1, 2015.
[56] A.W. Mohammad, Y.H. Teow, W.L. Ang, Y.T. Chung, D.L. Oatley-Radcliffe, andN. Hilal. Nanofiltration membranes review: Recent advances and future prospects.Desalination, 356:226–254, nov 2014.
[57] Denis Morineau, Gilberte Dosseh, Christiane Alba-Simionesco, and Philip Llewellyn.Glass transition, freezing and melting of liquids confined in the mesoporous silicateMCM-41. Philosophical Magazine Part B, 79(11-12):1847–1855, aug 2009.
45

BIBLIOGRAPHY
[58] Denis Morineau, Yongde Xia, and Christiane Alba-Simionesco. Finite-size and sur-face effects on the glass transition of liquid toluene confined in cylindrical mesopores.The Journal of chemical physics, 117(19):8966–8972, 2002.
[59] U Mueller, M Schubert, F Teich, H Puetter, K Schierle-Arndt, and J Pastre. Metal–organic frameworksâprospective industrial applications. Journal of Materials Chem-istry, 16(7):626–636, 2006.
[60] M Pilar Pen, Juan B Monto, Departamento De Ingenieria Quimica, Facultad DeQuimica, and Universitat De Valencia. Vapor - Liquid Equilibria for the BinarySystems tert -Butyl Alcohol + Toluene , + Isooctane , and + Methylcyclohexane at101 . 3 kPa Vicente MartÃ? pages 148–151, 1999.
[61] Michel Perez. Gibbs–thomson effects in phase transformations. Scripta materialia,52(8):709–712, 2005.
[62] B E Poling, J. M. Prausnitz, and J P O’Connell. Constants for the Antoine Equationfor Vapour Pressures of Pure Species, 2001.
[63] Ryong Ryoo, Sang Hoon Joo, and Shinae Jun. Synthesis of highly ordered carbonmolecular sieves via template-mediated structural transformation. The Journal ofPhysical Chemistry B, 103(37):7743–7746, 1999.
[64] Zeinab Sadjadi and Heiko Rieger. Scaling theory for spontaneous imbibition in ran-dom networks of elongated pores. Physical review letters, 110(14):144502, 2013.
[65] Peter Scheidler, Walter Kob, and Kurt Binder. The relaxation dynamics of a simpleglass former confined in a pore. EPL (Europhysics Letters), 52(3):277, 2000.
[66] Jan Swenson, Khalid Elamin, Helén Jansson, and Shigeharu Kittaka. Why is thereno clear glass transition of confined water? Chemical Physics, 424:20–25, 2013.
[67] a Vyalikh, Th Emmler, E Gedat, I Shenderovich, G H Findenegg, H-H Limbach, andG Buntkowsky. Evidence of microphase separation in controlled pore glasses. Solidstate nuclear magnetic resonance, 28(2-4):117–24, sep 2005.
[68] Yu Wang, Theodore T. Tsotsis, and Kristian Jessen. Competitive Sorption ofMethane/Ethane Mixtures on Shale: Measurements and Modeling. Industrial &Engineering Chemistry Research, 54(48):12187–12195, dec 2015.
[69] J Warnock, DD Awschalom, and MW Shafer. Geometrical supercooling of liquids inporous glass. Physical review letters, 57(14):1753, 1986.
[70] Edward W Washburn. The dynamics of capillary flow. Physical review, 17(3):273,1921.
[71] A Wittstock, V Zielasek, J Biener, C M Friend, and M Bäumer. Nanoporous goldcatalysts for selective gas-phase oxidative coupling of methanol at low temperature.Science (New York, N.Y.), 327(5963):319–22, jan 2010.
46

BIBLIOGRAPHY
[72] Yahui Xue, Jürgen Markmann, Huiling Duan, Jörg Weissmüller, and Patrick Huber.Switchable imbibition in nanoporous gold. Nature communications, 5(May):4237, jan2014.
[73] Omar M Yaghi, Michael O’Keeffe, Nathan W Ockwig, Hee K Chae, Mohamed Ed-daoudi, and Jaheon Kim. Reticular synthesis and the design of new materials. Nature,423(6941):705–714, 2003.
[74] Jeong-Ho Yun, Tina Düren, Frerich J Keil, and Nigel A Seaton. Adsorption ofmethane, ethane, and their binary mixtures on mcm-41: experimental evaluation ofmethods for the prediction of adsorption equilibrium. Langmuir, 18(7):2693–2701,2002.
[75] Dongyuan Zhao, Jianglin Feng, Qisheng Huo, Nicholas Melosh, Glenn H Fredrickson,Bradley F Chmelka, and Galen D Stucky. Triblock copolymer syntheses of meso-porous silica with periodic 50 to 300 angstrom pores. science, 279(5350):548–552,1998.
47

BIBLIOGRAPHY
48

2
Nuclear Magnetic Resonance studyof binary liquids in nanoconfinement
49

Chapter 2. Nuclear Magnetic Resonance study of binary liquids in nanoconfinement
I Scientific background and motivation
In the introduction, the physical properties of TBA, TOL and their mixtures have beenpresented. Although completely miscible at the macroscopic scale, availability of the -OHgroup in TBA molecules is found to promote clustering of TBA molecules at the nanoscalevia hydrogen-bonding interactions leading to structural changes by molecular associationobserved by neutron scattering and Raman spectroscopy as well as composition dependentchanges in dynamics, as observed by nuclear magnetic resonance. Confining moleculesin a spatial dimension in the nano-metre scale has been shown to influence structuraland dynamic properties of molecules when compared to bulk6,7,30. We expect that in ananoscale confinement, such hydrogen-bonding interactions in TBA molecules can lead toa modification of these mixture properties, which would also depend on the pore archi-tecture and chemical nature of the nanoporous substrates. Nuclear Magnetic Resonance(NMR) being a local technique and highly versatile in being useful for both structuraland dynamical characterisation of molecules10,11,20,24 is the preferred choice of techniqueto analyze confinement induced effects.
Structural studies of confined molecules have been done previously by interpreting theposition of 1H NMR chemical shift of functional group(s) that belong to the molecule(s)being probed. The position of chemical shift and line shape of spectrum associated to itprovides useful information of the electronic environment of the functional group, whichin turn is directly associated to the local structure of the molecules and the specific in-teractions (H-bonding, Van der Waals...) it undergoes with the surrounding molecules5,7.1H Magic Angle Spinning NMR (MAS NMR) technique is of great utility in characteris-ing molecules under nanoconfinement whose mobility is greatly reduced as it artificiallyinduces a motion-averaging analogous to isotropic motion-averaging of molecules in liquidstate, that enables obtaining precisely the chemical shifts of confined molecules.
One of the most popularly used technique for determining self-diffusion dynamics innanoconfined systems is the Pulsed Field Gradient NMR (PFG NMR)20,22,26. The ef-fects on self-diffusion dynamics under nanoconfinement have been shown to be influencedby the pore architecture and chemical environment of the host matrix9,10,16,30. Beyondsingle-component systems, NMR techniques have been used to investigate nanoconfinedmixtures undergoing phase separation under particular conditions29. Using a combinationof MAS NMR and PFG NMR can provide a wholesome knowledge and correlation of thestructure and dynamics of nanoconfined systems24.
As shown in the introduction, self-diffusion dynamics of TBA:TOL mixtures in bulkstate were found to undergo a slowdown with increasing concentration of TBA. Confine-ment of these molecules in cylindrical pores a few molecular diameters wide is expectedto curb the isotropic nature of diffusive motion and give more directional character to it.In the current chapter we use 1H MAS NMR and PFG NMR techniques on TBA:TOLmixtures confined in silica nanoporous matrices, MCM-41 and SBA-15, to investigate theinfluence of H-bonding interactions amongst confined molecules and their possible inter-
50

II. Fundamentals of NMR
action with the porous matrix driving nanostructuration and modification of dynamics ofmolecules compared to their bulk state.
II Fundamentals of NMRNuclear Magnetic Resonance (NMR) has proven to be an indispensable tool in spectro-scopic characterization of materials, especially for organic molecules of hydrocarbon origin.Only magnetically active nuclei with non-zero nuclear spins could be utilized for nuclearmagnetic resonance experiments, for example 1H,13C, 15N, 19F and 31P. Every spinningnucleus is equivalent to a bar magnet possessing a magnetic moment oriented along theaxis of spin. These magnetic moments generated by individual spins are randomly ori-ented in the absence of any external field. Upon application of an external magnetic field,the individual nuclear spins get aligned parallel or anti-parallel to the external field B0
8
, which leads to a split of the nuclear spins into lower and higher energy states respec-tively, amongst which transitions can take place from lower to higher state and vice-versa.This energy difference between the two states depends on B0 and is given by equation 2.1.
∆E = γhB0
2π = hν0 (2.1)
Where γ is called the gyromagnetic ratio, which is constant for each nucleus, h is thePlanck’s constant (6.626× 10⁻³⁴ J s) and ν0 is called the Larmor frequency. For typicalvalues of B0 =2 to 9 T, ν0 is in the radio-frequency (rf) range 50-1000MHz19.
In a typical NMR experiment, a suitable sample, for example, a hydrocarbon com-pound is put inside a glass or quartz tube and is placed at the center of a superconductingmagnet. As a consequence of the applied magnetic field, a splitting of nuclear spins oc-curs. The relative population distribution of spins between the two consecutive energystates is given by the Boltzmann distribution as follows19.
NHigher
NLower
= exp −∆EkBT
(2.2)
This difference results into a net magnetization ~M along ~B0. An alternating current pass-ing through a coil of wire surrounding the sample is used to generate an rf pulse, whosemagnetic field component Brf lies in the plane perpendicular to the applied external field~B0. ~Brf thus oscillates with a frequency ν, same as that of the corresponding rf pulse.When the value of ν is same as ν0, a resonance condition is met, some of the nuclear spinsare flipped to a higher energy state I = −1
2 , which causes the net magnetization ~M to flipfrom the direction ~B0. The component of ~M in the plane perpendicular to ~B0 generatesan alternating current which is processed by a receiver to obtain an NMR signal which isFourier transformed to get the NMR spectrum23.
Two of the three most important nuclear spin interactions are, dipolar coupling be-tween individual nuclear spins due to their individual magnetic fields and quadrupolar
51

Chapter 2. Nuclear Magnetic Resonance study of binary liquids in nanoconfinement
interactions between nuclei of spin ≥ 1. The third and one which concerns us most in thecontext of current chapter is due to magnetic field induced by electron clouds surround-ing a nucleus25.The strength of NMR lies in its ability to distinguish the same nucleuswhich is being probed when present in different electronic environments. Indeed nuclei aresurrounded by electrons, which generate an induced current, leading further to anothermagnetic field Bσ either opposing or augmenting B0
19. The net magnetic field thus actingon the nucleus changes to Bnet = B0 +Bσ and since the strength of Bσ is proportional toB0, we can rewrite Bnet as Bnet = B0(1 + σ), where σ is called the shielding or screeningConstant. Thus the difference in chemical environment around each functional groupleads to different values of σ, and consequently different resonance frequencies given byν0 = |γ|B0(1−σ)
2π , each unique and characteristic of a particular functional group giving riseto its respective peak in the NMR spectrum. In practice we express the NMR spectrumin a relative frequency scale, denoted by Chemical shift given by δ = ν0−νref
ν0∗ 106, where
νref is the NMR response a reference.
An important aspect to electronic shielding is the anistropy of electronic shieldingcaused due to presence of different functional groups. Orientation of such asymmetricelectron cloud with respect to the B0 could be different for individual molecules, lead-ing to a range of chemical shifts. In liquids, the strong isotropic movement of moleculesaverages out this effect as well as dipolar-coupling interactions and there is one uniquechemical shift for a certain functional group. In case of solids, due to the restrictedmobility of molecules, we obtain a distribution of chemical shifts instead. This effectis known as chemical shift anisotropy. The combination of dipolar coupling and chem-ical shift anistropy leads to broadening of an NMR spectrum in solids as the moleculesare strongly held in their positions. By confining liquids inside nanoscale geometries, astrongly restricted molecular mobility is induced similar to a solids. Thus, we explore anNMR technique specially suited to tackle such difficulties.
III 1H Magic Angle Spinning NMR (1H MAS NMR)of TBA and TOL mixtures in nanoconfinement
A Motivation for the application of MAS NMRDipolar coupling and chemical shift anisotropy are second rank tensors that depend on thesecond order Legendre polynomial 3 cos2 θ − 1, where θ is the angle between a given axisof interaction and external magnetic field. These interactions vanish when the Legendrepolynomial is equal to zero, i.e. θ = 54.73◦. This is known as the "magic angle".18
Orienting a solid state sample at magic angle with respect to external magnetic fieldand spinning at high frequencies (figure 2.1) averages out the dipolar coupling interactionsand chemical shift anistropy to produce an effect analogous to isotropic averaging ofnuclear spin interactions seen in liquids. This technique known as "Magic Angle Spinning"
52

III. 1H Magic Angle Spinning NMR (1H MAS NMR) of TBA and TOL mixtures in nanoconfinement
(MAS) results in narrowing of the spectrum and increased resolution compared to static-state spectrum as shown in figure 2.2.
Figure 2.1: Orientation of the sample at ”MagicAngle” = 54.7356o 13
Figure 2.2: Comparison of NMR spectra of TBA:TOL mixture confined in MCM-41 understatic condition (red line) and at Magic Angle Spinning (black line) (ν = 8 kHz)
53

Chapter 2. Nuclear Magnetic Resonance study of binary liquids in nanoconfinement
B Experiment
TOL and TBA were mixed in various volume ratios between %TBA = 0− 100. A cylin-drical zirconium oxide sample holder with an internal diameter of 4 mm, fitted at the topwith a cap made of high-strength polymer was used. This assembly of the cylindrical con-tainer and cap is called rotor. The rotor cap is designed with flaps which enable the entirerotor to be rotated at high frequencies using a combination of pressurized air streams inthe solid-state probe of Bruker Avance I WB 300 MHz(7 T) NMR spectrometer. The rotoris maintained at "Magic Angle" inside the cavity of a device in the solid-state probe calledstator as shown in figure 2.1.
MCM-41 powder was filled at 100% filling of its pores with TBA:TOL mixtures forany given concentration and packed inside the rotor tightly to be homogeneous along itslength in order to have uniform rotation. 1H NMR MAS experiments were carried outwith a frequency of rotation of 8 kHz. Figure 2.3(a) shows the MAS NMR spectra ofTBA:TOL mixtures of various compositions confined in MCM-41. In figure 2.3(b) thecorresponding static spectra are shown. Clearly the high resolution obtained by MAStechnique allows us to have a strong resolution of the four major peaks known from NMRmeasurements of bulk TBA:TOL mixtures.
In figure 2.3(a), recalling all the peaks once again, we have the methyl group fromTBA at ≈1ppm, methyl group from TOL at ≈2ppm, phenyl ring of TOL at ≈7ppm,while the only peak to change its relative position is the -OH peak from TBA, whichchanges its position between 4.5-2.5ppm as the concentration of TBA decreases in themixture.
In figure 2.4 we see the exact repetition of the MAS NMR spectrum, although vastlyreduced in intensity, zoom of the region as shown in the inset shows exact same lineshape. Position of each NMR line of this repeated spectrum is at same distance fromits corresponding NMR line of the main MAS NMR spectrum. Such periodic repetitionof the main spectrum is known as a spinning side-band which normally occur when thefrequency of MAS is less than the frequency width of chemical shift anisotropy, whichusually happens if the probed molecules have solid-like dynamics to some extent or dueto inhomogeneity in the magnetic field experienced by the sample. MAS NMR experi-ments carried out by putting two teflon spacers in the sample holder (rotor), such that thefilled MCM-41 powder was in centre of the rotors completely removed spinning sidebandsand thus we can safely attribute the presence of spinning sidebands to inhomogeneities inmagnetic field experienced by the sample.
Coming back to our main objective. In a series of experiments, the 1H MAS NMRspectra(8 kHz) of TBA:TOL mixtures confined in MCM-41 were obtained and the changeof −OH chemical shift was noted for each mixture composition up to ≈ 2% TBA byvolume. Solution-state NMR of the bulk mixtures were carried out as well over the sameconcentration range.
54

III. 1H Magic Angle Spinning NMR (1H MAS NMR) of TBA and TOL mixtures in nanoconfinement
(a)
(b)
Figure 2.3: (a) 1H MAS NMR spectra of TBA:TOL mixtures confined in MCM-41 atν = 8 kHz. The lines TBA at ≈1ppm, ≈2ppm and ≈7ppm represent the methyl groupsof TBA, TOL and phenyl group of TOL respectively, while the only peak to change itsrelative position is the -OH peak of TBA (4.5-2.5ppm)(b) Static solid state spectra forthe corresponding mixture compositions.
C Results and discussionFigure 2.5 shows the -OH chemical shift dependence on composition of TBA in MCM-41filled with TBA:TOL solutions as well as bulk liquid mixtures. The −OH chemical shift
55

Chapter 2. Nuclear Magnetic Resonance study of binary liquids in nanoconfinement
Figure 2.4: Presence of spinning sidebands observed in MAS NMR experiment of aTBA:TOL mixture confined in MCM-41. Inset zooms into the region. The exact lineshape as main spectrum is observed.
decreases linearly with decreasing concentration of TBA in the solution as can be observedfrom the solid line in the figure. However this linear decrease is only up to 20% (TBA byvol.), beyond which there is a rapid decrease in the chemical shift to very small values aswe go on diluting TBA further.
Comparing the chemical shift variation of bulk and confined TBA:TOL mixtures, asimilar linear decrease of -OH chemical shift with respect to concentration of TBA isnoticed up to ≈ 20% TBA. Upon higher dilution of TBA we notice a much rapid decreasein the -OH chemical shift for bulk mixtures, which is associated to decrease in electronicshielding of the -OH with breakdown of TBA clusters as interpreted from Raman spec-troscopy and 1H NMR spectroscopy1, as discussed previous in the introduction chapter.However the chemical shifts for confined mixtures are found to decrease linearly even athigh dilution and a significant value of -OH chemical shift continues to persist even atnegligible concentration of TBA (≈ 2%).
Existence of such finite -OH chemical shift at high dilution indicates the persistenceof electronic shielding on the -OH group due to presence of hydrogen-bonded structures,which could be either due to existed TBA clusters or specific interactions between TBAand MCM-41 pore wall due to their polar nature. The existence of TBA nanoclusters inTBA:TOL mixtures have been previously reported to exist even under nanoconfinement
56

III. 1H Magic Angle Spinning NMR (1H MAS NMR) of TBA and TOL mixtures in nanoconfinement
Figure 2.5: Change of -OH chemical shift as a function of % TBA for 1H MAS NMR ex-periments (circles) for solutions confined in MCM-41 and solution-state NMR expeirments(solid line). The dashed line is a guide for the eye.
by a combination of neutron scattering and numerical simulations15. However, comingdown to very high dilutions, the nanoclusters have been reported to break down in bulkstate1 and their existence under nanoconfinement as a result seems less likely. Thenthe remaining possibility is H-bonding interactions between TBA and the MCM-41 poresurface via -OH group in TBA and surface silanols in MCM-41. If this true, then weexpect a confinement induced structuration as TBA molecules will show a tendency toseparate out and attach to the pore walls. We expect such structuration of the confinedmixture into difference phases to modify the dynamics when compared to bulk state. Anissue which we attempt to understand in the following section.
57

Chapter 2. Nuclear Magnetic Resonance study of binary liquids in nanoconfinement
IV Pulsed Field Gradient Stimulated Echo NMR(PFG-STE NMR)
A Brief descriptionThe focus of this section is on the dynamic behaviour of our nanoconfined system, trans-lational self-diffusion to be more precise, the fundamentals of which are well established.One of the most well known equations for self-diffusion of a molecule in a fluid is givenby Stoke-Einstein relation (2.3)
D = kBT
6πηrs(2.3)
Where D is the diffusion constant of the diffusing fluid molecule, kB is the BotzmannConstant, T is temperature of the fluid, η is viscosity of the fluid and rs is known as theStoke’s radius22.
In an NMR experiment, upon application of a π/2 r.f pulse, the net magnetizationis flipped in the plane perpendicular to external magnetic field B0. As a consequence,individual nuclear spins spread out in this plane perpendicular to B0, soon after whichthey attempt to realign. In this process, some spins travel faster than others and areleading, while the rest lag behind. Upon applying a π r.f pulse to the system, positionsof individual spins are flipped by 180o, such that the previously slower spins are now theleading ones and vice versa. Finally realignment of these spins give rise to a signal knownas "spin echo".
However, applying a pulsed gradient of magnetic field parallel to B0 shortly afterapplication of the π/2 pulse modifies the net magnetic field acting on the nuclear spins.The effect of such spatial gradient of magnetic field is a loss of coherence between thespins. In a way each spin is coded according to the net magnetic field it experiences.After flipping the spins by 180o using π r.f. pulse, the spin echo signal could only beobtained by reversing the effect of previously applied pulsed field gradient and gainingback phase coherence of the nuclear spins. Thus a gradient pulse of equal strength isapplied, but in the opposite direction after the π pulse and with certain time delay ∆from the first pulse in order to restore the lost coherence. In this process however, owingto self-diffusion, some of the spins move away from their original positions and thus outof phase. Application of pulsed magnetic field gradients along z-axis change the effectivefield acting on the nuclear-spins, causing a phase-shift in the spins as give in equation 2.4.
φ = γgδz (2.4)
Where φ, γ, and δ are the phase shift of the spins, gyromagnetic ratio of the probednucleus and duration of the gradient pulse respectively and z is the distance travelled bya nuclear spin due to diffusion along the z-axis. The resulting echo signal thus undergoesa decay.Figure 2.6 shows the well known Stejskal and Tanner sequence28 of PFG-NMR
58

IV. Pulsed Field Gradient Stimulated Echo NMR (PFG-STE NMR)
experiment.
Figure 2.6: A typical Stejskal and Tanner sequence of PFG-STE NMR
In a typical PFG-STE NMR experiment, attentuation of the NMR echo signal is anexponential decay as given by the equation 2.5.
Ψ = I
I0= exp(−Dq2∆) (2.5)
WhereD (m2s−1) is the translational diffusion coefficient of the diffusing species. How-ever this equation is valid in its current form only in isotropic diffusion as in bulk liquids.
The translational self-diffusion coefficients of bulk TBA:TOL mixtures have been inter-preted simply by equation 2.5 and reported by Abdel Razzak et al.1 as discussed alreadyin chapter 1. However the possibility of structural reorganization induced by extremelysmall geometries of confinement makes it interesting to investigate its consequence on thedynamics of confined TBA:TOL systems as we discuss in the following sections.
B ExperimentTBA:TOLmixtures of various concentrations were prepared and confined in two nanoporoussilica powders, MCM-41 (φ=3.4 nm) and SBA-15 (φ=8 nm). The filled porous silica pow-der was put into 5 mm NMR tubes in a Diff60 diffusion probe, using a standard 3-pulsesstimulated echo (STE) sequence as shown in figure 2.7. The pulsed field gradients wereapplied after the first and third π/2 r.f. pulse.21
59

Chapter 2. Nuclear Magnetic Resonance study of binary liquids in nanoconfinement
Figure 2.7: PFG-STE NMR sequence utilizing threeπ2 pulses
MCM-41 powder was filled with TBA:TOL mixtures of various compositions insideNMR tubes and placed in the diffusion probe and probed by different ∆ periods =25, 50, 100, 150, 200ms respectively. For each ∆ value, the value of the gradient fieldintensity was varied from 0-3000 (Gcm−1). The PFG-STE NMR sequence remains un-changed for SBA-15 filled with TBA:TOL mixtures in various concentrations. Howeverthe ∆ values used were 5 and 20ms respectively. The strength of g used varied between0-300 Gcm−1.
C Results and discussion
C.1 MCM-41
Figure 2.8 shows the attenuation of NMR signal of pure TOL as a function of q for differ-ent ∆ mentioned in previous section, shown by various circles and triangles. Here q = gγδ(m−1) is analogous to the scattering vector in diffraction experiments. g is the strengthof pulsed field gradient, γ the gyromagnetic ratio of probed nucleus and δ the duration ofgradient pulse respectively.As we notice here, the attenuation of all the curves are roughly on top of each other
irrespective of ∆. However from equation 2.5 we expect a strong ∆ dependence in order tohave an isotropic self-diffusion. From transmission electron microscopy we have a roughestimation of the pore-length for MCM-41 to be ≈ 1 µm which is about three orders ofmagnitude greater than its pore diameter which is known to be ≈ 3.4 nm.Thus in thelength-scale of a pore, molecular self-diffusion is chiefly anisotropic as has been previouslyreported for diffusion in silica nanopores.27. Equation gives the expression for attenuationof an anisotropic self-diffusion process.
Ψ(δgγ) = I
I0= 1
2
∫ π
0exp−(γgδ)2∆(Dpara cos2 θ+Dperp sin2 θ) sin θdθ (2.6)
The model of anisotropic diffusion does however include a coefficient of diffusion in thedirection perpendicular to pore axis (Dperp), whose finite value has been attributed to dif-fusion through the pore walls or because of disorder in porous structure in the length scale
60

IV. Pulsed Field Gradient Stimulated Echo NMR (PFG-STE NMR)
Figure 2.8: Fit of Ψ = I(q)I0
versus q(µm−1) for attenuation curves from all ∆ values
of experiment27. θ is the angle a diffusing molecule makes with the pore axis. YohannLechaux et al. calculated the attenuation of magnetization using the above equation fortwo cases, first, no diffusion perpendicular to the pore axis exists, i.e. Dperp = 0 andsecondly with a finite value of diffusion perpendicular to pore axis such that Dperp 6= 021.The author reports a strongly ∆ dependent attenuation of magnetization irrespective ofexistence of any diffusive motion perpendicular to the pore axis or not, which is certainlynot the case. Secondly, the attenuation curves were expected to either decay rather rapidlywith q2 and then plateau to a constant value in case Dperp = 0 or decay completely tozero in case of Dperp 6= 0 within the range of q values used in the experiment.
Since none of the above conditions are fulfilled by the experimental points, we findthe model of unrestricted anisotropic diffusion not suitable for interpretation of the at-tenuation. Keeping in mind that the length of pore is in fact of finite length, a model foranisotropic restricted diffusion between two parallel planes given in equation 2.7 has beentested.
Ψ(q,∆) = 2[1− cos(2πqL)](2πqL)2 + 4(2πqL)2
∞∑n=1
exp(−n2π2D∆
L2
)1− (−1)n cos(2πqL)[(2πqL)2 − (nπ)2] (2.7)
Where L is the length of pore. q = gγδ is the scattering vector parallel to the pore-axis.Thus varying the strength of g from low to high values is equivalent to probing diffusive
61

Chapter 2. Nuclear Magnetic Resonance study of binary liquids in nanoconfinement
motions from low to high q values, in other words from a longer to smaller length scale,in the time period ∆. In figure 2.8, we see that the magnetization even at very highgradient strength (high q) decays only up to ≈ 50% of it’s original value.It is importantto note that the signal attenuation given by equation 2.7 is ∆ dependent as it is a sumof two terms, one of which varies with ∆. However the experimental attenuation curvesare ∆-independent. This condition could be fulfilled only if the ∆ dependent term inequation 2.7 is negligible, i.e.
4(2πqL)2∞∑n=1
exp(−n2π2D∆
L2
)1− (−1)n cos(2πqL)[(2πqL)2 − (nπ)2] ≈ 0
Which is possible when D >>L2
∆π2 .The experimental points of attenuation are thus fitted with the remaining term of equation2.7, which depends on the length of pore L, shown by a solid black line in figure 2.8. Theresult of the fit gives L = 0.65 µm.Using this value of L, we have D � 2× 10⁻¹² m2 s−1. The diffusion under confinementcould not be three orders of magnitude slower than bulk-like diffusion (2× 10⁻⁹ m2 s−1).The mean square displacement of a molecule is related to the diffusion constant as
〈u2〉 = 2∆D
Thus if L2 << ∆D, i.e. the mean square displacement is much larger than length of pore,it suggests that even with very small ∆ values that could be achieved experimentally(order of milliseconds), the self-diffusion of TOL is fast enough (� 2× 10⁻¹² m2 s−1),such that in the time scale of ∆, TOL molecules traverse a path much greater than lengthof the pore, i.e. several times along the length of pore.
Thus, owing to technical limitations, i.e., small pore length of MCM-41 and minimumpossible value of δ in milliseconds range, determination of the translational diffusioncoefficient of liquids under confinement was not possible. However it helped providecomplementary information on the pore-architecture by giving the value of pore length(L). Unintended though, this is an essential information on the architecture of the hostmatrix used. To overcome the structural limitation (small pore length) in determinationof D, the possible solution is the use of a porous matrix with pore length long enough todetermine D in typical ∆ time scales. Thus, SBA-15 owing to its longer pore size wasconsidered to be a more prospective host matrix, experiments on which are discussed inthe following section.
C.2 SBA-15
The diameter of typical SBA-15 pores is 8 nm, which is more than twice that of MCM-41 (3.4 nm). Thus the pore diameter of SBA-15 is large enough to accommodate 8-9molecular layers compared to about 4 molecular layers in MCM-41. This increased sizeof spatial confinement eases the restrictions on molecular motion. With the additionalproperty of corrugated pore-structure, we expect self-diffusion dynamics in SBA-15 to bedifferent compared to MCM-41.
62

IV. Pulsed Field Gradient Stimulated Echo NMR (PFG-STE NMR)
Just like MCM-41, SBA-15 nanopores also have pore lengths about three orders ofmagnitude larger than their pore diameter, promoting 1D molecular self-diffusion. Figure2.9 shows the attenuation of NMR signal versus q2 corresponding to the phenyl ring inTOL. i.e. TOL diffusion is being investigated for TBA:TOL compositions ranging from%TBA = 6% to %TBA = 90% for two different values of ∆ = 5 ms and ∆ = 20 ms shownin coloured circles and triangles respectively. The smaller T2 (transverse) relaxation timefor SBA-15 T SBA2 = 1.998 ms compared to that of MCM-41,TMCM
2 = 4.3 ms, preventsusing greater ∆ values for the experiment.
Figure 2.9: Attenuation of magnetization Ψ as a function of q2(µm−2) for different com-positions of TBA:TOL mixtures at ∆ = 5 ms (coloured circles) and ∆ = 20 ms (colouredtriangles) respectively.
The magnetization in SBA-15 decayed rapidly close to zero at very low q2 values forboth the ∆ values used. A ∆-dependent attenuation is observed which decays fast atlow q2 values and approaches close to zero. Some degree of concentration dependence isobserved between individual curves, although qualitatively we observe it to be non-linear.Since the attenuation in magnetization is related to the diffusion coefficient, such non-linear and small concentration-dependence of individual curves are in strong deviationfrom TOL diffusion coefficients in bulk mixtures which decrease steadily with decreasingTOL concentration as discussed in introduction chapter.These observations are completelydifferent from that observed in MCM41. The fact that we observe a full decay of the at-
63

Chapter 2. Nuclear Magnetic Resonance study of binary liquids in nanoconfinement
tenuation curves seems to indicate an unrestricted diffusion instead.
We know that SBA-15 pore length just like in MCM-41 surpasses its pore diame-ter (8 nm) by three orders of magnitude, an anisotropic diffusion model with restrictedpore-length (equation 2.7) was tested keeping the length of pore and diffusion coefficientparallel to pore axis (Dpara) as free parameters. The range of Dpara = 10−7 m2/s to10−12 m2/s and length of pore from 1 to 100 µm were used. Figure 2.10 shows the plot ofI(q)/I0) versus q2∆ for 40:60 TBA:TOL mixture composition by %volume for ∆ = 5 msand ∆ = 20 ms, both shown in black crosses. The closest possible fit for the curves wereobtained for Dpara = 8× 10⁻⁸ m2/s and L = 50 µm. We observe that the attenuationfor experimental points is much more rapid than predicted by the model of anisotropicdiffusion in restricted pore length.Thus the above model is found to be incompatible with experimental curves. One pos-
Figure 2.10: Attenuation of magnetization for 5 and 20 ms shown by crosses. Solid blacklines are calculated curves of anisotropic self-diffusion in restricted pore-length along poreaxis.
sibility of such an occurrence might be due to much greater length of SBA-15 pores thanMCM-41, such that in the time scale of experiment the pore-length appears as infinitelylong. If this is the case, then application of unrestricted anisotropic diffusion seems moreapt. Recalling equation 2.6, by removing the perpendicular component of diffusion coef-ficient, we simply reduce equation 2.6 to the following expression.
64

IV. Pulsed Field Gradient Stimulated Echo NMR (PFG-STE NMR)
Ψ(δ, g,∆) =√π
2√Dpara∆q
erf(√Dpara∆q) (2.8)
Figure 2.11 shows the plot of experimental I(q)/I0 versus q2 curves of a %TBA = 40mixture for the different ∆ values (circles) and the fit of curves (solid lines) using equation2.8. We notice that only experimental points of ∆ = 20 ms could be fitted, the best fit ofwhich was obtained for Dpara = 2× 10⁻⁸ m2/s. This value is an order of magnitude fasterthan TOL diffusion in the corresponding bulk mixture (D40TBA
TOL ≈ 1.7× 10⁻⁹ m2/s) and isincompatible with the experimental points at ∆ = 5 ms. A faster than bulk diffusion mighthave been interesting for interpretation has it been valid over both ∆ values. Consideringthe rapid decay of attenuation followed by a much slower decay at higher q values, theinterpretation of experimental points by a single unique diffusion coefficient might not bethe most ideal option.
Figure 2.11: Experimental points for attenuation of %TBA = 40 mixture at ∆ = 5 ms(red circles) and ∆ = 20 ms (blue circles) respectively. The solid lines (red and blue) showthe best fit of experiments for an anistropic self-diffusion model restricted between twoplanes and only parallel to the pore axis (equation 2.8).
We can as well visualize the attenuation curve to represent two different popula-tions, each with separate isotropic self-diffusion dynamics. Thus the attenuation for suchdouble-component diffusion can be written as a double exponential as shown in the fol-
65

Chapter 2. Nuclear Magnetic Resonance study of binary liquids in nanoconfinement
lowing equation.
I(q)I0
= Ae−q2D1∆ +Be−q
2D2∆ (2.9)
Where D1 and D2 are the diffusion coefficients at the fast and slow diffusion regionsrespectively (low and high q respectively). A and B are constants. Figure 2.12 showsthe plot of experimental points for attenuation of %TBA = 40 mixture at 5 and 20 msby red and blue circles respectively. The solid lines represent best fit of the curves usingequation 2.9.The result of fit gives D5ms
1 = 1.3× 10⁻⁷ m2/s ± 0.2 and D5ms2 = 2.4× 10⁻⁸ m2/s ± 0.2
Figure 2.12: Experimental points for attenuation of %TBA = 40 mixture at ∆ = 5 ms(red circles) and ∆ = 20 ms (blue circles) respectively. The solid lines (red and blue) showthe best fit of experiments for a two-component diffusion model (equation 2.8).
for ∆ = 5 ms and D20ms1 = 1.22× 10⁻⁷ m2/s± 0.2 and D20ms
2 = 9.8× 10⁻⁹ m2/s± 0.2 for∆ = 20 ms, while the values of constants are A5ms = 0.83± 0.03, B5ms = 0.18± 0.03 andA20ms = 0.95± 0.01, B20ms = 0.07± 0.01. The values of A and B suggest that majorityof dynamics belongs to very fast diffusive motions, > 80% at ∆ = 5 ms and > 90% at∆ = 20 ms, that is two-orders of magnitude faster than bulk self-diffusion constant ofTOL. On the other hand, the slower component which made up ≤ 18% and ≤ 7% of thesignal for ∆ = 5 ms and ∆ = 20 ms is found to be an order of magnitude faster than TOL
66

V. Conclusion
diffusion in bulk mixture for the former, while about the same as bulk for the latter. Onething quite clear here is that most of the observed attenuation corresponds to very fastdynamics which might be due to fast exchange of molecules between the confined liquidand surrounding vapour phase. This is consistent for both values of ∆ used. On the otherhand, the D2 diffusion coefficients though not in equally good agreement tend to be closerto bulk-like diffusion.
Finally, the diffusive dynamics of molecules in the binary mixture confined in SBA-15materials is found to be very different, at least at first glance, from the one observed in thesmaller pores of MCM-41 molecular sieves. Qualitatively, the observed dynamics appearsunrestricted and much faster than expected. The analysis of the dataset that could berecorded within our experimental limitations did dot provide up to now a clear quantita-tive view on the translational molecular dynamics. In order to get deeper understandingof this system, measurements at both shorter and longer ∆ values would be necessary, butare unfortunately unaccessible experimentally because of the unfavorable spin relaxationproperties of the confined liquid.
V Conclusion
The general trend of lowering of -OH chemical shift upon dilution of TBA is similarunder bulk and in confinement up to 20% TBA by vol. in mixtures, while its persistenceto significant values upon high dilution of TBA under confinement is in strong contrastto the rapid decrease in its value to nearly zero in bulk liquid mixtures. In spite ofthe evidence for existence of TBA nanoclusters in confinement, their persistence at highdilutions is less likely even in bulk mixtures. These specific interactions between -OHgroup from TBA and silanol groups on MCM-41 pore surface, which might give rise toa new hydrogen-bonded network. If this is true, then MCM-41’s surface selective naturetowards TBA might drive a confinement induced nano-segregation process of molecules,leading to a richer concentration of TBA at pore surface.
The possible effect of a nanosegragation on self-diffusion dynamics was studied forconfinement of TBA:TOL mixtures in MCM-41 and SBA-15. A ∆ independent natureof attenuation was observed in case of MCM-41. This was interpreted in terms of fastmolecular motions, with a mean-square displacement exceeding the pore length found tobe close to 0.65 µm.
The diffusion dynamics in SBA-15 though expected to be characteristic of an aniso-tropic diffusion, were rather found to be two-component in nature, although this inter-pretation still needs to be confirmed. Composed mostly of a very fast diffusing compo-nent, with diffusion coefficient two-order of magnitude larger than TOL molecules in bulkTBA:TOL mixture of the same composition. Such fast diffusive motion could be associ-ated to fast exchange of molecules between confined molecules and surrounding vapourphase of TBA and TOL molecules. The slower component was closer to a bulk-like diffu-sion and depending on the ∆ time used to probe, was found to be faster or slower thanbulk.
67

BIBLIOGRAPHY
Bibliography[1] Abdel Hamid, A. R., Lefort, R., Lechaux, Y., Moreac, A., Ghoufi, A.,
Alba-Simionesco, C., and D, M. Solvation Effects on Self-Association and Seg-regation Processes in tert -Butanol and Aprotic Solvent Binary Mixtures. Journal ofPhysical Chemistry B 117 (2013), 10221–10230.
[2] Adem, Z., Guenneau, F., Springuel-Huet, M.-A., Gédéon, A.,Iapichella, J., Cacciaguerra, T., and Galarneau, A. Diffusion Proper-ties of Hexane in Pseudomorphic MCM-41 Mesoporous Silicas Explored by PulsedField Gradient NMR. The Journal of Physical Chemistry C 116, 25 (jun 2012),13749–13759.
[3] Aksnes, D. W., Førland, K., and Stöcker, M. 1H NMR relaxation anddiffusion studies of cyclohexane and cyclopentane confined in MCM-41. Microporousand Mesoporous Materials 77, 1 (jan 2005), 79–87.
[4] Aksnes, D. W., and Gjerda, L. NMR line width , relaxation and diffusionstudies of cyclohexane confined in porous silica. 27–34.
[5] Azaïs, T., Tourné-Péteilh, C., Aussenac, F., Baccile, N., Coelho, C.,Devoisselle, J.-M., and Babonneau, F. Solid-State NMR Study of IbuprofenConfined in MCM-41 Material. Chemistry of Materials 18, 26 (dec 2006), 6382–6390.
[6] Babonneau, F., Yeung, L., Steunou, N., Gervais, C., Ramila, A., andVallet-Regi, M. Solid State NMR Characterisation of Encapsulated Molecules inMesoporous Silica. Journal of Sol-Gel Science and Technology 31, 1-3 (aug 2004),219–223.
[7] Buntkowsky, G., Breitzke, H., Adamczyk, A., Roelofs, F., Emmler,T., Gedat, E., Grünberg, B., Xu, Y., Limbach, H.-H., Shenderovich,I., Vyalikh, A., and Findenegg, G. Structural and dynamical properties ofguest molecules confined in mesoporous silica materials revealed by NMR. Physicalchemistry chemical physics : PCCP 9, 35 (sep 2007), 4843–53.
[8] Canet, D., Canet, E., and Boubel, J.-C. La rmn: concepts, møthodes etapplications.
[9] Courivaud, F., Hansen, E., Karlsson, A., Kolboe, S., and Stöcker, M.Pulsed field gradient NMR study of the diffusion of n-hexane confined in hydroxylatedand dehydroxylated MCM-41 of various pore diameters. Microporous and MesoporousMaterials 35-36 (apr 2000), 327–339.
[10] Courivaud, F., Hansen, E., Kolboe, S., Karlsson, A., and Stöcker, M.Enhanced n-hexane diffusion in partially filled MCM-41 of different surface hydropho-bicity probed by NMR. Microporous and Mesoporous Materials 37, 1-2 (may 2000),223–232.
68

BIBLIOGRAPHY
[11] Dubbeldam, D., and Snurr, R. Q. Recent developments in the molecular mod-eling of diffusion in nanoporous materials. Molecular Simulation 33, 4-5 (apr 2007),305–325.
[12] Dvoyashkin, M., Khokhlov, A., Naumov, S., and Valiullin, R. Pulsed fieldgradient NMR study of surface diffusion in mesoporous adsorbents. Microporous andMesoporous Materials 125, 1-2 (oct 2009), 58–62.
[13] Edison, A. S., and Long, J. R. Spectroscopy: The magic of solenoids. Nature447, 7145 (2007), 646–647.
[14] Gedat, E., Schreiber, A., Findenegg, G. H., Shenderovich, I., Limbach,H.-H., and Buntkowsky, G. Stray field gradient NMR reveals effects of hydrogenbonding on diffusion coefficients of pyridine in mesoporous silica. Magnetic Resonancein Chemistry 39, S1 (dec 2001), S149–S157.
[15] Ghoufi, A., Hureau, I., Morineau, D., Renou, R., and Szymczyk, A.Confinement of tert-butanol nanoclusters in hydrophilic and hydrophobic silicananopores. The Journal of Physical Chemistry C 117, 29 (2013), 15203–15212.
[16] Gjerdåker, L., Aksnes, D. W., Sørland, G. H., and Stöcker, M. Relax-ation and diffusion studies of cyclohexane confined in MCM-41 by NMR. Microporousand Mesoporous Materials 42, 1 (jan 2001), 89–96.
[17] Hamid, A. R. A. Nanoségrégation d’un liquide binaire confiné dans des matériauxmésoporeux. PhD thesis, Université Rennes 1, 2012.
[18] Hennel, J. W., and Klinowski, J. Magic-Angle Spinning : a Historical Perspec-tive. 1–14.
[19] Hore, P. Nuclear magnetic resonance. Oxford University Press, 2015.
[20] Kärger, J., Stallmach, F., and Vasenkov, S. Structure-mobility relations ofmolecular diffusion in nanoporous materials. Magnetic Resonance Imaging 21, 3-4(apr 2003), 185–191.
[21] Lechaux, Y. Etude experimentale de la dynamique de liquides nanoconfines. Masterthesis, Institut de Physique de Rennes, Université de Rennes 1, Institut de Physiquede Rennes UMR CNRS 6251 Bat. 11 A, B, C, D, E 263 Avenue du Général Leclerc35042 Rennes CEDEX France Tél : 02 23 23 52 92, 2013. Nom du responsable : M.Lefort Ronan Maître de conférences Tel : 02 23 23 69 07 [email protected].
[22] Price, W. S. Pulsed-field gradient nuclear magnetic resonance as a tool for studyingtranslational diffusion: Part 1. basic theory. Concepts in magnetic resonance 9, 5(1997), 299–336.
[23] Roberts, J. Nuclear magnetic resonance. J. Am. Chem. Soc 80 (1958), 501.
69

BIBLIOGRAPHY
[24] Romanova, E. E., Grinberg, F., Pampel, A., Kärger, J., and Freude, D.Diffusion studies in confined nematic liquid crystals by MAS PFG NMR. Journal ofmagnetic resonance (San Diego, Calif. : 1997) 196, 2 (feb 2009), 110–4.
[25] Shaw, D. Fourier transform nmr spectroscopy. 2.
[26] Stallmach, F., Gräser, A., Kärger, J., Krause, C., Jeschke, M., Ober-hagemann, U., and Spange, S. Pulsed field gradient NMR studies of diffusionin MCM-41 mesoporous solids. Microporous and Mesoporous Materials 44-45 (apr2001), 745–753.
[27] Stallmach, F., Kärger, J., Krause, C., Jeschke, M., and Oberhage-mann, U. Evidence of Anisotropic Self-Diffusion of Guest Molecules in NanoporousMaterials of MCM-41 Type. Journal of the American Chemical Society 122, 38 (sep2000), 9237–9242.
[28] Stejskal, E. O., and Tanner, J. E. Spin diffusion measurements: spin echoesin the presence of a time-dependent field gradient. The journal of chemical physics42, 1 (1965), 288–292.
[29] Valiullin, R., Kortunov, P., Körger, J., and Timoshenko, V.Concentration-dependent self-diffusion of liquids in nanopores: a nuclear magneticresonance study. The Journal of chemical physics 120, 24 (jun 2004), 11804–14.
[30] Vyalikh, a., Emmler, T., Gedat, E., Shenderovich, I., Findenegg, G. H.,Limbach, H.-H., and Buntkowsky, G. Evidence of microphase separation incontrolled pore glasses. Solid state nuclear magnetic resonance 28, 2-4 (sep 2005),117–24.
70

3
Dynamic vapour sorption study ofbinary gas adsorption in nanopores
71

Chapter 3. Dynamic vapour sorption study of binary gas adsorption in nanopores
I Scientific background and motivation
In the previous chapter with the help of a 1H MAS NMR chemical shift study we foundevidence for persistence of a hydrogen-bonded network in TBA:TOL mixtures confinedin MCM-41 nanopores even at high TBA dilutions. Hydrogen-bonded network of TBAclusters present in bulk TBA:TOL mixtures have been shown to disintegrate and dis-appear rapidly once its concentration in mixture goes below 20% by a combination ofRaman spectroscopy, 1H NMR and neutron scattering experiments and we speculatedthat persistence of a hydrogen-bonded network in nanoconfinement could be the result ofH-bonding interactions between TBA and silica surface. Certainly this speculation needsa stronger justification and its resulting effect on the molecular organization needs to beinvestigated.
In this chapter we use gravimetric vapour sorption technique to find answers to thequestions raised above. It is an isothermal vapour sorption process in which the relativepressure of the vapour of an adsorbing species is increased very gradually step-wise, suchthat at each step the system is under thermodynamic equilibrium. The resulting massuptake can be systematically interpreted to understand from a thermodynamic point ofview the role played by specific interactions between the adsorbing molecules and thesubstrate starting from the formation of first molecular layers at low relative pressures tillcomplete condensation into liquid phase at high pressure. The extent of intermolecularinteractions between different adsorbing species on a given surface can be compared bytheir relative thermodynamic affinity for the surface.
Adsorption phenomena for single-component systems consisting of a pair of adsorbateand adsorbent have been explained well since several decades from a thermodynamics andstatistical physics standpoint4,9,10,13,27,38,40–43,51,53. However, the establishment of funda-mentals on adsorption of multi-component systems34,35 continues to face challenges dueto the ever growing complexity such systems in spite of the progress in numerical simu-lations1,6,19,24,25,31,33,36. Currently, scientific interest has grown to understand adsorptionof multicomponent systems55,60 which show a very low gap of miscibility12,17,22,23,25–27.One of the earliest attempts were from Siperstein and Myers53. Besides, the ideal ad-sorbed solution theory, vacancy solution theory28, extended Langmuir isotherm model9and other models45,46,52 for binary liquid mixtures have provided significant improvementin explaining mixed-gas adsorption. Some of these models attempt to explain multi-component adsorption equilibria from the individual single-component data.
The current work provides a model to interpret semi-quantitatively the role played byrelative differences in thermodynamic affinity of components of a binary gas towards asubstrate utilizing the mixed gas adsorption data, which in the case of TBA:TOL confine-ment in nanopores of different chemical environment shall be highly useful in interpretingand comparing the relative strength of interaction of each component with the pore surfaceand the possible role played by it to lead confinement induced structuration.
72

II. Fundamentals of vapour sorption
II Fundamentals of vapour sorptionThe vapour sorption technique utilizes the property of adsorption of gases on given sub-strates for their characterization. This technique helps obtaining varied sorts of informa-tion, from understanding co-adsorption of gases essential for gas separation and filtrationapplications, to characterizing porous substrates and understanding the specific interac-tions between adsorbing gas molecules and the host matrix as discussed in the previoussection. The adsorption mechanism of pure gases on solid substrates is understood to agreat extent by the Langmuir32 and Brunauer Emmett and Teller (BET)10 developed onthe basis of thermodynamics and statistical physics. The success of these models is shownin their wide application in characterization of porous systems.
The Langmuir model assumes, firstly, that all adsorption occurs only up to one mono-layer of molecules in contact with the solid substrate, secondly, the entire surface is madeof up a certain number of equivalent adsorption sites and thirdly, that particles adsorbedin adjacent sites do not interact with each other. The average number of adsorbed parti-cles on a surface according to the Langmuir model is given as follows (equation 3.1)20
〈N〉 = N0 exp((ε0 + µ)/kBT )1 + exp((ε0 + µ)/kBT ) (3.1)
Here ε0 is the energy of interaction of a single particle (atom) adsorbed on the surface, µand T are the chemical potential and temperature of the gas reservoir. kB is the Boltz-mann constant and N0 is the number of available sites for adsorption.
The BET model on the other hand assumes that besides the first monolayer adsorbedon a substrate’s surface, the rest of incoming molecules adsorb as a continuous liquid filmabove the monolayer and in thermodynamic equilibrium with the reservoir of particles ingas phase. Since the BET model could account for more than a monolayer of adsorbedmaterial, it is the classical choice for treatment of adsorption data and is widely used fordetermination of specific surface area of porous materials. Similar to the Langmuir model,the adsorbed particles on the adjacent sites to not interact with each other, neither dothe particles in liquid state adsorbed over monolayer particles at adjacent sites. The BETmodel seems calculates the number of adsorbed particles at a given partial pressure of thegas as follows20
〈N〉 = N0Kξ
(1− ξ)[1 + (K − 1)ξ] (3.2)
Here K is known as the BET constant which depends on ε0 and εl, the energy of inter-action of an adsorbed particle on the surface of substrate and energy per particle of themulti-layer liquid film formed above the first adsorbed monolayer respectively. They arerelated together as K = exp
(ε0−εlkBT
). The term ξ is given as ξ = exp
(µ+ εlKT
)= P
Psat,
where Psat is the saturating pressure of the adsorbing, while P
Psatis the relative pressure.
73

Chapter 3. Dynamic vapour sorption study of binary gas adsorption in nanopores
Thus, according to a BET model, the number of adsorbed particles is simply depen-dent on ξ, considering that N0 and K are constants for a given surface and adsorbinggas pair. In the context of real substances, the weight gained by the porous substanceupon adsorption of certain gas atoms or molecules could be translated directly into thenumber of particles by converting it into number of moles gained (1 mole=NA, Avagadronumber of particles). As the value of ξ heads towards 1, the number of adsorbed particlesas predicted by the BET equation heads towards infinity. However when we talk aboutadsorption inside a pore, the restricted spatial environment puts a limit to the numberof particles that could be adsorbed, thus making the BET model valid only up to lowrelative pressures ξ = 0.15− 0.3, beyond which the adsorbing particles tend to condenseinto liquid state.
The following section describes the experimental procedure used to adsorb our modelbinary gas mixture of TBA:TOL in a porous substrate of choice over a range of differentconcentrations.
III Experimental procedureThe adsorption of binary gas mixture of TBA and toluene was carried out by the VTI–SA+ Vapour Sorption apparatus from TA instruments, a Dynamic Vapour Sorption ap-paratus56 using nitrogen as a carrier gas. The two liquids, TBA and toluene were mixedtogether in a desired ratio and filled into the reservoir. The reservoir was maintainedat 35 ◦C, which was sufficient to vaporize the liquid mixture to a binary gas mixture,thanks to high volatility of the two liquids at room temperature itself. Dry nitrogen gaswas connected to the setup and its pressure was maintained at 1.4 bar approximately inorder to create a flow of the gas from the nitrogen cylinder to the apparatus. A flow ofnitrogen gas went and mixed with binary gas mixture located in the evaporator, formingan organic vapor carried by nitrogen with a partial pressure corresponding to the binaryliquid saturating pressure. This saturated gas flow is then mixed with a second flow ofdry nitrogen gas in order to tune the resulting partial pressure. The concentration of theorganic vapor in the gas stream reaching the sample is determined by the fraction of gasgoing through the organic solvent evaporator and the fraction of dry gas by using massflow controllers, one for dry nitrogen and the other for nitrogen saturated with organicvapor. The mixture of dry nitrogen and binary gas was sent to the sample chamber con-sisting of a microbalance with two pans, one of which contained MCM–41 powder, whilethe other was left empty as a reference for measuring the change in weight of the sample.
A drying step prior to the adsorption process was carried out, where the powder washeated to 120 ◦C, at a heating rate of 2 ◦C min−1 under dry nitrogen flux for 120 minutesto remove any possible remaining adsorbed solvents or water inside the pores of MCM–41. After the completion of this step, a mixture of binary gas and nitrogen was beingsent to the sample. The partial pressure steps which we denote by P
P0, where P0 is the
saturating pressure for the binary gas and P is the partial pressure of the binary gas,were increased from 0 to 0.95 and decreased from 0.95 to 0 again during the adsorptionand desorption steps respectively. The adsorption of gas on the MCM substrate was
74

III. Experimental procedure
quantified at equilibrium. The equilibrium criterion in our experiments before movingon from a certain partial pressure step to the next one was a change in weight of thesample lower than 0.0010 % during at least 5 minutes. Both the sample cell and reservoir(saturator) of liquid are maintained at the same temperature (35 ◦C), with an accuracy ofa few degrees. The increase/decrease in mass of the sample during adsorption/desorptionrespectively was recorded as percentage-change in mass of the sample and was plottedagainst increasing/decreasing values of P
P0. The liquid reservoir was filled with TBA and
toluene mixtures in different compositions, ranging between pure toluene and pure TBA.Several liquid bath compositions have been studied, the corresponding list of TBA
volume fractions is : 0.0, 0.2, 0.5, 1.0, 2.0, 5.0, 10.0, 30.0, 50.0, 70.0, 90.0 and 100.0 %. Theschematic of the vapour sorption setup is shown in figure 3.1. The humidity sensor shownin the setup is simply a part of the instrument used only for water adsorption experimentsand is not to be taken into account in the context of current work. The porous substrates
Figure 3.1: Schematic diagram of the vapour sorption experiment
of choice were MCM-41 and CMK-13, both having pore sizes a few molecular layers wide,a hexagonal arrangement of pores, however differing in the chemical nature of the pores.While MCM-41 consists of silanol groups on its pore walls giving it a hydrophilic nature,
75

Chapter 3. Dynamic vapour sorption study of binary gas adsorption in nanopores
CMK-13 has carbonized pore walls, giving it a hydrophobic character. Understanding ofthe nature of TBA:TOL binary gas adsorption in these two different materials is discussedin the following sections.
IV MCM-41: Results and discussionTypical adsorption isotherms of TBA:TOL adsorption in MCM-41 pores are shown infigure 3.2. Here the x-axis is represented by P
Psat, the partial pressure relative to Psat
which is the saturation pressure of the binary gas-liquid equilibrium. Although completecycles of adsorption and desorption were carried out, due to highly ordered MCM-41 withvery little pore size distribution (see introduction), the adsorption and desorption curvesare almost completely identical with negligible to no hysteresis as shown in figure 3.3.The vapour sorption curve of TOL was found to be in good agreement with previouslyreported volumetric-adsorption experiment of TOL in MCM-415. In the current workwe focus our attention only to the adsorption process. All isotherms can be divided inthree regions. The partial-pressure region with P
Psat≤ 0.1 is characteristic of formation of
first few monolayers. By this point we notice that these monolayers already contribute toabout 30% weight increase of the powder. Succeeding to it is the capillary condensationregion marked by a step-rise of adsorbed mixture which occurs due to condensation of theadsorbing gas mixture into a binary liquid mixture. Finally we reach a plateau beyondwhich the weight of the porous powder does not increase any more owing to completelyfilled pores. We now treat step by step each stage of the adsorption process in the followingsections.
A Low partial pressure regionAs discussed in section II the BET model for treatment of adsorption data at low pres-sures is widely used for single-component systems. We developed a multi-component BETadsorption model with same basic assumptions as in the single-component BET model.Like in the classical BET model for a pure gas, we assume that a binary gas made of twocomponents i = 1, 2 is adsorbed on a planar surface divided in N0 equivalent adsorptionsites. The scheme of the binary gas adsorption is shown in figure 3.4.
A.1 Calculating the grand canonical partition function
Pure gas
The canonical partition function Z of a perfect gas adsorbing on a single site is givenby Z = 1
N !
(Vλ3
)N, where N and V are the number of particles and volume of the gas
respectively and λ is called the thermal length given by λ = h√2πmKBT
. We thuscalculate the free energy as:
F = −kBT ln(Z) ' NkBT [ln(N
Vλ3)− 1]
76

IV. MCM-41: Results and discussion
Figure 3.2: Vapour sorption isotherms (adsorption branch) of TBA:TOL mixtures inMCM-41 measured at 35 ◦C for different volume fractions:pure toluene (solid black line),xTBA = 0 : 5% (blue line), xTBA = 10% (red line), xTBA = 50% (green line) and pureTBA (black dashed line). For clarity, only a few concentrations ar shown.
And thus pressure of the gas as
P = − ∂F
∂V
∣∣∣∣∣T,N
= NkBT
V
(equation of state of a gas). The chemical potential of the gas is calculated as:
µg = ∂F
∂N
∣∣∣∣∣T,V
= kBT ln(Nλ3
V
)
= kBT ln(Pλ3
kBT
)
= kBT ln(P
P0
)(3.3)
Where P0 = kBT
λ3 is the reference pressure. However it is more practical to use the liquidsaturation pressure Psat as a reference. The chemical potential µl and energy per particle
77

Chapter 3. Dynamic vapour sorption study of binary gas adsorption in nanopores
Figure 3.3: Adsorption branch of TBA, TOL and TBA:TOL mixture with 50% TBAby volume, shown by solid blue, black and red lines respectively and their correspond-ing desorption curves shown by thick black crosses, thin black crosses and red trianglesrespectively in MCM-41 measured at 35 ◦C.
of the liquid are related to each other as µl = −εl. The chemical potential of gas andliquid are related to the Psat as shown in equation 3.4.
µg − µl = kBT ln(P
Psat
)(3.4)
or equivalently:ξ = P
Psat= exp
(µg + εlkBT
)(3.5)
Multi-component gas
In the current chapter we will use x and y to denote volume fraction/mole fraction of acertain component in a liquid mixture and gas mixture respectively. The partial pressureof the ith component in a gas mixture can be related to the total pressure by:
Pi = yiP (3.6)
Where yi is its mole(or volume) fraction in the gas mixture. At the mixture liquid-vapourequilibrium P = Psat, the saturation pressure. At this point the chemical potentials of
78

IV. MCM-41: Results and discussion
Figure 3.4: Scheme of the adsorption of a binary gas mixture on independent sites of aplanar surface as described by a binary BET model.
the ith component of in the gas and liquid mixture are related as :
µ(g)i (P = Psat) = µ
(l)i = −ε(l)
i
ε(l)i being the energy per particle of the ith component in the liquid state. If we generalizeequation 3.4 for the mixture we have for each component at any partial pressure Pi :
µ(g)i − µ
(l)i = kBT ln
(PiPsat
)(3.7)
or equivalently :
qi = PiPsat
= yiξ = expµ(g)
i + ε(l)i
kBT
(3.8)
A.2 The multi-component BET model
We denote the canonical partition function of adsorption on a single site by z, then thegrand canonical function of adsorption on all the N0 sites is given by
Z = zN0 (3.9)
The energy of the first adsorbed particle on a site and energy per particle making up themulti-layer liquid film are given by −ε0 and −εl respectively as shown in figure 3.4. Forthe component i of mixture, this is denoted by −ε0
i and −εli respectively. In the context ofthis work, i = 1, 2 as we are dealing with a binary gas mixture. A given state on one siteis then determined by only two numbers: the number of particles of type i adsorbed, andthe total number of adsorbed particles on the site. Depending on its energy an adsorbedparticle is present in three different states:
79

Chapter 3. Dynamic vapour sorption study of binary gas adsorption in nanopores
1. Zero particle adsorbed, reference energy ε = 0
2. Particle of type 1 is adsorbed on the surface directly. n particles are adsorbed on itmaking the multiple layers, consisting of n1 particles of type 1, and n−n1 particlesof type 2. The total number of particles at a given site is thus n+1 and the numberof type 1 particles is n1 +1. The particles making up the multi-layer film are presentin Cn1
n equivalent states, each with energy ε = ε01 + n1ε
(l)1 + (n− n1)ε(l)
2 .
3. Particle of type 2 is adsorbed on the surface directly instead of particle 1 and allthe conditions remain same as in 2. above. Thus the particles making up themulti-layer film are present in Cn1
n number of equivalent states, each with energyε = ε0
2 + n1ε(l)1 + (n− n1)ε(l)
2 .
The partition function for a given adsorption site z is thus given by:
z = 1 +∞∑n=0
n∑n1=0
{n1n exp
µ1 + ε01 + n1µ1 + n1ε
(l)1
kBT
×exp
(n− n1)µ2 + (n− n1)ε(l)2
kBT
(3.10)
The liquid film comprising the adsorbed multi-layers is in equilibrium with the gas reser-voir, thus having the same chemical potential, i.e. µi = µ
(g)i . Applying this to equation
3.7, we have
expµi + ε
(l)i
kBT
= qi = yiξ
Therefore we re-write equation 3.10 as:
z =1 +[exp
(µ1 + ε0
1kBT
)+ exp
(µ2 + ε0
2kBT
)]×
∞∑n=0
n∑n1=0
{n1n exp
n1µ1 + n1ε(l)1
kBT
exp(n− n1)µ2 + (n− n1)ε(l)
2kBT
=1 +
expµ1 + ε
(l)1 − ε
(l)1 + ε0
1kBT
+ expµ2 + ε
(l)2 − ε
(l)2 + ε0
1kBT
× ∞∑n=0
n∑n1=0
{n1n q
n1 q
n−n12
(3.11)
According to Newton’s binom, we can rewrite the termn∑
n1=0{n1n q
n1 q
n−n12 as
n∑n1=0
{n1n q
n1 q
n−n12 = (q1 + q2)n
This leads us toz = 1 + K1q1 +K2q2
1− q1 − q2(3.12)
80

IV. MCM-41: Results and discussion
With the constants
Ki = expε0
i − ε(l)i
kBT
Where Ki is equivalent to the BET constant of the ith component of the mixture (seeequation 3.2), which is indicative of the strength of interaction of an adsorbed particleon the substrate surface relative to that with the multi-layer liquid phase. Thus a highervalue of K indicates stronger affinity of a given particle to adsorb on the substrate surface.We now calculate 〈Ni〉, the average number of particles of type i adsorbed as follows:
〈Ni〉 = N0kBT∂ ln z∂µi
= N0kBT∂ ln z∂qi
∂q1
∂µi= N0
qiz
∂z
∂qi
Utilizing equation 3.12 here, we obtain∂z
∂qi= Ki(1− ξ) +K1q1 +K2q2
(1− ξ)2
Which leads us to equation 3.13
〈Ni〉 = N0yiξ
1− ξKi(1− ξ) +K1q1 +K2q2
1− ξ +K1q1 +K2q2(3.13)
We re-write equation 3.13 based on Sp, the total specific surface area of the sample anda, the average effective surface area of the adsorbing particles such that N0 = Sp
a
〈Ni〉 = Spyia
ξ
1− ξKi + ξ[(Ki −Kj)yi +Kj −Ki]
1 + ξ[(Ki −Kj)yi +Kj − 1] (3.14)
Where i, j = 1, 2 for referring to TBA and TOL.The value of Sp is determined experi-mentally through nitrogen-adsorption, while yi is known before-hand. ξ are simply thepartial-pressure steps, thus leaving us with Ki,j, relative energetic affinities of the twoadsorbing components upon which 〈Ni,j〉 and consequently the total number of adsorbedparticles 〈N〉 = 〈Ni〉+ 〈Nj〉 depends, with "a" being a result of relative number of i and jparticles adsorbed. From nitrogen-adsorption isotherms carried out on MCM-41 synthe-sized in our lab we have the BET specific surface area Sp = 970 m2 g−1. The values of ξbelong to P
Psat≤ 0.15, characteristic of low partial pressure region, as already discussed.
The values of yi were not determined directly by experiment, but were calculated fromvolume fraction xi of the liquid solution, which elaborated in the introduction.
From the 〈Ni〉 values, the corresponding % mass uptake could be calculated using thefollowing equation.
%massuptake = 〈N1〉M1 + 〈N2〉M2
NAmi
× 100 (3.15)
Where 〈N1,2〉 andM1,2 are the number of molecules of component 1 and 2 adsorbed andtheir molecular weights respectively. NA is the Avogadro number (6.023× 10⁻²³ mol−1)and mi is the initial (empty) weight of the porous substrate.
81

Chapter 3. Dynamic vapour sorption study of binary gas adsorption in nanopores
A.3 Composition of the first monolayer
The average total number of adsorbed particles in the low partial pressure region can becalculated from equation 3.14 as 〈Nt〉 = 〈Ni〉+ 〈Nj〉. From equation 3.14 we have
〈Nt〉 = Spa
ξ
1− ξK
1 + ξ(K − 1)(3.16)
Where K = Kiyi + Kjyj. A monolayer would be formed when all the N0 sites arecompletely filled, in other words when 〈Nt〉 = N0 = Sp
a. From equation 3.16 we thus have
ξ
1− ξK
1 + ξ(K − 1)= 1
We denote the ξ at monolayer formation as ξm. The above equation could be expressedas function of ξm as
ξm =√K − 1K − 1
(3.17)
The monolayer composition xm at ξm is thus given by:
xm(ξm) = 〈Ni〉〈Nt〉
= yi(K −Ki) +
√K(Ki − 1)√
K(K − 1)(3.18)
In further discussions the reference to compositions of the binary gas, monolayer or liquidreservoir will be made to TBA i.e. i=TBA.
A.4 Application of the Multi-component BET to adsorption isotherms
Figure 3.5(a) shows the best fits of experimental points in the adsorption isotherm (dots)by equation 3.15 by keeping the value of Sp constant (see section A.2) and adjusting asingle set of Ki for all curves and a different value of effective molecular area a for eachconcentration.The best fit of the curves gives
KTBA = 3652± 200
KTOL = 36± 2
while the best fit values of a are shown in figure 3.5(b). We find that KTBA is two ordersof magnitude larger than KTOL. This indicates a much higher thermodynamic affinityof MCM-41 surface to adsorb TBA molecules compared to TOL. The effect of this isobserved evidently in the composition of monolayer formed on MCM-41 pore surface asshown in figure 3.5(b)(dashed line) where the TBA composition of monolayer is plottedagainst its concentration in the binary gas (yTBA) and in the bulk liquid reservoir (xTBA).Once the concentration of TBA in vapour crosses ≈ 20% (≈ 10% in liquid), its concen-tration in the monolayer is almost 100% and with increasing TBA concentration in the
82

IV. MCM-41: Results and discussion
(a)
(b)
Figure 3.5: (a) Multi-component BET fits (full lines) of adsorption isotherms (dots) forξ or P
Psat≤ 0.15 from pure TBA (light blue, topmost) to pure TOL (dark blue, lower
most). The squares are ξm, partial pressure of monolayer formation. (b) Monolayer TBAcomposition xTBAm (dashed line) and average molecular area a versus TBA composition inliquid reservoir xTBA and in the binary gas yTBA (solid line)
vapour (and liquid respectively) it makes up 100% of the monolayer.
The variation of the effective BET molecular a a with composition of TBA (figure3.5(b)) qualitatively follows the same trend as that of monolayer composition, highest atpure TOL and decreasing with increasing TBA composition, however not equally sharply.From equation 3.14 the value of P/Psat at complete monolayer adsorption was calculatedand using equation 3.18 the mass of monolayer at that pressure was calculated as shownby the squares in figure 3.5(a). The mass of monolayer estimated for pure TOL is an arti-ficial value as its capillary condensation step occurs before the calculated value of P/Psat
83

Chapter 3. Dynamic vapour sorption study of binary gas adsorption in nanopores
for monolayer formation. However, instead of a monotonic decrease in mass of monolayeras should be expected with increase in TBA composition, we observe that after decreas-ing to some extent, the monolayer mass begins to increase once again as composition ofTBA reaches higher values. This is consistent with the non-constant effective moleculararea. At this point we reach certain limits of our multi-component model, which doesnot account for the differences in nature of molecular interactions in the two components,being a mix of Van der Waal’s and aromatic potential for TOL, while hydrogen-bondingfor TBA which is related to the density of silanol groups on the pore surface of MCM-41. Also, the possibility of specific interactions between neighbouring sites could not betotally ruled out. In the frame of BET approach, a lower density of adsorption sites isequivalent to a higher effective molecular area. Considering that the cross-sectional areaof TBA molecules is smaller than TOL, an increase in mass of monolayer at high TBAconcentration could be explained by the possibility of filling in more TBA molecules in agive area leading to densification of the monolayer and an increase in its mass.
The increasing partial pressure leads to adsorption of more number of molecules overthe monolayer leading us to the next phase of the adsorption process known as capillarycondensation.
B Capillary Condensation
The increasing partial pressure continues to build up more number of molecular layers onthe pore surface until we reach a certain pressure where a condensed liquid phase becomesthermodynamically more favourable11,14,47. We denote this as the capillary condensationpressure Pc. At Pc we notice a sharp rise in mass of adsorbed material (figure 3.2). ThePc
Psatvalues are found to be strongly concentration dependent and increase with increasing
TBA composition in the gas phase (yTBA) as shown by black dots in figure 3.6.We find here that the capillary condensation pressures are much higher than that of
monolayer formation (see figure 3.5 (a) (square boxes)), giving a clear indication that cap-illary condensation does not occur directly after monolayer formation. This is also visiblein the mass of adsorbed material, which is approximately twice at capillary condensationstep than at monolayer formation. Following the works of Celestini11 and Pellenq et al15,the capillary condensation pressure Pc can be related to the surface tension σ of the bulkliquid at the liquid-gas interface through a modified-Kelvin equation:
PcPsat
= exp[− σ
kBTρ(R0 − t− λ)
](3.19)
Where R0, ρ and T are the radius of pore, number density of the adsorbed film andthe temperature respectively. t is thickness of the adsorbed film and λ is a nanometriccorrelation-length between the solid-film and film-gas interfaces. Surface tension measure-ments of pure TBA, TOL and their bulk mixtures were carried out at 35 ◦C and plotted infigure 3.7 (black dots) against the xTBA mixture compositions of the liquid reservoir whilethe solid blue line shows the best fit obtained using the Hildebrand and Scott model58 for
84

IV. MCM-41: Results and discussion
Figure 3.6: Experimental capillary condensation relative partial pressures ( Pc
Psat) of the
TBA/TOL solutions adsorbed in MCM–41 versus TBA composition of the gas (yTBA)or liquid (xTBA) solution. The solid line is the best fit according to the modified Kelvinequation 3.19 (see text). Inset: Scaled schematic representation of the adsorbed filmat the capillary condensation pressure. The blue (resp. orange) filled circles representTBA (resp. TOL) molecules. The dashed circle shows the predicted inner radius of theadsorbed liquid film at the capillary condensation.
calculating surface tensions of bulk liquid mixtures.
σ = σtbaxtba + σtolxtol −(σtba − σtol)2
kBT(xtbaAtol + xtolAtba)xtbaxtol (3.20)
Where σ, σtba and σtol are the surface tensions of TBA:TOL mixtures, TBA and TOLrespectively. xtba and xtol are their mole fractions and the fitting parameters are theirmolecular cross-sections Atba and Atol respectively. The result of fit gives us:
Atba = 2.9× 10⁻¹⁹ m, Atol = 3.5× 10⁻¹⁹ mThey correspond to effective molecular radii of rtba = 0.3 nm and rtol = 0.33 nm re-spectively which are not so far from their Van der Waals radii rvtba = 0.43 nm andrvtol = 0.47 nm25 respectively. The good correlation between the two radii suggests thatthe correction to be made to the Hildebrand and Scott model due to the non-ideal natureof our solutions is small.
85

Chapter 3. Dynamic vapour sorption study of binary gas adsorption in nanopores
A concentration dependent Pc
Psat(figure 3.6) indicates that irrespective of forming a nearly
Figure 3.7: Experimental surface tensions of the bulk TBA/TOL solutions. The solid lineis the best fit obtained using the Hildebrand–Scott equation (see text).
pure TBA monolayer of fixed thickness equivalent to a size of TBA molecule for almostall mixture compositions, the situation just prior to capillary condensation step varieswith concentration. The solid blue line in figure 3.6 is a fit of the black points with themodified-Kelvin equation (eq.3.19). Surface tension σ and number density ρ values of bulkliquid mixtures of composition xTBA at 35 ◦C were used along with known radius of MCM-41 (3.4 nm) pores keeping the term t+ λ = δ as the adjustable parameter. The best fit isobtained for δ = 1.14 nm. This value is approximately twice the thickness of a monolayerof TBA, which might as well be interpreted from the mass of adsorbed material at cap-illary condensation, which is about twice of that at monolayer (see figures 3.2 and 3.5 (a)).
We do not have any direct measurement on either t or λ, but we are certainly surethat t > 0.43 nm, i.e. thickness of one monolayer of TBA. Thus we have λ < 0.71 nm, avalue for correlation length too high for simple liquids47. However it is easily noticed thatcapillary condensation takes place at a partial pressure much higher than of monolayerformation. Thus with the assumption of t to be approximately two monolayers thickwe arrive at the correlation length, λ ≈ 0, implying that there exists two uncorrelatedlayers making up the film preceding capillary condensation. We interpret this to be aresult of complete coverage of the silica surface by a monolayer of TBA. This blocks
86

IV. MCM-41: Results and discussion
the silanol groups which were formerly freely available and prohibits the possibility ofhydrogen-bonding interactions with incoming molecules. The second layer is formed on ahydrocarbon surface of TBA molecules which does not have specific preference to eitherof the two molecules. This layer is made up of both TBA and TOL and is not correlatedwith the TBA monolayer strongly attached to the pore wall. Considering how well equa-tion 3.19 fits the experimental points using surface tension and number-density values ofbulk TBA:TOL mixtures of xTBA composition, it appears that the average compositionof the adsorbed film is about the same as xTBA.
If the conclusions above are true, then we expect the monolayer of TBA which isstrongly attached to the pore wall to exist even after the capillary condensation pressure.This point is addressed in the following section.
C High partial pressure regionSubsequently after the capillary condensation stage we notice in figure 3.2 at high partialpressures the adsorption curves reach a plateau implying that the pores are completelyfilled with a binary mixture of TBA and TOL. The final mass of the adsorbed materialmf could be written as as a function of xTBA as
mf (xTBA) = Vp [ρTBAφTBA + ρTOL(1− φTBA)] (3.21)
Where Vp = 0.67 cm3 g−1 is the porous volume of MCM-41, φTBA is the volume fractionof TBA inside the pore and ρTBA, ρTOL are the densities of pure TBA and TOL. Equation3.21 could be re-written to express φTBA in terms of the final adsorbed masses of a givenmixture (mf ), TBA (mf (1)) and TOL (mf (0)).
φTBA(xTBA) = mf (xTBA)−mf (0)mf (2)−mf (0) (3.22)
Figure 3.8 shows the variation of φTBA as a function of both xTBA and yTBA (black dots).Similar to the behaviour observed at low partial pressures, we notice a strong affinity ofMCM-41 for adsorbing TBA preferentially as its volume fraction inside the pore is muchhigher compared to its corresponding composition in the mixture at liquid or vapourstate. Even at very low amounts of TBA in the liquid (respectively vapour) state, thevalue of φTBA increases rapidly, up to a certain threshold for φ ≈ 0.44, beyond which itsrise is more gradual with its increase in the liquid or vapour phase. From geometricalconsideration, the volume fraction of pore occupied by a monolayer of TBA could bewritten down as
φmono = (r0 − dtba)2
(r0)2 ≈ 0.44
Thus we speculate here that there is a phase separation of the two liquids, with formationof a monolayer or shell of TBA molecules as soon as we reach φTBA ≈ 0.44. Thus wecan estimate the composition of the core enclosed inside the TBA-shell by the followingequation.
xcore = φTBA − φ1− φ (3.23)
87

Chapter 3. Dynamic vapour sorption study of binary gas adsorption in nanopores
The red points in figure 3.8 show the variation of the volume fraction of TBA in the core(xcore) with xTBA and yTBA. We find the core to be highly concentrated in TOL, morethan the initial liquid mixture in the reservoir. MCM-41 materials thus definitely actas a selective sieve for the alcohol (TBA). The key role of hydrogen bonding network ofTBA in the physical mechanism of this selectivity is revealed clearly in the adsorptionisotherms. A change in the selectivity is thus expected by tuning the chemical natureof the pore walls, i.e. from hydrophilic to hydrophobic. Vapour-sorption of TBA:TOLmixtures described in the following section on hydrophobic CMK-3 consisting of porewalls made of carbon addresses this question.
Figure 3.8: Final composition φTBA of the liquid inside the pores after capillary con-densation versus the original composition xTBA (black circles). The red circles show thededuced composition of the liquid in the core of the pore within the frame of a core–shellmodel. The black dotted curve shows the composition of TBA in binary gas versus inbinary liquid mixture, while the blue dashed line is y = x line indicating the compositionof original liquid mixture as a guide for the eye.
V CMK-3: Results and discussionIn the previous sections, by the example of TBA:TOL mixtures confined in MCM-41nanopores we saw how a greater thermodynamic affinity of silica surface towards TBAled to its strongly preferential adsorption and phase separation at complete pore fill-ing. Switching the chemical nature of the surface from hydrophilic to hydrophobic wouldchange the nature of interactions of TBA and TOL with the pore surface and consequentlytheir thermodynamic affinity towards the surface, effects of which on the adsorption char-acteristics of our binary gas are worth investigating. For this purpose we choose CMK-3,
88

V. CMK-3: Results and discussion
which as described in the introduction (chapter 1) is an ordered nanoporous material, pos-sessing the same 2-D periodicity as its template matrix SBA-15, but with hydrophobiccarbon walls instead of hydrophilic silica ones.
Due to an unfortunate drift in the sample environment (thermal insulation of the sat-urator reservoir) that occurred but could not be fixed during the present work, it was notpossible to carry out the DVS experiments on CMK-3 materials at the same temperatureas for silica matrices. Hence, TBA:TOL adsorption on CMK-3 was carried out at 25 ◦C,in order to limit the effects of temperature gradients on the measurements. The adsorp-tion and desorption curves for all experiments are shown in figure 3.9.The data providedhere for adsorption of xTBA = 0.9 mixture is only for the adsorption branch and up toP/Psat = 0.13.
As is clearly noticeable here, unlike MCM-41, in CMK-3 the adsorption branch doesnot follow the same shape. Mass uptake continues to increase quite linearly to highP/Psat values and instead of a sharp first order change in mass uptake characteristic ofcapillary condensation phenomenon, a smoother gradual transition is observed betweenP/Psat = 0.4 − 0.6. The final mass uptake changes proportionately with increasing con-centration of TBA, however a significantly low mass uptake is seen for TBA which mightbe attributed to the fact that it starts crystallizing at ≈25 ◦C which can cause pore block-ing and prevention of further uptake of molecules. As a consequence, we have decidednot to take into account the data on pure TBA in the following analysis.
On the other hand we notice another major difference in the nature of desorptioncurves when comparing CMK-3 to MCM-41. Not only a strong hysteresis is observed,but also the desorption occurs in two steps. Such observation was made for nitrogenadsorption isotherms as well and is indicative of a broader pore size distribution (seeintroduction).
As in the case of MCM-41, we maintain our focus on the adsorption branch of CMK-3as it is a step-by-step process in thermodynamic equilibrium, more suitable to understandsurface-specific interactions between host and guest molecules.
A Low-partial pressure regionFor adsorption in CMK-3, we observe a rather broad range of values of P/Psat whereformation of the first monolayers possibly take place, i.e. the region preceding capillarycondensation pressure. We recall equation 3.13, the multi-component BET model derivedin previous sections in order to calculate the average number of adsorbed particles and theresulting weight increase of the porous sample. We utilise Sp = 368 m2 g−1 as obtainedfrom BET surface area characterisation of our CMK-3 powder obtained from nitrogenadsorption isotherm.
Figure 3.10 (a), shows the experimental points of the adsorption of pure TOL andmixtures with composition xTBA = 0.5, 0.7, 0.9 and their fits using the multi-componentBET model (equation 3.15) obtained by keeping the BET specific surface area of CMK-3,Sp = 368 m2 g−1 constant and once again adjusting a single set of Ki values, while letting
89

Chapter 3. Dynamic vapour sorption study of binary gas adsorption in nanopores
Figure 3.9: Adsorption curves of vapour sorption isotherms of TBA:TOL mixtures inCMK-3 measured at 25 ◦C for different volume fractions. Pure TOL: black solid line,xTBA = 0.5: red, xTBA = 0.7: blue, xTBA = 0.9: green and pure TBA: dashed black line.The corresponding desorption curves are shown in black, red, blue and grey symbols forPure TOL, xTBA = 0.5, xTBA = 0.7 and pure TBA respectively .
a, the effective BET molecular area to vary with each composition.The best fit of the experiment yields
KcmkTOL = 1411± 150
KcmkTBA = 239± 30
i.e. KTOL is approximately six times greater than KTBA. This is in strong contrastto their corresponding values for adsorption in MCM-41, being Kmcm
TOL = 36 ± 2 andKmcmTBA = 3652± 200.
Even though the difference between these two values is not as high in CMK-3 asMCM-41, the thermodynamic affinity has obviously been reversed making TOL muchmore preferable for adsorption on CMK-3 surface than TBA. The impact of this reversalin surface-specific interactions is also observed as a smaller TBA monolayer concentrationin comparison to its corresponding binary gas/binary liquid mixture as shown in figure3.10(b) (dashed line). The composition of this monolayer in CMK is however not pure
90

V. CMK-3: Results and discussion
(a)
(b)
Figure 3.10: (a) Multi-component BET fits (full lines) of adsorption isotherms (dots) onCMK-3 up to P/Psat = 0.13. Pure TOL (blue), xTBA = 0.5 (red) and xTBA = 0.7 (blue),xTBA = 0.9 (green). Square points indicate the partial pressure at which monolayer isformed for each case. (b) Monolayer TBA composition versus yTBA shown by dashed linewhile the solid line shows effective BET molecular area.
TOL, and this observation is in agreement with the smaller difference between KTBA andKTOL. On the other hand, the effective molecular area shown by solid line in figure 3.10(b)does not show any specific concentration dependence, rather stays in a narrower rangewhen compared to its qualitative concentration dependence for MCM-41. The mass ofmonolayer decreases with increasing TBA concentration as seen in figure 3.10(a) (squarepoints), which is in good agreement with the corresponding increase in TBA monolayercomposition, TBA having a molecular weight lower than TOL .
The mass rise gradually continues much further to the partial pressure of monolayerformation (0.4 6 P/Psat 6 0.6) until capillary condensation takes place, which shall bediscussed in the following subsection.
91

Chapter 3. Dynamic vapour sorption study of binary gas adsorption in nanopores
B Capillary condensationIn figure 3.9 we observe a step-increase in the mass uptake between P/Psat values rangingfrom 0.4-0.6, which appear to be characteristic of condensation of adsorbing molecules in-side the pores as discussed earlier in this chapter for adsorption in MCM-41. However themajor difference here is the smooth nature of this transition when compared to the abruptchange observed in MCM-41. It has been shown previously by GCMC simulations thatfor adsorption in nanopores with constant diameter as well as with constrictions of smallerdiameters along the length of pore, the capillary condensation step becomes increasinglysmoother with the increase of temperature beyond critical hystersis temperature (tem-perature beyond which adsorption-desorption hysteresis disappears) and we tend towardsa critical point where the phase boundary between vapour and liquid state diminishessignificantly16. It is important to note here that we observe a strong hystersis betweenadsorption and desorption curves in CMK-3 (figure 3.9) which leads us to interpret theobservation on the basis of a second possibility.
As discussed earlier in the introduction chapter, the BJH treatment of nitrogen ad-sorption isotherms revealed a broad pore size distribution in CMK-3. Since capillarycondensation pressure depends strongly on the curvature of a pore, such distribution ofpore diameters prevents from having one sharp step rise at capillary condensation unlikeMCM-41. Thus prediction of Pc/Psat on the basis of modified Kelvin equation (equation3.19) is not favourable. This adds to the fact that only three concentrations could be ac-cessible to the experiment within the time available for this study, which is obviously toosmall for a detailed characterization of the capillary condensation behaviour, especiallyat low TBA concentrations.
However we do make an attempt to apply equation 3.19 for predicting capillary con-densation pressures for two cases, first using the average pore radius r0 = 1.95 nm asobtained by BJH treatment and secondly using the most probable pore radius obtainedby the same treatment r1
0 = 2.8 nm which are significantly different.
Figure 3.11 shows the plot of experimental Pc/Psat values (black dots) obtained fromthe onset or first point of inflexion and its fit using the modified Kelvin-equation (equation3.19) for r0 = 1.95 nm (dashed blue line) and r1
0 = 2.8 nm (solid red line), both ofwhich superimpose on each other, arguing of the same (and good) quality of the fit. Themeasured values of bulk surface tensions at 298 K of TBA:TOL mixture compositionsfrom 0 to 100% were used. Number densities were calculated from mass density values ofTBA:TOL mixtures at 298 K as reported in literature44.
Following the same analysis procedure as for MCM41 materials, the fit of the experi-mental points for r0 = 1.95 nm gives δ ≈ 4.5Å while for r1
0 = 2.8 nm δ ≈ 12.9Å obtainedby keeping δ = t + λ as the fitting parameter and assuming the liquid film on the poresurface to have composition equal to that of adsorbing gas mixture, i.e. yTBA.
Comparing figures 3.10(a) and 3.9, we find that the mass uptake right at the onsetof capillary condensation is about 1.4 times greater than the mass uptake at monolayer.Thus, we might interpret the situation just prior to capillary condensation as existence ofa liquid film made of one monolayer with more molecules adsorbing over it, which might
92

V. CMK-3: Results and discussion
Figure 3.11: Fit of experimentally obtained values of Pc/Psat (black dots along with errorbars) fitted by calculated Pc/Psat by the modified Kelvin-equation for r0 = 1.95Å (dashedblue line) and r1
0 = 2.8 nm (solid red line).
be in the form of capillary bridges linking the adsorbed film across the pore.
Considering δ ≈ 4.5Å which is approximately equal to thickness of a monolayer ofTOL ≈ 4.7Å, then we conclude that λ, the correlation length is nearly zero and thethickness of adsorbed film, t ≈thickness of one monolayer. This is incompatible with thefact that mass uptake at the onset of capillary condensation is about 1.4 times greaterthan at monolayer and the thickness of adsorbed film must account for this additionalmass.
On the other hand, considering δ ≈ 12.9Å, a value more than twice as much asthickness of a single monolayer, because of the lack of information on the values of tand λ, we examine the situation based on the information that mass uptake is 1.4 timesgreater at capillary condensation. This means that t > thickness of a monolayer. Thusfor t > 4.7Å we obtain λ < 8.2Å, once again a value probably too high for simpleliquids. However if λ ≈ 0, the thickness of film at capillary condensation should be morethan twice as much of a monolayer, which is totally in disagreement with experimentalobservation .
As anticipated already, we confirm that the application of modified-Kelvin equationis unsuitable for interpreting quantitatively the capillary condensation pressure for ad-
93

Chapter 3. Dynamic vapour sorption study of binary gas adsorption in nanopores
sorption in CMK-3, as a broad pore size distribution prevents having one unique capillarycondensation, instead a distribution of capillary condensation pressures results into smear-ing of this step into a smooth transition.
C High Partial Pressure regionFinally we examine the adsorption isotherms at high partial pressures, usually consideredthe region beyond capillary condensation leading to complete filling of nanopores. Keep-ing in mind the linear mass increase at the end of adsorption branch is not related topore filling, we consider the maximum mass uptake for TOL, xTBA = 0.5 and xTBA = 0.7to be at P/Psat = 0.53, 0.65, 0.75 respectively. The volume porosity known from nitrogenadsorption isotherms based on pores 3.5 nm in diameter is ≈ 0.22 cm3 g−1. The volumeporosity as calculated from the total amount of TOL adsorbed at the end of adsorp-tion branch, assuming the density of confined TOL equal to its mass density at 25 ◦C,i.e. 0.861 g cm−3 21 was found to be ≈ 0.264 cm3 g−1, which is quite comparable to thatobtained from nitrogen isotherm. This corresponds to a porous volume of Vp = 1.575 µl.
From Vp and bulk density of TBA at 25 ◦C, (0.7803 g cm−3), known from literature21we may calculate the mass of TBA adsorbed assuming the porous volume to be completelyfilled with TBA molecules. Then using equation 3.22 we can estimate the concentrationof TBA in the pores at complete filling from final weights of adsorbed mixtures. Figure3.12 shows the estimated volume fraction of TBA inside the pores as a function of itsconcentration in the liquid reservoir xTBA. The error bars were estimated based on theerror in measurement of initial weight of the dry sample.
We do notice two things here, firstly the volume fraction of TBA in pore matches verywell its binary gas concentration (yTBA) for corresponding xTBA = 0.5 mixture (liquidreservoir), and secondly the volume fraction of TBA in pore for xTBA = 0.7 mixture isapparently equal to pure TBA. Obviously the second observation is unrealistic.
Assuming the composition of adsorbed material in the pores to be the same as itscorresponding vapour phase composition i.e. yTBA, we calculate the volume occupied bythe adsorbed material from its mass uptake at complete filling and its bulk density atyTBA = 0.5889 and yTBA = 0.6935 composition to be approximately 1.577 µl and 1.528 µlrespectively. If the volume uptake of TOL (1.575 µl) corresponds to 100% of availablepore volume, then the % of pore filled for the mixtures is ≈ 100% and 97% respectively.Since density of TBA is less than that of TOL, the corresponding mass uptake at completefilling has to be lower for TBA. Therefore values closer to mass uptake of TBA at completefilling will indicate a higher TBA composition. For the xTBA = 0.7 mixture, we find themass uptake at complete filling (1.2247 µg) to be less than the calculated mass uptakeof TBA (1.227 µg). This may be attributed to partial filling of pores irrespective of itscomposition. If the pore composition of this mixture is indeed same as its gas phase,then this partial filling corresponds to 97% of porous volume filled, as calculated above.Although this value is not far from complete pore-filling, its still sufficient to make adifference of few tens of micro-grams in final weight of adsorbed material which is enoughto cause significant error in estimation of pore composition owing to very high sensitivityof the technique, thus giving an apparent composition equal to 100% TBA.
On the other hand for the xTBA = 0.5 mixture we find the final pore composition
94

V. CMK-3: Results and discussion
Figure 3.12: Volume fraction of TBA inside the pore at complete filling (black points).The blue dotted line is the corresponding binary gas composition (yTBA), while the blackdashed line is a guide for the eye.
to follow the adsorbing binary gas composition, thus being much richer in TBA (≈ 59%TBA) than its corresponding monolayer stage (≈ 21% TBA). This condition necessitatesthe preferential adsorption of TBA subsequent to monolayer formation. As discussed inthe case of adsorption in MCM-41, after coverage of pore surface with first monolayer itloses any specific preference to either TBA or TOL for subsequent adsorption. If that isthe case, then the pore composition at complete filling could not be explained by prefer-entially greater TBA adsorption. Indeed we arrive at the limitation of our method for thecalculation of pore composition which necessitates the availability of experimental valueof mass uptake for pure TBA. Considering the high sensitivity of this method, an errorin estimation of mass uptake simply by calculation from bulk density and porous volumeis enough to produce significant error in the final pore composition. At this point, wehave to admit that lack of data, i.e. unavailability of experimental mass uptake of pureTBA and more number of mixtures restricts our ability to probe the situation at completefilling reliably as done for MCM-41.
95

Chapter 3. Dynamic vapour sorption study of binary gas adsorption in nanopores
VI Conclusion
The isothermal adsorption of TBA, TOL and their mixtures occurs in three major stagesgoing from lower to higher partial pressures. The high affinity of TBA to adsorb on thesolid silica pore-walls in MCM-41 at low partial pressures leads to complete coverage ofthe pore-surface by a monolayer of TBA even at very small concentration of TBA inthe binary gas mixture. This is attributed to the presence of free silanol groups on thepore-surface capable of making hydrogen-bonds with TBA. However a monolayer of TBAmodifies the pore-surface as it covers the free silanol groups and it is the methyl groupsof TBA instead which face towards the core of the pore.
As partial pressure increases, the incoming TBA and TOL molecules now facing TBAmethyl groups do not adsorb so selectively, thus forming the succeeding layer which isa mixture of both TBA and TOL. From the application of modified-Kelvin equation,we find that an approximately two-layer thick film precedes the capillary condensationpressure and that the last layer formed before condensation seems to have lost the memoryof the interaction with the silica surface. The strong contrast between the nature ofintermolecular forces in the two layers, hydrogen-bonding for TBA attached to pore-surface while Van der Waals interactions for the TBA:TOL mixed layer is seen as thereason for the loss of correlation with the pore wall. The finite pore size prevents naturalclustering of TBA molecules as observed in 1H NMR MAS experiments (section III,chapter 2).
The fit of experimental capillary condensation pressures by the modified-Kelvin equa-tion is compatible with a composition of the adsorbed film at Pc identical to the one ofthe liquid phase mixture. We attribute this to the non-selective adsorption of the secondlayer which leads to an average film composition equal to xTBA. The high affinity for TBAcontinues to exist even at complete pore filling at high partial pressures. We interpretthat the TBA monolayer formed at low partial pressures persists even beyond capillarycondensation as the volume fraction of TBA in completely filled pores corresponds tothat of one monolayer of TBA (φ ≈ 0.44) even at very low concentrations in its respectiveliquid or gas phase mixture. Such self-assembly would essentially leave a toluene-rich coreand has been experimentally confirmed by neutron-scattering experiments on TBA:TOLbinary liquid mixtures confined in MCM-412.
On the other hand, a reversal of adsorption characteristics is observed to a significantextent upon changing the chemical nature of pore wall from hydrophilic to hydrophobicwith the use of CMK-3. At low partial pressures, this is confirmed by the analysis of themolecular energy of interaction at the pore wall in the frame of a BET approach. Thecomposition of monolayer is found to be noticeably richer in TOL than its correspond-ing binary gas/liquid mixture, even though less dramatically when comparing to TBAmonolayer concentration on MCM-41 pore surface.
The current chapter thus provides a sound thermodynamic basis to understand thephase separation and structuration of adsorbing gases at the nanoscale based on specificinteractions between the adsorbing species and host matrix. Since our discussions sofar have been centered on nanoconfined systems at thermodynamic equilibrium, whichhave been addressed thoroughly, an open question remains whether these fundamentals
96

BIBLIOGRAPHY
of confinement induced phase separation can be extended to a system of nanoconfinedbinary liquids out of thermodynamic equilibrium, where bulk motion fully miscible binaryliquids take places in nanochannels. We answer this question in the next chapter.
Bibliography[1] Abdel Hamid, A. R., Lefort, R., Lechaux, Y., Moréac, A., Ghoufi, A.,
Alba-Simionesco, C., and Morineau, D. Solvation effects on self-associationand segregation processes in tert-butanol-aprotic solvent binary mixtures. The jour-nal of physical chemistry. B 117, 35 (sep 2013), 10221–30.
[2] Abdel Hamid, A. R., Mhanna, R., Lefort, R., Ghoufi, A., AlbaSimionesco, C., Frick, B., and Morineau, D. Micro-Phase Separation ofBinary Liquids Confined in Cylindrical Pores. The Journal of Physical Chemistry C(apr 2016), acs.jpcc.6b01446.
[3] Adiga, S. P., Jin, C., Curtiss, L. A., Monteiro-Riviere, N. A., andNarayan, R. J. Nanoporous membranes for medical and biological applications.Wiley interdisciplinary reviews. Nanomedicine and nanobiotechnology 1, 5, 568–81.
[4] Arnold, J. R. Adsorption of Gas Mixtures. Nitrogen-Oxygen on Anatase. Journalof the American Chemical Society 71, 1 (jan 1949), 104–110.
[5] Audonnet, F., BrodieâLinder, N., Morineau, D., Frick, B., and Alba-Simionesco, C. From the capillary condensation to the glass transition of a confinedmolecular liquid: Case of toluene. Journal of Non-Crystalline Solids (sep 2014).
[6] Ayappa, K. G. Simulations of Binary Mixture Adsorption in Carbon Nanotubes :Transitions in Adsorbed Fluid Composition. 880–890.
[7] Berezovska, I., Fettaka, H., Salmon, T., Toye, D., and Lodewyckx,P. Redistribution of a mixture of organic vapours inside an activated carbon filter.Chemical Engineering Journal 280 (nov 2015), 677–681.
[8] Brigo, L., Scomparin, E., Galuppo, M., Capurso, G., Ferlin, M. G.,Bello, V., Realdon, N., Brusatin, G., and Morpurgo, M. Mesoporoussilica sub-micron spheres as drug dissolution enhancers: Influence of drug and ma-trix chemistry on functionality and stability. Materials science & engineering. C,Materials for biological applications 59 (feb 2016), 585–93.
[9] Brocos, P., Amigo, A., and Lemus, M. G. Extended Langmuir Isotherm forBinary Liquid Mixtures. 4261–4266.
[10] Brunauer, S., Emmett, P. H., and Teller, E. Adsorption of Gases in Mul-timolecular Layers. Journal of the American Chemical Society 60, 2 (feb 1938),309–319.
97

BIBLIOGRAPHY
[11] Celestini, F. Capillary condensation within nanopores of various geometries.Physics Letters A 228, 1-2 (mar 1997), 84–90.
[12] Chen, B., Ji, Y., Xue, M., Fronczek, F. R., Hurtado, E. J., Mondal,J. U., Liang, C., and Dai, S. Metal-organic framework with rationally tunedmicropores for selective adsorption of water over methanol. Inorganic chemistry 47,13 (jul 2008), 5543–5.
[13] Choy, K. K. H., Porter, J. F., and Mckay, G. Langmuir Isotherm ModelsApplied to the Multicomponent Sorption of Acid Dyes from Effluent onto ActivatedCarbon. 575–584.
[14] Coasne, B. Adsorption and Condensation of Simple Fluids in Mesoporous Silicon: Experiment and Molecular Simulation. PhD thesis, 2007.
[15] Coasne, B., Alba-Simionesco, C., Audonnet, F., Dosseh, G., and Gub-bins, K. E. Adsorption, structure and dynamics of benzene in ordered and disor-dered porous carbons. Physical chemistry chemical physics : PCCP 13, 9 (mar 2011),3748–57.
[16] Coasne, B., Gubbins, K. E., and Pellenq, R. J.-M. Temperature effect onadsorption/desorption isotherms for a simple fluid confined within various nanopores.Adsorption 11, 1 (2005), 289–294.
[17] Costa, E., and Sotelo, J. L. Adsorption Of Binary And Ternary HydrocarbonGas Mixtures On Activated Corbon : Experimental Determination And TheoreticalPrediction Of The Ternary Equilibrium Data. 5–12.
[18] de Clippel, F., Khan, A. L., Cano-Odena, A., Dusselier, M., Vanherck,K., Peng, L., Oswald, S., Giebeler, L., Corthals, S., Kenens, B., De-nayer, J. F. M., Jacobs, P. A., Vankelecom, I. F. J., and Sels, B. F. CO2 reverse selective mixed matrix membranes for H 2 purification by incorporation ofcarbonâ??silica fillers. J. Mater. Chem. A 1, 3 (2013), 945–953.
[19] Dirir, Y. I., Hanafi, Y., Ghoufi, A., and Szymczyk, A. Theoretical investiga-tion of the ionic selectivity of polyelectrolyte multilayer membranes in nanofiltration.Langmuir : the ACS journal of surfaces and colloids 31, 1 (jan 2015), 451–7.
[20] Diu, B. Éléments de physique statistique. Collection Enseignement des sciences.Hermann, 1989.
[21] Dumitrescu, V., and Pântea, O. Viscosities of binary mixtures of toluene withbutan-1-ol and 2-methylpropan-2-ol. Journal of the Serbian Chemical Society 70, 11(2005), 1313–1323.
[22] Elamin, K., Jansson, H., and Swenson, J. Dynamics of aqueous binary glass-formers confined in MCM-41. Physical chemistry chemical physics : PCCP 17, 19(may 2015), 12978–87.
98

BIBLIOGRAPHY
[23] Formisano, F., and Teixeira, J. Appearance of critical fluctuations in a binaryfluid mixture confined in Vycor glass. Journal of Physics: Condensed Matter 12, 8A(feb 2000), A351–A356.
[24] Ghassemzadeh, J., Xu, L., Tsotsis, T. T., and Sahimi, M. Statistical Me-chanics and Molecular Simulation of Adsorption in Microporous Materials : PillaredClays and Carbon Molecular Sieve Membranes â . 3892–3905.
[25] Ghoufi, A., Hureau, I., Morineau, D., Renou, R., and Szymczyk, A.Confinement of tert -Butanol Nanoclusters in Hydrophilic and Hydrophobic SilicaNanopores. The Journal of Physical Chemistry C 117, 29 (jul 2013), 15203–15212.
[26] Guo, X.-Y., Watermann, T., and Sebastiani, D. Local microphase separationof a binary liquid under nanoscale confinement. The journal of physical chemistry.B 118, 34 (aug 2014), 10207–13.
[27] Hansen, R. S., Fu, Y., and Bartell, F. E. Multimolecular Adsorption fromBinary Liquid Solutions. The Journal of Physical and Colloid Chemistry 53, 6 (jun1949), 769–785.
[28] Hydrogen-chabazite, I. G., Roy, P., and Lond, S. O. C. Vacancy SolutionTheory of Adsorption From Gas Mixtures.
[29] Kadam, A. A., Karbowiak, T., Voilley, A., and Debeaufort, F. Tech-niques to measure sorption and migration between small molecules and packaging.A critical review. Journal of the Science of Food and Agriculture 95, 7 (may 2015),1395–1407.
[30] Karan, S., Jiang, Z., and Livingston, A. G. MEMBRANE FILTRATION.Sub-10 nm polyamide nanofilms with ultrafast solvent transport for molecular sepa-ration. Science (New York, N.Y.) 348, 6241 (jun 2015), 1347–51.
[31] Kusalik, P. G., Lyubartsev, A. P., Bergman, D. L., and Laaksonen, A.Computer Simulation Study of tert -Butyl Alcohol. 1. Structure in the Pure Liquid.The Journal of Physical Chemistry B 104, 40 (oct 2000), 9526–9532.
[32] Langmuir, I. The adsorption of gases on plane surfaces of glass, mica and platinum.Journal of the American Chemical society 40, 9 (1918), 1361–1403.
[33] Lerbret, A., Lelong, G., Mason, P. E., Saboungi, M.-L., and Brady,J. W. Molecular dynamics and neutron scattering study of glucose solutions confinedin MCM-41. The journal of physical chemistry. B 115, 5 (feb 2011), 910–8.
[34] Li, G., Xiao, P., and Webley, P. Binary adsorption equilibrium of carbondioxide and water vapor on activated alumina. Langmuir : the ACS journal ofsurfaces and colloids 25, 18 (sep 2009), 10666–75.
99

BIBLIOGRAPHY
[35] Li, M., Xu, E., Wang, T., and Liu, J. Adsorption equilibria of binary gasmixtures on graphitized carbon black. Langmuir : the ACS journal of surfaces andcolloids 28, 5 (mar 2012), 2582–8.
[36] Maddox, M. W., Sowers, S. L., Gubbins, K. E., and Hall, O. MolecularSimulation of Binary Mixture Adsorption in Buckytubes and MCM-41. 23–32.
[37] Martínez-Soria, V., Peña, M. P., and Montón, J. B. Vapor-Liquid Equi-libria for the Binary Systems tert -Butyl Alcohol + Toluene, + Isooctane, and +Methylcyclohexane at 101.3 kPa. Journal of Chemical & Engineering Data 44, 1(1999), 148–151.
[38] Mieczyslaw, B. Y. Statistical Thermodynamics of Mixed-Gas Adsorption. 933–938.
[39] Mohammad, A., Teow, Y., Ang, W., Chung, Y., Oatley-Radcliffe, D.,and Hilal, N. Nanofiltration membranes review: Recent advances and futureprospects. Desalination 356 (nov 2014), 226–254.
[40] Myers, A. L. Rigorous Thermodynamic Treatment of Gas Adsorption. 1887–1893.
[41] Myers, A. L. Thermodynamics of Adsorption in Porous Materials.
[42] Myers, A. L., and Prausnitz, J. M. Thermodynamics of Mixed-Gas Adsorption.121–127.
[43] NAGY, L., and SCHAY, G. ADSORPTION OF BINARY LIQUID MIXTURESON SOLID SURFACES - THERMODYNAMICAL DISCUSSION OF ADSORP-TION EQUILLIBRIUM .1. ACTA CHIMICA ACADEMIAE SCIENTARIUM HUN-GARICAE 39, 3 (1963), 365–&.
[44] Nikam, P. S., Jagdale, B. S., Sawant, A. B., and Hasan, M. Densitiesand Viscosities of Binary Mixtures of Toluene with Methanol, Ethanol, Propan-1-ol, Butan-1-ol, Pentan-1-ol, and 2-Methylpropan-2-ol at (303.15, 308.15, 313.15) K.Journal of Chemical & Engineering Data 45, 4 (jul 2000), 559–563.
[45] Park, J. Extension of the Brunauer-Emmett-Teller Equation to Mixtures. Journalof Chemical Engineering of Japan 48, 11 (nov 2015), 927–932.
[46] Pasinetti, P. M. A semiempirical model for adsorption of binary mixtures. PhysicalChemistry Chemical Physics 16 (2014), 24063–24068.
[47] Pellenq, R. J.-M., Coasne, B., Denoyel, R. O., and Coussy, O. SimplePhenomenological Model for Phase Transitions in Confined Geometry. 2. CapillaryCondensation/Evaporation in Cylindrical Mesopores. Langmuir 25, 3 (feb 2009),1393–1402.
100

BIBLIOGRAPHY
[48] Pen, M. P., Monto, J. B., Quimica, D. D. I., Quimica, F. D., and Valen-cia, U. D. Vapor - Liquid Equilibria for the Binary Systems tert -Butyl Alcohol +Toluene , + Isooctane , and + Methylcyclohexane at 101 . 3 kPa Vicente MartÄ?148–151.
[49] Pérez-Esteve, É., Ruiz-Rico, M., de la Torre, C., Villaescusa, L. A.,Sancenón, F., Marcos, M. D., Amorós, P., Martínez-Máñez, R., andBarat, J. M. Encapsulation of folic acid in different silica porous supports: Acomparative study. Food Chemistry 196 (apr 2016), 66–75.
[50] Poling, B. E., Prausnitz, J. M., and O’Connell, J. P. Constants for theAntoine Equation for Vapour Pressures of Pure Species, 2001.
[51] Rao, M. B., and Sircar, S. Thermodynamic Consistency for Binary Gas Ad-sorption Equilibria. Langmuir 15, 21 (oct 1999), 7258–7267.
[52] Science, N. Binary Langmuir and Freundlich Isotherms for Ideal Adsorbed Solu-tions. 3247–3250.
[53] Siperstein, F. R., and Myers, A. L. Mixed-Gas Adsorption. 1141–1159.
[54] Sumida, K., Rogow, D. L., Mason, J. A., Mcdonald, T. M., Bloch, E. D.,Herm, Z. R., Bae, T.-h., and Long, R. Carbon Dioxide Capture in Metal ÀOrganic Frameworks. 724–781.
[55] Tanaka, H. Double phase separation in a confined, symmetric binary mixture:Interface quench effect unique to bicontinuous phase separation. Physical ReviewLetters 72, 23 (jun 1994), 3690–3693.
[56] Thielmann, F., Butler, D., Williams, D., and Baumgarten, E. Charac-terisation of microporous materials by dynamic sorption methods, vol. 129 of Studiesin Surface Science and Catalysis. Elsevier, 2000.
[57] Wang, Y., Tsotsis, T. T., and Jessen, K. Competitive Sorption ofMethane/Ethane Mixtures on Shale: Measurements and Modeling. Industrial &Engineering Chemistry Research 54, 48 (dec 2015), 12187–12195.
[58] Xu, Y., Zhu, H., and Yang, L. Estimation of Surface Tension of Ionic Liquid-Cosolvent Binary Mixtures by a Modified Hildebrand-Scott Equation. Journal ofChemical & Engineering Data 58, 8 (aug 2013), 2260–2266.
[59] Yin, J., Kim, E.-S., Yang, J., and Deng, B. Fabrication of a novel thin-filmnanocomposite (TFN) membrane containing MCM-41 silica nanoparticles (NPs) forwater purification. Journal of Membrane Science 423-424 (dec 2012), 238–246.
[60] Yun, J. H., Düren, T., Keil, F. J., and Seaton, N. A. Adsorption of Methane,Ethane, and Their Binary Mixtures on MCM–41: Experimental Evaluation of Meth-ods for the Prediction of Adsorption Equilibrium. Langmuir 18, 32 (2002), 2693–2701.
101

BIBLIOGRAPHY
[61] Zhang, Y., Wei, S., Liu, F., Du, Y., Liu, S., Ji, Y., Yokoi, T., Tatsumi, T.,and Xiao, F. S. Superhydrophobic nanoporous polymers as efficient adsorbents fororganic compounds. Nano Today 4, 2 (apr 2009), 135–142.
102

4
Spontaneous imbibition of binaryliquids into a nanoporous network
103
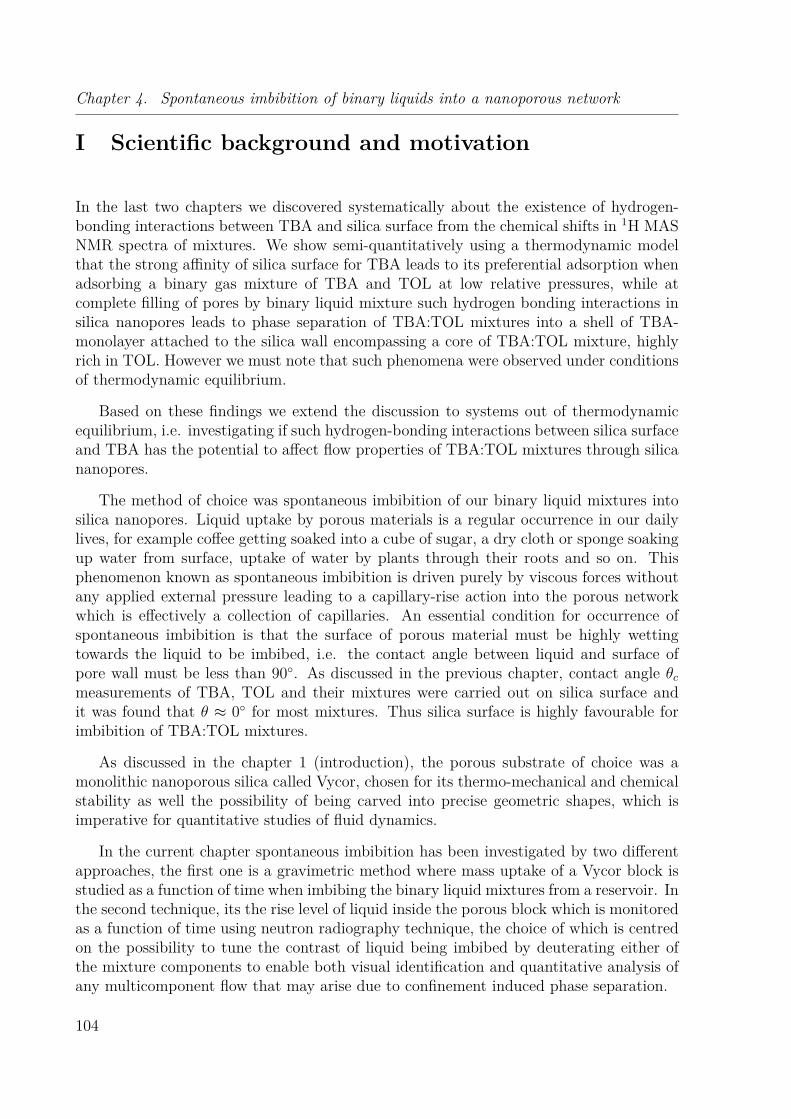
Chapter 4. Spontaneous imbibition of binary liquids into a nanoporous network
I Scientific background and motivation
In the last two chapters we discovered systematically about the existence of hydrogen-bonding interactions between TBA and silica surface from the chemical shifts in 1H MASNMR spectra of mixtures. We show semi-quantitatively using a thermodynamic modelthat the strong affinity of silica surface for TBA leads to its preferential adsorption whenadsorbing a binary gas mixture of TBA and TOL at low relative pressures, while atcomplete filling of pores by binary liquid mixture such hydrogen bonding interactions insilica nanopores leads to phase separation of TBA:TOL mixtures into a shell of TBA-monolayer attached to the silica wall encompassing a core of TBA:TOL mixture, highlyrich in TOL. However we must note that such phenomena were observed under conditionsof thermodynamic equilibrium.
Based on these findings we extend the discussion to systems out of thermodynamicequilibrium, i.e. investigating if such hydrogen-bonding interactions between silica surfaceand TBA has the potential to affect flow properties of TBA:TOL mixtures through silicananopores.
The method of choice was spontaneous imbibition of our binary liquid mixtures intosilica nanopores. Liquid uptake by porous materials is a regular occurrence in our dailylives, for example coffee getting soaked into a cube of sugar, a dry cloth or sponge soakingup water from surface, uptake of water by plants through their roots and so on. Thisphenomenon known as spontaneous imbibition is driven purely by viscous forces withoutany applied external pressure leading to a capillary-rise action into the porous networkwhich is effectively a collection of capillaries. An essential condition for occurrence ofspontaneous imbibition is that the surface of porous material must be highly wettingtowards the liquid to be imbibed, i.e. the contact angle between liquid and surface ofpore wall must be less than 90◦. As discussed in the previous chapter, contact angle θcmeasurements of TBA, TOL and their mixtures were carried out on silica surface andit was found that θ ≈ 0◦ for most mixtures. Thus silica surface is highly favourable forimbibition of TBA:TOL mixtures.
As discussed in the chapter 1 (introduction), the porous substrate of choice was amonolithic nanoporous silica called Vycor, chosen for its thermo-mechanical and chemicalstability as well the possibility of being carved into precise geometric shapes, which isimperative for quantitative studies of fluid dynamics.
In the current chapter spontaneous imbibition has been investigated by two differentapproaches, the first one is a gravimetric method where mass uptake of a Vycor block isstudied as a function of time when imbibing the binary liquid mixtures from a reservoir. Inthe second technique, its the rise level of liquid inside the porous block which is monitoredas a function of time using neutron radiography technique, the choice of which is centredon the possibility to tune the contrast of liquid being imbibed by deuterating either ofthe mixture components to enable both visual identification and quantitative analysis ofany multicomponent flow that may arise due to confinement induced phase separation.
104

II. Fundamentals of spontaneous imbibition
II Fundamentals of spontaneous imbibitionWe recall again the concepts discussed previously in the introduction chapter (section B)regarding dynamics of spontaneous imbibition of a liquid in nanopores. The mass uptakeof a porous block and the respective rise in liquid level inside it for pure liquids is givenby the equation 4.1 and 4.2 from the Lucas-Wasburn law.
m(t) = ρA
√φaσ cos θ
2η I√t (4.1)
h(t) =√σ cos θ2φaη
I√t (4.2)
Where ρ is the mass density, σ the surface tension, η the bulk viscosity, φa the apparentporosity of block, θ the contact angle between the liquid meniscus and pore wall, A is thecross-sectional area of block perpendicular to the axis of liquid rise and I is the Imbibitionstrength given by equation 4.3
I = r2h
r
√φ0
rLτ(4.3)
Where rh and rL are known as the hydrodynamic pore radius and Laplace radiusrespectively. rh is associated to the stick and slip flow of liquids through pores3 and isthe radial distance from centre of pore to the point where velocity of liquid layers is equalto zero. rL is the reduced radius of the pore due to formation of pre-adsorbed waterlayer(s) due to ambient humidity. I is fundamental to a porous matrix and derives fromits topology and pore-architecture, being independent of the liquid imbibed.
The measure of imbibition dynamics is thus obtained from the proportionality constantCM and CH , betweern mass uptake versus
√t and liquid rise level versus
√t given by
equations 4.4 and 4.5 respectively.
CM = ρA
√φaσ cos θ
2η I (4.4)
CH =√σ cos θ2φaη
I (4.5)
Imbibition dynamics of pure liquids in nanopores have already been shown to be wellpredicted by the Lucas-Washburn law. The evidence of phase-separation in TBA:TOLmixtures confined in silica nanopores in equilibrium conditions owing to hydrogen-bondinginteractions between TBA and silica surface prompts us to question if this preferentialinteraction for one component over the other might give rise to a two-component flowwith separate dynamics as the concept of bulk physical properties of mixtures, i.e. aunique surface tension, viscosity and density for a given mixture composition may nolonger apply, eventually leading to a deviation from Lucas-Washburn dynamics. In thefollowing sections we find out answers to these questions raised.
105

Chapter 4. Spontaneous imbibition of binary liquids into a nanoporous network
III Experiments and results
In the following section are discussed the two major experiments carried out in order tocharacterize rise dynamics of TBA:TOL mixtures in Vycor by (i) mass rise as a functionof time, referred to here as gravimetric technique, and (ii) observing rise of liquid level inthe block as a function of time by neutron radiography. Two Vycor blocks with slightlydifferent pore characteristics were used for the two experiments respectively owing totheir availability at the time of experiment. The following work was carried out underthe guidance and supervision of Prof. Dr. Patrick Huber, partly at the Institute ofMaterials Physics and Technology at the Hamburg University of Technology (TUHH,Hamburg, Germany) and part at the French Neutron source for research, LaboratoireLéon Brillouin (Saclay, France). The following sections discuss in detail the experimentalsetup, conditions and their respective results.
A Spontaneous imbibition study through gravimetryFigure 4.1 shows the experimental setup used..
The sample used was a Vycor block (0.9× 0.8× 1.25cm) with pore radius r = 4.54 nmand a volume porosity of φ0 = 0.32.The block is suspended into a glass beaker from thetop using an easily malleable metal wire glued to the top of the block using a two-partepoxy glue. A fast drying epoxy glue (< 2 min) was used in order to achieve fast polymer-ization and prevention of any glue component entering into the pores. The glass beakerserves as a reservoir of the liquid mixtures. This is a slight modification over the originalsetup which used a metallic cell to enclose both the sample and liquid reservoir in orderto provide a closer temperature control. Due to high vapour pressure of TBA and TOL,position of the suspended Vycor block inside such closed cell was found to be very un-stable, thus giving lot of fluctuations in the readings of its mass. As a result, the glassbeaker with an open top was found to be a practical solution to this problem.
Adsorption from the gas phase leading to pore filling by capillary condensation11 isalso another concern while working with high vapour pressure liquids. Thus it was im-perative to seal all sides of the Vycor block with the same fast drying epoxy glue, exceptthe bottom of block in contact with the liquid reservoir, in order to allow imbibition onlyfrom the bottom while preventing pore filling by adsorption from sides.
In figure 4.1, the cross-section parallel to vertical axis of the block is shown only forclarity. The chemical resistance of this epoxy glue to TOL and TBA:TOL mixtures wastested prior to use by coating a test Vycor block with the glue and keeping it submergedinside these solvents (TOL, TBA:TOL mixtures) for several hours. No physical or chem-ical changes on the glue, such as swelling, cracking or degradation were noticed, thusclearing out to be fit for the experiment. A cantilever mechanism with adjustable heightwas used to raise the beaker partially filled with the desired liquid to touch the bottom ofVycor block. Once in contact, the liquid is taken up by the porous matrix instantaneously
106

III. Experiments and results
giving rise to increase in weight of the block as a function of time m(t) which is recordedlive into a text file at a time-interveral of every 2 s. The following section describes moreabout the specific experimental details.
Figure 4.1: Schematic diagram of the experimental setup for studying spontaneous imbi-bition of TBA:TOL mixtures through Vycor by gravimetry
A.1 Experiment
A 50 ml glass beaker was used for the experiment which was filled with 10 ml of the liquidto be imbibed. The liquids used were pure TOL and a series of mixtures with increasingTBA concentration from %TBA = 10 (by volume) to %TBA = 90. The experimentswere carried out at room temperature (≈ 25(2) ◦C). However considering the relativelysmall effect of temperature on bulk physical properties of TB:TOL mixtures, i.e. theirviscosity, surface tension and density even within a temperature range of 5 ◦C5,14, we donot expect any significant changes in the imbibition dynamics from small temperaturefluctuations during the experiment. However imbibition of pure TBA was not possible atthis temperature because of its tendency to crystallize.
Prior to beginning each experiment, the Vycor block was heated at 65 ◦C for 48 hoursin an oven which is sufficient to remove the TBA and TOL molecules adsorbed in thepores. However it is hard to comment if it removes pre-adsorbed layer(s) of water effec-tively stuck to pore walls or not. Since there exist no specific technique to monitor theremoval of adsorbed solvents or pre-adsorbed water upon drying, the practical solution tojudge whether the pores properly emptied was to measure the weight of block. One mustnote that the weight of block now is inclusive of glue layers sealing its surface as well asthe metallic wire glued to its top. Thus achieving the same initial weight at the beginning
107

Chapter 4. Spontaneous imbibition of binary liquids into a nanoporous network
of each experiment ensures that we are starting with a completely empty porous matrix,at least theoretically.
As the liquid reservoir is raised gradually, at some point the block’s bottom surfacecomes in contact with the liquid surface. At this point, the apparent mass of the samplefalls suddenly. This happens due to the upward buoyant force exerted by the liquid on theblock, causing it to appear lighter suddenly. Instantaneously after this, mass of the blockstarts to increase as the liquid mixture starts penetrating inside the pores. We denotethe initial mass of the sample as mi and the apparent initial mass right after coming incontact with the liquid surface as ma
i . Thus the mass gain m(t) is recorded with respectto ma
i . As the imbibition process continues m(t) keeps increasing and plateau’s after acertain time indicating complete filling of the porous matrix, such that mass of the sampleno more increases.
The liquid is then slowly lowered to free the sample from it and as their contact breakswe notice a quick increase in mass of the completely filled sample as it is freed from thebuoyant force acting on it. The final mass of the block is noted as its mass at the pointwhen its breaks contact with the liquid reservoir, ensuring that there exists no attacheddrop of liquid at the bottom of block. The mass uptake can be simply calculated asfollows.
∆m = mf −mi
A systematic study of imbibition of liquid mixtures from %TBA=0 (i.e.pure TOL) to%TBA=90 was carried out and their results are discussed in the following section.
A.2 Results
Figure 4.2 shows the mass uptake versus time for imbibition of pure TOL. We observe thateven after complete filling of the block, its mass continues to rise linearly with time beforeit reaches a brief plateau and then drops suddenly as the liquid reservoir is physicallylowered breaking contact between the liquid surface and Vycor block.
The apparent mass uptake of block has two contributions, (i) filling of porous matrixby imbibing liquid leading to mass rise of the block (ii) decrease of buoyant force exertedby the liquid on the block due to the volatile nature of TBA:TOL mixtures causing a grad-ual lowering of liquid meniscus surrounding the bottom of Vycor block, in other wordsdecreasing the volume of block submerged inside the liquid during course of experiment.Although this lowering is not fast enough to cause a break of contact between the liquidand porous block in the time scale of experiments, lowering of its level does lead to gradualdecrease in volume of block immersed in the liquid. This results into a sustained loweringof the upward buoyant force from the liquid, or in other words increase in apparent massof the sample.
It was found that after correcting the mass rise for the additional linear mass rise(figure 4.2) due to falling liquid meniscus we arrive to the
√t dependence of mass rise as
predicted by equation 4.1 with mass uptake plateauing at complete filling of block, just
108

III. Experiments and results
Figure 4.2: m(t) versus time showing the apparent mass increase caused due to loweringof meniscus leading to reducing buoyant force or increased apparent mass rise
as would be expected. In figure 3.6, the mass uptake m(t) has been shown for differentconcentrations as a function of
√t for simplicity.
An important concern here is the decrease in initial porosity of the porous matrix dueto pre-adsorbed water layers. Although there was no direct way of determining the initialporosity φa, it was possible to calculate it from the mass of liquid taken up by the Vycorblock at complete filling.
φa = ∆mρVblock
Where, ∆m is the mass of liquid taken up and ρ is its density and Vblock is volume ofthe Vycor block (0.9 mm3). Assuming that the completely filled Vycor block has the exactsame composition as the liquid reservoir, we find φa = 0.274± 0.005 with no correlationto composition of the mixture imbibed. It is thus possible to calculate the Laplace radiusrL from φa by assuming the pores to be cylindrical by the following formula.
rL = r
√φaφ0
We find rL = 4.2 nm. Thus the thickness of pre-adsorbed layer is
t = r − rL = (4.54− 4.2)nm = 3.4Å
This corresponds roughly to the thickness of a monolayer of water7,9.
109

Chapter 4. Spontaneous imbibition of binary liquids into a nanoporous network
Figure 4.3: m(t) versus√t curves of all the concentrations measured between pure TOL
and %TBA = 90. The colour code for the curves is as follows solid black:TOL,solid blue:%TBA = 10, solid cyan: %TBA = 20, solid pink: %TBA = 30, dotted: %TBA = 40,dashed red: %TBA = 50, dashed blue: %TBA = 60, dashed green: %TBA = 70, dashedviolet: %TBA = 80, dashed cyan: %TBA = 90
Having known the reduced porosity of the Vycor block we are able to calculate theimbibition strength I for imbibition of TOL from equation 4.1 as follows.
I = 1ρA
√2η
φiσ cos θ0
The slope of m(t) versus√t in figure 4.3 gives us the pre-factor CM of equation 4.1.
cos θ0 ≈ 1 since the contact angle θ0 ≈ 0 as found from contact-angle measurements ofTBA:TOL mixtures on silica surface.
We find I = 1.325× 10⁻⁵√m which is well in agreement with the known imbibitionstrengths of Vycor materials9. It is important to note that I is a property associatedwith the structural characteristics of the solid matrix and the value obtained is constantirrespective of the liquid imbibed. From the known values of density, surface tension andviscosity of bulk TBA:TOL liquid mixtures at 25 ◦C in the reservoir and constant valuesof A, φa and I, we calculated the value of the imbibition coefficient Ccalc
M using equation4.1 and compared them to ones obtained from the slope m(t) vs t1/2 fits from figure 4.3(Cexp
M ) as shown in figure 4.4.
We find here that the values of CexpM vary similarly as Ccalc
M with TBA concentrationwith some fluctuations, while no general trend of deviation between the two sets of valuescould be noticed. We also calculate the final mass of liquid mixture taken up by the Vycor
110

III. Experiments and results
Figure 4.4: Comparison of CcalcM values calculated (solid black line) from bulk physical
properties (ρ,φa and σ) with CexpM values obtained from fitting of the m(t)vs
√t curves
(black dots)
block using the corresponding bulk densities of the mixtures and assuming the composi-tion of liquid mixture inside the pores to be same as in the reservoir at complete filling byusing equation 4.6 and compare them with the experimental values of ∆mexp(= mf −mi)as shown in figure 4.5.
∆mcalc = φa × Vblock × ρ (4.6)
The final mass uptake from experiment follows a similar trend with TBA concen-tration as expected by calculation with some fluctuations around it indicating that themixture composition inside the pores is nearly the same as its corresponding compositionin the liquid reservoir. Such fluctuations of experimentally obtained values from theircorresponding calculated values both for (Cexp
M ) and ∆mexp may be attributed to smalltemperature differences between individual experiments, difference in vapour pressuresbetween TBA and TOL which might lead to modification in the reservoir compositionand slight differences in initial porosity φa of the Vycor block.
We find here that the Lucas-Washburn approach works very well even for a mixture,
111

Chapter 4. Spontaneous imbibition of binary liquids into a nanoporous network
Figure 4.5: Comparison of the final masses of liquid mixtures taken up by the Vycor blockat complete filling. The dashed line gives ∆mcalc, which is the expected mass gain fromdensities of bulk TBA:TOL mixtures. ∆mexp is calculated from the difference in initialand weight (complete filling) of the sample outside liquid reservoir
assuming it to be a homogeneous liquid having average properties (density, viscosity,surface tension) of the bulk liquid mixtures without any demixion. In the next sectionwe approach the spontaneous imbibition of TBA:TOL mixtures using a technique whichcan enable us to qualitatively and quantitatively examine the rising imbibition front andclarify whether it is actually a homogeneous liquid following its corresponding reservoircomposition or not.
B Spontaneous imbibition study through neutron radiographyIn the current section we investigate the dynamics of imbibition of TBA:TOL mixturesinto Vycor through an imaging technique which provides us space and time resolved infor-mation of the process. The use of x-rays for tomographic and imaging purposes is alreadyvery prevalent. However, x-rays are less sensitive to small atomic number molecules suchas hydrogen, carbon, oxygen and nitrogen because of their low electron density whichresults into a low scattering cross-section.
112

III. Experiments and results
The use of neutrons provides much better solution to investigate soft matter as they in-teract directly with the nucleus of an element and the scattering/absorption cross-sectionis independent of the electronic density and thus the atomic number of an element. Theexclusive advantage which comes with neutrons is the difference in scattering/absorptioncross-section between two isotopes of the same element, for example σscatt1H = 82.03 b, whileσscatt2H = 7.64 b15. This helps to tune the contrast between two hydrocarbons mixed witheach other by simply deuterating one, without the risk of modifying its chemical nature.
In the context of radiography, differentiating one material from the other dependsupon their relative transmissions to the incoming neutron beam. The transmission T ofa material with thickness d which is basically the ratio of final intensity of transmittedneutron beam to its initial intensity
(II0
)is calculated by the Beer-Lambert Law.
T = I
I0= e−(ρσtotal)d
Where ρ, σtotal are the molecular density (molecules/cm3) and total scattering cross-section respectively, their product known as the total scattering-length density (SLD).The total SLD of a sample is calculated by the formula
SLDtotal = SLDscatt + SLDAbs = ρσscatt + ρσAbs
Where SLDscatt and SLDAbs are the scattering length densities for the scatteringand absorption processes respectively. From the known scattering and absorption cross-sections of 28Si,16O,12C,1H and 2H 15 the transmissions of Vycor, hydrogenated TOL,TBA denoted here by TOL-H, TBA-H and deuterated TOL, denoted by TOL-D througha thickness of 1 cm were calculated for comparison and the result was as follows.
TtolH = 0.961Ttol−D = 0.994Ttba−H = 0.948TV ycor = 0.998
Thus we find that Vycor is nearly transparent to neutrons, making it possible toobserve the liquids rising inside upon imbibition owing to their lower transmittance. Thissituation however during a radiography experiment leads to a transmittance composedof two contributions, one from Vycor and the other from imbibing liquid whose positionchanges with time, resulting in a time dependent transmission given by.
Timb(t) = e−(ρvσv+ρmixσ(t)mix)d (4.7)
Where Timb(t) is the time-dependent transmission of the Vycor block getting constantlyfilled with the mixtures, ρv, σv are the number density and total scattering cross-section ofthe Vycor block while ρmix and σ(t)
mix are the density and time-dependent scattering cross-section of the rising liquid, its time-dependence being related to its change of height. Ap-plication of such time-dependent transmissions to understand flow dynamics of TBA:TOLmixtures would be discussed more in detail later in this section.
113
Chapter 4. Spontaneous imbibition of binary liquids into a nanoporous network
B.1 Experiment
The experiments were carried out at the neutron imaging station "IMAGINE" of theFrench neutron source for research, Laboratoire Léon Brillouin (LLB) in Saclay, France.Located at the cold neutrons guide G3bis, the wavelength of available neutron beamranges between 0.3-2 nm with a flux of 2× 10⁷ neutrons/ sec /cm2. A sCMOS camera(Photonics Science) coupled to lithium scintillators of 50-100 mm thickness was used fordetection which in principle provide a resolution of up to 100 µm.
The Vycor block used in these experiments is noted as V5, its radius and porosity be-ing r = 3.4 nm and φ0 = 0.32 respectively. Figure 4.6 shows the setup for the imbibitionexperiment studied by neutron radiography. A cuboid shaped Hellma cell made of quartzwas used as a reservoir of the liquid mixture to be imbibed. An aluminium holder withslots made to hold the Vycor blocks was placed on top of the Hellma cell, thus coveringit and converting into a closed container, thus slowing down the loss of liquid inside thereservoir due to evaporation. The liquid in Hellma cell was filled up to the level that itjust touches the base of Vycor block, whose position was fixed. The entire system wasplaced on a rotatable platform, whose height could be adjusted as well. The Hellma cellwas placed perpendicular to the incoming neutron beam. The aluminium sample holderwas used because of its high transmission to neutrons. For the same reason, the Vycorsticks were sealed on all sides with aluminium tape to avoid pore-filling from the gaseousphase, while staying quite transparent to incoming neutrons at the same time. The topsection of Vycor blocks was sealed with an epoxy glue, while the bottom was left freefor the liquids to penetrate into the block. A sheet of cadmium was used to cover upmost of the aluminium exposed to neutrons in order to prevent unwanted scattering andprotecting it from radioactive activation.
Prior to starting the experiment, the Vycor block was dried under vacuum for 4-5 hoursat 70 ◦C.The sample set had to be kept small due to the short period of time available forthe experiments in comparison to the time taken for completion of a typical imbibitionexperiment (6-20 hours) and preparation for the next one. The chosen liquids being pureTOL-H, TBA-H:TOL-H 50:50 (by volume), TBA-H:TOL-D 50:50 and TBA-H:TOL-H90:10. The aim of using deuterated TOL in one of the mixtures was to achieve a contrastof the mixture where in the event of any phase separation, the contribution of pure TOLwould be masked as TOL-D has a much smaller absorption cross-section.
The kinetics of imbibition experiment was captured as series of images, each exposedto the neutron beam for a fixed period of 3 minutes and a time period of 3 minutes betweeneach image exposure. Figure 4.7 shows the image of a typical experiment. Comparing itwith figure 4.6 we can easily locate all the components of setup. In figure 4.7 we observethe position of liquid front can be located easily.
For a quantitative treatment, the images were analysed using ImageJ software. Toimprove resolution, the image was cropped to cover only the Vycor block along with someadditional space left around it. We can re-write the transmission of the system duringan imbibition experiment from equation 4.7 as a product of two transmissions, one of the
114

III. Experiments and results
Figure 4.6: Setup of the imbibition experiment comprising of the quartz Hema cell filledwith a TBA:TOL mixture. Vycor block is attached to a aluminium holder. A cadmiumsheet to prevent radioactive activation of aluminium. Incoming neutron beam parallel tothe plane of figure.
Figure 4.7: Image from a radiography experiment of imbibition in Vycor
empty Vycor and other the liquid mixture imbibing into it as
Timb(t) = Tv × Tmix(t)
115

Chapter 4. Spontaneous imbibition of binary liquids into a nanoporous network
We might as well take into account the contribution of Hellma cell in the above equa-tion even though it is nearly completely transparent. We thus have
Timb(t) = Tv × THellma × Tmix(t)
Since the transmission at time t = 0 depends simply on the Vycor block and Hellma cell,we have
Timb(t = 0) = Tv × THellmaThus the transmission of the only dynamic part i.e. the rising liquid can be found by
simply normalizing transmissions of all images by that of the first, consisting of emptyVycor and Hellma cell as given by.
Timb(t)Timb(t = 0) = Timb(t)
Tv × THellma= Tmix(t)
Plot profiles of transmission of the Vycor block were calculated using the ImageJsoftware for quantitative analysis. The details of which are discussed in the followingsection.
B.2 Results
Figure 4.8 shows a neutron radiography image of TOL imbibition into Vycor along withits plot profile after being normalized as described in the previous section. The block ispresented here horizontally instead of vertically to make it easier to analyse its plot profilemore conveniently as a function of time and distance. The distance here is represented inpixels which could be converted into SI units simply by multiplying a distance in pixelsby the ratio of length of the Vycor block in metres (0.02 m) to the length in pixels suchthat 1 pixel≈ 0.31 µm.
Figure 4.9 (a) shows the transmission plot profile of the entire experiment. We no-tice that the imbibition front is not moving parallel to the y-axis and has a broadenedprofile instead. In figure 4.9 (b) the corresponding derivative of transmission plot profilewith respect to distance is shown. Calculating the derivative helps locating the positionof front more precisely from the peak-position of curves, while the front broadening canbe estimated from full width at half maxima (FWHM). The curves showing derivativeof transmission plot profiles have been smoothed by a local smoothing technique usingpolynomial regression (degree 1) and weights computed from Gaussian density function.
We locate the position of each peak and its respective roughening (FWHM) and plottheir variation with
√t as shown in figure 4.10.The very clear linear dependence of rise level
of liquid front with√t is completely in accordance to the Lucas-Washburn equation 4.2.
The value of its slope thus gives the imbibition coefficient of TOL CH = 1× 10⁻⁴ m/s1/2.We find the front roughening to be varying linearly with
√t as well for most of the process
before reaching a plateau.
116

III. Experiments and results
Figure 4.8: Image of TOL imbibition through Vycor, normalized by the first image alongwith the plot profile of its transmission
The front broadening has been reported in the past for imbibition of different liquidsinto Vycor block and has been explained to occur mainly because of the following rea-sons, the major one being the mechanism of pore-filling in such inter-connected porousnetwork with pore-radius distribution. At the junction of two-interconnected capillariesof unequal radii, the one with smaller radius fills up faster than one with bigger radiusdue to greater Laplace pressure across it. However this movement of liquid in the smallercapillary is arrested momentarily when the pressure in both smaller and larger capillaries
117

Chapter 4. Spontaneous imbibition of binary liquids into a nanoporous network
(a)
(b)
Figure 4.9: (a) Plot profiles of transmission of TOL for entire imbibition process versusdistance travelled by the liquid front (pixels)(b) Derivative of the plot profiles with respect to distance. The centre of peak showsposition of the liquid front, while the FWHM of peaks give the roughening of front
are equal, with the larger one filled to lesser extent. Soon after the larger capillary startsfilling and the imbibition process continues. This phenomenon of menisci arrest is verywell described in the work of Simon Gruener et al8 from a numerical simulation approachand was reported to follow a
√t itself, same as observed here for TOL imbibition. This
broadening is reported in literature mostly as front-roughening.
Another important reason for such strong front-roughening is high volatility of TOL,such that the liquid front is preceded by its vapours, which eventually condense via cap-illary condensation to fill up the pores, which perhaps is the reason for plateauing of thefront-roughening (figure 4.9(b)).
118

III. Experiments and results
Figure 4.10: Position of the rising liquid front (in metres) (black points) and width of theroughening (metres) (blue triangles)as a function of
√t. Fit of the experimental points
by Lucas-Wasburn equation 4.2 h(t) = CH ×√t.
Finally, the slower rate of image acquisition with respect to dynamics of imbibitioncauses the images to be slightly deformed in time, however this effect is technical in natureand minor compared to the previous two effects.
The exact same image processing steps were taken for TBA:TOL mixtures, 50:50 and90:10, however unlike TOL, the images for imbibition of mixtures are not available untilcomplete block filling. Figure 4.11 shows the imbibition process in few images for eachsample.
Qualitatively it is possible to spot a few differences between individual experiments.We notice the rise level to be fastest in TOL, which gets slower with increasing concentra-tion of TBA in the mixture. The difference in contrast between the 50:50 HH (TBA:TOL)and 50:50 HD mixture is clearly visible as well. For the 90:10 mixture (figure 4.11(d)) wenotice the Vycor block filling up from the top which can be caused due to a loss in sealingcausing TBA:TOL vapour mixture to fill up the Vycor block by capillary condensation.However its effect on the imbibition process in the time-scale of experiment could be ig-nored in a first approximation as long as no interaction between the two fronts is observed.
To quantitatively treat the images, similar data treatment was carried out as for pure
119

Chapter 4. Spontaneous imbibition of binary liquids into a nanoporous network
(a)
(b)
(c)
(d)
Figure 4.11: Imbibition images from neutron radiography for various expeirments(a) pureTOL (b) TBA-H:TOL-H 50:50 (c) TBA-H:TOL-D 50:50 (d) TBA-H:TOL-H 90:10
TOL in order to obtain the transmission profiles as shown in figure 4.12.
One can notice for the 50:50 mixture (TBA-H:TOL-H) shown in figure 4.12(a), thatthe imbibition front seen in the transmission profile is clearly different from that of pure
120

III. Experiments and results
TOL ( figure 4.9) because of the two visible slopes instead of one, indicating the pres-ence of two different fronts and their respectively front-roughening. In the correspondingcurves showing the derivative of transmission we observe a main peak of higher intensityand a shoulder peak of low intensity. These two peaks progressively shift forward andsimultaneously broaden.
On the other hand such a two-front flow is not evidently observed for the 50:50 (TBA-H:TOL-D) mixture (figure 4.12(a)). It becomes clearer in the corresponding derivativeof transmission, where the curves though not completely symmetric, do lack evidence ofany second peak unlike 50:50 (TBA-H:TOL-H) mixture.
Finally for the case of 90:10 (TBA-H:TOL-H) mixture shown in figure 4.12(c), wenotice the progression of two fronts, one due to imbibition from the bulk reservoir whilethe second possibly due to capillary condensation from the top. The derivative of trans-mission profiles reveal existence of a main peak and a shoulder peak for the imbibitionfront just like 50:50 (TBA-H:TOL-H) mixture.
The positions and FWHM of all peaks were extracted and have been plotted againstthe square root of time in figure 4.13. Positions of fronts for all mixtures as well aspure TOL are found to be varying linearly with
√t in accordance to the Lucas-Washburn
equation. We notice in the case of 90:10 mixture a deviation from linear Lucas-Washburndynamics in the initial part of the experiment. This is attributed to the position of risingfront coinciding with the liquid meniscus of reservoir liquid for the first three hours of theimbibition due to its slow dynamics
On the other hand, widths of front-roughening were found to be very scattered butthey do appear to be roughly increasing with time, although not strictly linear enoughto be following Lucas-Washburn dynamics. Such a scattering can be expected from highvapour pressure liquids like TOL and TBA as the front-roughening is strongly influencedby the volatile nature of these liquids such that their vapours precede the liquid front.
Finding the slope of front position versus√t for each experiment the imbibition coef-
ficient CH of the Lucas-Washburn equation for rise level dynamics (equation 4.2) and arelisted in table below.
CH m/s1/2
TOL 1× 10⁻⁴
50:50 HH Main peak 7.4× 10⁻⁵
50:50 HH Shoulder peak 1× 10⁻⁴
50:50 HD 5.03× 10⁻⁵
90:10HH Main peak 4.02× 10⁻⁵
90:10HH Shoulder peak 5.31× 10⁻⁵
We now proceed to calculate the imbibition strength I of the Vycor block using thesurface tension, density and viscosity values of bulk TOL from the following equation:
121

Chapter 4. Spontaneous imbibition of binary liquids into a nanoporous network
(a)
(b)
(c)
Figure 4.12: Transmission plot profiles of mixtures along with their respective derivativeswith respect to distance (a) TBA-H:TOL-H 50:50 (b) TBA-H:TOL-D 50:50 (c) TBA-H:TOL-H 90:10
CH =√σ cos θ2φaη
I
Although we did not have any means to measure the weight of block right after itsextraction from the liquid reservoir in order to determine the reduced porosity due topossible formation of pre-adsored water layers, we assign φa = 0.2746, the same value asin the section of gravimetric study of imbibition, since it corresponds to one monolayer of
122

III. Experiments and results
(a)
(b)
Figure 4.13: Transmission plot profiles of mixtures along with their respective derivativeswith respect to distance (a) TBA-H:TOL-H 50:50 (b) TBA-H:TOL-D 50:50 (c) TBA-H:TOL-H 90:10
water adsorbed on the pore surface. We thus obtain
I = 1.073 54× 10−5 m1/2
In a method similar to one followed in the gravimetric study, we calculate the CHvalues for mixtures using their known bulk properties and the value of I obtained aboveand plot against them the values of CH obtained from the slope of position of front versus
123

Chapter 4. Spontaneous imbibition of binary liquids into a nanoporous network
√t from experiment (4.13(a)). This is represented in figure 4.14.
Figure 4.14: Comparison of the imbibition coefficient CcalcH (dashed line), calculated from
surface tension and viscosity of bulk mixtures with CexpH (different coloured points), ob-
tained from slope of experimental curves in figure 4.13(a).
A clear observation here is that the main peak of both 50:50 (TBA-H:TOL-H) andthe 90:10 (TBA-H:TOL-H) mixtures fall on the curve predicted by the Lucas-Washburnequation (eqn 4.2). However, their respective shoulder peaks appear to be travelling fasteras we find Cshoulder
H value equalling to CmainpeakH of pure TOL and mixture composition
%TBA = 77% for the 50:50 and 90:10 (TBA-H:TOL-H) mixtures respectively.
We attempt to explain it by the phenomenon of menisci arrest8 discussed earlier inthis section. The occurrence of two fronts, the leading one being much smaller, indicates acertain level of phase-separation. If this true then at the junction of two capillaries of un-equal radii, the component with greater surface tension (respectively richer in TOL) willhave a greater capillary pressure according to Young-Laplace equation (equation (1.1))which might enable it to rise ahead and occupy a given capillary, until its rise is arrestedand eventually the capillaries start filling up with the TBA:TOL mixture making up themajor imbibition front. Thus the component richer in TOL continues to separate outmomentarily and fill up the porous network first, forming the leading imbibition front.However the average dynamics of imbibition are still governed by the rise of the main frontfollowing its reservoir mixture composition analogous to the findings by the gravimetric
124

III. Experiments and results
technique.
We come finally to the 50:50 (TBA-H:TOL-D) mixture. The high transmittance ofTOL-D and its effect on the final contrast compared to 50:50 (TBA-H:TOL-H) is observedqualitatively in figure 4.11 (b) and (c) with the transmission being higher for the latter onenaturally. Upon comparing the transmission plot profiles and their derivatives of 50:50 HHand HD mixtures from figures 4.12(a) and (b), we observe that the second imbibition frontcharacterised by a shoulder peak has disappeared completely for the 50:50 HD mixture.Since the objective of using TOL-D was to mask its contribution to the rising front in caseof a phase separation, its disappearance in the 50:50 HD mixture further confirms the in-terpretation of a phase separation into two imbibition fronts, one of them being pure TOL.
The derivative of transmission of the 50:50 HH and 50:50 HD mixture are plottedtogether for comparison in figure 4.15. We find the main liquid front of the 50:50 HDto be rising quite slowly, having a value of CH = 5.03× 10⁻⁵ m/s1/2 which is equivalentto dynamics of an 80% TBA mixture. Considering that the surface tension and viscos-ity of TOL-D and TOL-H are approximately the same, one would expect the 50:50 HDmixture to follow the same dynamics as HH mixture. One possible explanation of thisapparent slowed down dynamics could be attributed to the high transmittance of TOL-D,as a result of which the rising front observed is mostly contributed by TBA-H and thusimbibition dynamics of the liquid appears closer to pure TBA.
Figure 4.15: Comparison of the derivative of transmission plot profile for the 50:50 (TBA-H:TOL-H) (green) and 50:50 (TBA-H:TOL-D) (red) from images corresponding to sameduration of the imbibition process.
125

BIBLIOGRAPHY
IV ConclusionThe role of specific hydrogen-bonding interactions between hydroxyl group of TBA and sil-ica surface on the dynamics of TBA:TOL imbibition into Vycor, a monolithic nanoporoussilica was investigated. We observe that the rate of imbibition, better known as its imbibi-tion coefficient CM(kg/
√m) found experimentally for TBA:TOL mixtures from their mass
uptake versus√t plots could be predicted theoretically by the well-known Lucas-Wasburn
law for simple liquids by assuming the liquid mixtures to behave like homogeneous simpleliquids with mass density, surface tension and viscosity values equal to that of the mixturesat different compositions. This good agreement with the Lucas-Washburn law suggestedthat the specific hydrogen-bonding interactions between TBA and silica surface known toexist under equilibrium conditions are not exhibited in out-of-equilibrium condition andthus do not play any role in governing capillary rise dynamics of TBA:TOL mixtures.
Quantitative analysis of the rise level by neutron radiography revealed separation ofthe imbibition front into two phases. The value of imbibition coefficients revealed that theleading front showed dynamics characteristic of a mixture with higher TOL compositionthan in the bulk reservoir, while the trailing front had dynamics corresponding to amixture composition same as that of bulk reservoir. Especially in the case of 50:50 (TBA-H:TOL-H) mixture, the leading front appeared to have dynamics equal to pure TOL.We attribute the occurrence of this phase separation to TOL’s higher surface tensionwhich at a capillary junction of unequal radii might cause a phase separation into onewith higher surface tension (respectively more TOL) to momentarily rise ahead due to agreater Laplace pressure. However we find the contribution of this second leading frontto be minor and it is in fact the slower front following bulk reservoir composition whichdrives overall imbibition dynamics analogous to the results of gravimetric study.
Bibliography
[1] Bell, J. M., and Cameron, F. The flow of liquids through capillary spaces. TheJournal of Physical Chemistry 10, 8 (1906), 658–674.
[2] Darcy, H. Les fontaines publiques de la ville de Dijon: exposition et application...Victor Dalmont, 1856.
[3] Debye, P., and Daen, J. Stability considerations on nonviscous jets exhibitingsurface or body tension. Physics of Fluids (1958-1988) 2, 4 (1959), 416–421.
[4] Dimitrov, D., Milchev, A., and Binder, K. Capillary rise in nanopores: molec-ular dynamics evidence for the lucas-washburn equation. Physical review letters 99,5 (2007), 054501.
[5] Dumitrescu, V., and Pântea, O. Viscosities of binary mixtures of toluene withbutan-1-ol and 2-methylpropan-2-ol. Journal of the Serbian Chemical Society 70, 11(2005), 1313–1323.
126

BIBLIOGRAPHY
[6] Gruener, S., and Huber, P. Spontaneous Imbibition Dynamics of an n -Alkane inNanopores: Evidence of Meniscus Freezing and Monolayer Sticking. Physical ReviewLetters 103, 17 (oct 2009), 174501.
[7] Gruener, S., and Huber, P. Imbibition in mesoporous silica: rheological conceptsand experiments on water and a liquid crystal. Journal of physics. Condensed matter: an Institute of Physics journal 23, 18 (may 2011), 184109.
[8] Gruener, S., Sadjadi, Z., Hermes, H. E., Kityk, A. V., Knorr, K., Egel-haaf, S. U., Rieger, H., and Huber, P. Anomalous front broadening duringspontaneous imbibition in a matrix with elongated pores. Proceedings of the NationalAcademy of Sciences of the United States of America 109, 26 (jun 2012), 10245–50.
[9] Grüner, S. A. Rheology and Dynamics of Simple and Complex Liquids in Meso-porous Matrices.
[10] Huber, P., Grüner, S., Schäfer, C., Knorr, K., and Kityk, a. V. Rheologyof liquids in nanopores: A study on the capillary rise of water, n-Hexadecane andn-Tetracosane in mesoporous silica. The European Physical Journal Special Topics141, 1 (feb 2007), 101–105.
[11] Kiepsch, S., and Pelster, R. Interplay of vapor adsorption and liquid imbibitionin nanoporous vycor glass. Physical Review E 93, 4 (2016), 043128.
[12] Liu, H., and Cao, G. Effectiveness of the young-laplace equation at nanoscale.Scientific reports 6 (2016).
[13] Lucas, R. Ueber das zeitgesetz des kapillaren aufstiegs von flüssigkeiten. Colloid& Polymer Science 23, 1 (1918), 15–22.
[14] Nikam, P. S., Jagdale, B. S., Sawant, A. B., Hasan, M., Chemistry, P.,College, M. S. G., and Camp, M. Densities and Viscosities of Binary Mixturesof Toluene with Methanol , Ethanol , Propan-1-ol , Butan-1-ol , Pentan-1-ol , and.559–563.
[15] Sears, V. F. Neutron scattering lengths and cross sections. Neutron news 3, 3(1992), 26–37.
[16] Speight, J. G., et al. Lange’s handbook of chemistry, vol. 1. McGraw-Hill NewYork, 2005.
[17] Washburn, E. W. The dynamics of capillary flow. Physical review 17, 3 (1921),273.
[18] Xue, Y., Markmann, J., Duan, H., Weissmüller, J., and Huber, P. Switch-able imbibition in nanoporous gold. Nature communications 5, May (jan 2014), 4237.
127

BIBLIOGRAPHY
128

5
General Conclusion and futureperspectives
129

Chapter 5. General Conclusion and future perspectives
The study of structural and dynamic phenomena in a model binary liquid systemunder nano-confinement was approached in a unique way by using a combination of ther-mdynamic equilibrium and out-of-equilibrium conditions. The use of TBA and TOL,two molecules with distinct ways of molecular interaction, i.e. H-bonding versus Van derWaals, provided a system which appears to be ideal from a macroscopic scale, but showsnon-ideal behaviour at the nanoscale, owing to the ability of TBA to form H-bondednetworks. This non-ideal nature existent in bulk state itself proved to be very useful forunderstanding the effect of nanometric spatial confinement and tunable surface chemistryon the molecular organization of the confined binary liquids and the driving forces behindit.
Chemical shift study from 1H MAS NMR experiments unveiled the existence of H-bonding networks in mixtures under confinement in MCM-41 pores at such low concen-trations of TBA, where in the bulk liquid mixtures TBA molecules completely lose theirH-bonded network and are present as free monomers. The persistence of H-bonded net-works at high TBA dilution in confinement thus raised the possibility of a new type of H-bonding interaction not seen in bulk, i.e. between hydroxyl group of TBA and free surfacesilanol groups on MCM-41 pore wall. If this is true then at higher TBA concentrations,more number of TBA molecules must be interacting with the pore-surface leading to anano-segregation. This finding justifies the previously reported core-shell model of phaseseparation of TBA:TOL mixtures confined in MCM-41 and SBA-15 nanopores (Chapter1, section E) where TBA separates out to form a monolayer-thick shell attached to silicapore wall while TOL forms the core.
The small diameter of MCM-41 pore (3.4 nm), only a few molecular layers wide couldaccommodate only one monolayer of TBA shell and a core which is 2-3 molecular layersthick. In bigger pores like those of SBA-15 (8 nm) there might be possibility of a concen-tration gradient from pore wall to centre of pore or presence of interfaces of TBA:TOLmixtures instead of a sharp core-shell boundary. Thus a chemical shift study on TBA:TOLmixtures confined in SBA-15 might prove useful to investigate the nature of H-bondinginteractions as a consequence of these interfaces. The influence of changing the chem-ical nature of pore walls from hydrophilic to hydrophobic by changing the host matrixto CMK-3 which has small pore diameter (4 nm) similar to MCM-41 has the potentialto change the nature of H-bonded network, as TBA could no longer make H-bondinginteractions with the pore wall. This makes it interesting to investigate whether the -OHchemical shift will exhibit a behaviour reminiscent of bulk TBA:TOL mixtures or unveilsome characteristics unique to confinement in CMK-3.
An attempt to characterize the self-diffusion dynamics of TBA:TOL mixtures in con-finement using PFG NMR method was met with certain challenges. The mean squaredisplacement of TOL molecules confined in MCM-41 greatly exceeded the pore lengthitself. The molecular motions as a result were fast enough even for the minimum possiblevalue of time-resolution ∆, such that the molecules could travel several times along thepore-length and make the self-diffusion dynamics appear ∆-independent. However a pre-cise measurement of MCM-41 pore length was achieved (0.65 µm) which was not possibleto obtain via electron microscopy.
The diffusion of TOL in TBA:TOL mixtures confined in SBA-15 revealed the existenceof two populations of different dynamics, one which was two orders of magnitude faster
130

than diffusion of TOL in bulk mixture of same composition and a second populationwith slower dynamics comparable to that of bulk which was found to be ∆-dependent.Interestingly, the magnetization attenuation was found to be ∆-dependent, an observationcharacteristic of isotropic bulk-like diffusion, but at the same time no strict mixturecomposition dependence was seen, unlike TBA:TOL bulk mixtures which show strongconcentration dependence in the diffusion dynamics of TBA and TOL. However, thestrong decay of magnetization in the case of SBA-15 at much lower q values, perhapsowing to the very short transverse relaxation time (T2 ≈ 2 ms) of the confined speciescauses a fast loss of correlation between nuclear spins even for the smallest possible ∆values, which makes it difficult to confirm whether the observed magnetization decaycurves represent the whole information on the self-diffusion dynamics.
Gravimetric vapour sorption experiments of TBA and TOL binary gas mixture inMCM-41 pores showed that the influence of H-bonding interactions between TBA andsilica surface extends even to gas-solid interface, leading to preferential adsorption ofTBA. With the help of a multi-component BET model, we expressed semi-quantitativelythe sheer difference of interaction of the two molecules with the silica surface in terms ofa thermodynamic parameter giving the energetic affinity of each molecule for the silicasurface. We find the energy of interaction of TBA with the silica surface to be two ordersof magnitude greater than TOL which leads to a 100% TBA monolayer coverage of thepore surface with as little as 10% TBA in the binary gas. Thus MCM-41 acts as a surfaceselective material for TBA. Very interestingly, after coverage of pore-surface by first mono-layer of TBA, the surface loses its selectivity completely and the subsequent layer followsthe binary gas composition. The difference in nature of interactions between the first andsecond adsorbed layers, i.e. H-bonding interactions between TBA and silica surface andVan der Waals interaction in the second layer, is strong enough to cause the two layers tolose correlation between each other. At complete pore-filling post capillary condensation,we find that the concentration of TBA inside pore increases rapidly compared to its binarygas concentration until xporeTBA ≈ 44%, beyond which the rise in TBA concentration is muchmore gentle. Considering that the volume fraction of pore occupied by a monolayer ofTBA is approximately 44%, the situation could be rationalized very well once again by thecore-shell model such that, as long as there is sufficient amount of TBA to have completemonolayer coverage of the pore surface, a phase separation would take place giving rise toa shell of TBA and a TOL-rich core whose concentration could be determined. The ap-plication of this multi-component BET to adsorption in CMK-3, which is hydrophobic innature, revealed reversal in the nature of molecular interactions such that the monolayerhad higher concentration of TOL than its corresponding concentration in the binary gas,even though the effect was not as strong as seen for TBA/silica-surface affinity. This wasreflected in the lesser difference between the thermodynamic parameters TBA and TOLrespectively with the carbon surface when compared to silica surface. Most importantlywe were able to demonstrate here that by tuning the chemical nature of pore surface weare able to switch the molecular level organization at the nanoscale by simply playingwith the specific interactions that confined liquids make with the pore-walls and amongstthemselves.
The model of core-shell under equilibrium conditions justified by a structural andthermodynamic point of view raised interest in investigating whether these surface-specific
131

Chapter 5. General Conclusion and future perspectives
effects are also exhibited in out-of-equilibrium conditions, which may lead to a deviationin spontaneous imbibition dynamics of these binary liquids from the Lucas-Washburndynamics, which has in the past, successfully described flow of simple liquids even innanopores.
Gravimetric study of spontaneous imbibition of TBA:TOL mixtures in Vycor, madeup of interconnected networks of nanoporous silica revealed that the dynamics of ourbinary liquids could be predicted well by Lucas-Washburn equation, assuming the binaryliquids to be homogeneous in nature having density, surface tension and viscosity equalto the corresponding bulk-state mixtures. This makes us conclude that under flow, thephase separation effects are not exhibited.
However, neutron radiography study of the same process showed TBA:TOL mixturesto rise with two fronts, indicating a phase separation. The front rising above, showed dy-namics characteristic of higher amount of TOL than in the original mixture composition,while the trailing front was found to have dynamics as predicted from Lucas-Washburnlaw for the given mixture composition. Replacing TOL by its deuterated version TOL-dcaused disappearance of the TOL-rich front for the 50% TBA by vol. mixture. As TOL-dis a strong scatterer, disappearance of the TOL-rich front strengthens the interpretationof phase separation. However the TOL-rich phase is found to be much smaller in widththan the one obeying reservoir mixture composition. Very interestingly though, we findthe leading front for 50% TBA mixture to show dynamics similar to that of pure TOL,while the leading front for 90% TBA mixture showed dynamics similar to a mixture whichhas higher TOL concentration than in bulk reservoir (≈ 77%). Such concentration depen-dence that starts from pure TOL and goes to high TBA concentration raises an importantquestion, does the phase separation starts occurring only after a certain minimum thresh-old concentration of TBA is crossed, which could then be directly associated with specificinteractions of TBA with the silica surface. To answer this, a systematic study over awide concentration range is required in order to analyze dynamics of the phase-separatedfront and also to use different isotopic combinations to play with the contrast of the risingliquid, which could make a beneficial undertaking for the future.
At present the phase separation phenomenon has been interpreted as an interplaybetween the different surface tensions of TBA and TOL, such that at capillary junctions, aTOL-rich phase due to its greater surface tension momentarily separates out and occupiesa capillary ahead of the main mixture because of its greater Young-Laplace pressure.Since this front rises as a square root of time as well, we might conclude that this effect iscontinuous throughout the imbibition process but still small as the dynamics of imbibitionis still governed by the slower front which overwhelmingly constitutes the rising liquidfront.
Neutron radiography technique was utilised to investigate if the H-bonding interac-tions between TBA and silica surface was dominant enough to replace TOL from a Vycorsample completely filled with TOL. A block of Vycor was filled completely by TOL-Dvia imbibition process. After complete filling, the liquid reservoir was replaced by a 90:10TBA-H:TOL-H mixture such that only the bottom of block was in contact with the liquidsurface. In a course of about 21 hours, we notice the gradual decrease of transmissionof the sample up to a certain extent, beyond which the final contrast stayed stable. Theimage of Vycor block completely filled with TOL-D as well as the successive images of
132

the block in contact with the 90:10 HH (TBA-H:TOL-H) mixture were normalized bythe image of empty Vycor block. The transmission profile of the experiment is shown infigure 5.1(a), while in figure 5.1 (b), neutron radiography images of the changes occurringin the contrast of liquid filled inside the Vycor block, TOL-D at t = 0 (extreme left) after≈ 21 hours (1230 minutes)(extreme right) are shown along with intervening steps.
We find a decrease in transmission of the block at the end of experiment. This in-dicates that TOL-D has been replaced inside the block by TBA-H since it has a lowertransmittance. For a diffusive motion of TBA one would expect a front of lower transmit-tance moving ahead with time. However what we do observe is a homogeneous decrease intransmission of the entire block with time even though the rate of decrease in transmissionis faster closer to the bottom of block or in other words beginning of the transmissionprofile. One possible explanation could be leakage in the sealant material covering sidesof the Vycor block leading to diffusion of TBA from all sides. However if that were to betrue, the dynamics of this process should have been much faster which is obviously not thecase. The replacement of TOL-D by TBA-H is a complex situation involving simultane-ous entry of TBA molecules while exit of TOL and the entire process driven by strongeraffinity between silica surface and TBA molecules compared to TOL. An appropriatemodel which could explain such diffusion phenomenon driven by competition betweenliquid-liquid and liquid-wall interactions could be yet another interesting undertaking forfuture.
133

Chapter 5. General Conclusion and future perspectives
(a)
(b)
Figure 5.1: (a) Transmission profile of the Vycor block normalized by its empty state. Redcurve is for block filled with TOL-D, while the blue curve is obtained after 21 hours ofcontact with TBA-H:TOL-H 90:10 mixture. The black curves display the gradual decreasein transmission over time. (b) Neutron radiography images of the changes occurring inthe contrast of liquid filled inside the Vycor block, TOL-D at t = 0 (extreme left) andpossible inclusion of TBA-H after ≈ 21 hours (1230 minutes)(extreme right), along withintervening steps.
134

Résumé Les mélanges de toluène et de tert-butanol sont complètement miscibles dans toutes les compositions à l’échelle macroscopique. Toutefois tert-butanol forme un réseau de liaisons hydrogène à l’échelle nanométrique qui persistent même dans les mélanges liquides binaires tert-butanol/toluène. Des expériences de diffusion de neutrons ont révélé la séparation des phases du mélange dans une structure coeur-gaine sous confinement dans des solides nanoporeux hydrophiles. Le travail effectué dans cette thèse vise à comprendre le rôle joué par la concurrence des interactions intermoléculaires (liaisons hydrogène, Van der Waals) lors de la séparation de phase sous nanoconfinement. Des expériences de RMN révèlent la persistance d’un réseau de liaisons hydrogène dans ces liquides binaires confinés dans des nanopores de silice à des concentrations faibles de tert -butanol, fournissant la preuves d’un autre type de réseau de liaisons hydrogène sous confinement. Des expériences d’adsorption du mélange gazeux dans des nanopores de silice ont aidé à expliquer l’affinité plus élevée des parois de silice polaires pour tert-butanol par une modèle thermodynamique. Le remplacement de la matrice hôte par un analogue hydrophobe est associé à une inversion de la sélectivité, montrant cette fois une plus grande affinité du toluène pour la surface des pores. L’effet des interactions spécifiques avec la surface sur la dynamique d’imbibition spontanée de ces liquides binaires à travers le réseau de silice nanoporeux a également été étudié. Des expériences de radiographie de neutrons ont révélé la séparation des flux à deux composants, au sein d’une dynamique toujours gouvernée par une loi de Lucas-Washburn. . Abstract Toluene and tert-butanol mixtures are completely miscible for all compositions at the macroscopic scale. However tert-butanol forms a network of hydrogen-bonded clusters at the nanoscale which persist even in the tert-butanol-toluene binary liquid mixtures. Interpretation of neutron scattering experiments revealed phase separation of the mixture into a core-shell structure inside hydrophilic nanoporous solids, with a tert-butanol shell and a toluene core. The work carried out in this thesis is aimed at understanding the role played by competing intermolecular interactions (hydrogen-bonding, van der Waals) in driving phase separation in confinement. NMR experiments reveal the persistence of a hydrogen-bonding network in these binary liquids confined in silica nanopores even at very low concentrations of tert-butanol, providing evidence of a new kind of hydrogen bonded network under confinement. Vapour sorption isotherms of tert-butanol-toluene binary gas mixtures in silica nanopores helped explain higher affinity of polar silica walls for tert-butanol by a thermodynamic model. Replacing the host matrix by a hydrophobic analogue was found to reverse the selectivity, with toluene showing greater affinity for the pore surface. Effect of surface specific interactions was studied on spontaneous imbibition dynamics of these binary liquids through nanoporous silica network. Neutron radiography experiments revealed the separation of fluxes into a two-component flow, generally obeying the Lucas-Washburn law.

Synthèse de thèse: Adsorption and imbibition of binary liquids in nanoporous solids
Auteur: Sujeet Dutta
Institut de Physique de Rennes
Date de soutenance: 2/12/2016
Mention: Physique
Les systèmes hétérogènes composés d'interfaces liquide-gaz, solide-gaz, solide-liquide été
longtemps étudié et appliqué à une vaste gamme d'utilisations technologiques dans des domaines tels
que le pétrole le raffinage, la catalyse, le dessalement de l'eau, les produits pharmaceutiques et ainsi
de suite. Peu à peu, la complexité de ces systèmes a continué de croître avec l'avènement de matériaux
conçus pour une plus grande surface d'activité et de fonctionnalité. Dans la classe des systèmes
hétérogènes les matériaux poreux sont les plus connus. Zéolites et des MOFs (Metal-Organic
Frameworks), qui sont souvent fonctionnalisés pour atteindre des objectifs spécifiques sont largement
utilisés dans les produits chimiques l'industrie, et de nos jours avec un croissant d'importance sur les
questions environnementales trouvant application dans le stockage et la filtration de les composé
organiques volatils qui sont exemples de croissance dans la portée des matériaux poreux avec ultra-
haute surface spécifique.
Matériaux nanoporeux avec des diamètres de pores allant de 2 - 50nm, comparable à un peu
de couches moléculaires sont bien connus et largement étudiées. Il a été démontré précédemment
que les molécules de liquide ou de gaz de confinement dans de tels nanopores avec des géométries
spécifiques à l'échelle nanométrique pourrait conduire à une grande modification des propriétés
physiques des molécules par rapport à leur état de volume libre. L'architecture poreuse et la
concurrence entre les interactions moléculaires liquide-mur et liquide-liquide (Van der Waals,
hydrogénation,π-π empilage, etc.) pourrait induire la séparation de phases et la séparation des phases
désordre. Il a été démontré que la structuration induite par confinement se modifier la cristallisation et
les températures de transition vitreuse des espèces confinées. Ainsi, la notion des propriétés physiques
moyennes telles que la densité, la viscosité ou la tension superficielle des liquides en volume doit être
appliquée avec caution tout en traitant des systèmes nanoconfinés.
Il a été démontré que la structuration induite par le confinement entraîne une modification de
la dynamique propriétés de l'échelle de longueur sous-nanométrique (changements conformationnels
groupes) à l'échelle micrométrique (auto-diffusion de translation). Avec la disponibilité de méthodes
avancées de caractérisation de la matière molle, phénomènes induits par le confinement ont fait l'objet
d'une étude approfondie pour les systèmes mono-composants. L'actualité scientifique l'intérêt porté à
l'étude des systèmes à composantes multiples avec plus en plus complexité. Bien que beaucoup de
questions aient été bien traitées pour les systèmes montrant une miscibilité beaucoup reste à désirer
pour comprendre le rôle joué par la concurrence liquide-liquide et les interactions liquide-paroi dans la
structure et la dynamique des systèmes multi-composants montrant un écart de miscibilité négligeable.
Ces questions s'étendent à deux types de systèmes, l'un à l'équilibre thermodynamique,
dynamiques caractérisées par des vibrations moléculaires, des rotations et des autodiffusion et autres
qui sont hors d'équilibre caractérisés par des propriétés d'écoulement des matériaux confinés à travers
les nano-capillaires, où l'architecture des pores et l'environnement chimique pourraient jouer un rôle
dans la modification des caractéristiques d'écoulement en à l'état contre en volume. Dans le présent
chapitre, nous discutons des divers phénomènes induits par le confinement découverte jusqu'à présent
et le cas scientifique de cette thèse qui tente de répondre à certaines des questions non résolues dans
ce domaine.

L'étude des phénomènes structuraux et dynamiques dans un système liquide binaire modèle
sous nano-confinement a été approché d'une manière unique en utilisant une combinaison de
thermodynamique l'équilibre et les conditions hors d'équilibre. L'utilisation de TBA (tert-butanol) et TOL
(toluène), deux molécules avec des modes distincts d'interaction moléculaire, c'est-à-dire la liaison
hydrogène par rapport à Van der Waals, a fourni un système qui semble être idéal à partir d'une échelle
macroscopique, mais montre comportement non idéal à l'échelle nanométrique, en raison de la
capacité de TBA à former des réseaux. Cette nature non idéale existant en volume lui-même s'est
révélée très utile pour comprendre l'effet du confinement spatial nanométrique et de la chimie
superficielle réglable sur l'organisation moléculaire des liquides binaires confinés et les forces motrices
derrière-il.
L'étude du déplacement chimique à partir des expériences 1H MAS NMR a dévoilé l'existence
réseaux dans des mélanges en confinement dans des pores MCM-41 à des concentrations aussi faibles
de TBA, où dans les mélanges liquides en volume les molécules TBA perdent complètement leur réseaux
à liaison hydrogène et sont présents sous forme de monomères libres. La persistance des réseaux à
liaison H à une dilution TBA élevée en confinement a donc soulevé la possibilité d'un nouveau type de
liaison hydrogène interaction non observée en volume, c'est-à-dire entre le groupe hydroxyle de TBA
et la surface libre silanol sur la paroi de pores MCM-41. Si cela est vrai alors à des concentrations plus
élevées de TBA, plus de molécules de TBA doivent interagir avec la surface des pores conduisant à un
nano-ségrégation. Cette constatation justifie le modèle cœur-gaine précédemment rapporté de phase
séparation des mélanges TBA: TOL confinés dans des nanopores de MCM-41 et SBA-15 (Chapitre 1,
section E) où TBA se sépare pour former une gaine épaisse monocouche attachée à la silice tandis que
TOL forme le cœur.
Le petit diamètre du pore MCM-41 (3,4 nm), seulement quelques couches moléculaires de
large pourrait n'accueillent qu'une seule monocouche de gaine TBA et un cœur qui est de 2 à 3 couches
moléculaires épais. Dans les pores plus grands comme ceux de SBA-15 (8 nm) il pourrait y avoir
possibilité d'une gradient de concentration de la paroi de pore au centre du pore ou présence
d'interfaces de TBA: TOL mélanges au lieu d'une limite cœur-gaine tranchante. L'influence du
changement de nature chimique des parois des pores, de hydrophile à hydrophobe en changeant la
matrice hôte à CMK-3 qui a un petit diamètre de pore (4nm) semblable à MCM-41 a le potentiel pour
modifier la nature du réseau à liaison en H, car TBA ne pouvait plus faire de liaison H interactions avec
la paroi des pores. Cela rend intéressant d'étudier si le déplacement chimique de –OH montrent un
comportement qui rappelle les mélanges volumique de TBA: TOL ou dévoilent certaines
caractéristiques propres au confinement dans le CMK-3.
Une tentative de caractérisation de la dynamique d'auto-diffusion de TBA: TOL en confinement
utilisant la méthode de RMN PFG a rencontré certains défis. Le carré moyen le déplacement des
molécules de TOL confinées dans MCM-41 a largement dépassé la longueur de pore même. Les
mouvements moléculaires en résultant étaient assez rapides même pour le minimum possible valeur
de résolution temporelle Δ, telle que les molécules puissent voyager plusieurs fois sur le longueur de
pore et faire apparaître la dynamique d'auto-diffusion Δ-independent. Toutefois, une mesure de la
longueur des pores MCM-41 a été obtenue (0,65 μm) ce qui n'était pas possible à obtenir par
microscopie électronique.
La diffusion de TOL dans les mélanges TBA: TOL confinés dans la SBA-15 a révélé l'existence de
deux populations de dynamique différente, celle qui était deux ordres de grandeur plus rapide que la
diffusion de TOL dans un mélange en volume de même composition et une seconde population avec
une dynamique plus lente comparable à celle du volume qui s'est avéré être Δ - dépendant. Il est
intéressant de noter que l'atténuation de l'aimantation a été jugée dépendante, une observation

caractéristique de la diffusion isotrope en volume, mais en même temps, aucun mélange strictment
dépendent de la composition, contrairement de les mélanges volumique. Cependant, le forte de la
magnétisation dans le cas de SBA-15 à des valeurs q beaucoup plus faibles, peut-être en raison du temps
de relaxation transverse très court (T2 ≈2 ms) des espèces confinées provoque une perte rapide de
corrélation entre les spins nucléaires, même pour le plus petit possible valeurs de Δ, ce qui rend difficile
de confirmer si la décroissance de l'aimantation observée de les courbes représentent l'ensemble de
l'information sur la dynamique d'autodiffusion.
Expériences gravimétriques de sorption de vapeur de mélange gazeux binaires de TBA et TOL
dans les pores MCM-41 ont montré que l'influence des interactions de liaison-H entre TBA et silice
s'étend même à l'interface gaz-solide, conduisant à une adsorption préférentielle de TBA. Avec l'aide
d'un modèle BET-multi-composante , nous avons exprimé de manière semi-quantitative la simple
différence d'interaction des deux molécules avec la surface de la silice en termes d’un paramètre
thermodynamique donnant l'affinité énergétique de chaque molécule pour la surface de silice. Nous
trouvons l'énergie d'interaction de TBA avec la surface de silice à deux ordres d'amplitude supérieure à
TOL, ce qui conduit à une couverture monocouche TBA à 100% surface de pores avec aussi peu que
10% de TBA dans le gaz binaire. Ainsi MCM-41 agit comme une matériel surface sélectif pour TBA. Très
intéressant, après la couverture de la surface des pores par une première monocouche de TBA, la
surface perd complètement sa sélectivité et la couche suivante suit la composition de gaz binaire. La
différence de nature des interactions entre les deuxièmes couches adsorbées, c'est-à-dire des
interactions de liaison H entre TBA et surface de silice et l'interaction de Van der Waals dans la
deuxième couche est suffisamment forte pour que les deux couches perdent corrélation les uns avec
les autres. Lors de la condensation post-capillaire de remplissage complet des pores, nous constatons
que la concentration de TBA intérieur pore augmente rapidement par rapport à son concentration dans
le gaz binaire de jusqu'à xpore TBA≈ 44%, au-delà de laquelle l'augmentation de la concentration TBA est
plus doux. Considérant que la fraction volumique des pores occupés par une monocouche de TBA est
d'environ 44%, la situation pourrait être rationalisée très bien une fois de plus par la cœur-gaine de
sorte que, tant qu'il y ait une quantité suffisante de TBA pour avoir une monocouche de la surface des
pores, une séparation de phase dans une gaine de TBA et un cœur riche en TOL dont la concentration
pourrait être déterminée. L'application de cette modèle BET-multi-composante à l'adsorption dans
CMK-3, qui est hydrophobe en nature, révélée une inversion dans la nature des interactions
moléculaires telles que la monocouche avait une concentration plus élevée de TOL que sa
concentration correspondante dans le gaz binaire, même si l'effet n'était pas aussi fort que celui
observé pour l'affinité TBA / surface de silice. C'était reflétée dans la moindre différence entre les
paramètres thermodynamiques de TBA et TOL respectivement avec la surface de carbone par rapport
à la surface de la silice. Plus important nous avons pu démontrer ici qu'en ajustant la nature chimique
de la surface des pores nous sommes capables de changer l'organisation du niveau moléculaire à
l'échelle nanométrique en jouant simplement avec les interactions spécifiques que les liquides confinés
font avec les pores-murs et entre eux.
Le modèle de cœur-gaine dans des conditions d'équilibre justifiées par le modèle
thermodynamique ont suscité un intérêt pour l'étude de la question de savoir si ces effets sont
également exposés dans des conditions hors d'équilibre, ce qui peut conduire à un écart dans la
dynamique d'imbibition spontanée de ces liquides binaires du Lucas-Washburn dynamique, qui a, dans
le passé, décrit avec succès l'écoulement de liquides simples dans des nanopores.
Etude gravimétrique de l'imbibition spontanée des mélanges TBA: TOL à Vycor, la mise en place
de réseaux interconnectés de silice nano-poreuse a révélé que la dynamique de les liquides binaires
pourraient être prédits bien par l'équation de Lucas-Washburn, en supposant que les liquides binaires

d'être homogène dans la nature ayant la densité, la tension de surface et la viscosité égale aux mélanges
d'état en volume correspondants. Cela nous amène à conclure qu'en les effets de séparation de phase
ne sont pas présentés.
Cependant, l'étude de la radiographie neutronique du même procédé a montré TBA: TOL
mélanges à monter avec deux fronts, indiquant une séparation de phase. Le front montant au-dessus,
a montré la dynamique caractéristique d'une quantité plus élevée de TOL que dans la composition de
mélange d'origine, tandis que le front de fuite a été trouvé pour avoir la dynamique comme prédit de
Lucas-Washburn pour la composition de mélange donnée. Remplacement de TOL par sa version
deutérée TOL-d a provoqué la disparition du front riche en TOL pour la TBA de 50% en vol. mélange.
Comme TOL-d est un diffuseur fort, la disparition du front riche en TOL renforce l'interprétation de
séparation des phases. Cependant, la phase riche en TOL se révèle être beaucoup plus petite en largeur
que celle qui obéit à la composition du mélange réservoir. Très intéressant cependant, nous trouvons
le front de tête pour 50% mélange TBA pour montrer une dynamique similaire à celle de TOL pure,
tandis que le front avant pour un mélange de TBA à 90% présentait une dynamique similaire à un
mélange qui a une concentration en TOL plus élevée que dans le réservoir en volume (≈ 77%). Une telle
dépendance à la concentration qui commence à partir de TOL pure et va à haute concentration de TBA
soulève une question important, la séparation des phases ne commence-t-elle à se produire qu'après
un certain seuil minimal concentration de TBA est croisée, ce qui pourrait alors être directement associé
à des interactions de TBA avec la surface de silice. Pour y répondre, une étude systématique d’une large
gamme de concentration est nécessaire pour analyser la dynamique des phases séparées avant et aussi
d'utiliser différentes combinaisons isotopiques pour jouer avec le contraste de la hausse liquide, ce qui
pourrait constituer une entreprise bénéfique pour l'avenir.
Actuellement, le phénomène de séparation des phases a été interprété comme un entre les
différentes tensions de surface de TBA et de TOL, de sorte qu'au niveau des jonctions capillaires, un
TOL-riche front en raison de sa plus grande tension superficielle momentanément se sépare et occupe
un capillaire devant le mélange principal en raison de sa plus grande pression Young-Laplace. Puisque
ce front s'élève aussi à la racine carrée du temps, nous pourrions conclure que cet effet est tout au long
du processus d'imbibition, mais encore faible, car la dynamique de l'imbibition est encore régie par le
front plus lent qui constitue de façon écrasante le liquide montant avant.
La technique de radiographie neutronique a été utilisée pour étudier si les interactions liaison-
H entre la TBA et la surface de la silice était suffisamment dominante pour remplacer la TOL d'un Vycor
échantillon complètement rempli de TOL. Un bloc de Vycor a été complètement rempli par TOL-D via
le processus d'imbibition. Après remplissage complet, le réservoir de liquide a été remplacé par un
réservoir de mélange 90:10 TBA-H: TOL-H tel que seul le fond du bloc était en contact avec le liquide
surface. Dans un trajet d'environ 21 heures, on constate une diminution progressive de la transmission
de l'échantillon dans une certaine mesure, au-delà de laquelle le contraste final est resté stable. L’image
du bloc Vycor complètement rempli de TOL-D ainsi que les images successives du bloc en contact avec
le mélange HH (TBA-H: TOL-H) 90:10 a été normalisé par l'image du bloc vide de Vycor. Le profil de
transmission de radiographie neutronique des changements dans le contraste du liquide rempli à
l'intérieur du bloc Vycor après 21 heures indique que TOL-D a été remplacé à l'intérieur du bloc par
TBA-H. Pour un mouvement diffusif de TBA on peut s'attendre à un front de plus faible transmittance
progresser avec le temps. Cependant, nous observons une diminution homogène transmission de
l'ensemble du bloc avec le temps même si le taux de diminution de la transmission est plus proche du
bas du bloc ou en d'autres termes le début de la transmission profil. Une explication possible pourrait
être la fuite dans le matériau couvrant les côtés du bloc de Vycor conduisant à la diffusion de TBA de
tous les côtés. Cependant, si cela devait être vrai, la dynamique de ce processus aurait dû être beaucoup

plus rapide, ce qui n'est évidemment pas le cas. Le remplacement de la TOL-D par la TBA-H est une
situation complexe impliquant une l'entrée de molécules TBA pendant la sortie de TOL et l'ensemble
du processus affinité entre la surface de la silice et les molécules de TBA par rapport à la TOL. Un modèle
qui pourrait expliquer ce phénomène de diffusion provoqué par la concurrence les interactions liquide-
liquide et liquide-paroi pourrait constituer un autre avenir.