Adsorption and desorption behaviour of organic molecules ... · Adsorption and desorption behaviour...
97
Adsorption and desorption behaviour of organic molecules on kaolinite particles in non-aqueous media By Jonathan Fafard Submitted to the Faculty of Graduate and Postdoctoral Studies, University of Ottawa in partial fulfillment of the requirements for the degree of Master of Science with specialization in Chemistry University of Ottawa Ottawa-Carleton Chemistry institute Ottawa, Canada August 2012 MSc. Candidate Research Supervisor Jonathan Fafard Christian Detellier ©Jonathan Fafard, Ottawa, Canada, 2012
Transcript of Adsorption and desorption behaviour of organic molecules ... · Adsorption and desorption behaviour...

Adsorption and desorption behaviour of organic molecules on kaolinite particles in non-aqueous media
By
Jonathan Fafard
Submitted to the Faculty of Graduate and Postdoctoral Studies, University of Ottawa
in partial fulfillment of the requirements for the degree of
Master of Science with specialization in Chemistry
University of Ottawa
Ottawa-Carleton Chemistry institute
Ottawa, Canada
August 2012
MSc. Candidate Research Supervisor
Jonathan Fafard Christian Detellier
©Jonathan Fafard, Ottawa, Canada, 2012
2
Table of Contents
Chapter 1: Adsorption/desorption of oil sand based organoclay model systems in non-aqueous media 12
1.1: Introduction ..................................................................................................................................... 12
1.1.1: Oil Sands: An unconventional source of petroleum ................................................................. 12
1.1.2: Oil Sand Mining In the Athabasca Basin ................................................................................... 13
1.1.3: Clay Minerals ............................................................................................................................. 16
1.1.4: Asphaltenes ............................................................................................................................... 20
1.1.5: Modelling organoclay adsorption ............................................................................................. 21
1.2: Techniques and characterization ..................................................................................................... 23
1.2.1: Adsorption ................................................................................................................................ 23
1.2.2: 13C CPMAS NMR ........................................................................................................................ 27
1.2.3: Powder X-ray diffraction ........................................................................................................... 29
1.2.4: Thermal gravimetric analysis .................................................................................................... 30
1.2.5: Scanning electron microscopy (SEM) ........................................................................................ 32
1.2.6: Elemental analysis (CHNS EA) ................................................................................................... 33
1.3: Materials and methods for preparing adsorption products ........................................................ 34
1.3.1: Preparation of purified kaolinite adsorbent ............................................................................. 34
1.3.2: Preparation of organoclay aggregates ...................................................................................... 34
1.3.3: Characterization of organoclays ............................................................................................... 35
1.4: Results and Discussion of adsorption products ............................................................................... 37
1.4.1: Adsorbate/adsorbent blanks .................................................................................................... 37
1.4.2: Identifying loaded organics ....................................................................................................... 40
1.4.3: Identifying adsorption positions ............................................................................................... 43
1.4.5: Theoretical adsorption capacity based on monolayer surface coverage ................................. 47
1.4.6: Quantifying adsorption ............................................................................................................. 48
Figure 27: Adsorption isotherms of indole:kaolinite systems prepared in heptane at 23°C. Adsorption
followed the Langmuir model at low concentrations but increased exponentially at higher
concentations suggesting the formation of multilayers of adsorbate. .............................................. 50
1.4.7: Evidence of multilayer adsorption phenomena ....................................................................... 52
1.5: Desorption studies of organoclay aggregates ..................................................................................... 57

3
1.6: Preparation of desorption products ................................................................................................ 57
1.7: Results and discussion of desorption products ............................................................................... 59
1.7.1: Identifying organics remaining ................................................................................................. 59
1.7.2: Quantifying desorption ............................................................................................................. 61
1.8: Conclusion ........................................................................................................................................ 65
Chapter 2: Desorption of oil sand based organoclay model systems in non-aqueous media: competitive
adsorption strategy ..................................................................................................................................... 66
2.1: Introduction ..................................................................................................................................... 66
2.1.1: Cellulose: abundant and versatile biopolymer ......................................................................... 66
2.2: Materials and methods for competitive desorption ....................................................................... 72
2.2.1: Competitive desorption of organoclays using cellulose ........................................................... 72
2.3: Results and discussion for competitive desorption ......................................................................... 74
2.3.1: Disaggregation and dispersion the organoclays ....................................................................... 74
2.3.3: Challenges with quantifying desorption ................................................................................... 78
2.3.4: Quantifying desorption using 13C CPMAS NMR: optimization experiments ............................. 80
2.3.5: Quantifying desorption using 13C CPMAS NMR ........................................................................ 82
2.3.6: Recommendation: quantitation of solvent filtrates ................................................................. 86
2.3.7: Next steps: alternative competitive agents .............................................................................. 90
2.4: Conclusion ........................................................................................................................................ 93
References .................................................................................................................................................. 94

4
List of Figures
Figure 1: World oil production outlook 2009-2035 (Adapted from [International Energy Agency, 2010]).
Unconventional sources of oil become more important as productivity of known reserves decline. ----- 13
Figure 2: [shown left] Process diagram for a typical oil sand mining operation. Under ideal conditions,
treatment leads to complete phase separation of the bitumen froth, water and sand in the mixture.
[source: Shell Canada Energy]. ----------------------------------------------------------------------------------------------- 14
Figure 3: View of a tailing pond in the Athabasca basin. The radar device shown scans for incoming birds
and emits a bird of prey call to ward off [source: Peter Essick, National Geographic]. ------------------------ 16
Figure 4: [shown left] a) top-down view of an idealized aluminosilicate tetrahedral sheet b) top down
view of an idealized aluminosilicate octahedral sheet c) a side cut out view of the superimposed
octahedral:tetrahedral aluminosilicate layered structure (Bailey, 1988). ----------------------------------------- 17
Figure 5: 3 dimensional ball & stick model of two layered sheets of kaolinite (Hess, 1992). Individual
sheets are held together through hydrogen bonding interactions between the silicate and aluminol
layers in adjacent sheets. ------------------------------------------------------------------------------------------------------ 18
Figure 6: [shown left] Elemental composition of a typical asphaltene extract (Payzant, 1991). [shown
right] Flowchart detailing the fractionation of a petroleum feedstock (Speight2004). Asphaltenes are the
components of a feedstock insoluble in saturated n-hydrocarbon solvents. They contain an appreciable
quantity of aromatic carbons and polar heteroatoms. ---------------------------------------------------------------- 20
Figure 7: Overview of organoclay fine model proposed. Indole, present as functional groups in
asphaltenes; and kaolinite, one of the most important clays in the Athabasca basin, were chosen as a
model for the organoclays found in oil sands. Asphaltene model on left adapted with permission from
(Gray, 2011) ----------------------------------------------------------------------------------------------------------------------- 21
Figure 8: Graphical representation of Freundlich, Langmuir and BET isotherms. ------------------------------- 24
Figure 9: IUPAC’s modern classification of the possible classes of adsorption isotherms (Carmody, 2007).
Types I and II are the most commonly encountered isotherms. Type I describes adsorption of a single
monolayer on the external surface, characteristic of microporous sorbents with small surface areas.
Type II describes unrestricted monolayer-multilayer adsorption, characteristic of macroporous or non-
porous adsorbents with strong adsorbate-adsorbent interactions. ------------------------------------------------ 26
Figure 10: Graphical representation of a cross polarization experiment [source: Glenn Facey, University
of Ottawa]. Magnetization is transferred from one nuclei to another by tuning the rf field strength
(BH/BX) to be equal to the ratio of the gyromagnetic ratio (γX/γH)of the two nuclei. --------------------------- 28
Figure 11: Visual representation of Bragg diffraction in a crystalline structure [source: David Mogk,
Montana State University]. Diffraction of incident X-rays from the crystal planes present results in a
characteristic interference pattern, which varies according to the d-spacing between the planes. ------- 29
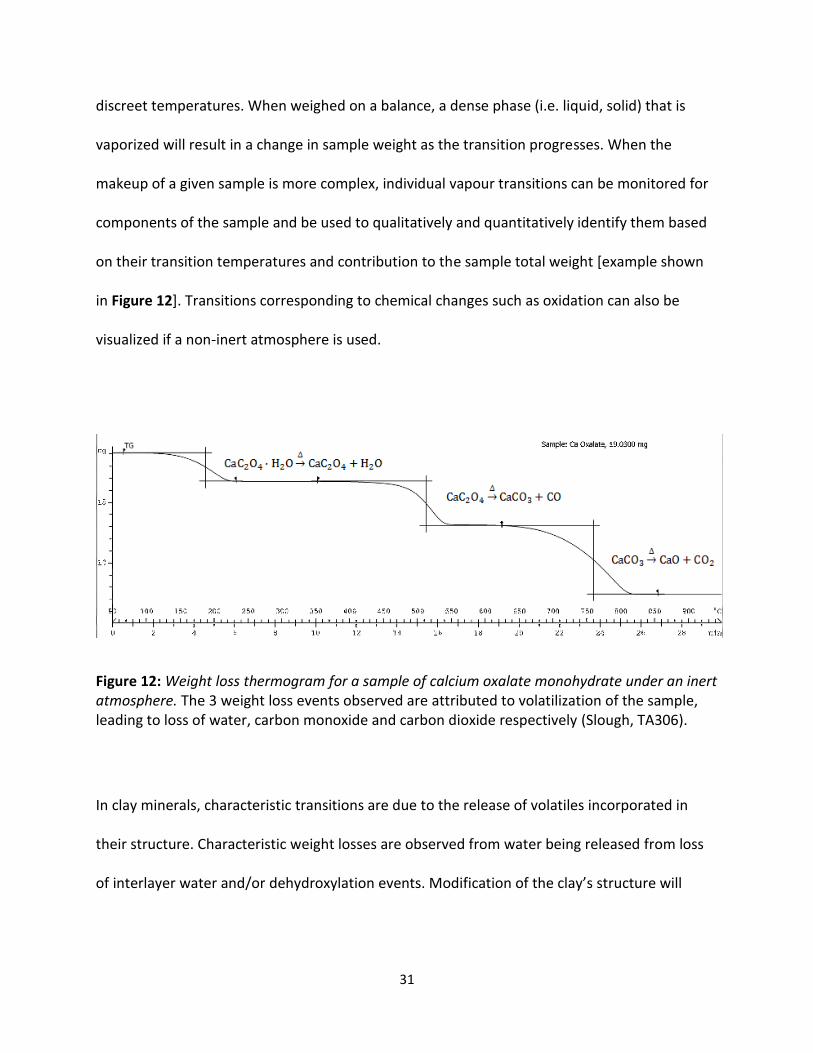
Figure 12: Weight loss thermogram for a sample of calcium oxalate monohydrate under an inert
atmosphere. The 3 weight loss events observed are attributed to volatilization of the sample, leading to
loss of water, carbon monoxide and carbon dioxide respectively (Slough, TA306). ---------------------------- 31
Figure 13: Visual representation of the possible outcomes in electron based characterization techniques
[source: Darrell Henry, Louisiana State University]. -------------------------------------------------------------------- 32

5
Figure 14: SEM microscope image of the purified kaolinite adsorbent. -------------------------------------------- 38
Figure 15: TGA weight loss graphs of the purified kaolinite. --------------------------------------------------------- 39
Figure 16: TGA weight loss graphs of neat indole. ---------------------------------------------------------------------- 39
Figure 17: 13C cross-polarization magic angle spinning (CPMAS) nuclear magnetic resonance spectrum of
neat indole. ----------------------------------------------------------------------------------------------------------------------- 40
Figure 18: 13C CPMAS NMR spectra of a kaolinite:indole systems prepared in heptane (KHI14) and
toluene (KTI06) solutions containing indole. The intensity of the indole resonances, attributed to the
peaks in the 80-150ppm region, was visible in the spectra, indicating that a fraction of the indole in
solution was loaded on the clay. -------------------------------------------------------------------------------------------- 40
Figure 19: 13C CPMAS NMR spectra of a kaolinite:indole systems prepared in heptane. The high field
resonances observed can be partially attributed to rotational bands of the higher field indole
resonances. ----------------------------------------------------------------------------------------------------------------------- 42
Figure 20: X-ray diffraction of kaolinite:indole systems prepared by dispersing kaolinite for 48hr in a
solution of heptane (KHI15) and toluene (KTI05) containing indole. The reflections observed suggest
indole wasn’t intercalated, with no noticeable shift in the reflections of neat kaolinite. A new phase
appearing around 18 o2θ can be attributed to organic matter adsorbed on the surface. --------------------- 43
Figure 21: SEM microscope images of purified kaolinite dispersed in water. Aggregation motifs obtained
was similar to those observed in real world samples. ------------------------------------------------------------------ 45
Figure 22: SEM microscope images of purified kaolinite dispersed in heptane. Dispersion in non-polar
solvents hinders aggregation. ------------------------------------------------------------------------------------------------ 45
Figure 23: Scanning electron microscope images of indole:kaolinite systems prepared in toluene.
Kaolinite platelets aggregate together to form vermicular shaped stacks. --------------------------------------- 46
Figure 24: Scanning electron microscope images of indole:kaolinite systems prepared in heptane.
Kaolinite platelets aggregation is even more striking than with those prepared in toluene.----------------- 47
Figure 25: Dimensions of a single molecule of indole. The structure and its dimensions were found using
the ACD/Chemsketch v.11.01. Dimensions were calculated using the bond length tool. An average of the
two diagonal distances shown (6.664 Å, 6.638 Å) along with simple trigonometric identities was used for
calculating the width (6.533 Å). ---------------------------------------------------------------------------------------------- 48
Figure 26: Adsorption isotherms of indole:kaolinite systems prepared in toluene at 23°C. At the
concentration range chosen, adsorption follows a simple Langmuir model, with loading rate decreasing
as the coverage corresponding to a monolayer is approached. ----------------------------------------------------- 50
Figure 27: Adsorption isotherms of indole:kaolinite systems prepared in heptane at 23°C. Adsorption
followed the Langmuir model at low concentrations but increased exponentially at higher concentations
suggesting the formation of multilayers of adsorbate. ---------------------------------------------------------------- 50
Figure 28: TGA weight loss of solvent blank material prepared in heptane. The clay dehydroxylation
weight loss event after 500°C is noticeably shifted towards higher temperature in the heptane blank. - 52
Figure 29 : TGA weight loss of solvent blank material prepared in toluene. Weight loss events were
similar to those obtained in the heptane blank material. ------------------------------------------------------------- 52
Figure 30: Thermal gravimetric weight loss curve of indole:kaolinite system prepared in heptane. Loss of
the loaded organic material occurs in 2 overlapping steps from 100°C to 200°C, suggesting a multilayer
stacking of the loaded organic material. ---------------------------------------------------------------------------------- 53

6
Figure 31: Thermal gravimetric weight loss curve of an indole:kaolinite systems prepared in toluene.
Weight loss events were similar to those obtained using heptane. ------------------------------------------------ 54
Figure 32: Adsorption isotherm for indole:kaolinite systems prepared in toluene at 23°C. Adsorption
profile is fit to the BET equation using the parameters shown above. Curve fitting was done by a non-
linear regression of data points through the Sigma Plot 12 graphing software. -------------------------------- 56
Figure 33: 13C cross-polarization magic angle spinning (CPMAS) nuclear magnetic resonance spectrum of
the C-5 asphaltenes used. 0-50 ppm resonances are attributed to aliphatic functionalities and 100+ppm
resonances to aromatic functionalities. ----------------------------------------------------------------------------------- 59
Figure 34: (left) 13C CPMAS NMR spectra of a kaolinite:indole systems prepared in heptane (KHI14)
before and after dispersing in toluene. In both systems, the loaded organics were not completely
removed by dispersion in the solvent. ------------------------------------------------------------------------------------- 59
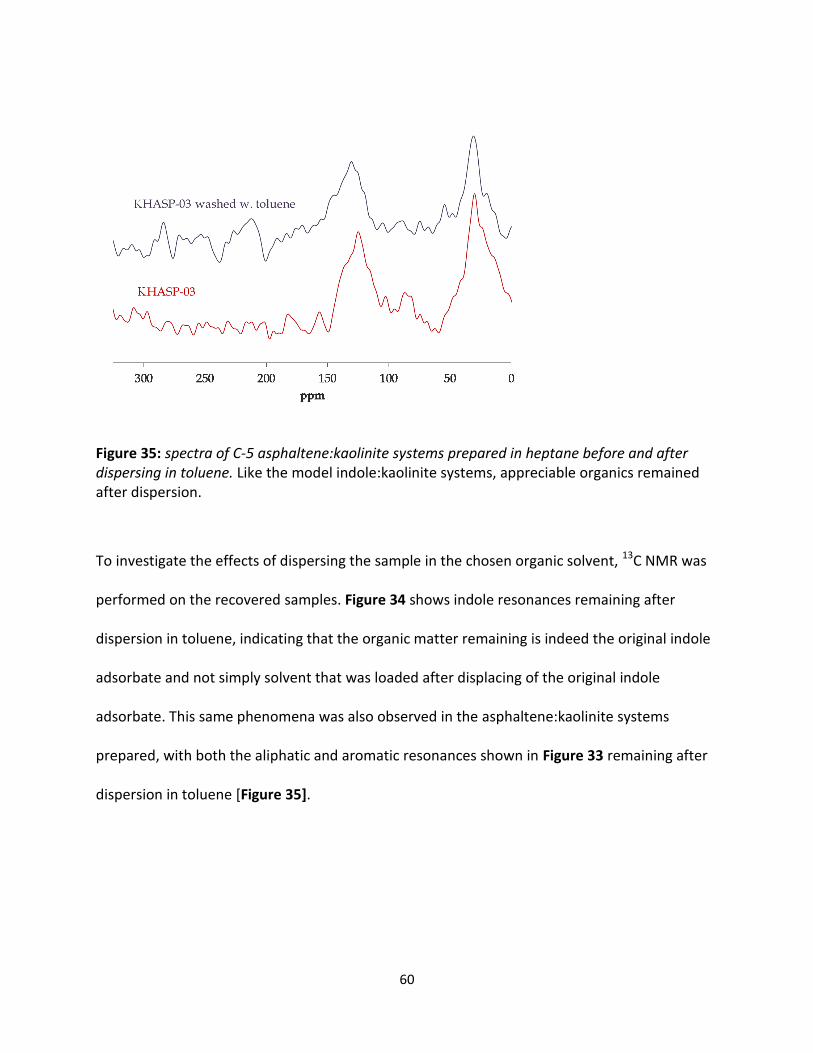
Figure 35: spectra of C-5 asphaltene:kaolinite systems prepared in heptane before and after dispersing in
toluene. Like the model indole:kaolinite systems, appreciable organics remained after dispersion. ------ 60
Figure 36: Desorption studies of an indole:kaolinite system prepared in heptane using various organic
solvents. Organic loading was quantified by %CNS elemental analysis of the recovered organoclay. The
most effective solvents removed close to 30-50% of the loaded organic. In the indole based organoclays,
the amount remaining was approximately a monolayer equivalent (line shown in red). --------------------- 61
Figure 37: Desorption studies of an asphaltene:kaolinite system prepared in heptane using various
organic solvents . Less organic matter was removed in the asphaltene:kaolinite systems, but showed a
similar trend to the indole system. ----------------------------------------------------------------------------------------- 62
Figure 38: (shown left) Structure of cellulose and (shown right) hydrogen bonding pattern for 2 cellulose
allomorphs of native cellulose (Festucci-Buselli, 2007). The hydrogen bonding pattern between the beta
glucan chains gives rise to the different crystal structures and allomorphs in cellulose.---------------------- 66
Figure 39: Cross section of a fibrillar stack of cellulose chains. The hydrogen bonding between individual
chains gives rise to a fibril shaped macrostructure that contains region of high and low crystallinity.
Adapted from (Moon, 2011). ------------------------------------------------------------------------------------------------- 67
Figure 40: Structural arrangement of cellulose synthases found in cellulose microfibrils (Ding, 2006). --- 68
Figure 41: Proposed cross sectional view of an Arabidopsis leaf cell (Somerville, 2004). Cellulose is
synthesized from CesA enzymes to form fibrilar cellulose strands. These fibrils stack in a crisscrossed
motif to form the backbone of the plant wall. --------------------------------------------------------------------------- 69
Figure 42: Visual representation of the hypothesized pathway for competitive adsorption/desorption of
organoclays using cellulose. The organoclay, shown as stacked hexagonal platelet coated with organics,
and cellulose, shown as a single fiber, when dispersed together in an organic solvent will lead to
deaggregation of the platelets and displacement of the organic matter into solution. ----------------------- 71
Figure 43: SEM microscope image of the cellulose adsorbate used in the desorption studies. SEM pictures
taken of the neat cellulose, shown in Figure 43 show it to be composed primarily of micron sized fibers
of varying shapes and sizes. Sub-micron sized fibers were also present, though in much lower quantities.
--------------------------------------------------------------------------------------------------------------------------------------- 72
Figure 44: 13C cross-polarization magic angle spinning (CPMAS) nuclear magnetic resonance spectrum of
the neat cellulose used in the desorption studies. Peaks were assigned according to (Newman, 1996) --- 73
Figure 45: SEM images of an asphaltene organoclay after dispersion with an excess (10:1, w/w). Clay
particles are completely deaggregated and well dispersed over the surface of the cellulose fibers. ------ 74

7
Figure 46: SEM images of an organoclay after dispersion with a limited amount (1:10, w/w) of cellulose.
--------------------------------------------------------------------------------------------------------------------------------------- 74
Figure 47: 13C CPMAS NMR spectra of a kaolinite:asphaltene system prepared in heptane compared to
the same material after dispersing with and without cellulose. Close analysis of the spectra, shows that a
fraction still remains. ----------------------------------------------------------------------------------------------------------- 76
Figure 48: Top and bottom spectra shown in Figure 47 with their intensity scales matched. ---------------- 76
Figure 49: Attenuated total reflection fourier-transform infrared (AT-FTIR) of a kaolinite:C-5 asphaltene
organoclay prepared in heptane Vibrational bands between 500-1200nm and between 3400-3700nm
are attributed to the kaolinite clay adsorbent. Bands between 1200-1500 nm are attributed to bending
and between 2800-3000nm to stretching of alkane and alkene functionalities. -------------------------------- 79
Figure 50: DRIFT spectra of native and microcrystalline cellulose. Adapted from (Ilharco, 1997). Cellulose
vibrational bands overlap with all the analyte bands, making quantitation of cellulose organoclay
materials very difficult to achieve. ------------------------------------------------------------------------------------------ 80
Figure 51: 13C CPMAS NMR spectra of a kaolinite:asphaltene organoclay after dispersion with cellulose
measured using a varying p15 pulse contact time. Signal is most intense using a 500µs contact time. --- 81
Figure 52: 13C CPMAS NMR spectra of kaolinite:asphaltene organoclay recovered after dispersion with
varying quantities of cellulose in toluene. Spectral subtraction was done using a cellulose blank to
remove it’s resonances from the spectra. The subtraction appears to remove a portion of the analyte’s
resonances, especially those attributed to aromatics. ----------------------------------------------------------------- 82
Figure 53: Close up of the 0-50ppm region of the spectra shown in Figure 52. Intensities are scaled
according to the masses loaded in the rotor and normalized to the signal at 0ppm. Maximum intensity of
the aliphatic resonance was used to quantify the aliphatic content. ---------------------------------------------- 84
Figure 54: Close up of the 100-150ppm region of the spectra shown in Figure 52. Intensities are scaled
according to the masses loaded in the rotor and normalized to the signal at 150ppm. The intensity of the
shoulder around 130-140 ppm was used to quantify the aromatic content. ------------------------------------ 84
Figure 55: Aliphatic functionalities remaining in an organoclay after dispersion in toluene with as a
function of cellulose content added to the dispersion. Cellulose added to the dispersion improved the
desorption process by 15-25%. Increasing the cellulose content beyond 10% had no effect. --------------- 85
Figure 56: Aromatic functionalities remaining in an organoclay after dispersion in toluene with as a
function of cellulose content added to the dispersion. Cellulose added to the dispersion improved the
desorption process by 15-40%. Increasing the cellulose content beyond 10% appeared to have a positive
effect on desorption. ----------------------------------------------------------------------------------------------------------- 86
Figure 57: UV-visual adsorption spectrum of an asphaltene solution in toluene Profile from 300-800 nm is
that of an extinction curve, with a single band at 405nm attributed to π-π* transitions of petroleum
porphyrins (Evdokimov, 2003). Strong adsorption from 200-300nm is attributed to the toluene solvent.
--------------------------------------------------------------------------------------------------------------------------------------- 88
Figure 58: Absorbance at 405nm as a function of asphaltene content in solution. Quantitation of
asphaltene content using the 405nm shoulder shows good linearity. --------------------------------------------- 89
Figure 59: Hypothetical outcomes for competitive desorption of organoclays using cellulose. The
displacement outcome is the desired for competitive desorption, however the real process is believed to
be some combination of the 3 shown. ------------------------------------------------------------------------------------- 90

8
Figure 60: Structure of (shown left) ethyl cellulose and (shown right) carboxymethyl cellulose. Chemically
modified cellulose could overcome the problems related to cellulose’s insolubility. -------------------------- 92

Acknowledgements
While this work is attributed to a single individual, its completion would not have been possible
without the help of many others. I would like to thank first and foremost my supervisor
Christian Detellier for giving me to opportunity to work under his guidance and for his patience
and understanding for the many delays and setbacks encountered throughout this project.
I would like to thank our group’s post-doctoral fellows and research associates with whom I
worked on this project: Sadok Letaief, Nabil Al-Yassir, and Gustave Kenne. Without their
seemingly endless wisdom at troubleshooting problems with my experiments and our insightful
discussions on our experimental results, we would not be where we are today with this project.
I would also like to thank the many visiting professors in our group during my stay: Claude
Forano, Vanessa Prévot, and Ignas Tonlé for their insightful commentary and guidance as well
as the students in our group: Rola Mansa, Katrin Blank, Lilianne Pagé and our visiting students:
Jérôme Leclercq, Gabriel Machado, and Leopoldo Radtke for their helpful pointers and
comments during our group meetings.
I would like to extend my thanks to the numerous support staff at the University of Ottawa for
their help completing my experiments: Glenn Facey for help in recording NMR spectra, Tara Kell

10
for help in recording X-ray spectra, Yun Liu for help in recording electron microscope images,
Paul Middlestead for help in recording elemental analysis.
And finally, I would like to thank my family and friends for their endless support and
encouragement throughout my studies. I would not have made it this far without you.

Abstract
Organoclays modelling the Athabasca oil sands were prepared in heptane and toluene showing
indole loading occurring exclusively on the external surface of the clay, via a multilayer
adsorption mechanism. Solvent adsorption was minimal. Vermicular microstructures, similar to
natural kaolinite were formed. Isotherms were constructed and fitted to the BET equation,
giving monolayer quantities (9.28mg) that matched well to the theoretical amount calculated
from surface area measurements (8.87mg). Dispersing the organoclays in isopropanol and in
toluene left a monolayer equivalent.
Using cellulose as a competitive desorption agent in asphaltene based organoclay dispersions
achieved complete disaggregation of the dispersed organoclay stacks. 13C CP-MAS NMR,
showed up to a 25% increase in desorption for aliphatic and up to 40% increase in desorption
for aromatic functionalities of the loaded organic matter.
Investigation of other saccharides and modified celluloses as competitive agents is
recommended for future work.

Chapter 1: Adsorption/desorption of oil sand based organoclay model systems in non-aqueous media
1.1: Introduction
1.1.1: Oil Sands: An unconventional source of petroleum
The last couple of decades have seen a sharp increase in energy demand, mostly arising from
the emerging economies of newly industrialized countries (International Energy Agency, 2010).
Discovery of conventional sources are projected to decline (Hubbert, 1956), and oil production
is expected to shift towards non-conventional sources in the coming decades [see Figure 1].
One important source is in the form of oil sands, a mixture of sediments, water and a viscous,
high molecular weight crude oil feedstock known as bitumen.

13
Figure 1: World oil production outlook 2009-2035 (Adapted from [International Energy Agency, 2010]). Unconventional sources of oil become more important as productivity of known reserves decline.
1.1.2: Oil Sand Mining In the Athabasca Basin
Much research has been done in developing oil sands extraction methods, much of it centered
on the Athabasca Basin, one of the world’s largest reservoirs (McMclave, 1935; Camp, 1976).
One of the key features of the regions mineralogy is the hydrophilicity of its sand grains
(Mossop, 1980), believed to be resulting from a thin, nanometer scale layer of water
sandwiched between the bitumen adsorbate and the mineral adsorbent (Takamura , 1982; Hall ,
1983). When in an aqueous environment, solvent favourable interactions allow for release of
the adsorbed bitumen with a minimal amount of energy and mechanical force applied, making
such aqueous based methods the most economically feasible and predominant extraction and

14
treatment techniques in use today (Masliyah, 2004). These methods typically go through the
following steps: the displacement of the bitumen from the surface of the sediment ore through
favourable interaction of the hydrophilic sediment and water; the aeration of the solution to
fractionate the bitumen from the water as a froth, driving it to the surface of the solution; and
finally the mechanical separation and subsequent treatment of the bitumen froth from the
solution. The processes’ tailings, containing the leftover water and sediment are then used for
land remediation and the water is recycled in subsequent extractions (See Figure 2 for a visual
summary of a typical process).
Figure 2: [shown left] Process diagram for a typical oil sand mining operation. Under ideal conditions, treatment leads to complete phase separation of the bitumen froth, water and sand in the mixture. [source: Shell Canada Energy].

15
Unfortunately, this process has several consequences. This is a very water intensive process: an
estimated 7.5-10 barrels of water are used to produce a barrel of bitumen [source: Government
of Alberta]. In addition, ores containing high levels of fine clay particles complicate and greatly
diminish the efficiency of the separation process. These fine particles are hydrophobic in nature
due to strongly adsorbed organic matter (Bensebaa , 2000; Sparks , 2003), making them
remarkably resistant to extraction with both aqueous and non-aqueous solvents such as
toluene. The fines are also sufficiently light that they will not fractionate from the bitumen
froth, resulting in lower quality froths and lower yields due to fixation of organic matter on the
surface of the fines (Tu , 2006). Separation of these fines from low quality froths is done
through sedimentation in tailing ponds, a very slow process which ties up water which could
otherwise be recycled in subsequent processes (Chalaturnyk , 2002) and generates much
ecological damage [see Figure 3]. The ecological and land management consequences of these
tailing wastes pose a great challenge for oil sands mining operations, and for this reason there
is a great need to refine and develop extraction and treatment methods.

16
Figure 3: View of a tailing pond in the Athabasca basin. The radar device shown scans for incoming birds and emits a bird of prey call to ward off [source: Peter Essick, National
Geographic].
1.1.3: Clay Minerals
The inorganic component of these fines is mostly clay minerals. In the Athabasca Basin these
are predominantly kaolinite and illiteError! Bookmark not defined.. These minerals are part of
he phyllosilicate family, minerals made up of individual layered sheets of metal cations
octahedrally and tetrahedrally coordinated to oxygen and hydroxyl groups. These sheets are
linked together through shared oxygens, forming discreet octahedral/tetrahedral layers.
Individual layers can stack together with one another through dipole-dipole, and hydrogen
bonding interactions to form a layered macrostructure. Assemblages formed from a single

17
tetrahedral sheet and octahedral sheet are referred to as 1:1 layers while those formed from 2
tetrahedral sheets sandwiching a single octahedral sheet are referred to as 2:1 layers (Bailey ,
1988). An idealized representation of these structures is shown in Figure 4.
Figure 4: [shown left] a) top-down view of an idealized aluminosilicate tetrahedral sheet b) top down view of an idealized aluminosilicate octahedral sheet c) a side cut out view of the superimposed octahedral:tetrahedral aluminosilicate layered structure (Bailey, 1988).

18
Figure 5: 3 dimensional ball & stick model of two layered sheets of kaolinite (Hess, 1992). Individual sheets are held together through hydrogen bonding interactions between the silicate and aluminol layers in adjacent sheets.
Kaolinite (Al2Si2O5(OH)4) is one such 1:1 layered phyllosilicate. Its naming originates from a
deposit close to Gaoling, a village in the Jiangxi province, China, where it was mined for many
centuries (Grim , 1968). It is characterised by continuous sheets of octahedrally coordinated
aluminols linked to sheets of tetrahedrally coordinated silicates [see Figure 5]. These sheets
form pseudo-hexagonal plate shaped particles that can aggregate together to form long,
vermicular motif structures. Like other kaolin minerals, their genesis occurs primarily through
the weathering of minerals such as feldspars and muscovite (Bailey, 1988) that contain the
necessary alumina and silica building blocks. This weathering mechanism is summarized as
follows:

19
→
Kaolinite is notable for its stability and consistent chemical composition. Clay minerals of the
largely available smectite family typically have varying degrees of isomorphic substitution of the
coordinated metal cations in the octahedral and tetrahedral sheets creating a charge imbalance
in the layers. This imbalance is corrected by incorporation of hydrated ions in the interlayer of
the sheets. This sort of substitution is largely absent in kaolin minerals such as kaolinite, giving
an overall neutral charge balance in the layers. This absence of substituted metal cations,
counter balance ions, and interlayer water makes the clay resilient to ion exchange processes.
This lack of interlayer water also prevents swelling, making the incorporation of guest
molecules much more difficult than in the case of the smectites. Despite its relative inertness
among clays, kaolinite has properties that confer it a degree of chemical and physical activity.
The 1:1 layer assemblies give rise to 2 distinct surfaces: one is resulting from silicate and
another from aluminol sheets. The aluminol surface contains an abundance of reactive hydroxyl
groups for guest species to anchor themselves, through favourable dipolar and hydrogen
bonding interactions with polar functional groups, like those found in asphaltenic fractions of
oil sand feedstocks.

20
Figure 6: [shown left] Elemental composition of a typical asphaltene extract (Payzant, 1991). [shown right] Flowchart detailing the fractionation of a petroleum feedstock (Speight 2004). Asphaltenes are the components of a feedstock insoluble in saturated n-hydrocarbon solvents. They contain an appreciable quantity of aromatic carbons and polar heteroatoms.
1.1.4: Asphaltenes
Asphaltenes are the component of a petroleum feedstock that is insoluble in saturated n-
hydrocarbons and soluble in toluene (Mullins, 2007). They are a common component of heavy
oil feedstocks, like those found in oil sands and classified according to the carbon chain length
of the n-hydrocarbon solvent used to isolate them from feedstocks. For example, the
asphaltenic material isolated from a feedstock using n-heptane, would be classified as C-7
asphaltenes. Their basic structure appears to be primarily composed of high molecular weight
polyaromatic hydrocarbons interlinked together with a wide variety of functionalities. These
functionalities contain an appreciable quantity of polar heteroatoms, such as nitrogen and
sulfur (Peng, 1997; Siskin, 2006) (see Figure 7 for a visual representation), which are expected
to interact very strongly with the aluminol layers in kaolinite. This makes them a strong culprit
behind the forming of the stable organoclays encountered.

21
1.1.5: Modelling organoclay adsorption
Figure 7: Overview of organoclay fine model proposed. Indole, present as functional groups in asphaltenes; and kaolinite, one of the most important clays in the Athabasca basin, were chosen as a model for the organoclays found in oil sands. Asphaltene model on left adapted with permission from (Gray, 2011)
To better understand these aforementioned toluene insoluble fines encountered in oil sand
mining, simplified model compounds using indole and kaolinite were prepared and
characterized by physiochemical techniques commonly used in the material sciences. These
models are based on the hypothesis that the formation and cohesion of these organoclays is
mediated by strong interactions between the aluminol groups in kaolinitic clays present and
polar functional groups encountered in asphaltenic fractions of oil sand feedstocks. The
nitrogen functional groups in asphaltenes are known to contain pyridinic and pyrollitic (Siskin,
2006) cycles, forming the base of more complex functionalities such as indoles, acridines, and
porphyrins (Gray, 2011). For this study indole, an aromatic heterocyle containing both a

22
benzene and pyridine ring, was chosen as a model structure.
The preparation and subsequent treatment of these organoclay models was done in organic
solvents. The reason for this is two-fold: to study the behaviour of clays in non-aqueous media,
a poorly understood and studied area in the clay sciences and to further the development of
non-aqueous solvent extraction methods. Improvement of the extraction yields of
predominantly aqueous based extraction methods in place today would improve efficiency of
the extraction process and make the process more environmentally friendly by reducing tailing
wastes produced. Heptane and toluene were chosen as solvent systems due to their
widespread use in the separation of crude oil components, and their standard use in isolating
and classifying asphaltenic materials.

1.2: Techniques and characterization
1.2.1: Adsorption
Adsorption is a phenomenon involving the adhesion of atoms, molecules or ions, referred to as
adsorbates, on a surface, referred to as an adsorbent. These adsorbate:adsorbent interactions
are mediated by surface energy. Weak forces (e.g. van der Waals) will lead to weak
physisorption interactions while strong forces (e.g. covalent) lead to strong chemisorption
interactions.
Adsorption is typically described in the form of isotherms, graphical representations of
adsorbate uptake as a function of adsorbate pressure or concentration at a given temperature.
These plots are based on the principle that adsorption/desorption is an equilibrium process,
where increasing the pressure or concentration of adsorbate would drive the equilibrium
towards the adsorption product leading to greater adsorbate loading. The shape of the
isotherm depends on a number of factors, chiefly the porosity of the adsorbent and the
strength of adsorbent-adsorbate interactions.

24
Figure 8: Graphical representation of Freundlich, Langmuir and BET isotherms.
Historically, the first isotherm described was the Freundlich model. This model states that as
adsorbate loading increases, the concentration of adsorbate required to increase the loading
further increases even more, leading a gradual tapering off of adsorbate loading. This is
represented by the following equation:
where q is the mass of adsorbate loaded on an adsorbent material, C is the adsorbate
concentration and Kf and n are constants. While useful for modelling low adsorbate
concentration adsorption, the model fails at concentrations where the adsorbate begins to
saturate the surface of the adsorbent.

25
The Langmuir model mitigates this by taking into account surface sites and saturation. This
model makes the following assumptions: the adsorbent surface is uniform and adsorption sites
are equivalent; adsorbent-adsorbent interactions do not occur; adsorption occurs through a
single mechanism; and maximum loading occurs at monolayer, adsorbent surface coverage.
This is represented by the following equation:
where qm is the quantity of adsorbate required to form a monolayer on the adsorbent and Kl is
a constant.
The obvious drawback to this model is how it ignores adsorbate-adsorbate interactions. In
systems where these interactions are significant, loading past monolayer coverage could occur
through adsorbate-adsorbate multilayers. In such systems, the Langmuir model is insufficient to
describe the full range of adsorption.
The most famous model for describing multilayer adsorption is the Brunauer, Emmett, Teller(
i.e. BET) model. This model expands upon the Langmuir model by considering that adsorbate-
adsorbate multilayers form past monolayer coverage, and that a layer does not need to be

26
completed before a new, upper layer can form (Brunauer , 1938). This is represented in the
following equation:
( ⁄ )
where Cs is the adsorbate concentration at which all layers are saturated, and Kb is a constant.
This model can adequately predict adsorption behaviour of most systems, even some more
unusual ones as shown in Figure 9.
Figure 9: IUPAC’s modern classification of the possible classes of adsorption isotherms (Carmody, 2007). Types I and II are the most commonly encountered isotherms. Type I describes adsorption of a single monolayer on the external surface, characteristic of microporous sorbents with small surface areas. Type II describes unrestricted monolayer-multilayer adsorption, characteristic of macroporous or non-porous adsorbents with strong adsorbate-adsorbent interactions.

27
1.2.2: 13
C CPMAS NMR
While less common and inherently less sensitive than their solution based counterparts, solid
state nuclear magnetic resonance is still routinely employed to that end for studying solid
samples. This technique uses the intrinsic property of a given nucleus, known as its spin angular
momentum to identify a given compound. Nuclei containing a non-zero spin also possess a non-
zero angular momentum magnetization vector and if an orthogonal electromagnetic force is
applied at the resonance frequency of the nuclei, they will precess and slowly relax back to
their rest state emitting a characteristic radio frequency. Measuring this as a time domain signal
yields a free induction decay spectrum contains the sum total of all the precessing nuclei in a
given sample, which when applying Fourier mathematics yields a frequency domain spectrum,
effectively sorting their different nuclei in a given sample based on their relaxation time.
Unlike in solution based NMR, where magnetic moments can be homogenized, rigid, solid
samples have considerable anisotropic effects, such as dipolar coupling and chemical shift
anisotropy that significantly reduce spectral resolution. These effects can be mostly averaged
out and homogenized by rapidly spinning the samples in the applied magnetic field. Spinning
the samples at the “magic” angle (54.74°), improves upon this further by eliminating geometric
terms in spin interactions that give rise to chemical shift anisotropy. This technique known as
magic angle spinning (MAS) is routinely applied for the study of nuclei in the solid state, and
offers resolution approaching that of solution based samples.

28
Figure 10: Graphical representation of a cross polarization experiment [source: Glenn Facey, University of Ottawa]. Magnetization is transferred from one nuclei to another by tuning the rf field strength (BH/BX) to be equal to the ratio of the gyromagnetic ratio (γX/γH)of the two nuclei.
Further refinements can be made to improve the sensitivity of less abundant or less
magnetically sensitive (i.e. containing low gyromagnetic ratios) nuclei using a technique known
as cross polarization (CP). This technique transfers the magnetization of an abundant and/or
magnetically sensitive nucleus such as 1H to a less abundant or sensitive one such as 13C by
tuning the magnetic field such that transfer of magnetization can occur (Figure 10). This results
in a dramatic improvement to the sensitivity of any nuclei coupled.

29
1.2.3: Powder X-ray diffraction
Figure 11: Visual representation of Bragg diffraction in a crystalline structure [source: David Mogk, Montana State University]. Diffraction of incident X-rays from the crystal planes present results in a characteristic interference pattern, which varies according to the d-spacing between the planes.
Powder X-ray diffraction (XRD) is one of the most widely used techniques for characterizing
solid materials. This technique bombards a powdered sample with homogenous, well
collimated X-rays and extracts structural information from the resulting interference pattern of
the diffracted rays. This interference pattern is a result of Bragg reflection of the incident X-rays
on the crystal lattice planes, the pattern depending on the spacing between parallel crystal
planes, commonly referred to as the d-spacing (Figure 11). This can be described in the Bragg
equation as follows:

30
where n is an integer, λ the wavelength of the incident x-ray, θ its angle relative to a given
plane and d is the d-spacing. Given that the interference is angle dependent, measuring the
diffraction pattern at all possible diffraction angles will yield the sum total of all crystal lattice
planes in the sample, which can then be used to solve the crystal structure of the material.
In clay science, the most interesting of these crystal planes is the plane perpendicular to
individual layers in the clay structure. Chemical modification of clay minerals will often result in
changes to the chemical and structural makeup of the interlayer. This change can result in an
expansion or contraction of the interlayer, which will be reflected in a change in the vertical
crystal plane of the clay. In a diffraction pattern, this will be observed as a shift in the [00l]
crystal planes in the clay, making this a useful tool for monitoring and characterizing changes to
interlayer structure of the clay
1.2.4: Thermal gravimetric analysis
Thermal gravimetric analysis (TGA) is a characterization technique that studies the changes in
weight of a sample under controlled temperature conditions. As the temperature of a given
system changes, it will undergo various thermodynamic transitions to different phases at
31
discreet temperatures. When weighed on a balance, a dense phase (i.e. liquid, solid) that is
vaporized will result in a change in sample weight as the transition progresses. When the
makeup of a given sample is more complex, individual vapour transitions can be monitored for
components of the sample and be used to qualitatively and quantitatively identify them based
on their transition temperatures and contribution to the sample total weight [example shown
in Figure 12]. Transitions corresponding to chemical changes such as oxidation can also be
visualized if a non-inert atmosphere is used.
Figure 12: Weight loss thermogram for a sample of calcium oxalate monohydrate under an inert atmosphere. The 3 weight loss events observed are attributed to volatilization of the sample, leading to loss of water, carbon monoxide and carbon dioxide respectively (Slough, TA306).
In clay minerals, characteristic transitions are due to the release of volatiles incorporated in
their structure. Characteristic weight losses are observed from water being released from loss
of interlayer water and/or dehydroxylation events. Modification of the clay’s structure will

32
result in a shift in transitions, and incorporation of new matter onto the clay will result in new
transitions being observed.
1.2.5: Scanning electron microscopy (SEM)
Figure 13: Visual representation of the possible outcomes in electron based characterization techniques [source: Darrell Henry, Louisiana State University].
Electron microscopy is an imaging technique that uses electrons beams to examine samples on
a very small scale. Owing to their much shorter wavelengths electron sources offer much better
resolution and magnification than light based sources.

33
Scanning electron microscopy (SEM) images a sample by raster scanning its surface with a
focused electron beam. The electrons will interact with the sample, yielding a variety of
different products that can be subsequently detected; typically using secondary electrons [see
Figure 13]. This yields an image of the sample that contains breadth and depth information,
giving a good visualization of its 3 dimensional structure. This makes the technique useful for
visualizing structural and overall changes to the visual composition of a material; useful for
large supramolecular assemblies and nanocomposite materials (Letaief , 2009)
1.2.6: Elemental analysis (CHNS EA)
Elemental analysis is a routine analytical technique used to quantify the elemental makeup of a
sample. One particular variant used for trace analysis of organic matter in chiefly inorganic
geological samples, %CHNS, quantifies the organic matter in a sample by measuring common
elements used as building blocks in organic compounds, carbon, hydrogen, nitrogen and sulfur.
This is achieved through the complete combustion of the sample, releasing the organic matter
as gaseous forms of the individual elements of interest (N: N2, C: CO2, H: H2O, S: SO2), followed
by separation of the gases through a series of gas traps and chromatography columns to be
detected.

34
1.3: Materials and methods for preparing adsorption products
1.3.1: Preparation of purified kaolinite adsorbent
Well-crystallized kaolinite (KGa-1b) was obtained from the Source Clay Repository of the Clay
Minerals Society, Purdue University, West Lafayette, IN, USA. The <2μm fraction was isolated
from the bulk material by sedimentation. Indole and heptane (99%, HPLC grade), were obtained
from Sigma Aldrich. Toluene (99.9%) was obtained from Fischer Scientific.
1.3.2: Preparation of organoclay aggregates
A known mass of the chosen solid organic adsorbate was dissolved in 100 mL of solvent, either
heptane (KHT series) or toluene (KTI series), and the resulting solution was stirred magnetically
until dissolution was complete. 1g of kaolinite was added to the solution and the resulting
mixture was dispersed by magnetic stirring for 48hrs at room temperature (23°C). The solid
material was removed from solution by vacuum filtration and left to dry under the vacuum ½
hour before recovering.

35
1.3.3: Characterization of organoclays
X-ray diffraction patterns (XRD) were obtained using a Philips PW 3710 instrument equipped
with Ni-filter and Cu-Kα radiation (λ = 0.15418 nm) operating at 45kV and 40mA.
Thermal gravimetric (TG) weight loss curves were obtained with an SDT 2960 simultaneous
DSC-TGA using a simple, linear temperature ramp program (10°C min-1) under a nitrogen
atmosphere (100ml min-1).
13C solid state nuclear magnetic resonance spectra (NMR) were obtained on a Bruker ADVANCE
200 spectrometer using a 7 mm O.D. zirconia rotor spun at the magic angle (MAS) at 4500Hz. A
1H → 13C cross polarization experiment (CP) was used to enhance the sensitivity of the 13C
nucleus.
Organic content was quantified by elemental analysis, analyzing for the carbon, nitrogen and
sulfur content in the sample (%CNS), using a VarioEL III. Samples were loaded into tin capsules
and flash combusted to 1800°C and the resulting gases separated using a series of adsorption
traps and analyzed.

36
Scanning electron microscope (SEM) images were taken on a JEOL JSM-7500F FESEM in low
secondary electron imaging (LEI) mode with a 2kV acceleration voltage and a 10mm working
distance.

1.4: Results and Discussion of adsorption products
1.4.1: Adsorbate/adsorbent blanks
SEM microscope images were taken to estimate the granulometry of the clay. These images, as
illustrated in Figure 14, show that the purified clay particles are in the sub-micron range, with
particles sizes varying from 100-900nm.
Thermogravimetric analysis was performed on the solid organic adsorbate and adsorbent as
experimental blanks. Figure 15 shows a single weight loss event for the clay corresponding to
14.10% (w/w) centered at 512°C. This is attributed to the dehydroxylation of kaolinite to form
metakaolinite (Kakali , 2001):
→ (
⁄ ) O
a classic decomposition event, where a compound irreversibly breaks down into several smaller
components which are subsequently driven off. This results in a partial loss of mass that is
represented as a sigmoid, s-shaped event on a weight loss curve.

38
Figure 16 shows a single sharp weight loss event for the organic adsorbate of 100% (w/w)
ending at 189.51°C. This is typical of a vaporization event, where the entirety of a compound is
driven off in a phase change. On a weight loss curve, this is represented as an exponential
decay event that rapidly cuts off when the entirety of the mass has been driven off. The first
derivative of the weight loss curve also shows fluctuation of the sample’s mass around 60°C,
attributed to a melt phase change.
Figure 14: SEM microscope image of the purified kaolinite adsorbent.

39
Figure 15: TGA weight loss graphs of the purified kaolinite.
Figure 16: TGA weight loss graphs of neat indole.

40
Figure 17: 13C cross-polarization magic angle spinning (CPMAS) nuclear magnetic resonance spectrum of neat indole.
1.4.2: Identifying loaded organics
Figure 18: 13C CPMAS NMR spectra of a kaolinite:indole systems prepared in heptane (KHI14) and toluene (KTI06) solutions containing indole. The intensity of the indole resonances, attributed to the peaks in the 80-150ppm region, was visible in the spectra, indicating that a fraction of the indole in solution was loaded on the clay.

41
To verify that the desired organic adsorbate was loaded on the clay, 13C CP-MAS NMR
measurements were performed on the prepared organoclays. Figure 18 indicates that a
fraction of the indole in solution was loaded on the clay mineral. The resonances between 100
and 150 ppm were attributed to indole, matching the resonances observed for neat crystalline
indole [Figure 17] indicating that indole was loaded on the clay mineral. In addition to indole,
solvent adsorption was also expected to be quite significant and some resonances that could be
attributed to the solvents were observed. Aromatic resonances, attributed to the C6 ring
carbons in toluene, also occur in the same region and indole resonances, so toluene based
organoclays would expect some resonances in that region. However the same resonances were
observed in heptane based organoclays, and the 100 ppm resonance attributed to one of the
C5 indole ring carbons occurred at much higher field than any expected toluene resonance.
Heptane based organoclays also showed significant high field resonances around 30 ppm;
attributed to the aliphatic carbons of the heptane solvent. This could be indicative of solvent
adsorption. However, these resonances could also be attributed to rotational bands of the
lower field indole resonances. Rotational band artifacts occur based on the speed the sample
was spun at; in these experiments: 4500Hz. Figure 19 illustrates that rotational artifacts would
be expected around 30ppm, which matches the resonances observed. However, these artifacts
also typically occur lower field too, and there were not always resonances in this region that
matched the expected profile and intensities. Weight loss curves of solvent blanks [shown later

42
in Figure 28 and Figure 29] was further evidence that some degree of solvent sorption is
occurring.
Figure 19: 13C CPMAS NMR spectra of a kaolinite:indole systems prepared in heptane. The high field resonances observed can be partially attributed to rotational bands of the higher field indole resonances.

43
1.4.3: Identifying adsorption positions
Adsorption is expected to occur primarily on the external surface of the clay. While a variety of
guest species have been successfully intercalated and grafted in kaolinite (Letaief , 2008;
Gardolinski, 2005; Komori , 2000; Tunney, 1996 [Chem. Mater. 8]), it is an inherently difficult
process owing to the strong cohesion between individual clay layers. Known pathways tend to
rely on a limited number of starting candidates to “tune” the interlayer spacing and gradually
allow for insertion of larger guest species. Therefore it is also of great interest to investigate
possibility for using new species to intercalate in neat kaolinite.
Figure 20: X-ray diffraction of kaolinite:indole systems prepared by dispersing kaolinite for 48hr in a solution of heptane (KHI15) and toluene (KTI05) containing indole. The reflections observed suggest indole wasn’t intercalated, with no noticeable shift in the reflections of neat kaolinite. A new phase appearing around 18 o2θ can be attributed to organic matter adsorbed on the surface.

44
The XRD patterns of kaolinite and prepared organoclays confirmed initial expectations.
Reflections, illustrated in Figure 20, were found to be almost perfectly superimposable. Using
the 2θ value of the intense [001] reflection, the interlayer spacing was calculated from the
Bragg equation using values of: λ=1.54 and n=1 to be 7.12Å, which agrees with known literature
values of 7.10 Å of neat kaolinite (Bailey, 1988). There was also no observable shift in any of the
higher order [00l] reflections. Since intercalation of a guest species would result in an expansion
of the spacing between individual clay layers, [00l] reflections, would be shifted by an amount
equal to this expansion. The absence of any interlayer expansion indicates that the loaded
organic material is not present in the clay interlayer, so loading must be occurring on the
external surfaces of the clay. The only notable change in the diffraction pattern was an
additional phase that appeared around 18o2θ; this was attributed to this externally loaded
organic material.

1.4.4: Aggregation phenomenon mediated by organic adsorbates
Figure 21: SEM microscope images of purified kaolinite dispersed in water. Aggregation motifs obtained was similar to those observed in real world samples.
Figure 22: SEM microscope images of purified kaolinite dispersed in heptane. Dispersion in non-polar solvents hinders aggregation.

46
SEM images of the prepared organoclays in Figure 23 and Figure 24 show the kaolinite platelets
as micron sized vermicular aggregates. Aggregation appears to occur mostly through face:face
interactions; edge:edge aggregation was not observed and face:edge interactions with much
less frequency and only on a nanoscale (<100nm).
This phenomenon is believed to be mediated by favorable interactions between polar species
adsorbed material on the surface of the clay platelets. Scans of solvent blank samples using
polar solvent like water [see Figure 21] showed aggregation while blanks using non-polar
solvent like heptane in Figure 22 showed an absence of aggregation.
Figure 23: Scanning electron microscope images of indole:kaolinite systems prepared in toluene. Kaolinite platelets aggregate together to form vermicular shaped stacks.

47
Figure 24: Scanning electron microscope images of indole:kaolinite systems prepared in heptane. Kaolinite platelets aggregation is even more striking than with those prepared in toluene.
1.4.5: Theoretical adsorption capacity based on monolayer surface coverage
The surface area occupied by a single molecule of indole was estimated by constructing and
optimizing its structure using ACD/Chemsketch v.11.01. The dimensions used to calculate the
area, shown in Figure 25, were obtained using the software’s bond length tool to give a total
area of 3.291*10-19 m2/molecule. BET surface area of kaolinite was measured using nitrogen
gas, giving a surface area of 15m2/g. Thus 8.866mg of indole would be required to form, a
simple, isotropic monolayer on 1 gram of kaolinite.

48
Figure 25: Dimensions of a single molecule of indole. The structure and its dimensions were found using the ACD/Chemsketch v.11.01. Dimensions were calculated using the bond length tool. An average of the two diagonal distances shown (6.664 Å, 6.638 Å) along with simple trigonometric identities was used for calculating the width (6.533 Å).
1.4.6: Quantifying adsorption
To quantitatively determine organic loading in these organoclays, %CNS elemental analysis
studies were performed. Organic loading was calculated based on the sum of the elemental
composition of each detected element. From this, adsorption isotherms could be constructed
by plotting the organic content detected as a function of the organic content dispersed in
solution.

49
Figure 26 shows the resulting isotherms of indole:kaolinite organoclays when prepared in
toluene and Figure 27 in heptane. The toluene system appears to follow the classical Langmuir
model of monolayer adsorption: loading occurs exponentially at first, quickly tapers off as
adsorption sites are filled, and loading stops when a monolayer is formed. The point where
loading tapers off agrees well with the calculated monolayer coverage calculated in the
previous section.
The heptane system showed a similar profile to the toluene system at low solution
concentrations, but at higher concentrations, the proposed Langmuir breaks down as loading
started increasing exponentially past monolayer coverage. This would suggest that a multilayer
adsorption model should be used to describe the system, where at loading increases past
monolayer coverage, multiple adsorbate:adsorbate stacks form. Unfortunately, indole is not
very soluble in heptane and at the point where loading exceeds monolayer coverage, saturation
of the solvent occurs. Thus, this exponential increase in loading could also be attributed to
crystalline indole being recovered with the organoclay.

50
Figure 26: Adsorption isotherms of indole:kaolinite systems prepared in toluene at 23°C. At the concentration range chosen, adsorption follows a simple Langmuir model, with loading rate decreasing as the coverage corresponding to a monolayer is approached.
Figure 27: Adsorption isotherms of indole:kaolinite systems prepared in heptane at 23°C. Adsorption followed the Langmuir model at low concentrations but increased exponentially at higher concentations suggesting the formation of multilayers of adsorbate.

51

1.4.7: Evidence of multilayer adsorption phenomena
Figure 28: TGA weight loss of solvent blank material prepared in heptane. The clay dehydroxylation weight loss event after 500°C is noticeably shifted towards higher temperature in the heptane blank.
Figure 29 : TGA weight loss of solvent blank material prepared in toluene. Weight loss events were similar to those obtained in the heptane blank material.

53
TG weight loss curves in Figure 30 and Figure 31 of the prepared organoclay aggregates showed
two weight loss events one between 100-200°C and the other between 300-700°C. The
characteristic weight loss event centered at 510°C was attributed to the dehydroxylation of the
clay; its intensity and profile matching that of the pristine clay. This loss occurs at higher
temperature for the prepared organoclays and heptane blank, suggesting the solvent and
adsorbate have some effect on the structure of the clay. The total weight loss for this event was
also ~1% w/w higher for materials prepared in heptane. This was attributed to solvent loading,
agreeing with previously shown NMR data.
Figure 30: Thermal gravimetric weight loss curve of indole:kaolinite system prepared in heptane. Loss of the loaded organic material occurs in 2 overlapping steps from 100°C to 200°C, suggesting a multilayer stacking of the loaded organic material.

54
Figure 31: Thermal gravimetric weight loss curve of an indole:kaolinite systems prepared in toluene. Weight loss events were similar to those obtained using heptane.
The losses centered on 130°C were attributed to the loaded organic material. According to
Figure 28 and Figure 29, about 0.5% of this total weight was is due to solvent loading. The
shape and position of the weight loss events of the organoclay aggregates is characteristic of a
decomposition event rather than a vaporization like the one shown for pure indole in [Figure
16], indicating that indole was only present as an adsorbate and none of it in its crystalline form
was recovered. The derivative of the weight loss curve showed that this event was actually a
superposition of two distinct events, one centered around 110°C and the other around
165°C.This weight loss profile agrees with the proposed multilayer adsorption model, the
higher temperature weight loss event being due to the loss of the layer adsorbed closest to the

55
surface of the clay and the lower temperature event was attributed to the loss of the material
adsorbed through weaker adsorbate:adsorbate interactions.
To investigate this multilayer adsorption phenomenon in greater detail, an adsorption isotherm
was constructed using organoclays prepared in toluene at higher solution concentrations.
Toluene is a much better solvent system for indole than heptane; it is readily soluble at
concentrations far beyond where multilayer coverage was occurring in the studied heptane
systems. Figure 32 shows the isotherm covering a much wider concentration range than the
one shown previously in Figure 26, as determined by %CNS elemental analysis. Points were
fitted to the BET equation shown previously and the constants/parameters for this system were
calculated by a non-linear regression analysis. This model was found to be an excellent fit with
the obtained data, with an R-squared value of 0.982 for the chosen parameters.
From this, the following adsorption parameters were calculated: <a>, which corresponds to the
quantity of organic material required to form a monolayer (shown as qm in the original
equation); <b>, a constant related to adsorption/desorption equilibrium (shown as Kb in the
original equation); and <c>, corresponding to the concentration at which the system is
saturated (shown as Cs in the original equation). The calculated qm of 9.28mg agrees nicely with
the previously estimated amount required to form monolayer coverage of 8.87mg reinforcing
the validity of the proposed model.

56
Figure 32: Adsorption isotherm for indole:kaolinite systems prepared in toluene at 23°C. Adsorption profile is fit to the BET equation using the parameters shown above. Curve fitting was done by a non-linear regression of data points through the Sigma Plot 12 graphing software.

1.5: Desorption studies of organoclay aggregates
Since one of the key objectives of this work was to study non aqueous extraction of these
organoclays, the next step was to study the effects of dispersing the prepared organoclay
models in various solvents. Heptane and toluene were chosen as solvents due to their
widespread use in the industry when isolating and classifying asphaltenic materials and
isopropanol due to the affinity simple alcohols are known to have with kaolinite (Tunney , 1996
[Chem Mater. 6]).The model organoclay system will also be compared to a more complex
asphaltene:kaolinite system that is closer to real world samples to evaluate the effectiveness of
this method.
1.6: Preparation of desorption products
100mg of organoclay, prepared as described in the previous section, was dispersed in 100mL of
organic solvent (heptane, toluene or isopropanol) for 48hr. The resulting solution was vacuum
filtered to remove the solid matter and left to dry under the vacuum for ½ hour before
recovering.

58
Asphaltene:kaolinite organoclays were prepared with C-5 asphaltenes using the same
procedure described in the preceding section. The recovered material was then dispersed and
recovered as described above.

1.7: Results and discussion of desorption products
1.7.1: Identifying organics remaining
Figure 33: 13C cross-polarization magic angle spinning (CPMAS) nuclear magnetic resonance spectrum of the C-5 asphaltenes used. 0-50 ppm resonances are attributed to aliphatic functionalities and 100+ppm resonances to aromatic functionalities.
Figure 34: (left) 13C CPMAS NMR spectra of a kaolinite:indole systems prepared in heptane (KHI14) before and after dispersing in toluene. In both systems, the loaded organics were not completely removed by dispersion in the solvent.
60
Figure 35: spectra of C-5 asphaltene:kaolinite systems prepared in heptane before and after dispersing in toluene. Like the model indole:kaolinite systems, appreciable organics remained after dispersion.
To investigate the effects of dispersing the sample in the chosen organic solvent, 13C NMR was
performed on the recovered samples. Figure 34 shows indole resonances remaining after
dispersion in toluene, indicating that the organic matter remaining is indeed the original indole
adsorbate and not simply solvent that was loaded after displacing of the original indole
adsorbate. This same phenomena was also observed in the asphaltene:kaolinite systems
prepared, with both the aliphatic and aromatic resonances shown in Figure 33 remaining after
dispersion in toluene [Figure 35].

1.7.2: Quantifying desorption
Figure 36: Desorption studies of an indole:kaolinite system prepared in heptane using various organic solvents. Organic loading was quantified by %CNS elemental analysis of the recovered organoclay. The most effective solvents removed close to 30-50% of the loaded organic. In the indole based organoclays, the amount remaining was approximately a monolayer equivalent (line shown in red).

62
Figure 37: Desorption studies of an asphaltene:kaolinite system prepared in heptane using various organic solvents . Less organic matter was removed in the asphaltene:kaolinite systems, but showed a similar trend to the indole system.
%CNS studies were performed on indole:kaolinite (KHI-16) and asphaltene:kaolinite (KHASP-09)
samples prepared at concentrations close to the adsorbate’s saturation limit in solution before
and after dispersion in various organic solvents. In the indole system, maximum adsorbate
loading was found to be 20mg/g of kaolinite. Given that this was prepared close to the indole
saturation limit in heptane, it is effectively the maximum loading possible in this solvent system.
Toluene and isopropanol were found to be the most effective desorption solvents, both
removing close to 50% of the loaded organic material. Strikingly, the amount remaining
corresponds to the theoretical monolayer coverage of 8.87mg. This further reinforces the

63
multilayer adsorption model proposed, where indole:indole multilayer stacks being easily
removed by a strong solvent, while the more strongly bound indole:kaolinite monolayer being
unaffected by the solvent. This also agrees well with the “toluene insoluble” fines encountered
in real world samples (Bensebaa, 2000). Of great interest is the effectiveness of alcohol based
solvents, a less hazardous and more environmentally friendly alternative to toluene.
The asphaltene:kaolinite systems studied in Figure 37, shown in yielded similar results. Organic
loading quantified by %CNS showed loading higher than for the indole:kaolinite systems studied
(60mg/g vs. 20mg/g). This would seem to indicate that asphaltenes have an even greater
affinity for adsorption on the clay surface than indole. Nevertheless, the system also showed
resistance to being removed with organic solvents with 13C NMR showing the asphaltene
resonances remaining after dispersing and the %CNS results only ~30% of the loaded organic
matter removed with the most effective solvents. This is an agreement with the indole model
system, which indicating its suitabibity for modelling the insolubility of the oil sand organoclays
and showing a possible link between heteroatom containing functional groups and the
formation of stable organoclays.
These results, while reinforcing the validity of the chosen model systems, also show that
solvents alone will not lead to a great improvement in extraction efficiency in systems
containing large quantities of fines. It is recommended that future work look into competitive
adsorption to improve the desorption process.

64
The idea behind using competitive desorption, is to introduce a compound that has a great
affinity for adsorption on the clay into the dispersion with the organoclay. If the clay:adsorbate
interactions of the competitive agent is sufficiently strong, the competing adsorption process
will dominate and the original adsorbate will be displaced into solution and “blocked” from re-
adsorbing on the clay surface. Given the promising results using alcohol based solvents in the
desorption studies and kaolinite’s known affinity for compounds containing hydroxyl
functionalities (Tunney , 1996 [Chem Mater. 6]), it is proposed that future work using
competitive agents focus on compounds containing a high density of such groups, such as
polysaccharides.

1.8: Conclusion
Solid state NMR and thermal analysis confirmed that a fraction of the indole in solution was
loaded on the clay. The multi-step weight loss suggests a multi-layered adsorption mechanism.
XRD scans showed no shifts in the d-spacing of kaolinite in the material, confirming that indole
was incorporated entirely via adsorption on the external surfaces. Electron microscopy shows
regular stacking of kaolinite platelets, evidence of an aggregation of kaolinite mediated by
adsorbed indole. The amount loaded was quantified by %CNS elemental analysis: a maximum
loading of around 20mg of organic material loaded/g of clay in heptane based systems. Organic
matter was resistant to removal using organic solvents, with a monolayer equivalent of organic
material remaining with the most efficient solvents. An isotherm of toluene based materials
reinforces this multilayer adsorption model.
Additional work is proposed to further refine the desorption studies of the organoclays
systems, in particular to investigate desorption using competitive adsorbates, particularly those
containing a high density of hydroxyl functionalities.

Chapter 2: Desorption of oil sand based organoclay
model systems in non-aqueous media: competitive
adsorption strategy
2.1: Introduction
2.1.1: Cellulose: abundant and versatile biopolymer
Figure 38: (shown left) Structure of cellulose and (shown right) hydrogen bonding pattern for 2 cellulose allomorphs of native cellulose (Festucci-Buselli , 2007). The hydrogen bonding pattern between the beta glucan chains gives rise to the different crystal structures and allomorphs in cellulose.

67
Cellulose is a natural polymer, present in most plant based matter. It was first described in 1838
by French chemist Anselme Payen as a fibrous solid extracted from plant tissues after
treatment with various acids and ammonia (Payen , 1838). It’s base structure is that of
repeating glucose units linked β-1,4 [Figure 38]. The length of these chains varies depending on
the feedstock, ranging from as low as 300 in wood and as high as 10000 in plant fibers (Klemm,
2005). Individual chains are linked together through an extensive network of hydrogen bonding,
the pattern of this bonding giving rise to different possible allomorphs (Jarvis, 2003;
Zugenmaier, 2001).
Figure 39: Cross section of a fibrillar stack of cellulose chains. The hydrogen bonding between individual chains gives rise to a fibril shaped macrostructure that contains region of high and low crystallinity. Adapted from (Moon, 2011).
In plants, cellulose is synthesized enzymatically from the cellulose synthase enzyme (CesA). The
enzyme, forming rosette shaped, hexagonal arrays in the plasma membrane of the plant
[Figure 40], directs cellulose synthesis and growth into fibrillar strands, stacked in a crisscross
motif. Each strand contains regions of high and low crystallinity, a consequence of the hydrogen
bonding pattern in the structure [Figure 39]. These strands coalesce together with various

68
other polysaccharides, hemicelluloses, pectins, to form the cellular wall of plants. A visual
representation of this is shown in Figure 41.
Figure 40: Structural arrangement of cellulose synthases found in cellulose microfibrils (Ding, 2006).

69
Figure 41: Proposed cross sectional view of an Arabidopsis leaf cell (Somerville , 2004). Cellulose is synthesized from CesA enzymes to form fibrilar cellulose strands. These fibrils stack in a crisscrossed motif to form the backbone of the plant wall.
At ~1.5 trillion tonnes produced annually, cellulose is one of the most important biopolymers in
industrial processes (Kaplan, 1998). Being such a cheap and abundant raw material, it’s been
used extensively in industrial processes for over 100 years. Its most common use is in the pulp
and paper industry, being the base material for papers, cardboards and card stocks. It also is
the base material for many natural textiles such as linen and flax and is used in the production
of synthetics fibers such as rayon. Other common uses are as an adsorbing material, being used
commercially as sponges, filters, and TLC plates, an emulsifier and food additive, as insulation in

70
construction, and as a potential energy crop (Himmel, 2007; Dawson, 2007). Its abundance has
also made it a promising candidate for environmentally friendly nano- and biocomposites.
Cellulose has many properties that make it an ideal candidate as a competitive adsorbate for
the organoclay systems studied. It is a cheap and abundant raw material making it ideal for use
on an industrial scale, it is environmentally friendly, facilitating disposal of the used material,
feedstocks could come from forestry and agricultural waste, contributing to waste reduction
from these other industrial processes, and it contains an abundance of hydroxyl groups that
would be expected to interact very strongly with the aluminol and silicate surfaces on kaolinite.
Therefore, when dispersed with an organoclay in a solvent that already has some effectiveness
at removing organics from the clay, we would expect even more organics to be removed, as a
result of favourable cellulose clay interactions disaggregating the organoclay and displacing the
organic matter into solution. This theoretical process is illustrated in Figure 42.

71
Figure 42: Visual representation of the hypothesized pathway for competitive adsorption/desorption of organoclays using cellulose. The organoclay, shown as stacked hexagonal platelet coated with organics, and cellulose, shown as a single fiber, when dispersed together in an organic solvent will lead to deaggregation of the platelets and displacement of the organic matter into solution.
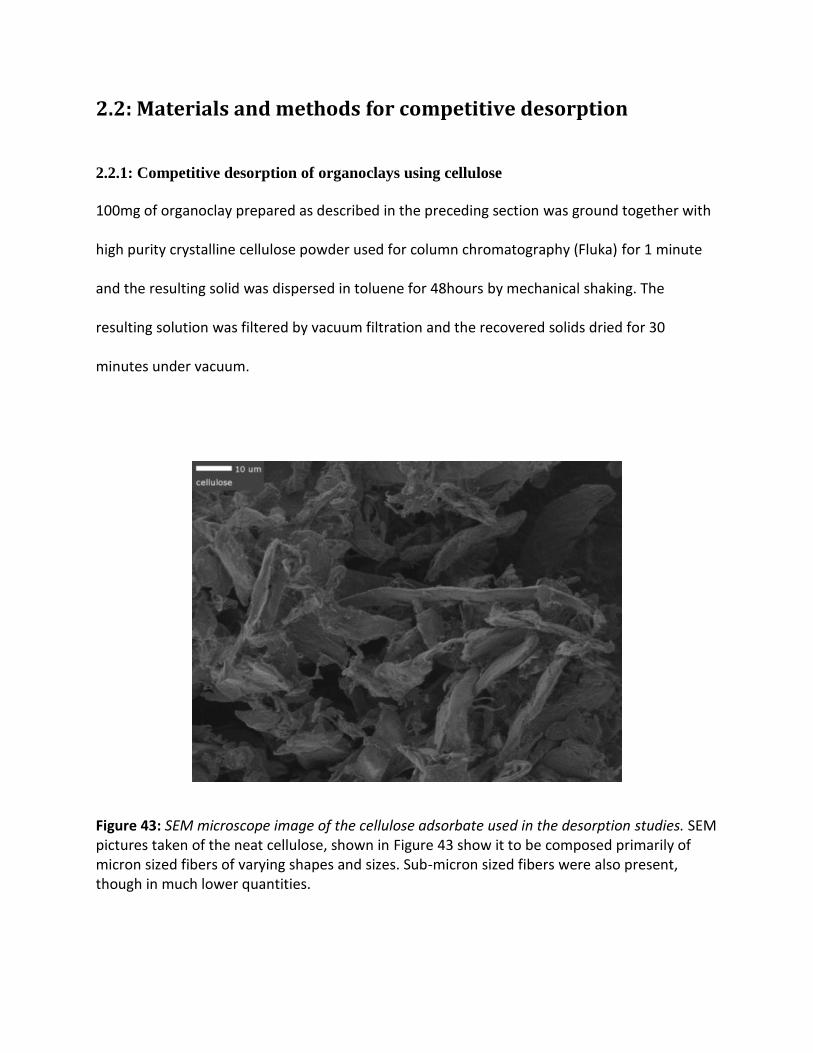
2.2: Materials and methods for competitive desorption
2.2.1: Competitive desorption of organoclays using cellulose
100mg of organoclay prepared as described in the preceding section was ground together with
high purity crystalline cellulose powder used for column chromatography (Fluka) for 1 minute
and the resulting solid was dispersed in toluene for 48hours by mechanical shaking. The
resulting solution was filtered by vacuum filtration and the recovered solids dried for 30
minutes under vacuum.
Figure 43: SEM microscope image of the cellulose adsorbate used in the desorption studies. SEM pictures taken of the neat cellulose, shown in Figure 43 show it to be composed primarily of micron sized fibers of varying shapes and sizes. Sub-micron sized fibers were also present, though in much lower quantities.

73
Figure 44: 13C cross-polarization magic angle spinning (CPMAS) nuclear magnetic resonance spectrum of the neat cellulose used in the desorption studies. Peaks were assigned according to (Newman, 1996)

2.3: Results and discussion for competitive desorption
2.3.1: Disaggregation and dispersion the organoclays
Figure 45: SEM images of an asphaltene organoclay after dispersion with an excess (10:1, w/w). Clay particles are completely deaggregated and well dispersed over the surface of the cellulose fibers.
Figure 46: SEM images of an organoclay after dispersion with a limited amount (1:10, w/w) of cellulose.

75
To qualitatively observe the effects of the cellulose in dispersion on the organoclay, SEM
images were taken of the recovered material. Figure 45 and Figure 46 show the hexagonal
platelets attributed to the clay material coating the cellulose fibers [image of the neat cellulose
shown in Figure 43 for reference]. The platelets were well dispersed on the surface of the fibers
with little platelet aggregation observed like previously shown in Figure 24. Adhesion appears
to be almost exclusively from the platelet faces; little edge adhesion observed. When
organoclay content greatly exceeds that of cellulose in the dispersion, organoclay aggregation
was observed, but only after the cellulose surface was completely covered. This would indicate
strong organoclay:cellulose interactions are occurring. Were these interactions weaker than
organoclay:organoclay ones, we would expect to see some aggregation of the hexagonal clay
particles before saturation of the cellulose surface occurs. This shows cellulose to be a very
effective agent in clay dispersions and indicate possible strong clay:cellulose interactions,
reinforcing our working hypothesis.

76
2.3.2: Cellulose: effect on desorption in organoclays
Figure 47: 13C CPMAS NMR spectra of a kaolinite:asphaltene system prepared in heptane compared to the same material after dispersing with and without cellulose. Close analysis of the spectra, shows that a fraction still remains.
Figure 48: Top and bottom spectra shown in Figure 47 with their intensity scales matched.

77
To evaluate the effectiveness of the cellulose as a competitive agent in the
adsorption/desorption process, 13C CPMAS NMR measurements were performed on
organoclays recovered after dispersion with cellulose in toluene [Figure 47]. At a distance, the
resonances corresponding to the loaded organic matter apppear to be absent. Both the high
field resonances, attributed to aliphatic functionalities and the low field resonances, attributed
to aromatics are not observed when looking at the full scale of the spectrum; only cellulose
resonances are present. This would indicate that all the organic matter was removed, leaving
only a mixture of cellulose and kaolinite in the recovered solid material. This assumption,
however, is incorrect: the intensity scales are not the same for all the spectra. Adjusting the
intensity scales to match the noise in all the spectra, [Figure 48], the intense cellulose
resonances are effectively hiding the much weaker asphaltene resonances. While it is difficult
to say for the aromatic resonances, since they slighly overlap with the cellulose ones, the
resolution of the aliphatic resonances are clearly still present. How much is removed is difficult
to say and impossible to quantify with the current experiments.

78
2.3.3: Challenges with quantifying desorption
Quantifying the organic content remaining in the organoclays after dispersion with cellulose has
proven to be a great challenge. Typically, elemental analysis would be used, as was done for the
adsorption and desorption studies in preceding sections. With cellulose introduced into the
system, however, we are adding another source of carbon into the mixture which greatly
complicates this measurement. This forces us to ignore the carbon signal, the most intense of
the elemental signals in our samples, drastically affecting sensitivity. Measurements could still
be done using only the nitrogen and sulfur content, however, the high mass ratios of cellulose
to organoclays used in most samples means that these signals will be too small to be accurately
measured.
IR is another method typically used to quantify organic matter in solids. The IR spectra of a
prepared organoclay [Figure 49] show four important regions: vibrational bands in between
500-1200nm, 1200-1500nm, 2800-3000nm, and 3400-3700nm. The bands between 500-
1200nm, attributed to Si-O and Al-O bending, and 3400-3700nm, attributed to -OH stretching,
are due to the kaolinite adsorbent. Bands between 1200-1500nm, attributed to -CH3 and -CH2
bending, and 2800-3000nm, attributed to -CH3 and -CH2 stretching, are due to the loaded
organic matter. The 2800-300nm bands are both intense and well resolved from the kaolinite
bands, which would make them ideal candiates for quantifying organic content in the
organocalys. Unfortunately, cellulose bands interfere in all the regions of interest [see Figure

79
50]. Quantification would be possible using peak deconvolution , but that would, again, come at
the expense of sensitivity, which is unnacceptable in these already very dilute samples.
Figure 49: Attenuated total reflection Fourier-transform infrared (AT-FTIR) of a kaolinite:C-5 asphaltene organoclay prepared in heptane Vibrational bands between 500-1200nm and between 3400-3700nm are attributed to the kaolinite clay adsorbent. Bands between 1200-1500 nm are attributed to bending and between 2800-3000nm to stretching of -CH3 and -CH2 functionalities.

80
Figure 50: DRIFT spectra of native and microcrystalline cellulose. Adapted from (Ilharco, 1997). Cellulose vibrational bands overlap with all the analyte bands, making quantitation of cellulose organoclay materials very difficult to achieve.
13C CPMAS NMR was finally chosen as the technique of choice for this analysis, but it too was
not without problems. Even with careful control of experimental conditions, differences in
probe tuning and phasing between samples will introduce appreciable variability in the
measurements; and overlap of the analyte resonances with cellulose in cellulose rich samples
will introduce further variability. All things considered, an estimated 10-15% error is expected
using this method. Therefore, very careful control of the experimental conditions was necessary
to optimize the analyte’s signals.
2.3.4: Quantifying desorption using 13
C CPMAS NMR: optimization experiments

81
Figure 51: 13C CPMAS NMR spectra of a kaolinite:asphaltene organoclay after dispersion with cellulose measured using a varying p15 pulse contact time. Signal is most intense using a 500µs contact time.
To maximize the intensity of the signal, a series of optimization experiments were performed to
determine the optimal p15 pulse contact time used in the cross polarization experiment. Figure
51 shows the result of these experiments using a toluene based asphaltene:kaolinite
organoclay (JSTASP-02) recovered after dispersion with cellulose in toluene. These results show
a steady decline in signal intensity as the contact time is increased. This trend was consistent
throughout the entire spectrum for the resonances of the analyte and cellulose. From this data,
experimental conditions (summarized in Table 1) were chosen for quantitation of the organic
matter in the recovered organoclays.

82
recycle delay (d1) 2s
pulse contact time
(p15) 500µs
well time (DW) 24.8µs
receiver gain 203
acquisition time 50.79ms
number of scans 42000
Table 1: 13C CPMAS NMR experimental conditions used for quantitation of organic matter in organoclays dispersed with cellulose. Total instrument time comes out to 23hr 58min per run.
2.3.5: Quantifying desorption using 13
C CPMAS NMR
Figure 52: 13C CPMAS NMR spectra of kaolinite:asphaltene organoclay recovered after dispersion with varying quantities of cellulose in toluene. Spectral subtraction was done using a cellulose blank to remove it’s resonances from the spectra. The subtraction appears to remove a portion of the analyte’s resonances, especially those attributed to aromatics.

83
Using the aforementioned experimental parameters, the relative amount of organic content
removed from an asphaltene:kaolinite organoclay (JSTASP-02) was quantified by 13C CPMAS
NMR, and the effects on these quantities by adding a controlled amount of cellulose to the
dispersion was investigated. Figure 52 shows a superposition of all the sample spectra after
spectral subtraction was performed using a cellulose blank. The process, unfortunately is
imperfect: artifacts of the cellulose resonances still remain and, more importantly, as the
cellulose content is increased, we begin to see the subtraction removing parts of the analyte
resonances. This is especially evident for the aromatic resonances when 400mg of cellulose was
used, where we see a large dropoff in signal around 130ppm. This is attributed to the
broadening of cellulose resonances as its content increases resulting in overlap with the
aromatic resonances
The maximum intensity in the 0-50ppm region was taken [Figure 53] and compared to that of
the starting material to obtain relative quantities between samples. These results were plotted
as a function of cellulose content added to the dispersion, as summarized in Figure 55. The
presence of cellulose had a positive effect on the desorption process: organic content removed
increased by 15-25% when cellulose was added to the dispersion. The quantity removed,
however, was independent of the quantity added: approximately the same amount was
removed when up to 50% (w/w) cellulose was added.

84
Figure 53: Close up of the 0-50ppm region of the spectra shown in Figure 52. Intensities are scaled according to the masses loaded in the rotor and normalized to the signal at 0ppm. Maximum intensity of the aliphatic resonance was used to quantify the aliphatic content.
Figure 54: Close up of the 100-150ppm region of the spectra shown in Figure 52. Intensities are scaled according to the masses loaded in the rotor and normalized to the signal at 150ppm. The intensity of the shoulder around 130-140 ppm was used to quantify the aromatic content.

85
Quantifying aromatic functionalities was less clear cut. The maximum intensity around 120-
130ppm [Figure 54] overlapped slightly with the cellulose resonances and thus were affected
by the spectral subtraction. To minimize errors from the spectral subtraction, a lower field peak
around 140ppm was chosen instead of the more intense peak at 130ppm. Their intensities
relative to that of the starting material were plotted as a function of cellulose content added to
the dispersion [Figure 56]. As was the case with the aliphatic functionalities, cellulose also had a
positive effect on the desorption of aromatics. Organic content removed increased by 15-40%
with cellulose present in the dispersion. In contrast to the aliphatics, as the cellulose content
increased, desorption of the analyte appeared to increase as well. This might not be entirely
due to an increase in desorption, however as spectral subtraction of the cellulose could play an
important role in this decrease in spectral intensity.
Figure 55: Aliphatic functionalities remaining in an organoclay after dispersion in toluene with as a function of cellulose content added to the dispersion. Cellulose added to the dispersion improved the desorption process by 15-25%. Increasing the cellulose content beyond 10% had no effect.

86
Figure 56: Aromatic functionalities remaining in an organoclay after dispersion in toluene with as a function of cellulose content added to the dispersion. Cellulose added to the dispersion improved the desorption process by 15-40%. Increasing the cellulose content beyond 10% appeared to have a positive effect on desorption.
2.3.6: Recommendation: quantitation of solvent filtrates
As previously outlined, the errors associated with quantitation by 13C CPMAS NMR are quite
high, estimated at ~15%. Considering that the lower end of the adsorption efficiency gained
from adding cellulose to the dispersions close to this amount, it could be argued that cellulose
isn’t having any effect whatsoever on the desorption process and the signal drop between
samples is due to experimental errors. The consistency in the results for the 5 cellulose
containing samples in Figure 55 makes this unlikely, however. Were the organic contents to
remain constant from sample to sample, with this range of uncertainty, we would expect to see
a larger spread in the data, rather than it being concentrated with around 60% organic content
remaining for all 5. We see evidence of this spread more in the aromatic functionalities with 1

87
cellulose containing sample having organic content almost equal to the sample dispersed
cellulose, going against the general trend observed. To avoid this level of uncertainty, a more
efficient method is recommended for future work quantifying organic matter in these cellulose
containing organoclays.
One of the key problems with quantifying cellulose containing organoclays has been the
presence of the cellulose itself in the samples. Knowing that it is insoluble in the solvents used,
quantifying the organic content displaced in solution would avoid the problems associated its
presence. Solution based methods, also have the advantage of being far more robust and
developed that their solid state counterparts, making them a much better choice for
quantitation. The UV spectroscopy adsorption profile of asphaltenic materials dispersed in
toluene, summarized in Figure 57 and Figure 58, shows that while they display a relatively
featureless adsorption profile, quantitation is entirely possible. It is recommended that future
studies on competitive desorption of these organoclays investigate using this method for
quantifying desorption.

88
Figure 57: UV-visual adsorption spectrum of an asphaltene solution in toluene Profile from 300-800 nm is that of an extinction curve, with a single band at 405nm attributed to π-π* transitions of petroleum porphyrins (Evdokimov, 2003). Strong adsorption from 200-300nm is attributed to the toluene solvent.

89
Figure 58: Absorbance at 405nm as a function of asphaltene content in solution. Quantitation of asphaltene content using the 405nm shoulder shows good linearity.
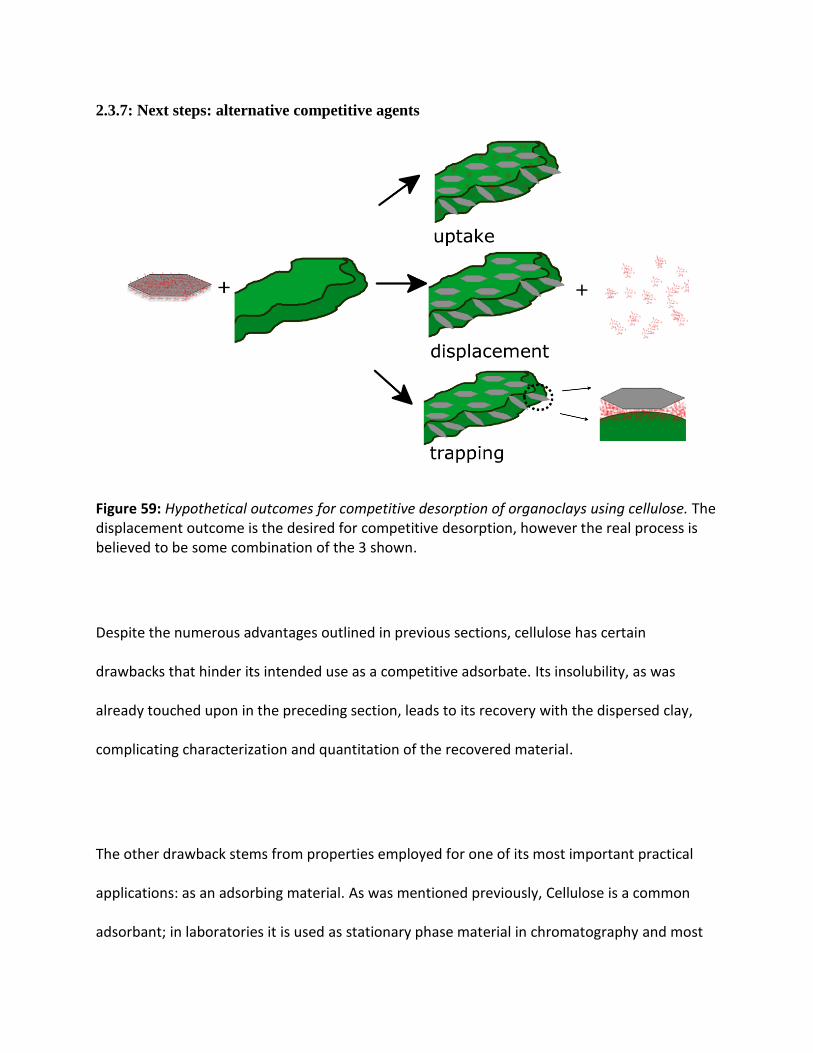
2.3.7: Next steps: alternative competitive agents
Figure 59: Hypothetical outcomes for competitive desorption of organoclays using cellulose. The displacement outcome is the desired for competitive desorption, however the real process is believed to be some combination of the 3 shown.
Despite the numerous advantages outlined in previous sections, cellulose has certain
drawbacks that hinder its intended use as a competitive adsorbate. Its insolubility, as was
already touched upon in the preceding section, leads to its recovery with the dispersed clay,
complicating characterization and quantitation of the recovered material.
The other drawback stems from properties employed for one of its most important practical
applications: as an adsorbing material. As was mentioned previously, Cellulose is a common
adsorbant; in laboratories it is used as stationary phase material in chromatography and most

91
commonly as the base material for thin layer chromatography. This could lead to the possibility
of the cellulosic material uptaking some of the organic matter dispersed in solution, reducing
the efficiency of the desorption process.
Additionally, if the cellulose:adsorbate interactions are strong enough, it is possible that the
organic matter could adsorb on both the clay and cellulose surfaces, sandwiched between the
two. This scenario becomes more likely with large molecules containing numerous functional
groups that would interact strongly with the adsorbent, such as the asphaltenic materials used
as adsorbates. When sandwiched between the two surfaces, displacement in solution become
much less favorable, due in part to the increased stability conferred by favorable interactions
with the additional adsorbent surface and to the increased steric effects to form a solvation
shell around the adsorbate. This effectively “traps” the organic matter, decreasing the
efficiency of the desorption process. This mechanism is believed to become increasingly
important in low cellulose content mixtures.
Thus, competitive desorption with cellulose leads to 3 possible outcomes: displacement, uptake
and trapping as outlined in Figure 59, the real process being some combination of the three.
This problem could, again, be avoided by using a competitive adsorbate that is soluble in the
chosen solvent system. Other polysaccharides and compounds in the same family as cellulose
such as alditols, saccharides, and polyols could be investigated as potential competitive
adsorbates in future studies. Another possible avenue is chemical modification of cellulose

92
itself. Adding functional groups to the base glucose units of cellulose could break apart the
extensive hydrogen bonding network which renders it insoluble in most conditions. There are a
number of chemically modified celluloses readily available on the market (examples shown in
Figure 60), so this is another possible direction for future studies.
Figure 60: Structure of (shown left) ethyl cellulose and (shown right) carboxymethyl cellulose. Chemically modified cellulose could overcome the problems related to cellulose’s insolubility.

2.4: Conclusion
Cellulose was shown to have a high affinity for kaolinite adsorption, showing disaggregation of
the organoclay particles when dispersed together. Adding cellulose to an organoclay dispersion
was shown to improve the desorption of aliphatic organic matter by up to 20% and aromatics
by up to 40%. Increasing cellulose content had little noticeable effect past 10% (w/w) content
for desorbing aliphatics.
Due to the difficulties associated with quantifying in the solid material, future studies are
recommended to focus on solution based methods, especially UV spectroscopy.
Due to the dual adsorbate/adsorbent nature of cellulose and its inherent insolubility in most
solvents, it is recommended that future studies look at chemically modified celluloses and other
saccharides, alcohols, polymers, that contain a high density of hydroxyl groups as potential
competitive agents.

References Bailey, S.W. (ed.) Reviews in Mineralogy, Volume 19: Hydrous Phyllosilicates (Exclusive of Micas). Mineralogical Society of America, Chelsea (1988), 1-89.
F. Bensebaa, L.S. Kotlyar, B.D. Sparks, K.H. Chung, Organic coated solids in Athabasca bitumen: Characterization and process implications. The Canadian Journal of Chemical Engineering 78 (2000) 610–616.
S. Brunauer, P.H Emmett, E. Teller Adsorption of gases in multimolecular layers. Journal of the American Chemical Society 60 (1938) 309-319.
F.W. Camp, The Tar Sands of Alberta, Canada 3rd ed., Cameron Engineering Inc., Colorado, 1976.
O. Carmody, R. Frost, Y. Xi, S. Kokot Surface characterisation of selected sorbent materials for common hydrocarbon fuels. Surface Science 601 (2007) 2066-2076.
R.J. Chalaturnyk, Management of oil sands tailings. Petroleum Science and Technology 20 (2002) 1025-1046.
L. Dawson, R. Boopathy, Use of post-harvest sugarcane residue for ethanol production. Bioresource Technology 98 (2007) 1695-1699.
S.-Y. Ding, M. Himmel, The maize primary cell wall microfibril: A new model derived from direct visualization. Journal of agricultural and food chemistry 54 (2006) 597-606.
I.N. Evdokimov, N.Y. Eliseev, B.R. Akhmetov, Assembly of asphaltene molecular aggregates as studied by nead-UV/visible spectroscopy I. Structure of the absorbance spectrum. Journal of Petroleum Science & Engineering 37 (2003) 135-143.
R. A. Festucci-Buselli, W. C. Otoni, C. P. Joshi, Structure, organization, and functions of cellulose synthase complexes in higher plants. Brazilian Journal of Plant Physiology 19 (2007) 1-13.

95
J.E.F.C. Gardolinski, G. Lagaly, Grafted organic derivatives of kaolinite: I. Synthesis, chemical and rheological characterization. Clay Minerals 40 (2005) 537-546. Government of Alberta, Oil Sands Facts and Statistics. (n.d.) Retrieved February 20, 2012, from http://www.energy.alberta.ca/oilsands/791.asp M.R. Gray, R.R. Tykwinski, J.M. Stryker, X. Tan, Supramolecular assembly model for aggregation of petroleum asphaltenes. Energy & Fuels 25 (2011) 3125-3134. R.E.Grim, Clay Mineralogy, 2nd Ed. McGraw-Hill, New York (1968), 596pp. A. C. Hall, S. H. Collins, J. C. Melrose, Stability of aqueous wetting films in Athabasca tar sands. Society of Petroleum Engineers Journal 23 (1983) 249-258. A.C. Hess, V.R. Saunders, Periodic ab initio Hartree-Fock calculations of the low-symmetry mineral kaolinite. Journal of physical chemistry 96 (1992) 4367-4374. M.E. Himmel, S.-Y. Ding, D.K. Johnson, W.S. Adney, M.R. Nimlos, J.W. Brady, T.D. Foust, Biomass recalcitrance: Engineering plants and enzymes for biofuels production. Science 315 (2007) 804-807.
M.K. Hubbert, Nuclear Energy and the Fossil Fuels. Shell Development Co., pub no.95, (1956).
International Energy Agency, World Energy Outlook 2010. OECD/IEA ,Paris (2010).
L.M. Ilharco, A.R. Garcia, J. Lopes Da Silva, L.F. Vieira Ferreira, Infrared approach to the study of adsorption on cellulose: Influence of cellulose crystallinity on the adsorption of benzophenone. Langmuir 13 (1997) 4126-4132. M. Jarvis, Cellulose stacks up. Nature 426 (2003) 611-612. G. Kakali, T. Perraki, S. Tsivilis, E. Badogiannis, Thermal treatment of kaolin: The effect of mineralogy on the pozzolanic activity. Applied Clay Science 20 (2001) 73-80. D. L. Kaplan (ed.) Biopolymers from Renewable Resources Springer, Berlin (1998), 1-29. D. Klemm, B. Heublein, H.-P. Fink, A. Bohn, Cellulose: Fascinating biopolymer and sustainable raw material. Angewandte Chemie - International Edition 44 (2005) 3358-3393. Y. Komori, H. Enoto, R. Takenawa, S. Hayashi, Y. Sugahara, K. Kuroda, Modification of the interlayer surface of kaolinite with methoxy groups. Langmuir 16 (2000) 5506-5508.

96
S. Letaief, P. Aranda, R. Fernandez-Saavedra, J.C. Margeson, C. Detellier, E. Ruiz-Hitzky,
Poly(3,4-ethylenedioxythiophene)-clay nanocomposites. Journal of Materials Chemistry 18
(2008), 2227-2233.
S. Letaief, C. Detellier, Clay-polymer nanocomposite material from the delamination of kaolinite in the presence of sodium polyacrylate. Langmuir 25 (2009) 10975-10979.
J. Masliyah, Z. Zhou, Z. Xu, J. Czarnecki, H. Hamza, Understanding water-based bitumen extraction from athabasca oil sands. The Canadian Journal of Chemical Engineering 82 (2004) 628-654.
J. M. Mcclave, Recovery of Oil from Athabaska Oil Sands. Canadian Mining Journal 56 (1935) 317–323.
R.J. Moon, A. Martini, J. Nairn, J. Simonsen, J. Youngblood, Cellulose nanomaterials review: Structure, properties and nanocomposites. Chemical Society Reviews 40 (2011) 3941-3994. G.D. Mossop, Geology of the Athabasca oil sands. Science 207 (1980) 145-207. O.C. Mullins (ed.), E. Y. Sheu (ed.), A.H. Hammami (ed.), A.G. Marshall (ed.), Asphaltenes, Heavy Oils and Petroleomics Springer Science+Business Media, New York (2007). R.H. Newman, L.M. Davies, P.J. Harris, Solid-state 13C nuclear magnetic resonance characterization of cellulose in the cell walls of Arabidopsis thaliana leaves. Plant Physiology 111 (1996) 475-485. A. Payen, Mémoire sur la composition du tissu propre des plantes et du ligneux. Comptes rendus hebdomadaires des séances de l’Académie des sciences 7 (1838) 1052. J.D. Payzant, E.M. Lown, O.P. Strauz, Structural units of athabasca asphaltene: The aromatics with a linear carbon framework Energy & Fuels 5 (1991) 445-453.
P. Peng, A. Morales-Izquierdo, A. Hogg, O.P. Strausz, Molecular structure of athabasca asphaltene: Sulfide, ether, and ester linkages. Energy & Fuels 11 (1997) 1171-1187.

97
S. Persson, T. Raab, S. Vorwerk, H. Youngs, Toward a systems approach to understanding plant cell walls. Science 306 (2004) 2206.
M. Siskin, S.R. Kelemen, C.P. Eppig, L.D. Brown, M. Afeworki, Asphaltene molecular structure and chemical influences on the morphology of coke produced in delayed coking Energy & Fuels 20 (2006) 1227-1234.
C.G. Slough Weight Loss Determined from Mass Spectrometry Trend Data in Thermogravimetric /Mass Spectrometer System TA306 (n.d.) TA instruments, New Castle. C. Somerville, S. Bauer, G. Brininstool, M. Facette, T. Hamann, J. Milne, E. Osbourne, A. Paredez, S. Persson, T. Raab, S. Vorwerk, H. Youngs, Toward a systems approach to understanding plant cell walls. Science 306 (2004) 2206.
B.D. Sparks, L.S. Kotlyar, J.B O’Carroll, K.H. Chung, Athabasca oil sands: Effect of organic coated solids on bitumen recovery and quality. Journal of Petroleum Science & Engineering 39 (2003) 417-430.
J.G. Speight, Petroleum asphaltenes - Part 1: Asphaltenes, resins and the structure of petroleum. Oil Gas Science and Technology 59 (2004) 467-477. K. Takamura, Microscopic structure of athabasca oil sand. Canadian Journal of Chemical Engineering 60 (1982) 538-545. Y.Tu, L.S. Kotlyar, B.D. Sparks, K.H. Chung, Adsorption of pentane insoluble organic matter from oilsands bitumen onto clay surfaces. Petroleum Science and Technology 24 (2006) 327-338.
J.J. Tunney, C. Detellier, Aluminosilicate nanocomposite materials. Poly(ethylene glycol)-kaolinite intercalates. Chemistry of Materials 6 (1996) 1679-1685. J.J. Tunney, C. Detellier, Aluminosilicate nanocomposite materials. Poly(ethylene glycol)-kaolinite intercalates. Chemistry of Materials 8 (1996) 927-935. P.Zugenmaier, Conformation and packing of various crystalline cellulose fibers. Progress in Polymer Science 26 (2001) 1341-1417.