ADS Ptolemy Simulation -...
184
ADS Ptolemy Simulation January 2007
Transcript of ADS Ptolemy Simulation -...

ADS Ptolemy Simulation
January 2007

Notice
The information contained in this document is subject to change without notice.
Agilent Technologies makes no warranty of any kind with regard to this material, including, but not limited to, the implied warranties of merchantability and fitness for a particular purpose. Agilent Technologies shall not be liable for errors contained herein or for incidental or consequential damages in connection with the furnishing, performance, or use of this material.
Warranty
A copy of the specific warranty terms that apply to this software product is available upon request from your Agilent Technologies representative.
Restricted Rights Legend
Use, duplication or disclosure by the U. S. Government is subject to restrictions as set forth in subparagraph (c) (1) (ii) of the Rights in Technical Data and Computer Software clause at DFARS 252.227-7013 for DoD agencies, and subparagraphs (c) (1) and (c) (2) of the Commercial Computer Software Restricted Rights clause at FAR 52.227-19 for other agencies.
© Agilent Technologies, Inc. 1983-2007. 395 Page Mill Road, Palo Alto, CA 94304 U.S.A.
Acknowledgments
Mentor Graphics is a trademark of Mentor Graphics Corporation in the U.S. and other countries.
Microsoft®, Windows®, MS Windows®, Windows NT®, and MS-DOS® are U.S. registered trademarks of Microsoft Corporation.
Pentium® is a U.S. registered trademark of Intel Corporation.
PostScript® and Acrobat® are trademarks of Adobe Systems Incorporated.
UNIX® is a registered trademark of the Open Group.
Java™ is a U.S. trademark of Sun Microsystems, Inc.
SystemC® is a registered trademark of Open SystemC Initiative, Inc. in the United States and other countries and is used with permission.
MATLAB® is a U.S. registered trademark of The Math Works, Inc.
ii

Portions of the documentation
Copyright © 1990-1996 The Regents of the University of California. All rights reserved.
In no event shall the University of California be liable to any party for direct, indirect, special, incidental, or consequential damages arising out of the use of this software and its documentation, even if the University of California has been advised of the possibility of such damage. The University of California specifically disclaims any warranties, including, but not limited to, the implied warranties of merchantability and fitness for a particular purpose. The software provided hereunder is on an “as is” basis and the University of California has no obligation to provide maintenance, support, updates, enhancements, or modifications.
iii

iv
Contents1 ADS Ptolemy
Introduction............................................................................................................... 1-1ADS Ptolemy and UC Berkeley Ptolemy .................................................................. 1-2Timed Synchronous Dataflow Simulator................................................................... 1-2Terminology .............................................................................................................. 1-3
2 Integrator ExampleCopying and Opening Example Project.................................................................... 2-1
Copy the Project ................................................................................................. 2-2Open the Project ................................................................................................ 2-2
Selecting and Placing Components.......................................................................... 2-4Add a Source...................................................................................................... 2-4Add an Output Display ....................................................................................... 2-5Modify Component Parameters.......................................................................... 2-5Connect Components with Wires ....................................................................... 2-6Add a Controller ................................................................................................. 2-6
Starting Simulation.................................................................................................... 2-8Simulate and Display Data Directly .................................................................... 2-8Simulate and Save Data..................................................................................... 2-9
3 Data Types, Controllers, Sinks, and ComponentsRepresentation of Data Types .................................................................................. 3-1Automatic or Manual Data Type Conversion ............................................................ 3-3
What Happens During Conversion?................................................................... 3-4Controllers ................................................................................................................ 3-5
DF (Data Flow) Controller................................................................................... 3-5OutputOption Controller ..................................................................................... 3-12WTB Controller ................................................................................................... 3-13VarEqnCheck...................................................................................................... 3-15
Sources and Sinks Control the Simulation ............................................................... 3-17ADS Ptolemy Components....................................................................................... 3-20
4 Understanding ParametersValue Types .............................................................................................................. 4-1Parameter Editing..................................................................................................... 4-5Parameter Expressions ............................................................................................ 4-7Complex-Valued Parameters.................................................................................... 4-7Parameters for Fixed-Point Components ................................................................. 4-8String Parameters..................................................................................................... 4-13Filename Parameters ............................................................................................... 4-13Array Parameters ..................................................................................................... 4-14
v

Reading Array Parameter Values From Files ........................................................... 4-15Parameters With Optimization and Swept Attributes................................................ 4-16
5 Using Data TypesRepresentation of Data Types .................................................................................. 5-1
Stem Thickness .................................................................................................. 5-2Single and Multiple Arrowheads......................................................................... 5-2
Data Types Defined .................................................................................................. 5-3Numeric Scalar Data .......................................................................................... 5-3Numeric Matrix Data........................................................................................... 5-4Timed Data ......................................................................................................... 5-4
Conversion of Data Types ........................................................................................ 5-5Numeric Scalar and Matrix Conversions ............................................................ 5-5Timed Data Conversions .................................................................................... 5-6Rules and Exceptions......................................................................................... 5-8Automatic or Manual Data Type Conversion ...................................................... 5-8
6 Understanding File FormatsIntroduction............................................................................................................... 6-1Real Array Data ........................................................................................................ 6-1Complex Array Data ................................................................................................. 6-1String Array Data ...................................................................................................... 6-1Real Matrix Data....................................................................................................... 6-2Fixed-Point Matrix Data ............................................................................................ 6-2Integer Matrix Data ................................................................................................... 6-2Complex Matrix Data ................................................................................................ 6-3SPW (.ascsig and .sig) File Formats ........................................................................ 6-3
Real Double Data Format Example .ascsig File................................................. 6-3Complex double data format example .ascsig file .............................................. 6-4
Time-Domain Waveform Data (.tim) File, MDIF ASCII Format................................. 6-5BINTIM Format................................................................................................... 6-5Guidelines for .tim files ....................................................................................... 6-5Example .tim Files .............................................................................................. 6-7
Agilent Standard Data Format (.dat) Files ................................................................ 6-8
7 Performing Parameter SweepsIntroduction............................................................................................................... 7-1Simple Parameter Sweeps ....................................................................................... 7-2Parameter Sweeps with Defined Variables .............................................................. 7-5Multiple Parameter Sweeps...................................................................................... 7-6String Type Parameter Sweeps ................................................................................ 7-9Multidimensional Parameter Sweeps ....................................................................... 7-11
8 Using Nominal Optimization
vi

Introduction............................................................................................................... 8-1Optimizing Various Parameter Types ....................................................................... 8-1
Optimizing Input and Output Bit Width ............................................................... 8-2
9 Theory of OperationIntroduction............................................................................................................... 9-1Synchronous Dataflow.............................................................................................. 9-2
Basic Dataflow Terminology ............................................................................... 9-2Balancing Production and Consumption of Tokens............................................ 9-3How Schedulers Work ........................................................................................ 9-4Iterations in SDF................................................................................................. 9-6Deadlocks........................................................................................................... 9-7Deadlock Resolution .......................................................................................... 9-8
Timed Synchronous Dataflow................................................................................... 9-9Time Step Resolution ......................................................................................... 9-10Carrier Frequency Resolution ............................................................................ 9-11Input/Output Resistance..................................................................................... 9-11
Multithreaded Synchronous Dataflow....................................................................... 9-13Parallelism with Clustering ................................................................................. 9-13Memory Overhead.............................................................................................. 9-14Sample Results .................................................................................................. 9-15Reentrancy ......................................................................................................... 9-16Thread-Safe Programming................................................................................. 9-16
References ............................................................................................................... 9-18
10 Introduction to MATLAB CosimulationSupported MATLAB Versions ................................................................................... 10-2Setting Up MATLAB Cosimulation............................................................................ 10-2
On Windows ....................................................................................................... 10-2On UNIX ............................................................................................................. 10-3Finishing the MATLAB Compiler Configuration .................................................. 10-6
Simulating with MATLAB (Script-Interpreting) .......................................................... 10-6Writing Functions for MATLAB Models (Script-Interpreting) ..................................... 10-7Simulating with MATLAB (Library-Importing)............................................................ 10-8Examples.................................................................................................................. 10-10
11 Cosimulation with Analog/RF SystemsSetting Up the Analog/RF Circuit Schematic............................................................ 11-3Setting Up the Signal Processing Schematic ........................................................... 11-4
Circuit Simulation Controllers ............................................................................. 11-5Numeric-to-Timed Converters ............................................................................ 11-5
Automatic Verification Modeling (Fast Cosimulation) ............................................... 11-5Clustering of Circuit Subnetworks ............................................................................ 11-8
vii

Connected Circuit Subnetworks ......................................................................... 11-8Connected Resistors .......................................................................................... 11-8
Feedback Loops ....................................................................................................... 11-9Named Connections and Measurements in Circuit Designs .................................... 11-10Circuit Envelope Specific Rules................................................................................ 11-10Transient Simulation Specific Rules ......................................................................... 11-11Nested Simulation Approach .................................................................................... 11-11
Signal Processing Model of the Circuit Network ................................................ 11-12Circuit Model of the Signal Processing Network ................................................ 11-12
Interface Issues ........................................................................................................ 11-12Time Step ........................................................................................................... 11-13Delays in Feedback Loops ................................................................................. 11-14Time Converters ................................................................................................. 11-14Carrier Frequency .............................................................................................. 11-15EnvOutSelector and EnvOutShort Components ................................................ 11-15
Troubleshooting Common Problems ........................................................................ 11-16Cosimulation Example.............................................................................................. 11-17
Copying and Opening the Project ...................................................................... 11-17Rectifier Schematic ............................................................................................ 11-18
12 Interactive Controls and DisplaysIntroduction............................................................................................................... 12-1TkSlider and TkPlot Components............................................................................. 12-3TkText and TkShowValues Components .................................................................. 12-5TkXYPlot Component ............................................................................................... 12-6TkBarGraph Component .......................................................................................... 12-8LMS Adaptive Filter Components............................................................................. 12-8TkButtons Component.............................................................................................. 12-10TkBreakPt Component ............................................................................................. 12-11TkMeter Component................................................................................................. 12-11TkShowBooleans Component .................................................................................. 12-11TkBasebandEquivChannel Component ................................................................... 12-12TclScript Component ................................................................................................ 12-13TkEye, TkConstellation, TkHistogram, TklQrms, and TkPower Components .......... 12-13References ............................................................................................................... 12-13
A Wireless Test Bench DesignsCreating a Wireless Test Bench Design ................................................................... A-1
Wireless Test Bench Design Examples.............................................................. A-2Setting the Units for WTB Design Parameters ................................................... A-2Categorizing WTB Design Parameters .............................................................. A-2Information Parameters...................................................................................... A-3
Verifying a WTB Design in ADS ............................................................................... A-3
viii

Exporting a WTB Design to RFDE ........................................................................... A-4WTB Design User Interface Attributes...................................................................... A-4Creating a Results Display for WTB Designs ........................................................... A-5Circuit Envelope Parameters.................................................................................... A-6
B ADS Ptolemy AMS ModelsCreating ADS Ptolemy Designs for Use in AMSD-ADE ........................................... B-1Exporting ADS Ptolemy Designs for Use in AMSD-ADE.......................................... B-2Creating a Results Display for ADS Ptolemy Designs Used in AMSD-ADE ............ B-3
Index
ix

x

Chapter 1: ADS Ptolemy
IntroductionThe ADS Ptolemy software provides the simulation tools you need to evaluate and design modern communication systems products. Today’s designs call for implementing DSP algorithms in an increasing number of portions in the total communications system path, from baseband processing to adaptive equalizers and phase-locked loops in the RF chain. Cosimulation with ADS RF and analog simulators can be performed from the same schematic.
Using the ADS Ptolemy simulator you can:
• Find the best design topology using state-of-the-art technology with more than 500 behavioral DSP and communication systems models
• Cosimulate with RF and analog simulators
• Integrate intellectual property from previous designs
• Reduce the time-to-market for your products
And, ADS Ptolemy features:
• Timed synchronous dataflow simulation
• Easy-to-use interface for adding and sharing custom models
• Interface to test instruments
• Data display with post-processing capability
Introduction 1-1

ADS Ptolemy
ADS Ptolemy and UC Berkeley PtolemyThe Ptolemy signal processing simulator has its roots at the University of California at Berkeley. UC Berkeley Ptolemy is a third-generation software environment that began in January of 1990. It is an outgrowth of two previous generations of design environments, Blosim and Gabriel, that were aimed at digital signal processing. Both environments use dataflow semantics with block-diagram syntax for the description of algorithms.
Built on the UC Berkeley Ptolemy code, ADS Ptolemy software includes a large number of behavioral, time-domain antenna and propagation models that are critical to communication systems designers. For DSP designers, fixed-point analysis is scalable up to 256 bits. The intuitive ADS user interface includes post-processing capability, cosimulation with analog/RF simulators, links to test instruments, online help, and a host of other features.
In Ptolemy, different specialized design environments are called domains. ADS Ptolemy has modified the proven synchronous dataflow domain to include timed components; this is called the timed synchronous dataflow domain.
Timed Synchronous Dataflow SimulatorThe timed synchronous dataflow domain captures years of Agilent EEsof expertise in system-level analog/RF simulation, while adding the benefits of dataflow technology. This domain enables fast RF simulation, integration with signal processing simulation, and cosimulation with Agilent EEsof circuit simulators. For more information on the timed synchronous dataflow simulator and the synchronous dataflow domain, refer to Chapter 9, Theory of Operation.
1-2 ADS Ptolemy and UC Berkeley Ptolemy

TerminologyThroughout most of the ADS Ptolemy documentation, we use the ADS terminology, which is standard EDA terminology. However, UC Berkeley Ptolemy has its own terminology and for users familiar with this terminology, or those who are writing their own models, the following table compares the terms. The UC Berkeley Ptolemy terminology is used only in Chapter 9, Theory of Operation and in the chapters on building signal processing models found in the User-Defined Models documentation.
$HPEESOF_DIR
In UNIX installations, the environment variable specifying the directory in which the ADS software is installed. In Windows installations, the syntax, when needed, is %HPEESOF_DIR%.
actor
An atomic (indivisible) function in a dataflow model of computation. An actor is called a component in ADS Ptolemy and a star in UCB Ptolemy.
arc
A wire that connects the output of one star or component with the input of another.
base class
A C++ object used to define common interfaces and common code for a set of derived classes. An object may be a base class and a derived class simultaneously.
Table 1-1. Terminology Comparison
ADS Ptolemy Term UC Berkeley Ptolemy Term
Component Star
Network (or circuit) Galaxy
Top-level System Universe
Controller Target
Wire Arc
Data (or signals) Particles (or tokens)
Terminology 1-3

ADS Ptolemy
behavioral modeling
System modeling consisting of functional specification plus modeling of the timing of an implementation (compare to functional modeling).
Block
The base class defined in the kernel for stars, galaxies, universes, and targets.
block
A star or a galaxy.
compile-time scheduling
A scheduling policy in which the order of block execution is pre-computed when the execution is started. The execution of the blocks thus involves only sequencing through this pre-computed order one or more times (compare to run-time scheduling).
derived class
A C++ object derived from some base class. It inherits all of the members and methods of the base class.
dataflow
A model of computation in which actors process streams of tokens. Each actor has one or more firing rules. Actors that are enabled by a firing rule may fire in any order.
domain
A specific implementation of a computation model.
Domain
The base class in the ADS Ptolemy kernel from which all domains are derived.
drag
The action of holding a mouse button while moving the mouse.
FFT
The Fast Fourier Transform (FFT) is an efficient way to implement the discrete Fourier transform in digital hardware.
firing
A unit invocation of an actor in a dataflow model of computation.
1-4 Terminology

firing rule
A rule that specifies how many tokens are required on each input of a dataflow actor for that actor to be enabled for firing.
fork star
A star that reads one input particle and replicates it on any number of outputs.
functional modeling
System modeling that specifies input/output behavior without specifying timing (compare to behavioral modeling).
galaxy
A block that contains a network of other blocks.
Gantt chart
A graphical display of a parallel schedule of tasks. In ADS Ptolemy, the tasks are the firings of stars and galaxies.
homogeneous synchronous dataflow
A particular case of the synchronous dataflow model of computation, where actors produce and consume exactly one token on each input and output.
hpeesoflang
• A schema language used to define stars in ADS Ptolemy.
• The program that translates stars written in the hpeesoflang language to C++. In UCB Ptolemy, the equivalent language is called ptlang.
iteration
A set of executions of blocks that constitutes one pass through the pre-computed order of a compile-time schedule.
kernel
The set of classes defined in the ADS Ptolemy kernel.
layer
In the Schematic, a color with a given precedence. Colors with higher precedence will obscure colors with lower precedence.
Terminology 1-5

ADS Ptolemy
member
A C++ object that forms a portion of another object.
method
A function defined to be part of an object in C++.
model of computation
A set of semantic rules defining the behavior of a network of blocks.
net
A graphical connection between ports in the schematic.
object
A data type in C++ consisting of members and methods. These members and methods may be private, protected, or public. If they are private, they can only be accessed by methods defined in the object. If they are protected, they can also be accessed by methods in derived classes. If they are public, they can be accessed by any C++ code.
palette
A schematic area that contains a library of block icons.
parameter
The initial value of a state.
particle
Data (for example, a floating-point value) communicated between blocks.
port
A star or galaxy input or output.
PortHole
The base class in the ADS Ptolemy kernel for all ports.
Ptolemy
A design environment that supports simultaneous mixtures of different computation models. Ptolemy, named after the second-century Greek astronomer, mathematician, and geographer, was developed at the University of California at Berkeley.
1-6 Terminology
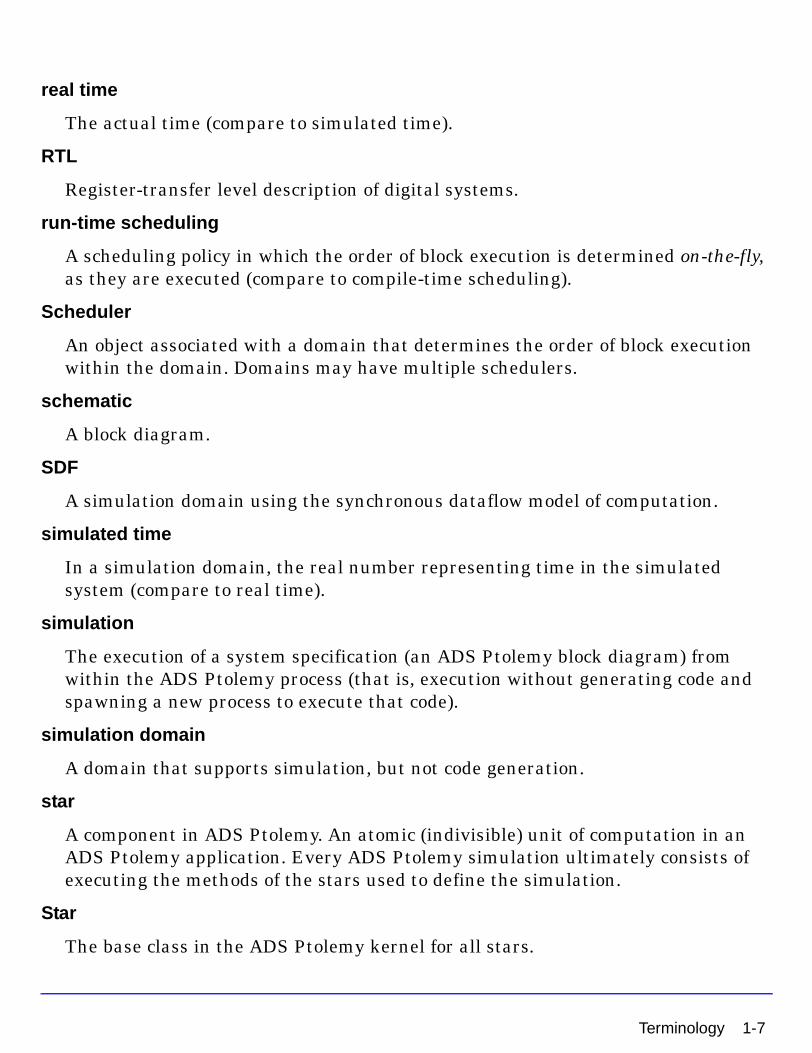
real time
The actual time (compare to simulated time).
RTL
Register-transfer level description of digital systems.
run-time scheduling
A scheduling policy in which the order of block execution is determined on-the-fly, as they are executed (compare to compile-time scheduling).
Scheduler
An object associated with a domain that determines the order of block execution within the domain. Domains may have multiple schedulers.
schematic
A block diagram.
SDF
A simulation domain using the synchronous dataflow model of computation.
simulated time
In a simulation domain, the real number representing time in the simulated system (compare to real time).
simulation
The execution of a system specification (an ADS Ptolemy block diagram) from within the ADS Ptolemy process (that is, execution without generating code and spawning a new process to execute that code).
simulation domain
A domain that supports simulation, but not code generation.
star
A component in ADS Ptolemy. An atomic (indivisible) unit of computation in an ADS Ptolemy application. Every ADS Ptolemy simulation ultimately consists of executing the methods of the stars used to define the simulation.
Star
The base class in the ADS Ptolemy kernel for all stars.
Terminology 1-7
ADS Ptolemy
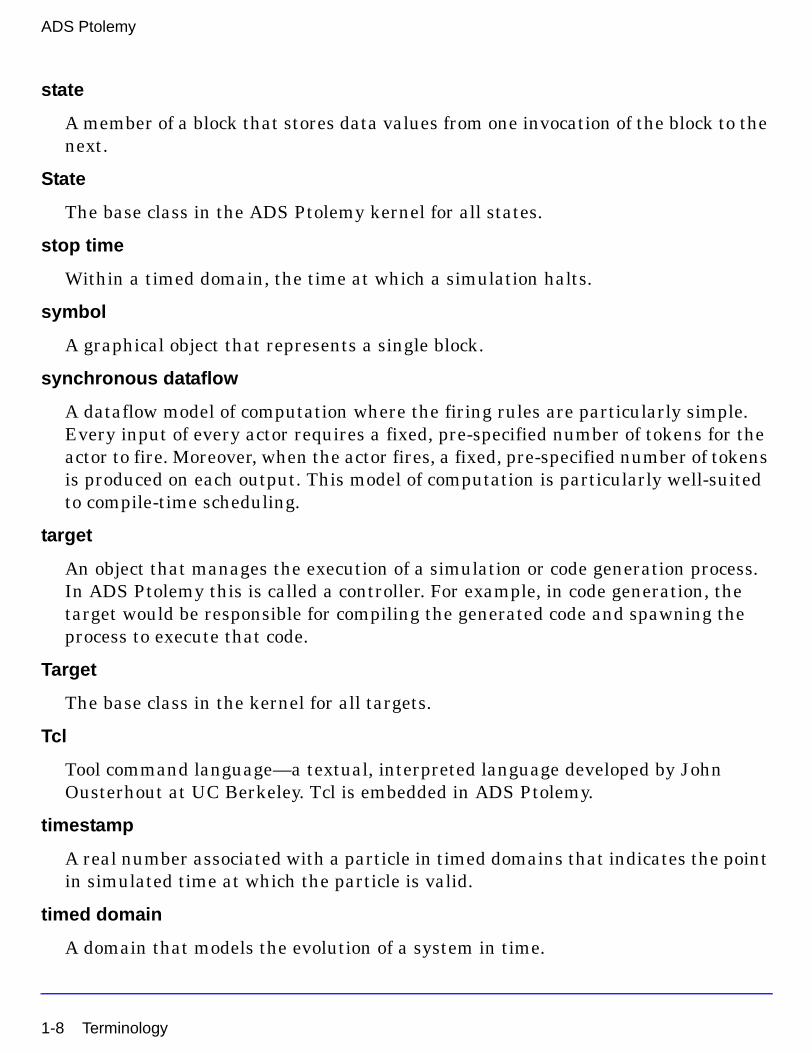
state
A member of a block that stores data values from one invocation of the block to the next.
State
The base class in the ADS Ptolemy kernel for all states.
stop time
Within a timed domain, the time at which a simulation halts.
symbol
A graphical object that represents a single block.
synchronous dataflow
A dataflow model of computation where the firing rules are particularly simple. Every input of every actor requires a fixed, pre-specified number of tokens for the actor to fire. Moreover, when the actor fires, a fixed, pre-specified number of tokens is produced on each output. This model of computation is particularly well-suited to compile-time scheduling.
target
An object that manages the execution of a simulation or code generation process. In ADS Ptolemy this is called a controller. For example, in code generation, the target would be responsible for compiling the generated code and spawning the process to execute that code.
Target
The base class in the kernel for all targets.
Tcl
Tool command language—a textual, interpreted language developed by John Ousterhout at UC Berkeley. Tcl is embedded in ADS Ptolemy.
timestamp
A real number associated with a particle in timed domains that indicates the point in simulated time at which the particle is valid.
timed domain
A domain that models the evolution of a system in time.
1-8 Terminology

Tk
A Windows and X-Windows toolkit for Tcl. The interactive sliders, buttons, and plotting capabilities of ADS Ptolemy are implemented in Tcl/Tk.
token
A unit of data in a dataflow model of computation. Tokens are implemented as particles in ADS Ptolemy.
universe
An entire ADS Ptolemy design.
VHDL
The VHSIC hardware description language, a standardized language for specifying hardware designs at multiple levels of abstraction.
wormhole
A star in a particular domain that internally contains a galaxy in another domain.
Terminology 1-9

ADS Ptolemy
1-10 Terminology

Chapter 2: Integrator ExampleThis chapter is designed for the new user. If you know how to use ADS for Analog/RF Systems design, read quickly through this chapter noting the differences to ADS Ptolemy, such as the use of sinks, Data Flow controller, and Interactive Controls and Displays components.
To learn how to use ADS Ptolemy, let’s load a simple integrator example. We will add a source, an output display item, and a controller, then simulate and view the results.
Copying and Opening Example ProjectFirst, we will copy an example project.
Note
On UNIX platforms, you must copy an example project to a directory for which you have write permission.
On Windows platforms, while you can work in the Example directories, it’s better to copy the examples to another directory.
Copying and Opening Example Project 2-1

Integrator Example
Copy the Project
1. From the Main window, choose File > Copy Project. A dialog box appears.
2. In the From Project field, click the Example Directory button, and then the Browse button. The Copy From File Browse dialog box appears with the examples directories listed.
3. Scroll down the Directories list and double-click Tutorial (directory).
4. Select the project you want to copy:
In Windows: Select integrator_prj from the list of projects, and click OK.
In UNIX: Select integrator_prj from the list of files in the Files list, and click OK.
5. In the To Project field, click the Startup Directory or Working Directory button (depending on where you want to copy the project) or choose the Browse button to select another directory.
6. Choose Copy Project Hierarchy to ensure that all appropriate directories and files will be copied. Choose Open Project After Copy if you want to work with the project now.
7. Click OK to copy the project and close the dialog box.
Open the Project
1. If you did not chooose to automatically open the project after the copy, from the Main window, choose File > Open Project. When the Open Project dialog box appears, select <the directory you copied the example to> in the Directories list:
In Windows: Then select integrator_prj in the list of projects, and click OK. The project will appear in the File Browser field of the Main window. Also, an empty schematic window opens.
2-2 Copying and Opening Example Project

In UNIX: Then double-click integrator_prj in the Files list, and click OK. The project will appear in the File Browser field of the Main window. Also, an empty schematic window opens.
2. Under the integrator_prj project directory, double-click the networks subdirectory to list the various schematics within this project. These will all have the extension .dsn.
3. Double-click integrator1.dsn. In the Design Information field at the right, one item appears.
4. Double-click integrator1 (Schematic). A schematic window opens with the design.
Figure 2-1. Integrator Design
Copying and Opening Example Project 2-3

Integrator Example
Selecting and Placing ComponentsWe will add a sine wave source, an output display item, and a controller to the integrator schematic. There are two ways to choose components:
• From a Palette List You can select items from a palette at the left side of the Schematic window; first select a palette then click on icon(s) in the palette.
• From a Library You can select items by choosing Insert > Component > Component Library. A window opens that displays libraries; select a library then click on component(s) in the library.
Add a Source
1. We will use the Palette List method first. Since the component we want is in the default library, called Common Components, simply click the SinGen icon (near bottom of list). Crosshairs and a ghost image of the component appear as you move the pointer over the design area.
2. Move the crosshairs to the upper left part of the schematic (to the left of the Fork2 component), then click once. A symbol representing the source component is placed in the design area. Beneath the symbol is a block of information with the component name and editable parameters. We will accept the default values.
3. When all components are placed, click the End Command arrow on the toolbar, or press Escape. The crosshairs disappear.
Note If you continue to click without deselecting, you will place a new component with each click.
2-4 Selecting and Placing Components

Add an Output Display
We will continue by adding the output display item. But this time we will use the Library method of selecting components.
1. Choose Insert > Component > Component Library. A dialog box appears that displays components in each component library. From the Libraries list box, select Interactive Controls and Displays (resize the dialog box to show long names).
2. From the right side, select TkPlot. Crosshairs and a ghost image of the component appear as you move the pointer over the design area. (Another TkPlot item is already in the schematic to display the input signal.)
3. Move the crosshairs to the upper right part of the schematic (to the right of the Fork2 component), then click once. A symbol representing the TkPlot display component is placed in the design area.
4. Click the End Command arrow on the toolbar, or press Escape. The crosshairs disappear.
5. Close the Component Library dialog box.
Modify Component Parameters
We will modify two parameters for this item. There are several ways to edit parameters:
• Double-click the component symbol.
• Choose Edit > Component > Edit Component Parameters.
• Click the Edit Component Parameters button on the toolbar.
• Type the parameter value directly on the schematic page. The text changes color. Then edit the value and press Return at the right of the new value. Pressing Return also takes you through subsequent parameters.
We will use the dialog box method.
1. Double-click the TkPlot item. A dialog box appears.
2. Select the xRange parameter (left side). On the right side, backspace over the 100 and type 400.
Selecting and Placing Components 2-5
Integrator Example
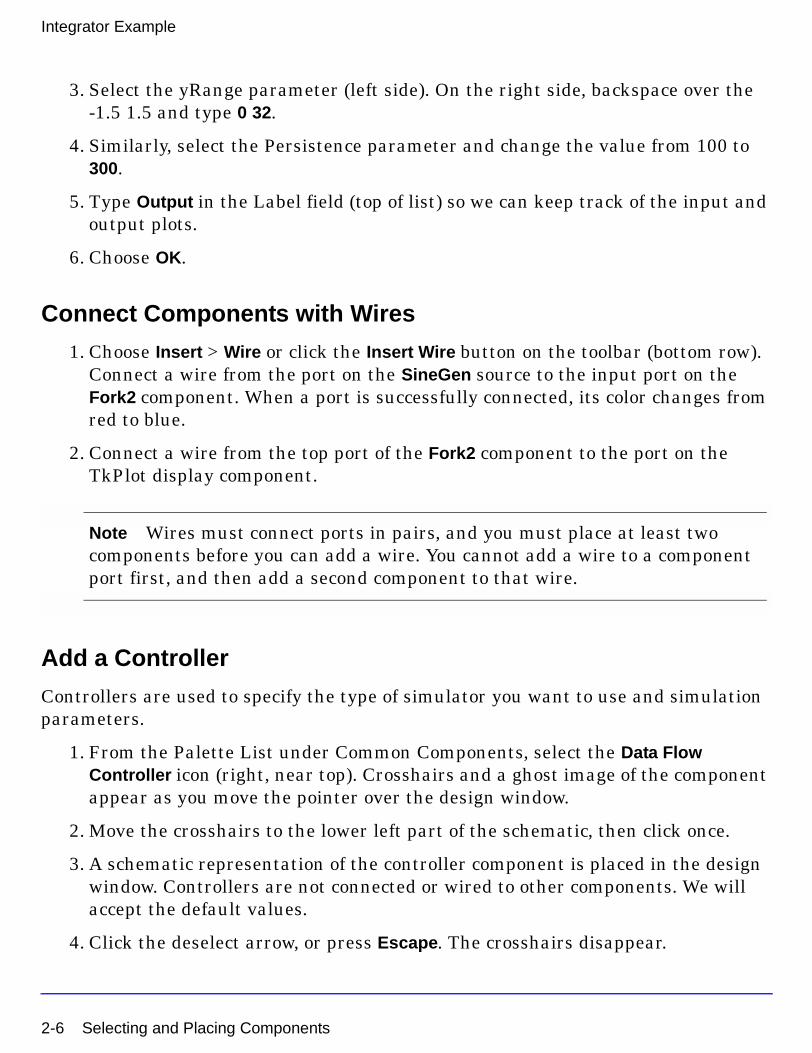
3. Select the yRange parameter (left side). On the right side, backspace over the -1.5 1.5 and type 0 32.
4. Similarly, select the Persistence parameter and change the value from 100 to 300.
5. Type Output in the Label field (top of list) so we can keep track of the input and output plots.
6. Choose OK.
Connect Components with Wires
1. Choose Insert > Wire or click the Insert Wire button on the toolbar (bottom row). Connect a wire from the port on the SineGen source to the input port on the Fork2 component. When a port is successfully connected, its color changes from red to blue.
2. Connect a wire from the top port of the Fork2 component to the port on the TkPlot display component.
Note Wires must connect ports in pairs, and you must place at least two components before you can add a wire. You cannot add a wire to a component port first, and then add a second component to that wire.
Add a Controller
Controllers are used to specify the type of simulator you want to use and simulation parameters.
1. From the Palette List under Common Components, select the Data Flow Controller icon (right, near top). Crosshairs and a ghost image of the component appear as you move the pointer over the design window.
2. Move the crosshairs to the lower left part of the schematic, then click once.
3. A schematic representation of the controller component is placed in the design window. Controllers are not connected or wired to other components. We will accept the default values.
4. Click the deselect arrow, or press Escape. The crosshairs disappear.
2-6 Selecting and Placing Components

There are several types of controllers, the one we have chosen is called the Data Flow controller, which is used to run mixed numeric and timed signal processing simulations.
At this point, your example should look similar to Figure 2-2.
Figure 2-2. Integrator Design with Source, Display, and Controller Items
If you have had difficulty building the design, you can select the completed schematic from your directory you copied the example project to earlier. Select integrator1_complete.dsn.
Selecting and Placing Components 2-7
Integrator Example
Starting Simulation Now that we have a completed schematic, we’re ready to start a simulation. ADS provides flexibility in this task. In our example, we have placed an interactive display item called TkPlot. This item quickly displays the results of your simulation. Later we will substitute a Sink item in the schematic that will save the simulation results to a file. We will then use the Data Display to review our results.
Simulate and Display Data Directly
1. Choose Simulate > Simulate. The simulation begins. A status window appears that provides information on your simulation or reports errors.
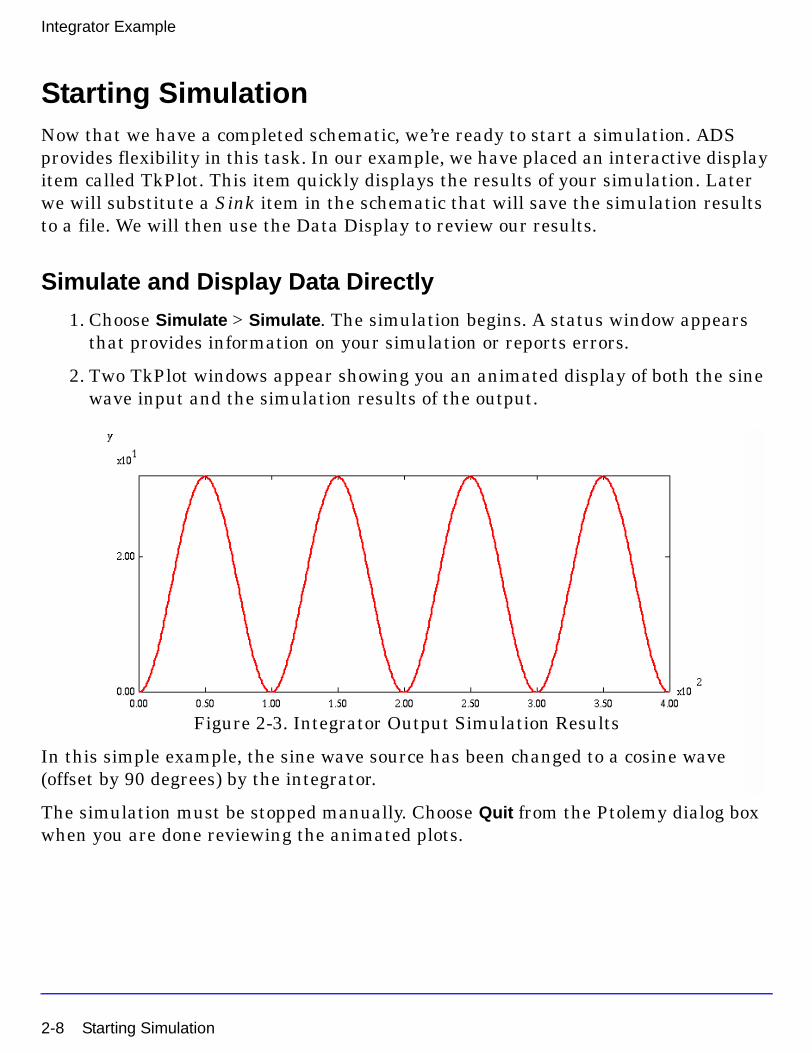
2. Two TkPlot windows appear showing you an animated display of both the sine wave input and the simulation results of the output.
Figure 2-3. Integrator Output Simulation Results
In this simple example, the sine wave source has been changed to a cosine wave (offset by 90 degrees) by the integrator.
The simulation must be stopped manually. Choose Quit from the Ptolemy dialog box when you are done reviewing the animated plots.
2-8 Starting Simulation

Simulate and Save Data
Now we will use the alternate approach where we substitute a Sink component in the schematic and save the data.
1. Click the output TkPlot item in your schematic to select it.
2. Press the Delete key or choose the Delete (trash can) icon from the toolbar.
3. From the Common Components Palette List, select the Numeric icon (NumericSink). Crosshairs appear.
4. Place the NumericSink where the TkPlot item was originally.
5. Double-click the NumericSink to edit the sink parameters.
6. Accept the Start default of DefaultNumericStart.
7. Select Stop and change the value to 200. Here we show that a sink can override the Data Flow controller’s Stop value. Typically, a sink can be left at its default and you can control simulation from the Data Flow controller.
8. Choose OK.
9. Choose Simulate > Simulation Setup. The Simulation Setup dialog box appears where you can explicitly name a dataset.
Starting Simulation 2-9

Integrator Example
10. In the Dataset field, type myresults. This becomes the filename of your simulation results. Accept the other defaults.
11. Choose the Simulate button. The simulation begins. A status window appears that gives information on your simulation or reports errors.
This time, your data is saved to disk where it can be used to display results in a variety of formats, or be used in post-processing procedures. In addition, the input TkPlot displays an animated plot for the input. Click Quit to dismiss this display.
1. Choose Window > New Data Display. The Data Display window opens.
2. From the drop-down list, select myresults. This list is called the Default Dataset list.
3. Click Rectangular Plot in the Plot Types palette list. A ghost rectangular frame appears.
Rectangular Plot Default Dataset drop-down list
2-10 Starting Simulation

4. Click once to place the frame in the Data Display window. The Plot Traces & Attributes dialog box appears:
1. Select data item N1.
2. Click Add to adddata you want to display.
Starting Simulation 2-11
Integrator Example
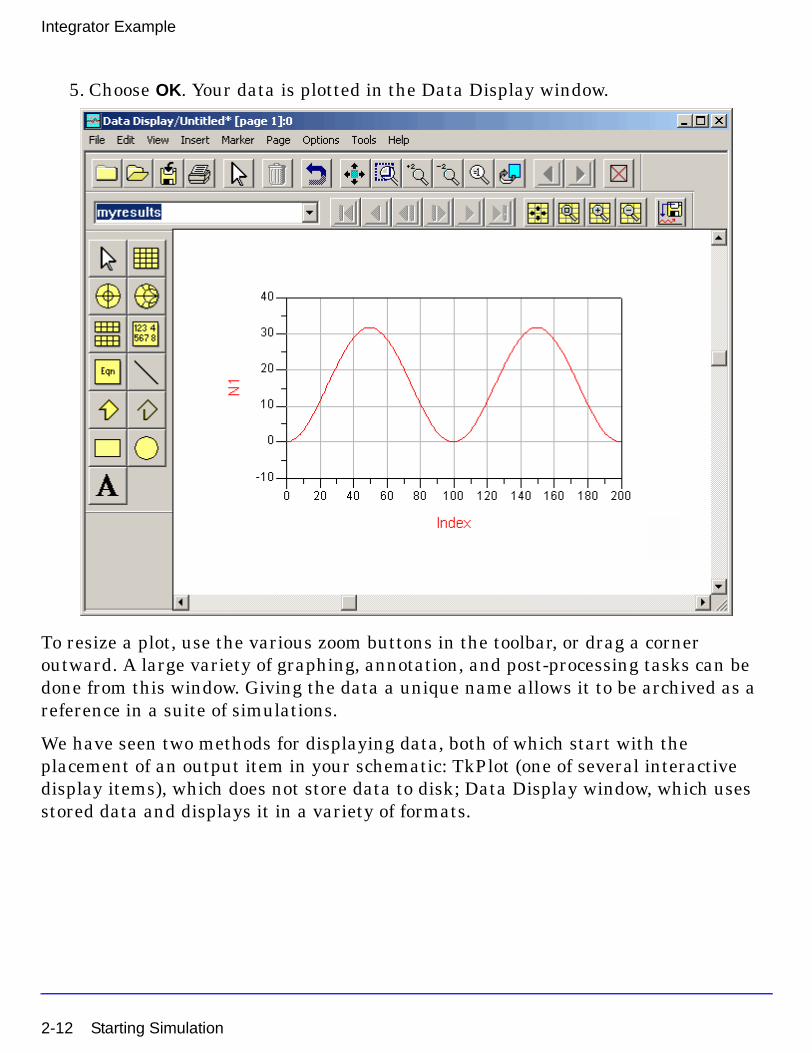
5. Choose OK. Your data is plotted in the Data Display window.
To resize a plot, use the various zoom buttons in the toolbar, or drag a corner outward. A large variety of graphing, annotation, and post-processing tasks can be done from this window. Giving the data a unique name allows it to be archived as a reference in a suite of simulations.
We have seen two methods for displaying data, both of which start with the placement of an output item in your schematic: TkPlot (one of several interactive display items), which does not store data to disk; Data Display window, which uses stored data and displays it in a variety of formats.
2-12 Starting Simulation

Chapter 3: Data Types, Controllers, Sinks, and ComponentsBefore continuing to use ADS Ptolemy, let’s look at some of the concepts you may have questions about and introduce the signal processing components that ADS Ptolemy uses.
Representation of Data TypesADS Ptolemy components have stems of different colors and thicknesses that are based on the data type (this differs from Analog/RF Systems components). Table 3-1 lists the data types.
Note For some applications, particularly those using timed components, data types can be thought of as signal types. Regardless of the terminology, packets of data are passed from one component to another.
Figure 3-1 shows the thicker stem width associated with matrix data compared to the thinner stem width associated with scalar data.
Table 3-1. Data Type Representation
Data Type Stem Color Stem Thickness
Scalar Fixed Point Magenta Thin
Scalar Floating Point (Real) Blue Thin
Scalar Integer Orange Thin
Scalar Complex Green Thin
Scalar Timed Black Thin
Matrix Fixed Point Magenta Thick
Matrix Floating Point (Real) Blue Thick
Matrix Integer Orange Thick
Matrix Complex Green Thick
Any Type Red Thin
Representation of Data Types 3-1

Data Types, Controllers, Sinks, and Components
Figure 3-1. Matrix Data (Thick Lines) Versus Scalar Data (Thin Lines)
Components have single or multiple arrowheads at inputs or outputs.
• Single arrowheads carry one distinct signal.
• Multiple arrowheads carry more than one distinct signal.
For example, a multiple input multiplier component has multiple arrowheads at the input and a single output arrowhead, as shown in Figure 3-1.
BusMerge items can be used to connect multiple signals to a component when the signal order must be specified. Similarly, BusSplit items can be used to split signals to multiple outputs.
3-2 Representation of Data Types

Automatic or Manual Data Type ConversionWhen you connect components of the same data type (color), data is copied from one component to another. If you connect components represented by different data types, such as scalar complex to scalar floating-point (real), or scalar integer to matrix integer, consider two things about conversion:
• Should I place a conversion component in the schematic or let the software automatically do the conversion?
• What will happen to my data?
Although the software will automatically convert dissimilar data types, such as complex to floating-point (real), place an appropriate converter (from the Signal Converters library) in your schematic. This acts as a visual reminder that a conversion is taking place, and also helps you decode error messages that may arise. Automatic conversion means that an appropriate converter is spliced in behind the scenes and is not shown on the schematic.
Automatic conversion is allowed among scalar data types and among matrix data types, but not between scalar and matrix data types.
For Timed pins, there are two cases when automatic splicing produces an error message:
• When either a Float (real) to Timed, Fixed to Timed, Integer to Timed, or Complex to Timed converter is placed (or spliced) in the design and there is no time step defined (via sources or other timed converters) in the design. You must define the time step at least once in your design.
• When a Complex port is connected to a Timed port. Automatic conversion from Complex to Timed is not supported. You must place a Complex to Timed converter between the ports and enter appropriate parameters.
When a scalar pin is directly connected to a matrix pin (or vice versa), without a Pack or Unpack converter, an error message is generated.
In the Numeric Matrix Library, four converters are used to pack scalar data into matrix data, such as Pack_M and PackCx_M. Similarly, four converters unpack the data (back to scalar), such as UnPk_M and UnPkCx_M. There is no automatic conversion between scalar and matrix data (or vice versa); you must place the converters where needed in your design.
Automatic or Manual Data Type Conversion 3-3

Data Types, Controllers, Sinks, and Components
What Happens During Conversion?
Most conversions do what you expect. For example, when converting from lower precision to higher precision data types, such as integer to floating-point (real), no data is lost; only the format is changed.
When converting from higher precision to lower precision data types, such as floating-point (real) to integer, the outcome is governed by your computer’s math rounding rules, with the following exceptions:
• Complex to Float (Real) ADS Ptolemy calculates the magnitude and ignores the phase.
• Complex to Fixed After calculating the floating-point (real) magnitude, ADS Ptolemy converts the floating-point (real) to fixed.
• Complex to Integer After calculating the floating-point (real) magnitude, ADS Ptolemy converts the floating-point (real) to integer.
Timed Data Conversions
The Timed data type represents the time-domain signal in either carrier-modulated (complex) or real-baseband flavors. The Timed data class members are I, Q, Fc, time, plus an ADS Ptolemy member called Flavor. Flavor specifies whether the Timed data type is in a carrier-modulated or real-baseband format. When the carrier frequency is not specified (undefined) for a Timed port, an error message is generated.
You can convert between Timed and non-Timed ports by placing one of the following converters and supplying the parameters as needed:
• Timed to Complex or Complex to Timed
• Timed to Float (Real) or Float (Real) to Timed
• Timed to Fixed or Fixed to Timed
• Timed to Integer or Integer to Timed
Time-data conversion depends on the flavor of the Timed data and the carrier frequency.
For more detailed information on conversion of data types, refer to “Conversion of Data Types” on page 5-5.
3-4 Automatic or Manual Data Type Conversion

ControllersControllers, used to control simulation, are placed unconnected any where in the schematic, and are found in the Controllers library or palette. The DF (data flow) controller controls the flow of mixed numeric and timed signals for all digital signal processing simulations within ADS. Other controllers are used to set up parameter sweeps, optimization, or statistical design. To set or modify the parameters using a dialog box, double-click the component in the schematic, or choose Edit > Component > Edit Component Parameters.
DF (Data Flow) Controller
The DF (data flow) controller is required for all simulations. Use the DF controller to control the flow of mixed numeric and timed signals for all digital signal processing simulations within ADS. This controller, together with source and sink components, provide the flexibility to control the duration of simulation globally or locally.
Important Multiple DF controllers on the schematic are not allowed.
Versions of ADS Ptolemy released before ADS 1.5 allowed multiple DF controllers on the same schematic. Starting with ADS 1.5, this is no longer possible. Multiple controllers were used to simulate the same design with different DF parameters, for example with a different value of DefaultNumericStart. You can achieve the same effect by using single-point sweeps on the parameter you are interested in varying.
The DF controller dialog box has the Controls, Options, Output, Resistors, Debug, and Display tabs, which are described in the following sections.
Controllers 3-5

Data Types, Controllers, Sinks, and Components
Controls Tab
ADS Ptolemy sinks have Start and Stop parameters that control when to start and stop data collection. Sinks collect from Start to Stop, inclusively.
In numeric sinks, these numbers are unitless because they represent sample numbers. The first data that the sink receives is #0, the second is #1, etc. For example, a numeric sink with Start=3 and Stop=4 will skip the first three pieces of data and collect the next two.
In timed sinks, Start and Stop have timed units because the data has a time base. The amount of data that the sink collects is a function of both the data time base and the sink’s Start and Stop parameters. For example, if Start=0 msec, Stop=1 msec, and the data has a time base of 2 µsec, the sink will collect 501 pieces of data.
The Controls tab contains global parameters that are the default values for the sink’s start and stop parameters. Numeric sinks’ start and stop parameters are set to DefaultNumericStart and DefaultNumericStop. Timed sinks’ start and stop parameters are set to DefaultTimeStart and DefaultTimeStop. Default values for these DF controller values are 0, 100, 0 µsec, and 100 µsec, respectively.
Sinks can control simulation locally with their own start and stop times, or they can use the appropriate DF parameter to inherit control. By default, all sinks inherit start and stop times from the controller. You can inherit none, one, or both of the start and stop times.
Because these DF parameters function as variables inside the simulation, they can be used inside expressions or overridden in a hierarchal fashion. For example, you could set a numeric sink’s parameters to Start=DefaultNumericStart and Stop=DefaultNumericStop*2.
3-6 Controllers

Options Tab
The options tab has the following parameters:
DefaultSeed Enter an integer to seed the random number generator. The default is 1234567.
DefaultSeed is used by all random number generators in the simulator, except those components that use their own specific seed parameter. DefaultSeed initializes the random number generation. The same seed value produces the same random results, thereby giving predictable simulation results.
To generate repeatable random output from simulation to simulation, use any positive seed value. For the output to be truly random, enter a seed value of 0.
OutVar
Note OutVar is an obsolete parameter. Use the Output tab (refer to “Output Tab” on page 3-9) and the OutputOption controller (refer to “OutputOption Controller” on page 3-12).
OutVar is a space-separated list of variable names defined using variables and equations (VAR) components. Values are sent to the Data Display window. In the case of hierarchical designs, in order to send variables that are at a level other than the top-most level, use the complete path to the variables, which must be period (.) delimited.
Controllers 3-7

Data Types, Controllers, Sinks, and Components
Example:
OutVar="freq1 freq2 X1.amplitude X2.X4.temp"
In this case, there are four variables to be sent to the Data Display: freq1, freq2, amplitude, and temp, each separated with a space. The variable amplitude is contained in subnetwork X1, while the variable temp is contained in subnetwork X4, which in turn is contained in subnetwork X2. These subnetworks are delimited with periods.
Note ADS places a set of quotes around the OutVar variable. Do not enter your own quotes as the double set will cause simulation failure.
The global character * is no longer supported.
SchedulerType The Scheduler Type enables you to run the simulation based on options from the drop-down list:
• Cluster Loop Scheduler (default) Optimized for multirate graphs with feedback cycles.
• Classical Scheduler For uni-rate graphs with cycles.
• Hierarchical Scheduler For multirate graphs with disconnected graphs.
• Multithreaded Scheduler Optimized for multiprocessor machines.
• Multirate Scheduler Optimized for large-scale or heavily multi-rate graphs.
No matter which scheduler is chosen, the simulation results will be the same. The difference is in the time and memory needed to set up and run the simulation. It’s best to start with the default, and experiment with the others as needed. For more information on these schedulers, refer to “How Schedulers Work” on page 9-4.
DeadlockManager The Deadlock Manager enables you to manage design deadlocks. A deadlock occurs when a feedback loop does not have a delay in its feedback path, or when a Delay item does not initialize the proper number of signal tokens. A static schedule (required for simulation) can only be derived in a design with no schedule deadlocks.
Select the type of deadlock management from the drop-down list:
• Report deadlock (default) Indicates the design includes deadlocks.
3-8 Controllers

• Identify deadlocked loops Enables you to spot which loops are deadlocked. These loops can be highlighted on the schematic page by clicking on the error message or Status window.
• Resolve deadlock by inserting tokens Adds delays to deadlock loops and allows the simulator to proceed.
CktCosimInputs This option controls the initialization method on the input pins of Analog/RF circuits during cosimulation. The option applies initialization to all cosimulation circuit subnetworks. (Refer to Chapter 11, Cosimulation with Analog/RF Systems for information regarding how to set up an ADS Ptolemy A/RF cosimulation.) Select the type of input initialization method from the drop-down list:
• No change (default) No special initialization.
• Initialize with zero volts Initialize the first data of all input pins to 0; basically, the first data value is discarded.
• Insert one time step delay Insert one extra data with 0 value to all input pins, delaying everything by one time step.
Output Tab
The Output tab enables you to selectively save simulation data to a dataset. For details, refer to Selectively Saving and Controlling Simulation Data in Using Circuit Simulators > Simulation Basics > Saving and Controlling Simulation Data.
Note that Node Voltages are supported only on A/RF controllers; therefore, you will not find this option available on the Data Flow Controller’s Output tab.
Controllers 3-9

Data Types, Controllers, Sinks, and Components
Resistors Tab
The Resistors tab controls global parameters related to resistor behavior. As in the Controls tab, these parameters act as variables inside the simulation. Overriding the resistor values in a hierarchal fashion can be especially useful. For example, a large design can have a subcircuit representing a component being tested. By setting the DefaultRTemp inside the Data Flow controller to -273.15, and placing a VAR block with a DefaultRTemp setting inside the subcircuit, you can easily add resistor noise to the subcircuit only.
DefaultRIn is the default input impedance of timed components; its value is 50 ohms.
DefaultROut is the default output impedance of timed components; its value is 50 ohms.
DefaultRLoad is the default input impedance of timed sinks and the default impedance of solitary resistors (the R component); its value is 1.0e18 ohms, representing an infinite load.
DefaultRTemp is the default temperature of resistors; its value is -273.15 Celsius (0 K), so by default there is no thermal noise.
Debug Tab
The Debug tab can be used to provide the ability to debug your design and its custom components.
Schedule Log File enables you to specify the file name for a log file. After simulation, the log file you specified will be generated under the /data directory of the project. It will log the firing schedule of components in your design.
3-10 Controllers
Profile Times File enables you to specify the file name for a file containing simulation information. After simulation, the file will be located under the /data directory of the project. It provides run-time information for components in your design during simulation. For example, information may include the number of times a component is fired or the average time.
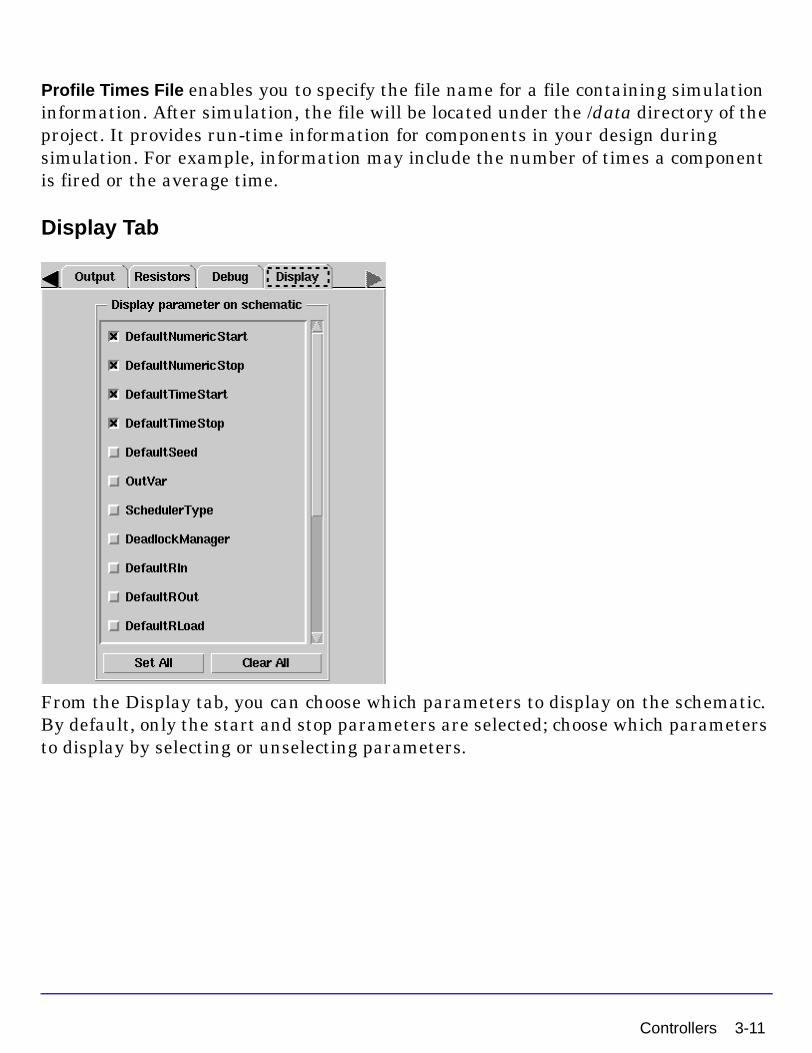
Display Tab
From the Display tab, you can choose which parameters to display on the schematic. By default, only the start and stop parameters are selected; choose which parameters to display by selecting or unselecting parameters.
Controllers 3-11

Data Types, Controllers, Sinks, and Components
OutputOption Controller
Description: Output Option for Dataset TemplatesLibrary: Controllers
Parameters
Notes/Equations
1. The OutputOption controller is used to specify the data display template(s) for Wireless Test Bench (WTB) used in RFDE.
2. All listed data display template(s) will be automatically inserted into an Autoplot data display window in RFDE after simulation.
3. The string value of DatasetTemplate should be the name of only one data display template file and should not contain the data display template file extension (.ddt).
4. To list more than one template name, use the Add button on the component dialog box to add additional DatasetTemplate parameters, each of which should have a string value for only one template.
5. A blank space (" ") value for DatasetTemplate will be ignored.
Name Description Default Type Range
DatasetTemplate Dataset Template name (repeatable)
string
3-12 Controllers

WTB Controller
Description: Controller for Wireless Test BenchLibrary: Obsolete (not to be discontinued) Controllers
Parameters
There are no parameters for this controller.
Notes/Equations
Note This controller is obsolete for new designs. (It is available only for compatibility with designs created with ADS 2005A or earlier.) There are no plans to remove this controller from future ADS releases; however, enhancements or fixes of any existing defects will not be made.
Please use the revised method for creating wireless test benches described in Appendix A, Wireless Test Bench Designs.
1. The WTB controller is used to verify a wireless test bench design created in ADS before exporting the design to RFDE as a WTB model.
For details about creating these designs, see appendix A, “Creating Wireless Test Bench Designs for RFDE” in the ADS Ptolemy Simulation documentation for ADS 2005A or earlier.
2. The WTB model created in ADS is a subcircuit that must contain output pins and input pins followed by EnvOutShort or EnvOutSelector. The WTB model subcircuit must also have a DF controller with the correct setup. The WTB model simulates a RFIC Design Under Test (DUT) and reads the data back from the DUT to do complex measurements.
3. The WTB subcircuit created in ADS should be verified before exporting the WTB design to RFDE. To verify the WTB subcircuit open a new DSP schematic window, and add a WTB controller along with the instance of the WTB model subcircuit, a DUT, and an Envelope controller. The WTB controller enables a cosimulation between the Envelope controller and the DF controller inside the WTB model subcircuit.
Controllers 3-13

Data Types, Controllers, Sinks, and Components
4. The Envelope controller must be added along with an instance of the DUT subcircuit created using Analog/RF components. The Envelope controller can be added to the WTB verification design (DSP schematic) by opening an Analog/RF schematic window, adding an Envelope controller in this window, then copy and paste the Envelope controller into the WTB verification design window.
5. The WTB simulation in ADS will ignore the OutputOption controller that has been placed in the WTB subcircuit (see “OutputOption Controller” on page 3-12). This means that the data display window with the templates defined in the OutputOption controller will not be opened automatically in ADS. These templates open only in RFDE.
3-14 Controllers

VarEqnCheck
Description: Check value range from a variable or expressionLibrary: Controllers
Parameters
Notes/Equations
1. Use VarEqnCheck to check the value range limits of a parameter defined either in a VAR item (variable or expression) or defined as a subnetwork parameter.
2. ParameterRange performs parameter value range test on the value defined by ParameterValue. ParameterRange should be a boolean expression that evaluates to 1 when the range test is successful. A range test is considered to be a failure when ParameterRange is zero and results in display of the message defined by Message.
3. ReportValue, when set to YES, results in display of the ParameterValue along with the Message when the ParameterRange is zero.
4. Type is the type of message displayed.
Name Description Default Type Range
ParameterRange Boolean expression for the parameter range check (value of 1 means ParameterValue within range limits)
X>=1 int
ParameterValue Optional value that can be reported when a message is to be displayed
X real
ReportValue Report parameter value NO query NO, YES
Type Range check message type Warning enum Warning, Status message, Initialization error, Abort simulation error, Standard
Message Message to display if ParmeterRange evaluates to 0 ‘X is out of range, it should be >=1’
string
Controllers 3-15

Data Types, Controllers, Sinks, and Components
5. When Type is Warning, then the range test is performed during simulation. A range test failure (ParameterRange=0) results in display of the Message in the Simulation Message window (and optionally ParameterValue when ReportValue=YES ) and continuance of the simulation.
6. When Type is Status message, then the range test is performed during simulation. A range test failure (ParameterRange=0) results in display of the Message in the Simulation Status window (and optionally ParameterValue when ReportValue=YES ) and continuance of the simulation.
7. When Type is Initialization error, then the range test is performed during simulation initialization before simulation begins. A range test failure (ParameterRange=0) results in display of the Message in the Simulation Message window (and optionally ParameterValue when ReportValue=YES). The simulation will continue for the remainder of the simulation initilization and will quit after all initialization errors are detected.
8. When Type is Abort simulation error, then the range test is performed during simulation. A range test failure (ParameterRange=0) results in display of the Message in the Simulation Message window (and optionally ParameterValue when ReportValue=YES ) and simulation will quit.
3-16 Controllers

Sources and Sinks Control the SimulationADS Ptolemy simulation is controlled by the sources and sinks you place on your schematic. There must be at least one source or sink that is controlling the simulation. All sinks and many sources have a ControlSimulation parameter that is set to YES or NO. Controlling sinks and sources keep the simulation running; non-controlling sinks and sources do not.
Sinks
Sinks are components with no outputs. When a sink controls the simulation (ControlSimulation=YES), data collection always begins at the input sample with an index value equal to the value of the Start time parameter. The data collection ends with an index value equal to the value of the Stop time parameter. (One or both of the Start and Stop times might be inherited from the Data Flow controller.) By default, a sink’s ControlSimulation parameter is set to YES. When a sink is not controlling the simulation (ControlSimulation=NO), it will start collecting data at Start, then collect as much data as the simulation produces. Consider the following example:
Sources and Sinks Control the Simulation 3-17

Data Types, Controllers, Sinks, and Components
As shown, both sinks will collect 101 data samples (0 to 100 inclusive). They are both controlling sinks so they will obey their start and stop index times. Because of the DownSample, sink N2 will receive more data but it will not collect it.
Changing one of the sinks ControlSimulation parameters to NO will cause N2 to collect twice as much data as N1. If N1 is the controller, then it will collect 101 samples, and N2 will collect 202. If N2 is the controller, then it will collect 101 samples, and N1 will collect 50.
This example demonstrates a useful way to design a schematic with multiple sinks. Choose one sink to control the simulation, and set all other sinks’ ControlSimulation parameters to NO. In this manner, your sinks will collect appropriate amounts of data according to the multirate characteristics of your schematic.
Sources
Sources are components with no inputs. Sources that read from files, instruments, and data sets also have a ControlSimulation parameter. By default, its value is NO. When a source is controlling the simulation, it will keep the simulation running long enough to output all its data. Controlling sources can be used to create designs that process all the data in a file, as shown next.
3-18 Sources and Sinks Control the Simulation

In this example, the SDFRead component is controlling the simulation, and the TimedSink parameter is not in control. The TimedSink will collect all the data available in the file. This example demonstrates another useful way to design schematics: control the simulation with a source, and set all the sinks’ ControlSimulation parameters to NO.
In the example, if both components’ ControlSimulation parameters were flipped so that only the TimedSink was in control, then it would collect enough data to meet its Start and Stop parameters. If that were more data than was available in the file, then the SDFRead component would repeat its data or zero pad according to its Periodic parameter. If that were less data than was available in the file, then the SDFRead would not output the entire file.
It’s possible to set both components’ ControlSimulation parameters to YES. In that case, and if the file had more data than the TimedSink’s Start and Stop required, then the SDFRead would output the entire file, but the TimedSink would ignore any data received after its Stop.
Sources and Sinks Control the Simulation 3-19

Data Types, Controllers, Sinks, and Components
ADS Ptolemy ComponentsThe component libraries available for use with signal processing designs using the ADS Ptolemy simulator are listed in Table 3-2. Reference information for each component is available by choosing Help, either from the parameters dialog box for a specific component, or from the Help menu.
Get to know the available components by choosing Insert > Component > Component Library, resizing the dialog box so you can read the complete names, and browsing through the list.
Note If you have purchased and installed ADS Design Library products, such as the CDMA, cdma2000, GSM, EDGE, DTV, 1xEV, TDSCDMA, WLAN, or W-CDMA3G design libraries, they will be displayed in the list, in alphabetical order.
Table 3-2. ADS Ptolemy Component Libraries
Library Summary of Contents
Antennas & Propagation Components for radio channel, including antennas and propagation models. The channel models provide built-in functionality based on various standards: 1xEV, 3GPP, DTV, GSM, TDSCDMA, CDMA, WLAN.
Circuit Cosimulation Items used to set up cosimulation with analog/RF circuits.
Common Components A factory list of the most commonly-used components.
Controllers Items that control simulation parameters.
HDL Blocks HDL cosimulation components.
Instruments Components used to link data to instruments, such as the 89600 Vector Signal Analyzer.
Interactive Controls and Displays Components that control and interactively display real-time simulation results. Data is not saved.
Numeric Advanced Comm Components that provide functions for simulation of advanced communication systems based on the latest communication technologies including wireless metropolitan access networks (WMAN), wireless local access networks (WLAN), and wireless personal access networks (WPAN).
Numeric Communications Components that perform numeric communications functions such as ADPCM coder, QAM encoder, Viterbi decoder, modulation, demodulation, scrambler, spreader.
Numeric Control Items that manipulate data flow during simulation: commutators, multiplexers, demultiplexers, upsamplers, and forks.
Numeric Fixed Point DSP Bit-accurate DSP models (adders, registers, etc.) with behavioral C++ simulation code.
Numeric Logic Contains Boolean operators, such as and, or, equals, greater than, etc.
Numeric Math Components that perform math functions, such as adders, multipliers, integrators, log, sine, cosine.
Numeric Matrix Components that receive and/or produce vector or matrix signals at their input and output, such as add and multiply. Also contains MATLAB components and components used for converting scalar to matrix.
3-20 ADS Ptolemy Components

Numeric Signal Processing Components that perform basic discrete-time DSP functions, such as FIR filter, IIR filter and adaptive filter, and DTFT.
Numeric Sources Contains sources (items having output only) that produce numeric signals. This includes sources that output scalar, matrix, and random signals.
Numeric Special Functions Miscellaneous items. Typically nonlinear operations such as quantizing, limiting, or triggering on input signals.
Signal Converters Converts signal (data) types, from one type to another, for example, CxToFloat (complex to floating-point (real)). Others include integer, fixed, or timed.
Sinks Data collection items or data processed as measurements, such as numeric sink, BER sinks, or EVM sink.
Timed Data Processing Data processing components that operate on time-domain baseband waveforms, e.g., multilevel symbol coders and converters, IQ data coders.
Timed Filters Time-domain lowpass and bandpass analog filters for filtering baseband or RF signals.
Timed Linear Various linear operations for time-domain analog baseband and RF signals, e.g., waveform delay, split, sum, sample, switch.
Timed Modem Analog RF modulators, demodulators, and carrier recovery for AM, FM, PM, QAM, QPSK, GMSK, MSK, DQPSK, and Pi/4 DQPSK formats.
Timed Nonlinear Various nonlinear time-domain operations for time-domain analog baseband and RF signals, e.g., nonlinear gain, RF mixers, RF multipliers, rectifiers, signal sampling, or phase detectors.
Timed RF Subsystems RF subsystem components, such as RF combiner, RF modulator, or RF demodulator.
Timed Sources Time-domain signal generators for baseband and RF signals, e.g., AM, FM, PM, QAM, clock, sinusoid, pulsed, or video.
Table 3-2. ADS Ptolemy Component Libraries (continued)
Library Summary of Contents
ADS Ptolemy Components 3-21

Data Types, Controllers, Sinks, and Components
3-22 ADS Ptolemy Components

Chapter 4: Understanding Parameters
Value TypesADS Ptolemy requires specific parameter value types (string, real array, or complex) for the component parameter values you enter in schematic designs.
Component parameter values can be entered several ways:
• Editing the component parameters dialog box. Double-click the component symbol on the schematic, the dialog box appears. Parameter values can be selected from lists or entered. The dialog box lists the value type expected, such as real or integer.
• Editing values directly on the schematic. Click the parameter value and type.
• Editing default values in the Design Definition dialog box. Choose File > Design/Parameters > Parameters tab. A type of parameter value can be selected from the Value Type list, and a default value can be entered in the Default Value field.
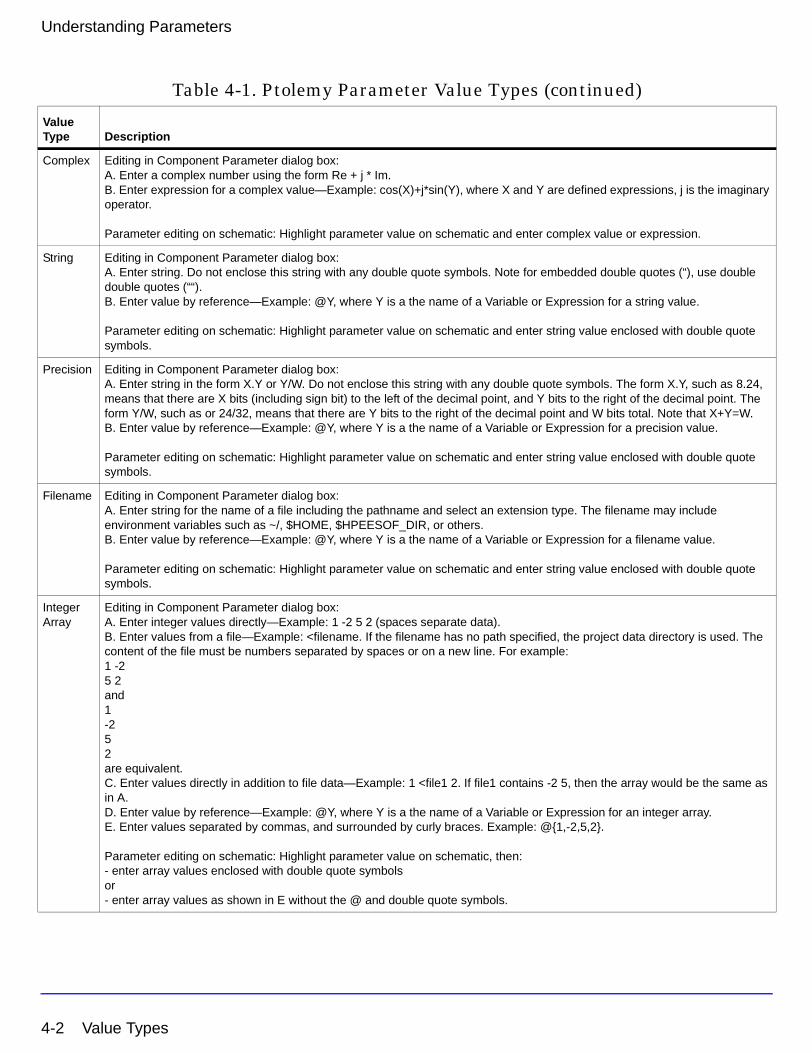
Table 4-1 describes each value type.
Table 4-1. Ptolemy Parameter Value Types
Value Type Description
Real Editing in Component Parameter dialog box:A. Enter real number.B. Enter expression for a real value—Example: X*cos(Y), where X and Y are defined expressions.
Parameter editing on schematic: Highlight parameter value on schematic and enter real value or expression.
Integer Editing in Component Parameter dialog box:A. Enter integer.B. Enter expression for an integer value—Example: X+Y, where X and Y are defined expressions.
Parameter editing on schematic: Highlight parameter value on schematic and enter integer value or expression.
Fixed Point
Parameter editing in Component dialog box:A. Enter real value, but the value used will be based on the precision used with this parameter.B. Enter expression for a real value—Example: X*cos(Y), where X and Y are defined expressions.
Parameter editing on schematic: Highlight parameter value on schematic and enter real value or expression.
Value Types 4-1
Understanding Parameters
Complex Editing in Component Parameter dialog box:A. Enter a complex number using the form Re + j * Im.B. Enter expression for a complex value—Example: cos(X)+j*sin(Y), where X and Y are defined expressions, j is the imaginary operator.
Parameter editing on schematic: Highlight parameter value on schematic and enter complex value or expression.
String Editing in Component Parameter dialog box:A. Enter string. Do not enclose this string with any double quote symbols. Note for embedded double quotes (“), use double double quotes (““).B. Enter value by reference—Example: @Y, where Y is a the name of a Variable or Expression for a string value.
Parameter editing on schematic: Highlight parameter value on schematic and enter string value enclosed with double quote symbols.
Precision Editing in Component Parameter dialog box:A. Enter string in the form X.Y or Y/W. Do not enclose this string with any double quote symbols. The form X.Y, such as 8.24, means that there are X bits (including sign bit) to the left of the decimal point, and Y bits to the right of the decimal point. The form Y/W, such as or 24/32, means that there are Y bits to the right of the decimal point and W bits total. Note that X+Y=W. B. Enter value by reference—Example: @Y, where Y is a the name of a Variable or Expression for a precision value.
Parameter editing on schematic: Highlight parameter value on schematic and enter string value enclosed with double quote symbols.
Filename Editing in Component Parameter dialog box:A. Enter string for the name of a file including the pathname and select an extension type. The filename may include environment variables such as ~/, $HOME, $HPEESOF_DIR, or others.B. Enter value by reference—Example: @Y, where Y is a the name of a Variable or Expression for a filename value.
Parameter editing on schematic: Highlight parameter value on schematic and enter string value enclosed with double quote symbols.
Integer Array
Editing in Component Parameter dialog box:A. Enter integer values directly—Example: 1 -2 5 2 (spaces separate data).B. Enter values from a file—Example: <filename. If the filename has no path specified, the project data directory is used. The content of the file must be numbers separated by spaces or on a new line. For example:1 -25 2and 1-252are equivalent.C. Enter values directly in addition to file data—Example: 1 <file1 2. If file1 contains -2 5, then the array would be the same as in A.D. Enter value by reference—Example: @Y, where Y is a the name of a Variable or Expression for an integer array.E. Enter values separated by commas, and surrounded by curly braces. Example: @{1,-2,5,2}.
Parameter editing on schematic: Highlight parameter value on schematic, then:- enter array values enclosed with double quote symbolsor- enter array values as shown in E without the @ and double quote symbols.
Table 4-1. Ptolemy Parameter Value Types (continued)
Value Type Description
4-2 Value Types

Fixed Point ArrayorReal Array
Editing in Component Parameter dialog box:A. Enter fixed-point values directly—Example: 1.2 -2.3 5.6 2.8 (spaces separate data).B. Enter values from a file—Example: <filename. If the filename has no path specified, the project data directory is used. The content of the file must be numbers separated by spaces or on a new line. For example:1.2 -2.35.6 2.8and 1.2-2.35.62.8are equivalent.C. Enter values directly in addition to file data—Example: 1.2 <file1 2.8. If file1 contains -2.3 5.6, then the array would be the same as in A.D. Enter value by reference—Example: @Y, where Y is a the name of a Variable or Expression for a fixed-point or real array.E. Enter values separated by commas, and surrounded by curly braces. Example: @{1.2,-2.3,5.6,2.8}.
Parameter editing on schematic: Highlight parameter value on schematic, then:- enter array values enclosed with double quote symbolsor- enter array values as shown in E without the @ and double quote symbols.
Complex Array
Editing in Component Parameter dialog box:A. Enter complex values directly as ordered pairs separated by a comma (optional spaces may follow the comma). Each ordered pair must be enclosed in parentheses, and separated from other ordered pairs by spaces. Example: (1.2,2.5) (-2.3,1.3) (5.6, -1.4) (2.8, 3.4)B. Enter values from a file—Example: <filename. If the filename has no path specified, the project data directory is used. The content of the file must be ordered pairs of numbers separated by a comma (optional spaces may follow the comma). Each ordered pair must be enclosed in parentheses, and separated from other ordered pairs by spaces or on a new line. For example:(1.2, 2.5) (-2.3, 1.3) (5.6, -1.4)(2.8, 3.4)and (1.2, 2.5)(-2.3, 1.3)(5.6, -1.4)(2.8, 3.4)are equivalent.C. Enter values directly in addition to file data—Example: (1.2,2.5) <file1 (2.8,3.4). If file1 contains (-2.3, 1.3) (5.6, -1.4), then the array would be the same as in A.D. Enter value by reference—Example: @Y, where Y is a the name of a Variable or Expression for a complex array.E. Enter values separated by commas, and surrounded by curly braces. Complex values must be entered using the format a+j*b. Example:@{1.2+j*2.5, -2.3+j*1.3, 5.6-j*1.4, 2.8+j*3.4}
Parameter editing on schematic: Highlight parameter value on schematic, then:- enter array values enclosed with double quote symbolsor- enter array values as shown in E without the @ and double quote symbols.
Table 4-1. Ptolemy Parameter Value Types (continued)
Value Type Description
Value Types 4-3

Understanding Parameters
To define or see the list of value types for a schematic design, from a Signal Processing Schematic window, choose File > Design/Parameters > Parameter. The list of parameter types available for a schematic design can be seen by selecting the Value Type drop-down list.
All parameter types except Enumerated, are directly available to define parameters in a schematic design. To use the Enumerated type for a schematic design, you must edit the design AEL file (located in the project networks directory) and implement the AEL code for the desired Enumerated type. Examples of AEL for Enumerated types can be observed in the file $HPEESOF_DIR/adsptolemy/ael/stars.ael.
String Array
Editing in Component Parameter dialog box:A. Enter string values directly—Example: “Button 1” “Button 2” “Button 3”(each string is enclosed with double quote marks, spaces separate each string).B. Enter values from a file—Example: <filename. If the filename has no path specified, the project data directory is used. The content of the file must be text separated by spaces or on a new line. For example:“Button 1” “Button 2” “Button 3”and “Button 1”“Button 2”“Button 3”are equivalent.C. Enter values directly in addition to file data—Example: “Button 1” <file1 “Button 3”. If file1 contains “Button 2,” then the array would be the same as in A.D. Enter value by reference—Example: @Y, where Y is a the name of a Variable or Expression for a string array.
Parameter editing on schematic: Highlight parameter value on schematic and enter array value enclosed with double quote symbols.
Enumerated Type(with form specific to the component)
Editing in Component Parameter dialog box:A. Select enumerated type from selection list specific to the component parameter. For example, Time Unit (milliseconds, etc.) is an Enumerated Type you choose from a list. The Data Flow Controller parameter Scheduler Type is also an Enumerated Type. B. Select the “Standard” enumerated type and enter an integer value in the entry field provided. The integer value is associated with an option in the selection list with the first selection list entry associated with the integer 0,the second entry with the integer 1, etc.C. Select the “Standard” enumerated type and enter the expression in the entry field provided for an integer value—Example: X+Y, where X and Y are defined expressions.
Parameter editing on schematic: Highlight parameter value on schematic and enter enumerated value, or use the up or down arrow keys on the keyboard to scroll through the enumerated options available.
Table 4-1. Ptolemy Parameter Value Types (continued)
Value Type Description
4-4 Value Types
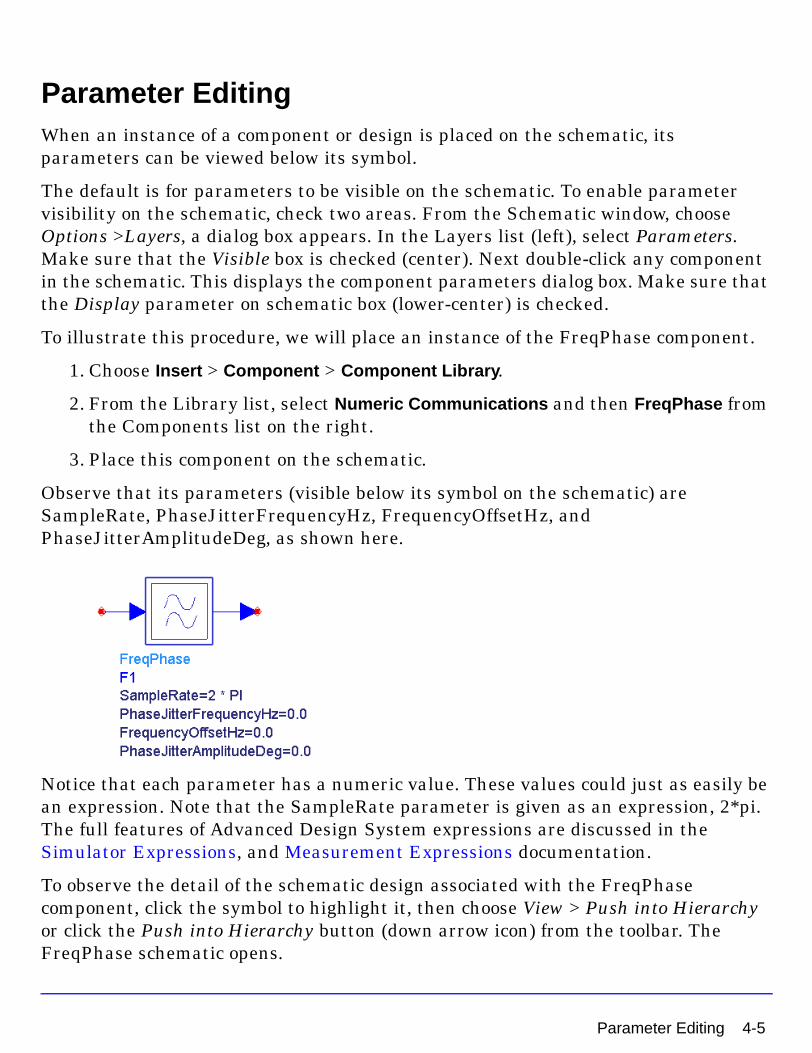
Parameter EditingWhen an instance of a component or design is placed on the schematic, its parameters can be viewed below its symbol.
The default is for parameters to be visible on the schematic. To enable parameter visibility on the schematic, check two areas. From the Schematic window, choose Options >Layers, a dialog box appears. In the Layers list (left), select Parameters. Make sure that the Visible box is checked (center). Next double-click any component in the schematic. This displays the component parameters dialog box. Make sure that the Display parameter on schematic box (lower-center) is checked.
To illustrate this procedure, we will place an instance of the FreqPhase component.
1. Choose Insert > Component > Component Library.
2. From the Library list, select Numeric Communications and then FreqPhase from the Components list on the right.
3. Place this component on the schematic.
Observe that its parameters (visible below its symbol on the schematic) are SampleRate, PhaseJitterFrequencyHz, FrequencyOffsetHz, and PhaseJitterAmplitudeDeg, as shown here.
Notice that each parameter has a numeric value. These values could just as easily be an expression. Note that the SampleRate parameter is given as an expression, 2*pi. The full features of Advanced Design System expressions are discussed in the Simulator Expressions, and Measurement Expressions documentation.
To observe the detail of the schematic design associated with the FreqPhase component, click the symbol to highlight it, then choose View > Push into Hierarchy or click the Push into Hierarchy button (down arrow icon) from the toolbar. The FreqPhase schematic opens.
Parameter Editing 4-5

Understanding Parameters
Notice that the various components in this schematic reference the top-level FreqPhase parameters by name. The RampFloat component Step parameter= 2*π*FrequencyOffsetHz/SampleRate, where FrequencyOffsetHz and SampleRate values are passed in from the top level.
To view the parameters defined (or to define additional parameters) for this schematic design, choose File > Design/Parameters. The Design Parameters dialog box appears. Select the Parameters tab and you will observe fields to enter parameter definition information. For more information on the Design Definition dialog box refer to Design & Display > Schematic Capture and Layout > Creating Hierarchical Designs.
4-6 Parameter Editing

Parameter ExpressionsParameter values can be arithmetic expressions. This is particularly useful for propagating values down from a top-level system parameter to component parameters down in the hierarchy. An example of a valid parameter expression is:
x = pi/(2*order)
where order is a parameter defined in the network or top-level system, and pi is the built-in constant π. The basic arithmetic operators are addition (+), subtraction (-), multiplication (*), division (/), and exponentiation (^). These operators work on integers and floating-point (real) numbers. Currently, all intermediate expressions are calculated in double-precision values and only the final value is converted to the type of the parameter being computed. Hence, it is necessary to be very careful when, for example, using floating-point (real) expressions, to compute an integer parameter. In an integer parameter specification, all intermediate expressions will be calculated with double-precision floating-point (real) values and the final value is cast to an integer value.
Complex-Valued ParametersWhen defining complex values, the basic syntax is
real + j*imag
where real and imag evaluate to double-precision, floating-point (real) values, which may be numbers or expressions, and where j is the imaginary operator.
There are also other functions in ADS Ptolemy that can be used with complex values. These include:
• An expression/function that returns a Cartesian form: complex (X, Y), where X is the real part and Y is the imaginary part.
• An expression/function that converts a polar form to Cartesian form: polar (X, Y), where X is magnitude and Y is in degrees.
• An expression/function that converts a decibel form to a Cartesian form: dbpolar (X, Y), where X is in decibels and Y is in degrees.
Parameter Expressions 4-7

Understanding Parameters
Parameters for Fixed-Point ComponentsMany fixed-point components used in ADS Ptolemy use one or more common parameters that identify the specific characteristics of the finite-precision, fixed-point value. These include characteristics specifying overflow, overflow reporting, quantization, and finite precision bit format. The following describes several properties in common use by these components.
• Parameters specifying fixed-point value precision are typically labeled Precision, InputPrecision, OutputPrecision, or some other token containing Precision.
Fixed-point parameter precision is defined by either of two types of syntax:
Syntax 1
As a string such as "3.2", or more generally "m.n", where m is the number of integer bits (to the left of the binary point) and n is the number of fractional bits (to the right of the binary point). Thus length is m+n.
Syntax 2
A string like "24/32" which means 24 fraction bits from a total word length of 32. This format, n/w, is often more convenient because the word length often remains constant while the number of fraction bits changes with the normalization being used.
In both cases, the sign bit counts as one of the integer bits, so this number must be at least one. The maximum value of w (or x+y) is 256.
Thus, for example, a fixed-point value of 0.8 may have a precision defined as 2/4. This means that a 4-bit word will be used with two fraction bits. Since the value "0.8" cannot be represented precisely in this precision, the actual value of the parameter will be rounded to "0.75".
When an input pin with an associated fixed-point signal class (scalar or matrix) receives another class of signal (scalar or matrix, respectively), the received signal is automatically converted to the fixed-point class. A pin specified for use with fixed-point scalar signals does not accept any matrix class signals, and vice versa. The automatic conversion from timed, complex or floating-point (real) signals to a fixed-point signal uses a default bit width of 32 bits with the minimum number of integer bits needed to represent the value. For example, the automatic conversion of the floating-point (real) value of 1.0 creates a fixed-point value with precision of 2.30, and a value of 0.5 would create one of
4-8 Parameters for Fixed-Point Components

precision of 1.31. For details on data/signal conversion rules, refer to “Conversion of Data Types” on page 5-5.
• ArithType is used to specify the arithmetic form of a fixed-point value. This parameter is an enumerated type with two options: TWOS_COMPLEMENT and UN_SIGNED. Fixed-point components in the Numeric Fixed Point DSP library use either arithmetic form; fixed-point components outside the Numeric Fixed Point DSP library use only the TWOS_COMPLEMENT form (the default).
• RoundFix is used to specify the quantization property of a fixed-point value. This parameter is an enumerated type with two options: ROUND and TRUNCATE. The quantization property is used to convert a floating-point (real) value to its fixed-point value. The ROUND quantization property causes this float-to-fixed transformation to occur such that the nearest fixed-point value to the floating-point (real) value is used. For example, consider the floating-point (real) value 0.1. It is not possible to represent this number exactly as a two’s complement fixed-point value. Remember that a fractional decimal number is represented in its fixed-point form by composing it of the summation of fractional powers of two (2-N ). 0.1 is represented as 0.0001100110011...with an infinite number of fractional binary terms. If the precision is 2.8 and the quantization is ROUND, then this above fixed-point value is rounded up to the nearest fractional power of 2-8 which is 0.00011010. If the precision remains at 2.8 and the quantization is TRUNCATE, then the value is truncated to 0.00011001.
• OverflowHandler or OvflwType parameters are used to specify the overflow properties of fixed-point mathematical operations. These parameters are an enumerated type. The overflow parameter specifies the overflow characteristic to use when the result of a fixed-point operation cannot fit into the precision specified.
• OvflowType has two options: WRAPPED or SATURATE. OvflwType is used only by fixed-point components in the Numeric Fixed Point DSP library.
• OverflowHandler has four options: wrapped, saturate, zero_saturate, or warning. OverflowHandler is used by all fixed-point components except Numeric Fixed Point DSP components.
Consider a fixed-point ramp data source (RampFix) as shown in the following figure. It has a step size of 0.2, initial value of 0, output precision of 2.14, with round type quantization.
Parameters for Fixed-Point Components 4-9

Understanding Parameters
Figure 4-1. Schematic Using the RampFix Component
When OverflowHandler = wrapped, the following data display results:
Figure 4-2. Simulation Plot with OverflowHandler Set to wrapped
Note that as a 2’s complement signal, the maximum value for a 2.14 precision with rounding is nearly 1.9 and the minimum value is nearly −2.0. There are actually more decimal places in these values due to the quantization of the step size. This maximum and minimum is obtained by first converting the step size of 0.2 into its fixed-point form with 2.14 precision. This becomes the step size for the fixed-point ramp accumulation. The signal begins at zero, and increments by the fixed-point binary representation of 0.2 with each sample. When the maximum value is reached, the output wraps to the minimum value for the given precision and quantization.
4-10 Parameters for Fixed-Point Components
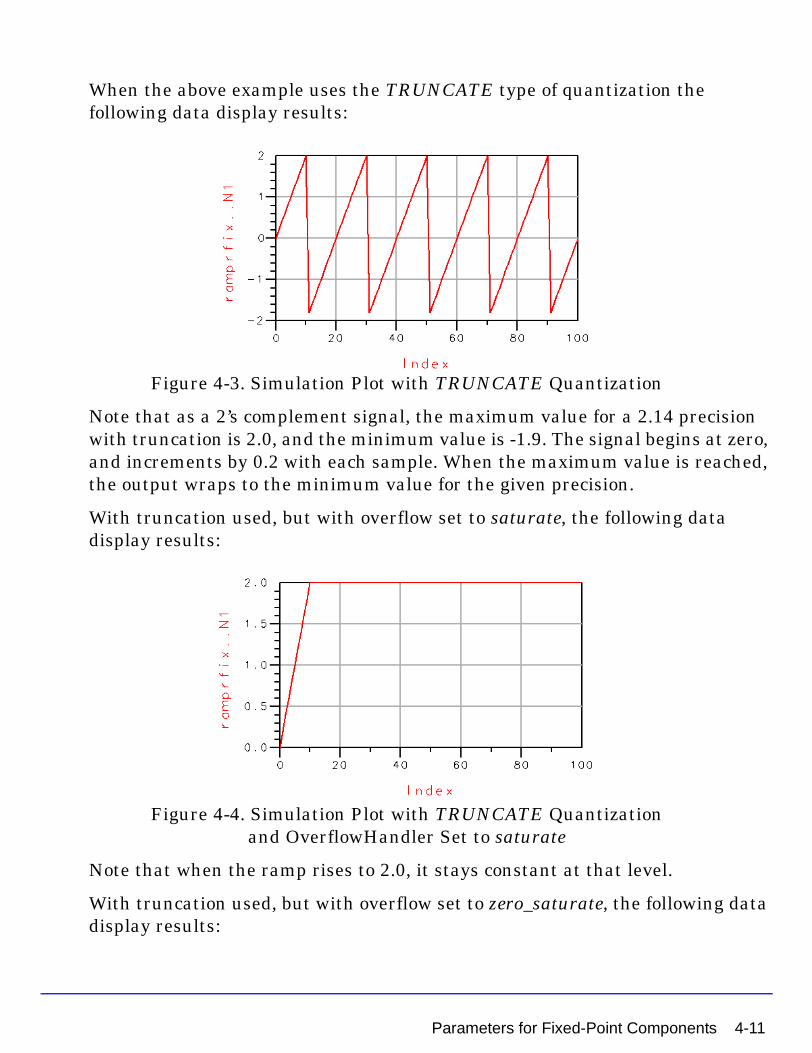
When the above example uses the TRUNCATE type of quantization the following data display results:
Figure 4-3. Simulation Plot with TRUNCATE Quantization
Note that as a 2’s complement signal, the maximum value for a 2.14 precision with truncation is 2.0, and the minimum value is -1.9. The signal begins at zero, and increments by 0.2 with each sample. When the maximum value is reached, the output wraps to the minimum value for the given precision.
With truncation used, but with overflow set to saturate, the following data display results:
Figure 4-4. Simulation Plot with TRUNCATE Quantization and OverflowHandler Set to saturate
Note that when the ramp rises to 2.0, it stays constant at that level.
With truncation used, but with overflow set to zero_saturate, the following data display results:
Parameters for Fixed-Point Components 4-11

Understanding Parameters
Figure 4-5. Simulation Plot with TRUNCATE Quantization and OverflowHandler Set to zero_saturate
Note that when the ramp rises to 2.0, it resets to the value of zero and continues to rise.
Again with truncation used, but with overflow set to warning the following data display results:
Figure 4-6. Simulation Plot with TRUNCATE Quantization and OverflowHandler Set to warning
Note that the saturate characteristic is used. Additionally, the warning mode results in ReportOverflow being set to REPORT, which reports the number of overflows at the end of the simulation.
• ReportOverflow is used to specify whether overflow is reported. This enumerated type parameter provides two options: REPORT and DONT_REPORT. Consider the preceding overflow displays; for each case, when ReportOverflow = REPORT a warning message is displayed in the
4-12 Parameters for Fixed-Point Components
Simulation/Synthesis Messages window after simulation. In the previous simulation for the zero_saturate data display, the warning is:
1: R1: experienced overflow in 9 out of 101 fixed-point calculations checked (8.9%)
When you click this message, the RampFix component with the name R1 is highlighted in the schematic window.
When ReportOverflow = DONT_REPORT, a warning message does not appear.
• UseArrivingPrecision is used to specify whether a component is to use the input signal with its arriving precision, or whether this signal is to be cast into another component’s specific precision. This enumerated type parameter provides two options: NO or YES. UseArrivingPrecision is used with the InputPrecision parameter; when UseArrivingPrecision = NO, the input signal is cast to the precision specified by InputPrecision; otherwise, the input signal’s precision is used.
String ParametersString parameters are assigned a text value that may include any alpha-numeric symbol, including spaces and other punctuation symbols. If a double-quote symbol (") is to be used, it must be used with two such sequential symbols ("") and will be interpreted as only a single, double-quote symbol.
Filename ParametersFilename parameters are assigned a filename value that may include the file path name and environment variables such as ~/, $HOME, $HPEESOF_DIR, or others. If no path name is provided, the current project data subdirectory is the assumed path for the file.
String Parameters 4-13

Understanding Parameters
Array ParametersWhen defining arrays of integers, floating-point (real) numbers, complex numbers, fixed-point numbers, or strings, the basic syntax is a simple list separated by spaces, as shown in the following example:
1 2 3 4 5
defines an integer array with five elements. Repetition can be indicated using the following syntax, value[n], as demonstrated in the following example:
1 2 3[10] 4 5
where n is an integer. This example has ten instances of the value 3. An array or portion of an array can be input from a file using the symbol < as shown in the following example:
1 2 < filename 3 4
Here the first two elements of the array will be 1 and 2, the next elements will be read from file filename, and the last two elements will be 3 and 4. This latter capability can be used in combination with the WaveForm component to read a signal from a file.
When defining complex array values, the basic syntax is
(1.2, 2.5) (-2.3, 1.3) (5.6, -1.4) (2.8, 3.4)
where all entered complex values are ordered pairs of real and imaginary values of complex numbers enclosed in parentheses and separated by commas. Optional spaces may follow each comma. Ordered pairs must be separated by a space. All entries must be numbers.
When defining string array values, the basic syntax is
"Button 1" "Button 2" "Button 3"
where all entered string values are enclosed in double quote symbols.
Another way to define arrays is to separate values with commas, and enclose the set of values in curly braces. For example:
{1, 2, 3, 4, 5}
Complex numbers must be specified using the format a+j*b. For example:
{1.2+j*2.5, -2.3+j*1.3, 5.6-j*1.4, 2.8+j*3.4}
4-14 Array Parameters

However, using the < filename method inside curly braces to include values is not supported.
Reading Array Parameter Values From FilesThe values of all array parameter types can be read from a file. The syntax for this is to use the symbol < as in the following example:
< filename
or
1.2 2.6 <filename 2.8 6.4
If the filename has no path specified, the project data directory is used. Otherwise, the filename should typically contain the full pathname to the file. Any references to environment variables or home directories are substituted to generate a complete path name. All values in the filename must be numeric values for the numeric array types (integerarray, realarray, fixedpointarray, complexarray), and must be string values for the string array type. The contents of the file are read and spliced into the parameter expression and re-parsed. File inputs can be very useful for array parameters which may require a large amount of data. Other expressions may come before or after the < filename syntax (any white space that appears after the < character is ignored). Within the file, comment lines containing a leading pound (#) symbol are ignored by the file parser.
Reading Array Parameter Values From Files 4-15

Understanding Parameters
Parameters With Optimization and Swept AttributesMany component parameters may have associated attributes that are used during nominal optimization. Within the Component dialog box, any parameter of type real, fixed point, integer, or enumerated, may also be optimized for design performance. A complex value may be optimized by optimizing its real and/or imaginary parts.
Parameters of type Complex, Precision, Array, String, or Filename can be optimized or swept by creating a string that references optimized or swept variables. To reference an optimized variable, the variable must be defined in a VAR (Variables and Equations) component with the Standard entry mode and with Optimization/Statistic Setup enabled.
In a manner similar to optimization attributes, there can also be parameters with swept attributes.
For more information on optimization in ADS Ptolemy, refer to Chapter 8, Using Nominal Optimization. For more information on sweeping parameters in ADS Ptolemy, refer to Chapter 7, Performing Parameter Sweeps.
4-16 Parameters With Optimization and Swept Attributes

Chapter 5: Using Data TypesThis chapter reviews some basic material on Data Types that was introduced in Chapter 3, Data Types, Controllers, Sinks, and Components, but then goes into more detail.
ADS Ptolemy uses different data types such as integer, fixed-point, floating-point (real), and complex in scalar or matrix forms. In ADS Ptolemy documentation there are numerous references to data and signal types. When data is presented versus an independent variable such as time, the data can be thought of as a signal. Regardless of the terminology, data or signals consist of packets of information that are passed from one component to another.
Representation of Data TypesADS Ptolemy schematics contain component stems with different colors and thicknesses. Each component input and output pin has an associated data type, and each type is represented in the component symbol by use of a color code and a thickness of stem. And, each component stem may have single or multiple arrowheads. Table 5-1 lists the data types.
Table 5-1. Component Stem Color and Thickness
Data Type Stem Color Stem Thickness
Scalar Fixed Point Magenta Thin
Scalar Floating Point (Real) Blue Thin
Scalar Integer Orange Thin
Scalar Complex Green Thin
Matrix Fixed Point Magenta Thick
Matrix Floating Point (Real) Blue Thick
Matrix Integer Orange Thick
Matrix Complex Green Thick
Timed Black Thin
AnyType Red Thin
Representation of Data Types 5-1
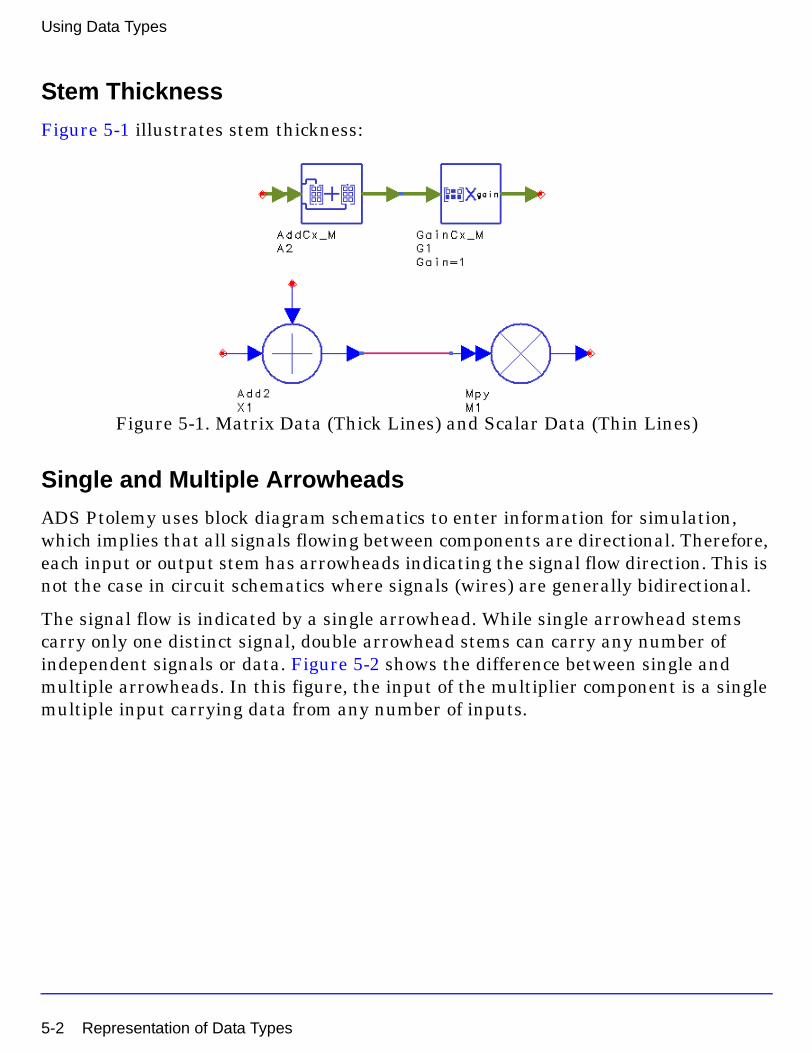
Using Data Types
Stem Thickness
Figure 5-1 illustrates stem thickness:
Figure 5-1. Matrix Data (Thick Lines) and Scalar Data (Thin Lines)
Single and Multiple Arrowheads
ADS Ptolemy uses block diagram schematics to enter information for simulation, which implies that all signals flowing between components are directional. Therefore, each input or output stem has arrowheads indicating the signal flow direction. This is not the case in circuit schematics where signals (wires) are generally bidirectional.
The signal flow is indicated by a single arrowhead. While single arrowhead stems carry only one distinct signal, double arrowhead stems can carry any number of independent signals or data. Figure 5-2 shows the difference between single and multiple arrowheads. In this figure, the input of the multiplier component is a single multiple input carrying data from any number of inputs.
5-2 Representation of Data Types

Figure 5-2. Single and Multiple Arrowheads
Data Types DefinedThere are two general signal types in ADS Ptolemy, numeric and timed. The numeric type has several subtypes, such as fixed-point, real, scalar, and matrix. Numeric signals have sequential numbers as the independent variable. Timed signals have time as the independent variable and are derived from complex data. Timed signals have additional attributes.
Typically, numeric data is used for algorithmic development in the baseband portion of a communication system. Timed signals are used to simulate the signal in the modulation channel, as well as for cosimulation with certain ADS circuit simulators.
Numeric Scalar Data
Numeric scalar data is defined as follows:
• int single, integer value (signed value defined with a 32-bit value)
• fixed single, fixed-point value with the following properties and operation attributes:
precision defined using x.y or y/w where
x = bits to the left of the decimal pointy = bits to the right of the decimal point
w = x+y = total bit width, 1 to 255
Data Types Defined 5-3

Using Data Types
arithmetic type
twos complement (with sign bit included in x)unsigned
quantization type
truncate, round
overflow type
saturate, saturate to zero, wrapped
• floating-point (real) double precision floating-point (real) number
• complex pair of double precision floating-point (real) number for real and imaginary parts
Numeric Matrix Data
All matrix data is defined as a two-dimensional array (rows, columns) of either int, fixed, floating-point (real), or complex values. All matrix data types are indicated by thick stems, in contrast with the thin stems used for scalar data types.
Timed Data
ADS Ptolemy supports timed data. This signal is derived from complex data and includes additional attributes. The timed signal packet includes five members
{i(t), q(t), flavor, Fc and t}
where i(t) and q(t) are the timed signal in phase and quadrature components, flavor indicates the representation of a modulated signal, Fc is the carrier (or characterization) frequency, and t is the time.
There are two equivalent representations (flavors) of a timed signal:
complex envelope (ComplexEnv) v(t)real baseband (BaseBand) V(t)
RF signals that are represented in the ComplexEnv flavor v(t) together with Fc can be converted to the real BaseBand flavor V(t) as:
V t( ) Re v t( )ej2πFc t
=
5-4 Data Types Defined

Conversion of Data TypesWe introduced this topic in Chapter 3. In this section, we go into more detail. Most conversions do what you expect. For example, when converting from lower to higher precision data types such as integer to floating-point (real), no data is lost; only the format is changed.
When converting from higher to lower precision data types, such as floating-point (real) to integer, the outcome is determined by the computer’s math rounding rules.
Whether you manually place a converter, or the simulator splices in a converter, the conversion process is the same. It is similar to the casting operation used in C or C++ languages. If the conversion from A to B requires more information (integer to floating-point (real), floating-point (real) to complex, etc.) the obvious happens. For example, conversion from floating-point (real) to complex is done by setting the imaginary part of the complex number equal to 0.0. However, if the conversion involves loss of information (complex to double, double to integer, etc.), a set of rules is followed that is generally simple and intuitive.
Numeric Scalar and Matrix Conversions
Table 5-2 outlines the rules regarding scalar conversions among numeric data types:
Note that mag means the magnitude of the complex number C = a + jb which is equal to
For automatic conversion (when no converter is explicitly used) to the Fixed data type, the resulting fixed-point number has the default length of 54 bits with the minimum number of integer bits needed to represent the value in twos complement representation. For example, the integer 5 is converted to the fixed point number 0101.00000000000000000000000000000000000000000000000000 (precision "4.50"), whereas the floating-point (real) number 3.375 is converted to
Table 5-2. Numeric Scalar and Matrix Conversion Rules
From To
Integer Fixed Real
Complex round mag round/truncate mag mag
Real round round/truncate
Fixed round
a2 b2+
Conversion of Data Types 5-5

Using Data Types
011.011000000000000000000000000000000000000000000000000 (precision "3.51"). If this is not the behavior you want, you must explicitly use a converter.
For matrix conversions, the above operations hold for all entries in the matrix.
Timed Data Conversions
You can convert between timed and scalar numeric data types by placing one of the following converters and supplying the parameters as needed:
• Timed to Complex or Complex to Timed
• Timed to Float (real) or Float (real) to Timed
• Timed to Fixed or Fixed to Timed
• Timed to Integer or Integer to Timed
Given the Timed data type {i(t), q(t), flavor, Fc and t}, the conversions between input and output of a converter are summarized below:
Timed To Float (Real)
If x is the input and y is the output for the TimedToFloat converter, then:
y[n] = i(t)*cos(2*π∗Fc*t)-q(t)*sin(2*π∗Fc*t)
when flavor = ComplexEnv
y[n] = x(t)
when flavor = BaseBand
Timed to FloatYX
5-6 Conversion of Data Types

Float (Real) To Timed
The FloatToTimed converter has one specific parameter, TStep. If x is the input and y is the output for this converter, then the y(t) packet has the following parts:
i(t) = x[n*TStep] q(t) = 0.0Fc= 0.0flavor = BaseBand
Timed To Complex
The Timed To Complex converter has no parameters. If x is the input and y is the output for this converter, then:
y[n] = i(t) + j*q(t) when flavor = ComplexEnv
y[n] = i(t) + j*0.0 when flavor = BaseBand
Complex To Timed
The Complex To Timed converter has two specific parameters, TStep and FCarrier. If x is the input and y is the output for this converter, then the y(t) packet has the following parts:
i(t) = Real{x[n*TStep] }q(t) = Imag{x[n*TStep] }Fc= FCarrierflavor = ComplexEnv
Float to Timed YXParameter: TStep
Timed to ComplexYX
Complex to Timed YXParameters: TStepFCarrier
Conversion of Data Types 5-7

Using Data Types
Rules and Exceptions
The converter devices are in general not reciprocal, i.e., putting two converters with opposite functionality back-to-back does not necessarily recover the original signal.
Based on the numeric scalar, numeric matrix, and timed data categories discussed previously, consider the following:
• Conversion between numeric scalar and numeric matrix types is done by explicitly placing Pack and UnPack components. Automatic conversion is not performed between these two categories.
• Conversion between numeric scalar and timed data is done by placing the appropriate converters. Automatic conversion between these two categories is allowed.
• Direct conversion is not done between numeric matrix and timed data types.
Figure 5-3 illustrates the conversion among data types; timed data must be converted to numeric scalar before being converted to matrix.
Figure 5-3. Data Type Conversions
Automatic or Manual Data Type Conversion
If the output of component A and the input of component B is the same (they are represented by the same color), data is simply copied from A to B. If the output of component A and the input of component B is different, conversion is needed.
Automatic conversion means that an appropriate converter is spliced in behind the scenes (not shown on the schematic). You may want to manually place an appropriate converter (from the Signal Converters library) in your schematic, which will be a visual conversion reminder and will help you decode any error messages.
Automatic conversion is allowed among scalar data types and among matrix data types, but not between scalar and matrix data types.
TimedTimed to Numeric
Numeric to TimedNumericScalar
Pack
UnpackNumericMatrix
5-8 Conversion of Data Types

Allowed and Disallowed Automatic Conversions
Automatic conversion is available among all numeric scalar types. The same is true for matrix types. Figure 5-4 summarizes the allowed conversions.
Figure 5-4. Automatic Conversion Among Numeric Scalar and Matrix Types
With one exception (complex to timed), automatic conversion between timed and numeric scalar types is also supported, as illustrated in Figure 5-5.
Figure 5-5. Automatic Conversion of Timed and Scalar Numeric Types
Complex Real
Integer Fixed
Timed
Complex Integer Real Fixed
Conversion of Data Types 5-9

Using Data Types
Automatic complex-to-timed conversion is not supported because carrier frequency information must be supplied by the user; for complex-to-timed conversion, place a ComplexToTimed converter and enter the appropriate parameters.
Automatic conversion of float (real) to timed, fixed to timed, integer to timed, or complex to timed must have at least one component in the design defining the TStep.
There is no automatic conversion between scalar and matrix data (or vice versa). In the Numeric Matrix Library, Pack_M, PackCx_M, PackFix_M, and PackInt_M are used to pack scalar data into matrix data; UnPk_M, UnPkCx_M, UnPkFix_M, and UnPkInt_M unpack the data (back to scalar). Place the converters where needed in your design. (Otherwise, when a scalar pin is directly connected to a matrix pin (or vice versa), without a pack or unpack converter, an error message is generated.)
5-10 Conversion of Data Types

Chapter 6: Understanding File Formats
IntroductionReal, complex, and string array data can be used with component parameters of type real array, complex array, or string array, respectively. Real array data can be used as input with the ReadFile component. Real, complex, floating-point (real) matrix, fixed matrix, complex matrix, and integer matrix can be used as output from the Printer component.
The following file format examples (real array data through complex matrix data), are drawn from the code and include the comment line # symbol.
Real Array Data# Template for ADS Ptolemy real data# Each number separated by new lines100
Complex Array Data# Template for ADS Ptolemy complex data# Each complex value, (real, imag), separated by new lines(1.0, 0.0)(0.0, 0.0)(0.0, 0.0)
String Array Data# Template for ADS Ptolemy string data# Each string value enclosed with double-quote marks "" and separated by new lines "text 1""text 2""text 3"
Introduction 6-1

Understanding File Formats
Real Matrix Data# Template for ADS Ptolemy real matrix data# Each matrix data set separately listed with brackets around each row and matrix# Each matrix row separated by new lines [[ 1.2, -2, 2 ] [ -2, 2.25, -2 ]] [[ 2.5, -2.1, 3.2 ] [ -3.5, 2.4, -1.3 ]] [[ 2.2, -2.4, 3.8 ] [ -2.5, 2, -2.6 ]]
Fixed-Point Matrix Data# Template for ADS Ptolemy fixed-point matrix data# Each matrix data set separately listed with brackets around each row and matrix# Each matrix row separated by new lines [[ 1.2, -2, 2 ] [ -2, 2.25, -2 ]] [[ 2.5, -2.1, 3.2 ] [ -3.5, 2.25, -1.25 ]] [[ 2.2, -2.5, 3.5 ] [ -2.5, 2, -2.5 ]]
Integer Matrix Data# Template for ADS Ptolemy integer matrix data# Each matrix data set separately listed with brackets around each row and matrix# Each matrix row separated by new lines[[ 1 -2, 2 ] [ -2, 2, -2 ]] [[ 2, -2, 3 ] [ -3, 2, -1 ]] [[ 2, -2, 3 ] [ -2, 2, -2 ]]
6-2 Real Matrix Data

Complex Matrix Data# Template for ADS Ptolemy complex matrix data# Each matrix data set separately listed with brackets around each row and matrix# Each matrix row separated by new lines[[ 11.0+0.0j, 12.0+0.0j, 13.0+0.0j ] [ 21.0+0.0j, 22.0+0.0j, 23.0+0.0j ]]
SPW (.ascsig and .sig) File FormatsSPW format data files can be read by the system simulator by specifying them as input files in a TimedDataRead component. They can be written by the simulator by specifying them as output files in a TimedDataWrite component. The binary format .sig file has the same ASCII header information as the .ascsig file but data is stored as a pointer in binary format.
• The SPW version 3.0 data file format must be used.
• Comments can only be included on the one line following the $USER_COMMENT statement.
• The TimedDataRead source can read a real double-format or complex double-format SPW data file. To read an SPW format file, the appropriate .ascsig or .sig extension must be specified with the filename.
Real Double Data Format Example .ascsig File$SIGNAL_FILE 9$USER_COMMENT
$COMMON_INFOSPW Version = 3.0
Sampling Frequency = 1Starting Time = 0$DATA_INFONumber of points = 6Signal Type = Double$DATA1.0000000000000000000001.000000000000000000000-1.000000000000000000000-1.0000000000000000000001.0000000000000000000001.000000000000000000000END
Complex Matrix Data 6-3

Understanding File Formats
Complex double data format example .ascsig file$SIGNAL_FILE 9$USER_COMMENT
$COMMON_INFOSPW Version = 3.0
Sampling Frequency = 1Starting Time = 0$DATA_INFONumber of points = 10Signal Type = DoubleComplex Format = Real_Imag$DATA1.000000000000000000000+j1.0000000000000000000001.000000000000000000000+j1.000000000000000000000-1.000000000000000000000+j1.000000000000000000000-1.000000000000000000000+j1.0000000000000000000001.000000000000000000000+j1.0000000000000000000001.000000000000000000000+j1.000000000000000000000-1.000000000000000000000+j1.000000000000000000000-1.000000000000000000000+j1.000000000000000000000-1.000000000000000000000+j1.000000000000000000000-1.000000000000000000000+j1.000000000000000000000END
6-4 SPW (.ascsig and .sig) File Formats

Time-Domain Waveform Data (.tim) File, MDIF ASCII FormatThe general .tim file format is:
BEGIN TIMEDATA# T ( SEC V R xx )% t voltage<data line>...<data line>END
BINTIM Format
The BINTIM format (.bintim) is for binary time-domain waveform data files. In .bintim files, the format is the same as .tim files, except the BEGIN line is preceded by a line indicating the number of data points, n:
NUMBER OF DATA n
The <data line> in a .bintim file is just a binary dump of all the waveform (time, voltage) data. Also, there is no END line.
Note The .bintim format is not supported in the Data File Tool. However, certain signal processing components can read .bintim files.
Guidelines for .tim files
An exclamation point ! at the beginning of a line signifies a comment line; characters that follow ! are ignored by the program.
TIMEDATA data block is required.
When the file reader reads a file, it renames the independent and dependent variable names regardless of the names specified in the file. The file reader reads the independent variable name as time, and the dependent variable name as voltage.
Time-Domain Waveform Data (.tim) File, MDIF ASCII Format 6-5

Understanding File Formats
• The BEGIN statement:
BEGIN TIMEDATA ! Begin time-domain waveform data
• Option line:
# T ( time_unit data_unit R xx )
where
# = delimiter tells the program you are specifying these parameters.T = timetime_unit = sets time units. Options are SEC, MSEC, USEC, NSEC, PSEC.data_unit = Set the units for the voltage values. Options are:
V = voltsMV = millivolts
R xx = sets resistance, where xx = reference resistance. (default is 50.0)
• Format line:
% time voltage
where
% = delimiter that tells the program you are specifying these parameters
In ADS, the syntax time and voltage in the Format line are arbitrary. These values can be whatever you prefer. For example, an option line such as:
% t mV
can be used. However, these values are converted to time and voltage by the file reader when the .tim file is imported, and these will be the variables appearing in a dataset (.ds) file.
• TIMEDATA data requirements are:
• A value for time=0 is not required.
• The signal is assumed to be time periodic with time period equal to maximum time minus minimum time.
6-6 Time-Domain Waveform Data (.tim) File, MDIF ASCII Format

Example .tim FilesBEGIN TIMEDATA# T ( USEC V R 50 )% time voltage
0.0 -1.02.0 1.04.0 2.08.0 3.0
10.0 3.014.0 0.018.0 -1.024.0 -2.028.0 0.032.0 -1.0
END
This example file results in a time periodic voltage versus time with time period 32 µsec, interpreted as a piece-wise linear voltage description.
The following example shows how to handle independent and dependent variable names when using a DataAccessComponent. This is useful since the file reader reads the independent variable name as time, and the dependent variable name as voltage, regardless of the names specified in the file. The following example data files shows the variable names specified as t and v:
BEGIN TIMEDATA% t v
0 01e-011 0.009950172e-011 0.01980135e-011 0.0487706
1.4e-010 0.1306424.1e-010 0.33635
1e-009 0.632121END
Though the variable names are t and v, the file reader changes the names to time and voltage, requiring the following syntax for the DataAccessComponent:
2 4 8 14
28 3218 240
-1
-2
1
2
3
Time-Domain Waveform Data (.tim) File, MDIF ASCII Format 6-7

Understanding File Formats
DataAccessComponentType=Time Domain Waveform (TIM MDIF)iVar1="time"iVal1=time
VARX=file{DAC1,"voltage"}
Agilent Standard Data Format (.dat) FilesThe .dat file is a signal file form used with the 89400 and 89600 series of test instruments (vector modulation generators/analyzers). Refer to the Agilent Standard Data Format Utilities User’s Guide, Agilent Part No. 5061-8056.
6-8 Agilent Standard Data Format (.dat) Files

Chapter 7: Performing Parameter Sweeps
IntroductionPerforming parameter sweeps with ADS Ptolemy works similar to Analog/RF Network simulators. This chapter describes this capability using signal processing examples and points out some things to be aware of when performing sweeps with ADS Ptolemy.
Parameter sweeps are a quick way to conduct a series of simulations while varying a parameter and displaying the output on one plot. For example, you could analyze a bit error rate (BER) measurement while sweeping the amount of noise added to the design.
Note In many ADS circuit simulators, sweeps of individual parameters (such as frequency) can be performed from within many of the simulator dialog boxes themselves; in signal processing, a Parameter Sweep (ParamSweep) controller must be used.
The following sections describe various methods for sweeping parameters.
• For a simple parameter sweep, use a ParamSweep controller. For details, refer to “Simple Parameter Sweeps” on page 7-2.
• A flexible way to build complicated sweep relationships uses a VAR component to define variables and equations. For details, refer to “Parameter Sweeps with Defined Variables” on page 7-5.
• It is possible to combine sweeps of several parameters or several ranges of one parameter into a single sweep plan. This plan of multiple parameter sweeps is controlled by placing a SweepPlan in your schematic. For details, refer to “Multiple Parameter Sweeps” on page 7-6.
• To sweep complex, precision, array, string, or filename parameter types, you must use a VAR (Variables and equations) component to define the swept variable. You then embed a variable from the VAR in the string of the component parameter value. The reason for this is because the simulator only sweeps numbers and these parameter types are strings that are interpreted by the simulator. For details, refer to “String Type Parameter Sweeps” on page 7-9.
Introduction 7-1

Performing Parameter Sweeps
• To sweep two or more variables and observe the composite results (for example, analyzing the bit error rate of a communication system for two modulation schemes at three different power levels) uses two ParamSweep controllers. For details, refer to “Multidimensional Parameter Sweeps” on page 7-11.
Simple Parameter SweepsTo sweep parameters, place and specify parameters for the ParamSweep controller. Optionally, you can also place a VAR (variables and equations) to aid in defining terms; for details, refer to “Parameter Sweeps with Defined Variables” on page 7-5.
The example design in Figure 7-1 includes a Waveform source, a Gain component (Common Components library), a NumericSink (Sinks library), a ParamSweep, and the required DataFlow (DF) controller (Controllers library). We will sweep the Gain parameter of the Gain component.
Figure 7-1. Sweeping a Gain Component Using ParamSweep
To sweep the Gain parameter of the Gain component:
1. Double-click ParamSweep symbol to display the dialog box.
7-2 Simple Parameter Sweeps

2. In the Sweep tab, Parameter to sweep field, enter G1.Gain. A period separates the instance name (G1) from the parameter we want to sweep (Gain). With this syntax, you can set up any parameter of any component for sweeping. This syntax is hierarchical; if the Gain parameter was in a subnetwork called A, you would use A.G1.Gain.
3. Sweep Type field is set to Linear (other choices are Single point and Log).
4. With the Start/Stop option button selected, enter the following parameters:
Start = 1Stop = 5Step-size = 2Num. of pts. = 3 (this field is calculated by the program)
5. In the Simulations tab, Simulations to perform field, in the Simulation 1 field enter DF (this field must be specified for successful simulation). ADS will use the DataFlow controller (instance name DF) as the simulator.
6. Click OK to accept your changes and dismiss the dialog box.
7. Double-click the DF symbol to edit its parameters.
8. Change the Stop parameter to 10.0.
Simple Parameter Sweeps 7-3

Performing Parameter Sweeps
9. Choose Simulate > Simulate.
10. When the simulation is finished, choose Window > New Data Display.
11. Place a rectangular plot, add N1 from your dataset, and choose OK. Your result should indicate the waveform multiplied by three different Gain values and look similar to the one shown next.
7-4 Simple Parameter Sweeps

Parameter Sweeps with Defined VariablesAn alternate way to conduct parameter sweeps is to place a VAR component in addition to ParamSweep. A VAR component, used to define variables and equations, provides a flexible way of building complicated sweep relationships. (For a simple parameter sweep, it is easiest to use ParamSweep only as described in “Simple Parameter Sweeps” on page 7-2.)
The following example uses the same design as Figure 7-1, adding a VAR component to help perform the parameter sweep.
To sweep the Gain parameter of the Gain component:
1. Place a VAR component (Controllers library) anywhere in the schematic.
Figure 7-2. Sweeping a Gain Component Using ParamSweep and VAR
2. Edit the Gain component so that Gain=XYZ (instead of the default of Gain=1.0).
3. Edit the VAR component so that XYZ=1.0.
4. Edit the ParamSweep controller so that SweepVar="XYZ" and SimInstanceName[1]="DF". Do not change other ParamSweep parameters.
In this method, you are connecting the Gain parameters with the sweep variable XYZ. Any reference to XYZ in this design would be swept. Further, you may want to use VAR components to define other relationships in a design and add another line to define the parameter to be swept.
Parameter Sweeps with Defined Variables 7-5

Performing Parameter Sweeps
Multiple Parameter SweepsIt is possible to combine sweeps of several parameters or several ranges of one parameter into a single sweep plan. This plan of multiple parameter sweeps is controlled by using a SweepPlan.
1. Place a SweepPlan (Controllers library) anywhere in the schematic.
2. Edit ParameterSweep so that the Use sweep plan check box is selected.
7-6 Multiple Parameter Sweeps

3. Double-click the SweepPlan symbol to edit its parameters.
4. Enter two ranges of gain steps. First, in the Start/Stop field repeat the range that was entered for the single parameter sweep:
Start = 1Stop = 5Step-size = 2
5. Choose Apply.
6. Change the Start/Stop field to:
Start = 10Stop = 14Step-size = 2
7. Choose Add to add the new range to the sweep plan.
Click OK, or check Next Sweep Plan then click OK to add more SweepPlan components to control simulation in a chain of events.
Multiple Parameter Sweeps 7-7

Performing Parameter Sweeps
Note Placement of sweep components does not affect the order in which parameters are swept; similarly, the order in which the sweeps are automatically numbered does not determine the order in which they are executed. The order of execution is determined by the order in which one sweep calls another, as determined by the value of SweepPlan. The simulation component calls the first sweep plan to be conducted, whatever it is named.
8. Choose Simulate > Simulate.
When the simulation is finished, the Gain parameter has now been swept over two ranges; your Data Display window will look similar to the following:
7-8 Multiple Parameter Sweeps

String Type Parameter Sweeps
To sweep a real, integer, or fixed-point parameter type, the procedure is similar to examples previously presented. To sweep complex, precision, array, string, or filename parameter types, you must use a VAR (Variables and equations) component to define the swept variable. You then embed a variable from the VAR in the string of the component parameter value. The reason for this is because the simulator only sweeps numbers and these parameter types are strings that are interpreted by the simulator.
An example of sweeping a filename is the case of 10 files, myfile1.dat through myfile10.dat each containing filter coefficients. You might want to sweep a range of these files.
Note Earlier versions of Advanced Design System (1.0 and 1.1) required the use of sprintf and strcat functions to reference strings. While no longer needed for complex, precision, or array types, designs built with these functions will still work.
The following example shows how to sweep a string parameter type. The example in Figure 7-3 uses a VAR (variables and equations) component to define the swept variable called Gain; Figure 7-4 zooms in on the WaveFormCx component, which produces a complex waveform.
Figure 7-3. Sweeping a Complex Waveform Component Value
String Type Parameter Sweeps 7-9

Performing Parameter Sweeps
Figure 7-4. WaveFormCx Component
The parameter we want to sweep is the imaginary part of the first complex entry in an array of two complex numbers. Since complex arrays are handled as strings in ADS Ptolemy, we sweep the imaginary part as follows:
Value="(1+j*Gain)(2+j*4)"
The string "(1+j*Gain)(2+j*4)" tells the software to evaluate the mathematical expression for variable Gain and convert it to a string.
Now if we sweep the variable Gain from 0 to 3, we obtain the following results for the magnitude of the output.
7-10 String Type Parameter Sweeps
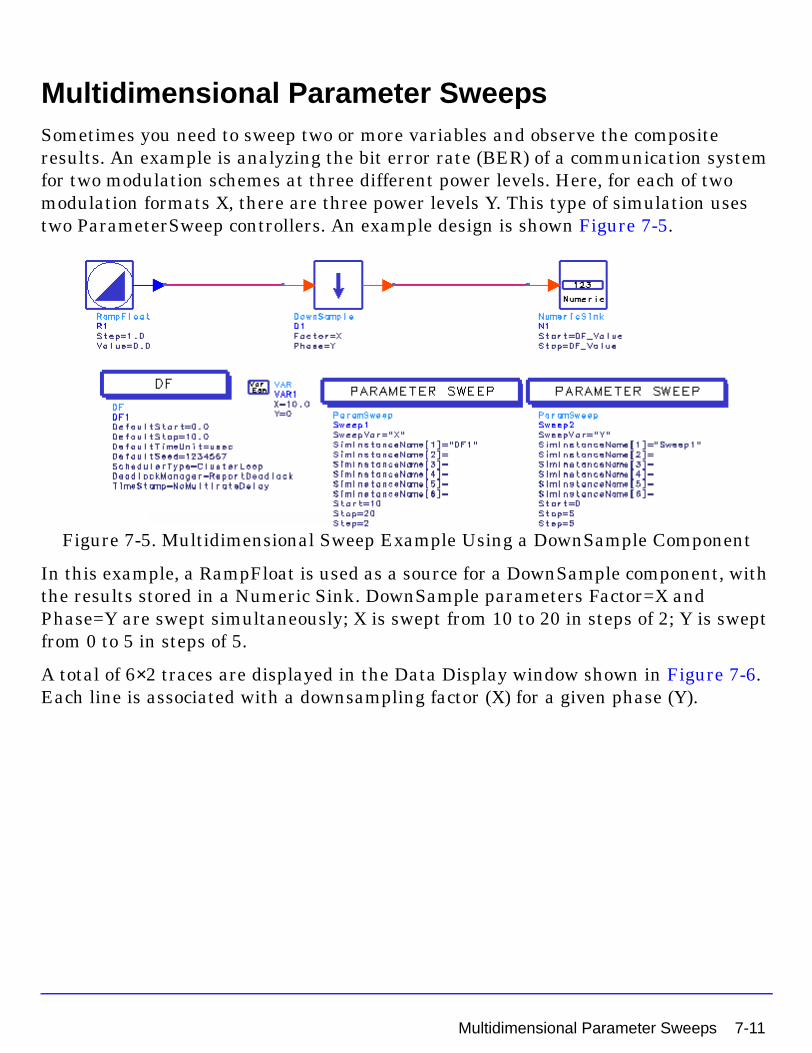
Multidimensional Parameter SweepsSometimes you need to sweep two or more variables and observe the composite results. An example is analyzing the bit error rate (BER) of a communication system for two modulation schemes at three different power levels. Here, for each of two modulation formats X, there are three power levels Y. This type of simulation uses two ParameterSweep controllers. An example design is shown Figure 7-5.
Figure 7-5. Multidimensional Sweep Example Using a DownSample Component
In this example, a RampFloat is used as a source for a DownSample component, with the results stored in a Numeric Sink. DownSample parameters Factor=X and Phase=Y are swept simultaneously; X is swept from 10 to 20 in steps of 2; Y is swept from 0 to 5 in steps of 5.
A total of 6×2 traces are displayed in the Data Display window shown in Figure 7-6. Each line is associated with a downsampling factor (X) for a given phase (Y).
Multidimensional Parameter Sweeps 7-11

Performing Parameter Sweeps
Figure 7-6. Simulation Results of Multidimensional Sweep Example
7-12 Multidimensional Parameter Sweeps

Chapter 8: Using Nominal Optimization
IntroductionThis chapter describes using nominal optimization with ADS Ptolemy. Nominal optimization, also called performance optimization, uses iterative simulation to achieve user-specified goals by automatically varying specific simulation design parameter values over user-specified ranges. For example, you could optimize the gain of a carrier recovery loop to achieve a desired lock time and residual loop error or you could optimize a fixed-point bit-width parameter in a DSP design. This capability generally works the same way as in Analog/RF Network simulators. Details regarding nominal optimization are provided in “Performing Nominal Optimization” in the Tuning, Optimization, and Statistical Design manual.
In this chapter we will present a DSP example on optimizing bit-width and describe information on signal processing parameter types to be aware of when performing optimization with ADS Ptolemy.
Optimizing Various Parameter TypesTo optimize a real, integer, or fixed-point parameter type, the procedure is similar to standard nominal optimization.
To optimize complex, precision, array, string, or filename parameter types, you must use a VAR component to define the optimizable variable. You then embed a variable from the VAR in the string of the component parameter value. This is because the simulator only sweeps numbers and these parameter types are strings that are interpreted by the simulator.
To reference an optimized variable for parameter types that use strings, the variable is defined in a VAR (Variables and equations) component with Standard entry mode and Optimization/Statistic Setup enabled. Once defined, this variable can be used as a component parameter. If you type this variable on the schematic, it must be enclosed in quotes " "; if you enter this variable in the component dialog box, quotes are automatically added.
An example of optimizing a filename is the case of ten files, myfile1.dat through myfile10.dat, each containing filter coefficients. You might want to conduct an optimization based on a range of these files.
Introduction 8-1

Using Nominal Optimization
Note Earlier versions of Advanced Design System (1.0 and 1.1) required the use of sprintf and strcat functions to reference strings. While no longer needed for complex, precision, or array types, designs built with these functions will still work.
Optimizing Input and Output Bit Width
This example shows how to set up a simple fixed-point bit-width parameter optimization. We will build a simple design as shown in Figure 8-1. To help you set up this design, copy the project file dspopt_prj from the examples/Tutorial directory, and modify the design simpleopt2 as described in this section.
Figure 8-1. Optimizing Input and Output Precision of a GainSyn Component
8-2 Optimizing Various Parameter Types

The value of the input and output precision of GainSyn in component G1 is optimized to achieve a dc data value of 0.2 in the sample stored in the numeric sink. The goal is to represent the gain with the minimum number of bits possible.
The value of 0.2 cannot be exactly represented with only one or two fractional bits (bits to the right of the decimal point). Without optimization, too many bits (such as 16) might be used. While the number 0.2 would be represented very accurately, the extra bits could be wasteful in the final implementation.
By studying this example, you can learn the procedure you would use to solve real-world design problems, such as optimizing the bit width of an FIR filter.
The design consists of:
• A fixed constant output (ConstFix) source component (from the Numeric Sources library), with the Level parameter set to 1.0.
• A GainSyn component, with Gain=0.2 and GainPrecision="W.D".
• A NumericSink, with default values accepted.
• A DataFlow controller, with default values accepted, except set DefaultNumericStop to 0.0.
• A VAR component, set up as described in the following paragraphs.
• An Optim controller, set up as described in the section “Setting Optimization Job Parameters” in the Tuning, Optimization, and Statistical Design manual. Use the default values, except set MaxIters = 30. The default optimizer type is the Random optimizer.
• A Goal component, for the expression mag(N1-0.2).
Set Up the VAR Component
To set up the VAR component, first refer to Figure 8-2.
Figure 8-2. VAR Component Parameters
Double-click the VAR symbol in your schematic to display its dialog box. The following describes each parameter that must be set so the VAR component matches Figure 8-2.
Optimizing Various Parameter Types 8-3

Using Nominal Optimization
1. Enter W= 2. W is the number of bits to the left of the decimal point, including the sign bit.
2. Enter D=1. D is the number of bits to the right of the decimal point. 1 is our nominal value before optimization. This should be your best estimate for the nominal value.
Note The W and D labels are user-defined variable names.
3. Choose the Tune/Opt/Stat/DOE Setup button.
4. From the Optimization Status dropdown menu, select Enabled.
5. From the Type dropdown menu, select Discrete.
6. In the Minimum Value field, enter 1.
7. In the Maximum Value field, enter 16.
8. In the Step Value field, enter 1.
Note Steps 5 through 8 tell the program to optimize using only the discrete values of 1 through 16 in steps of 1.
9. Click OK to return to the main Variables and Equations dialog box.
10. When done, click OK.
Note that the Weight parameter weighs the importance of one goal to the other goal(s). Generally, the first goal may be more important, for example when it meets a performance specification such as frequency response. The second goal (in this example, bit width) is weighted less. Because the error function of the first goal is small compared to the second, the Weight of the first goal is set to 1e9.
Completing the Optimization
You are now ready to complete the optimization. The remainder of the procedure for completing and running the optimization for parameter types (such as precision or string) are the same as for any optimization. To review these procedures, refer to “Specifying Component Parameters for Optimization” in the Tuning, Optimization, and Statistical Design manual.
8-4 Optimizing Various Parameter Types

Chapter 9: Theory of Operation
IntroductionADS Ptolemy provides signal processing simulation for ADS’s specialized design environments. Each of these design environments capture a model of computation, called a domain, that has been optimized to simulate a subset of the communication signal path. ADS domains that are part of ADS Ptolemy, or can cosimulate with ADS Ptolemy are:
In ADS Ptolemy, a complex system is specified as a hierarchical composition (nested tree structure) of simpler circuits. Each subnetwork is modeled by a domain. A subnetwork can internally use a different domain than that of its parent. In mixing domains, the key is to ensure that at the interface, the child subnetwork obeys the semantics of the parent domain.
Thus, the key concept in ADS Ptolemy is to mix models of computation, implementation languages, and design styles, rather than trying to develop one, all-encompassing technique. The rationale is that specialized design techniques are more useful to the system-level designer, and more amenable to a high-quality, high-level synthesis of hardware and software. Synchronous dataflow (SDF) and timed synchronous dataflow (TSDF) are described in the sections that follow.
For general documentation on the Circuit Envelope and Transient simulators refer to the Circuit Envelope and RF Transient/Convolution Simulation chapters in the Circuit Simulation manual. For information on cosimulation with ADS Ptolemy and these circuit simulators, refer to Chapter 11, Cosimulation with Analog/RF Systems.
Domain Simulation Technology Controller Application Area
Synchronous Dataflow (SDF)
Numeric dataflow Data Flow Synchronous multirate signal processing simulation
Timed Synchronous Dataflow (TSDF)
Timed dataflow Data Flow Baseband and RF functional simulation (e.g., antenna and propagation models, timed sources)
Circuit Envelope Time- and frequency-domain analog Envelope Complex RF simulation
Transient Time-domain analog Transient Baseband analog simulation
Introduction 9-1

Theory of Operation
Synchronous DataflowSynchronous dataflow is a special case of the dataflow model of computation, which was developed by Dennis [1]. The specialization of the model of computation is to those dataflow graphs where the flow of control is completely predictable at compile time. It is a good match for synchronous signal processing systems, those with sample rates that are rational multiples of one another.
The SDF domain is suitable for fixed and adaptive digital filtering, in the time or frequency domains. It naturally supports multirate applications, and its rich component library includes polyphase FIR filters.
The ADS examples directories contain application examples that rely on SDF semantics. To view these examples, chose File > Example Project; select the DSP/dsp_demos_prj directory for one group of SDF examples.
SDF is a data-driven, statically scheduled domain in ADS Ptolemy. It is a direct implementation of the techniques given by Lee [2] [3]. Data-driven means that the availability of data at the inputs of a component enables it; components without any inputs are always enabled. Statically scheduled means that the firing order of the components is periodic and determined once during the start-up phase. It is a simulation domain, but the model of computation is the same as that used for bit-true simulation of synthesizable hardware. A number of different schedulers have been developed for this model of computation.
Basic Dataflow Terminology
The SDF model is equivalent to the computation graph model of Karp and Miller [4]. In the terminology of dataflow literature, components are called actors; an invocation of a component is called a firing. The signal carried along the arc connecting the blocks are made of individual packets of data called tokens. In a digital signal processing system, a sequence of tokens might represent a sequence of samples of a speech signal or a sequence of frames in a video sequence.
Note Some ADS Ptolemy terminology differs from UCB Ptolemy terminology. For example, a component in ADS is called a star in UCB Ptolemy and an arc is a wire. Refer to the “Terminology” on page 1-3 for more information.
When an actor fires, it consumes some number of tokens from its input arcs, and produces some number of output tokens. In synchronous dataflow, these numbers
9-2 Synchronous Dataflow

remain constant throughout the execution of the system. It is for this reason that this model of computation is suitable for synchronous signal processing systems, but not for asynchronous systems. The fact that the firing pattern is determined statically is both a strength and a weakness of this domain. It means that long runs can be very efficient, a fact that is heavily exploited in ADS Ptolemy. But it also means that data-dependent flow of control is not allowed; this would require dynamically changing firing patterns.
Balancing Production and Consumption of Tokens
Each port of each SDF component has an attribute that specifies the number of tokens consumed (for inputs) or the number of tokens produced (for outputs). When you connect an output to an input with an arc, the number of tokens produced on the arc by the source component may not be the same as the number of tokens consumed from that arc by the destination component. To maintain a balanced system, the scheduler must fire the source and destination components with different frequency.
Consider a simple connection between three components, as shown in Figure 9-1.
Figure 9-1. Simple Connection of SDF Components Illustrates Balance Equations Constructing a Schedule
The symbols adjacent to the ports, such as NA1, represent the number of tokens consumed or produced by that port when the component fires. For many signal processing components, these numbers are simply one, indicating that only a single token is consumed or produced when the component fires. But there are three basic circumstances in which these numbers differ from one:
• Vector processing in the SDF domain can be accomplished by consuming and producing multiple tokens on a single firing. For example, a component that computes a fast Fourier transform (FFT) will typically consume and produce 2M samples when it fires, where M is an integer. Examples of vector processing components that work this way are FFT_Cx, Average, and FIR. This behavior is quite different from the matrix components, which operate on tokens where each individual token represents a matrix.
A
B
C
NA1
NB2NB1NC2
NC1
NA2
Synchronous Dataflow 9-3

Theory of Operation
• In multirate signal processing systems, a component may consume M samples and produce N, thus achieving a sampling rate conversion of N/M. For example, the FIR component can optionally perform such a sampling rate conversion and, with an appropriate choice of filter coefficients, can interpolate between samples. Other components that perform sample rate conversion include UpSample, DownSample, and Chop.
• Multiple signals can be merged using components such as Commutator or a single signal can be split into subsignals at a lower sample rate using the Distributor component.
To be able to handle these circumstances, the scheduler first associates a simple balance equation with each connection in the graph. For the graph in Figure 9-1, the balance equations are
This is a set of three simultaneous equations in three unknowns. The unknowns rA, rB, and rC are the repetitions of each actor that are required to maintain balance on each arc. The first task of the scheduler is to find the smallest non-zero integer solution for these repetitions. It is proven in Lee [1] that such a solution exists and is unique for every SDF graph that is consistent, as defined next.
How Schedulers Work
SDF is a restricted version of dataflow in which the number of data produced or consumed by a component per invocation is known at compile time. As the name implies, SDF can be used to model synchronous signal processing algorithms. In these algorithms, all of the sampling rates are rationally related to one another.
An SDF scheduler takes a simulation design and determines the sequence or order of invocation of each component. The simulator will simulate the design according to the schedule generated by the scheduler. ADS Ptolemy provides user-selectable schedulers for any given simulation:
• Classical scheduler
• Cluster loop scheduler
• Hierarchical scheduler
rANA1 rCNC1=
rANA2 rBNB1=
rBNB2 rCNC2=
9-4 Synchronous Dataflow

• Multithreaded scheduler
• Multirate scheduler
The trade-offs between them are typically the time needed to generate the schedule, the memory usage of storing the schedule data structure, and the memory usage of buffers for data collection.
Classical Scheduler
This is the classic scheduler from UC Berkeley Ptolemy, which tries to minimize the buffer sizes. It delays the firing of any block as long as possible. A component firing is deferred until none of the components that feeds data to it can be fired. It usually takes longer to generate the schedule than other schedulers, and has a large schedule size, but it uses less memory buffers across components. This scheduler is good for uni-rate designs.
Cluster Loop Scheduler
This scheduler generates single-appearance schedules that take less time than the classical scheduler. The advantage of a single-appearance schedule is that it significantly reduces schedule size. Each component appears once in the schedule and possibly with a loop factor. However, the buffer memory usage will be increased by the loop factor. Most of the increased buffer memory usage can be reduced by clustering components and limiting the buffer increases to only between clusters. This scheduler is good for multirate designs such as wireless 2.5/3G.
Hierarchical Scheduler
This scheduler generates single-appearance schedules based on cluster loop scheduler. A hierarchical structure is used for storing different clusters. Disconnected graphs are controlled separately to avoid unnecessary memory usage of multirate designs. Simulation time is also reduced when any graph finishes earlier than the other.
Multithreaded Scheduler
This scheduler is based on the cluster loop scheduler that uses multithreading techniques to achieve speedup on multiprocessor machines. It extracts parallelism from synchronous dataflow graphs and distributes the load among multiple threads. The actual speedup depends on the complexity of designs and the number of processors used. However, speedup does not scale linearly to the number of
Synchronous Dataflow 9-5
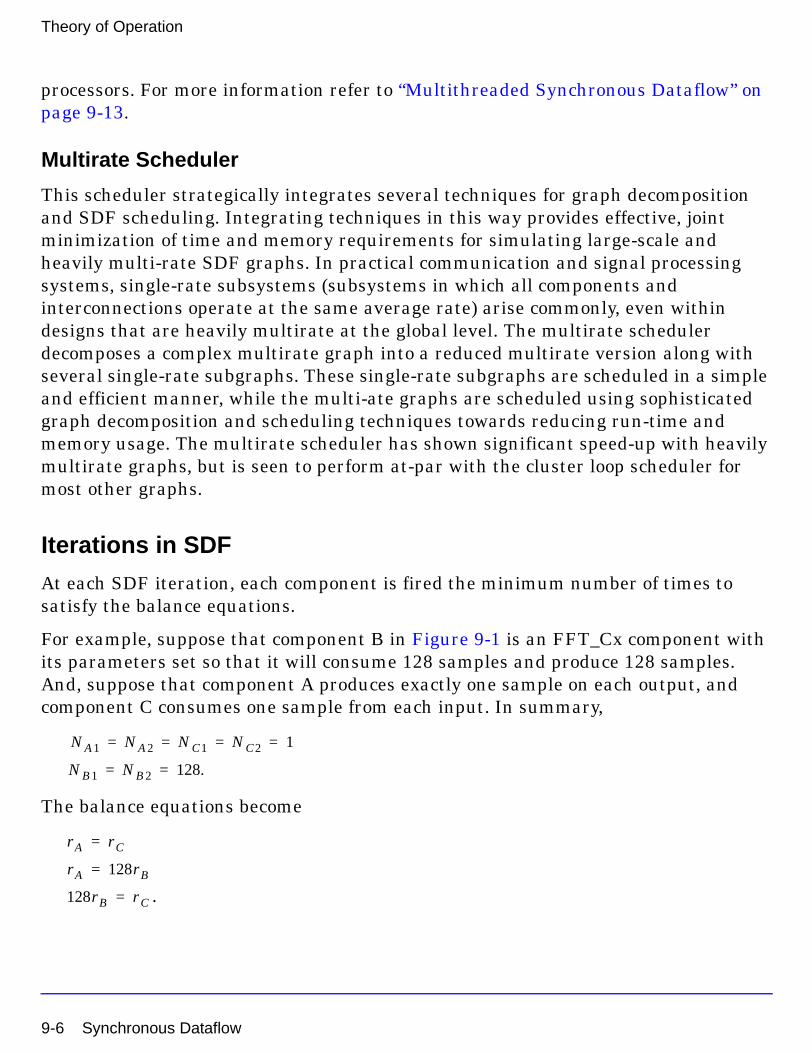
Theory of Operation
processors. For more information refer to “Multithreaded Synchronous Dataflow” on page 9-13.
Multirate Scheduler
This scheduler strategically integrates several techniques for graph decomposition and SDF scheduling. Integrating techniques in this way provides effective, joint minimization of time and memory requirements for simulating large-scale and heavily multi-rate SDF graphs. In practical communication and signal processing systems, single-rate subsystems (subsystems in which all components and interconnections operate at the same average rate) arise commonly, even within designs that are heavily multirate at the global level. The multirate scheduler decomposes a complex multirate graph into a reduced multirate version along with several single-rate subgraphs. These single-rate subgraphs are scheduled in a simple and efficient manner, while the multi-ate graphs are scheduled using sophisticated graph decomposition and scheduling techniques towards reducing run-time and memory usage. The multirate scheduler has shown significant speed-up with heavily multirate graphs, but is seen to perform at-par with the cluster loop scheduler for most other graphs.
Iterations in SDF
At each SDF iteration, each component is fired the minimum number of times to satisfy the balance equations.
For example, suppose that component B in Figure 9-1 is an FFT_Cx component with its parameters set so that it will consume 128 samples and produce 128 samples. And, suppose that component A produces exactly one sample on each output, and component C consumes one sample from each input. In summary,
The balance equations become
.
NA1 NA2 NC1 NC2 1= = = =
NB1 NB2 128.= =
rA rC=
rA 128rB=
128rB rC=
9-6 Synchronous Dataflow

The smallest integer solution is
.
Hence, each iteration of the system includes one firing of the FFT_Cx component and 128 firings each of components A and B.
It is not always possible to solve the balance equations. Suppose that in Figure 9-1 we have
.
In this case, the balance equations have no non-zero solution. The problem with this system is that there is no sequence of firings that can be repeated indefinitely with bounded memory. If we fire A,B,C in sequence, a single token will be left over on the arc between B and C. If we repeat this sequence, two tokens will be left over. Such a system is said to be inconsistent, and is flagged as an error. The SDF scheduler will refuse to run it.
Deadlocks
While scheduling a system, it is possible that all firings specified in the repetition vector will not be completed because none of the remaining components are enabled. Such a system is said to be a deadlock state. Figure 9-2 illustrates a system in such a state.
Figure 9-2. Deadlocked SDF System
The repetitions vector for this system is:
.
Thus this system is consistent; however, neither A nor B are enabled because each is waiting for one token from the other. The way to resolve this deadlock is to introduce
rA rC 128= =
rB 1=
NA1 NA2 NC1 NC2 NB1 1= = = = =
NB2 2=
A B
1
1
1
1
rA 1=
rB 1=
Synchronous Dataflow 9-7

Theory of Operation
an initial token on one of the two arcs in the figure. This initial token is known as a delay.
The Delay component (symbolized by a component with a diamond that is connected to an arc) has a single parameter for the number of samples of delay to be introduced. In the SDF domain, a delay with parameter equal to one is simply an initial token on an arc. This initial token may enable a component, assuming that the destination component for the delay arc requires one token in order to fire. To avoid deadlock, all feedback loops must have delays. The SDF scheduler will flag an error if it finds a loop with no delays. For most token types, the initial value of a delay will be zero.
By default, a delay has a zero value. To specify a specific value for the initial token, use the InitDelay token.
There are a number of specialized components in ADS Ptolemy that add a delay on an arc, such as DelayRF, VcDelayRF, ShiftRegPPSyn, ShiftRegPSSyn, ShiftRegSPSyn, and CounterSyn. Delay_M is used for matrices.
Deadlock Resolution
In ADS Ptolemy, an optional deadlock resolution algorithm can determine where Delay components need to be inserted. If preferred, the delay components can be automatically spliced in.
For the DF (data flow) controller, an Options item DeadlockManager has 3 options:
• Report deadlock The ADS Ptolemy simulator will simply report deadlocks if the schedule has failed because of a deadlock.
• Identify deadlocked loops A new algorithm is turned on to locate where the problem occurs. By using this algorithm, ADS Ptolemy highlights each loop that has deadlocked.
• Resolve deadlock by inserting tokens ADS Ptolemy will automatically resolve the deadlock by inserting delays. This option must be used with care. In general, there are many places ADS Ptolemy can insert a delay to break a deadlock; each can lead to different simulation results.
9-8 Synchronous Dataflow

Timed Synchronous DataflowTimed synchronous dataflow is an extension of SDF. TSDF adds a Timed data type (described in Chapter 5, Using Data Types). For each token of the Timed type, both a time step and a carrier frequency must be resolved.
ADS examples directories contain numerous application examples that rely on TSDF semantics. To view these examples, chose File > Example Project, a dialog box appears. Select the DSP/ModemTimed_prj directory for one group of TSDF examples.
Note that the ADS Ptolemy (Pt) simulation time domain signals are different from those used for Circuit Envelope (CE) and Transient (T) simulation.
• For Pt, the simulation time step is not global and the input signals for different components may have a different time step. However, the simulation time step at each node of a design, once set at time=0, remains constant for the duration of the simulation. The time step is initially set by the time domain signal sources or numeric to timed converters. The time step in the data flow graph may be further changed due to upsample (decreases the time step by the upsampling factor) and/or down sample (increases the time step by the downsample factor) components. The time step associated with signals at the inputs of the timed sinks may or may not be the same as the one that was initiated by the timed sources or numeric to timed converters. This is dependent on any up or down sampling that may have occurred in the signal flow graph.
• For CE, the simulation time step is set by the simulation controller and is constant for the duration of the simulation. This is global for all components simulated in the design.
• For T, the simulation maximum time step is set by the simulation controller, but the actual simulation time step may vary for the duration of the simulation. This simulation time step is global for all components simulated in the design.
• For Pt, each timed sink that sends data to Data Display has time values that are specific to the individual sink and may or may not be the same as the time values associated with data from other timed sinks.
• For CE and T, all time domain data sent to Data Display has the same global time value.
Timed Synchronous Dataflow 9-9

Theory of Operation
• For CE, a time domain signal may have more than one carrier frequency associated with it concurrently. The carrier frequencies in the simulation are harmonically related to the frequencies defined in the CE controller and their translated values that result from nonlinear devices.
• For Pt, a time domain signal has only one characterization frequency associated with it. This characterization frequency is also typically the signal carrier frequency. However, the term carrier frequency is more typically used to mean the RF frequency at which signal information content is centered. A signal has one characterization frequency, but the signal represented may have information content centered at one or more carrier frequencies. This would occur when several RF bandpass signals at different carrier frequencies are combined to form one total composite RF signal containing the full information of the multiple carriers.
Example
Two RF signals and their summation:
Arf = Ai*cos(wa*t) - Aq*sin(wa*t) with carrier frequency waBrf = Bi*cos(wb*t) - Bq*sin(wb*t) with carrier frequency wbThe summation of these two signal, Crf, can be represented at one characterization frequency, wc, as follows:Crf = Ci*cos(wc*t) - Cq*sin(wc*t) with carrier frequency wcwherewc = max(wa, wb)Ci = Ai + Bi*cos((wa-wb)*t) + Bq*sin((wa-wb)*t) (assuming wa > wb)Cq = Aq - Bi*sin((wa-wb)*t) + Bq*cos((wa-wb)*t) (assuming wa > wb)
Time Step Resolution
In TSDF, each Timed arc has an associated time step. This time step specifies the time between each sample. Thus the sampling frequency for the envelope of a Timed arc is 1/time step.
The sampling frequency is propagated over the entire graph, including both Timed and numeric arcs. To calculate a time step, the SDF input and output numbers of tokens consumed/produced are used.
For any given SDF or TSDF component, the sampling frequency of the component is defined as the sampling frequency on any input (or output) divided by the consumption (or production) SDF parameter on that port. After a sampling frequency is derived for a given component, it is propagated to every port by multiplying the
9-10 Timed Synchronous Dataflow

component’s rate with the SDF parameter of the port. A sample rate inconsistency error message is returned if inconsistent sample rates are derived.
Carrier Frequency Resolution
Each Timed arc in a timed dataflow system has an associated carrier frequency (Fc). These Fc values are used when a conversion occurs between Timed and other data types, as well as by the Timed components.
The Fc has either a numerical value, which is greater than or equal to zero (Fc ≥ 0.0), or is undefined (Fc = UNDEFINED). All Timed ports have an associated Fc ≥ 0.0. Non-timed ports have an UNDEFINED Fc.
During simulation, all Fc values associated with all Timed ports are resolved by the simulator. The resolution algorithm begins by propagating the Fc specified by the user in the Timed sources parameter Fcarrier until all ports have their associated Fc. At times, the user may have specified incompatible carrier frequencies, and ADS Ptolemy will return an error message.
In the feedforward designs, the algorithm will converge quickly to a unique solution. In the designs with feedback, the algorithm takes additional steps to resolve the carrier frequency at all pins.
For feedback paths, a default Fc is assigned by the simulator. This default Fc is then propagated until the Fc converges on the feedback path. This Fc is occasionally non-unique. To specify a unique value, use the SetFc Timed component.
Input/Output Resistance
Resistors can be used with timed components. Resistors provide a means to support analog/RF component signal processing. They provide definition of analog/RF input and output resistance, additive resistive Gaussian thermal (Johnson) noise, and power-level definition for time-domain signals.
Though resistors are circuit components, they are used in the data flow graph by defining their inputs from the outputs of connected TSDF components and their outputs at connected TSDF component inputs.
Figure 9-3 shows two TSDF components, T1 and T2, with an interconnected series resistor, R1, at the output of T1 and a shunt resistor, R2, at the input of T2. Such interconnected resistors are collected and replaced with the appropriate signal
Timed Synchronous Dataflow 9-11

Theory of Operation
transformation model that includes time-domain signal scaling and additive thermal noise.
Figure 9-3. TSDF Components with Interconnected Output (R1) and Input (R2) Resistors
Resistors contribute additive thermal noise (kTB) to signals when the specified
resistance temperature (RTemp) is greater than absolute zero (-273.16 o C) where:
k = Boltzmann’s constantT = temperature in KelvinB = simulation frequency bandwidth
1/2 / TStep if signal is a timed baseband signal1 / TStep if signal is a timed complex envelope signal
T1 T2R1
R2
9-12 Timed Synchronous Dataflow

Multithreaded Synchronous DataflowThe multithreaded scheduler, targeted for multiprocessor workstations, can significantly reduce the run time of multi-rate SDF simulations. The basic idea behind the scheduler is to realize the potential parallelism that exists in an SDF graph and transform the efficient uniprocessor hierarchical cluster looped schedule into a multithreaded parallel schedule for the simulation environment.
Parallelism with Clustering
The main idea behind cluster loop scheduling is to limit the explosion of nodes in an SDF schedule while minimizing the buffer memory requirement. Figure 9-4 shows a chain-structured multi-rate SDF graph. Using the classical scheduling to minimize buffer usage, a component will fire when their input requirement is fulfilled. The schedule will use the minimum amount of buffer 4+1+4=9 but the schedule will consist of 41 nodes, ABCABCDABC…, before it repeats again.
Figure 9-4.
Using looped scheduling, the schedule becomes (9A)(12B)(12C)(8D) which greatly reduces the nodes into four where each has a loop factor. Unfortunately, the buffer memory requirement has gone up to 36+12+24=72. With the help of clustering, the schedule can be transformed into (3[(3A)(4B)])(4[(3C)(2D)]), grouping A and B into cluster α, C and D into cluster β. The resultant memory requirement is 12+12+6=30, not as good as the minimal but less than half of looped scheduling.
B C CA
4 13 1 32
Gf
Multithreaded Synchronous Dataflow 9-13

Theory of Operation
Figure 9-5.
Now if we apply α and β using pipelining on dual processors machine, two threads can run independently, one thread fires 21 components and the other 20 components before they synchronize at the end of the time slot. Let us assume that each component firing consumes 2 cycles, and thread synchronization takes 10 cycles. A single processor will finish the schedule in 82 cycles. In the 2 processor scenario, it will take max(42,40)+10=52 cycles to finish the schedule. Furthermore, one can do schedule unfolding to increase the workload before the synchronization of each thread to generate higher throughput. The drawback with schedule unfolding is the proportional increase in memory buffer requirement.
Note Data dependency issues and exact algorithms to increase parallelism are beyond the scope of this document and will not be discussed.
Memory Overhead
The classic trade-off between memory and speed happens in Multithreaded SDF scheduling. When loop unfolding is in effect (applicable to small designs only), the buffer size increase is proportional to the number unfolding. This is in contrast to pipelining of clusters, where buffer size is doubled. And, only the buffers that bridge across clusters are doubled; buffers connecting components within a single cluster remain the same size.
9-14 Multithreaded Synchronous Dataflow

Sample Results
A subset of WLAN and 3GPP designs results are listed here. All designs are shipped as example designs. Results are gathered by running the designs on a dual-processor PC (specifics of PC) with the cluster looped and multithreaded scheduler:
Simulation controls associated with the above designs are modified such that the simulation time is normalized to fall between 10 and 90 minutes. The average speedup for a dual-processor machine is approximately 1.76x.
The next list of designs indicate a set which takes a much shorter time (3 - 10 minutes). The idea was to observe the speedup among designs that take less time to simulate. As seen here, shorter simulation time gives a slightly smaller speedup due to the overhead of the multithreaded scheduler. Again, speedup depends on the parallelism of a design. The average speedup here is 1.68x.
WLAN 3GPP
Simulation Time (seconds)
SpeedupCluster Looped
Multi-Threaded
WLAN_80211a_RxNonAdjCh_12Mbps.dsn 5090 3512 1.45
UE_Rx_In_Band_Blocking.dsn 2701 1406 1.92
WLAN_80211a_RxAdjCh_9Mbps.dsn 2634 2058 1.28
WLAN_80211a_RxNonAdjCh_48Mbps.dsn 2230 1006 2.22
WLAN_80211a_RxSensitivity_6Mbps.dsn 1762 1949 0.90
WLAN_80211a_ChannelCoding.dsn 1567 1229 1.28
WLAN_80211a_RxAdjCh_18Mbps.dsn 1485 755 1.97
WLAN_80211a_GI.dsn 1261 1138 1.11
UE_Rx_ACS.dsn 1245 500 2.49
WLAN_80211a_RxAdjCh_36Mbps.dsn 976 517 1.89
UE_Rx_MaxLevel.dsn 823 329 2.50
UE_Rx_MaxLevel.dsn 815 333 2.45
WLAN_80211a_RxSensitivity_24Mbps.dsn 626 429 1.46
WLAN_80211a_TxEVM_Turbo.dsn 617 360 1.71
Multithreaded Synchronous Dataflow 9-15

Theory of Operation
Reentrancy
Due to reentrancy issues, some simulations may not demonstrate a desired speedup improvement. For example, Analog/RF cosimulation limitations allow only one processor to perform execution in Analog/RF portion. Multithreading will only be on for the Ptolemy portion.
Thread-Safe Programming
In order to satisfy reentrancy, some components have serial regions to ensure proper multithreading simulations. Custom models can usually be made thread-safe by not relying on static data and the communication between models with global data.
It is not always possible to avoid using this type data structure when designing a model. When it is used, you will be responsible for any data synchronization that is necessary.
WLAN 3GPP
Simulation Time (seconds)
SpeedupCluster Looped
Multi-Threaded
WLAN_80211a_TxEVM.dsn 578 437 1.324
UpLk_1DPCCH_5DPDCH.dsn 519 298 1.741
UpLk_1DPCCH_6DPDCH.dsn 510 294 1.734
DnLk_DPCH.dsn 495 243 2.047
UpLk_1DPCCH_3DPDCH.dsn 489 289 1.692
DnLk_TestModel.dsn 486 250 1.944
UpLk_1DPCCH.dsn 484 244 1.987
DnLk_PCCPCH_SCH.dsn 482 241 2
UpLk_1DPCCH_4DPDCH.dsn 481 287 1.688
UpLk_1DPCCH_1DPDCH.dsn 473 273 1.731
WLAN_80211a_RxSensitivity_54Mbps.dsn 402 284 1.423
UpLk_1DPCCH_2DPDCH.dsn 349 214 1.631
WLAN_80211a_TxSpectrum.dsn 301 197 1.539
3GPPFDD_UE_Tx_12_2.dsn 274 246 1.111
UE_Rx_RefLevel_PhyCHBER.dsn 249 149 1.671
9-16 Multithreaded Synchronous Dataflow
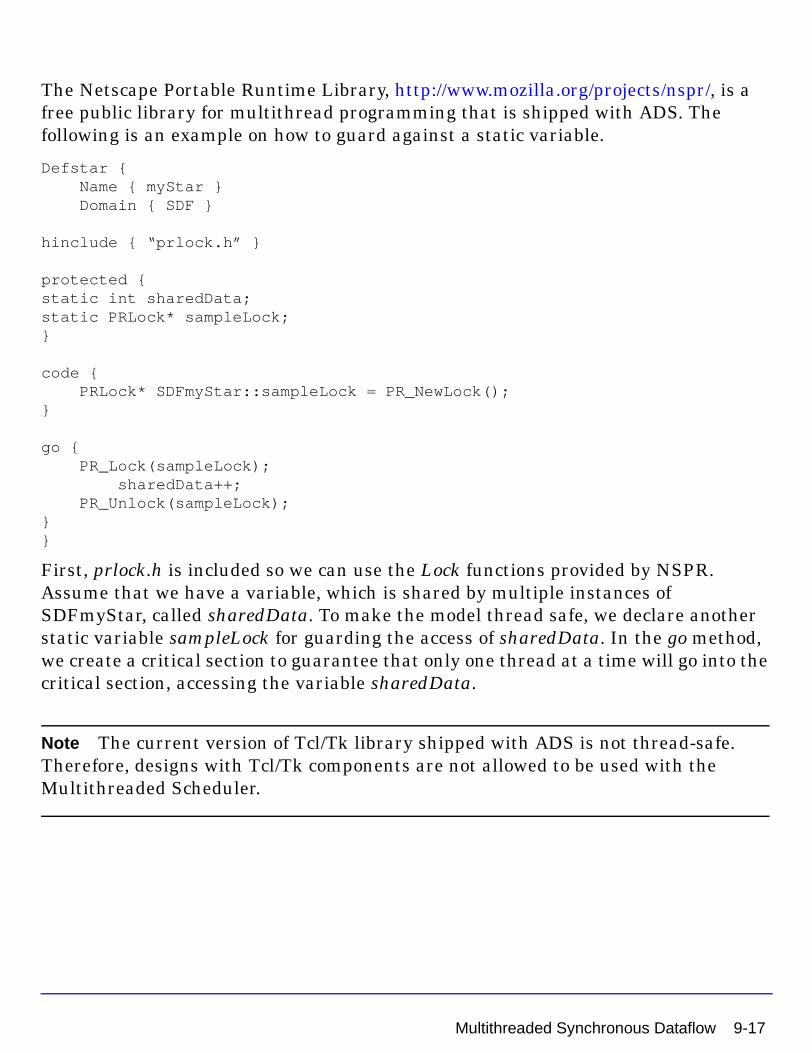
The Netscape Portable Runtime Library, http://www.mozilla.org/projects/nspr/, is a free public library for multithread programming that is shipped with ADS. The following is an example on how to guard against a static variable.
Defstar { Name { myStar } Domain { SDF }
hinclude { “prlock.h” }
protected {static int sharedData;static PRLock* sampleLock;}
code { PRLock* SDFmyStar::sampleLock = PR_NewLock();}
go { PR_Lock(sampleLock); sharedData++; PR_Unlock(sampleLock);}}
First, prlock.h is included so we can use the Lock functions provided by NSPR. Assume that we have a variable, which is shared by multiple instances of SDFmyStar, called sharedData. To make the model thread safe, we declare another static variable sampleLock for guarding the access of sharedData. In the go method, we create a critical section to guarantee that only one thread at a time will go into the critical section, accessing the variable sharedData.
Note The current version of Tcl/Tk library shipped with ADS is not thread-safe. Therefore, designs with Tcl/Tk components are not allowed to be used with the Multithreaded Scheduler.
Multithreaded Synchronous Dataflow 9-17

Theory of Operation
References[1] J. B. Dennis, First Version Data Flow Procedure Language, Technical Memo
MAC TM61, May 1975, MIT Laboratory for Computer Science.
[2] E.A. Lee and D. G. Messerschmitt, “Static Scheduling of Synchronous Data Flow Programs for Digital Signal Processing,” IEEE Trans. on Computers, vol. 36, no. 1, pp. 24-35, January 1987.
[3] E.A. Lee and D. G. Messerschmitt, “Synchronous Data Flow,” Proc. of the IEEE, vol. 75, no. 9, pp. 1235-1245, September 1987.
[4] R.M. Karp and R. E. Miller, “Properties of a Model for Parallel Computations: Determinancy, Termination, Queueing,” SIAM Journal, vol. 14, pp. 1390-1411, November 1966.
9-18 References

Chapter 10: Introduction to MATLAB CosimulationThe MATLAB® models provide an interface between ADS Ptolemy and MATLAB, a numeric computation and visualization environment from The MathWorks, Inc. All ADS Ptolemy MATLAB Cosimulation models can be found in the Numeric Matlab palette and library on the DSP Schematic.
ADS provides the Import MATLAB Function Tool, an easy-to-use wizard interface enabling a user to create custom MATLAB models. These models can be for a MATLAB script, .m file function, or built-in MATLAB function. The wizard generates models that are essentially subnetworks containing one of the core infrastructure models listed in Table 10-1. To learn more about the Import MATLAB Function Tool see Importing MATLAB Functions in the User-Defined Models documentation. For details about the MATLAB models, see MATLAB Blocks in the Signal Processing Components documentation.
ADS Ptolemy handles the conversion of data to and from MATLAB. Since MATLAB Cosimulation involves multiple environments and associated inter-process communication, the installation and pre-simulation configuration must be precise and correct for the infrastructure to work as expected. To ensure proper operation, the instructions provided in “Setting Up MATLAB Cosimulation” on page 10-2 must be followed as described whether or not the model is built into ADS Ptolemy or is user-defined.
Table 10-1. MATLAB Models Built into ADS Ptolemy
Type of MATLAB Model Description Model Name
Models that interpret a MATLAB script The script can contain a function, command, statement or several statements.
MatlabCx_MMatlabFCx_MMatlabF_MMatlabSinkMatlabSinkFMatlab_M
Models that can compile and import a MATLAB function as a shared library
The function can be implemented in a .m file or a pre-compiled shared library.
MatlabLibLinkMatlabLibLinkCx
Models that call specific MATLAB built-in functions
These models are available in the DSP schematic’s Numeric Matlab palette and library.
AwgnCxEigCx_MErfErfc Norm_MRandDeintrlvRandIntrlvSVD_Cx_M
10-1

Introduction to MATLAB Cosimulation
Supported MATLAB VersionsADS Ptolemy MATLAB Cosimulation requires MATLAB and supports these MATLAB versions:
• MATLAB Release 13 (version 6.5 Service Pack 1)
• MATLAB Release 14 (version 7.1 Service Pack 3)
For cosimulation in script-mode, there is no significant difference between the two versions. However, the steps to configure the two versions can be different if it is not done using the automation process defined in “Automated Configuration Process” on page 10-3. For cosimulation in compiled-mode, the newer version of the MATLAB compiler can be expected to perform slower than the older version. This is due to a major change in the implementation of the newer version.
Note MATLAB Cosimulation is supported only on native 32-bit platforms or through 32-bit compatibility mode on 64-bit platforms.
Setting Up MATLAB CosimulationMATLAB must be configured correctly before using cosimulation. If a MATLAB model is run and MATLAB is not configured correctly, ADS Ptolemy will report an error. See “On Windows” on page 10-2 or “On UNIX” on page 10-3 for platform-specific configuration information.
On Windows
For most Windows users, ADS Ptolemy MATLAB Cosimulation will work as expected when MATLAB and ADS are installed. Only the PATH environment variable must be set after installing ADS and MATLAB. This will support script-mode, library-importing mode, and MATLAB compiler use. The PATH environment variable should include the bin directory under the MATLAB root directory. This example shows how PATH can be set:
set PATH=<matlabroot>\bin\win32;%PATH%
Typically, PATH is set by the MATLAB installer which also registers the COM components in the Windows registry. Using MATLAB Cosimulation library-importing mode which requires precompilation requires additional
10-2 Supported MATLAB Versions

configuration; for details, see “Finishing the MATLAB Compiler Configuration” on page 10-6.
On UNIX
Setting up MATLAB on UNIX platforms can be an involved process since multiple environment variables must be set correctly before cosimulation will work as expected. To help simplify this configuration procedure, an automated process is defined through the hpads.cfg file. If you prefer the manual configuration, see “Manual Configuration Process” on page 10-3.
Automated Configuration Process
The automated configuration process uses the configuration file hpads.cfg. For more details on the hpads.cfg file, see the chapter Customizing the ADS Environment located in the Customization and Configuration documentation.
Set the MATLAB configuration variable to point to the root of your MATLAB installation. An example of this setting is:
MATLAB=/usr/local/matlab
If you are using MATLAB Release 14 (Version 7.1 Service Pack 3), set the MATLABREL variable to 14. An example of this setting is:
MATLABREL=14
This is required since the MATLAB shared library paths and compiler options are incompatible between versions. By setting this variable, the shared library paths are configured correctly on ADS start-up and compiler options are determined dynamically during simulation.
If the command to invoke MATLAB is not matlab, set the MATLABCMD configuration variable to the correct command. For example, you might set it to
MATLABCMD="matlab -c /path/to/license/file"
so that matlab correctly finds its license file. Typically, you will not need to set the MATLABCMD variable.
Manual Configuration Process
You can configure manually all the variables required for MATLAB cosimulation without using the hpads.cfg file. In this case, you must configure the following
Setting Up MATLAB Cosimulation 10-3

Introduction to MATLAB Cosimulation
environment variables. The example commands below assume you are using a C-shell or equivalent; modify this command as needed for other shells.
• Set an environment variable named MATLAB that points to the root of your MATLAB installation as shown in this example:
setenv MATLAB /usr/local/matlab
• If you are using MATLAB Release 14 (Version 7.1 Service Pack 3), set an environment variable named MATLABREL to 14 as shown in this example:
setenv MATLABREL 14
This is required since the MATLAB compiler options are incompatible between versions. By setting this variable, the compiler options will be determined dynamically during simulation.
• If the command to invoke MATLAB is not matlab, set the MATLABCMD configuration variable to the correct command. For example, you might set it to
setenv MATLABCMD matlab -c /path/to/license/file
so that matlab correctly finds its license file. Typically, you will not need to set the MATLABCMD variable.
• Set an environment variable named MLM_LICENSE_FILE to point to the MATLAB license file server as shown in this example:
setenv MLM_LICENSE_FILE myport:myserver.mydomain.com
MATLAB Compiler Configuration
To generate a MATLAB shared library using MATLAB library-importing components, the MATLAB Compiler 3.0/4.0 with a valid license must be installed on the system.
The following environment variable settings are required for MATLAB Compiler use on supported UNIX and Linux platforms:
setenv XAPPLRESDIR $MATLAB/X11/app-defaults
The following shared library paths should be appended to the platform-specific shared library path variable:
10-4 Setting Up MATLAB Cosimulation

Linux_x86
MATLAB Release 13
setenv LD_LIBRARY_PATH$MATLAB/bin/glnx86:$MATLAB/extern/lib/glnx86:$MATLAB/sys/os/glnx86
MATLAB Release 14
setenv LD_LIBRARY_PATH$MATLAB/bin/glnx86:$MATLAB/extern/lib/glnx86:$MATLAB/sys/os/glnx86:$MATLAB/sys/java/jre/glnx86/jre1.5.0/lib/i386/native_threads:$MATLAB/sys/java/jre/glnx86/jre1.5.0/lib/i386/client:$MATLAB/sys/java/jre/glnx86/jre1.5.0/lib/i386
Sun Solaris
MATLAB Release 13
setenv LD_LIBRARY_PATH$MATLAB/sys/os/sol2/:$MATLAB/bin/sol2:$MATLAB/extern/lib/sol2
MATLAB Release 14
setenv LD_LIBRARY_PATH/user/lib/lwp:$MATLAB/sys/os/sol2/:$MATLAB/bin/sol2:$MATLAB/extern/lib/sol2:$MATLAB/sys/java/jre/sol2/jre1.5.0/lib/i386/native_threads:$MATLAB/sys/java/jre/sol2/jre1.5.0/lib/i386/native_threads:$MATLAB/sys/java/jre/sol2/jre1.5.0/lib/i386
HP-UX
MATLAB Release 13
LD_LIBRARY_PATH$MATLAB/sys/os/hpux/:$MATLAB/bin/hpux:$MATLAB/extern/lib/hpux:
MATLAB Release 14
setenv SHLIB_PATH$MATLAB/sys/os/hpux/:$MATLAB/bin/hpux:$MATLAB/extern/lib/hpux:$MATLAB/sys/java/jre/hpux/jre1.5.0/lib/i386/native_threads:$MATLAB/sys/java/jre/hpux/jre1.5.0/lib/i386/native_threads:$MATLAB/sys/java/jre/hpux/jre1.5.0/lib/i386
Setting Up MATLAB Cosimulation 10-5

Introduction to MATLAB Cosimulation
Finishing the MATLAB Compiler Configuration
To complete the MATLAB compiler configuration on all supported platforms (UNIX/Linux/Windows), one additional step is required. The MATLAB compiler must know which native C++ compiler to use to compile the C++ wrapper files it generates. This can be selected by running the following script on all platforms:
<matlabroot>/bin/<arch>/mbuild -setup
This is a one-time step per user and need not be repeated.
To verify that the MATLAB compiler has been configured correctly, run the command:
<matlabroot>/bin/<arch>/mcc
from the command line. Usage of mcc and command line options will be displayed if mcc has been configured correctly.
Simulating with MATLAB (Script-Interpreting)MATLAB distinguishes between complex matrices and floating-point (real) matrices. ADS Ptolemy distinguishes between models that produce data and models that do not. Table 10-2 lists six script-interpreting MATLAB models available in ADS Ptolemy; two produce floating-point (real) matrices, two produce complex-valued matrices, and two are sinks that do not produce data. All models can accept any number of inputs provided that the inputs have the same data type, either floating-point (real) or complex.
These models use a common MATLAB engine interface that is managed by a base MATLAB model. The base model does not have any inputs or outputs. It provides methods for starting and killing a MATLAB process, evaluating MATLAB commands,
Table 10-2. Script-Interpreting ADS Ptolemy Models
Model Description
Matlab_M Evaluates a MATLAB expression and outputs results as floating-point (real) matrices.
MathlabF_M Evaluates a MATLAB script file and outputs results as floating-point (real) matrices.
MatlabCx_M Evaluates a MATLAB expression and outputs results as complex-valued matrices.
MathlabFCx_M Evaluates a MATLAB script file and outputs results as complex-valued matrices.
MatlabSink Evaluates a MATLAB expression a fixed number of times.
MatlabSinkF Evaluates a MATLAB script file a fixed number of times.
10-6 Simulating with MATLAB (Script-Interpreting)

managing MATLAB figures, changing directories in MATLAB, and passing ADS Ptolemy matrices into and out of MATLAB. Currently, the base model supports 2-D real and complex-valued matrices only.
The MATLAB interpreter’s working directory is set to the ScriptDirectory parameter, if it is given. Any custom MATLAB models will be searched from there, and any output files will be written there.
Figures generated by a MATLAB model are managed according to the value of the DeleteOldFigures parameter. If this parameter is set to Yes, the MATLAB model will close any MATLAB plots or graphics when it is destroyed. If set to No, the figures must be closed manually.
Writing Functions for MATLAB Models (Script-Interpreting)There are several ways in which MATLAB commands can be specified in the MATLAB models in the MatlabFunction parameter.
If only a MATLAB function name is given for this parameter, the function is applied to the inputs in order. The function’s outputs are sent to the model’s outputs.
For example, specifying eig means to perform the eigendecomposition of the input. The function will be called to produce one or two outputs, according to how many output ports there are. If there is a mismatch in the number of inputs and outputs between the ADS Ptolemy model and the MATLAB function, then an error will be reported by MATLAB.
You may also explicitly specify how the inputs are to be passed to a MATLAB function and how the outputs are taken from the MATLAB function. For example, consider a two-input, two-output MATLAB model to perform a generalized eigendecomposition. The command
[output#2, output#1] = eig( input#2, input#1 )
says to perform the generalized eigendecomposition on the two-input matrices, place the generalized eigenvectors on output#2, and the eigenvalues (as a diagonal matrix) on output#1. Before this command is sent to MATLAB, all “#” characters are replaced with the underscore character “_” because “#” is illegal in a MATLAB variable name.
The MATLAB models also allow a sequence of commands to be evaluated. Continuing with the previous example, we can plot the eigenvalues on a graph after taking the generalized eigendecomposition:
Writing Functions for MATLAB Models (Script-Interpreting) 10-7

Introduction to MATLAB Cosimulation
[output#2, output#1] = eig( input#2, input#1 ); plot( output#1 )
When entering such a collection of commands in ADS Ptolemy, both commands appear on the same line without a new line after the semicolon. In this way, very complicated MATLAB commands can be built up. We can make the plot of eigenvalues always appear in the same plot without interfering with other plots generated by other MATLAB models with this function (new lines are inserted after the semicolons to improve readability):
[output#2, output#1] = eig( input#2, input#1 );if ( exist(`myEigFig’) == 0 ) myEigFig = figure; end;figure(myEigFig);plot( output#1);
The MatlabSetup and MatlabWrapUp parameters are called during the model’s begin and wrap-up procedures. When used in Matlab_M or MatlabF_M components, these parameters can refer to a *.m file. During each of these procedures, data is not passed into or out of the model.
Because the same MATLAB interpreter is used for the entire simulation, variables are preserved from iteration to iteration. For example, the output of a Matlab_M model with settings:
MatlabSetUp = "x=ones(2;1)"MatlabFunction = "output#1=x(2)/x(1); x=[x(2),sum(x)];"
will converge on the golden mean. It is impossible, however, to share variables between different MATLAB components. Such a simulation would be non-deterministic.
Simulating with MATLAB (Library-Importing)Two models allow cosimulation between MATLAB and ADS through a native shared library. In MATLAB Release 13 (Version 6.5 Service Pack 1), shared library mode provides substantial speed improvement over script interpreting mode. However, in MATLAB Release 14, the MATLAB Compiler does not generate native C/C++ code, but rather an intermediate bytecode format that is interpreted at runtime by the MATLAB Compiler Runtime (MCR). According to Mathworks, this effectively makes the performance of the shared library mode to be on par with script-interpreting mode. If simulation performance is important for your needs, you may continue to use the older supported version of MATLAB.
The library-importing models use MATLAB Compiler to convert .m script files to shared libraries. This allows the sharing of libraries without exposing source files.
10-8 Simulating with MATLAB (Library-Importing)

You should be able to import a MATLAB .m script file directly without any code change.
The models are:
• MatlabLibLink
Evaluates a MATLAB expression and outputs the result as floating-point (real) matrices.
• MatlabLibLinkCx
Evaluates a MATLAB expression and outputs the result as complex-valued matrices.
The models accept the .m script file for matrices evaluation and an optional .m script file for passing setup parameters to the MATLAB environment. You can switch between scripting and shared library modes by changing the Mode parameter. Due to the limitation of the MATLAB Compiler, no figures are supported in the shared library mode.
The shared libraries are compiled in the project/data directory. By default, libraries are also imported from the project/data directory. Make sure that the current directory “.”, is in the library search path (i.e., LD_LIBRARY_PATH on Linux and Sun, SHLIB_PATH on HP-UX, and PATH on Windows). You can also set the library search path to a specified directory where pre-compiled libraries are located.
Users can manually generate shared libraries with Matlab Compiler 3.0/4.0. The exact mcc commands used by ADS are:
MATLAB Compiler 3.0
mcc -t -W lib:<libname> -T link:lib -h <function name1> <function name2><...> libmmfile.mlib libmwsglm.mlib
For example, to compile a gain.m file into a library called libmygain, the mcc command to generate a shared library for use with ADS is:
mcc -t -W lib:libmygain -T link:lib -h gain libmmfile.mlib libmwsglm.mlib
MATLAB Compiler 4.0
mcc -W lib:<libname> -T link:lib <function name1> <function name2> <...>
For example, to compile a gain.m file into a library called libmygain, the mcc command to generate a shared library for use with ADS is:
mcc -W lib:libmygain -T link:lib gain.m
Simulating with MATLAB (Library-Importing) 10-9

Introduction to MATLAB Cosimulation
ExamplesADS Ptolemy provides example projects containing designs demonstrating MATLAB cosimulation. These projects are available from the ADS Main window.
For a project with a design demonstrating how to use MATLAB models, selectFile > Example Project > DSP > dsp_demos_prj. SOMBRERO.dsn is a simple example that plots a SINC function demonstrating how to use several MATLAB models effectively.
For a project with designs demonstrating how to call a MATLAB.m file, selectFile > Example Project > DSP > MATLABlink_prj.
• Channel_Estimate.dsn demonstrates Script-Interpreting using Matlab_M.
• Channel_Estimate2.dsn demonstrates Library-Importing using MatlabLibLink.
10-10 Examples

Chapter 11: Cosimulation with Analog/RF SystemsSimulation of behavioral DSP designs along with analog/RF circuit designs is critical to the success of the integrated components, devices, and subsystems used in today’s wireless applications. The need to verify the impact of real-world analog/RF issues on the DSP algorithms and vice versa in a tightly integrated environment is highly desirable.
For designs of low complexity, it is possible to use separate simulators for the signal processing and analog/RF portions and then integrate the results. However, today’s state-of-the-art designs using a mix of analog/RF and dedicated on-chip DSP blocks require high levels of integration at the two-environment boundary. Advanced Design System cosimulation between signal processing and circuits addresses this need. ADS Ptolemy provides the signal processing simulation, while the analog/RF simulation is provided by either the Circuit Envelope or High-Frequency SPICE (Transient) simulators.
Other types of cosimulation include placing MATLAB components or HDL blocks in a signal processing simulation. This chapter describes cosimulation with analog/RF systems.
Note For information on A/RF cosimulation with Cadence refer to the RFIC Dynamic Link documentation located in the Design Flow area of the ADS Documentation set. See the chapter “Running a DSP and Analog/RF Cosimulation with RFIC Dynamic Link.”
Figure 11-1 shows a mixture of RF circuitry and DSP components. ADS provides a variety of analog/RF circuit simulators, including Linear, Harmonic Balance, Circuit Envelope, High-Frequency SPICE, and Convolution.
Note Circuit Envelope and High-Frequency SPICE simulators are included with some, not all, ADS suites.
For signal processing simulation, ADS Ptolemy is used. Only circuits simulated with either Circuit Envelope or High-Frequency SPICE can be instantiated as a subnetwork and included in a signal processing schematic. These circuit blocks can
11-1
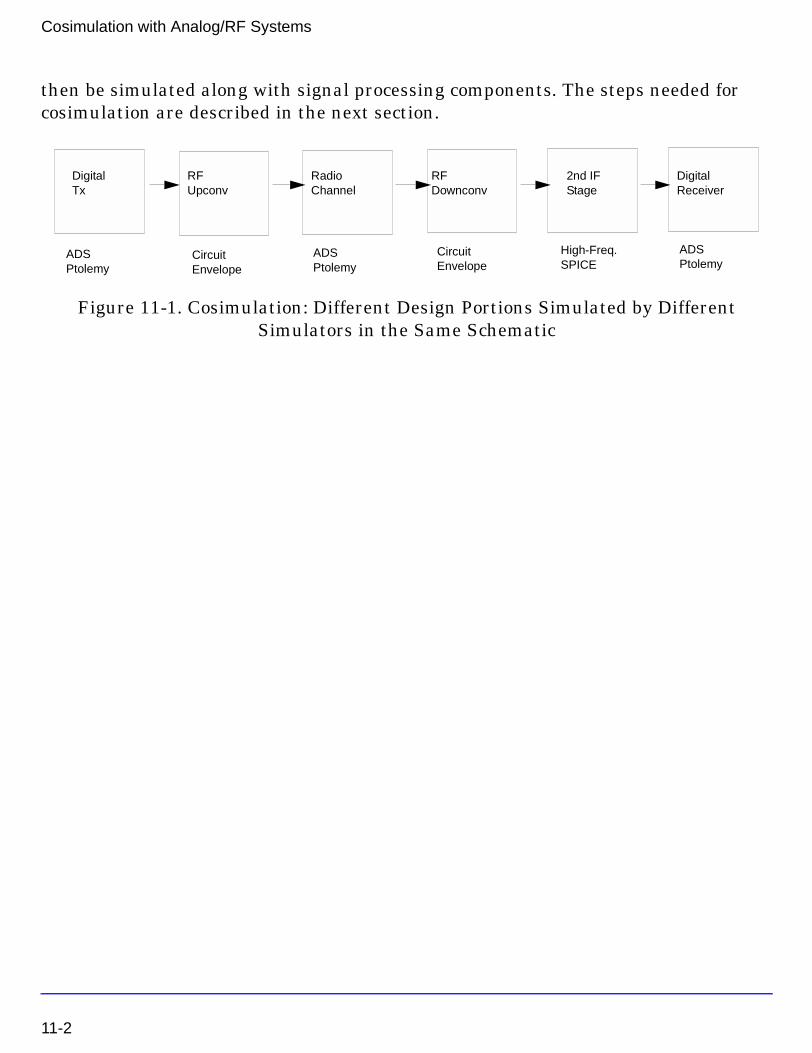
Cosimulation with Analog/RF Systems
then be simulated along with signal processing components. The steps needed for cosimulation are described in the next section.
Figure 11-1. Cosimulation: Different Design Portions Simulated by Different Simulators in the Same Schematic
DigitalTx
RFUpconv
RadioChannel
RFDownconv
2nd IFStage
DigitalReceiver
ADSPtolemy
CircuitEnvelope
ADSPtolemy
CircuitEnvelope
High-Freq.SPICE
ADSPtolemy
11-2

Setting Up the Analog/RF Circuit Schematic
Figure 11-2. Diode Rectifier Circuit Design Used in Cosimulation
To create circuit designs for cosimulation.
1. In the analog/RF circuit Schematic window, create a circuit schematic that includes a simulation component for either Circuit Envelope (called ENV) or High-Frequency SPICE simulation (called TRAN).
2. Generally, use Circuit Envelope for an RF simulation and High-Frequency SPICE (transient) for a baseband simulation.
3. Do not use Envelope and Transient simulators in the same design; if you want to keep both controllers in a design use activate/deactivate.
4. Add ports to your design.
5. Save your design.
In Figure 11-2, a diode rectifier is set to be simulated with the Circuit Envelope simulator. Next, we will place this subnetwork in the signal processing schematic where it will be represented as a block.
Setting Up the Analog/RF Circuit Schematic 11-3

Cosimulation with Analog/RF Systems
Setting Up the Signal Processing Schematic
Figure 11-3. Signal Processing Design Using Circuit Shown in Figure 11-2
To create signal processing designs for cosimulation:
1. To place the circuit subnetwork(s) you have already created in the signal processing schematic, choose Component > Component Library. Your opened projects are listed at the top of the list. Circuit projects have (A/RF) at the end.
2. Choose the circuit design you want and place it in your signal processing schematic.
3. Add the signal processing components.
4. Add the signal processing controller(s).
5. Connect the circuit design to the signal processing components.
6. For cosimulation with the Circuit Envelope simulator, see “Circuit Simulation Controllers” on page 11-5.
7. If your circuit subnetworks have feedback loops between them, see “Feedback Loops” on page 11-9.
8. If the input signal into the circuit subnetwork is not of type Timed, see “Numeric-to-Timed Converters” on page 11-5.
9. Select the initialization method of the circuit inputs in the Signal Processing DF controller; see “DF (Data Flow) Controller” on page 3-5.
10. Start the simulation.
Circuit Design (Diode Rectifier)
EnvOutSelector Component Used with Circuit Envelope Cosimulation
11-4 Setting Up the Signal Processing Schematic

Circuit Simulation Controllers
As stated earlier, ADS Ptolemy can cosimulate with only the Circuit Envelope or High-Frequency SPICE simulators. Any circuit simulation control components other than ENV or TRAN (such as for harmonic balance or S-parameter simulation) are ignored in the cosimulation from the signal processing schematic.
Numeric-to-Timed Converters
Both Circuit Envelope and Transient simulators deal with time-domain signals. Therefore, signal processing components connected to the circuit subnetwork must be the timed type. If the input component (connecting signal processing components to the circuit) produces numeric data, place an appropriate numeric-to-timed converter (such as float-to-timed or complex-to-timed) in your schematic. These components (located in the Signal Converters library) ensure that the input into the circuit subnetwork is in the time domain. Refer to “Time Converters” on page 11-14 for more information.
Automatic Verification Modeling (Fast Cosimulation)Automatic Verification Modeling is a simulation mode that can significantly accelerate formerly lengthy cosimulations of Analog/RF circuits. You can enable Automatic Verification Modeling in the Circuit Envelope Simulation Controller. When enabled, this mode characterizes an analog subcircuit into a behavior model, then the model is used to predict the response of the subcircuit at each time point. For details about Automatic Verification Modeling, see the documentation Simulation > Circuit Envelope Simulation > Theory of Operation > Automatic Verification Modeling (Fast Cosimulation).
The following steps demonstrate how to enable the fast cosimulation mode using PtolemyDocExamples/AVM_prj from the examples directory:
1. In the ADS Main window, choose File > Copy Project. This opens the Copy Project dialog box.
Automatic Verification Modeling (Fast Cosimulation) 11-5

Cosimulation with Analog/RF Systems
Note On UNIX platforms, you must copy an example project to a directory for which you have write permission. On Windows platforms, you can work directly in the Examples directories; however, it's better to copy examples to a working directory.
2. In the From Project area, click Example Directory, then click Browse. The Copy From File Browse dialog box opens showing the Examples directories.
3. Select the PtolemyDocExamples directory. On Windows, the list of available projects appears in the list.On UNIX, click Filter to see the list of projects.
4. On Windows, select AVM_prj. Click OK.On UNIX, in the Files list, select AVM_prj. Click OK.
5. In the To Project area, click Startup Directory or Working Directory to select the destination directory for the copied project. Click Browse to select another directory.
6. Select Copy Project Hierarchy to enable this option which ensures all appropriate directories and files are copied.Select Open Project After Copy to enable this option which opens the project immediately after copying.
7. Click OK to copy the project and close the dialog box.
8. In the ADS Main window, choose File > Open Project to open the Open Project dialog box. In the Directories list, select the directory to which you copied the example.On Windows, select RectifierCosim_prj, then click OK.On UNIX, double-click RectifierCosim_prj in the Files list.
9. In the Main window, choose File > Open Design to open the Open Design dialog box. In the Designs list, double-click TestMixer.dsn.
10. In the Schematic window, select DUT_Mix_sub, and push into its hierarchy, then push into the DUT_Mixer hierarchy as shown in the following figure.
11. In the DUT_Mixer, double-click the Envelope simulation controller to open its setup dialog. Select the Cosim tab, and click Enable AVM (Fast Cosim) to enable the mode.
11-6 Automatic Verification Modeling (Fast Cosimulation)

Hint To enable AVM (Fast Cosim) directly on the schematic, click the Display tab on the Circuit Envelope setup dialog. Enable the ABM_Mode parameter. On the schematic, set ABM_Mode=yes to enable the mode; set ABM_Mode=no to disable the mode.
Figure 11-4. Pushing into TestMixer.dsn Hierarchy to Enable AVM (Fast Cosim)
Automatic Verification Modeling (Fast Cosimulation) 11-7

Cosimulation with Analog/RF Systems
Clustering of Circuit SubnetworksClustering is the process of defining the boundaries of the signal processing and analog/RF simulators. Initially, this boundary is defined by circuit schematics, where you define the circuit subnetworks and then make an instance of those on the Signal Processing schematic. However, there is a bit more to clustering than what is on the two schematics.
Circuit subnetworks directly connected in the Signal Processing schematic are automatically clustered and treated as one circuit subnetwork, as shown in Figure 11-5. Therefore, use only one circuit simulation control component in either of the two (or more) directly connected subnetworks.
Figure 11-5. Connected Subnetworks Treated as One
Connected Circuit Subnetworks
When two circuit subnetworks defined on two different circuit schematics are connected on a Signal Processing schematic, the two circuit subnetworks are clustered into one (this is done transparently and should not concern the user). However, if each of these two circuit subnetworks use their own simulation controller, then the circuit engine would not know which one to choose for simulation and would result in an error message.
Connected Resistors
Another aspect of clustering is when circuit components available on the Signal Processing schematic (resistors in the first release of Advanced Design System) are
Signal Processing
Circuit 2 Subnetwork
Circuit 1 Subnetwork
Signal Processing
Signal Processing
Circuit Subnetwork
Signal Processing
11-8 Clustering of Circuit Subnetworks

connected to a circuit subnetwork. In this case, such resistors will be absorbed into the circuit subnetwork during the clustering and will be simulated by the circuit engine as part of circuit subnetwork.
Feedback LoopsCircuit subnetworks that form a feedback loop via signal processing components require a delay component in the feedback loop to facilitate the signal processing simulation scheduling, as shown in Figure 11-6 and Figure 11-7. If such a delay is not present, an error message will be issued. To have the program automatically insert the delay, you must edit the DF (data flow) controller parameters. To do this, double-click the controller, choose the Options tab, then select Resolve deadlock by inserting tokens from the DeadlockManager drop-down list. For more information about deadlocks, refer to “Deadlocks” on page 9-7 in Chapter 9, Theory of Operation.
Figure 11-6. Feedback Loop Before Delay Added by Program
Figure 11-7. Feedback Loop After Delay Added by Program (Delay Not Shown on Schematic)
SignalProcessing
Circuit 2Subnetwork
SignalProcessing
SignalProcessing
Circuit 1Subnetwork
SignalProcessing
Circuit Subnetwork
SignalProcessing
SignalProcessing
DelayComponent
Feedback Loops 11-9
Cosimulation with Analog/RF Systems
Named Connections and Measurements in Circuit DesignsNamed connections and measurements included in the circuit schematic design (such as for a voltage) are ignored in cosimulation. The only results you get from a cosimulation are obtained from the Signal Processing schematic using Sink components or Interactive Components and Displays items.
Circuit Envelope Specific RulesThe output of the Circuit Envelope simulator is a collection of time waveforms, each at a different fundamental frequency. You must select the waveform you want by specifying this fundamental frequency. You do this by choosing the EnvOutSelector or EnvOutShort component from the Circuit Cosimulation library. Refer to “EnvOutSelector and EnvOutShort Components” on page 11-15 for more information. Place this component at all circuit subnetwork output ports in the Signal Processing schematic.
Circuit Envelope simulation requires that many parameters be set up in the circuit schematic. For more information, refer to Advanced Design System’s Circuit Envelope Simulation documentation. For cosimulation, the key parameter is the Step parameter. This is the time step used by the simulator, and can be set equal to or less than the time step at the connecting port in the signal processing schematic design. Other important parameters for cosimulation (especially nonlinear designs) are MaxOrder, Freq[ ], and Order[ ]. Make sure that the OutFreq parameter specified at the EnvOutSelector or EnvOutShort component is among the fundamental frequency or harmonics specified by the Circuit Envelope controller.
To enable or disable the addition of noise from the Circuit Envelope components, use the Turn on all noise parameter in the Env Params tab. For cosimulation, the Nonlinear noise button, the Small-signal button, and their corresponding tab pages should not be used as they are not used during cosimulation. Note that explicit noise sources, such as V_Noise, are always on. The Turn on all noise enables or disables only the noise generated by non-source models, such as the resistors, lossy transmission lines, and transistors.
The amplitude of these noise sources is determined by the Circuit Envelope bandwidth, which is determined by 1/(Time Step). Normally, this Circuit Envelope timestep would be the same timestep as that used by Ptolemy, so the total noise bandwidths are the same. However, for designs where the Ptolemy waveform is
11-10 Named Connections and Measurements in Circuit Designs

changing too rapidly for the analog simulation and the user has reduced the Circuit Envelope timestep, then the Circuit Envelope noise bandwidth also increases. Depending on the circuit behavior, this broader bandwidth noise may appear at the circuit output, where it is now effectively sampled by the EnvOut element. This sampling will then alias all the higher bandwidth circuit noise, and result in a higher noise density within the Ptolemy noise bandwidth. If this is not the desired simulation behavior, then a filter may need to be placed at the circuit output. Of course, this will also filter any signals being passed back to the Ptolemy simulation.
Transient Simulation Specific RulesWhen cosimulation with ADS Ptolemy and the Transient simulator is required, the circuit schematic must have a Transient (Tran) simulation controller (a transient simulation component). No explicit user setting is required for the Tran controller; that is, the default parameters will work for cosimulation. However, the Tran controller’s Freq [x] parameter is required when there are any frequency-dependent sources. The Freq [x] parameter specifies the fundamental frequency.
There is a difference between ADS Ptolemy and the Transient simulator regarding how they treat signals at time=0- (before t=0) that may cause unexpected results; they have different simulation assumptions for time=0-. ADS Ptolemy assumes signal states at time=0- are zeros, while the Transient simulator assumes signal states at time=0- the same as time=0. For a circuit with a given input signal stimulus to give the same response for both Ptolemy/Transient cosimulation and for Transient simulation alone, the circuit signal stimulus for the Ptolemy/Transient cosimulation must have a zero value at time=0. If the signal stimulus into the circuit during a Ptolemy/Transient cosimulation is not zero at time=0, then the cosimulated Transient simulator will result in output signals that are not expected when compared to a Transient-alone simulation. To force the circuit input to be zero during a Ptolemy/Transient cosimulation, the workaround is to change the CktCosimInputs setting on the Options tab of the DF (data flow) controller (refer to “Options Tab” on page 3-7 for details).
Nested Simulation ApproachADS cosimulation is based on a nested simulation approach. In this use model, you first create your circuit designs on the circuit schematic. This circuit design can be tested using appropriate circuit sources and measurements with either the Circuit Envelope or High-Frequency SPICE simulators. Once the circuit design has been
Transient Simulation Specific Rules 11-11

Cosimulation with Analog/RF Systems
verified, ports to be interfaced with the signal processing design are identified and placed. Next, you place an instance of the design on the Signal Processing schematic and connect it to the other blocks. The combined schematic design can now be simulated.
Signal Processing Model of the Circuit Network
ADS Ptolemy uses a data flow simulation approach, and this simulation is controlled using the DF (data flow) controller component. To understand this chapter, you need to be aware that this simulation is based on invoking a schedule. A schedule tells the simulator engine to fire components in a certain order and with a certain frequency. A simulation is typically a repetition of a schedule many times.
From the data flow engine perspective, a circuit subnetwork on the Signal Processing schematic is just a component with a certain number of input and output ports. This circuit subnetwork is part of the schedule determined by the data flow engine. It would be fired just like any other component according to the schedule, and as many times as required. Every time the circuit subnetwork is fired, the circuit simulator (designated by the simulation controller on the circuit schematic) continues to carry on the simulation based on the input it receives from the signal processing interface. Once the circuit simulator completes its analysis, it passes the simulation results back to the signal processing interface. This cycle repeats as many times as the scheduler requires. The duration of the circuit simulation each time it is invoked is determined by the time step provided by the connecting signal processing component at the input interface to the circuit subnetwork.
Circuit Model of the Signal Processing Network
From the circuit simulator engine point of view, the signal processing input interface is viewed as an ideal (0 ohm impedance) source. The more ports at the input interface to the circuit, the more ideal sources there will be feeding the circuit subnetwork. At the output interface of the circuit, there would be a node where the results are shared with the connecting signal processing component.
Interface IssuesAt the interface boundary of the signal processing and analog/RF circuit simulators, there needs to be an exchange of information. The semantics and fundamentals of simulation in the two application areas are quite different and therefore, you need to
11-12 Interface Issues
understand these differences for proper use. The following sections outline the most important aspects of this interface.
Time Step
Time samples for signal processing are one fixed time step apart. However, both Envelope and Transient simulators define the time step in the simulation controller with various options.
The Transient Simulator controller component has several parameters, including Start time, Stop time, Min time step, and Max time step (see the Time Setup tab). In addition, the Integration tab contains a time step control method parameter with Fixed, Iteration Count, and Truncation Error options. For more information, refer to the Transient/Convolution Simulation documentation.
For cosimulation with the Transient simulator, keep in mind one key issue: The Transient simulator may need time steps smaller than ADS Ptolemy’s Time Step to satisfy its own setup requirements. In addition, the Transient simulator, when needed, will take additional time steps to match the time points in the signal processing simulation. Only time steps that match the signal processing time points will be passed on to ADS Ptolemy.
Note For all practical purposes, the only parameter that may concern the cosimulation user is the Max time step. Other parameters in the Transient Simulation control component can remain at default values.
For the Circuit Envelope simulator, the time step parameter in the ENV Simulation controller component should be set equal to or less than the Time Step at the signal-processing-to-circuit interface.
Depending on the Time Step value you set, the simulator will set the internal Circuit Envelope time step to either the Ptolemy time step value, or to an integer sub-multiple of this value. Time step values less than the Ptolemy time step value are sometimes required to achieve the desired accuracy, due to rapidly changing signals and the integration required for capacitive and inductive components. If the Circuit Envelope value is less than one-tenth of the Ptolemy time step value, a warning is generated to alert you to this so you can avoid inadvertent small time step values that might unnecessarily be slowing the cosimulation.
Interface Issues 11-13

Cosimulation with Analog/RF Systems
Note The Stop time for the simulation is determined by the Signal Processing Data Flow controller and/or Sinks. The Circuit Envelope Stop time does not affect the duration of the cosimulation. The Stop Time value is used in a few models and, ideally, should be set to reflect an approximate stop time range. As an example, for explicit Analog/RF Noise sources that have a user-specified baseband frequency response, this stop time value is used to determine the maximum duration of the pre-computed random noise sequence. Presently, the stop time is limited to about 2.1M (=221) times the time step value. If the cosimulation runs longer than this, then this noise data is repeated.
Delays in Feedback Loops
As stated earlier, Data Flow simulation requires that a Delay component exist in the feedback loops for proper activation of the schedule. Circuit subnetworks that form a feedback loop, for this same reason require a delay component in their path. Typically, a DelayRF component in such feedback loops will suffice. If such a delay does not exist, ADS Ptolemy will report a deadlock by default.
Time Converters
The common signal being exchanged between signal processing Data Flow components and the circuit simulators (Circuit Envelope and Transient) is a time-domain signal. All three engines, hence, deal with the notion of time step.
The signal entering the circuit subnetwork should be Timed. The Transient simulator deals only with real-baseband time-domain signals while Circuit Envelope can handle both baseband and complex envelope timed signals.
If the signal entering into the circuit subnetwork is not Timed (that is, the signal is Numeric), you should place a FloatToTimed, FixToTimed, IntToTimed, or CxToTimed converter to accommodate the conversion. Although ADS Ptolemy will place appropriate converters when they do not exist, it is always a good practice to explicitly place and connect these converters in your design. This will ensure that the input parameters into the circuit subnetwork are correct, as well as helping to debug possible errors that may occur.
11-14 Interface Issues

Carrier Frequency
In the case of cosimulation with the Circuit Envelope simulator, the timed signal entering the circuit subnetwork is typically a carrier-modulated timed signal. This means that timed data has an Fc field that is passed to the Circuit Envelope simulator, which is needed by the simulator. The Circuit Envelope simulator, depending on a particular design, will generate a number of time-domain waveforms, each associated with a carrier (harmonic) frequency. Since ADS Ptolemy supports only one carrier frequency at each node, you need to select which one of the waveforms you desire in the signal processing portion of the design. This is done by placing a Circuit-Envelope specific component described next.
EnvOutSelector and EnvOutShort Components
When cosimulating with the Circuit Envelope simulator, additional information is needed for proper cosimulation. This is done by connecting an EnvOutSelector or EnvOutShort component (from the Circuit Cosimulation library in the Signal Processing schematic) to each output port of the subnetwork design.
The EnvOutSelector component acts as an open, blocking everything connected to its output from loading the circuit. If such loading is desired, use the EnvOutShort component. The EnvOutShort component acts as a short and therefore loads the circuit with the connecting Signal Processing components.
The EnvOutSelector and EnvOutShort components have a parameter called OutFreq. OutFreq specifies which waveform is selected from the time-domain waveforms at the output of the Circuit Envelope simulator. OutFreq has the following options:
• Lowpass—selects the time-varying DC component.
• Bandpass—(default) lets you specify any frequency.
• Allpass—forms the composite (baseband) signal.
One or more EnvOut components (EnvOutSelector and EnvOutShort) can be connected to each output port of a circuit subnetwork as illustrated in Figure 11-8. All waveforms generated by the Circuit Envelope simulator can be accessed in a Signal Processing schematic.
Interface Issues 11-15
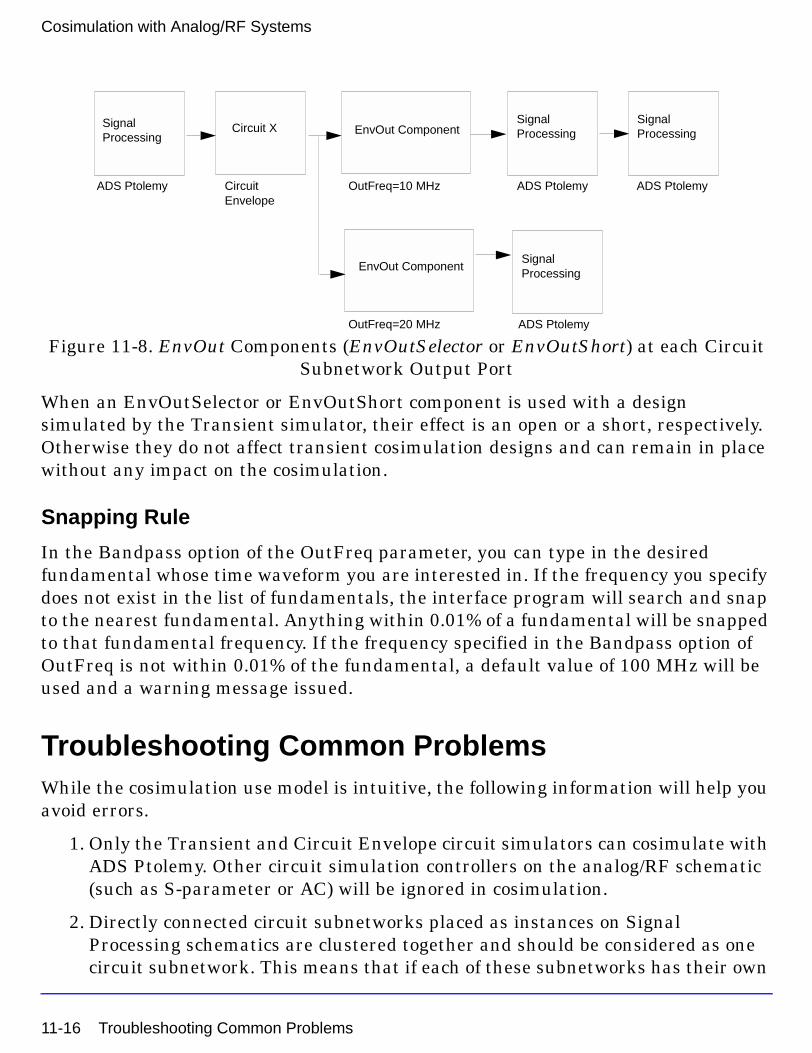
Cosimulation with Analog/RF Systems
Figure 11-8. EnvOut Components (EnvOutSelector or EnvOutShort) at each Circuit Subnetwork Output Port
When an EnvOutSelector or EnvOutShort component is used with a design simulated by the Transient simulator, their effect is an open or a short, respectively. Otherwise they do not affect transient cosimulation designs and can remain in place without any impact on the cosimulation.
Snapping Rule
In the Bandpass option of the OutFreq parameter, you can type in the desired fundamental whose time waveform you are interested in. If the frequency you specify does not exist in the list of fundamentals, the interface program will search and snap to the nearest fundamental. Anything within 0.01% of a fundamental will be snapped to that fundamental frequency. If the frequency specified in the Bandpass option of OutFreq is not within 0.01% of the fundamental, a default value of 100 MHz will be used and a warning message issued.
Troubleshooting Common ProblemsWhile the cosimulation use model is intuitive, the following information will help you avoid errors.
1. Only the Transient and Circuit Envelope circuit simulators can cosimulate with ADS Ptolemy. Other circuit simulation controllers on the analog/RF schematic (such as S-parameter or AC) will be ignored in cosimulation.
2. Directly connected circuit subnetworks placed as instances on Signal Processing schematics are clustered together and should be considered as one circuit subnetwork. This means that if each of these subnetworks has their own
Circuit X EnvOut Component
OutFreq=10 MHz
OutFreq=20 MHz
EnvOut ComponentSignalProcessing
SignalProcessing
SignalProcessing
SignalProcessing
ADS Ptolemy ADS PtolemyADS Ptolemy
ADS Ptolemy
CircuitEnvelope
11-16 Troubleshooting Common Problems

circuit simulation controller, an error message will be issued. To avoid such problems you can either:
• Deactivate all controllers but one on the circuit schematics.
• Connect a signal processing component between the two circuit subnetworks, thereby preventing the two subnetworks from being clustered into one.
3. Resistor components that are part of hierarchical designs of timed components in the Signal Processing schematic will be absorbed into connecting circuit subnetworks by the program. If the EnvOutSelector component is used, the absorbed resistors will not load the circuit, since the circuit model is an open. If the EnvOutShort component is used, the absorbed resistors will load the circuit, and the results will be different by a scale factor.
4. Since resistors that are part of timed subnetworks are absorbed into connecting circuit subnetworks, you should avoid placing a sink or any other signal processing component directly at this port, when cosimulating with Circuit Envelope. If placed, an error message is issued, requiring an EnvOutSelector component to be placed. The reason for this condition is the fact that the sink now constitutes an output port from the perspective of the circuit subnetwork.
5. Writing a VAR in the analog/RF subnetwork to the dataset cannot be done using the Output tab on the Circuit Envelope Controller’s setup dialog box, nor by using OutVar in the Data Flow Controller. It can be done by using the Output tab option in the top-level DF controller, or defining the VAR in the top-level DSP design.
Cosimulation ExampleTo illustrate cosimulation, we will use an example called RectifierCosim_prj.
Copying and Opening the Project
1. From the Main window, choose File > Copy Project. A dialog box appears.
Note On UNIX platforms, you must copy the example project to a directory for which you have write permission. On Windows platforms, while you can work in the Examples directories, it is a good idea to copy examples to another directory.
Cosimulation Example 11-17
Cosimulation with Analog/RF Systems
2. In the From Project area, click Example Directory, then click Browse. The Copy From File Browse dialog box opens showing the Examples directories.
3. Select the /Com_Sys directory.On Windows, the list of available projects appears in the list.On UNIX, click Filter to see the list of projects.
4. On Windows, select RectifierCosim_prj. Click OK.On UNIX, in the Files list, select RectifierCosim_prj. Click OK.
5. In the To Project area, click Startup Directory or Working Directory to select the destination directory for the copied project. Click Browse to select another directory.
6. Select Copy Project Hierarchy to enable this option which ensures all appropriate directories and files are copied.Select Open Project After Copy to enable this option which opens the project immediately after copying.
7. Click OK to copy the project and close the dialog box.
8. In the ADS Main window, choose File > Open Project to open the Open Project dialog box. In the Directories list, select the directory to which you copied the example.On Windows, select RectifierCosim_prj, then click OK.On UNIX, double-click RectifierCosim_prj in the Files list.
Rectifier Schematic
The top level design RectifierCx_Tutorial, as shown in Figure 11-9, generates a complex modulated signal and sends that signal into a simple rectifier circuit.
Two identical instances of this rectifier circuit are created on a circuit schematic, one with a TRAN controller (rct_Tran), Figure 11-10, and the other with an ENV controller (rct_Env), Figure 11-11.
11-18 Cosimulation Example

Figure 11-9. RectifierCosim Project Top-Level Schematic
Figure 11-10. Circuit Subnetwork with Transient Controller
Cosimulation Example 11-19

Cosimulation with Analog/RF Systems
Figure 11-11. Circuit Subnetwork with Circuit Envelope Controller
To view the circuit subnetworks from the top-level design, choose View > Push Into Hierarchy or click the Push Into Hierarchy button (down arrow) from the toolbar.
The circuit design in both rct_Tran and rct_Env is a simple diode with a shunt parallel RC attached to its output. Note the placement of ports and that rct_Env has an Circuit Envelope controller, while rct_Tran a Transient controller. The two circuit designs are then placed on the Signal Processing schematic.
On the Signal Processing schematic, the generation of complex modulated signals is accomplished via a RectCx component that generates a periodic pulse with a complex amplitude. This complex pulse is then fed into a CxToTimed component that effectively upconverts the signal. The TStep is set to 0.01 µsec and the carrier is at 11 MHz. This modulated RF signal is then split into two branches by a SplitterRF component and fed into the rct_Tran and rct_Env circuit subnetworks. In addition, there are TkPlot components (which display the simulation results) attached to the output of RectCx and CxToTimed to monitor the signal before simulation.
Since the TStep of the signal entering circuit design is at 0.01 µsec, the MaxTimeStep on the Transient controller is set to the same value. This value should always be smaller than or equal to the Signal Processing TStep. The other Time setup parameters, such as Start time and Stop time, are ignored in the Transient cosimulation. Note that the output of rct_Tran is directly fed into a TkPlot without an interface component.
Similarly for the Circuit Envelope simulator, the Step parameter of the simulation controller should be set less than or equal to the Signal Processing TStep. Other
11-20 Cosimulation Example

parameters of interest are Freq[], Order[], and MaxOrder, which specify the fundamentals and related harmonics to be analyzed. In this example, the fundamental of interest is Freq[1] = 11MHz and the MaxOrder and Order[1] are set to 5. Note also, that Freq[0] is the dc term that is always available.
Typically, there is only one EnvOut component (EnvOutSelector or EnvOutShort) attached to the Circuit Envelope subnetwork output, but in this example we have used three to show the different signals that can be selected from the Circuit Envelope output. Specifically, the OutFreq parameter is set to the Bandpass, Allpass and Lowpass options in the three instances. When Bandpass is selected, the dialog box changes so you can enter the desired fundamental frequency; in this case, OutFreq is set to 11 MHz. The output of EnvOutSelectors are then fed into three interactive TkPlot display components.
When we simulate this design, 6 TkPlot windows pop up, as shown next.
The plot Complex Bits displays the magnitude of the complex periodic pulse and the plot Rectifier Input depicts the pulse-modulated signal at 11 MHz.
Cosimulation Example 11-21

Cosimulation with Analog/RF Systems
The plot Transient Output is the rectified version of the modulated signal (note that there are no negative components in the signal), where the value of the time constant (RC) determines the degree of pulse fall-off. Note also that this output is a real-baseband signal and includes all the harmonics.
11-22 Cosimulation Example

The allpass, lowpass, and bandpass output plots are shown next.
Cosimulation Example 11-23

Cosimulation with Analog/RF Systems
11-24 Cosimulation Example

Chapter 12: Interactive Controls and Displays
IntroductionThe Interactive Controls and Display library components provide real-time simulation input control and animated plots of simulation results. Examples are given in this chapter to demonstrate use of these components.
Table 12-1 describes two ADS methods for simulating and viewing results.
The interactive controls and displays were derived from a scripting language called Tool Command Language (Tcl) and the Tool Kit attached to TCL (Tk). Tcl or Tk are used in these ADS Ptolemy component names. Tcl is a language that was created to be easily embedded into applications. Tk is a graphical toolkit that makes creating user interfaces easier. Both were created by John Ousterhout while he was a professor at U.C. Berkeley. To explore this language further to write your own applications “References” on page 12-13 provides resources regarding Tcl and Tk.
Note To use Interactive Controls and Displays library components with the ADS tune mode, you must dismiss the Interactive Controls and Displays component between each tune with its pop-up dialog box.
Table 12-2 lists the components available in the Interactive Controls and Displays Library.
Table 12-1. Simulating and Viewing Results
Method Description
Interactive Controls and Displays
A quick and easy way to display results. They also give you a way to interactively change parameters while your simulation is running and display animated plots. Data is not saved. No post processing.
Data Display Window Data is saved after simulation is complete. You open a Data Display window, choose a plot type, parameters to plot, and have many data manipulation options.
Note You can set up a schematic for both methods by placing an Interactive Controls and Displays component and a Sink component.
Introduction 12-1

Interactive Controls and Displays
Table 12-2. Interactive Controls and Displays Library
Component Name Description
TkSlider Interactive Slider
TkPlot Plot Inputs versus Time
TkText Display History of Input Values
TkShowValues Input Values Display
TkXYPlot Plot Y versus X Inputs
TkBarGraph Bar Chart Display
LMS_CxTkPlot Interactive Complex LMS Adaptive Filter
LMS_TkPlot Interactive LMS Adaptive Filter
TkButtons Interactive Buttons
TkBreakPt Conditional Breakpoint
TkMeter Bar Meters Display
TkShowBooleans Booleans Display
TkBasebandEquivChannel Baseband Equivalent Channel
TclScript Invoke Tcl Script
TkEye Eye Diagram
TkConstellation IQ Constellation Diagram
TkHistogram Histogram Diagram
TklQrms Display rms value of input IQ signal
TkPower Signal Power Display in dBm
12-2 Introduction

TkSlider and TkPlot ComponentsFigure 12-1 is taken from the File > Example Project > DSP > dsp_demos_prj EYE.dsn. To run this example, copy the project (File > Copy Project) to a directory for which you have write permission.
The EYE schematic uses an interactive control TkSlider component to adjust the amount of noise added to the pulse stream. Simulation results change instantly in an animated display provided by the TkPlot component. TkPlot simply plots one input on the Y-axis versus time, or sample number on the X-axis.
Figure 12-1. Schematic Using TkSlider and TkPlot Components(TkPlot is part of TkEye Subcircuit)
When you begin simulation of a design using TkSlider, a Control Panel dialog box shown in Figure 12-2 is displayed.
Figure 12-2. TkSlider is Interactively Controlled
At a minimum, the Pause and Quit buttons are shown. If the TKSlider PutInControlPanel default Yes is accepted, the slider control is available. (If you choose No for this parameter, a separate box will be displayed for each slider.)
Slider Control
TkSlider and TkPlot Components 12-3

Interactive Controls and Displays
With the slider control moved to the far left, 0.0 noise is added; the resulting clean eye-diagram plot is shown Figure 12-3.
Figure 12-3. Eye Diagram Plot with Noise at 0.0
If you move the slider so that Noise Magnitude is 0.37 as shown in Figure 12-4, the animated plot changes instantly to display the poor eye diagram shown in Figure 12-5. More or less noise can be added and results will be shown instantly.
Figure 12-4. Slider Control Moved to Add Noise
Figure 12-5. Eye Diagram Plot with Noise at 0.37
12-4 TkSlider and TkPlot Components

Placing multiple TKSlider components in a schematic will result in multiple sliders in the Control Panel. You can type a label for each by editing the parameters on-screen or double-clicking the component to bring up the component parameters dialog box.
Figure 12-6. Control Panel with Multiple TkSliders
TkText and TkShowValues ComponentsThe TkText component simply displays a history of input values in text form.
The TkShowValues component displays only one value is at a time (rather than a history) in the Control Panel.
TkText and TkShowValues Components 12-5

Interactive Controls and Displays
For component and parameter details, refer to Interactive Controls and Displays in the Signal Processing Components manual.
TkXYPlot ComponentSeveral TkXYPlot components are placed in this design to show animated results where two inputs, X versus Y, are to be plotted.
The example in Figure 12-7 is from the File > Example Project > DSP > dsp_demos_prj EQ_16QAM.dsn. To use and simulate this example, copy the project (File > Copy Project) to a directory for which you have write permission. In this example TkXYPlot components are used to display constellation diagrams. The equalized constellation diagram is shown in Figure 12-8.
For component and parameter details, refer to Interactive Controls and Displays in the Signal Processing Components manual.
12-6 TkXYPlot Component

Figure 12-7. Equalized 16 QAM System with Multipath and Phase Noise
Figure 12-8. TkXYPlot for Equalized Constellation Diagram
TkXYPlot Component 12-7

Interactive Controls and Displays
TkBarGraph ComponentThe TkBarGraph component displays input (multiple anytype) data in a bar graph format. Different inputs are assigned up to 12 different colors, then the colors are repeated. A TkBarGraph example is shown in Figure 12-9.
Figure 12-9. TkBarGraph Display
For component and parameter details, refer to Interactive Controls and Displays in the Signal Processing Components manual.
LMS Adaptive Filter ComponentsThere are two LMS adaptive filter components in the Interactive Controls and Displays library: LMS_CxTkPlot and LMS_TkPlot. LMS_CxTkPlot expects complex data and LMS_TkPlot expects real data.
The example in Figure 12-10 is from the File > Example Project > DSP > dsp_demos_prj EQ_16QAM.dsn. To use and simulate this example, copy the project (File > Copy Project) to a directory for which you have write permission.
12-8 TkBarGraph Component

Figure 12-10. LMS Adaptive Filter (Complex) Component in the 16 QAM System
Both LMS components implement an adaptive filter using the least-mean square algorithm, also know as the stochastic-gradient algorithm.
The size of the LMS filter is determined by the number of coefficients in the Taps parameter; the default gives an 8th-order, linear-phase lowpass filter. LMS supports decimation, but not interpolation.
The filter coefficients can be specified directly or read from a file. To load filter coefficients from a file, replace the default coefficients with the string <filename (use an absolute path name for the filename to allow the filter to work as expected regardless of the directory where the simulation process actually runs).
When used correctly, this LMS adaptive filter will adapt to try to minimize the mean-squared error of the signal at its error input. The output of the filter should be compared to (subtracted from) some reference signal to produce an error signal. That error signal should be fed back to the error input. The ErrorDelay parameter must equal the total number of delays in the path from the output of the filter back to the error input. This ensures correct alignment of the adaptation algorithm. The number of delays must be greater than 0 or the simulation will deadlock.
If the SaveTapsFile string is non-null, a file will be created with the name given by that string, and the final tap values will be stored there after the run has completed.
LMS Adaptive Filter Components 12-9

Interactive Controls and Displays
The plot generated from this design upon simulation is shown in Figure 12-11.
Figure 12-11. Plot Resulting From LMS_CxTkPlot FilterTaps Parameter
For component and parameter details, refer to Interactive Controls and Displays in the Signal Processing Components manual.
TkButtons ComponentLike TkSlider, TkButtons produces an output. The data type of the output is multiple anytype. TkButtons outputs 0.0 unless the corresponding button is pushed, when the output becomes the value assigned in the parameter Value. You can assign your own identifiers using strings for the corresponding parameter.
For component and parameter details, refer to Interactive Controls and Displays in the Signal Processing Components manual.
12-10 TkButtons Component

TkBreakPt ComponentWith TkBreakPt you can pause or stop a simulation. Its principal use is to help debug simulations. You can stop the simulation based on a condition of the model’s inputs.
For component and parameter details, refer to Interactive Controls and Displays in the Signal Processing Components manual.
TkMeter ComponentTkMeter dynamically displays the value of any number of input signals (any type) on a set of bar meters. These values are displayed in the Control Panel.
For component and parameter details, refer to Interactive Controls and Displays in the Signal Processing Components manual.
TkShowBooleans ComponentThe TkShowBooleans component works similar to TkShowValues, except that a Boolean value of zero (false) or non-zero (true) is displayed in the Control Panel.
For component and parameter details, refer to Interactive Controls and Displays in the Signal Processing Components manual.
TkBreakPt Component 12-11

Interactive Controls and Displays
TkBasebandEquivChannel Component
The TkBasebandEquivChannel subcircuit, Figure 12-12, models a baseband equivalent channel with linear distortion, frequency offset, phase jitter, and additive white Gaussian noise. Many of the channel model parameters can be set dynamically.
TkBasebandEquivChannel accepts complex data and outputs the input signal plus distortions. To model linear distortion, such as intersymbol interference, the input signal is passed through a complex FIR filter with the taps set by LinearDistortionTaps. Frequency offset distortion is set by the Freq. Offset slider control. Similarly, the phase jitter amplitude (peak-to-peak, in degrees) is set by the Phase Jitter slider control while the phase jitter frequency is set by the PhaseJitterFrequencyHz parameter. The phase of frequency offset and phase jitter can be reset with the Reset Phase control button. The amplitude of the added complex white Gaussian noise is set by the Noise Power slider control.
Figure 12-12. TkBasebandEquivChannel Subnetwork
12-12 TkBasebandEquivChannel Component

For component and parameter details, refer to Interactive Controls and Displays in the Signal Processing Components manual.
TclScript Component
TclScript reads a file containing Tcl commands. It can be used in a variety of ways, including using Tk to animate or control a simulation. Procedures and global variables will have been defined for use by the Tcl script by the time it is sourced; these enable the script to read inputs to the component or set output values. The Tcl script can optionally define a procedure to be called by ADS Ptolemy for every simulation of the component.
For component and parameter details, refer to Interactive Controls and Displays in the Signal Processing Components manual.
TkEye, TkConstellation, TkHistogram, TklQrms, and TkPower ComponentsThese TclTk components generate an eye diagram, an IQ constellation diagram, a histogram diagram, a display of the rms value of the IQ input signal, and a signal power display in dBm, respectively.
For component and parameter details, refer to Interactive Controls and Displays in the Signal Processing Components manual.
References[1] John K. Ousterhout, Tcl and the Tk Toolkit (Addison-Wesley Professional
Computing), Addison-Wesley Publishing Company. May 1994.
[2] Brent B. Welch, Practical Programming in Tcl & Tk, Prentice Hall: Englewood Cliffs, NJ. July 1997. 2nd Bk and cdr Edition.
[3] Mark Harrison and Michael J. McLennan, Effective Tcl/Tk Programming: Writing Better Programs in Tcl and Tk, Addison-Wesley Publishing Company. November 25, 1997.
The following web site is a good place to look for Tcl/Tk information:
http://www.yahoo.com/Computers_and_Internet/programming_and_development/languages/tcl_tk/
TclScript Component 12-13

Interactive Controls and Displays
12-14 References

Appendix A: Wireless Test Bench DesignsUsing Ptolemy in ADS, a system designer can create a DSP system design that is available to an RFIC designer as a wireless test bench (WTB) model. The wireless test bench is a mechanism by which a system designer can make system measurements available to an RFIC designer. The RFIC designer can then validate and verify the RFIC design or device under test (DUT).
Creating a Wireless Test Bench DesignCreating wireless test bench designs using Ptolemy components in ADS is similar to setting up other Analog/RF designs for cosimulation. The design must be created in a DSP schematic using only DSP components. In the File > Design Parameters select simulation model Wireless Test Bench.
The WTB design can be split between two parts.
• The first part of the WTB design is the group of components that generate a signal appropriate for stimulating the RFIC or DUT. Ports (appropriately named) added at the output of this part of the design will act as WTB model output and DUT input when used in RFDE.
• The second part of the WTB design is the group of components that process the DUT output and perform various system measurements using Ptolemy Sink components. Ports (appropriately named) added at the input of this part of the design act as WTB model input and DUT output.
The input ports must have an EnvOutSelector or EnvOutShort (from the Circuit Cosimulation library) to select the correct frequency to be extracted from the Circuit Envelope analysis of the DUT for system measurement. Any port that is not connected to an EnvOutSelector or EnvOutShort is considered to be an output port.
A DF controller (from the Controller library) must be added to the design that uses the correct setup of scheduler type, deadlock manager, and other parameters.
Create the WTB design parameters that the RFIC designer can use to modify the WTB design’s configuration, using the File > Design Parameters in the ADS schematic window.
A-1

Creating Wireless Test Bench Designs for RFDE
Wireless Test Bench Design Examples
For examples on how to create a WTB design, look at the designs listed with the example projects in Table A-1. Each design has instances of the pre-configured WTB model components. Push into the components to view the design.
These projects are contained in the 3GPP W-CDMA. WLAN, and TD-SCDMA Design Libraries and can be installed by using the custom installation option.
Note RangeCheck components used in the pre-configured WTB designs are created specifically for those WTB designs. Do not use the RangeCheck components when you create your own WTB designs.
Setting the Units for WTB Design Parameters
The system designer can use the list of units provided in the Design Parameter dialog box to correctly specify the unit used for a parameter. If the parameter value is a unit that is not part of the list, such as percent, and the system designer wants to communicate the units to the RFIC designer, then the unit can be placed within parentheses at the end of the parameter’s description text.
Categorizing WTB Design Parameters
WTB designs support a feature that enables a person using the WTB design to categorize the parameters. It is helpful for the System designer to group the parameters in a way that makes it easier for the RFIC designer.
To categorize the list of parameters, define a string type of parameter at the beginning of the group of parameters that belong in a category. The parameter must have a description field specified that contains a very short description of the
Table A-1. Wireless Test Bench Design Examples
Example Project License Required
TDSCDMA_RF_Verification_prj mdl_tdscdma
WCDMA3G_RF_Verification_prj mdl_wcdma3g
WLAN_RF_Verification_prj mdl_wlan
UWB_RF_Verification_prj mdl_ultrawideband
A-2

category. The parameter's default value must be set to Category to identify this parameter as a categorization parameter. And, the parameter’s attributes must be set such that it will not be netlisted and not displayed.
The group of parameters will appear in different tabs in the Wireless Test Bench Setup dialog in RFDE. The first group of parameters are considered Required Parameters and will appear in a separate widget along with the ports in the top half of the Wireless Test Bench Setup dialog box. These parameters are considered as parameters that must have value (they cannot be blank). All subsequent groups of parameters will be considered as optional parameters for modification.
Information Parameters
The system designer can insert various information parameters that describe a particular aspect of the WTB design, such as instructions related to timing setup. To create such a parameter, define a string type of parameter and set its attribute such that it will not be netlisted and will not be displayed on the schematic. Leave the parameter's default value blank.
Verifying a WTB Design in ADSTo verify a WTB design in ADS:
1. Create a DUT in ADS.
2. Open a new Analog/RF schematic window.
3. Add an instance of the WTB design and the instance of the DUT; connect them.
4. Add an Envelope controller.
5. Simulate this design and generate the dataset to verify the results.
A-3

Creating Wireless Test Bench Designs for RFDE
Exporting a WTB Design to RFDEAfter creating a WTB design as described in “Creating a Wireless Test Bench Design” on page A-1, export the design so it can be used in RFDE. To export the WTB design, save it and select Tools > Export ADS Ptolemy Design > As WTB Model to RFDE in the schematic window containing the design. An Export Status/Error/Warning dialog box appears showing the exporting progress. A temporary design window will open where the WTB design will be instantiated before the export starts.
A successful export process generates the files <WTBname>_TB.il and <WTBname>_TB.net. These files are saved with the exported design under the project directory ..._prj/adsptolemy/wtb.
WTB Design User Interface AttributesEach WTB design has a category to which it belongs. The category name is the project name from which it was exported without the _prj extension.
The WTB design name is same as the corresponding design name.
The Wireless Test Bench Setup dialog in RFDE contains a pull-down list of categories. Each category selection updates another pull-down list containing WTB models exported from a single project.
Following the WTB model selection pull-down list is the Required Parameters widget that contains the ports that can be connected to the DUT, along with the first group of parameters created by the system designer. If no categories are created, all of the parameters are included as part of this widget. The items in this widget cannot be left blank, or unspecified, and must contain some value. To aid WTB model and DUT port connection, a button is provided, per port, that takes the RFIC designer to the schematic window to select a pin on the DUT.
Following the Required Parameters widget is a widget containing tabs for all subsequent parameter groups. The tab name is the description specified for the categorization parameter. These parameters are optional parameters for modification.
A-4

Creating a Results Display for WTB DesignsA WTB design can have complex data that the RFIC designer will not know how to interpret. To help simplify data analysis, the System designer must use the following steps:
1. System designer must use a simple DUT in ADS to create a dataset.
2. Open a new DDS window. Add one or more new pages and name them appropriately.
3. Leave page 1 untouched and blank; this page is used for other Analog/RF automatic plots.
4. Add correct equations/plots/configurations on the new pages.
5. Save this DDS file as a template by choosing File > Save as Template on the DDS window. Select the User category to save the template.
6. The template file is saved under $HOME/hpeesof/circuit/templates.
7. Copy the template file to _prj/adsptolemy/templates.
8. Place an OutputOption controller in the WTB design’s schematic window. (The OutputOption component can be placed at any level of hierarchy in the WTB design.)
9. Add the data display template name, created above, to the list of names. More than one data display template is allowed for a given WTB design.
10. Re-export the WTB design.
Now, when this WTB design is used in a simulation, the templates named in the OutputOption controller will be inserted in the DDS window that appears at the end of the simulation.
A-5
Creating Wireless Test Bench Designs for RFDE
Circuit Envelope ParametersSome parameters must be defined as WTB design parameters to ensure compliance with Circuit Envelope requirements within the WTB design’s simulation setup.
• CE_TimeStep The WTB design must have a CE_TimeStep parameter that enables the RFIC designer to set the Circuit Envelope time step. If this parameter is not added to a WTB design, the time step will always be set to 0.01µsec.
• FSource The WTB design can optionally have an FSource parameter to enable the RFIC designer to set the source carrier frequency. This parameter will automatically be added to the Fundamental Tones parameters of Circuit Envelope after the WTB design is set up in RFDE. To ensure correct behavior this frequency must not be deleted from the Fundamental Tones.
• FMeasurement The WTB design can optionally have an FMeasurement parameter to enable the RFIC designer to set the measurement carrier frequency. This parameter will automatically be added to the Fundamental Tones parameters of Circuit Envelope after the WTB design is set up in RFDE. To ensure correct behavior this frequency must not be deleted from the Fundamental Tones.
A-6

Appendix B: ADS Ptolemy AMS ModelsUsing ADS Ptolemy, a system designer can create a DSP system design that is available to a SystemIC designer as a source or a measurement model in AMSD-ADE (Cadence Analog Mixed Signal Designer integrated in Cadence Analog Design Environment). This mechanism enables a system designer to make complex signal generation and system measurements available to a SystemIC designer. The SystemIC designer can then validate and verify the SystemIC design or device under test (DUT) in Cadence IC Design Tool or Design Framework II.
This appendix describes how to create and export ADS Ptolemy designs to AMSD-ADE.
Creating ADS Ptolemy Designs for Use in AMSD-ADEThe design must be created in a DSP Schematic window using only DSP components. A/RF cosimulation sub-circuits can be embedded inside the design. Any A/RF components or resistors that are adjacent to the input or output port will have no impact on the SystemIC DUT.
Currently, we only support exporting ADS Ptolemy source designs with all output ports and ADS Ptolemy sink designs with all input ports.
ADS Ptolemy source design requirements for use in AMSD-ADE are:
• The ADS Ptolemy design must contain all output ports.
• The design should generate timed baseband signal appropriate for stimulating the SystemIC DUT.
• Ports must be appropriately named, and cannot be VerilogAMS keywords.
• An AMS_Interface (refer to AMS_Interface documentation) component must be placed adjacent to and connected to the output port of the design.
• Each port can be exported as an analog port (electrical) or a digital port (wreal).
B-1

Creating ADS Ptolemy AMS Models
ADS Ptolemy sink design requirements for use in AMSD-ADE:
• The ADS Ptolemy design must contain all input ports.
• The design reads only timed baseband signals from the SystemIC DUT.
• Ports must be appropriately named and cannot be VerilogAMS keywords.
• An AMS_Interface (refer to AMS_Interface documentation) component must be placed adjacent to and connected to the input port of the design
• Each port can be exported as an analog port (electrical) or a digital port (wreal).
Each design can have parameters as required. These parameters will be available for modification in the AMSD-ADE environment. Parameters can be added using the File > Design Parameters in an ADS Schematic window.
It is recommended that you verify the source and sink design by placing the instance of the design and connecting appropriate components and a DF controller.
Exporting ADS Ptolemy Designs for Use in AMSD-ADEAfter creating an ADS Ptolemy design as described in “Creating ADS Ptolemy Designs for Use in AMSD-ADE” on page B-1, export the design so it can be used in AMSD-ADE. To export the design, save it and select Tools > Export ADS Ptolemy Design >As AMS model to AMSD-ADE in the schematic window containing the design. An Export Status/Error/Warning dialog box appears showing the exporting progress. A temporary design window will open where the design will be instantiated before the export starts.
A successful export process generates the files <Design name>_AMS.cdf, <Design name>_AMS.vams and <Design name>_AMS.net. These files are saved with the exported design under the project directory ..._prj/adsptolemy/ams.
B-2

Creating a Results Display for ADS Ptolemy Designs Used in AMSD-ADEAn ADS Ptolemy design may have complex data that the SystemIC designer will not know how to interpret. To help simplify data analysis, the System designer must use the following steps:
1. System designer must perform verification of the design as mentioned earlier to create a dataset in ADS.
2. Open a new DDS window. Add one or more new pages and name them appropriately.
3. Add correct equations/plots/configurations on the new pages.
4. Save this DDS file as a template by choosing File > Save as Template on the DDS window. Select the User category to save the template.
5. The template file is saved under $HOME/hpeesof/circuit/templates.
6. Copy the template file to _prj/adsptolemy/templates.
7. Place an OutputOption controller in the design’s schematic window. (The OutputOption component can be placed at any level of hierarchy in the design.)
8. Add the data display template name, created above, to the list of names. More than one data display template is allowed for a given design.
9. Re-export the design.
Now, when this design is used in an AMSD-ADE simulation, the templates listed in the OutputOption controller will be inserted in the DDS window that users can launch via Results>ADS Ptolemy>Launch Data Display menu item.
B-3

Creating ADS Ptolemy AMS Models
B-4

Index
AADSapproach to cosimulation, 11-12ADS Ptolemy
arrowheads in schematic, 5-2data types, conversion, 5-5data types, representation, 5-1Interactive Controls and Displays,
compared to sinks, 12-1overview versus UC Berkeley Ptolemy, 1-2references, 9-18terminology versus UCB Ptolemy, 1-3theory of operation, 9-1
array parameters, 4-14arrowheads in schematic, 5-2Automatic Verification Modeling (Fast
Cosimulation), 11-5
BBaseband Equivalent Channel, 12-12
Ccarrier frequency resolution, 9-11Circuit Envelope simulator
selecting waveform for cosimulation, 11-15circuit subnetworks, consequences of
clustering, 11-8classical scheduler, 9-5cluster loop scheduler, 9-5clustering
consequences of, 11-8defined for cosimulation, 11-8simulating resistors, 11-9
complex-valued parameters, 4-7cosimulation
Automatic Verification Modeling, 11-5clustering, consequences of, 11-8clustering, defined, 11-8example of, 11-17example results, 11-21fast, 11-5MATLAB, 10-1nested simulation approach, 11-12resolving deadlocks, 11-9selecting circuit envelope waveform, 11-15
time step sizes, 11-13troubleshooting common problems, 11-16using EnvOutSelector, 11-15using EnvOutShort, 11-15using time converters, 11-14using time steps, 11-13
Ddata types
conversion of, 5-5conversion, automatic or manual, 5-8numeric matrix, 5-4numeric scalar, 5-3representation, 5-1timed data, 5-4
dataflow terminology, 9-2deadlocks, 9-7
resolving for cosimulation, 11-9DF (DataFlow) Controller, 3-5
EEnvOutSelector, using for cosimulation,
11-15EnvOutShort, using for cosimulation, 11-15
Ffast cosimulation, 11-5filename
parameters, 4-13
Hhierarchical scheduler, 9-5homogeneous synchronous dataflow, 1-5
IInteractive Control and Display
components, 12-2Invoke Tcl Script, 12-13
LLMS Adaptive Filter, 12-8
MMATLAB
built-in model types, 10-1cosimulation, 10-1
Index-1

examples, 10-10library-importing simulation, 10-8script-interpreting simulation, 10-6setting up, 10-2supported versions, 10-2
multirate scheduler, 9-6multithreaded scheduler, 9-5multithreading, 9-5
Nnominal optimization
See optimization, 8-1
Ooptimization
bit width example, 8-2using various parameter types, 8-1
OutputOption Controller, 3-12
Pparameter expressions, 4-7parameters
for fixed-point components, 4-8with optimization attributes, 4-16
ParamSweep controller, 7-2performance optimization
See optimization, 8-1
Rresistance, input/output, 9-11resistors
cosimulation with clustering, 11-9
Sschedulers
classical, 9-5cluster loop, 9-5described, 9-4hierarchical, 9-5multirate, 9-6multithreaded, 9-5selecting, 3-8
signals, time domain, 9-9string parameters, 4-13sweeping parameters, 7-1
multidimensional sweeps, 7-11string parameter types, 7-9using ParamSweep, 7-2
using the VAR component, 7-5using VAR, 7-5using various parameter types, 7-6
SweepPlan controller, 7-6Synchronous Dataflow, 9-2
TTIM data format
examples, 6-7time converters
placing for cosimulation, 11-14time step resolution, 9-10time steps
size for cosimulation, 11-13using for cosimulation, 11-13
Timed Synchronous Dataflow, 9-9TkBarGraph, 12-8TkBreakPt, 12-11TkButtons, 12-10TkMeter, 12-11TkPlot, 12-3TkShowBooleans, 12-11TkShowValues, 12-5TkSlider, 12-3TkText, 12-5TkXYPlot, 12-6Transient simulator
time step size for cosimulation, 11-13
Vvalue types, 4-1
complex array, entering, 4-3complex, entering, 4-2entering, 4-1enumerated type, entering, 4-4filename, entering, 4-2fixed point array, entering, 4-3fixed point, entering, 4-1integer array, entering, 4-2integer, entering, 4-1precision, entering, 4-2real array, entering, 4-3real, entering, 4-1string array, entering, 4-4string, entering, 4-2table of, 4-1
VarEqnCheck, 3-15
Index-2

Wwireless test bench
creating designs, A-1WTB Controller, 3-13
Index-3

Index-4