ADRIATIC SEA ENVIRONMENT PROGRAM - All …documents.worldbank.org/curated/en/... · Montenegro ......
42
ADRIATIC SEA ENVIRONMENT PROGRAM Rapid Assessment of Pollution Hotspots for the Adriatic Sea FINAL REPORT October 2011 Public Disclosure Authorized Public Disclosure Authorized Public Disclosure Authorized Public Disclosure Authorized Public Disclosure Authorized Public Disclosure Authorized Public Disclosure Authorized Public Disclosure Authorized
Transcript of ADRIATIC SEA ENVIRONMENT PROGRAM - All …documents.worldbank.org/curated/en/... · Montenegro ......
ADRIATIC SEA ENVIRONMENT PROGRAM Rapid Assessment of Pollution Hotspots for the Adriatic
Sea
FINAL REPORT
October 2011
Pub
lic D
iscl
osur
e A
utho
rized
Pub
lic D
iscl
osur
e A
utho
rized
Pub
lic D
iscl
osur
e A
utho
rized
Pub
lic D
iscl
osur
e A
utho
rized
Pub
lic D
iscl
osur
e A
utho
rized
Pub
lic D
iscl
osur
e A
utho
rized
Pub
lic D
iscl
osur
e A
utho
rized
Pub
lic D
iscl
osur
e A
utho
rized
wb456288
Typewritten Text
83124
© 2013 The World Bank 1818 H Street NW Washington DC 20433 Telephone: 202-473-1000 Internet: www.worldbank.org
Acknowledgments This work was made possible by the financial contribution of the World Bank’s Water Partnership Program (WPP) - a multi-donor trust fund that promotes water security for inclusive green growth
(water.worldbank.org/water/wpp).
This work is a product of The World Bank with external contributions. The findings, interpretations, and conclusions expressed in this work do not necessarily reflect the views of The World Bank, its Board of Executive Directors or the governments they represent.
The World Bank does not guarantee the accuracy of the data included in this work. The boundaries, colors, denominations, and other information shown on any map in this work do not imply any judgment on the part of The World Bank concerning the legal status of any territory or the endorsement or acceptance of such boundaries.
Rights and Permissions The material in this work is subject to copyright. Because The World Bank encourages dissemination of its knowledge, this work may be reproduced, in whole or in part, for noncommercial purposes as long as full attribution to this work is given.
Any queries on rights and licenses, including subsidiary rights, should be addressed to the Office of the Publisher, The World Bank, 1818 H Street NW, Washington, DC 20433, USA; fax: 202-522-2422; e-mail: [email protected].
About the authors
Roko ANDRIČEVIĆ - holds PhD from the Civil and Environmental Engineering Department, University of Minnesota, USA, in the subject area of management of water resources systems under uncertainty; professor at the Faculty of Civil Engineering and Architecture at the University of Split.
Aleka MELIADOU - holds PhD from the Department of Environmental Studies, University of the Aegean, Mytilini, Greece; lectures at the Open University of Greece; possesses extensive experience in Integrated Coastal Zone Management and sustainable development planning.
Marin MILETIĆ - holds PhD in Methodology of bio-monitoring and quality of the environment from the University of Trieste, Italy; experienced in the use of environmental monitoring data and the synthesis of monitoring data with eco-toxicological data, in assessing the consequences of natural resource management and pollution risks.
Mak KIŠEVIĆ - PhD candidate in the field of remote sensing at the University of Zagreb; experienced in designing environmental monitoring, information and management systems using GIS and applying remote sensing techniques.
The Authors would like to express a special gratitude to Mr Manuel Mariño, Ms Sanyu Lutalo, Ms Maria Angelica Sotomayor and Ms Beata Plonka who provided valuable input, comments and assistance at all times.
4
Table of Contents
Chapter 1 Executive summary .......................................................................................................... 7
Chapter 2 Introduction ..................................................................................................................... 12
Chapter 3 Identification of Pollution Hotspots and Endangered Areas ..................................... 16 3.1. Definition of Pollution Hotspot Sites ...................................................................................... 16 3.2. Definition of endangered areas ............................................................................................... 16 3.3. Methodology .............................................................................................................................. 17
3.3.1. Data collection ............................................................................................................. 17 3.3.2. Assembling a list of potential pollution hotspot sites ................................................... 17
3.4. Identifying pollution hotspot sites .......................................................................................... 18 3.5. Prioritization of pollution hotspot sites .................................................................................. 19
Chapter 4 Regional perspective ..................................................................................................... 21 4.1. Adriatic Sea in the Mediterranean context ............................................................................. 21 4.2. Regional issue: Ballast waters and invasive species ........................................................... 23 4.3. Regional issue: Harmful Algal Blooms ................................................................................... 23 4.4. Regional issue: Solid waste management ............................................................................. 24
Chapter 5 Pollution Hotspot Sites .................................................................................................. 25 5.1. The Republic of Albania ........................................................................................................... 25 5.2. Montenegro ................................................................................................................................ 28 5.3. The Republic of Croatia ............................................................................................................ 31 5.4. Bosnia and Herzegovina .......................................................................................................... 34 5.5. Total investment needs in the eastern Adriatic coast ........................................................... 37 5.6. Endangered areas ..................................................................................................................... 38
Chapter 6 Conclusions and Recommendations ........................................................................... 40
Chapter 7 Implementation Plan ...................................................................................................... 41
Literature .............................................................................................................................................. 42
ANNEX I – LIST OF PERTINENT EU DIRECTIVES AND INTERNATIONAL AGREEMENTS AND STANDARDS ANNEX II – CRITERIA FOR IDENTIFICATION AND LIST OF EXAMINED POTENTIAL POLLUTION HOTSPOTS ANNEX III – RANKING CRITERIA AND SCORING OF POLLUTION HOTSPOT SITES ANNEX IV – DESCRIPTION OF POLLUTION HOTSPOTS ANNEX V - GENERAL STAKEHOLDER QUESTIONNAIRE ANNEX VI – LIST OF CONTACTED STAKEHOLDERS ANNEX VII – LIST OF PARTICIPANTS AND MINUTES OF THE MEETING FROM THE STAKEHOLDERS’ WORKSHOP
5
List of Tables Table 1 Contribution of tourism in the national economies ..................................................................... 8
Table 2 Contribution of fisheries in the national economies .................................................................... 9 Table 3 Estimated investments needed (funding gaps) per country per sector (in M€) ......................... 9 Table 4 Project supported by Investment Fund program in the Adriatic Sea basin .............................. 14 Table 5 Summary table of the criteria used for establishing a list of potential PHS sites ..................... 18 Table 6 Commonly used environmental quality indicators .................................................................... 18
Table 7 Values of concern for assessing impacts of PHS .................................................................... 19 Table 8 Criteria used in ranking pollution hotspot sites ......................................................................... 20 Table 9 Comparison of identified pollution hotspots in the Adriatic Sea between different reports ...... 22 Table 10 Indication of the overall costs for reducing nitrogen loads discharged by rivers and originating
from non-point sources .......................................................................................................................... 23
Table 11 Characterization of pollution sources in Albania .................................................................... 26 Table 12 Estimated investments per sector for all hotspot sites in Albania and priority sites ............... 27
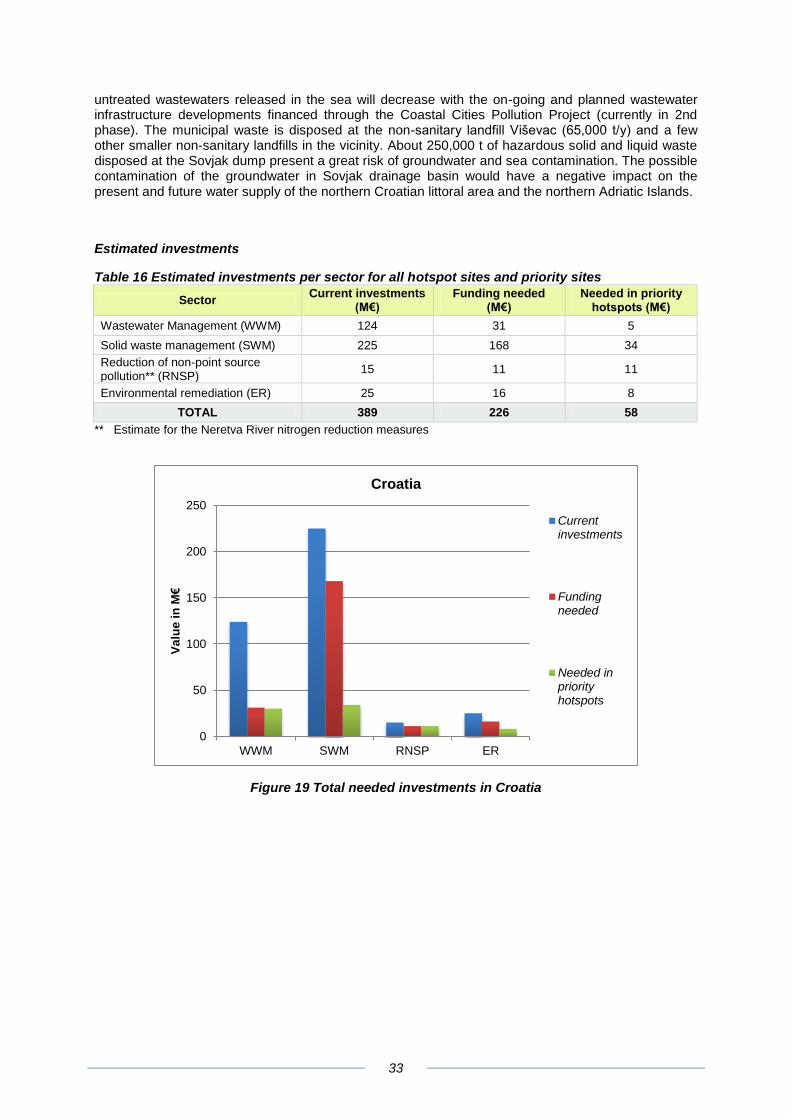
Table 13 Characterization of pollution sources in Montenegro ............................................................. 28 Table 14 Estimated investments per sector for all hotspot sites and priority sites................................ 29 Table 15 Characterization of pollution sources in Croatia ..................................................................... 31 Table 16 Estimated investments per sector for all hotspot sites and priority sites................................ 33 Table 17 Overview of pollution loads by Adriatic Sea river basins ....................................................... 34
Table 18 Overview of the existing wastewater treatment in the Adriatic Sea discharge basin ............. 35
Table 19 Characterization of pollution sources in Bosnia and Herzegovina ......................................... 35 Table 20 Overview of the larger municipal wastewater treatment pollution sources ............................ 35 Table 21 Estimated investments per sector for all hotspot sites and priority sites* .............................. 36
Table 22 Overview of the investment needs in the eastern Adriatic coast ........................................... 37
Table 23 Endangered areas .................................................................................................................. 38 Table 24 Provisional Implementation Plan ............................................................................................ 41
List of Figures Figure 1 Nautical tourism in the Kornati archipelago .............................................................................. 7 Figure 2 Overview of the pollution hotpot sites in the Adriatic Sea (red dots are priority sites) .............. 8
Figure 3 Ratio of total investment needs per sector in the eastern Adriatic coast ................................ 10 Figure 4 Adriatic Sea Basin ................................................................................................................... 13
Figure 5 Assessment process scheme ................................................................................................. 17 Figure 6 Pollution hotspots identified by UNEP/MAP in the Mediterranean ......................................... 21
Figure 7 Solid waste washed out at the beaches of the Pelješac peninsula in Croatia, ....................... 24 Figure 8 Overview of the Pollution Hotspot Sites and areas of influence in the Republic of Albania ... 25 Figure 9 Ranking of the Albanian Pollution Hotspot Sites (Priority sites in red) ................................... 26 Figure 10 Weighted impacts of the pollution hotspot sites in Albania on different values of concern .. 26
Figure 11 Total needed investments in Albania .................................................................................... 27 Figure 12 Overview of the Pollution Hotspot Sites and areas of influence in Montenegro ................... 28 Figure 13 Ranking of Montenegrin Pollution Hotspot Sites (Priority sites in red) ................................. 29 Figure 14 Weighted impacts of pollution hotspot sites in Montenegro on different values of concern . 29 Figure 15 Total needed investments in Montenegro ............................................................................. 30
Figure 16 Overview of the Pollution Hotspot Sites and areas of influence in Croatia and B&H ........... 31 Figure 17 Ranking of the Croatian Pollution Hotspot Sites (Priority sites in red) .................................. 32
Figure 18 Weighted impacts of the pollution hotspot sites in Croatia on different values of concern ... 32 Figure 19 Total needed investments in Croatia..................................................................................... 33 Figure 20 Overview of the point-source pollution sources in Bosnia and Herzegovina ........................ 34 Figure 21 Total needed investments in Bosnia and Herzegovina ......................................................... 36 Figure 22 Overview of total investments per country per sector ........................................................... 37
Figure 23 Overview of endangered areas in the Adriatic Sea ............................................................... 38
6
Glossary of Acronyms
ASEP Adriatic Sea Environment Program
BAT Best Available Technique
EBRD European Bank for Reconstruction and Development
EC European Commission
ECENA Environmental Compliance and Enforcement Network for Accession
EEA European Environment Agency
EEC European Economic Community
EIB European Investment Bank
EU European Union
FZOEU Croatian Environmental Protection and Energy Efficiency Fund
GEF Global Environment Facility
GHG Greenhouse gas
HELCOM The Helsinki Commission
IBRD International Bank for Reconstruction and Development
IFI International Financing Institution
IPA Instrument for Pre-accession Assistance
IPPC Integrated Pollution Prevention and Control
MAP Mediterranean Action Plan
MARPOL International Convention for the Prevention of Pollution from Ships
MEDPOL The Programme for the Assessment and Control of Pollution in the Mediterranean region
NAP National Action Plan
NGO Non-Governmental Organization
PAH Polycyclic aromatic hydrocarbon
PCB Polychlorinated biphenyl
PE Person Equivalent
PEIP Priority Environmental Investment Programme
PHS Pollution Hotspot Site
POC Particulate Organic Carbon
POP Persistent Organic Pollutant
REC Regional Environment Centre
RENA Regional Environmental Network for Accession
SAP Strategic Action Plan
UNCLOS United Nations Convention on the Law of the Sea
UNEP United Nations Environment Programme
WB World Bank
WWTP Wastewater Treatment Plant
7
Chapter 1 Executive summary
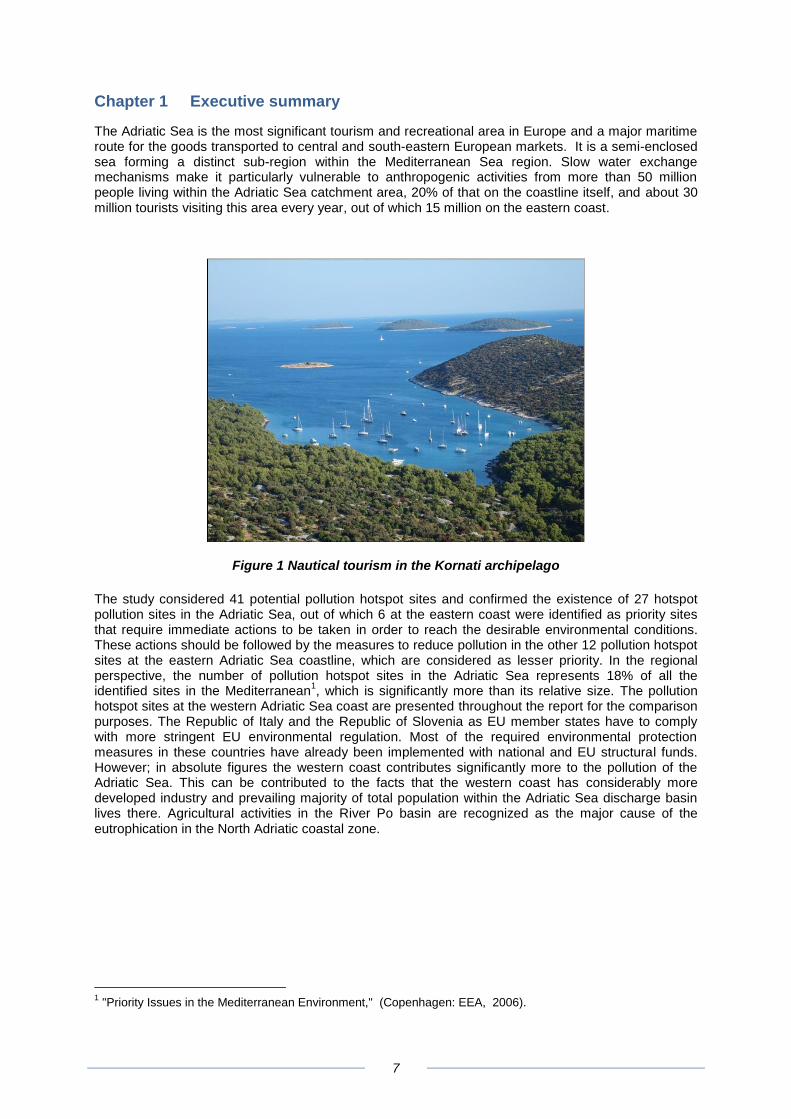
The Adriatic Sea is the most significant tourism and recreational area in Europe and a major maritime route for the goods transported to central and south-eastern European markets. It is a semi-enclosed sea forming a distinct sub-region within the Mediterranean Sea region. Slow water exchange mechanisms make it particularly vulnerable to anthropogenic activities from more than 50 million people living within the Adriatic Sea catchment area, 20% of that on the coastline itself, and about 30 million tourists visiting this area every year, out of which 15 million on the eastern coast.
Figure 1 Nautical tourism in the Kornati archipelago
The study considered 41 potential pollution hotspot sites and confirmed the existence of 27 hotspot pollution sites in the Adriatic Sea, out of which 6 at the eastern coast were identified as priority sites that require immediate actions to be taken in order to reach the desirable environmental conditions. These actions should be followed by the measures to reduce pollution in the other 12 pollution hotspot sites at the eastern Adriatic Sea coastline, which are considered as lesser priority. In the regional perspective, the number of pollution hotspot sites in the Adriatic Sea represents 18% of all the identified sites in the Mediterranean
1, which is significantly more than its relative size. The pollution
hotspot sites at the western Adriatic Sea coast are presented throughout the report for the comparison purposes. The Republic of Italy and the Republic of Slovenia as EU member states have to comply with more stringent EU environmental regulation. Most of the required environmental protection measures in these countries have already been implemented with national and EU structural funds. However; in absolute figures the western coast contributes significantly more to the pollution of the Adriatic Sea. This can be contributed to the facts that the western coast has considerably more developed industry and prevailing majority of total population within the Adriatic Sea discharge basin lives there. Agricultural activities in the River Po basin are recognized as the major cause of the eutrophication in the North Adriatic coastal zone.
1 "Priority Issues in the Mediterranean Environment," (Copenhagen: EEA, 2006).
8
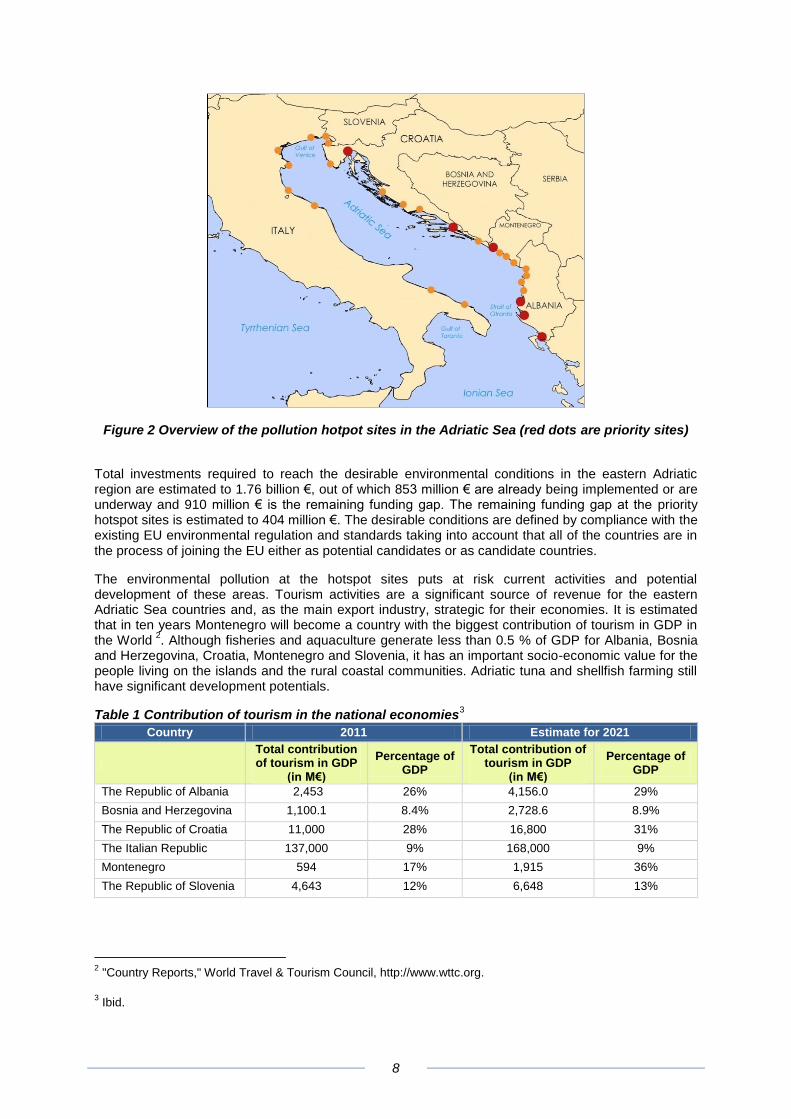
Figure 2 Overview of the pollution hotpot sites in the Adriatic Sea (red dots are priority sites)
Total investments required to reach the desirable environmental conditions in the eastern Adriatic region are estimated to 1.76 billion €, out of which 853 million € are already being implemented or are underway and 910 million € is the remaining funding gap. The remaining funding gap at the priority hotspot sites is estimated to 404 million €. The desirable conditions are defined by compliance with the existing EU environmental regulation and standards taking into account that all of the countries are in the process of joining the EU either as potential candidates or as candidate countries.
The environmental pollution at the hotspot sites puts at risk current activities and potential development of these areas. Tourism activities are a significant source of revenue for the eastern Adriatic Sea countries and, as the main export industry, strategic for their economies. It is estimated that in ten years Montenegro will become a country with the biggest contribution of tourism in GDP in the World
2. Although fisheries and aquaculture generate less than 0.5 % of GDP for Albania, Bosnia
and Herzegovina, Croatia, Montenegro and Slovenia, it has an important socio-economic value for the people living on the islands and the rural coastal communities. Adriatic tuna and shellfish farming still have significant development potentials.
Table 1 Contribution of tourism in the national economies3
Country 2011 Estimate for 2021
Total contribution of tourism in GDP
(in M€)
Percentage of GDP
Total contribution of tourism in GDP
(in M€)
Percentage of GDP
The Republic of Albania 2,453 26% 4,156.0 29%
Bosnia and Herzegovina 1,100.1 8.4% 2,728.6 8.9%
The Republic of Croatia 11,000 28% 16,800 31%
The Italian Republic 137,000 9% 168,000 9%
Montenegro 594 17% 1,915 36%
The Republic of Slovenia 4,643 12% 6,648 13%
2 "Country Reports," World Travel & Tourism Council, http://www.wttc.org.
3 Ibid.
9
Table 2 Contribution of fisheries in the national economies4
Country Total contribution of
fisheries in GDP (in M€) Percentage of GDP
The Republic of Albania 13.7 0.01%
Bosnia and Herzegovina 0.37 0.003%
The Republic of Croatia 121 0.23%
The Italian Republic 3,793 0.44%
Montenegro 7.4 0.40%
The Republic of Slovenia 4.7 0.02%
The main regional challenge is the issue of ballast waters from maritime transport, which are recognized as one of the main vectors for the spread of invasive species in the Adriatic Sea. The introduction of invasive species and loss of biodiversity further threatens the tourism and fishing activities. The solution to this challenge asks for regional measures to be adopted in the whole Adriatic Sea.
Six years after the last UNEP activity to list the priority issues in the Mediterranean5, it is observable
that the main pollution sources have remained similar. Improvements can be seen in the wastewater treatment capacity development at the eastern coast of the Adriatic Sea. This being noted, the development of environmental infrastructure for managing wastewater and waste is still a major investment need at the eastern coast, while Italy, and Slovenia to some extent, have moved its focus from building the environmental infrastructure to its maintenance and upgrades, and remediation of contaminated pollution sites. Apart from investments in the infrastructure there is a need of better management of the coastal zones; in terms of improving both coastal and marine spatial planning and environmental monitoring capacity.
Pollution hotspot site, as per definition proposed by this study, is a coastal area that is recipient of pollution, regardless of its source. This means that pollution sources can be located far in the inland and still contribute to the marine pollution at the hotspot site. In the course of this study a methodology for the prioritization of the identified pollution hotspot sites was developed taking into account impacts of pollution to ecological, socio-economic and public health values of concern. Data used for the identification and assessment of the pollution hotspot sites was collected from the recent official national and international publications, peer reviewed scientific journals, other public domain resources and stakeholders. Although there is a large set of environmental data available for the Adriatic Sea, the main difficulty, as in the majority of similar studies, is a lack of continuous environmental monitoring data with the sufficient spatial and temporal resolution that would allow for uniform assessment of the whole Adriatic Sea basin.
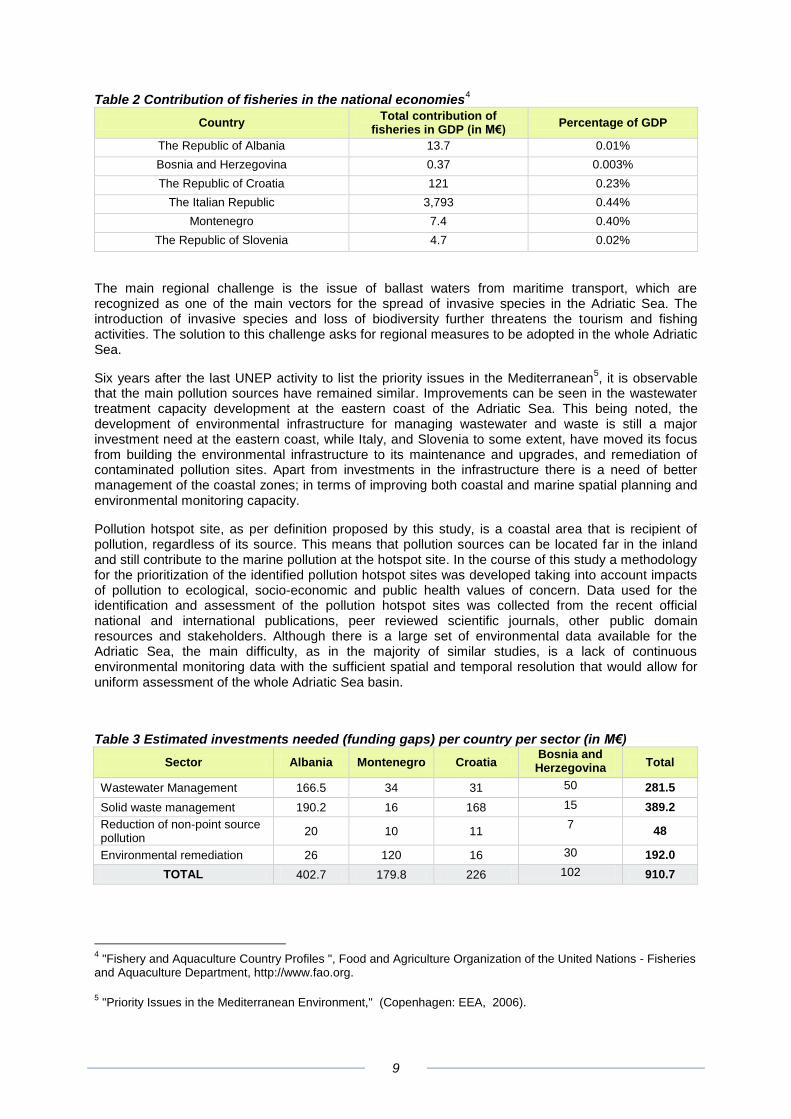
Table 3 Estimated investments needed (funding gaps) per country per sector (in M€)
Sector Albania Montenegro Croatia Bosnia and Herzegovina Total
Wastewater Management 166.5 34 31 50 281.5
Solid waste management 190.2 16 168 15 389.2
Reduction of non-point source pollution
20 10 11 7
48
Environmental remediation 26 120 16 30 192.0
TOTAL 402.7 179.8 226 102 910.7
4 "Fishery and Aquaculture Country Profiles ", Food and Agriculture Organization of the United Nations - Fisheries
and Aquaculture Department, http://www.fao.org.
5 "Priority Issues in the Mediterranean Environment," (Copenhagen: EEA, 2006).
10
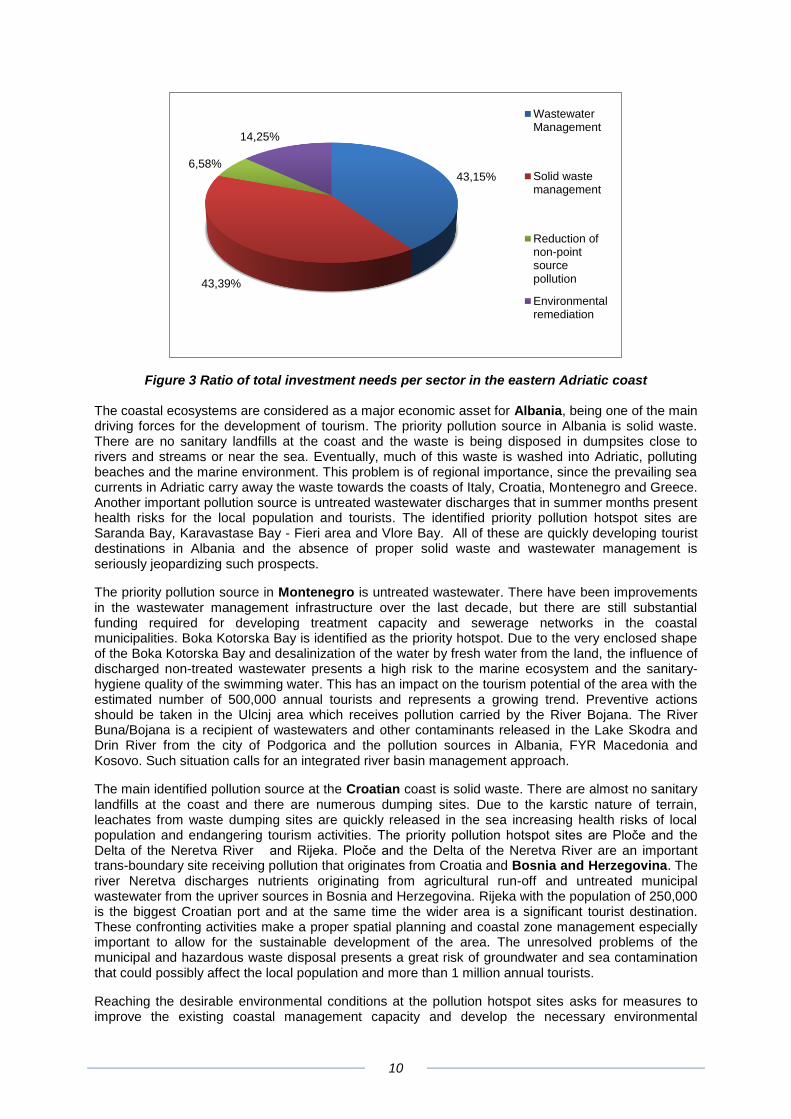
Figure 3 Ratio of total investment needs per sector in the eastern Adriatic coast The coastal ecosystems are considered as a major economic asset for Albania, being one of the main driving forces for the development of tourism. The priority pollution source in Albania is solid waste. There are no sanitary landfills at the coast and the waste is being disposed in dumpsites close to rivers and streams or near the sea. Eventually, much of this waste is washed into Adriatic, polluting beaches and the marine environment. This problem is of regional importance, since the prevailing sea currents in Adriatic carry away the waste towards the coasts of Italy, Croatia, Montenegro and Greece. Another important pollution source is untreated wastewater discharges that in summer months present health risks for the local population and tourists. The identified priority pollution hotspot sites are Saranda Bay, Karavastase Bay - Fieri area and Vlore Bay. All of these are quickly developing tourist destinations in Albania and the absence of proper solid waste and wastewater management is seriously jeopardizing such prospects.
The priority pollution source in Montenegro is untreated wastewater. There have been improvements in the wastewater management infrastructure over the last decade, but there are still substantial funding required for developing treatment capacity and sewerage networks in the coastal municipalities. Boka Kotorska Bay is identified as the priority hotspot. Due to the very enclosed shape of the Boka Kotorska Bay and desalinization of the water by fresh water from the land, the influence of discharged non-treated wastewater presents a high risk to the marine ecosystem and the sanitary-hygiene quality of the swimming water. This has an impact on the tourism potential of the area with the estimated number of 500,000 annual tourists and represents a growing trend. Preventive actions should be taken in the Ulcinj area which receives pollution carried by the River Bojana. The River Buna/Bojana is a recipient of wastewaters and other contaminants released in the Lake Skodra and Drin River from the city of Podgorica and the pollution sources in Albania, FYR Macedonia and Kosovo. Such situation calls for an integrated river basin management approach.
The main identified pollution source at the Croatian coast is solid waste. There are almost no sanitary landfills at the coast and there are numerous dumping sites. Due to the karstic nature of terrain, leachates from waste dumping sites are quickly released in the sea increasing health risks of local population and endangering tourism activities. The priority pollution hotspot sites are Ploče and the Delta of the Neretva River and Rijeka. Ploče and the Delta of the Neretva River are an important trans-boundary site receiving pollution that originates from Croatia and Bosnia and Herzegovina. The river Neretva discharges nutrients originating from agricultural run-off and untreated municipal wastewater from the upriver sources in Bosnia and Herzegovina. Rijeka with the population of 250,000 is the biggest Croatian port and at the same time the wider area is a significant tourist destination. These confronting activities make a proper spatial planning and coastal zone management especially important to allow for the sustainable development of the area. The unresolved problems of the municipal and hazardous waste disposal presents a great risk of groundwater and sea contamination that could possibly affect the local population and more than 1 million annual tourists.
Reaching the desirable environmental conditions at the pollution hotspot sites asks for measures to improve the existing coastal management capacity and develop the necessary environmental
43,15%
43,39%
6,58%
14,25%
WastewaterManagement
Solid wastemanagement
Reduction ofnon-pointsourcepollution
Environmentalremediation
11
infrastructure. There are plenty of available tools that can be put to use in the management of coastal zones such as Integrated Coastal Zone Management, Integrated River Basin Management and Maritime Spatial Planning. However, in order to properly apply these tools, there is a need to strengthen institutional capacity on the regional and local level. The major difficulty is a lack of continuous environmental monitoring data that would allow decision makers to make better informed decisions and evaluate results of environmental protection activities. Since this problem is common for all the countries, it is recommended to facilitate creation of joint environmental monitoring initiatives and a regional platform for exchanging data. There are other inter-regional problems that can be resolved only by joint efforts, such as: pollution from maritime transport, including management of ballast waters and spread of invasive species. The existing institutional structures, such as the Strategic Partnership for the Mediterranean Large Marine Ecosystem (MedPartnership) and the Adriatic Ionian Initiative can be used to foster the adoption and steer the implementation of necessary measures.
To mobilise the investments in the environmental sector, it is recommended as a first step to prepare economic and institutional sectorial analysis that would identify the most cost-effective and sustainable approach for the infrastructure development and the optimal institutional set up. To be sustainable, the infrastructure development has to run in parallel with the capacity building at the municipal level for its operation and management. This can be partially accomplished through a stronger involvement of the private sector where such regulatory possibilities exist.
12
Chapter 2 Introduction
Structure of the Report
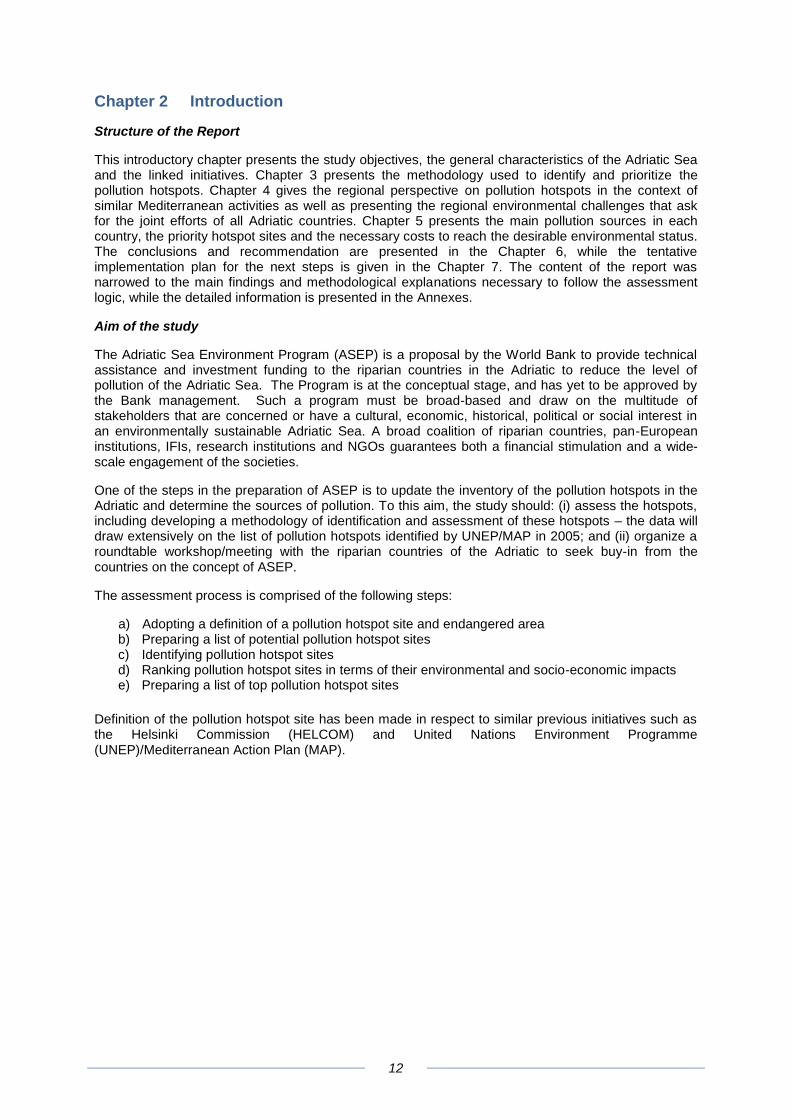
This introductory chapter presents the study objectives, the general characteristics of the Adriatic Sea and the linked initiatives. Chapter 3 presents the methodology used to identify and prioritize the pollution hotspots. Chapter 4 gives the regional perspective on pollution hotspots in the context of similar Mediterranean activities as well as presenting the regional environmental challenges that ask for the joint efforts of all Adriatic countries. Chapter 5 presents the main pollution sources in each country, the priority hotspot sites and the necessary costs to reach the desirable environmental status. The conclusions and recommendation are presented in the Chapter 6, while the tentative implementation plan for the next steps is given in the Chapter 7. The content of the report was narrowed to the main findings and methodological explanations necessary to follow the assessment logic, while the detailed information is presented in the Annexes.
Aim of the study
The Adriatic Sea Environment Program (ASEP) is a proposal by the World Bank to provide technical assistance and investment funding to the riparian countries in the Adriatic to reduce the level of pollution of the Adriatic Sea. The Program is at the conceptual stage, and has yet to be approved by the Bank management. Such a program must be broad-based and draw on the multitude of stakeholders that are concerned or have a cultural, economic, historical, political or social interest in an environmentally sustainable Adriatic Sea. A broad coalition of riparian countries, pan-European institutions, IFIs, research institutions and NGOs guarantees both a financial stimulation and a wide-scale engagement of the societies.
One of the steps in the preparation of ASEP is to update the inventory of the pollution hotspots in the Adriatic and determine the sources of pollution. To this aim, the study should: (i) assess the hotspots, including developing a methodology of identification and assessment of these hotspots – the data will draw extensively on the list of pollution hotspots identified by UNEP/MAP in 2005; and (ii) organize a roundtable workshop/meeting with the riparian countries of the Adriatic to seek buy-in from the countries on the concept of ASEP.
The assessment process is comprised of the following steps:
a) Adopting a definition of a pollution hotspot site and endangered area b) Preparing a list of potential pollution hotspot sites c) Identifying pollution hotspot sites d) Ranking pollution hotspot sites in terms of their environmental and socio-economic impacts e) Preparing a list of top pollution hotspot sites
Definition of the pollution hotspot site has been made in respect to similar previous initiatives such as the Helsinki Commission (HELCOM) and United Nations Environment Programme (UNEP)/Mediterranean Action Plan (MAP).
13
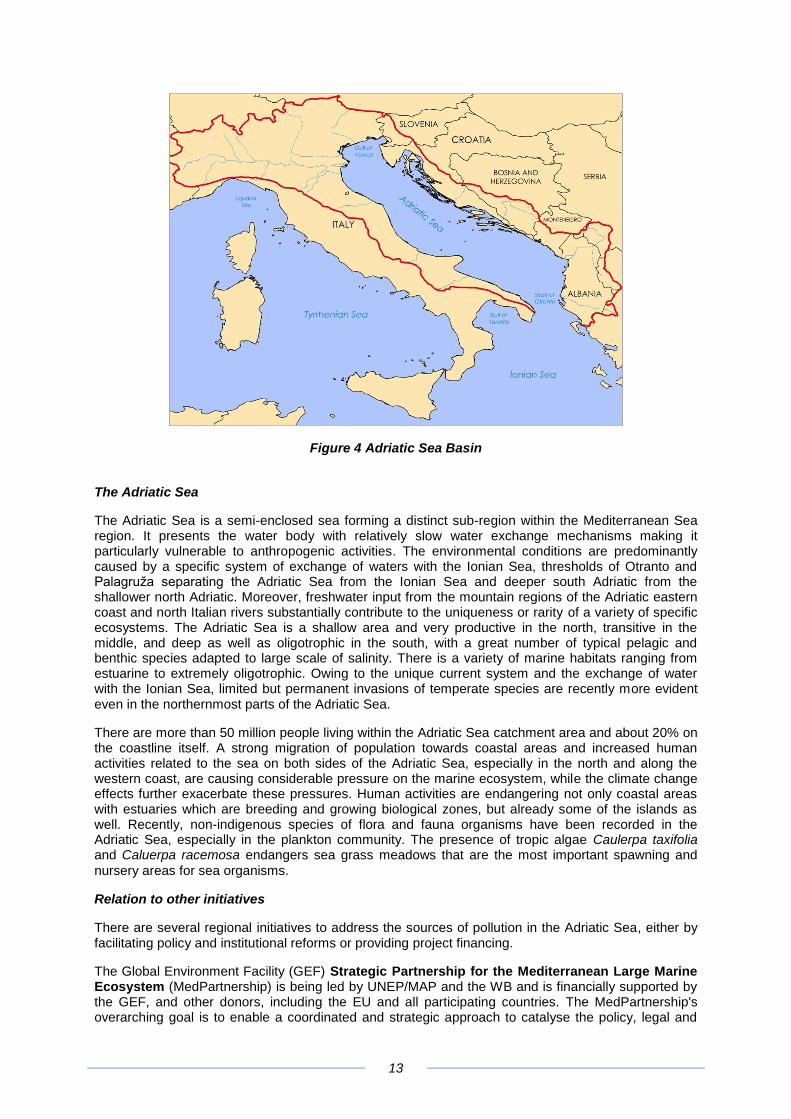
Figure 4 Adriatic Sea Basin
The Adriatic Sea
The Adriatic Sea is a semi-enclosed sea forming a distinct sub-region within the Mediterranean Sea region. It presents the water body with relatively slow water exchange mechanisms making it particularly vulnerable to anthropogenic activities. The environmental conditions are predominantly caused by a specific system of exchange of waters with the Ionian Sea, thresholds of Otranto and Palagruža separating the Adriatic Sea from the Ionian Sea and deeper south Adriatic from the shallower north Adriatic. Moreover, freshwater input from the mountain regions of the Adriatic eastern coast and north Italian rivers substantially contribute to the uniqueness or rarity of a variety of specific ecosystems. The Adriatic Sea is a shallow area and very productive in the north, transitive in the middle, and deep as well as oligotrophic in the south, with a great number of typical pelagic and benthic species adapted to large scale of salinity. There is a variety of marine habitats ranging from estuarine to extremely oligotrophic. Owing to the unique current system and the exchange of water with the Ionian Sea, limited but permanent invasions of temperate species are recently more evident even in the northernmost parts of the Adriatic Sea.
There are more than 50 million people living within the Adriatic Sea catchment area and about 20% on the coastline itself. A strong migration of population towards coastal areas and increased human activities related to the sea on both sides of the Adriatic Sea, especially in the north and along the western coast, are causing considerable pressure on the marine ecosystem, while the climate change effects further exacerbate these pressures. Human activities are endangering not only coastal areas with estuaries which are breeding and growing biological zones, but already some of the islands as well. Recently, non-indigenous species of flora and fauna organisms have been recorded in the Adriatic Sea, especially in the plankton community. The presence of tropic algae Caulerpa taxifolia and Caluerpa racemosa endangers sea grass meadows that are the most important spawning and
nursery areas for sea organisms.
Relation to other initiatives
There are several regional initiatives to address the sources of pollution in the Adriatic Sea, either by facilitating policy and institutional reforms or providing project financing.
The Global Environment Facility (GEF) Strategic Partnership for the Mediterranean Large Marine Ecosystem (MedPartnership) is being led by UNEP/MAP and the WB and is financially supported by the GEF, and other donors, including the EU and all participating countries. The MedPartnership's overarching goal is to enable a coordinated and strategic approach to catalyse the policy, legal and
14
institutional reforms, and the investments necessary to reverse the degradation trends affecting the Mediterranean, including its coastal habitats and biodiversity. The MedPartnership works through two lines of actions:
● Technical and policy support led by UNEP/MAP (Regional Project); and
● Project financing led by the WB (Investment Fund/Environmental Mediterranean Sustainable Development Program (Sustainable MED).
The Sustainable MED program is a WB initiative supported by the GEF, aimed at enhancing and accelerating the implementation of trans-boundary pollution reduction, improving water resources management, and developing biodiversity conservation measures in priority hotspots and sensitive areas in selected Mediterranean basin countries that would help to achieve the Strategic Action Plans (SAP) - SAP MED and SAP BIO targets. It evolved in 2009 from the Investment fund that was established with the similar aim in 2007.
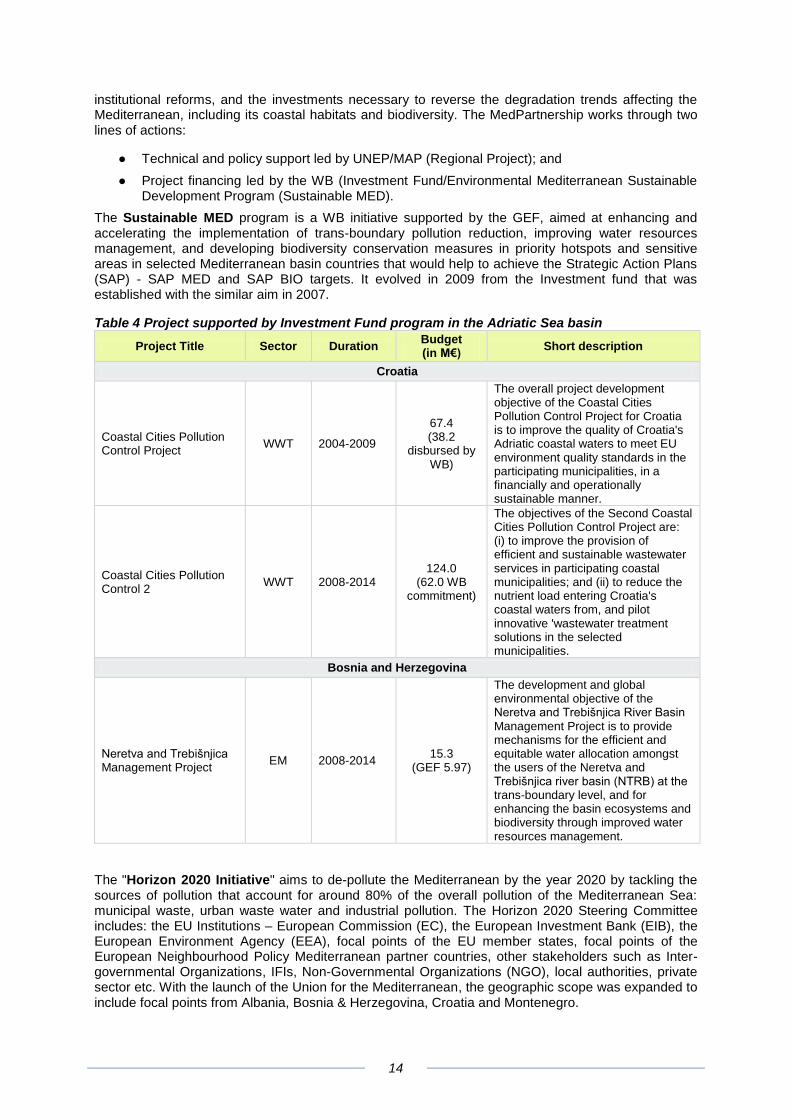
Table 4 Project supported by Investment Fund program in the Adriatic Sea basin
Project Title Sector Duration Budget (in M€)
Short description
Croatia
Coastal Cities Pollution Control Project
WWT 2004-2009
67.4 (38.2
disbursed by WB)
The overall project development objective of the Coastal Cities Pollution Control Project for Croatia is to improve the quality of Croatia's Adriatic coastal waters to meet EU environment quality standards in the participating municipalities, in a financially and operationally sustainable manner.
Coastal Cities Pollution Control 2
WWT 2008-2014 124.0
(62.0 WB commitment)
The objectives of the Second Coastal Cities Pollution Control Project are: (i) to improve the provision of efficient and sustainable wastewater services in participating coastal municipalities; and (ii) to reduce the nutrient load entering Croatia's coastal waters from, and pilot innovative 'wastewater treatment solutions in the selected municipalities.
Bosnia and Herzegovina
Neretva and Trebišnjica Management Project
EM 2008-2014 15.3
(GEF 5.97)
The development and global environmental objective of the Neretva and Trebišnjica River Basin Management Project is to provide mechanisms for the efficient and equitable water allocation amongst the users of the Neretva and Trebišnjica river basin (NTRB) at the trans-boundary level, and for enhancing the basin ecosystems and biodiversity through improved water resources management.
The "Horizon 2020 Initiative" aims to de-pollute the Mediterranean by the year 2020 by tackling the sources of pollution that account for around 80% of the overall pollution of the Mediterranean Sea: municipal waste, urban waste water and industrial pollution. The Horizon 2020 Steering Committee includes: the EU Institutions – European Commission (EC), the European Investment Bank (EIB), the European Environment Agency (EEA), focal points of the EU member states, focal points of the European Neighbourhood Policy Mediterranean partner countries, other stakeholders such as Inter-governmental Organizations, IFIs, Non-Governmental Organizations (NGO), local authorities, private sector etc. With the launch of the Union for the Mediterranean, the geographic scope was expanded to include focal points from Albania, Bosnia & Herzegovina, Croatia and Montenegro.
15
The Pollution Reduction Investments Sub Group is one of the three sub-groups set up by the Horizon 2020 Steering Group. Chaired by the EIB, its task is the identification and development of investment projects to reduce the most significant sources of pollution in the Mediterranean.
There are two projects currently active in the scope of this group:
i) the Mediterranean Hotspots Investment Programme – Project Preparation and Implementation Facility
This project aims to support the Horizon 2020 Investments for Pollution Reduction component. This will mainly be achieved through providing project development support to infrastructure investment projects, which will assist these projects to proceed towards securing funding and successful implementation. The projects derive mainly from the so-called "hotspots" as identified under the National Action Plan (NAP) exercise that was coordinated by the UNEP/MAP. In order to be chosen, the projects have to meet a set of criteria (financial and environmental) as well as be strongly supported by the national administration responsible for planning and finance. The Phase II was launched in February 2010 and is expected to be completed by April 2013.
ii) Hotspot Inventory for the West Balkans and Turkey
Α Hotspot Inventory for the West Balkans (Albania, Bosnia & Herzegovina, Croatia and Montenegro) and Turkey, complementing the existing hotspot inventory for the Southern Mediterranean countries covered by the Mediterranean Hotspots Investment Programme, was launched in September 2010. The project aims to identify environmental hotspot investments and appropriate funding sources that will significantly contribute to the depollution of the Mediterranean by 2020.
While the scope of this study is assessing and prioritizing pollution hotspot sites and identifying main pollution sources, the Hotspot Inventory project is focused on assessing the status and financial gaps of individual investment projects mainly identified in the countries’ National Action Plans. In this respect these two studies are complementary.
The final report was published in summer 2011. It showed that an average of 20% of the projects identified in the National Action Plans in the field of wastewater and solid waste management remains to be funded and 15% of the projects is only partially funded. It further showed that industrial pollution control and clean-up projects suffer from low compliance levels and a lack of liability for environmental pollution and need to be specially addressed in order to become fundable. It was recommended to consider launching a project preparation facility for developing and managing a project pipeline in the Western Balkans and Turkey.
16
Chapter 3 Identification of Pollution Hotspots and Endangered Areas
This chapter adopts a definition of pollution hotspot sites as used in this report. It presents the criteria used to identify a potential pollution hotspot site and it presents common environmental indicators that are used in assessing if such potential site should be regarded as a pollution hotspot.
3.1. Definition of Pollution Hotspot Sites
The UNEP/MAP provides two complementary definitions of pollution hotspot sites; as point source pollution sites at the coast or as the coastal area, which is subject to pollution from one or more sources of point source or non-point source pollution.
The UNEP/MAP definition of pollution hotspot sites:
a) Point sources on the coast of the Mediterranean Sea which potentially affect human health, ecosystems, biodiversity, sustainability or economy in a significant manner. They are the main points where high levels of pollution loads originating from domestic or industrial sources are being discharged;
b) Defined coastal areas where the coastal marine environment is subject to pollution from one or more points or diffused sources on the coast of the Mediterranean, which potentially affect human health in a significant manner, ecosystems, biodiversity, sustainability or economy.
The HELCOM definition of coastal lagoon and Wetland Hotspots:
Coastal lagoon or wetland can be considered as hotspots “if potential qualities of the area are considered to be substantial, in terms of biodiversity and landscape, natural resources for human use, and/or the area plays an important role as a buffer for pollution loads and variations in the hydrological cycle, but these aspects are now in a state of deterioration.”
The HELCOM defines a hotspot through a set of criteria for different point and non-point sources of pollution affecting the coastal environment. Similar to the UNEP/MAP, there are two ways to define a pollution hotspot site, either as a source of pollution (point or non-point) contributing to the coastal environmental quality degradation or as a recipient coastal area which shows deteriorating natural qualities.
Within the scope of this project, the pollution hotspot sites were regarded as coastal areas that are recipients of pollution regardless of its source in the quantities that threaten different values of concern and its potential use. Practically, this means that a pollution source may be located far away upriver from the coastal area that is recipient of pollution.
The adopted definition for coastal pollution hotspot site within this project is:
“A coastal area where the environment is subject to pollution due to intense human activities regardless of their location and source, which potentially affect public health, threaten biodiversity, degrade ecosystem services and put at risk the prospects for sustainable development both on the spot but also in a wider area.”
3.2. Definition of endangered areas
The definition of endangered area adopted in this study is:
“A coastal area that is in danger of becoming a pollution hotspot in the future due to existing human activities, but it still cannot be classified as such in accordance to the coastal pollution hotspot definition.”
17
In this respect, endangered areas are all potential hotspot areas that still do not satisfy criteria to be identified as pollution hotspot sites.
3.3. Methodology
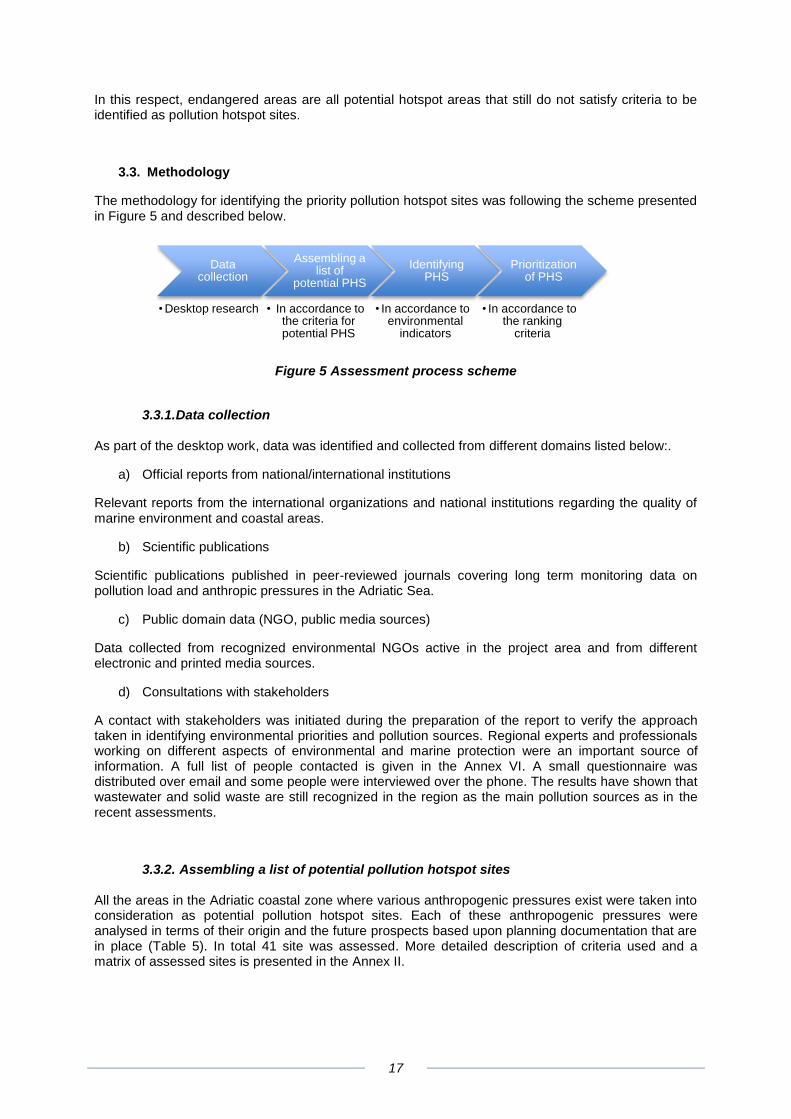
The methodology for identifying the priority pollution hotspot sites was following the scheme presented in Figure 5 and described below.
Figure 5 Assessment process scheme
3.3.1. Data collection
As part of the desktop work, data was identified and collected from different domains listed below:.
a) Official reports from national/international institutions
Relevant reports from the international organizations and national institutions regarding the quality of marine environment and coastal areas.
b) Scientific publications
Scientific publications published in peer-reviewed journals covering long term monitoring data on pollution load and anthropic pressures in the Adriatic Sea.
c) Public domain data (NGO, public media sources)
Data collected from recognized environmental NGOs active in the project area and from different electronic and printed media sources.
d) Consultations with stakeholders
A contact with stakeholders was initiated during the preparation of the report to verify the approach taken in identifying environmental priorities and pollution sources. Regional experts and professionals working on different aspects of environmental and marine protection were an important source of information. A full list of people contacted is given in the Annex VI. A small questionnaire was distributed over email and some people were interviewed over the phone. The results have shown that wastewater and solid waste are still recognized in the region as the main pollution sources as in the recent assessments.
3.3.2. Assembling a list of potential pollution hotspot sites
All the areas in the Adriatic coastal zone where various anthropogenic pressures exist were taken into consideration as potential pollution hotspot sites. Each of these anthropogenic pressures were analysed in terms of their origin and the future prospects based upon planning documentation that are in place (Table 5). In total 41 site was assessed. More detailed description of criteria used and a matrix of assessed sites is presented in the Annex II.
Data collection
• Desktop research
Assembling a list of
potential PHS
• In accordance to the criteria for potential PHS
Identifying PHS
• In accordance to environmental
indicators
Prioritization of PHS
• In accordance to the ranking
criteria
18
Table 5 Summary table of the criteria used for establishing a list of potential PHS sites
Criteria Description Environmental
Pressures
A Densely populated
areas
Large population centres6, popular touristic
areas or densely populated coastal areas without adequate wastewater treatment
(municipal PHS)
Wastewater
B Coastal industry Sites with large untreated wastewater outlets in
the sea Wastewater, solid waste
C Big ports Intense maritime transport routes and ports
(commercial and civil) Ballast waters, bilge waters, solid waste
D Landfills and dump
sites Non sanitary landfills and dump sites located in
proximity of the coastline Litter, leachate
E Oil/gas drilling and
mining sites Oil/gas drilling and mining activities in proximity
of the coastline or at the sea Oil, heavy metals
F Big aquaculture areas Areas with intensive fish and shellfish farming Nutrient enrichment
G Large river discharges Large river discharges, carrying along a) solid
waste, b) urban wastewater, c) industrial wastewater, d) agricultural run-offs
Nutrients, solid waste, wastewaters
H Intensive agriculture
areas
Sea waters receiving substantial agricultural run-offs from the intensively cultivated coastal
agriculture areas
Agricultural run-offs containing nutrients,
pesticides
I Historical pollution
sites Sites where pollution occurred in the past, but
the risk to the environment is still present
Sunken ships carrying hazardous waste,
abandoned industries, disposed weaponry
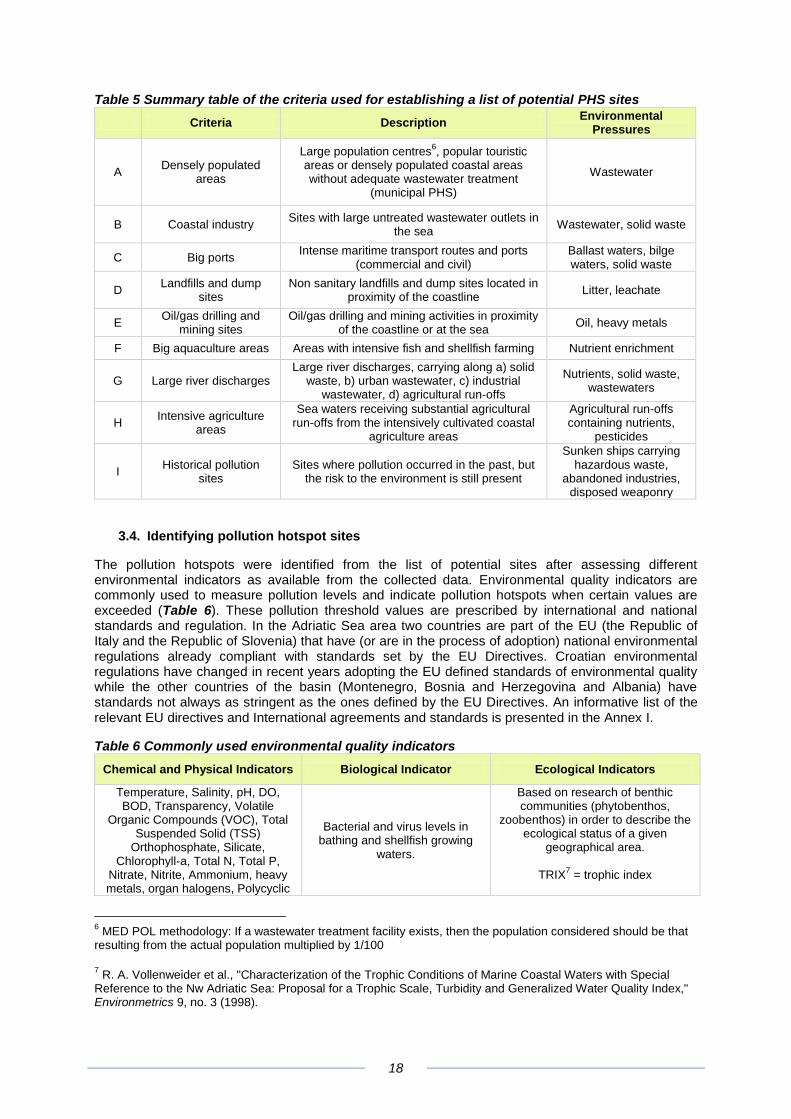
3.4. Identifying pollution hotspot sites
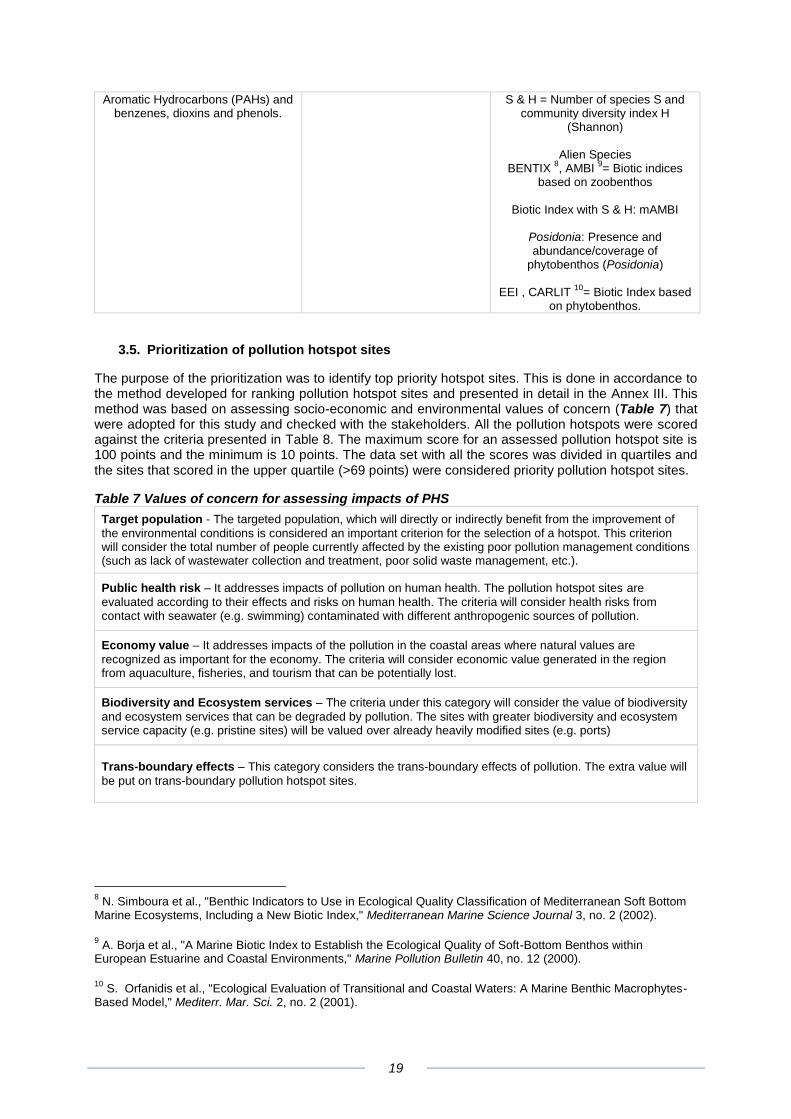
The pollution hotspots were identified from the list of potential sites after assessing different environmental indicators as available from the collected data. Environmental quality indicators are commonly used to measure pollution levels and indicate pollution hotspots when certain values are exceeded (Table 6). These pollution threshold values are prescribed by international and national standards and regulation. In the Adriatic Sea area two countries are part of the EU (the Republic of Italy and the Republic of Slovenia) that have (or are in the process of adoption) national environmental regulations already compliant with standards set by the EU Directives. Croatian environmental regulations have changed in recent years adopting the EU defined standards of environmental quality while the other countries of the basin (Montenegro, Bosnia and Herzegovina and Albania) have standards not always as stringent as the ones defined by the EU Directives. An informative list of the relevant EU directives and International agreements and standards is presented in the Annex I.
Table 6 Commonly used environmental quality indicators
Chemical and Physical Indicators Biological Indicator Ecological Indicators
Temperature, Salinity, pH, DO, BOD, Transparency, Volatile
Organic Compounds (VOC), Total Suspended Solid (TSS)
Orthophosphate, Silicate, Chlorophyll-a, Total N, Total P,
Nitrate, Nitrite, Ammonium, heavy metals, organ halogens, Polycyclic
Bacterial and virus levels in bathing and shellfish growing
waters.
Based on research of benthic communities (phytobenthos,
zoobenthos) in order to describe the ecological status of a given
geographical area.
TRIX7 = trophic index
6 MED POL methodology: If a wastewater treatment facility exists, then the population considered should be that
resulting from the actual population multiplied by 1/100
7 R. A. Vollenweider et al., "Characterization of the Trophic Conditions of Marine Coastal Waters with Special
Reference to the Nw Adriatic Sea: Proposal for a Trophic Scale, Turbidity and Generalized Water Quality Index," Environmetrics 9, no. 3 (1998).
19
Aromatic Hydrocarbons (PAHs) and benzenes, dioxins and phenols.
S & H = Number of species S and community diversity index H
(Shannon)
Alien Species BENTIX
8, AMBI
9= Biotic indices
based on zoobenthos
Biotic Index with S & H: mAMBI
Posidonia: Presence and abundance/coverage of
phytobenthos (Posidonia)
EEI , CARLIT 10
= Biotic Index based on phytobenthos.
3.5. Prioritization of pollution hotspot sites
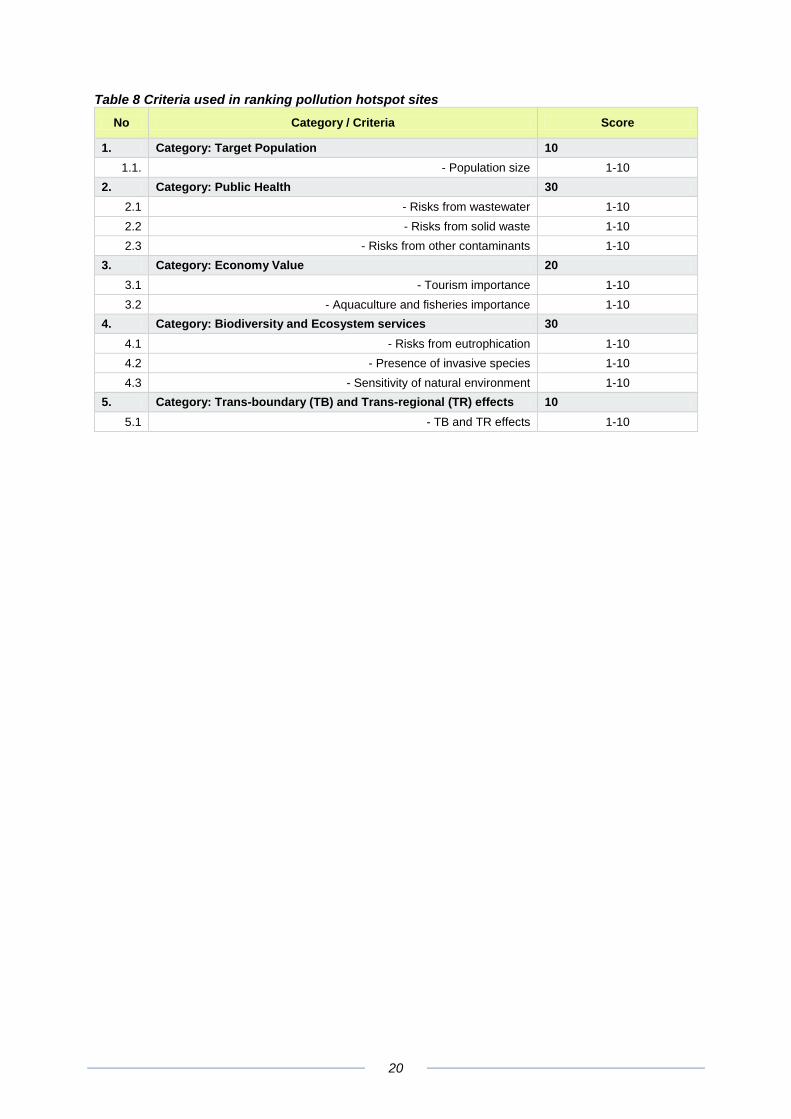
The purpose of the prioritization was to identify top priority hotspot sites. This is done in accordance to the method developed for ranking pollution hotspot sites and presented in detail in the Annex III. This method was based on assessing socio-economic and environmental values of concern (Table 7) that were adopted for this study and checked with the stakeholders. All the pollution hotspots were scored against the criteria presented in Table 8. The maximum score for an assessed pollution hotspot site is 100 points and the minimum is 10 points. The data set with all the scores was divided in quartiles and the sites that scored in the upper quartile (>69 points) were considered priority pollution hotspot sites.
Table 7 Values of concern for assessing impacts of PHS
Target population - The targeted population, which will directly or indirectly benefit from the improvement of
the environmental conditions is considered an important criterion for the selection of a hotspot. This criterion will consider the total number of people currently affected by the existing poor pollution management conditions (such as lack of wastewater collection and treatment, poor solid waste management, etc.).
Public health risk – It addresses impacts of pollution on human health. The pollution hotspot sites are
evaluated according to their effects and risks on human health. The criteria will consider health risks from contact with seawater (e.g. swimming) contaminated with different anthropogenic sources of pollution.
Economy value – It addresses impacts of the pollution in the coastal areas where natural values are
recognized as important for the economy. The criteria will consider economic value generated in the region from aquaculture, fisheries, and tourism that can be potentially lost.
Biodiversity and Ecosystem services – The criteria under this category will consider the value of biodiversity
and ecosystem services that can be degraded by pollution. The sites with greater biodiversity and ecosystem service capacity (e.g. pristine sites) will be valued over already heavily modified sites (e.g. ports)
Trans-boundary effects – This category considers the trans-boundary effects of pollution. The extra value will
be put on trans-boundary pollution hotspot sites.
8 N. Simboura et al., "Benthic Indicators to Use in Ecological Quality Classification of Mediterranean Soft Bottom
Marine Ecosystems, Including a New Biotic Index," Mediterranean Marine Science Journal 3, no. 2 (2002).
9 A. Borja et al., "A Marine Biotic Index to Establish the Ecological Quality of Soft-Bottom Benthos within
European Estuarine and Coastal Environments," Marine Pollution Bulletin 40, no. 12 (2000).
10 S. Orfanidis et al., "Ecological Evaluation of Transitional and Coastal Waters: A Marine Benthic Macrophytes-
Based Model," Mediterr. Mar. Sci. 2, no. 2 (2001).
20
Table 8 Criteria used in ranking pollution hotspot sites
No Category / Criteria Score
1. Category: Target Population 10
1.1. - Population size 1-10
2. Category: Public Health 30
2.1 - Risks from wastewater 1-10
2.2 - Risks from solid waste 1-10
2.3 - Risks from other contaminants 1-10
3. Category: Economy Value 20
3.1 - Tourism importance 1-10
3.2 - Aquaculture and fisheries importance 1-10
4. Category: Biodiversity and Ecosystem services 30
4.1 - Risks from eutrophication 1-10
4.2 - Presence of invasive species 1-10
4.3 - Sensitivity of natural environment 1-10
5. Category: Trans-boundary (TB) and Trans-regional (TR) effects 10
5.1 - TB and TR effects 1-10
21
Chapter 4 Regional perspective
4.1. Adriatic Sea in the Mediterranean context
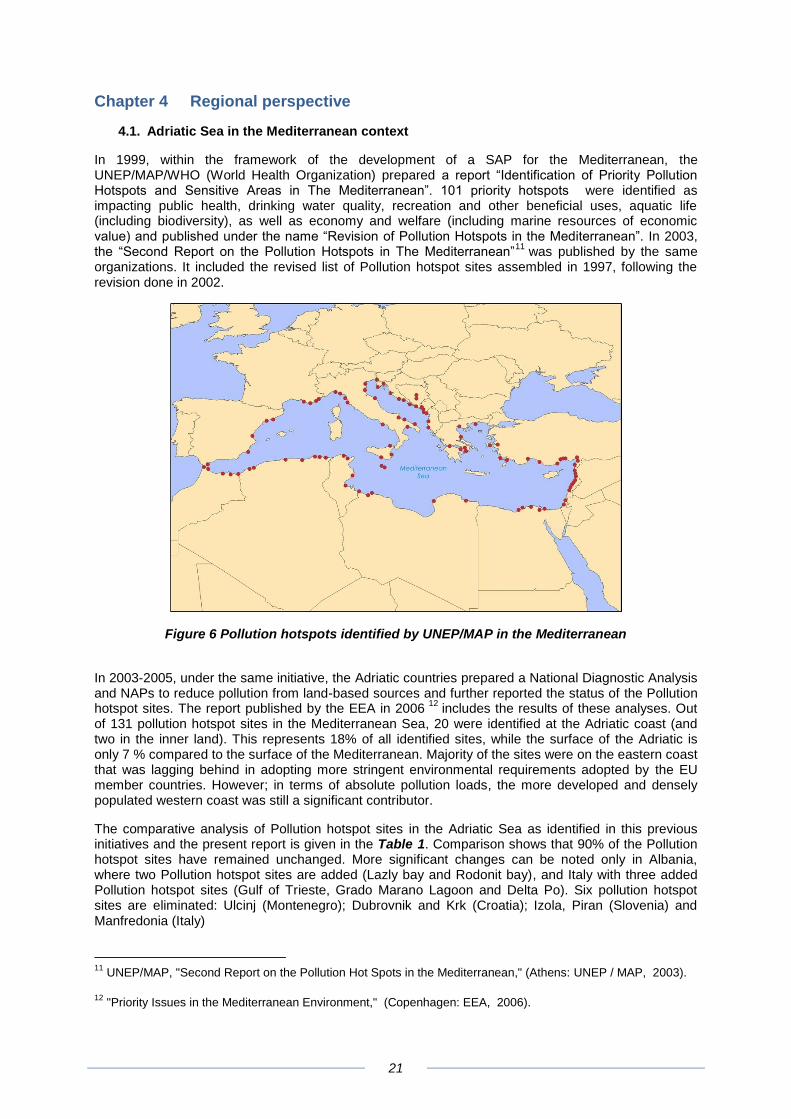
In 1999, within the framework of the development of a SAP for the Mediterranean, the UNEP/MAP/WHO (World Health Organization) prepared a report “Identification of Priority Pollution Hotspots and Sensitive Areas in The Mediterranean”. 101 priority hotspots were identified as impacting public health, drinking water quality, recreation and other beneficial uses, aquatic life (including biodiversity), as well as economy and welfare (including marine resources of economic value) and published under the name “Revision of Pollution Hotspots in the Mediterranean”. In 2003, the “Second Report on the Pollution Hotspots in The Mediterranean”
11 was published by the same
organizations. It included the revised list of Pollution hotspot sites assembled in 1997, following the revision done in 2002.
Figure 6 Pollution hotspots identified by UNEP/MAP in the Mediterranean
In 2003-2005, under the same initiative, the Adriatic countries prepared a National Diagnostic Analysis and NAPs to reduce pollution from land-based sources and further reported the status of the Pollution hotspot sites. The report published by the EEA in 2006
12 includes the results of these analyses. Out
of 131 pollution hotspot sites in the Mediterranean Sea, 20 were identified at the Adriatic coast (and two in the inner land). This represents 18% of all identified sites, while the surface of the Adriatic is only 7 % compared to the surface of the Mediterranean. Majority of the sites were on the eastern coast that was lagging behind in adopting more stringent environmental requirements adopted by the EU member countries. However; in terms of absolute pollution loads, the more developed and densely populated western coast was still a significant contributor.
The comparative analysis of Pollution hotspot sites in the Adriatic Sea as identified in this previous initiatives and the present report is given in the Table 1. Comparison shows that 90% of the Pollution hotspot sites have remained unchanged. More significant changes can be noted only in Albania, where two Pollution hotspot sites are added (Lazly bay and Rodonit bay), and Italy with three added Pollution hotspot sites (Gulf of Trieste, Grado Marano Lagoon and Delta Po). Six pollution hotspot sites are eliminated: Ulcinj (Montenegro); Dubrovnik and Krk (Croatia); Izola, Piran (Slovenia) and Manfredonia (Italy)
11
UNEP/MAP, "Second Report on the Pollution Hot Spots in the Mediterranean," (Athens: UNEP / MAP, 2003).
12 "Priority Issues in the Mediterranean Environment," (Copenhagen: EEA, 2006).
22
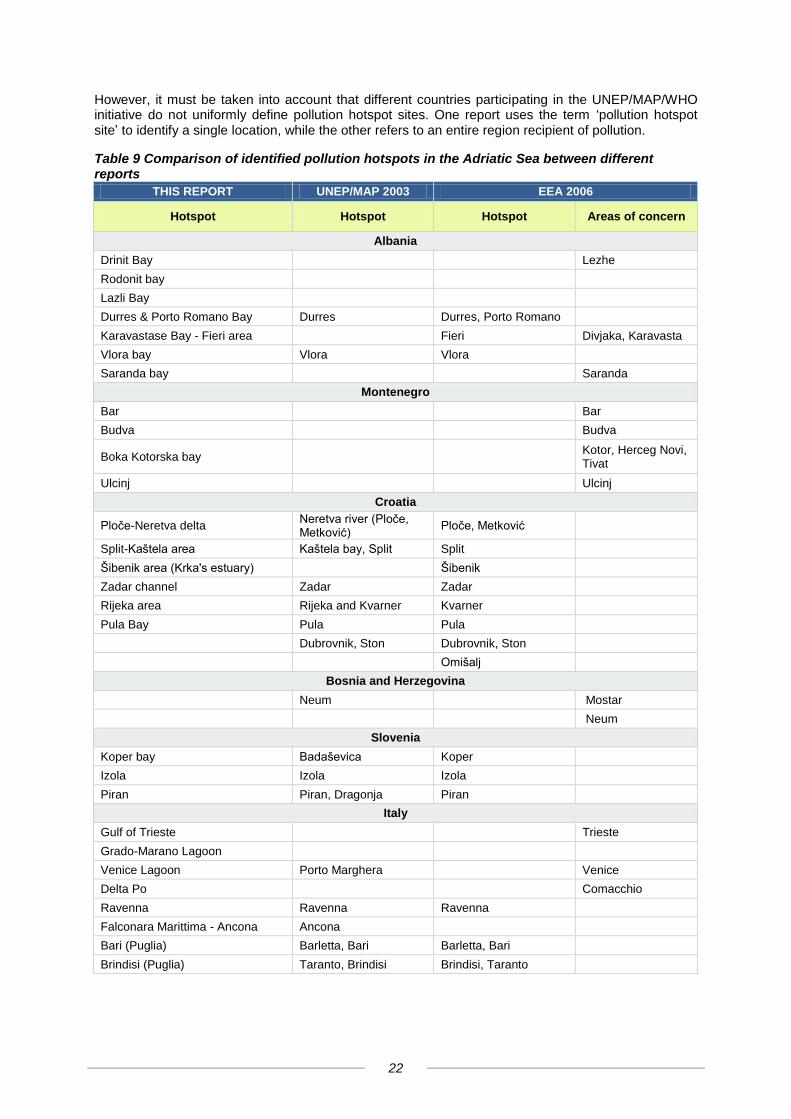
However, it must be taken into account that different countries participating in the UNEP/MAP/WHO initiative do not uniformly define pollution hotspot sites. One report uses the term ‘pollution hotspot site’ to identify a single location, while the other refers to an entire region recipient of pollution.
Table 9 Comparison of identified pollution hotspots in the Adriatic Sea between different reports
THIS REPORT UNEP/MAP 2003 EEA 2006
Hotspot Hotspot Hotspot Areas of concern
Albania
Drinit Bay Lezhe
Rodonit bay
Lazli Bay
Durres & Porto Romano Bay Durres Durres, Porto Romano
Karavastase Bay - Fieri area Fieri Divjaka, Karavasta
Vlora bay Vlora Vlora
Saranda bay Saranda
Montenegro
Bar Bar
Budva Budva
Boka Kotorska bay Kotor, Herceg Novi, Tivat
Ulcinj Ulcinj
Croatia
Ploče-Neretva delta Neretva river (Ploče, Metković)
Ploče, Metković
Split-Kaštela area Kaštela bay, Split Split
Šibenik area (Krka's estuary) Šibenik
Zadar channel Zadar Zadar
Rijeka area Rijeka and Kvarner Kvarner
Pula Bay Pula Pula
Dubrovnik, Ston Dubrovnik, Ston
Omišalj
Bosnia and Herzegovina
Neum Mostar
Neum
Slovenia
Koper bay Badaševica Koper
Izola Izola Izola
Piran Piran, Dragonja Piran
Italy
Gulf of Trieste Trieste
Grado-Marano Lagoon
Venice Lagoon Porto Marghera Venice
Delta Po Comacchio
Ravenna Ravenna Ravenna
Falconara Marittima - Ancona Ancona
Bari (Puglia) Barletta, Bari Barletta, Bari
Brindisi (Puglia) Taranto, Brindisi Brindisi, Taranto
23
4.2. Regional issue: Ballast waters and invasive species
A matter of increasingly serious concern in the Adriatic Sea is the introduction of invasive species through ships’ ballast water and sediments. The quantity of ballast water released in the Adriatic ports of Italy, Croatia and Slovenia estimated for the year 2003 was around 8 million tonnes, of which around 80 % was discharged in the Italian Adriatic ports, while the remaining volume was shared between Slovenia’s port of Koper and all the Croatian ports together
13. Nowadays, however, most of
that ballast water arrives from locations within the Mediterranean (58%), and due to inter-Adriatic traffic (34%), while only 8% of ballast water volume released in the Adriatic ports is currently originating from ports located outside the Mediterranean Sea. With expected changes in import and export flows, and especially if a major new oil export route is introduced from a deep-sea port in the Adriatic, those proportions will change considerably, so that a far larger ballast water volume discharged in the Adriatic Sea will be from vessels arriving from ports outside the Mediterranean Sea. The risk of introduction of harmful invasive species could in that case become significantly increased. The solution to this challenge asks for regional measures to be adopted in the whole Adriatic Sea to prevent the uncontrolled exchange of ballast waters. The need to develop facilities for the treatment of ballast waters in the major Adriatic ports should be examined as well.
4.3. Regional issue: Harmful Algal Blooms
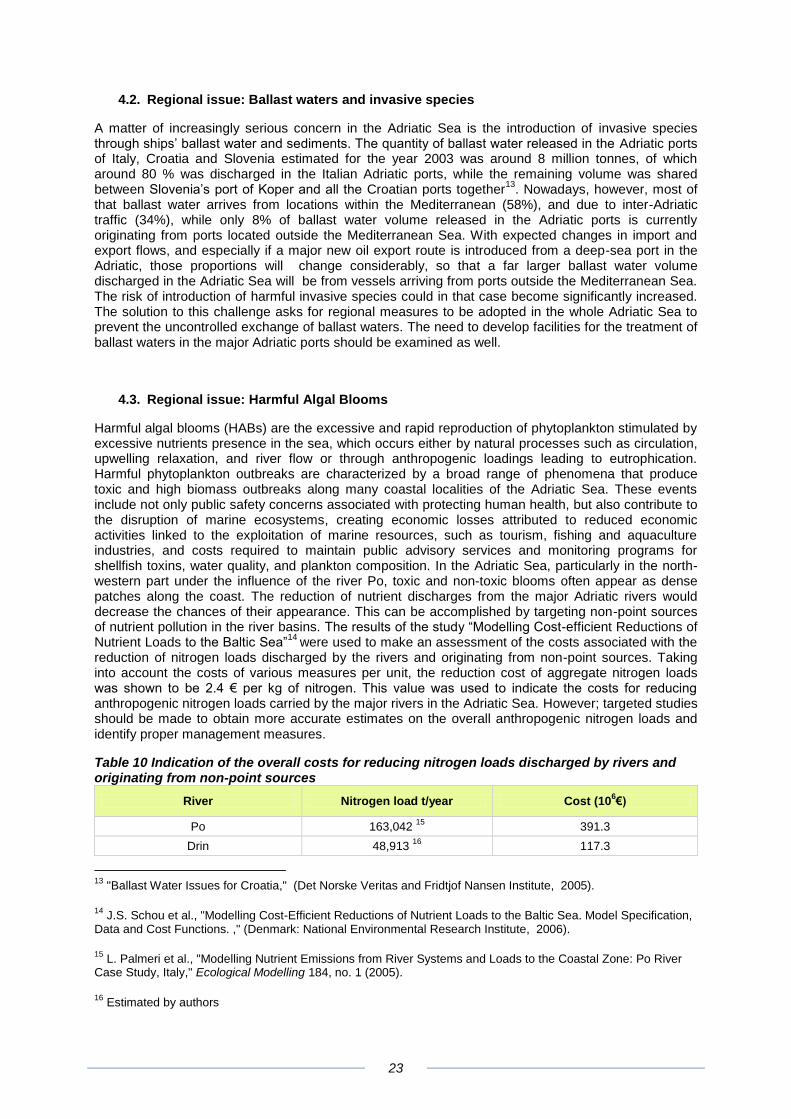
Harmful algal blooms (HABs) are the excessive and rapid reproduction of phytoplankton stimulated by excessive nutrients presence in the sea, which occurs either by natural processes such as circulation, upwelling relaxation, and river flow or through anthropogenic loadings leading to eutrophication. Harmful phytoplankton outbreaks are characterized by a broad range of phenomena that produce toxic and high biomass outbreaks along many coastal localities of the Adriatic Sea. These events include not only public safety concerns associated with protecting human health, but also contribute to the disruption of marine ecosystems, creating economic losses attributed to reduced economic activities linked to the exploitation of marine resources, such as tourism, fishing and aquaculture industries, and costs required to maintain public advisory services and monitoring programs for shellfish toxins, water quality, and plankton composition. In the Adriatic Sea, particularly in the north-western part under the influence of the river Po, toxic and non-toxic blooms often appear as dense patches along the coast. The reduction of nutrient discharges from the major Adriatic rivers would decrease the chances of their appearance. This can be accomplished by targeting non-point sources of nutrient pollution in the river basins. The results of the study “Modelling Cost-efficient Reductions of Nutrient Loads to the Baltic Sea”
14 were used to make an assessment of the costs associated with the
reduction of nitrogen loads discharged by the rivers and originating from non-point sources. Taking into account the costs of various measures per unit, the reduction cost of aggregate nitrogen loads was shown to be 2.4 € per kg of nitrogen. This value was used to indicate the costs for reducing anthropogenic nitrogen loads carried by the major rivers in the Adriatic Sea. However; targeted studies should be made to obtain more accurate estimates on the overall anthropogenic nitrogen loads and identify proper management measures.
Table 10 Indication of the overall costs for reducing nitrogen loads discharged by rivers and originating from non-point sources
River Nitrogen load t/year Cost (106€)
Po 163,042 15
391.3
Drin 48,913 16
117.3
13
"Ballast Water Issues for Croatia," (Det Norske Veritas and Fridtjof Nansen Institute, 2005).
14 J.S. Schou et al., "Modelling Cost-Efficient Reductions of Nutrient Loads to the Baltic Sea. Model Specification,
Data and Cost Functions. ," (Denmark: National Environmental Research Institute, 2006).
15 L. Palmeri et al., "Modelling Nutrient Emissions from River Systems and Loads to the Coastal Zone: Po River
Case Study, Italy," Ecological Modelling 184, no. 1 (2005).
16 Estimated by authors
24
River Nitrogen load t/year Cost (106€)
Neretva 4,612 17
11.0
4.4. Regional issue: Solid waste management
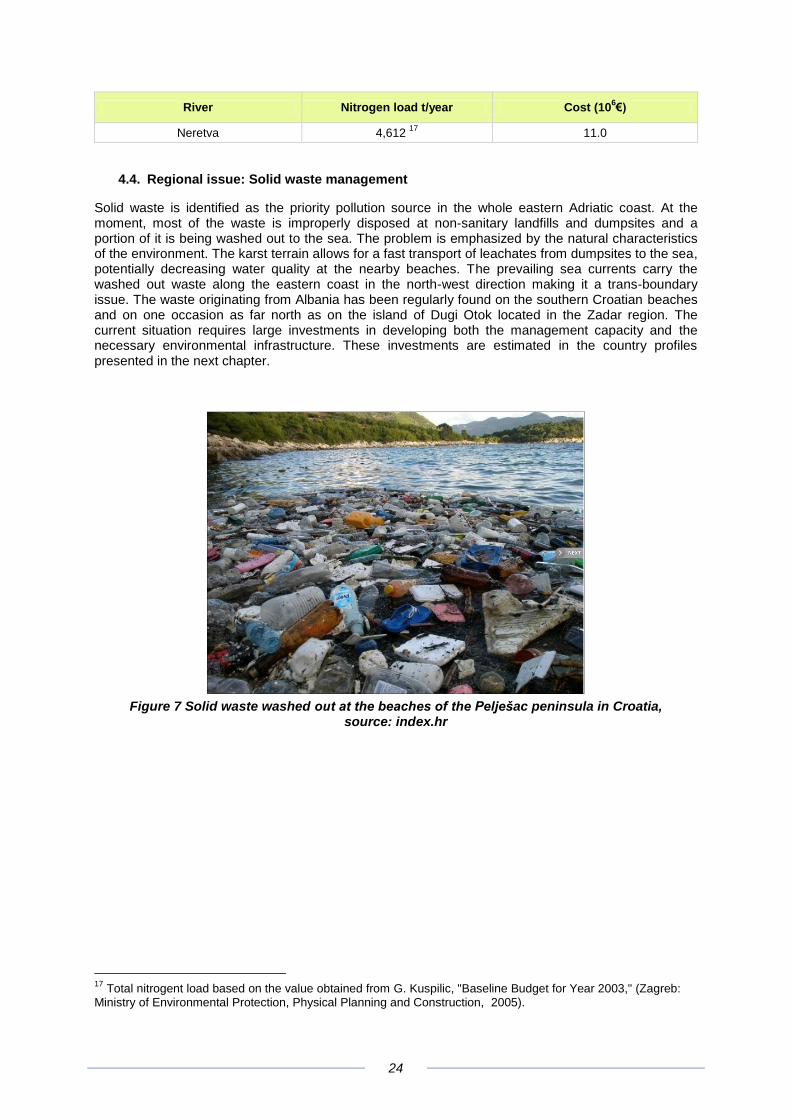
Solid waste is identified as the priority pollution source in the whole eastern Adriatic coast. At the moment, most of the waste is improperly disposed at non-sanitary landfills and dumpsites and a portion of it is being washed out to the sea. The problem is emphasized by the natural characteristics of the environment. The karst terrain allows for a fast transport of leachates from dumpsites to the sea, potentially decreasing water quality at the nearby beaches. The prevailing sea currents carry the washed out waste along the eastern coast in the north-west direction making it a trans-boundary issue. The waste originating from Albania has been regularly found on the southern Croatian beaches and on one occasion as far north as on the island of Dugi Otok located in the Zadar region. The current situation requires large investments in developing both the management capacity and the necessary environmental infrastructure. These investments are estimated in the country profiles presented in the next chapter.
Figure 7 Solid waste washed out at the beaches of the Pelješac peninsula in Croatia,
source: index.hr
17
Total nitrogent load based on the value obtained from G. Kuspilic, "Baseline Budget for Year 2003," (Zagreb: Ministry of Environmental Protection, Physical Planning and Construction, 2005).
25
Chapter 5 Pollution Hotspot Sites
The following chapter presents summarised information on the main pollution sources in the assessed countries, indicates where and why, in terms of potential impacts, is the priority of reducing pollution loads, and estimates the investments needed to reach the desirable environmental state at both priority and other pollution hotspot sites. A detailed description of each pollution hotspot site is given in the Annex IV.
5.1. Republic of Albania
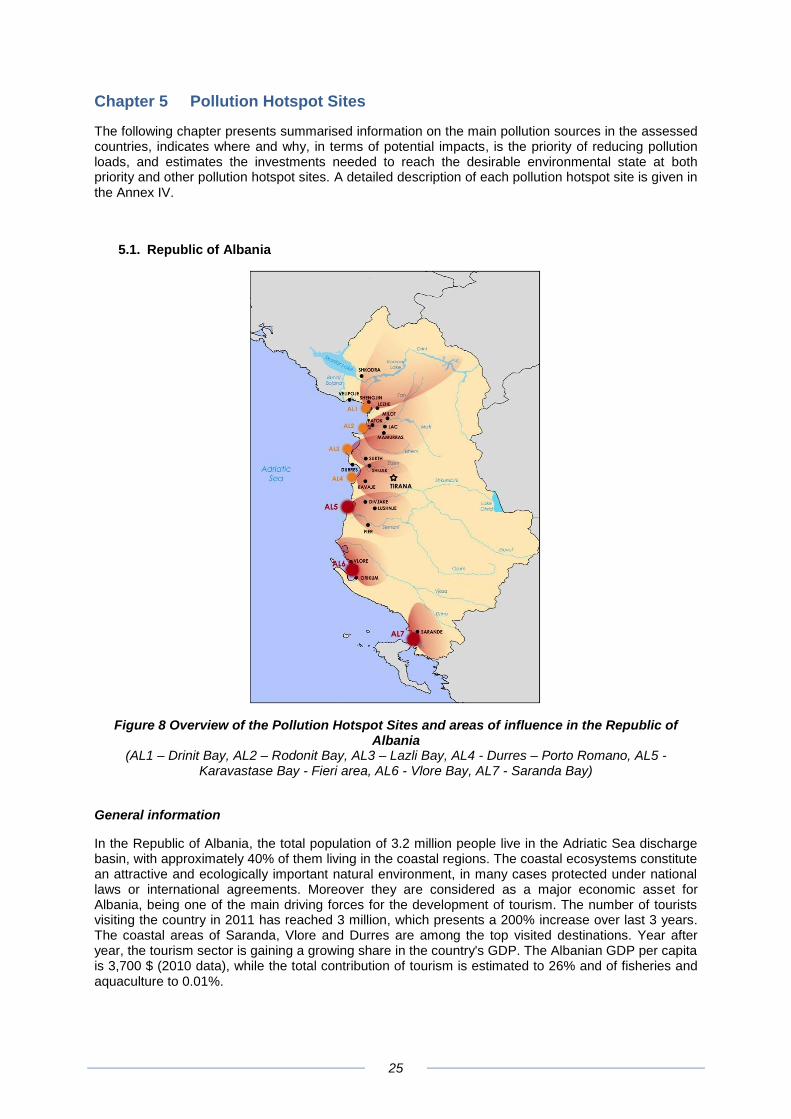
Figure 8 Overview of the Pollution Hotspot Sites and areas of influence in the Republic of Albania
(AL1 – Drinit Bay, AL2 – Rodonit Bay, AL3 – Lazli Bay, AL4 - Durres – Porto Romano, AL5 - Karavastase Bay - Fieri area, AL6 - Vlore Bay, AL7 - Saranda Bay)
General information
In the Republic of Albania, the total population of 3.2 million people live in the Adriatic Sea discharge basin, with approximately 40% of them living in the coastal regions. The coastal ecosystems constitute an attractive and ecologically important natural environment, in many cases protected under national laws or international agreements. Moreover they are considered as a major economic asset for Albania, being one of the main driving forces for the development of tourism. The number of tourists visiting the country in 2011 has reached 3 million, which presents a 200% increase over last 3 years. The coastal areas of Saranda, Vlore and Durres are among the top visited destinations. Year after year, the tourism sector is gaining a growing share in the country's GDP. The Albanian GDP per capita is 3,700 $ (2010 data), while the total contribution of tourism is estimated to 26% and of fisheries and aquaculture to 0.01%.
26
Main identified pollution sources
The priority pollution source in Albania is solid waste. There are no sanitary landfills at the coast and the waste is being disposed in dumpsites close to rivers and streams or near the sea. Eventually, much of this waste is washed into the Adriatic, polluting beaches and the marine environment. This problem is of regional importance, since the prevailing sea currents in the Adriatic carry away the waste towards the coasts of Croatia and Montenegro. In most of the cases untreated wastewaters are discharged directly into the sea or in the water bodies connected to the sea. As a result, bacteriological pollution in the coastal waters is high and represents health risks for the population and tourists.
Table 11 Characterization of pollution sources in Albania
Pollution Source Impact characterization Observed trend
Municipal Wastewater +++
Solid Waste +++
Non-point source pollution +
Historically polluted sites ++
(Legend: +++ high impact, ++ medium impact, + low impact)
Priority pollution hotspot sites
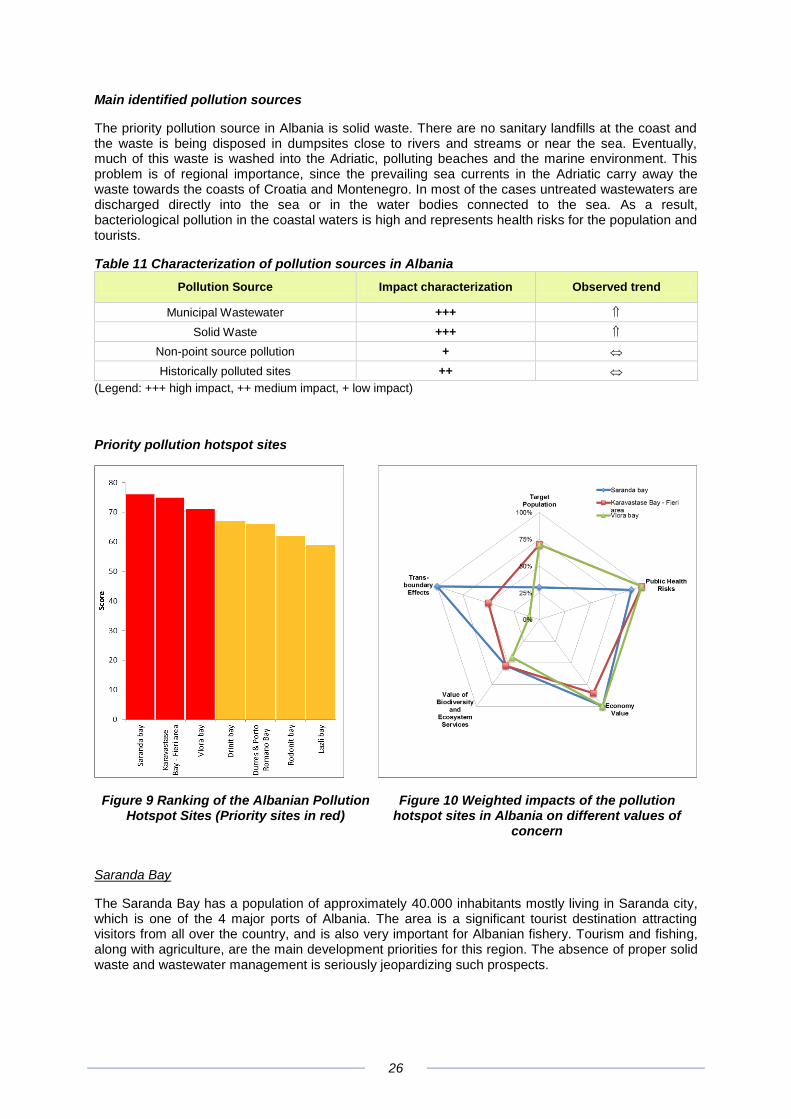
Figure 9 Ranking of the Albanian Pollution Hotspot Sites (Priority sites in red)
Figure 10 Weighted impacts of the pollution hotspot sites in Albania on different values of
concern
Saranda Bay
The Saranda Bay has a population of approximately 40.000 inhabitants mostly living in Saranda city, which is one of the 4 major ports of Albania. The area is a significant tourist destination attracting visitors from all over the country, and is also very important for Albanian fishery. Tourism and fishing, along with agriculture, are the main development priorities for this region. The absence of proper solid waste and wastewater management is seriously jeopardizing such prospects.
27
Karavastase Bay - Fieri area
The Karavastase Bay – Fieri area has a population of approximately 150.000 inhabitants living in 3 major cities: Divjake, Lushnja and Fieri. The area is a popular tourist resort attracting visitors from all over the country, while the lagoon’s fishery is very important. Untreated wastewater is discharged to rivers and channels while solid waste is dumped along roads. Industrial sources of pollution include the Patos-Marinza oil field, the biggest on-shore oil field in Europe, a former Nitrate Fertilizer plant in Fier, identified by UNEP as one of the main environmental hotspots in Albania and the former Metallurgical Complex of Elbasan. The activities for environmental remediation of the Patos Marinza oil field have been initiated in 2009 while no actions have been taken on the other sites.
Vlore Bay
The Vlore Bay has a population of approximately 100.000 inhabitants. Tourism and fishing, along with agriculture are the main development priorities for this region. The volume of the wastewater, increased due to the high urban development rate, is too high for the sewerage network capacity. The existing wastewater treatment plant is not fully operational because of the insufficient rate of connection to the secondary and tertiary sewerage network. No significant progress is made in the field of solid waste management. Municipal solid waste from Vlora city is disposed at a dumpsite. This situation presents health risks for the local population, while threatening biodiversity, tourism development, and fisheries.
Estimated investments
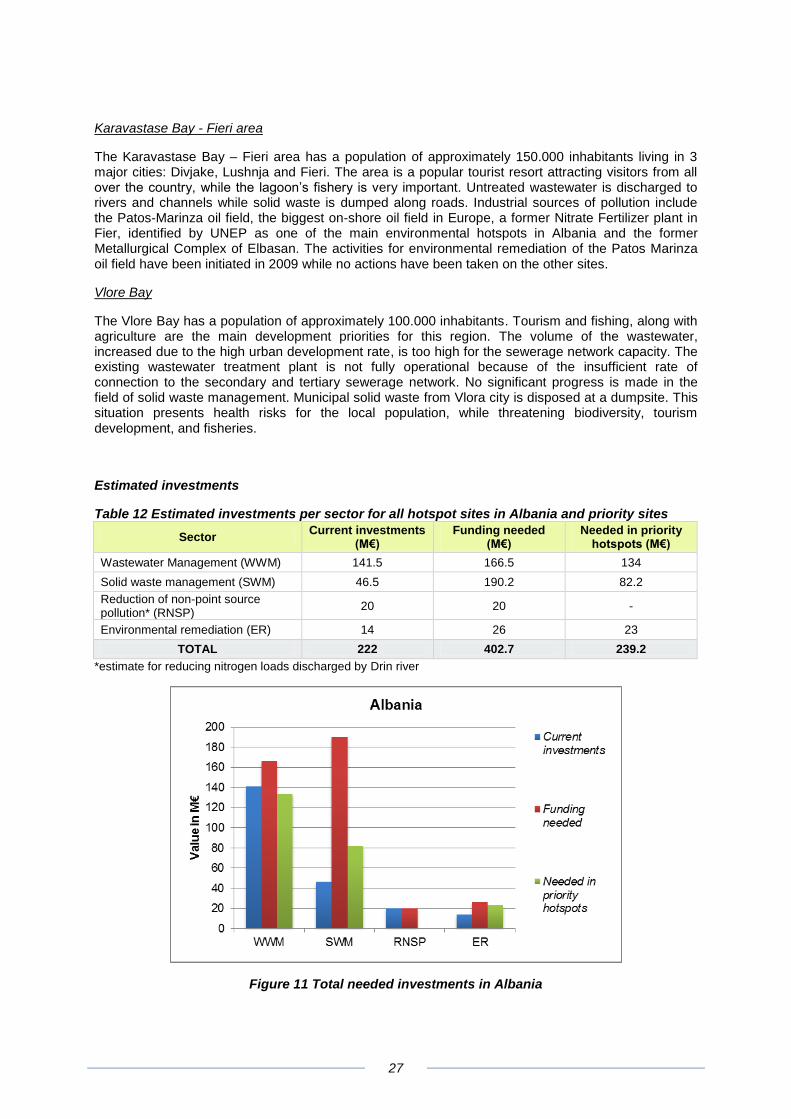
Table 12 Estimated investments per sector for all hotspot sites in Albania and priority sites
Sector Current investments
(M€) Funding needed
(M€) Needed in priority
hotspots (M€)
Wastewater Management (WWM) 141.5 166.5 134
Solid waste management (SWM) 46.5 190.2 82.2
Reduction of non-point source pollution* (RNSP)
20 20 -
Environmental remediation (ER) 14 26 23
TOTAL 222 402.7 239.2
*estimate for reducing nitrogen loads discharged by Drin river
Figure 11 Total needed investments in Albania
28
5.2. Montenegro
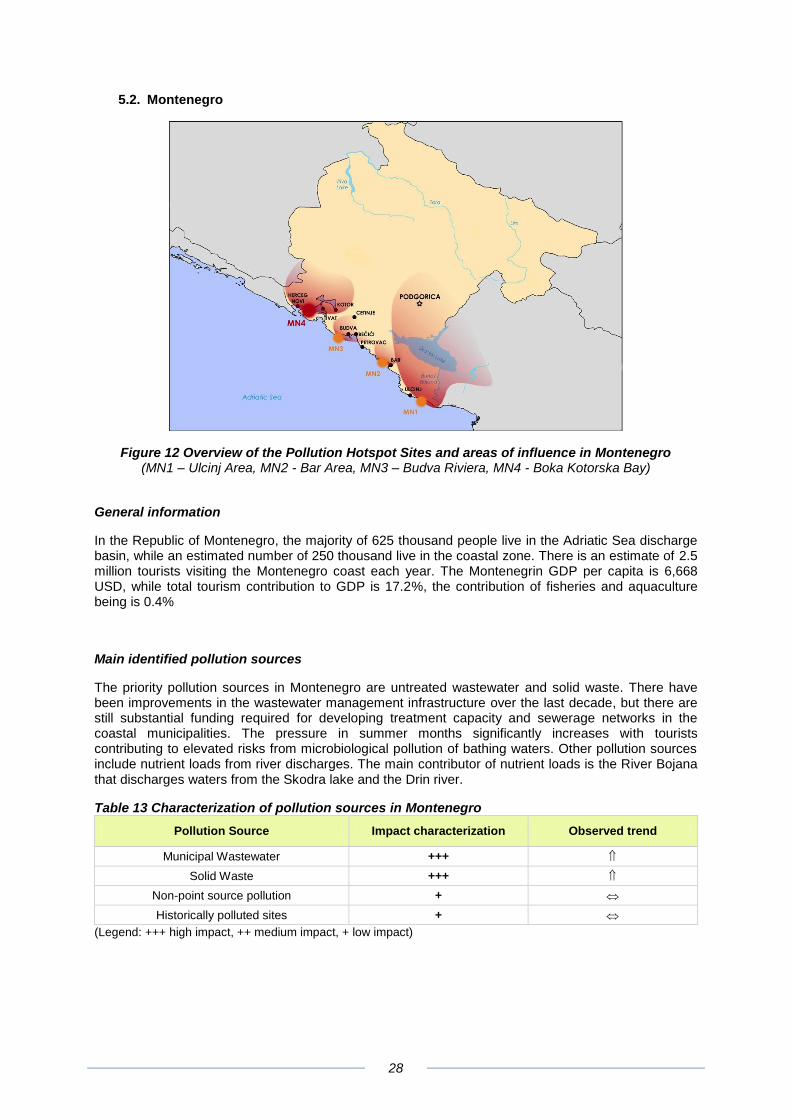
Figure 12 Overview of the Pollution Hotspot Sites and areas of influence in Montenegro (MN1 – Ulcinj Area, MN2 - Bar Area, MN3 – Budva Riviera, MN4 - Boka Kotorska Bay)
General information
In the Republic of Montenegro, the majority of 625 thousand people live in the Adriatic Sea discharge basin, while an estimated number of 250 thousand live in the coastal zone. There is an estimate of 2.5 million tourists visiting the Montenegro coast each year. The Montenegrin GDP per capita is 6,668 USD, while total tourism contribution to GDP is 17.2%, the contribution of fisheries and aquaculture being is 0.4%
Main identified pollution sources
The priority pollution sources in Montenegro are untreated wastewater and solid waste. There have been improvements in the wastewater management infrastructure over the last decade, but there are still substantial funding required for developing treatment capacity and sewerage networks in the coastal municipalities. The pressure in summer months significantly increases with tourists contributing to elevated risks from microbiological pollution of bathing waters. Other pollution sources include nutrient loads from river discharges. The main contributor of nutrient loads is the River Bojana that discharges waters from the Skodra lake and the Drin river.
Table 13 Characterization of pollution sources in Montenegro
Pollution Source Impact characterization Observed trend
Municipal Wastewater +++
Solid Waste +++
Non-point source pollution +
Historically polluted sites +
(Legend: +++ high impact, ++ medium impact, + low impact)
29
Priority pollution hotspot sites
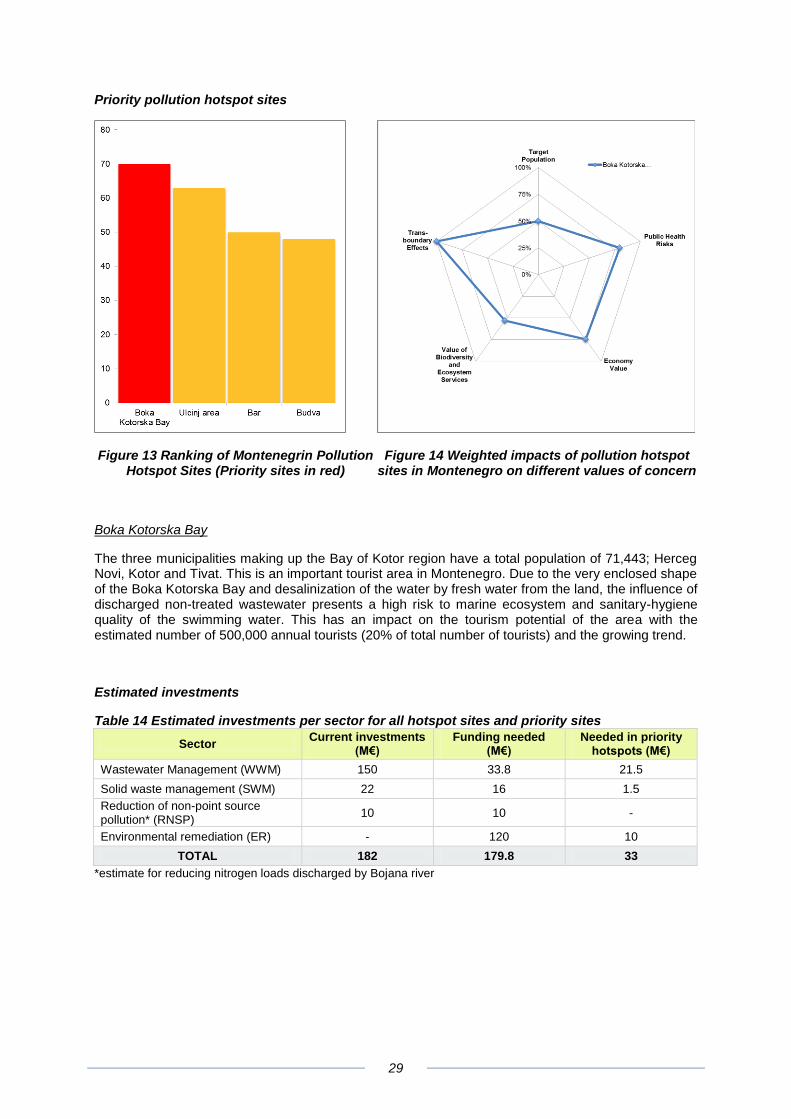
Figure 13 Ranking of Montenegrin Pollution Hotspot Sites (Priority sites in red)
Figure 14 Weighted impacts of pollution hotspot sites in Montenegro on different values of concern
Boka Kotorska Bay
The three municipalities making up the Bay of Kotor region have a total population of 71,443; Herceg Novi, Kotor and Tivat. This is an important tourist area in Montenegro. Due to the very enclosed shape of the Boka Kotorska Bay and desalinization of the water by fresh water from the land, the influence of discharged non-treated wastewater presents a high risk to marine ecosystem and sanitary-hygiene quality of the swimming water. This has an impact on the tourism potential of the area with the estimated number of 500,000 annual tourists (20% of total number of tourists) and the growing trend.
Estimated investments
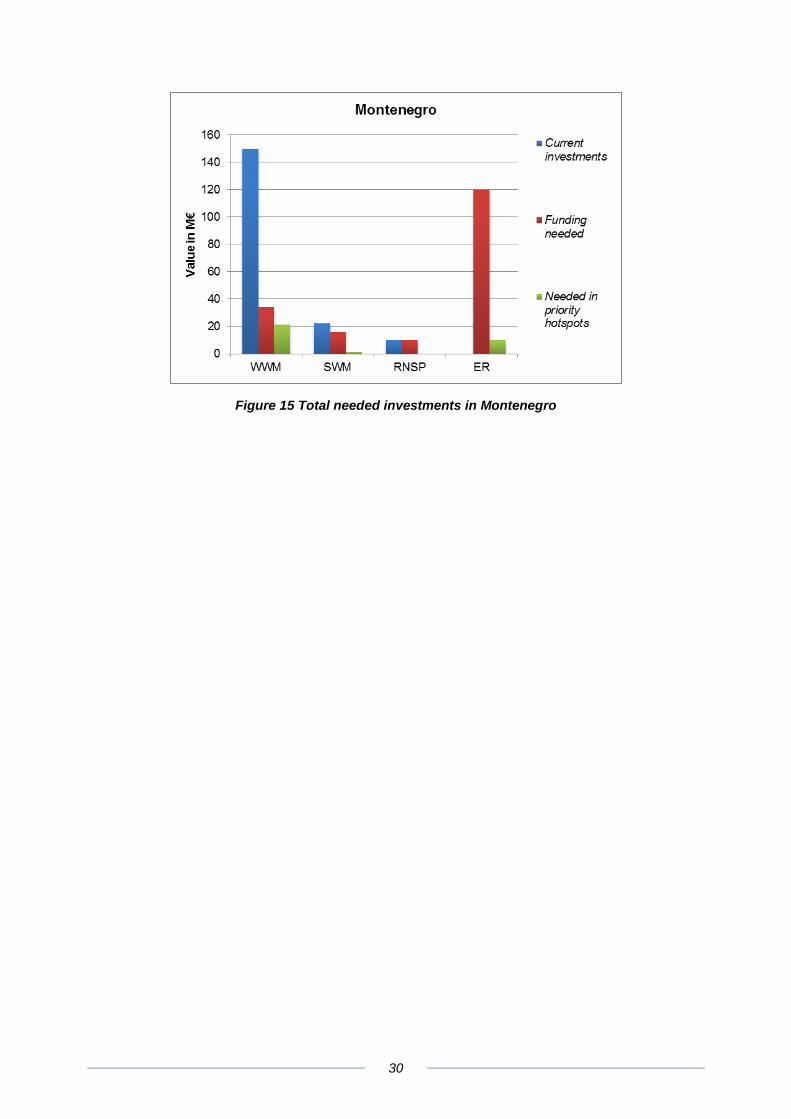
Table 14 Estimated investments per sector for all hotspot sites and priority sites
Sector Current investments
(M€) Funding needed
(M€) Needed in priority
hotspots (M€)
Wastewater Management (WWM) 150 33.8 21.5
Solid waste management (SWM) 22 16 1.5
Reduction of non-point source pollution* (RNSP)
10 10 -
Environmental remediation (ER) - 120 10
TOTAL 182 179.8 33
*estimate for reducing nitrogen loads discharged by Bojana river
30
Figure 15 Total needed investments in Montenegro
31
5.3. Republic of Croatia
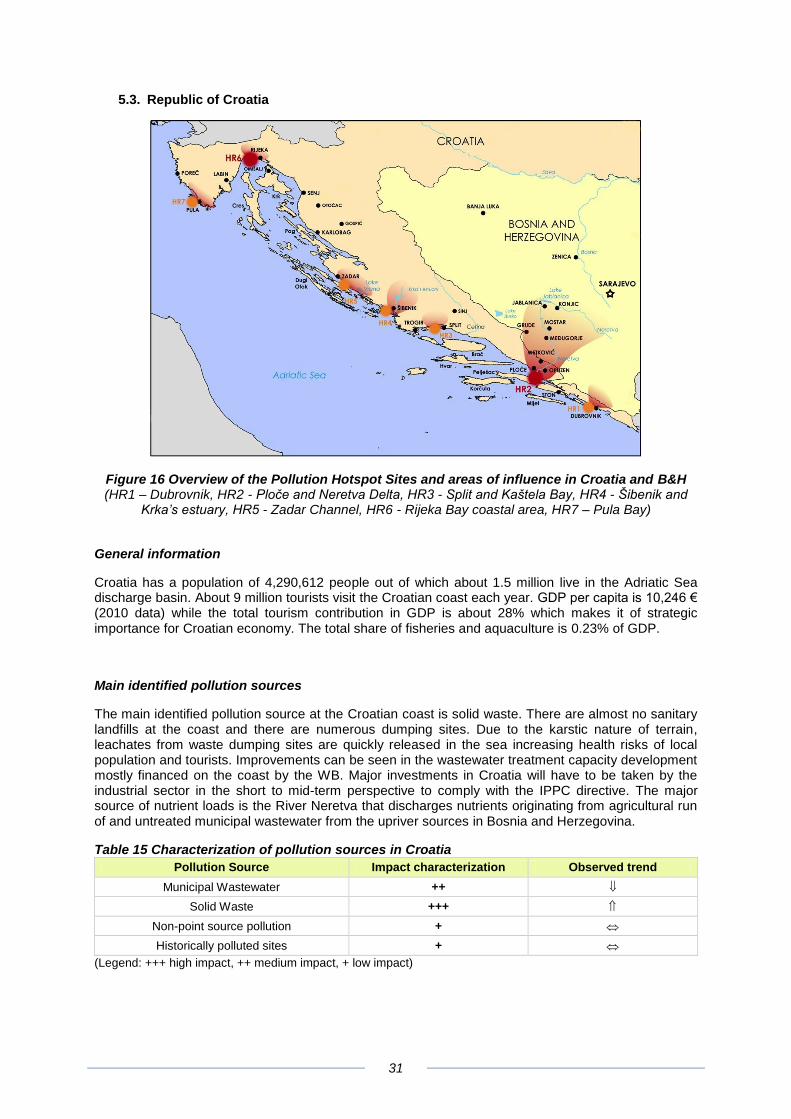
Figure 16 Overview of the Pollution Hotspot Sites and areas of influence in Croatia and B&H (HR1 – Dubrovnik, HR2 - Ploče and Neretva Delta, HR3 - Split and Kaštela Bay, HR4 - Šibenik and
Krka’s estuary, HR5 - Zadar Channel, HR6 - Rijeka Bay coastal area, HR7 – Pula Bay)
General information
Croatia has a population of 4,290,612 people out of which about 1.5 million live in the Adriatic Sea discharge basin. About 9 million tourists visit the Croatian coast each year. GDP per capita is 10,246 € (2010 data) while the total tourism contribution in GDP is about 28% which makes it of strategic importance for Croatian economy. The total share of fisheries and aquaculture is 0.23% of GDP.
Main identified pollution sources
The main identified pollution source at the Croatian coast is solid waste. There are almost no sanitary landfills at the coast and there are numerous dumping sites. Due to the karstic nature of terrain, leachates from waste dumping sites are quickly released in the sea increasing health risks of local population and tourists. Improvements can be seen in the wastewater treatment capacity development mostly financed on the coast by the WB. Major investments in Croatia will have to be taken by the industrial sector in the short to mid-term perspective to comply with the IPPC directive. The major source of nutrient loads is the River Neretva that discharges nutrients originating from agricultural run of and untreated municipal wastewater from the upriver sources in Bosnia and Herzegovina.
Table 15 Characterization of pollution sources in Croatia
Pollution Source Impact characterization Observed trend
Municipal Wastewater ++
Solid Waste +++
Non-point source pollution +
Historically polluted sites +
(Legend: +++ high impact, ++ medium impact, + low impact)
32
Priority pollution hotspot sites
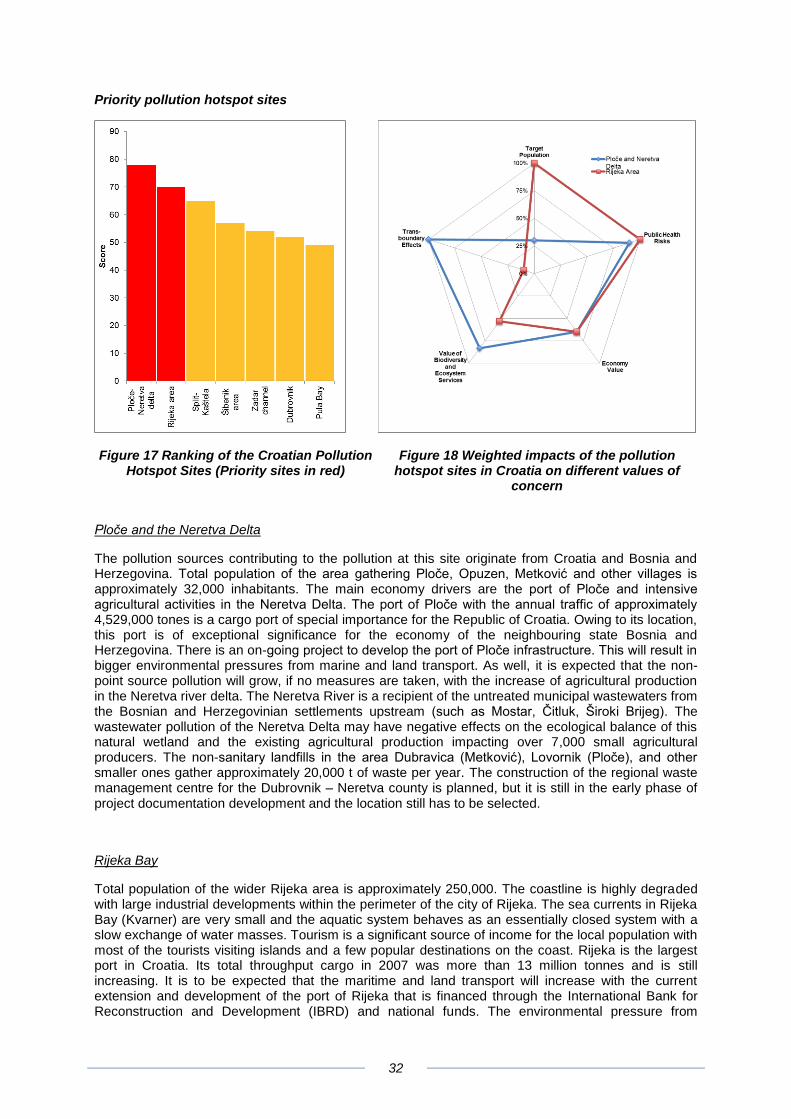
Figure 17 Ranking of the Croatian Pollution Hotspot Sites (Priority sites in red)
Figure 18 Weighted impacts of the pollution hotspot sites in Croatia on different values of
concern
Ploče and the Neretva Delta
The pollution sources contributing to the pollution at this site originate from Croatia and Bosnia and Herzegovina. Total population of the area gathering Ploče, Opuzen, Metković and other villages is approximately 32,000 inhabitants. The main economy drivers are the port of Ploče and intensive agricultural activities in the Neretva Delta. The port of Ploče with the annual traffic of approximately 4,529,000 tones is a cargo port of special importance for the Republic of Croatia. Owing to its location, this port is of exceptional significance for the economy of the neighbouring state Bosnia and Herzegovina. There is an on-going project to develop the port of Ploče infrastructure. This will result in bigger environmental pressures from marine and land transport. As well, it is expected that the non-point source pollution will grow, if no measures are taken, with the increase of agricultural production in the Neretva river delta. The Neretva River is a recipient of the untreated municipal wastewaters from the Bosnian and Herzegovinian settlements upstream (such as Mostar, Čitluk, Široki Brijeg). The wastewater pollution of the Neretva Delta may have negative effects on the ecological balance of this natural wetland and the existing agricultural production impacting over 7,000 small agricultural producers. The non-sanitary landfills in the area Dubravica (Metković), Lovornik (Ploče), and other smaller ones gather approximately 20,000 t of waste per year. The construction of the regional waste management centre for the Dubrovnik – Neretva county is planned, but it is still in the early phase of project documentation development and the location still has to be selected.
Rijeka Bay
Total population of the wider Rijeka area is approximately 250,000. The coastline is highly degraded with large industrial developments within the perimeter of the city of Rijeka. The sea currents in Rijeka Bay (Kvarner) are very small and the aquatic system behaves as an essentially closed system with a slow exchange of water masses. Tourism is a significant source of income for the local population with most of the tourists visiting islands and a few popular destinations on the coast. Rijeka is the largest port in Croatia. Its total throughput cargo in 2007 was more than 13 million tonnes and is still increasing. It is to be expected that the maritime and land transport will increase with the current extension and development of the port of Rijeka that is financed through the International Bank for Reconstruction and Development (IBRD) and national funds. The environmental pressure from
33
untreated wastewaters released in the sea will decrease with the on-going and planned wastewater infrastructure developments financed through the Coastal Cities Pollution Project (currently in 2nd phase). The municipal waste is disposed at the non-sanitary landfill Viševac (65,000 t/y) and a few other smaller non-sanitary landfills in the vicinity. About 250,000 t of hazardous solid and liquid waste disposed at the Sovjak dump present a great risk of groundwater and sea contamination. The possible contamination of the groundwater in Sovjak drainage basin would have a negative impact on the present and future water supply of the northern Croatian littoral area and the northern Adriatic Islands.
Estimated investments
Table 16 Estimated investments per sector for all hotspot sites and priority sites
Sector Current investments
(M€) Funding needed
(M€) Needed in priority
hotspots (M€)
Wastewater Management (WWM) 124 31 5
Solid waste management (SWM) 225 168 34
Reduction of non-point source pollution** (RNSP)
15 11 11
Environmental remediation (ER) 25 16 8
TOTAL 389 226 58
** Estimate for the Neretva River nitrogen reduction measures
Figure 19 Total needed investments in Croatia
0
50
100
150
200
250
WWM SWM RNSP ER
Va
lue
in
M€
Croatia
Currentinvestments
Fundingneeded
Needed inpriorityhotspots
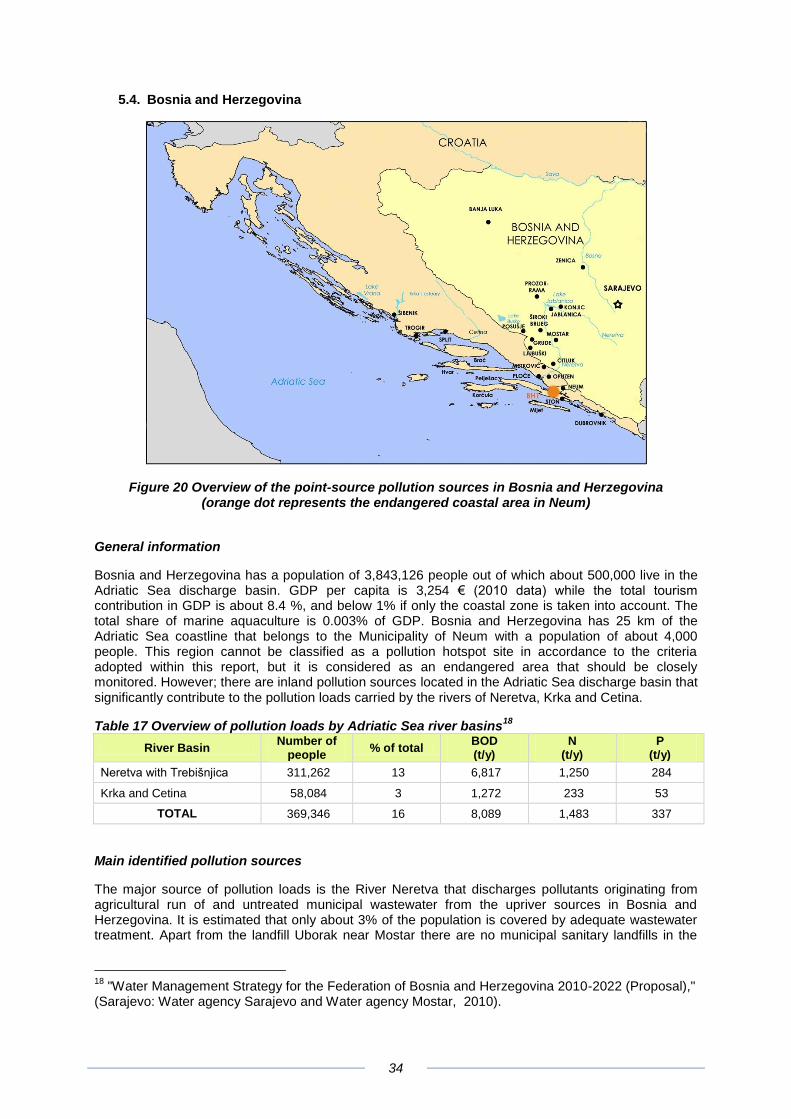
34
5.4. Bosnia and Herzegovina
Figure 20 Overview of the point-source pollution sources in Bosnia and Herzegovina (orange dot represents the endangered coastal area in Neum)
General information
Bosnia and Herzegovina has a population of 3,843,126 people out of which about 500,000 live in the Adriatic Sea discharge basin. GDP per capita is 3,254 € (2010 data) while the total tourism contribution in GDP is about 8.4 %, and below 1% if only the coastal zone is taken into account. The total share of marine aquaculture is 0.003% of GDP. Bosnia and Herzegovina has 25 km of the Adriatic Sea coastline that belongs to the Municipality of Neum with a population of about 4,000 people. This region cannot be classified as a pollution hotspot site in accordance to the criteria adopted within this report, but it is considered as an endangered area that should be closely monitored. However; there are inland pollution sources located in the Adriatic Sea discharge basin that significantly contribute to the pollution loads carried by the rivers of Neretva, Krka and Cetina.
Table 17 Overview of pollution loads by Adriatic Sea river basins18
River Basin Number of
people % of total
BOD (t/y)
N (t/y)
P (t/y)
Neretva with Trebišnjica 311,262 13 6,817 1,250 284
Krka and Cetina 58,084 3 1,272 233 53
TOTAL 369,346 16 8,089 1,483 337
Main identified pollution sources
The major source of pollution loads is the River Neretva that discharges pollutants originating from agricultural run of and untreated municipal wastewater from the upriver sources in Bosnia and Herzegovina. It is estimated that only about 3% of the population is covered by adequate wastewater treatment. Apart from the landfill Uborak near Mostar there are no municipal sanitary landfills in the
18
"Water Management Strategy for the Federation of Bosnia and Herzegovina 2010-2022 (Proposal)," (Sarajevo: Water agency Sarajevo and Water agency Mostar, 2010).
35
Adriatic Sea discharge basin. The old coal-pit Vihovići located above Mostar presents a risk of heavy metal pollution of the River Neretva and it will have to be remediated in the perspective.
Table 18 Overview of the existing wastewater treatment in the Adriatic Sea discharge basin19
WWTP Capacity (PE) Treatment type Operational
Ljubuški 5,000 Secondary Yes
Neum 30,000 Primary Yes
Čitluk 7,000 Secondary Yes
Grude 2,500 Secondary With difficulties
B. Grahovo 1,650 Primary No
Široki Brijeg 5,000 Secondary No
Table 19 Characterization of pollution sources in Bosnia and Herzegovina
Pollution Source Impact characterization Observed trend
Municipal Wastewater +++
Solid Waste ++
Non-point source pollution +
Historically polluted sites +
(Legend: +++ high impact, ++ medium impact, + low impact)
Priority pollution hotspot sites
While there are no identified pollution hotspot sites at the Adriatic Sea coastal zone of Bosnia and Herzegovina, there are major municipal point-source pollution sources located within the Adriatic Sea discharge basin.
Table 20 Overview of the larger municipal wastewater treatment pollution sources
Municipality Wastewater treatment status
Mostar Partially resolved
Konjic Partially resolved
Široki Brijeg WWTP under rehabilitation
Jablanica Partially resolved
Međugorje Unresolved
Posušje Unresolved
Čapljina Unresolved
Rama-Prozor Unresolved
19
Ibid.
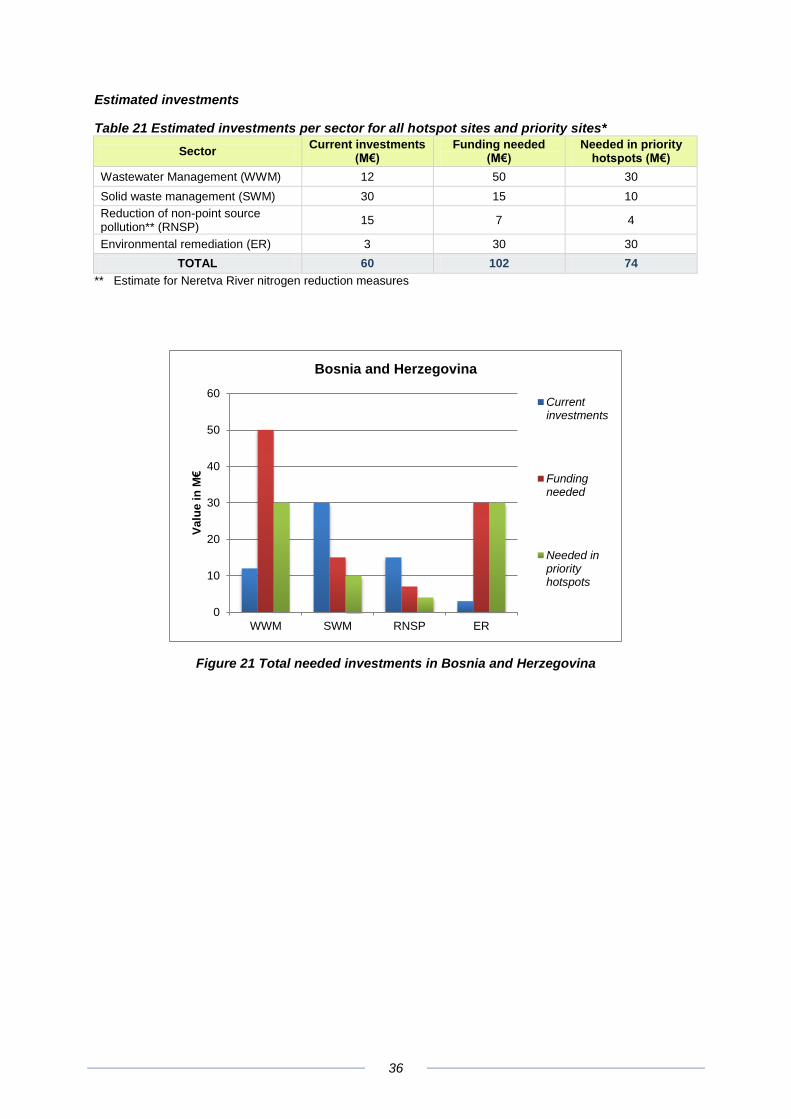
36
Estimated investments
Table 21 Estimated investments per sector for all hotspot sites and priority sites*
Sector Current investments
(M€) Funding needed
(M€) Needed in priority
hotspots (M€)
Wastewater Management (WWM) 12 50 30
Solid waste management (SWM) 30 15 10
Reduction of non-point source pollution** (RNSP)
15 7 4
Environmental remediation (ER) 3 30 30
TOTAL 60 102 74
** Estimate for Neretva River nitrogen reduction measures
Figure 21 Total needed investments in Bosnia and Herzegovina
0
10
20
30
40
50
60
WWM SWM RNSP ER
Va
lue
in
M€
Bosnia and Herzegovina
Currentinvestments
Fundingneeded
Needed inpriorityhotspots
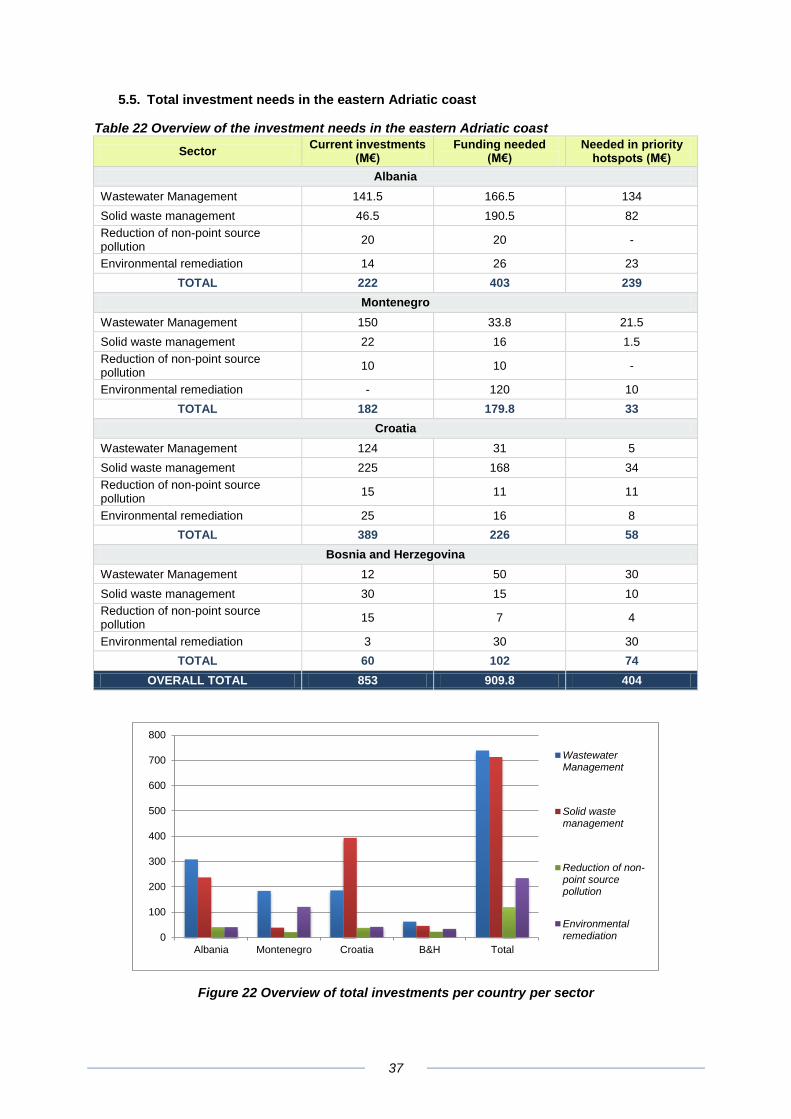
37
5.5. Total investment needs in the eastern Adriatic coast
Table 22 Overview of the investment needs in the eastern Adriatic coast
Sector Current investments
(M€) Funding needed
(M€) Needed in priority
hotspots (M€)
Albania
Wastewater Management 141.5 166.5 134
Solid waste management 46.5 190.5 82
Reduction of non-point source pollution
20 20 -
Environmental remediation 14 26 23
TOTAL 222 403 239
Montenegro
Wastewater Management 150 33.8 21.5
Solid waste management 22 16 1.5
Reduction of non-point source pollution
10 10 -
Environmental remediation - 120 10
TOTAL 182 179.8 33
Croatia
Wastewater Management 124 31 5
Solid waste management 225 168 34
Reduction of non-point source pollution
15 11 11
Environmental remediation 25 16 8
TOTAL 389 226 58
Bosnia and Herzegovina
Wastewater Management 12 50 30
Solid waste management 30 15 10
Reduction of non-point source pollution
15 7 4
Environmental remediation 3 30 30
TOTAL 60 102 74
OVERALL TOTAL 853 909.8 404
Figure 22 Overview of total investments per country per sector
0
100
200
300
400
500
600
700
800
Albania Montenegro Croatia B&H Total
WastewaterManagement
Solid wastemanagement
Reduction of non-point sourcepollution
Environmentalremediation
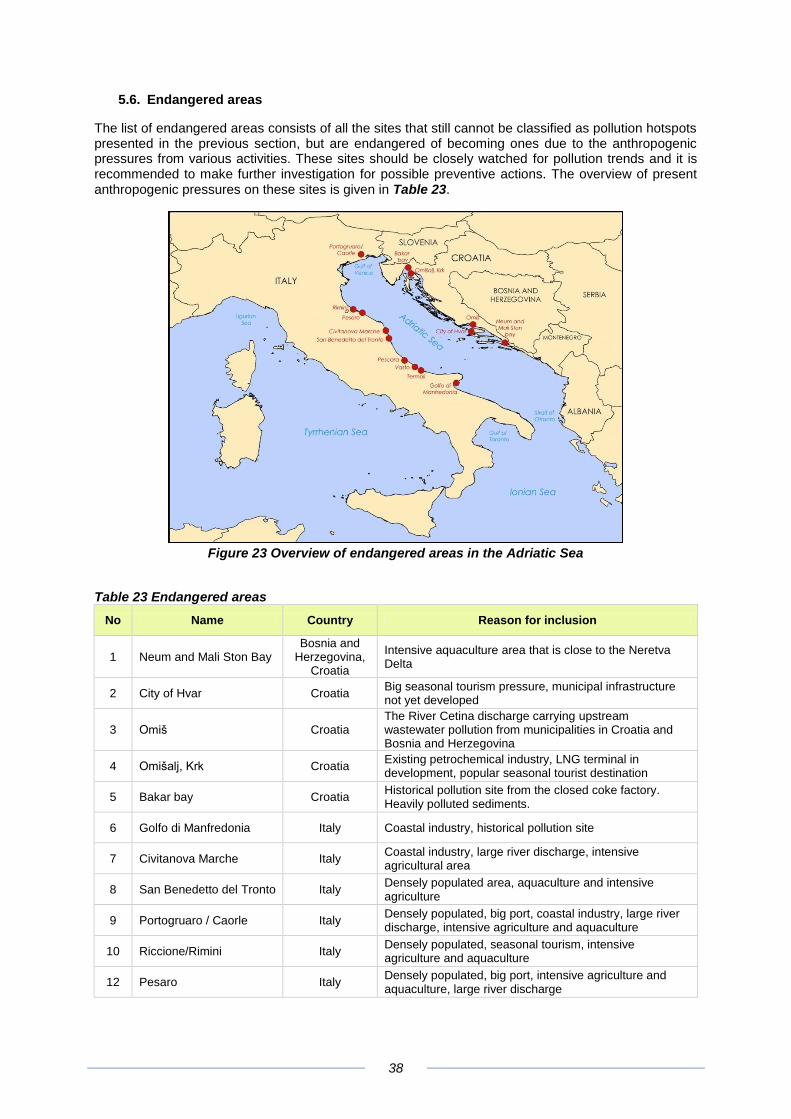
38
5.6. Endangered areas
The list of endangered areas consists of all the sites that still cannot be classified as pollution hotspots presented in the previous section, but are endangered of becoming ones due to the anthropogenic pressures from various activities. These sites should be closely watched for pollution trends and it is recommended to make further investigation for possible preventive actions. The overview of present anthropogenic pressures on these sites is given in Table 23.
Figure 23 Overview of endangered areas in the Adriatic Sea
Table 23 Endangered areas
No Name Country Reason for inclusion
1 Neum and Mali Ston Bay Bosnia and
Herzegovina, Croatia
Intensive aquaculture area that is close to the Neretva Delta
2 City of Hvar Croatia Big seasonal tourism pressure, municipal infrastructure not yet developed
3 Omiš Croatia The River Cetina discharge carrying upstream wastewater pollution from municipalities in Croatia and Bosnia and Herzegovina
4 Omišalj, Krk Croatia Existing petrochemical industry, LNG terminal in development, popular seasonal tourist destination
5 Bakar bay Croatia Historical pollution site from the closed coke factory. Heavily polluted sediments.
6 Golfo di Manfredonia Italy Coastal industry, historical pollution site
7 Civitanova Marche Italy Coastal industry, large river discharge, intensive agricultural area
8 San Benedetto del Tronto Italy Densely populated area, aquaculture and intensive agriculture
9 Portogruaro / Caorle Italy Densely populated, big port, coastal industry, large river discharge, intensive agriculture and aquaculture
10 Riccione/Rimini Italy Densely populated, seasonal tourism, intensive agriculture and aquaculture
12 Pesaro Italy Densely populated, big port, intensive agriculture and aquaculture, large river discharge

39
No Name Country Reason for inclusion
13 Pescara Italy Densely populated, coastal industry, big port, intensive agriculture and aquaculture
14 Termoli Italy Solid waste problems, intensive agriculture and aquaculture, large river discharge
15 Vasto Italy Mining site, large river discharge, intensive agriculture
40
Chapter 6 Conclusions and Recommendations
1. In the previous initiatives, some countries in the region identified as a pollution hotspot site both the recipient areas and point-source pollution sites, which sometimes created a misunderstanding. We recommend defining a pollution hotspot site as a coastal zone that receives pollution, while actual pollution sources might be located at various distances from the site.
2. The list of endangered areas consists of all the sites that still cannot be classified as pollution hotspots, but are endangered of becoming ones due to the anthropogenic pressures from various activities. These potential pollution hotspots sites should be closely watched for pollution trends. It is recommended to make further investigation for possible preventive actions.
3. Although there is a large set of environmental data available for the Adriatic Sea, the main difficulty, as in the majority of similar studies, is a lack of continuous environmental monitoring data with the sufficient spatial and temporal resolution that would allow for uniform assessment of the whole Adriatic Sea basin. It is recommended to facilitate the creation of joint environmental monitoring initiatives and a regional platform for exchanging data.
4. The study considered 41 potential pollution hotspot sites and confirmed the existence of 27 hotspot pollution sites in the Adriatic Sea, out of which 6 at the eastern coast were identified as priority sites that require immediate actions to be taken in order to reach the desirable environmental conditions.
5. Environmental pollution at the hotspot sites puts at risk current activities and potential development of these areas. Tourism activities are significant source of revenues estimated to over 14 billion € annually for the eastern Adriatic Sea countries and, as the main export industry, strategic for their economies.
6. Total investments required to reach the desirable environmental conditions in the eastern Adriatic region are estimated to 1.6 billion €, out of which 793 million € are already being implemented or are underway and 808 million € is the remaining funding gap. The remaining funding gap at the priority hotspot sites is estimated to 355 million €. The desirable conditions are defined by compliance with existing EU environmental regulation and standards taking into account that all of the countries are in the process of joining the EU either as potential candidates or as candidate countries.
7. Reaching the desirable environmental conditions at the pollution hotspot sites asks for measures both to improve the existing coastal management capacity and to develop the necessary environmental infrastructure. There are plenty of available tools that can be put to use in the management of coastal zones such as Integrated Coastal Zone Management, Integrated River Basin Management and Maritime Spatial Planning. However, in order to properly apply these tools, there is a need to strengthen institutional capacity on the national and local level.
8. There are inter-regional problems that can be resolved only by joint regional efforts, such as: pollution from maritime transport, including management of ballast waters, and eutrophication processes caused by excess nutrients discharged by rivers. However; instead of creating additional institutional layers, it is recommended to use the existing institutional structures, such as MedPartnership and the Adriatic Ionian Initiative, to foster the adoption and steer the implementation of necessary regional measures.
9. To mobilise the investments in the environmental sector, it is recommended as a first step to prepare economic and institutional sectorial analysis that would identify the most cost-effective and sustainable approach for reaching desirable environmental conditions in terms of the infrastructure development, necessary regulatory reforms and the optimal institutional set up.
10. To be sustainable, the infrastructure development has to run in parallel with the capacity building at the municipal level for its operation and management. It is recommended to investigate best actions to increase such municipal capacities. This can be partially accomplished through a stronger involvement of the private sector where such regulatory possibilities exist.
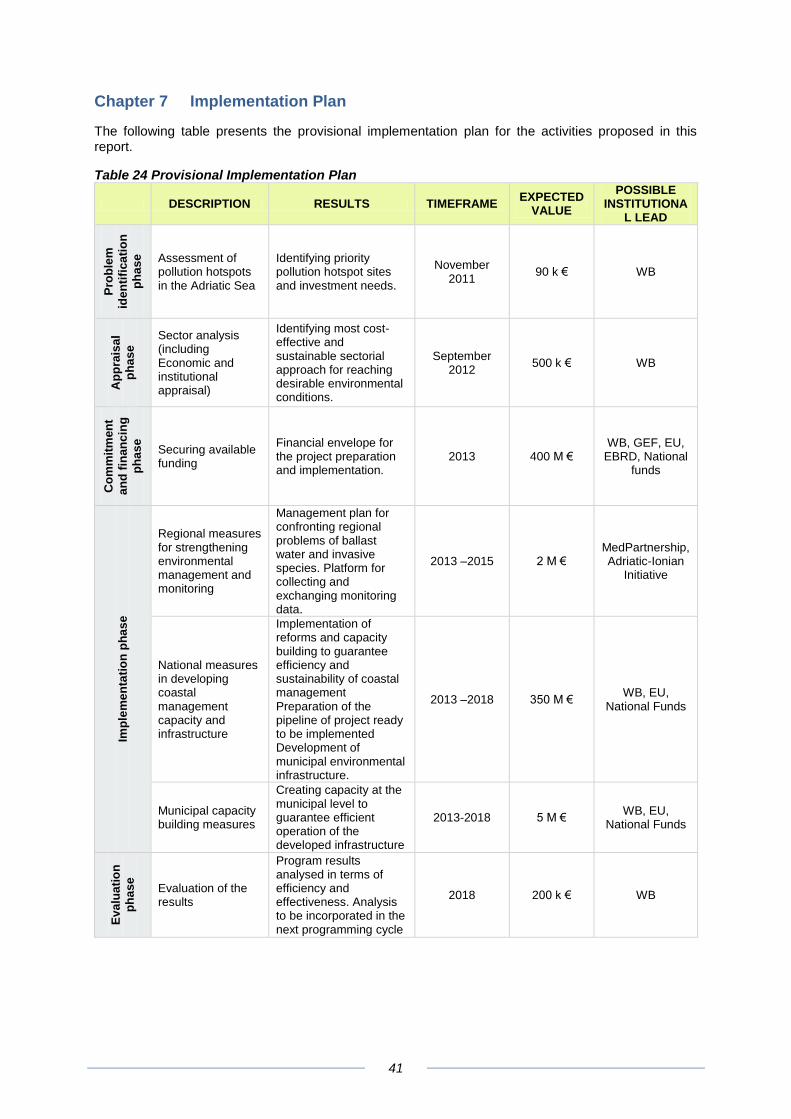
41
Chapter 7 Implementation Plan
The following table presents the provisional implementation plan for the activities proposed in this report.
Table 24 Provisional Implementation Plan
DESCRIPTION RESULTS TIMEFRAME EXPECTED
VALUE
POSSIBLE INSTITUTIONA
L LEAD
Pro
ble
m
ide
nti
fica
tio
n
ph
as
e
Assessment of pollution hotspots in the Adriatic Sea
Identifying priority pollution hotspot sites and investment needs.
November 2011
90 k € WB
Ap
pra
isa
l
ph
as
e
Sector analysis (including Economic and institutional appraisal)
Identifying most cost-effective and sustainable sectorial approach for reaching desirable environmental conditions.
September 2012
500 k € WB
Co
mm
itm
en
t
an
d f
inan
cin
g
ph
as
e
Securing available funding
Financial envelope for the project preparation and implementation.
2013 400 M € WB, GEF, EU,
EBRD, National funds
Imp
lem
en
tati
on
ph
as
e
Regional measures for strengthening environmental management and monitoring
Management plan for confronting regional problems of ballast water and invasive species. Platform for collecting and exchanging monitoring data.
2013 –2015 2 M € MedPartnership, Adriatic-Ionian
Initiative
National measures in developing coastal management capacity and infrastructure
Implementation of reforms and capacity building to guarantee efficiency and sustainability of coastal management Preparation of the pipeline of project ready to be implemented Development of municipal environmental infrastructure.
2013 –2018 350 M € WB, EU,
National Funds
Municipal capacity building measures
Creating capacity at the municipal level to guarantee efficient operation of the developed infrastructure
2013-2018 5 M € WB, EU,
National Funds
Ev
alu
ati
on
ph
as
e
Evaluation of the results
Program results analysed in terms of efficiency and effectiveness. Analysis to be incorporated in the next programming cycle
2018 200 k € WB
42
Literature
"Ballast Water Issues for Croatia." Det Norske Veritas and Fridtjof Nansen Institute, 2005. Borja, A., J. Franco, and V. Perez. "A Marine Biotic Index to Establish the Ecological Quality of Soft-
Bottom Benthos within European Estuarine and Coastal Environments." Marine Pollution Bulletin 40, no. 12 (2000): 1100-14.
"Country Reports." World Travel & Tourism Council, http://www.wttc.org. "Fishery and Aquaculture Country Profiles ". Food and Agriculture Organization of the United Nations -
Fisheries and Aquaculture Department, http://www.fao.org. Kuspilic, G. "Baseline Budget for Year 2003." Zagreb: Ministry of Environmental Protection, Physical
Planning and Construction, 2005. Orfanidis, S. , P. Panayotidis, and N. Stamatis. "Ecological Evaluation of Transitional and Coastal
Waters: A Marine Benthic Macrophytes-Based Model." Mediterr. Mar. Sci. 2, no. 2 (2001): 45-65.
Palmeri, L., G. Bendoricchio, and Y. Artioli. "Modelling Nutrient Emissions from River Systems and Loads to the Coastal Zone: Po River Case Study, Italy." Ecological Modelling 184, no. 1 (2005): 37-53.
"Priority Issues in the Mediterranean Environment." Copenhagen: EEA, 2006. Schou, J.S., S.T. Neye, T. Lundhede, L. Martinsen, and B. Hasler. "Modelling Cost-Efficient
Reductions of Nutrient Loads to the Baltic Sea. Model Specification, Data and Cost Functions. ." 69. Denmark: National Environmental Research Institute, 2006.
Simboura, N., and A. Zenetos. "Benthic Indicators to Use in Ecological Quality Classification of Mediterranean Soft Bottom Marine Ecosystems, Including a New Biotic Index." Mediterranean Marine Science Journal 3, no. 2 (2002): 77-111.
UNEP/MAP. "Second Report on the Pollution Hot Spots in the Mediterranean." Athens: UNEP / MAP, 2003.
Vollenweider, R. A., F. Giovanardi, G. Montanari, and A. Rinaldi. "Characterization of the Trophic Conditions of Marine Coastal Waters with Special Reference to the Nw Adriatic Sea: Proposal for a Trophic Scale, Turbidity and Generalized Water Quality Index." Environmetrics 9, no. 3 (1998): 329-57.
"Water Management Strategy for the Federation of Bosnia and Herzegovina 2010-2022 (Proposal)." Sarajevo: Water agency Sarajevo and Water agency Mostar, 2010.