Adoption of climate technologies in the agrifood sector · Adoption of climate technologies in the...
80
Adoption of climate technologies in the agrifood sector Methodology
Transcript of Adoption of climate technologies in the agrifood sector · Adoption of climate technologies in the...

Please address comments and inquiries to:Investment Centre DivisionFood and Agriculture Organization of the United Nations (FAO)Viale delle Terme di Caracalla – 00153 Rome, Italy [email protected]/investment/en
Report No. ? – Month Year
Adoption of climate technologies in the agrifood sector - M
ethodologyReport N
o. ?
Adoption of climate technologies in the agrifood sectorMethodology
I7022EN/1/03.17
ISBN 978-92-5-109704-5
9 7 8 9 2 5 1 0 9 7 0 4 5


Food and agriculture organization oF the united nationsrome, 2017
Adoption of climate technologies in the agrifood sector Methodology
Ralph Sims specialist in sustainable energy, Massey university
Alessandro FlamminiNatural Resources Officer, Investment Centre Division, FAO
Nuno Santoseconomist, investment centre division, Fao
with contributions from:
Luis Dias Pereiraeconomist, investment centre division, Fao
Arianna Caritaeconomist, investment centre division, Fao
Stefania Braccospecialist on energy-smart Food, climate and environment division, Fao
Domonkos Ozeclimate technologies specialist, Fao
directions in investmentprepared under the Fao/eBrd cooperation

The designations employed and the presentation of material in this information product do not imply the expression of any opinion whatsoever on the part of the Food and Agriculture Organization of the United Nations (FAO) or the European Bank for Reconstruction and Development (EBRD) concerning the legal or development status of any country, territory, city or area or of its authorities, or concerning the delimitation of its frontiers or boundaries. The mention of specific companies or products of manufacturers, whether or not these have been patented, does not imply that these have been endorsed or recommended by FAO or EBRD in preference to others of a similar nature that are not mentioned.
The views expressed in this information product are those of the author(s) and do not necessarily reflect the views or policies of FAO or EBRD.
ISBN 978-92-5-109704-5 (FAO)
© FAO 2017
FAO encourages the use, reproduction and dissemination of material in this information product. Except where otherwise indicated, material may be copied, downloaded and printed for private study, research and teaching purposes, or for use in non-commercial products or services, provided that appropriate acknowledgement of FAO as the source and copyright holder is given and that FAO’s endorsement of users’ views, products or services is not implied in any way.
All requests for translation and adaptation rights, and for resale and other commercial use rights should be made via www.fao.org/contact-us/licencerequest or addressed to [email protected].
FAO information products are available on the FAO website (www.fao.org/ publications) and can be purchased through [email protected].
iii
TABLE OF CONTENTS
Foreword v
acknowledgements vii
acronyms and abbreviations ix
executive summary xi
Scope and data issues xi
The four step method xiii
Step 1: Identifying the most GHG-emitting agrifood activities xiv
Step 2: Prioritising climate technologies and practices based on costs, markets and technical information xiv
Step 3: Evaluating sustainability issues xvii
Step 4: Addressing barriers hindering uptake xviii
1 introduction 1
2 Key concepts and data 3
Approach and complementarities with other methodologies 3
Definitions, data issues and limitations 4
Tiered approach to measure indicators 6
3 step 1: identifying the most ghg emitting agrifood activities 11
What are the major GHG emitting activities? 11
What have been the GHG emission trends for each activity? 14
How do emission intensities compare with other countries? 15
Key results from Step 1 16
4 step 2: Prioritising climate technologies/practices based on techno-economic criteria 17
Assessing the potential of each climate technology to reduce GHG emissions 17
Multi-criteria analysis of climate technologies in the agrifood sector 18
Technical assessment 20
Market assessment 23
Economic assessment 27
Data availability 31
Key results from Step 2 31
5 step 3: evaluating sustainability issues 37
Key results from Step 3 42
6 step 4: addressing barriers hindering uptake 43
Overall policy and institutional setting in the country 43
Review of past policy interventions aimed at technology adoption 43
Key barriers, risks and possible solutions to overcome them, by technology 44
Key results from Step 4 47
annex 1 the Fao Water-energy-Food nexus assessment 49
annex 2 description of relevant policies 53
references 55


v
Global agrifood systems play an important role in greenhouse gas (GHG) emissions and are therefore increasingly under pressure to achieve efficiency improvements and reduce their environmental footprint. Fostering the adoption of best available green technologies along agrifood supply chains is an essential step toward this objective. The European Bank for Reconstruction and Development (EBRD) and the Food and Agriculture Organization of the United Nations (FAO) have been supporting this process through many activities.
As part of its commitment to climate change mitigation and adaptation, the EBRD is participating with other regional development banks in the Climate Technology Transfer Initiative funded by the Global Environment Facility (GEF). The initiative aims to accelerate the dissemination and deployment of mitigation and adaptation technologies and focuses on the countries of the southern and eastern Mediterranean (SEMED) region, namely Egypt, the Kingdom of Jordan, Morocco and Tunisia, and the early transition countries (ETC) of Armenia, Azerbaijan, Belarus, Georgia, Kyrgyz Republic, the Republic of Moldova, Mongolia, Tajikistan, Turkmenistan and Uzbekistan as well as Kazakhstan and Ukraine.
In particular, the EBRD is leading a set of activities aimed at supporting the market penetration of climate technologies in both the SEMED and ETC regions. Part of this effort includes co-financing the Finance and Technology Transfer Centre for Climate Change (FINTECC), which provides a framework to demonstrate the viability of climate technologies and includes a programme to help businesses implement innovative climate technologies (mostly through technical assistance and incentive grants for eligible technologies). In addition, FINTECC is intended to help legislators and private sector investors overcome market barriers to the transfer of climate technologies and accelerate their deployment.
A central tenet of FAO’s work is the promotion of climate technologies and practices that help make agricultural and food systems more efficient, while also making agriculture, forestry and fisheries more productive and sustainable. A change in agrifood technology inevitably has an impact on the water, energy and food sectors as well as on the ability to mitigate and adapt to climate change. FAO has extensive experience assessing and managing these impacts, which has resulted in a multitude of analytical tools that inform and guide strategic decisions.
This document has been produced under the EBRD/FAO cooperation, which has significantly expanded into climate change and energy efficiency topics in recent years. In 2014, the EBRD and FAO started to collaborate under the FINTECC framework to support the market penetration of climate technologies in the agrifood sector and jointly formulated and launched a project on Monitoring the adoption of key sustainable climate technologies in the agrifood sector. The project was implemented in close cooperation with the International Energy Agency (IEA), focusing on the market penetration of energy efficiency and renewable energy technologies in a broad range of industry sectors (including agrifood). The two main outputs of the project were: (i) this methodology guide, which tracks technology adoption rates specifically in agrifood supply chains; and (ii) a pilot of the methodology, which was done in Morocco and detailed in the report “Morocco: Adoption of climate technologies in the agrifood sector”1.
The application of this methodology to other EBRD countries of operation will help meet a number of objectives that can contribute to national and international climate change mitigation and adaptation efforts. First, it will facilitate a practical understanding of the penetration of climate change-related technologies in a particular agrifood sector, while underlining the need or potential for further
1 FAO, 2016
FOrEwOrd

vi
technological adoption. Second, it can help guide national and international policymakers to maximise the value and utility of their investments in new technologies and practices, while promoting more productive and sustainable agrifood sectors. This guidance can help minimise emissions from agrifood activities while maximising benefits, including increased productivity and more efficient water and energy usage. Finally, it will facilitate cross-country comparisons (in addition to cross-technology comparisons within the same country), thereby enhancing the scope for regional and international cooperation on climate change action.
René Castro Salazar,
Assistant Director General, Climate, Biodiversity, Land
and Water Department
Daniel Gustafson,
Deputy Director General (Programmes),
Food and Agriculture Organization of the United
Nations
Josué Tanaka,
Managing Director, Operational Strategy and Planning, Energy Efficiency and Climate
Change, European Bank for Reconstruction and
Development

vii
This publication is a joint product of FAO and the EBRD. The development of this tool was initiated and led by Nuno Santos, Economist, FAO and Alessandro Flammini, Natural Resources Officer, FAO in close collaboration with Gianpiero Nacci, Head of Sustainable Resources Investments, EBRD and Sumeet Manchanda, Principal, Energy Efficiency and Climate Change, EBRD. The lead author of the final document is Ralph Sims, Specialist in Sustainable Energy, Massey University. Other authors are Stefania Bracco, Specialist on Energy-Smart Food, FAO; Arianna Carita, Economist, FAO; Luis Dias-Pereira, Economist, FAO; Alessandro Flammini; Domonkos Oze, Climate Technologies Specialist, FAO; and Nuno Santos.
In its initial phase, the document benefited from inputs from different FAO technical divisions, in particular the following experts: Amani Alfarra, Land and Water Division; Wilfried Baudoin, Plant Production and Protection Division; Olivier Dubois, Climate and Energy Division; Jippe Hoogeveen, Land and Water Division; Jorge Fonseca, Nutrition and Food Systems Division; Josef Kienzle, Plant Production and Protection Division; Anne Mottet, Animal Production and Health Division; Francesco Tubiello, Statistics Division; and Emilie Wieben, Nutrition and Food Systems Division. Ralph Sims and Alessandro Flammini provided technical leadership on the overall methodological approach of the document.
The authors would like to thank IEA experts for their contributions during numerous discussions held on the overall methodology, in particular Adam Brown, Consultant; Simone Landolina, Acting Head of the International Partnerships and Initiatives Unit; Eric Masanet, Head of Energy Demand Technology Unit; and Jeremy Sung, Analyst.
Valuable support at the final stages of the publication and dissemination was provided by Nada Zvekic, Communications Officer, FAO and Sarah Mercadante, Project and Communications Officer, FAO. The report benefited from excellent editing by Genevieve Joy, FAO Consultant and Genevieve Theodorakis, Economist, FAO.
Lastly, the authors would like to thank Emmanuel Hidier, Senior Economist for support in the development of the project and technical comments on the contents, as well as Mohamed Manssouri, Chief, Europe and Central Asia, Near East and North Africa, Latin America and the Caribbean, Investment Centre Service, FAO, for his overall guidance.
ACkNOwLEdgEmENTS


ix
ACrONymS ANd ABBrEviATiONS
AFOLU Agriculture, Forestry and Other Land Use
BAT Best available technology
BAU Business as usual
CA Conservation agriculture
CBA Cost-benefit analysis
EBRD European Bank for Reconstruction and Development
EC European Commission
EE Energy efficiency
ESMAP Energy Sector Management Assistance Program
ETC Early transition countries
EX-ACT Ex-ante carbon balance tool
FAO Food and Agriculture Organization of the United Nations
FINTECC Finance and Technology Transfer Centre for Climate Change
GDP Gross domestic product
GEF Global Environment Facility
GHG Greenhouse gas
GLEAM-i Global Livestock Environmental Assessment Model (interactive)
HCFCs Hydrochlorofluorocarbons
HFCs Hydrofluorocarbons
IAV Institut Agronomique et Vétérinaire Hassan II
IEA International Energy Agency
INRA Institut National de la Recherche Agronomique
IPCC Intergovernmental Panel on Climate Change
IRENA International Renewable Energy Agency
LPG Liquid petroleum gas
MACCs Marginal abatement cost curves
MCA Multi-criteria analysis
MS Excel-based tool Microsoft Excel-based tool
NG Natural gas
OECD Organization for Economic Co-operation and Development
PICCPMV Projet d’Intégration du Changement Climatique dans la Mise en œuvre du Plan Maroc Vert (Project of Integration of Climate Change in the Plan Maroc Vert)
PV Photovoltaic
RE Renewable energy
REEEP Renewable Energy and Energy Efficiency Partnership
REN21 Renewable Energy Policy Network for the 21st Century
R&D Research and development
SEMED Southern and Eastern Mediterranean region
SMEs Small and medium sized enterprises
UNFCCC United Nations Framework Convention on Climate Change
UNSD United Nations Statistics Division
VAT Value-added tax


xi
ExECuTivE SummAry
The food production and supply chain consumes about 30 percent of total end-use energy globally, and contributes to over 20 percent of total annual greenhouse gas (GHG) emissions (excluding emissions or sinks from land use change). A growing worldwide population, changing diets and growing economic development will all serve to increase competition for land, water and energy resources – which already face problems of environmental degradation and, in some cases, scarcity. To address these challenges, agrifood systems at every scale, from the small family farm to the vertically integrated corporate farm level, will have to become more efficient by using less land, water, fertilizers, energy and other inputs to produce more food more sustainably, and with greater resilience to weather pattern changes and extreme events. Technology adoption is bound to play an important part in this adjustment process.
There are significant regional variations in the ability to respond to these challenges. In particular, countries that face food insecurity naturally put concerns over GHG emission reductions or other environmental issues in second place. Still, in specific situations technology adoption can help reduce a country’s environmental footprint and go hand in hand with both improved food security and rural development. The goal of this document is therefore to provide guidance in assessing options for GHG emission reductions and decoupling the agrifood industry from its dependency on fossil fuels in a context where various goals are important: increased crop productivity, efficient use of water, improved livelihoods for the rural poor, and sustainable development.
As a contribution to quickly expanding literature on the subject, the present document provides a practical methodology to enable a country or funding agency to assess and monitor the market penetration of sustainable climate technologies and practices in agrifood chains. Market penetration is defined as a measure of the adoption of an agrifood technology or practice in a specific market. The guidelines are useful not only to estimate the current market penetration, but also – and more importantly – to assess the potential for further adoption and to reduce GHG emissions efficiently. The methodology therefore takes into consideration important features of each technology including: market potential, technical and non-technical barriers to adoption and unit cost in terms of US dollars per tonnes of carbon dioxide equivalent (USD/tCO2eq).
The result is a characterisation of a set of technologies and practices which can lead to identification of “best bet” options to reduce emissions from the agrifood sector on the basis of local conditions. Moreover, the results include a discussion of policy areas that may need reform, and specifically what can be the drivers to promote adoption of such best bet technology options.
Scope and data issues
The immediate focus of the methodology is on the EBRD countries of operation and in particular the southern and eastern Mediterranean (SEMED) region, namely Egypt, the Kingdom of Jordan, Morocco and Tunisia; and the early transition countries (ETC), Armenia, Azerbaijan, Belarus, Georgia, Kyrgyz Republic, the Republic of Moldova, Mongolia, Tajikistan, Turkmenistan and Uzbekistan as well as Kazakhstan and Ukraine. Still, the methodological principles can easily be used in any other country context. In addition, four key issues should be taken into consideration when applying and interpreting the results obtained through this methodology.
First, the implementation of the methodology can be done in different degrees of intensity ranging from a detailed study to a rapid appraisal exercise. Ideally the implementation should be undertaken as an intensive and detailed study involving policymakers in the country alongside local and international experts. However, it is appreciated that the proposed method is challenging to undertake in full by a country

xii
or funding agency. A team of staff and/or consultants would need to be appointed to undertake the process which, if carried out thoroughly, is likely to last several months. Engaging with expert stakeholders, collecting data, filling in data gaps, producing a complete cost abatement curve, etc. all take time and will be resource intensive for government officials, particularly where data are hard to access. A possible incentive for a country to undertake the full analysis may be that funding agencies will have the flexibility to assess the enabling environment to encourage investment, and then may be more inclined to invest where detailed analysis has reduced the risks.
However, where such a detailed approach is not acceptable for some reason, a less formal “desktop study”, partly based on expert opinion and conducted over a shorter period of time may be feasible. Naturally this will involve greater risk of inadequate analysis or poor identification of key issues and policy development areas. A rapid appraisal uses a mix of data sources according to the availability in the country, which may have variable coverage and quality across the subsectors and technologies being assessed. It needs to rely on a mixture of existing indicators and available GHG emissions data; employ readily available national data; and use existing literature to ascertain typical impacts of specific technologies where available. Moreover, in the case of a rapid appraisal it is usually best practice for users of the methodology to use scenario analysis insofar as possible and to state any assumptions very clearly. Such clarity is important for policymakers and ultimate users of the data and analysis to construct their own hypothesis and value different options.
The concept of detailed analysis is also extremely important in the identification of barriers and policy analysis. In fact, in its rapid appraisal form, the analysis seeks to simply identify key policy areas that can be explored further. To move from policy themes to actual reform proposals is necessarily a more transaction intensive process involving multiple stakeholders under government leadership and can be a natural follow-up to the results of a rapid exercise. In addition, the policy analysis can always be made more in-depth in order to produce concrete reform proposals if required.
Second, the number of technologies taken into consideration when applying the methodology can be expanded. In fact, the evaluation methods and principles indicated in Steps 2 to 4 of the methodology can be applied to more technologies as needed since they are for the most part general analytical tools. In a given country, implementation of the methodology for the first time can be followed by work that consider more technologies as this is a field which is constantly seeing advances and also as new data and information is made available.
Third, the methodology has been designed as a repeat exercise. In principle, it can be applied repeatedly in the future in appropriate time intervals given that most data sources are usually identified during the first study in a given country. Repeating the implementation allows local authorities to monitor technology uptake, track how adoption of specific technologies may be responding to policy reforms and add new technologies to the analysis as they become available internationally.
Finally, this step-by-step methodology seeks to reduce emissions from the agrifood sector while maximising co-benefits. Climate change mitigation is therefore just one criterion that impacts the classification of technologies, together with other sustainability considerations, based primarily on an assessment of technical, market and economic criteria. Such an approach may aid policymakers to screen technologies and attract international climate financing to mitigate emissions, while maximising co-benefits. However it is less suitable if the local priority is to adapt to climate change. For this reason, technologies such as small dams, biogas from agri-residues or grazing management, which may have an important value in making agriculture more resilient to climate change, rank relatively low compared to other technologies. A different analysis where adaptation co-benefits are preferentially weighted can nonetheless be performed. In addition, it is important to note that the proposed approach considers land use to be constant (for the most part). This is a simplification and allows the methodology to be highly complementary of other approaches that look specifically at land use and emissions such as FAO’s EX-ACT tool. Depending on resources available, the land use component can be incorporated in the analysis for a given country.

xiii
The four step method
The methodology is organized in a four step approach, as can be seen from the figure below:
(i) identify relevant GHG emissions in the agrifood sector by activities carried out
both on-farm and during food processing;
(ii) analyse the markets for selected agrifood climate technologies and practices and
evaluates their potential;
(iii) consider other sustainability issues for a more comprehensive assessment of the
technologies; and
(iv) identify obstacles to increased adoption, policy areas that warrant reform and
measures to encourage market penetration of appropriate climate technologies
and practices.
It is important to note that the different steps are not necessarily sequential and each of them is expected to separately add value to the emissions reduction discussions in a given country. For example, Step 1 on identifying key GHG emitting agrifood sector activities is an important departure point for considering which areas could be given priority to finding green technical solutions. Applying the methodology sequentially is an option especially under constrained resources for implementation: the list of technologies and practices can be reduced with each successive step based on the assessment thereby simplifying the analysis of the latter steps.
Figure: Summary of the four step approach
Identify the most relevant GHG emission sources in the agrifood chain and ascertain trends
Put the stage of technology development into context
Produce marginal abatement cost curves
Assess technical and market aspects
Consider any trade-offs such as those within the water/energy/food nexus and climate change adaptation
Assess market penetration vis-à-vis policies in place and obstacles and confirm most suitable technologies/practices
Identify drivers to support adoption of technologies/practices
Identify technologies/practices with significant potential
Ascertain the maturity of technologies/practices and their costs and potentials
Target agrifood activities that emit most GHGs
Identify any sustainability issues relating to the selected technologies/systems.
Identify any issues hindering market uptake
1
2
3
4
Source: Authors’ compilation.
xiv
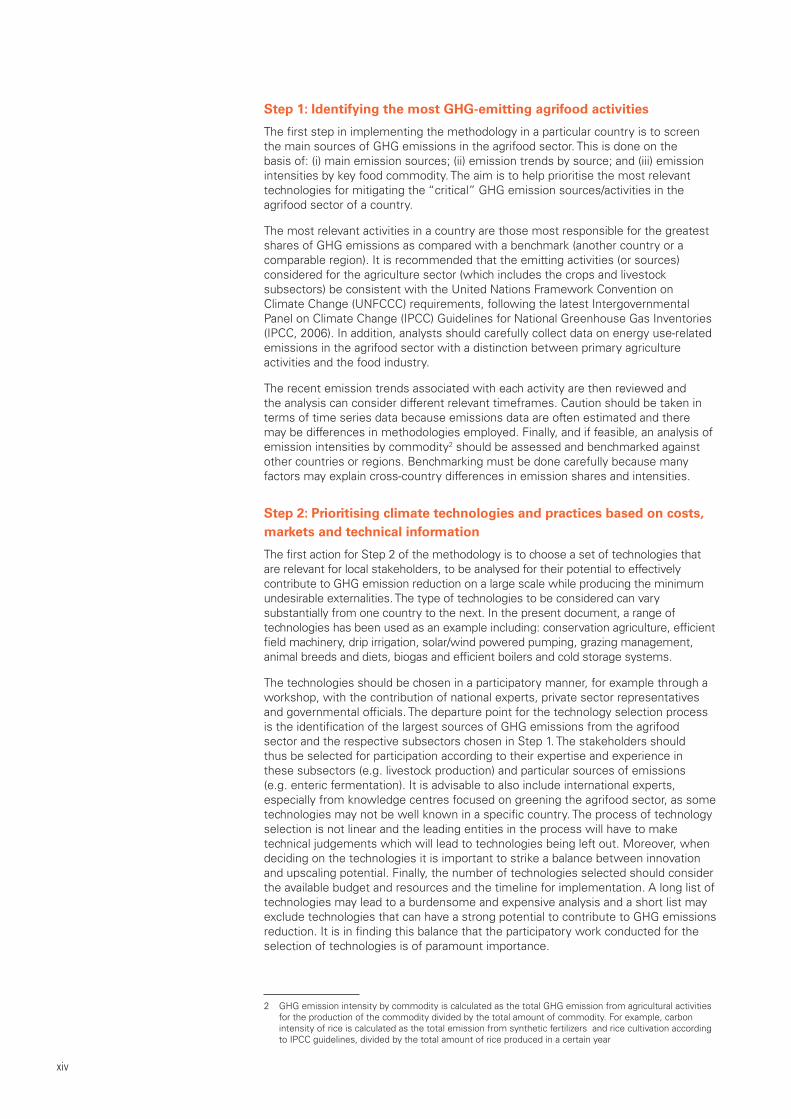
Step 1: Identifying the most GHG-emitting agrifood activities
The first step in implementing the methodology in a particular country is to screen the main sources of GHG emissions in the agrifood sector. This is done on the basis of: (i) main emission sources; (ii) emission trends by source; and (iii) emission intensities by key food commodity. The aim is to help prioritise the most relevant technologies for mitigating the “critical” GHG emission sources/activities in the agrifood sector of a country.
The most relevant activities in a country are those most responsible for the greatest shares of GHG emissions as compared with a benchmark (another country or a comparable region). It is recommended that the emitting activities (or sources) considered for the agriculture sector (which includes the crops and livestock subsectors) be consistent with the United Nations Framework Convention on Climate Change (UNFCCC) requirements, following the latest Intergovernmental Panel on Climate Change (IPCC) Guidelines for National Greenhouse Gas Inventories (IPCC, 2006). In addition, analysts should carefully collect data on energy use-related emissions in the agrifood sector with a distinction between primary agriculture activities and the food industry.
The recent emission trends associated with each activity are then reviewed and the analysis can consider different relevant timeframes. Caution should be taken in terms of time series data because emissions data are often estimated and there may be differences in methodologies employed. Finally, and if feasible, an analysis of emission intensities by commodity2 should be assessed and benchmarked against other countries or regions. Benchmarking must be done carefully because many factors may explain cross-country differences in emission shares and intensities.
Step 2: Prioritising climate technologies and practices based on costs, markets and technical information
The first action for Step 2 of the methodology is to choose a set of technologies that are relevant for local stakeholders, to be analysed for their potential to effectively contribute to GHG emission reduction on a large scale while producing the minimum undesirable externalities. The type of technologies to be considered can vary substantially from one country to the next. In the present document, a range of technologies has been used as an example including: conservation agriculture, efficient field machinery, drip irrigation, solar/wind powered pumping, grazing management, animal breeds and diets, biogas and efficient boilers and cold storage systems.
The technologies should be chosen in a participatory manner, for example through a workshop, with the contribution of national experts, private sector representatives and governmental officials. The departure point for the technology selection process is the identification of the largest sources of GHG emissions from the agrifood sector and the respective subsectors chosen in Step 1. The stakeholders should thus be selected for participation according to their expertise and experience in these subsectors (e.g. livestock production) and particular sources of emissions (e.g. enteric fermentation). It is advisable to also include international experts, especially from knowledge centres focused on greening the agrifood sector, as some technologies may not be well known in a specific country. The process of technology selection is not linear and the leading entities in the process will have to make technical judgements which will lead to technologies being left out. Moreover, when deciding on the technologies it is important to strike a balance between innovation and upscaling potential. Finally, the number of technologies selected should consider the available budget and resources and the timeline for implementation. A long list of technologies may lead to a burdensome and expensive analysis and a short list may exclude technologies that can have a strong potential to contribute to GHG emissions reduction. It is in finding this balance that the participatory work conducted for the selection of technologies is of paramount importance.
2 GHG emission intensity by commodity is calculated as the total GHG emission from agricultural activities for the production of the commodity divided by the total amount of commodity. For example, carbon intensity of rice is calculated as the total emission from synthetic fertilizers and rice cultivation according to IPCC guidelines, divided by the total amount of rice produced in a certain year

xv
Once the climate technologies/practices for analysis have been selected, their assessment and classification should be made through a multi-criteria analysis (MCA). In Step 2, the criteria applied for the assessment of each technology can be grouped into three broad categories:
(i) technical performance and potential for adoption/deployment;
(ii) current market potential and adoption trends; and
(iii) financial and economic attractiveness, excluding GHG mitigation benefits (and
other difficult to quantify externalities).
For each of the three categories, performance criteria are applied as indicated in the columns in the table on the following page. As a result of the assessment proposed in this methodological guide, each technology is classified with a one to three stars rating for each criterion (see examples in the table). Once the assessment has been conducted and the ratings for each criterion established as suggested in this document, the analyst can then decide whether to attribute weights to each (third row in the table) as to construct an index. This index would allow ranking of the technologies according to their techno-economic performance as exemplified in the Figure at page xvii.
Assessing the criteria proposed for Step 2 is a demanding part of the methodology. Hence, if limited budget and resources are available, the implementation team may consider focusing only on the technologies with the most relevance to the emitting activities identified in Step 1. For example, if “energy use on-farm” is deemed to be a high priority for emissions reduction, the various options to reduce emissions are then compared based on a series of criteria weighted according to the local conditions (as shown in the table). On the other hand, for low priorities in terms of emissions reduction, not all available technologies – if any – need to be assessed. Data quality and sources to be used in the study will largely depend on availability, but also on the time and resources available for conducting the full assessment.
In analysing the results from Step 2, the technologies/practices that rank higher are those which have both the potential to reduce GHG emissions at a significant scale and could do it with lower costs or even net benefits to the adopters and the society at large. However, these solutions may also carry negative externalities or face constraints to their adoption that have not yet been assessed and are the focus of Step 3.

xvi
Tab
le: E
xam
ple
of
Ste
p 1
tec
hn
olo
gy/p
ract
ice
pri
ori
tisa
tio
n M
CA
for
“en
ergy
use
on
-far
m”
tech
nic
al a
sses
smen
t M
arke
t as
sess
men
t e
con
om
ic a
sses
smen
ta
vaila
bili
ty o
f d
ata
Clim
ate
tech
nolo
gies
an
d pr
actic
es
Rel
evan
t ag
rifoo
d G
HG
em
issi
on
sour
ces
Perf
orm
ance
co
mpa
red
to
inte
rnat
iona
l bes
t pr
actic
e
Mat
urity
of
tech
nica
l sup
port
se
rvic
es
Pote
ntia
l to
redu
ce a
nnua
l na
tiona
l GH
G
emis
sion
s
Cur
rent
te
chno
logy
ad
optio
n ra
te
Tren
ds in
ga
p be
twee
n te
chno
logy
up
take
and
te
chni
cal
pote
ntia
l
Fina
ncia
l at
trac
tiven
ess
Miti
gatio
n co
stTo
tal s
core
ba
sed
on
wei
ghts
(Ind
ex)
Wei
ghts
10%
10%
15%
10%
15%
15%
20%
5%
Con
serv
atio
n ag
ricul
ture
Ric
e cu
ltiva
tion
Synt
hetic
fe
rtili
zers
Man
ure
appl
ied
to s
oils
Man
ure
man
agem
ent
en
erg
y u
se-o
n
farm
***
**
****
***
*1.
75
Eff
icie
nt f
ield
m
achi
nery
Ene
rgy
use-
on
farm
***
**
***
****
*1.
80
Sol
ar/w
ind
pow
ered
wat
er
pum
ping
Ene
rgy
use
on-
farm
****
**
****
****
*2.
00
Inno
vativ
e gr
eenh
ouse
te
chno
logi
es
Synt
hetic
fe
rtili
zers
Cul
tivat
ion
of
orga
nic
soils
en
erg
y u
se o
n-
farm
****
**
****
**
1.55
Sou
rce:
Aut
hors
.

xvii
Figure: Example of a ranking of technologies and practices following the techno-economic assessment of Step 2
Drip irrigation 2.35
Solar/wind powered water pumping 2.00
Efficient field machinery 1.80
Conservation agriculture 1.75
Innovative greenhouse technologies 1.55
Biogas 2.15
Renewable energy systems 1.95
Source: Authors.
Step 3: Evaluating sustainability issues
In Step 3, the climate technology/practice mitigation options that seem technically and economically promising from Step 2 are further scrutinised in terms of externalities that go beyond GHG emissions impact. This part of the methodology focuses on general equilibrium effects from scaling up the adoption of a certain technology, and more specifically on the water-energy-food nexus and climate adaptation effects of adoption. This ensures that a government or funding agency will take into account, at least on a qualitative basis, the key factors of resilience to climate change as well as the synergies with climate change adaptation.
A full water-energy-food nexus analysis can be conducted following the FAO Nexus Assessment3, but an alternative simpler approach might be to ensure all factors have been considered at least in a qualitative manner (on the basis of available literature and expert opinions) for the climate technologies and practices under evaluation. In this case, a full water-energy-food nexus analysis would be conducted only for those technologies/practices that signal particular concerns.
For example, in the case of solar or wind-powered pumping systems, farmers can more effectively manage water through timely and precise water withdrawals; and this may increase resilience in places with variable climate or where water management is not under the individual farmer’s responsibility. Besides the impact on climate change adaptation, the upscaling of solar or wind-powered pumping systems in a country can, under certain circumstances, lead to improved food security (at least in its availability and stability dimensions). However, the reduction of marginal pumping costs with the large-scale introduction of the technology may lead to unsustainable groundwater use. The analysis in Step 3 therefore underlines how certain technologies would require complementary measures to be introduced (such as technologies, institutions and policies supporting groundwater governance) to ensure sustainability.
On the basis of the Step 3 analysis, those technologies and practices that have positive implications and synergies across the different nexus aspects and that are most relevant for climate adaptation are expected to be less constrained by sustainability concerns in their market development. This information complements the analyses of Steps 1 and 2, and the classification of sustainable climate technologies is modified accordingly (those technologies/practices that show fewer sustainability concerns move up in the ranking).
3 More information is available in the FAO publication “Walking the Nexus Talk: Assessing the Water-Energy-Food Nexus”: http://www.fao.org/3/a-i3959e.pdf

xviii
Step 4: Addressing barriers hindering uptake
The key objective of Step 4 is to identify thematic policy areas that may warrant greater attention to promote or improve the adoption of sustainable climate technologies in the agrifood sector. Fostering the adoption of new technologies/practices relies, among other factors, on a conducive institutional and legal framework, which encompasses regulatory and legislative acts, financial support and implementation structures. Step 4 therefore analyses relevant policies and institutional barriers and/or support mechanisms that influence the potential deployment of climate technologies and practices for GHG emissions reduction in a specific country situation.
This step builds on the results from Steps 2 and 3 in that it uses the techno-economic analysis and the assessment of sustainability aspects to identify important barriers to the adoption of specific technologies. In addition, it brings an extra dimension to the overall assessment by describing key policies that may impact policy adoption and concludes which are the key thematic areas that may deserve more attention from policymakers. It is important to note that it would be too ambitious in the proposed assessment to be able to provide detailed policy guidance: policy formulation is often more successful when different stakeholders are involved and reforms are carefully assessed and debated. The objective under Step 4 is therefore limited to identifying policy themes and directions that can eventually be further developed by policymakers to support the deployment of climate technologies in the agrifood sector. This methodological guide proposes that Step 4 covers the following topics:
(i) overall policy and institutional setting in the country;
(ii) review of past policy interventions aiming at technology adoption; and
(iii) key barriers, risks and possible solutions to overcome them, by technology.
The last section comprises subsections per technology. For each technology, a diagnostic of key policies and relevant institutions, a description of main barriers and risks to adoption and a proposal of relevant policy themes is undertaken. At the end of Step 4, a discussion of the findings is conducted. It summarises the key barriers and policy themes across technologies and is a key input to the conclusions of the overall assessment.

Adoption of climate technologies in the agrifood sector - Methodology
1
“In December 2015, at the Conference of the Parties (COP) summit organized by the United Nations Framework Convention on Climate Change we need to transform political commitment into actions and results. That includes ensuring the necessary funding to cover the cost of transition to food systems that mitigate and adapt, that are more sustainable and resilient to climate change”.
José Graziano da Silva, Director-General, FAO, 23 April, 2015
A growing worldwide population, changing diets and growing economic development will all serve to increase competition between agriculture, fisheries, forestry, energy extraction, mining, transport and other sectors over natural resources, water and energy supplies. Global projections indicate that demand will increase significantly over the next decades under the pressures of population growth, increased mobility demands, economic development, and international trade, urbanisation, diversifying of diets, cultural and technological changes, and climate change (Hoff, 2011). Water is used for the production and processing of crops, animal products, fish, and forest products along the entire agrifood supply chain, accounting for around 70 percent of total global freshwater withdrawals –making it the largest user. Water is also used to generate electricity and for marine and river transport in different forms (FAO, 2011a; Sims et al., 2015).
The food production and supply chain consumes about 30 percent of total end-use energy globally and contributes approximately 22 percent of total annual GHG emissions4 (excluding land use change) (FAO, 2011b; Sims et al., 2015). Energy is required to produce, transport and distribute food as well as to extract, pump, lift, collect, transport and treat water. Cities, industries and other users compete for water, energy and land resources that, in some areas, face problems of environmental degradation and, in some cases, scarcity of resources. Global primary energy demand is projected to grow by around 32 percent by 2040 (IEA, 2014).
Global agrifood systems thus face at least three simultaneous and inter-twined challenges. First, they need to ensure the security of food supply and an adequate supply of non-food agricultural goods through increased productivity and
4 In early 2000s
income. Second, they have to adapt to climate change and the threat of more frequent extreme weather events. Finally, they also need to contribute to climate change mitigation through the uptake of climate technologies and practices5 that result in climate change mitigation such as renewable energy (RE) and energy efficiency (EE) measures as well as those that increase resilience to climate change impacts and enable adaptation to occur.
The European Bank for Reconstruction and Development (EBRD) and the Food and Agriculture Organization of the United Nations (FAO) recognise that addressing these challenges will require radical changes in food production and processing systems. For example, to meet food production goals (around 60 percent more food will be needed to be produced in order to feed the world population in 2050), total global water withdrawals for irrigation, primarily in already water–stressed areas, are projected to increase by 10 percent by 2050 (FAO, 2011a) and up to 20 percent by 2080 (FAO, 2014c). Taking sub-Saharan Africa as an example, if unabated, by 2080 climate change is likely to lead to around 75 million hectares (ha) of land currently suitable for rain-fed agriculture being lost, agricultural gross domestic product (GDP) falling by up to 8 percent, and 75 percent of the population being at risk of hunger.
Innovation and adoption of new technologies can make great contributions towards meeting the challenges mentioned above but this will require an enabling policy environment. In particular, there is a need to support research efforts and demonstration investments, as well as the adoption and scaling up of sound, proven and reliable climate technologies/practices. In addition, there is a need, among other actions, to help strengthen the capacity of the users of climate technologies and practices, to provide business opportunities and financing for the uptake of new technologies and practices and improve the social cohesion of rural communities where technologies are introduced.
In response to these needs, FAO and the EBRD have combined efforts to develop this methodological guide to help assess and monitor
5 Most of the mitigation options envisaged are climate technologies whereby a new or improved technology replaces another. However, mitigation can also result from behavioral change or a different means of achieving the same end – hence the term “systems” is included throughout
Chapter 1 – introduction

2
the market penetration of sustainable climate technologies/practices. The study builds upon FAO’s extensive experience with agricultural production and food processing and its support to low-carbon, climate technologies and practices that have specific relevance to agrifood supply chains. It also builds on the EBRD’s extensive experience of investing in energy efficiency and renewable energy initiatives across a wide range of sectors through specific financial products and technical assistance activities. In addition to the present document, the EBRD is working on a similar analytical tool with the International Energy Agency (IEA) that aims to cover a broader range of sectors.
The ultimate objective of this methodological document is to contribute to GHG emission reductions through greater adoption of sustainable climate technologies in the agrifood sector. The document is expected to enable stakeholders in the agrifood sector, including governments, national statistics offices, financial institutions, businesses and industry associations to evaluate different climate technologies and practices available and contribute to increased investments, as well as policy reforms that help overcome barriers to adoption. In addition, it is also expected to support international financial institutions (IFIs) and the donor community by prioritising the use of available capital and orientate their support to specific countries. The application of this methodology in a specific country context should create information and knowledge and therefore help inform investments in climate-smart technologies.
The guidance provided in this document is of a generic nature in order to cover the broad scope of the agrifood sector and a range of potential climate technologies, which vary widely between regions. In addition, the results are expected to be practical so that stakeholders from a country or aid agency can use them to define investment priorities and inform policy dialogue initiatives. In addition, it is also expected to be helpful in bridging information and analytical gaps and provide guidance on typology of information and analysis that could improve availability of critical knowledge. Attempting to fill these gaps directly through surveys and analytical work is possible but will likely be beyond the scope of the methodology in a given country, in particular because of the diversity of agribusinesses and technologies that would warrant a detailed assessment.
The present document is composed of five main sections. The next section introduces key concepts and data issues in applying the methodology. It is followed by a section on each of the four steps of the methodology, namely: Step 1 – identifying the most GHG emitting agrifood activities; Step 2 – prioritising climate technologies and practices based on costs, markets and technical information; Step 3 – evaluating sustainability issues; and Step 4 – addressing barriers hindering uptake.

Adoption of climate technologies in the agrifood sector - Methodology
3
Chapter 2 – key concepts and data
In order to facilitate implementation, the methodology has been designed as a step-by-step approach. The four steps help identify which of the many agrifood climate technologies and practices should be prioritised based on mitigation potential and in light of several important criteria, notably technical parameters, financial and economic feasibility and sustainability considerations. It intends to promote efficiency in technology investments in order to minimise emissions from the sector and maximise economic returns, reflecting the different benefits and costs of adopting technologies, including positive and negative externalities. Each of the four steps is intended to help the assessor answer specific questions, but more importantly to stimulate a debate on the most efficient approaches to greening the agrifood sector. The following are the key questions that each step seeks to answer:
• Step 1: Which are the most relevant agrifood
related activities in terms of GHG emissions?
• Step 2: How can climate technologies/
practices capable of mitigating the identified
GHG emissions be prioritised based on
market penetration and other techno-
economic parameters?
• Step 3: What are the relevant issues in terms
of sustainability and potential for adaptation
to climate change that need to be considered
when evaluating these technologies?
• Step 4: Which are the main barriers hindering
uptake and how can they be addressed?
Approach and complementarities with other methodologies
Several key issues should be taken into consideration when interpreting the results obtained through the application of this methodology. First, the methodology has been designed as a rapid appraisal tool; a mixture of data sources is used according to the availability in the country, with variable coverage and quality across the subsectors and technologies. Such an approach may aid policymakers to screen technologies and attract international climate financing to mitigate emissions while maximising co-benefits. However, the approach can easily be adapted to a more in-depth exercise involving collection of primary data and more
intensive field work (depending on resources and time). Pilot studies will primarily rely on official country and international data along with industry sources, information from civil society organizations and academia. The results that arise from the application of this methodology are therefore dependent on the quality of such sources and availability of data.
As is the case for gathering accurate GHG data through measurement, it is appreciated that a detailed assessment of the market penetration of climate technologies and practices may be a challenge for any country or funding agency to undertake. Generally, two options are therefore proposed:
• Option 1: Proceeding with the full
methodology, which will require engaging
with expert stakeholders, collecting data to fill
in any gaps in current databases, producing
a complete cost abatement curve, etc. This
would be time and resource-intensive for
government officials, particularly where data
are hard to access.
• Option 2: A “desktop study” is a more
rapid approach to avoid time and resource
constraints. It would rely on a mixture
of existing indicators and available GHG
emissions data, draw on national data
that already exist, and use the literature
to ascertain typical impacts of specific
technologies where available. It would involve
focusing only on certain types of technologies
and practices and not attempting to cover all
those available.
When focusing on the mitigation costs, Option 1 could involve producing a complete marginal abatement cost curve (MACC) as some countries have done and identifying metrics for the evaluation of different aspects linked to the performance of the specific technologies (see Step 2). Alternatively, Option 2 attempts to use indicative ranges for the costs and potentials for each type of technology, in which case seeking expert opinion might suffice.
For countries or agencies wishing to undertake a full and detailed analysis based on these guidelines (Option 1), it is recommended that a small team of staff and/or consultants be appointed to undertake the process which, if

4
carried out thoroughly, is likely to last over several months. Where this is not possible, the less formal approach over a shorter period (Option 2) may be appropriate but it comes with a greater risk of poor policy development as a result of inadequate analysis. In addition, potential investors may be less inclined to invest if the policy environment is inappropriate and if a country shows little effort towards reform: in such a scenario a particular country may be more inclined to undertake a full analysis. Finally, gaining greater political support before investing may then need lengthier dialogue between parties.
Second, the number of technologies taken into consideration and the subsequent policy analysis can vary depending on the capacity of the assessor, and can also be expanded when needed. The evaluation methods and principles can be applied to more or fewer technologies as needed since they are general analytical tools. Indeed, future pilot studies will likely consider more technologies as this is a field that is constantly seeing advances. In a given country, the implementation of the methodology for the first time can be built up by later consideration of more technologies as well as new data and information.
Third, the methodology has been designed as a repeatable exercise. In principle, it can be applied recurrently in the future at appropriate time intervals assuming that most data sources have been identified. Repeating the implementation allows local authorities to monitor technology uptake, track how the adoption of specific technologies may be responding to policy reforms and add new technologies to the analysis as they become available internationally.
Fourth, this step-by-step methodology seeks to reduce emissions from the agrifood sector while maximising co-benefits. Climate change adaptation (CCA) is therefore just one criterion impacting the classification of technologies – together with other sustainability considerations – based primarily on an assessment of technical, market and economic criteria. Such an approach may aid policymakers to screen technologies and attract international climate financing to mitigate emissions while maximising co-benefits. However, it is less suitable if the local priority is to adapt to climate change. For this reason, technologies that increase agriculture’s resilience to climate change may not be included or may rank low compared to other technologies. A different analysis where adaptation co-benefits are preferentially weighted could nonetheless be performed.
Fifth, it is important to note that the proposed approach considers land use to be constant for the most part. This is a simplification and allows the methodology to be highly complementary to other tools that look specifically at land use and
emissions6. Depending on resources available, the land use component can be incorporated in the analysis for a given country.
Finally, the methodology has been prepared for the EBRD countries of operation and in particular the SEMED region, ETCs and Kazakhstan and Ukraine. Still, the methodological principles presented in the document can easily be used in any other specific country context.
Definitions, data issues and limitations
The methodology is focused on assessing market penetration of different sustainable climate technologies in the agrifood sector. This is the starting point for the analysis and results in the identification of investment opportunities, key barriers to adoption and supporting policies. Market penetration is defined in this study as the extent to which the sale or adoption of an agrifood technology or practice has reached (or could reach) a specific national market. In addition, “sustainable climate technologies” are broadly defined as (i) climate change mitigation technologies, including RE systems and EE improvements, that can directly reduce GHG emissions; (ii) management and operational systems or practices in the agrifood sector (such as irrigation monitoring, conservation agriculture or equipment maintenance) that enable increased productivity or improved performance and hence result in lower GHG emissions per unit of food production; and (iii) adaptation7 technologies and practices (such as biodigestion and conservation agriculture) that can result in improved resilience to future climate change impacts on food production, processing and security of supplies.
Climate technologies can be very different and it is important to distinguish at least two typologies:
(i) sector-specific technologies (for example,
those mainly related to a process such as the
chilling of fish or drying of grain);
6 For example, FAO’s EX-ACT or GLEAM tools. The Ex-Ante Carbon-balance Tool (EX-ACT) is an appraisal tool that provides estimates of the impact of agriculture and forestry development programmes, projects, and policies on the carbon-balance (for more information, see: http://www.fao.org/tc/exact/ex-act-home/en/).The Global Livestock Environmental Assessment Model (GLEAM) is a modelling framework that simulates the impacts of the livestock sector on the environment (for more information, see: http://www.fao.org/gleam/en/)
7 Climate change adaptation is the adjustment in natural or human systems in response to actual or expected effects of climate, which moderates or minimises the harm caused by the effects of climate change. Climate resilience on the other hand is the ability to do the changes required to minimise the effects of climate change. A technology or practice is considered to increase climate resilience potential if it helps minimise the adverse impacts caused by change in climate on agricultural productivity or resource use. A climate resilient technology increases the adaptation potential of the agricultural system

Adoption of climate technologies in the agrifood sector - Methodology
5
(ii) horizontal, cross-cutting technologies that
can be applicable across a number of sectors
(for example, solar PV systems used for
water pumping, powering milking equipment,
refrigeration, lighting, etc.).
For the latter typology, data and information that are not specific to the agrifood sector can be used (e.g. the cost of installing and maintaining a PV system). Many of the sector-specific agrifood technologies selected for consideration in this study could utilise energy inputs from RE systems8 as a means of achieving CO2 emission reductions if substituted for power and heat generation using fossil fuels.
Due to the limited data availability for many of the target countries in various international datasets, useful data for this project are scarce, so specific country information may need to be accessed or collected locally in order to undertake some actions such as estimating mitigation costs, technology market shares, etc. In fact, the IEA collects limited data on energy for agricultural production, processing or heating demands and FAO’s statistical data can be of limited use because, for example, even knowing the number of agricultural tractors operating in a country would not enable the volume of GHG emissions from diesel fuel combustion to be calculated without also knowing the tractor size range, the age and the average number of hours used annually.
Top-down or bottom-up approaches, or a combination of the two, can be used, based on data collection methodologies and data availability (Figure 1). A top-down approach using high-level statistics is acceptable for setting
8 Renewable energy here is in the form of electricity generated from biogas, bioenergy, geothermal, hydro, wind, or solar sources, or heat/cold supplied directly from solar, biomass combustion, or direct geothermal
policy directions but normally does not provide sufficient granularity of the data needed to assess whether the technologies being deployed are in line with best practice. A bottom-up approach recognises informal data sources (such as from surveys, business association statistics, site data collection) as a valid complement to using the higher level, top-down data. For example, during the Morocco pilot study9, a combination of the two was used, depending on the specific technology/practice under analysis.
Lack of data may result in specific priority assessments and analysis not being possible during methodology implementation. These issues should be highlighted so that crucial data can be made available in the future. For example: How much diesel is combusted annually by the agricultural sector in tractors and harvesters? How much land is currently under conservation tillage? What total volume of water is applied by drip irrigation and by sprinklers? What tonnage of cereal crops is artificially dried each year?
Where the study identifies that data gaps exist in the agricultural production and water use sectors, it could be suggested (e.g. to national statistics offices) that additional data should be provided10. Obtaining useful data for the food processing sector is more of a challenge depending on how much data a country is already collecting and the complexity of the sector (e.g. number of stakeholders and size of the agro-processing sector). National statistics offices and private sector associations may be able to assist in this regard. In addition, interviews with key stakeholders can also provide useful insights especially in situations where there are only few
9 See FAO (2016).Morocco: Adoption of climate technologies in the agrifood sector”
10 Note: It has been agreed with the EBRD and IEA that limited data availability should not be a reason for excluding a measure from the selected prioritisation criteria (see Step 2 below)
Figure 1: A tiered approach to measure indicators based on available data sources
PERFORMANCE INDICATORS FOR SECTORS
TECHNOLOGY SPECIFIC STATISTICS
TIER 1vStatistical officesvOther formal sources
TIER 2vCertification bodiesvSector organizationsvNon-governmental organizationsvInternational financial institutions
TIER 3vAd-hoc surveysvAd-hoc research
Source: Authors.

6
actors (for example the sugar sector in Morocco). Finally, international organizations such as FAO and IFIs such as the EBRD or the World Bank can play an important role in supporting standardised data collection efforts that enable countries to measure progress in greening the agrifood sector. During the Morocco pilot study, industry experts, equipment providers, associations, and local literature review were key data sources for the assessment of the technologies.
Tiered approach to measure indicators
A three-tiered approach (Figure 1) can have particular merit for evaluating the potential for GHG emission reductions from the uptake of climate technologies while also providing a method to rate and categorise the reliability and methodological complexity of GHG emission factors and activity data. It can give more confidence in the validity of a GHG inventory when used as an indicator for assessing the mitigation potential of a low-carbon agrifood technology. The tier levels of indicators used partly depends on the data sources available.
• Tier 1: High-level indicators – data are
normally sourced from statistical offices
or other official national or international
data sources and are not always easily
disaggregated to the required level of detail.
• Tier 2: More disaggregated indicators – data
are sourced from a number of other sources,
often of specialised nature, for example,
from organizations that certify boilers or
associations that import tractors.
• Tier 3: Indicators based on ad-hoc surveys
or research – data are collected in the field
by inspection of installations, undertaking
surveys of equipment suppliers, analysing
financial investments, etc.
Where such data sources are not available, a country could consider seeking funding from agencies such as the EBRD or the Climate Technology Center and Network (CTCN)11 in order to undertake collection of whatever data are most relevant for the purpose.
It may be feasible to use Tier 1 data as a fixed approach across all countries to help select which technologies and practices should be assessed and enable country comparisons to be made, and then to delve down to more accurate country level indicators using Tier 2 and Tier 3 data sources where they are available. For example, the energy use per hectare of arable land varies between countries (Figure 2), thereby giving an indication of different farming intensities. As seen below, Egypt is the most energy intensive country of the target regions at 53 giga joules (GJ) per hectare (ha), while Mongolia has a very low energy intensity of 0.3 GJ/ha, which stems from differences in climate, growing season, labour use,
11 See https://www.ctc-n.org/ for further information
Box 1: A practical approach to data collection and validation
When approaching a new country, sometimes it is difficult to understand who is officially responsible for the promotion of climate technologies in the agrifood chain as this is a cross-cutting topic among different ministries and the roles are likely not clearly defined at the national level. The responsibility is usually shared between the Ministry of Agriculture, the Ministry of Environment, the Ministry of Energy, the Ministry of Planning and all related specialised agencies.
FAO country offices as well as local partners are often a good entry point to reach relevant stakeholders. In the case of FAO, the government counterpart is usually the Ministry of Agriculture, but not exclusively.
The first option for the assessment team is to contact official statistics offices, such as: (i) the one linked to the Ministry of Agriculture, to collect agriculture-related information; (ii) the team responsible for compiling GHG emission inventories, which is usually part of the Ministry of Environment; or (iii) the office responsible for energy statistics, which can be part of the Ministry of Energy or of Planning. A good local consultant and local contacts can facilitate the identification of the relevant persons. This is important since the same contact point may validate the correctness of the data used and ultimately the findings of the report.
However, even if preference should be given to official statistics, it will not always be possible to source all information needed in this way. International databases such as FAOSTAT, FAO AQUASTAT, IEA Statistics and World Bank Statistics can be useful sources to complement official data.
When none of these sources can be exploited, information will need to be collected either directly from farmers, industry or local technology providers (including expert opinion for those criteria that cannot be assessed in a quantitative manner), or from third part sources (e.g. reports developed by other entities).
It is important that non-official data have been collected by reliable sources or local expert to facilitate data validation by local stakeholders.

Adoption of climate technologies in the agrifood sector - Methodology
7
and availability of agricultural land for crops. Thus, in Egypt reducing energy inputs into agricultural production without losing or even improving productivity could be worth investigating, whereas in Mongolia, the aim could be to look into ways to increase productivity in an energy efficient manner. Still, the problem with such indicators is that their cross-country comparison has to be done very carefully as they result from a number of factors which go beyond simply having a very energy (in)efficient agrifood sector.
Another interesting indicator for comparing agricultural intensities between countries is the energy input per unit of production value earned from agricultural production (mega joule (MJ) per USD) (Figure 3). Morocco is the highest of the SEMED and ETC countries at around 10.1 MJ/USD, while Mongolia is the least energy intensive
at around 0.2 MJ/USD. For high energy intensive countries, it is important to reduce energy inputs without reducing either productivity or product quality. In particular, it can be important to focus policies on incentivising the development of an agrifood sector with high value addition per unit of energy use.
It may be more difficult to acquire data for some indicators than others. For example, indicators relating to energy intensity of food processing and related emissions are complicated to compile due to limited data availability and the wide variety of food processing facilities that exist and their range of scales. IEA does not release its energy data for the food and tobacco industry for free whereas the UN Statistics Division presents more scattered data only up to 2013 (Table 1). Electricity generation data can be converted to GHG
Figure 2: Fossil energy intensity per hectare of arable land (GJ/ha) for SEMED and ETC countries, 2012
Source: Authors’ calculation based on FAOSTAT, 2015.
Figure 3: Fossil energy inputs per unit of production value (MJ/USD) for Kazakhstan, SEMED and ETC countries, 2012
Source: Authors’ calculation based on FAOSTAT, 2015.

8
emission data by using for example IEA emission factors for each country and year12. For other fuels, IPCC 2006 Guidelines for National Greenhouse Gas Inventories (IPCC, 2006) can be used.
Gaps in the data are also evident for each country (Table 1). The various combinations of electricity, coal (in its various forms), natural gas, liquid petroleum gas (LPG), liquid fuels, and solid biomass vary by country. Several countries have no data in any category at all. Thus, using indicators to compare energy inputs for food processing can be challenging since much of the data are unavailable from international databases. Such data may, however, be available at governmental level (as was the case for the Morocco pilot study).
When using indicators, it is useful to understand that countries have very different baseline conditions that can impact policy decisions. As an example, for the countries of interest in this study, the potential for using solar driers in the agrifood sector was analysed as a means of reducing the
12 They are publicly available in Annex of IEA report “CO2 emissions from fuel combustion - Highlights 2012”, International Energy Agency, www.iea.org
electricity demand (and hence the related GHGs) for heating water. Key variables that determine the payback period of an investment in solar water heating (assuming the use of electric boilers as a baseline) are the current average electricity price and the incoming solar irradiation levels (Figure 4). Even from this somewhat simple cost analysis, it is evident that most of the SEMED countries (Tunisia, Morocco and the Kingdom of Jordan) have relatively short payback periods due to their high solar irradiation levels and the relatively high cost of electricity. Even Egypt, with a low electricity price of USD 0.04/kWh, had a 3 year payback due to its very high solar irradiation levels.
Conversely the very low electricity price in Turkmenistan, coupled with only moderate solar irradiation, resulted in a negative payback. Similarly, the payback period for Kyrgyzstan was 67 years. Therefore, given that every country has different sets of baseline conditions, even a simple analysis can produce useful indicators. In this example, it is evident that it should be easier to increase the market penetration of solar driers in the 6 countries with a payback period of 1–2 years.
Table 1: Energy end-use data for the agrifood processing sector where available for Kazakhstan, Ukraine, SEMED and ETC countries (PJ), 2005–2013
2005 2006 2007 2008 2009 2010 2011 2012 2013
seMed
Morocco P P P P P P P P 15.3
Tunisia P P P 4.0 4.3 4.8 5.3 5.6 5.7
Egypt N/A N/A N/A N/A N/A N/A N/A N/A N/A
Kingdom of Jordan N/A N/A N/A N/A N/A N/A N/A N/A N/A
etc
armenia P P P P P P P P P
Azerbaijan P P 5.0 11.6 11.7 9.6 9.9 15.3 15.8
Belarus P 6.2 6.6 7.3 8.3 9.1 10.6 10.1 10.6
Georgia P P 0.4 0.8 0.4 0.6 1.1 1.1 2.2
Kyrgyzstan N/A N/A 0.0 0.0 0.0 0.0 0.0 0.1 1.4
Republic of Moldova P P 1.6 1.7 1.4 1.8 1.9 2.1 2.1
Mongolia N/A N/A N/A N/A N/A N/A N/A N/A N/A
Tajikistan P P P 0.3 0.3 0.4 0.3 0.3 0.3
Turkmenistan N/A N/A N/A N/A N/A N/A N/A N/A N/A
Uzbekistan N/A N/A N/A N/A N/A N/A N/A N/A N/A
Kazakhstan P P P 42.8 25.8 29.5 9.6 15.2 16.5
Ukraine P P P 1.6 1.0 1.7 2.0 1.7 35.0
Source: UNSD Energy Statistics Database, 2016.
Notes: a check mark means data is available in the IEA Statistics database only. N/A = no data available.

Adoption of climate technologies in the agrifood sector - Methodology
9
Figure 4: Payback periods (years) for SEMED countries (red) and ETCs (blue) when investing in a solar drier system to displace the purchase of grid electricity
Source: Authors’ calculations based on electricity prices from different online sources.
Notes: The number to the right of each diamond gives the approximate payback period in years based on calculating the value of the electricity saved assuming a capital investment cost of USD 100/m2 of solar collector, plus 3 percent of capital cost per year for maintenance over the 10 year life of the solar collector.
–ve = a negative payback period.


Adoption of climate technologies in the agrifood sector - Methodology
11
Chapter 3 – Step 1: identifying the most gHg emitting agrifood activities
Step 1 provides an overview of the most relevant GHG emitting activities in the agrifood sector, building on data already collected at the national level. It enables the analyst to highlight where GHG emissions come from along the agrifood chain and which are dominant or require particular attention in a given country. The efficiency of food production, as measured in terms of GHG emissions, can then be compared between different countries and across specific regions.
The screening of the main sources of GHG emissions in Step 1 is carried out on the basis of three main analyses:
(i) main GHG emitting activities in the sector;
(ii) emissions trends by activity; and
(iii) emissions intensity of key food commodities.
The FAOSTAT public database of GHG emissions from agriculture13 can be used to support the analysis, and the United Nations Statistics Division (UNSD) and IEA provide data on energy in the food industry 14 (though not for all countries and not by subsectors). This screening aims to identify the most relevant technologies to reduce emissions by activity, and also on the basis of the specific gases emitted. Such an analysis undertaken at this initial phase will provide answers to questions such as:
• In which specific agrifood activities is the
country emitting the most GHGs?
• What are the emissions shares and how do
they compare with other countries in the
same region?
• Which GHG is increasing the most between
CO2, nitrous oxide (N2O) and methane (CH4)?
• Are emissions released mainly during primary
production, at the food processing stage or
both?
• Is the GHG emissions level associated
with a high or low emission intensity by
main commodity when compared to other
countries?
13 See http://faostat.fao.org “Emissions - agriculture”, which follows the IPCC 2006 guidelines
14 http://unstats.un.org/
What are the major GHG emitting activities?
The most significant emitting activities along the agrifood chain can first be identified by seeing which are responsible for the greatest share of emissions in the specific country and region, and second how these shares compare with other benchmark countries.
Emissions from activities listed in the FAOSTAT database by country are measured in tonnes of CO2 equivalent (tCO2eq):
• enteric fermentation by animal type (CH4);
• paddy rice cultivation (mainly CH4);
• synthetic nitrogenous fertilizer use/application (N2O), which refers to N2O emissions resulting from the application of fertilizer as per IPCC Guidelines
• manure management by animal type (N2O and CH4);
• manure applied to soils by animal type – (N2O);
• manure left on pasture by animal type – (mainly N2O);
• cultivation of soils in cropland or grassland (soil carbon changes);
• crop residue decay by crop (soil carbon changes, CO2 and some CH4);
• burning of crop residues such as cereal straw (CO2 and black carbon [a short-lived climate forcer i.e. it has a relatively short life span, unlike CO2]);
• burning of savannah such as closed and open shrub land, woody savannah and grassland15
(CO2 and black carbon); and
• energy use on-farm such as diesel fuel combustion and electricity (CO2, with separate data available for irrigation, transport on farm, fisheries, and total energy use).
Data on energy used in food processing are more difficult to obtain, with limited detail available from the UNSD Energy Statistics
15 Note FAOSTAT also provides details on GHG emissions by country from land use including land use change

12
database.16 Still, some countries will have their own national data available. For example, New Zealand produced energy consumption estimates based on a manufacturing energy-use survey conducted by Statistics New Zealand in 2010. The survey assessed end-use energy consumption across manufacturing industries (including food processing) for the 2009 calendar year. Using subsector GDP data for the period, the implied energy intensities (PJ per unit of GDP) were calculated for each subsector for diesel, gasoline and fuel oil inputs. To estimate activity data for each subsector, these intensities were then applied to GDP data measured across the time series and scaled to match the fuel sales reported for all manufacturing and construction industries.
Some countries may also have collected statistical data on other factors relevant to the agrifood industry such as water use, land use changes, etc. (which are mostly covered in Step 3).
16 The UNSD Energy Statistics database is available at http://data.un.org/Explorer.aspx?d=EDATA (data from 2000)
Taking GHG emissions from agricultural production in Morocco as an example17, the distribution of total GHG emissions by primary agricultural activity and energy used in the food industry can be benchmarked against the average from neighbouring countries (Algeria, Tunisia and Libya) (Figure 5) or the region to which it belongs. In this case, Morocco clearly has a higher share of emissions from energy use than the benchmark, a similar share from synthetic nitrogenous fertilizer application18, but a lower emission share from energy use in food processing, enteric fermentation and manure left on pasture. Other countries or agencies could
17 This example if for illustrative purposes and data used in this report comes from international datasets which are not necessarily the same collected during the Morocco pilot phase, for which more precise numbers and information were sought at the national level involving national experts and the use of locally available data. The report of the Morocco pilot study is available as a separate publication
18 According to IPCC Guidelines for GHG emissions, ‘synthetic fertilizers’ refers to N2O emissions resulting from the application of fertilizers
Figure 5: Share of total agrifood GHG emissions by source in Morocco and the benchmark Maghreb region, 2013
0%
10%
20%
30%
40%
50%
60%
70%
80%
90%
100%
Morocco only avg Maghreb
Enteric fermentation Manure management Rice cultivationSynthetic fertilisers Manure applied to soils Manure left on pastureCrop residues Burning - crop residues Burning - savanna
Enteric fermentationManure managementManure applied to SoilsRice cultivationManure left on pastureSynthetic fertilizersCrop residuesColtivation of organic soilsBurning - Crop residuesBurning - Savannah
GHG Emission sources according to IPCC guidelines for the AFOLU sector
Energy in agricultureEnergy in food and tobacco
Other GHG emission sources
Source: FAOSTAT, 2015 and UNSD Energy Statistics Database, 2015.
Note: Here, the “Maghreb” region includes Tunisia, Libya and Algeria. The term “agrifood” includes the crops and livestock subsectors, plus energy use in agriculture and the food industry.

Adoption of climate technologies in the agrifood sector - Methodology
13
access the FAOSTAT database to undertake a similar analysis if desired.19
As discussed above, data issues can be a problem particularly as international databases may not accurately reflect emissions in a given country. For example, international databases show that only 4 percent of agrifood GHG emissions come from energy in “food industry” in Morocco, whereas for other countries in the region the share is significantly higher (above 10% on average), suggesting that there may be a problem with reporting. Rather than relying on international databases that do not necessarily reflect the best statistics available at national level, the best case scenario is for a country to regularly collect energy consumption data for its food processing subsector (e.g. through new surveys or adapting existing ones). Thorough energy data are needed to accurately estimate the main sources of emissions from agrifood processing activities. UNSD publishes public energy consumption data for the “food and tobacco industry” for some countries (Table 1) but such data are not available for Morocco, for example. In addition, UNSD’s published data
19 An FAO online tool can facilitate this kind of analysis easily and quickly for all emission categories of the AFOLU sector, comparing the agricultural GHG emission of a country to those of the region it belongs to. The tool is available at the following link: http://www.fao.org/in-action/micca/resources/tools/ghg/emissions-overview/
do not include a breakdown by subsector. IEA also collects such data and publishes them in the IEA Statistics database (accessible with a subscription fee). These two sources can complement each other, but again, not all countries provide data so there are many gaps.
In some cases, more precise figures for a proper assessment may be available from the national statistical offices responsible for energy and/or GHG emissions. For example, for the pilot testing of the methodology to the Morocco case, it was possible to obtain detailed data about energy consumption of the food industry from the national accounts (in Moroccan Dirham [MAD]), which were subsequently converted into amount of energy consumed by typology of energy source.
This raises an important point: users of the methodology should always be ready to question the available databases and use more accurate local data when possible. These gaps and inconsistencies also raise questions about the comparability of data between a country and a benchmark region or other countries. Cross-country comparisons or benchmarking against a region must be done with care and it is recommended to provide adequate detail on why a comparison can be meaningful (using similar data sources, country characteristics, etc.).
Figure 6: Trends in emissions of agricultural GHG sources (crops and livestock subsectors) in Morocco including main agricultural activities, energy consumption and synthetic fertilizer manufacturing, 2000–2012
2000 2001 2002 2003 2004 2005 2006 2007 2008 2009 2010 2011 2012 2013
Energy in agriculture, +332%
Synthetic fertilizer manufacturing, +68%Enteric fermentation, +14%
Manure left on pasture, +18%Synthetic fertilizer (application), -14%Energy in food industry, +59%
Crop residues, +65%
Manure management, +22%Manure applied to soils, +33%Burning - crop residues, +5%
Rice cultivation, -14%
Burning - savannah, +693%
0
1
2
3
4
5
6
7
8
9
10
Mt
CO
2 eq
per
year
Source: FAOSTAT, 2015 and UNSD Energy Statistics Database, 2015.
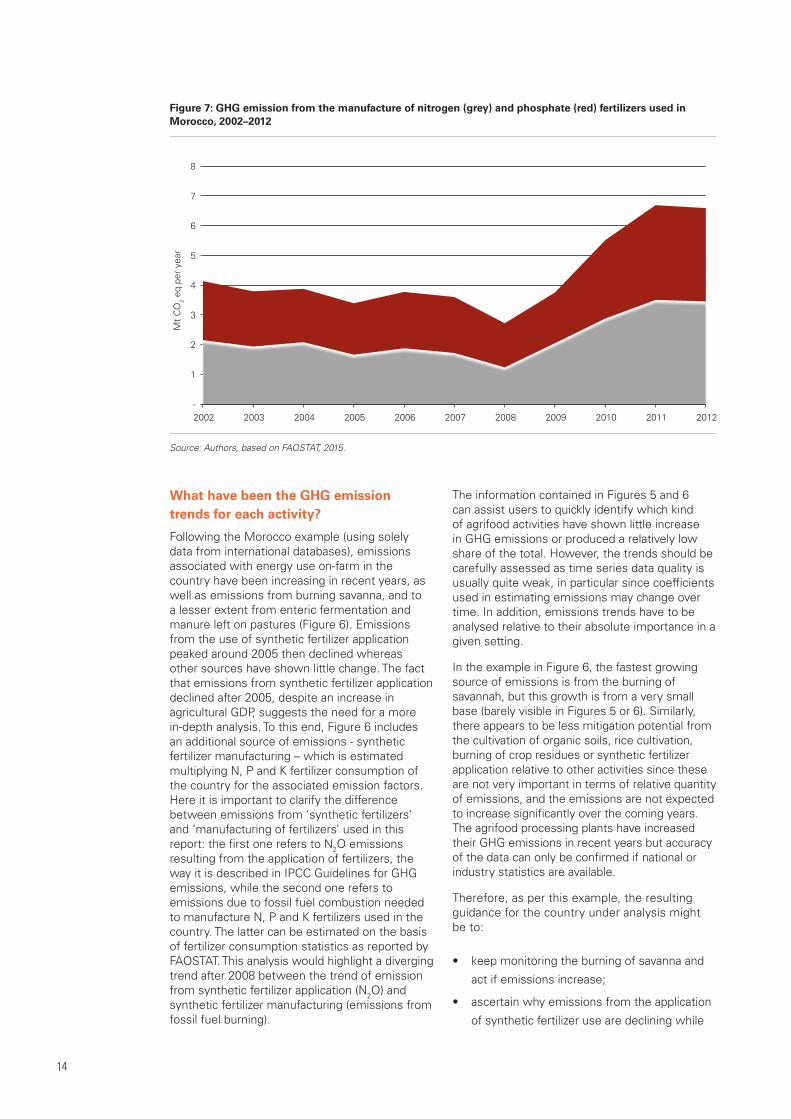
14
What have been the GHG emission trends for each activity?
Following the Morocco example (using solely data from international databases), emissions associated with energy use on-farm in the country have been increasing in recent years, as well as emissions from burning savanna, and to a lesser extent from enteric fermentation and manure left on pastures (Figure 6). Emissions from the use of synthetic fertilizer application peaked around 2005 then declined whereas other sources have shown little change. The fact that emissions from synthetic fertilizer application declined after 2005, despite an increase in agricultural GDP, suggests the need for a more in-depth analysis. To this end, Figure 6 includes an additional source of emissions - synthetic fertilizer manufacturing – which is estimated multiplying N, P and K fertilizer consumption of the country for the associated emission factors. Here it is important to clarify the difference between emissions from ‘synthetic fertilizers’ and ‘manufacturing of fertilizers’ used in this report: the first one refers to N2O emissions resulting from the application of fertilizers, the way it is described in IPCC Guidelines for GHG emissions, while the second one refers to emissions due to fossil fuel combustion needed to manufacture N, P and K fertilizers used in the country. The latter can be estimated on the basis of fertilizer consumption statistics as reported by FAOSTAT. This analysis would highlight a diverging trend after 2008 between the trend of emission from synthetic fertilizer application (N2O) and synthetic fertilizer manufacturing (emissions from fossil fuel burning).
The information contained in Figures 5 and 6 can assist users to quickly identify which kind of agrifood activities have shown little increase in GHG emissions or produced a relatively low share of the total. However, the trends should be carefully assessed as time series data quality is usually quite weak, in particular since coefficients used in estimating emissions may change over time. In addition, emissions trends have to be analysed relative to their absolute importance in a given setting.
In the example in Figure 6, the fastest growing source of emissions is from the burning of savannah, but this growth is from a very small base (barely visible in Figures 5 or 6). Similarly, there appears to be less mitigation potential from the cultivation of organic soils, rice cultivation, burning of crop residues or synthetic fertilizer application relative to other activities since these are not very important in terms of relative quantity of emissions, and the emissions are not expected to increase significantly over the coming years. The agrifood processing plants have increased their GHG emissions in recent years but accuracy of the data can only be confirmed if national or industry statistics are available.
Therefore, as per this example, the resulting guidance for the country under analysis might be to:
• keep monitoring the burning of savanna and
act if emissions increase;
• ascertain why emissions from the application
of synthetic fertilizer use are declining while
Figure 7: GHG emission from the manufacture of nitrogen (grey) and phosphate (red) fertilizers used in Morocco, 2002–2012
-
1
2
3
4
5
6
7
8
2002 2003 2004 2005 2006 2007 2008 2009 2010 2011 2012
Mt
CO
2 eq
per
year
Source: Authors, based on FAOSTAT, 2015.

Adoption of climate technologies in the agrifood sector - Methodology
15
fertilizer use (hence emissions from fertilizer
manufacturing) is increasing, and whether
that is due to more efficient use;
• aim to reduce GHG emissions in the agrifood
sector by concentrating on energy use on
farm, ruminant livestock emissions and
manure left on pasture; and
• obtain improved data on the agrifood
processing sector, namely data that provide
information on energy end uses to meet
the demands for fuel, heat and electricity in
the various subsectors such as commercial
processing plants.
In some cases, a closer look at GHG emission trends from specific activities could be useful to better understand the situation and hence be able to focus on the most relevant climate technologies. For example, a disaggregation of the GHG emissions from the manufacture of different types of fertilizers can be done (Figure 7). As indicated above, for each type, energy inputs and GHG emissions associated with fertilizer manufacturing and transport can be assessed from the amount and type of fertilizer consumed20 multiplied by an appropriate emissions factor21. These emissions may not be released within country boundaries if the fertilizer is manufactured elsewhere and imported but regardless, they are linked to the agricultural activity of the country under analysis. For example, the country under analysis can be importing fertilizers from another country and, according to IPCC guidelines, these latter emissions are accounted in the industry GHG inventory of the country where fertilizer is manufactured.
It is important to note that the approach used above (based on past and present emissions data) does not necessarily capture all important trends and some technologies may not be adequately covered. It is therefore advisable that the user also rely on local knowledge of trends that may not be apparent in the databases, which often contain gaps or are simply being out of date. A participatory process with heavy involvement of local stakeholders and discussions with industry players and government officials is essential for being able to
20 This information can be obtained from FAOSTAT21 Emission factors used for agricultural activities and energy
carriers (but electricity) are available on the FAOSTAT Emissions database (http://faostat3.fao.org/download/G1/GT/E) and are consistent with IPCC, 2006. For electricity the country emission factors for the power a d heat sector are available from the International Energy Agency. For fertilizers manufacturing, it is assumed that: N fertilizer manufacturing requires, in terms of energy, 85 percent of natural gas and 15 percent of electricity; P and K fertilizers require 30 percent of natural gas and 70 percent of electricity
capture such “hidden” trends. It is also qualitative in nature and should complement the quantitative data analysis. For example, in the aforementioned case of Morocco, the projected growth in fresh food exports will result in increased cold storage capacity in the country. Although not identified as a result of the process above, this technology should therefore be discussed with local stakeholders and eventually included in Step 2 of the analysis.
How do emission intensities compare with other countries?
A final part of Step 1 consists in evaluating emission intensities for specific products by comparing them with other countries in the region. Emission intensity is defined as quantity of emissions (usually in kg of CO2eq) by kilogram of production of a given commodity. Emission intensities associated with the national production of some key commodities such as eggs, rice, cereals, chicken meat, beef and cattle milk usually vary between countries within the reference region. There are many variables explaining emission intensity differences across countries and some of the gaps may be due to specific characteristics of a country which are not necessarily the result of inefficiencies (such as lower than optimal levels of technology adoption). In addition, it can also be complicated to aggregate data across commodities because of differences in nutritional content. In fact, there is no real benefit in comparing emission intensities between food products as this does not account for the wide variations in nutritional values per unit weight of product (for example 1 kg of rice has less protein than 1 kg of beef).
The analysis using Morocco data as an example provides a useful illustration of the difficulties in using emissions intensities to draw conclusions. Benchmarking Morocco against the average for all SEMED countries, it tends to have slightly higher emission intensities for animal products but lower for cereals and rice (Figure 8). However, the reason for this is not clear and would require further evaluation. This can be usually done through qualitative data collection, namely involving stakeholders to understand what are the key differences in technology used in the countries and what can be the factors underlying emissions intensity differences when these are significant.

16
Key results from Step 1
In sum, the three parts of Step 1 analyse: (i) data on the main sources of GHG emissions in agriculture; (ii) the recent trends in GHG emissions by activity; and (iii) the GHG intensities of key commodities. The analysis uses comparable countries to draw conclusions and combines quantitative and qualitative data (namely through discussions with key stakeholders in the country).
In a specific country situation, Step 1 should conclude with an overview of some of the most relevant agrifood emission sources in a country. Others can be added based on local knowledge and experience. As part of the participatory process that accompanies the methodology implementation, Step 1 is therefore key to creating a common understanding among stakeholders regarding the key GHG emissions from the sector and their associated activities. Ideally, reducing the GHG emissions of the main sources should then be prioritised, for example by stimulating the adoption of alternative agrifood technologies or practices and encouraging their rapid market penetration.
The results from this analysis help to identify which kind of CO2 emissions should be addressed, while the analyses from Steps 2 and 3 help assess appropriate technologies or practices to reduce emissions. For example, some of the climate smart technologies/
22 Emission intensity indicators are based on data already existing in FAOSTAT. Such indicators for key commodities in all countries are going to be made public in FAOSTAT
practices considered in subsequent steps are relevant to mitigate CO2 emissions from energy consumption (be it on- or off-farm). Others focus on emissions from other gases, such as CH4 or N2O. For example, conservation agriculture practices can help mitigate CH4 emissions from rice cultivation, N2O emissions from the application of synthetic fertilizers and CO2 emissions linked to their manufacturing (these latter are normally accounted for in the country where fertilizers have been manufactured but are nevertheless linked to the country under analysis). At the same time, conservation agriculture can increase N2O emissions from crop residues since one related practice consists of keeping the soil covered with agriculture residues. Although these emissions are largely offset by other emission reductions (and sinks, such as the carbon kept or stored in the soil as organic matter), they should be taken into account for an overall carbon balance. Hence the results expressed in the ranking of technologies should be expressed in terms of CO2eq balance.
Figure 8: Greenhouse gas emission intensity for a range of agricultural commodities produced in our reference country (Morocco in this example) compared with other benchmark countries
0
5
10
15
20
25
30
Chicken Cattle Chicken Sheep Cattle Sheepeggs meat Milk
Kg
CO
2eq/
kg p
rodu
ct
0
0.2
0.4
0.6
0.8
1
1.2
Cereals
Algeria Libya Morocco Tunisia
Source: FAOSTAT, 201522.

Adoption of climate technologies in the agrifood sector - Methodology
17
Chapter 4 – Step 2: Prioritising climate technologies/practices based on techno-economic criteriaThe first activity of Step 2 is to choose a set of technologies to be analysed for their potential to effectively contribute to GHG emission reductions on a large scale while minimising undesirable externalities.
The selection of technologies should be decided in a participatory manner, e.g. through a workshop, with the contribution of national experts, private sector representatives and government officials. The departure point for the technology selection process is the identification of the largest sources of GHG emissions from the agrifood sector and the respective responsible subsectors undertaken in Step 1. The stakeholders invited to participate should thus be selected according to their expertise and experience in these subsectors (e.g. livestock production) and particular sources of emissions (e.g. enteric fermentation). In preparation for the task, the facilitators should have knowledge of the most widely available and commonly applied climate technologies on an international scale that can address the major sources of emissions from the agrifood sector in the country. If required and when resources are available, international expertise on where such technologies are used should be sought. Many of these technologies are shown in Table 2. The list is not exhaustive and other climate technologies/practices can be added based on local context or local knowledge, such as adding insulation to buildings used for livestock housing or installing precision irrigation sprinkler systems23.
As a result of the participatory selection process, a number of relevant technologies that mitigate GHG emissions should be identified. These should target the largest emission sources from the agrifood sector in the country. The technologies should not be so many as to make the analysis too burdensome or too expensive, nor so few as to possibly exclude technologies which may have potential to contribute to GHG emissions reduction. Finding this balance that the participatory work conducted for the selection of technologies is of paramount importance.
23 An example of this innovative and water saving technology is http://www.precisionirrigation.co.nz/
Assessing the potential of each climate technology to reduce GHG emissions
The key principles for assessing the adoption, market penetration or future deployment of climate technologies/practices in any given country require an analysis of both their specific characteristics and the influence of the external environment on the results they might produce. It is not always evident how to define potential and therefore it can be difficult to measure. Depending on the constraints that are considered in the analysis the estimated potential for future technology deployment can largely differ. Literature on climate technology and RE sources provides some examples of the parameters that can be used to define different types of potential (see e.g. Ecofys, 2008). This methodology proposes a simple approach, considering three large types of potential:
• Theoretical potential: The highest level of
potential, which only takes into account
natural and climatic restrictions;
• Technical potential: The second level of
potential, reduced due to technical limitations
such as energy conversion efficiencies or land
use restrictions (e.g. solar panels should not
be installed in a natural park with valuable
biodiversity); and
• Economic potential: The most restricted
potential, constrained by demand, policy
and regulatory environments and competing
technologies (costs levels must be
competitive).
As an example, the theoretical potential of wind energy would be constrained by the area available for the installation of wind turbines. The technical potential of wind energy can be defined as the total number and scale of wind turbines that could be installed in areas of good mean annual wind speeds and that do not face constraints such as proximity to houses or forests, or prohibitively high losses in the conversion process (Ecofys, 2008). The economic potential of wind would be calculated using: (i) projected electricity demand; (ii) projected demand of competing forms of electricity generation such as hydro or solar; (iii) power generated per turbine based on mean annual wind speeds (to estimate the value of generated energy); (iv) energy

18
conveyance losses; (v) connection costs; and (vi) the costs of integration into an existing network, e.g. installation and operation. In addition, the likelihood of receiving planning consent and the existence of supportive policies (e.g. the possibility of selling excess production) need to be confirmed in advance. In sum, the economic potential is the total number and scale of wind turbines that can be installed with an adequate economic return.
Beyond these factors, external conditions that could influence how a climate technology is adopted and therefore the scale of its impact in the agrifood sector include:
• barriers and incentives associated with
national regulations;
• the availability and suitability of public or
private financing;
• the existence of technology supply chains
and associated services such as equipment
maintenance and training of installers and
operators; or
• required natural and human resources or raw
material availability for the operation of the
technology.
Hence, the assessment of the adoption, market penetration and/or future deployment of climate technologies/practices in a country is not straightforward. This guide proposes that it is based on a multi-criteria analysis. This multi-criteria analysis (MCA) is the main focus of Steps 2 and 3 of this methodology: Step 2 is dedicated to a techno-economic analysis whereas Step 3 assesses different dimensions of each technology’s environmental and social sustainability. In Step 2 technologies are assessed on the basis of:
(i) technical performance and potential for
adoption/deployment;
(ii) market potential and adoption trends; and
(iii) financial and economic attractiveness
(excluding GHG mitigation benefits and other
difficult to quantify externalities).
The following sections justify the selection of these three main aspects of analysis in Step 2 and propose a methodology to assess them.
Multi-criteria analysis of climate technologies in the agrifood sector
The choice of the most suitable climate technologies/practices to contribute to the mitigation of significant GHG emissions in a country’s agrifood chain as identified in Step 1 depends on several criteria.
An MCA is one option to evaluate different potential investments in climate technologies/systems. The MCA approach has a number of positive aspects as it enables an assessment of technical performance measures, socio-economic costs, and co-benefits as well as the participation of local stakeholders when prioritising mitigation efforts (Beria et al., 2012). It is designed to compare a mitigation option to a reference case or a set of alternative measures, primarily ex ante. It can also accommodate a range of measures that are difficult to quantify or monetise while allowing for the integration of a cost-benefit analysis (CBA) where sufficient data are available.
The MCA method involves developing a set of criteria, both qualitative and quantitative, by which the range of mitigation technologies, systems and practices can be assessed and compared for their mitigation potential. Each criterion is given a score and then assigned a weighting value to reflect the relative importance of it in the specific country in question (Browne and Ryan, 2011). The scores can be based on the opinion of several experts (an approach that limits the amount of work required). Weights can also be assigned to the criteria through a participatory process.
There are various approaches to assigning the weights and combining the scores but, as in the approach used here, based on the normalised performance scores and the weights, a final overall value is obtained for each alternative measure that reflects its techno-economic performance.
This relatively simple weighting procedure allows for stakeholder participation without significant effort. However, such processes can be resource intensive and, being subjective, may negatively affect the results with individual preferences varying depending on whether the weighting is conducted in a group setting or in isolation (Wang et al., 2009). When experts work in a group, they may change their preferences based on exchange of information, rational reflection and social learning, although the weighting process can force consensus even though some participants might be hesitant to reveal their true preferences (Garmendia and Gamboa, 2012). Hence, an MCA-based report should be clear that its results are not the only possible outcome from the analysis. The outcome should be compared with results obtained through alternative weightings for each criterion and complemented by a description

Adoption of climate technologies in the agrifood sector - Methodology
19
of where the criteria score differently for the different technologies on other scales.
Whenever data and resources are available to conduct a CBA, this can be a useful complementary tool as it quantifies net benefits and reduces the subjectivity of the assessment. This does not mean that a CBA could always entirely replace an MCA, as the quantitative analysis often fails to adequately include wider socio-economic impacts that are difficult to quantify in a meaningful manner, or for which data are scarce or unavailable. It also tends to reduce results to a handful of economic indicators that might tell an incomplete story about the technology.
As explained before, in the approach proposed in this methodology, the range of available technologies/practices is initially screened against the most “critical” emitting agrifood activities in the country to determine which may be more relevant. Thus, for example, as shown in columns 1 and 2 of Table 2, if energy in food processing was identified in Step 1 as a priority area for emission reductions, then depending on the
main food commodities produced in the country, the technologies/practices to concentrate on would be solar drying; cold storage; biogas; and renewable energy systems. As a large number of technologies/practices are available for reducing emissions throughout the agrifood chain, but not all of them will be suitable for or easy to deploy in any specific context, it is useful to rank them.
For the example shown in Table 2, if the agrifood activity of most concern as identified in Step 1 was energy use on-farm, then as shown in column 2, the climate practices of minimum soil disturbance (under conservation agriculture), efficient field machinery, drip irrigation, solar/wind-powered water pumping, innovative greenhouse technologies, biogas, and renewable energy systems could all be deployed in order to reduce the related GHG emissions24.
24 These are examples of options that could initially be deemed adequate for a given context. They do not compose a comprehensive list of all possible technologies to reduce on-farm energy use in all environments
Table 2: Example of the technology/practice prioritisation process in an MCA for energy use on-farm
technical assessment Market assessment economic assessment data availability
Climate technologies and practices
Performance compared to international best practice
Maturity of technical support
services
Potential to reduce
annual national
GHG emissions
Current technology
adoption rate
Trends in gap
between technology uptake and
technical potential
Financial attractiveness
Mitigation cost
Total score based on weights
Weights 10% 10% 15% 10% 15% 15% 20% 5%
Conservation agriculture*
* *** * ** ** * ** * 1.75
Efficient field machinery
* *** * * ** ** ** * 1.80
Drip irrigation ** *** * *** *** * *** ** 2.35
Solar/wind-powered water pumping
** *** * ** ** ** ** * 2.00
Innovative** greenhouse technologies
** ** * * ** ** * * 1.55
Biogas from manure, wastewater or agrifood residues***
* *** ** ** *** ** ** * 2.15
Renewable energy systems****
** ** *** * ** ** ** * 1.95
Source: FAO, 2016.
Note: Technology also reduces GHG emissions from: * rice cultivation, synthetic fertilizers, manure applied to soils, manure management; ** synthetic fertilizers, cultivation of organic soils, *** manure management, manure left on pasture, crop residues, energy in food processing; **** energy in food processing.
20
In order to then prioritise these 7 technologies/practices, a 1 to 3 star classification is assigned to each criterion used to assess the technologies. Each criterion is evaluated as objectively as possible (the proposed methodology is presented later in the study), but it is useful to have a panel of experts to agree on the classification. Each criterion is given a specific weight (the total adding up to 100 percent), which is taken into account when calculating the final ranking25. The weighting system given in Table 2 is recommended (it was also adopted for the Morocco pilot study); however it can be adjusted by each group of analysts for each context.
In the energy use on-farm example, the star ratings (1, 2 or 3) multiplied by the weights (e.g. 20 percent, 15 percent), result in the technology drip irrigation being ranked highest with a total score of 2.35 followed by biogas, scoring 2.15. The application of this scoring system suggests that highest consideration should be given mainly to these technologies to reduce GHG emissions from on-farm energy use, as they have the best techno-economic performance (other sustainability and policy issues are still to be assessed). Solar/wind-powered water pumping, renewable energy and efficient field machinery practices could also be considered as good opportunities but with lower techno-economic performance because they have a smaller GHG emission reduction theoretical potential or because they are more difficult to deploy at a large scale (e.g. low financial attractiveness to adopters or lack of support services in the country).
Completing such a multi-criteria analysis for a specific context may require ad-hoc research to be undertaken as well as gathering expert opinion where data is scarce or non-existent. Expert opinion may also be paramount beyond the ranking of technologies, when this ranking does not reflect exactly the potential of a technology in a certain context. For example, if one conducts the ranking process in the Kingdom of Jordan it may suggest that investors and policymakers bet on drip irrigation technologies (as they can save energy and thus cut emissions, are financially attractive, and the country has state of the art technology available and excellent support services). However, in the Kingdom of Jordan the gap between the current uptake and the potential market saturation level would only receive one star because drip irrigation has already reached 90 percent of its adoption potential and this can also lead experts to advise the government not to put any further resources into supporting this technology.
25 For each criteria, the number of stars times the percentage weight are added to provide a total score
Technical assessment
For the MCA, the three technical indicators proposed are:
(i) performance compared to international best
practice;
(ii) maturity of technical support services; and
(iii) potential to reduce annual national GHG
emissions.
Performance compared to international best practiceThis indicator gives a qualitative assessment of the availability and technological advancement of a technology/practice in a given country, comparing it with the “international best available technology”. It provides information on the environmental efficiency of the technology available in the country compares with the best available options worldwide.
Assessing if a certain technology corresponds to international best practice is based on benchmarking, or identifying the best possible performing technology/practice and seeing whether it is present or can be implemented in the country26. For example, the European Council’s Directive 2008/1/EC on integrated pollution prevention and control defines the “best available techniques” (BAT) for energy efficiency as “the most effective and advanced stage in the development of activities and their methods of operation which indicate the practical suitability of particular techniques for providing in principle the basis for emission limit values designed to prevent and, where that is not practicable, generally to reduce emissions and the impact on the environment as a whole”(European Parliament and Council, 2008: 4). It further defines:
• techniques: includes both the technology
used and the way in which the installation
is designed, built, maintained, operated and
decommissioned;
• available: those developed on a scale that
allows implementation in the relevant
industrial sector, under economically and
technically viable conditions, taking into
consideration the costs and advantages,
whether or not the techniques are used
or produced inside the Member State in
question, as long as they are reasonably
accessible to the operator; and
26 For a definition of best practice, see for instance: Bogan, C.E. and English, M.J., Best Practices, LLC (1994). Benchmarking for Best Practices: Winning Through Innovative Adaptation. New York: McGraw-Hill

Adoption of climate technologies in the agrifood sector - Methodology
21
• best: most effective in performing its
functions (e.g. fast and precise seed
distribution in a seeder) or in achieving a high
general level of protection of the environment
as a whole.
These definitions can be extended to technologies and practices to reduce emissions from agriculture for the purposes of this assessment.
In the context of the MCA proposed here, the definition of “best” is based on the GHG mitigation performance of the available technology against the specific functions for which it was designed. This does not mean that other performance parameters related to their functions and protection of the environment as a whole should not be considered.
For instance, in a given market, if a modern and efficient renewable energy technology to reduce emissions is not locally available, or it is available at a very high price, the indicator would score low. If the technology/practice is economically and technically available in the country, then it would score high.
A specific example is provided by biogas technologies for wastewater treatment. Depending on the system, the same biogas production from the same given feedstock can result in similar GHG emissions but different quality standards of the final effluent (e.g. in terms of concentrations of oxygen demand, suspended solids, pH and temperature). In such case, the quality of effluents could be assessed against international benchmarks to determine if we are in the range of international best practices and the technology with the best environmental impact would score higher.
Insofar as possible the comparison to international best practice should build on national data and actual experience on the characteristics and performance of the technology, particularly with regards to the reduction of GHG emissions. This can also be complemented with technical experts’ judgements.
As this is the first criterion to be assessed, its dedicated section should provide a clear, even succinct, definition and description of the technology that frames the whole assessment and provides sufficient information for comparison with other technologies.
Maturity of technical support servicesThe potential for adoption of a technology is very much related to the quality and availability of support services in the country. As such, judging whether a technology effectively reduces GHG emissions on a large scale means knowing whether or not technical support services are widespread and efficient and whether the
technical knowledge is common or simple enough so that most operators can use the technology to its full potential.
Let’s take for example the use of improved cattle diets as a means to achieve a reduction in emissions derived from enteric fermentation. It is possible that in many countries, knowledge on how to change diets (and possibly breed) to minimise emissions from enteric fermentation is held by researchers and a few specialised extension workers. In many cases, however, farmers and technical support staff may not be acquainted with such practices or with their implications in terms of cost changes or productivity. As a result, there would be a certain degree of technical support services and knowledge of the technology in the country, but it could not be said that technical support services are widespread and efficient and the degree of technical knowledge is such that most operators can use the technology to its full potential. The technology would thus be classified with two stars (see Table 3 on the scoring of indicators).
A similar situation can occur with solar-powered pumps, which require different maintenance skills from those required by conventional pumps. Service providers may be present in certain areas, but their network may not reach remote or sparsely populated rural areas.
Potential to reduce annual national GHG emissionsThis indicator provides a quantitative assessment of how much adopting a technology/practice might contribute to reducing annual GHG emissions in a given country. The mitigation potential of a technology/practice can be measured as the potential reduction in specific emissions compared to business as usual (Schlömer et al., 2014). Estimating this can take different approaches depending on what is possible with the available data and resources, but the assessment of the technical potential might generally be a good compromise between accuracy and cost of estimation.
The information on national annual GHG emissions by primary agricultural activity gives a preliminary insight into the potential contribution that a specific technology/practice can have in a country to reduce GHG emissions. After calculating the abatement potential (Enkvist et al., 2007), it is possible to estimate the range of percentage reduction in emission from that technology/practice. For instance, in Morocco, emissions from enteric fermentation are responsible for about 25 percent of total GHG agricultural production emissions (Figure 5). An intervention that halves emissions from enteric fermentation would therefore reduce total annual Moroccan GHG emissions from agriculture by about 12 percent.

22
In the case of renewable energy, it may not be feasible to assess the total available area with the right conditions for solar photovoltaic panels, but if the country has abundant swathes of cheap unused land (e.g. desert) and sunlight, the estimation of the total potential might be based on the total market size for electricity in the country or region. This could be considered to be the technical potential to reduce emissions, as the first conditioning factor for growth is the capacity to substitute energy generated by GHG emitting sources. This type of estimate does not take into consideration economic feasibility limitations or existing policy measures and therefore should not be confused with an estimate of economic potential (see Figure 9).
In the case of biogas, its potential may be reasonably easily estimated through the availability and characteristics of feedstock, but assessing the amount of feedstock that can be efficiently mobilised can prove to be more difficult. The analyst will be faced with several options to estimate GHG emissions potential and should strive to find a compromise between accuracy and cost of estimation – and above all, be clear in the definition of potential (including assumptions and data used for its estimation) and coherent in the estimations amongst the different technologies/practices. In addition, the estimated potential to reduce annual national GHG emissions must be coherent with the potential for technology
adoption in the country as assessed for the criterion current technology adoption rate.
Several tools and databases can help estimate the potential to reduce annual national GHG emissions,27 and others more specifically measure GHG emissions from energy use in food processing (some of them are presented in Sims et al., 2015). Preference should be given to tools that are compliant with the IPCC 2006 Guidelines for National GHG Inventories.28 National communications on GHG emissions submitted to the IPCC contain an emissions inventory that, depending on the degree of disaggregation, can provide information on the baseline. Intended Nationally Determined Contributions (INDCs) can also provide information on targets and potential for some technologies to contribute to emission reduction.
Although these two sources of information must be reviewed in order to undertake the assessment, they rarely provide information on the GHG mitigation potential of a specific climate technology. For instance, when assessing potential to reduce GHG emissions through a shift from traditional to conservation agriculture, inventories will in most cases only provide data on emissions from land use change and
27 A collation of these tools applicable to agriculture and land use is available at http://www.fao.org/tc/exact/review-of-ghg-tools-in-agriculture/en/
28 See http://www.ipcc-nggip.iges.or.jp/public/2006gl/
Table 3: Scoring guidelines for technical criteria
criterion score * ** ***
technical criteria
Performance compared with international best practice
The most efficient technology is not available.
The most efficient technology is available but costly
The most efficient technology is commonly available
Maturity of technical support services
Technical support services do not exist or are at a very early stage and cannot support the uptake of the new technology/practice; and the degree of technical knowledge is at very early stage. The majority of operators do not know how to use the technology
Technical support services exist but are not fully widespread and/or not fully efficient. In particular, they are not able to support the diffusion of the technology. The degree of technical knowledge is still at an early to intermediate stage with many operators not able to use the technology to its full potential
Technical support services are widespread and efficient; and the degree of technical knowledge is such that most operators can use the technology to its full potential
Potential to reduce annual GHG emissionsi
The technology/practice capacity to reduce annual national GHG emissions by agricultural sector is less than 3 percent
The technology/practice capacity to reduce annual national GHG emissions by agricultural sector is between 3 percent and 10 percent
The technology/practice capacity to reduce annual national GHG emissions by agricultural sector is more than 10 percent
Source: Authors. i For this indicator the range can be adapted case by case. For example, once the potential to reduce annual GHG emissions has been estimated for all the technologies under assessment for one country, the thresholds might be chosen to leave 50 percent in the centre (two stars) and 25 percent in each of the extreme scores (one and three stars). In all cases, it is important to consider that the definition of the thresholds should depend on the distribution of the different potentials. For example, if all potentials are reasonably close to the median, but there are one or two technologies that are clear outliers, the analyst may choose to attribute one or three stars only to the outliers.

Adoption of climate technologies in the agrifood sector - Methodology
23
energy use, but will not inform on how no tillage systems and minimal soil disturbance can contribute to reduced emissions. Similarly, GHG inventories and national communications tend to contain aggregated information on emissions from enteric fermentation, but do not disaggregate the emissions per type of diet or breed as to assess the potential of changing livestock diets and breeds in reducing the country’s GHG emissions. Hence, specific data sources and tools will be required in each case. Some examples are given below.
For emissions from livestock: Emissions from livestock, namely enteric fermentation, manure management and manure left on pasture are difficult to deal with as they depend on many possible variables and approaches in the specialised literature. FAO has developed an MS Excel-based tool, GLEAM-i, to assist in estimating GHG emissions for the main livestock species in different environments and under alternative breeding practices, which may be useful to assess the potential to reduce annual national GHG emissions of technologies applicable to livestock. GLEAM-i follows Tier 2 IPCC guidelines and therefore requires a considerable amount of data. The tool provides baseline data mostly from FAOSTAT, but for more accurate results users should search for specific information on targeted production systems.
For emissions related to land use change: Although this methodology does not focus specifically on the reduction of emissions from land use change (see Step 1), some technologies that address practices such as energy use (e.g. conservation agriculture) or enteric fermentation (e.g. grazing management),
may have important implications for land use that have to be assessed. FAO has developed an MS Excel-based tool, Ex-Act, to assist in estimating GHG emissions for alternative land uses in different environments and soils. The tool follows Tier 1 or Tier 2 IPCC guidelines depending on the available data for input.
For emissions related to energy use: Many countries will have data available on energy consumption by subsector or activity. Local experts will also know how to estimate the main energy sources used in each subsector or activity (e.g. fuel oil in boilers or grid electricity in cold storage). GHG emissions can be obtained by multiplying the average country emission factor for each source of energy by the quantity of energy used by the subsector/activity and the amount saved with the adoption of the climate technology. Emission factors can usually be found from IEA, IPCC guidelines for national greenhouse gas inventories, or national greenhouse inventories.
FAOSTAT provides IPCC Tier 1 estimates of emission for the main sources of emissions in agriculture and livestock and can be a valuable resource if specific studies for the country or region and applicable practices do not exist.
Market assessment
For the MCA, the following two market-related indicators are used:
(i) current technology adoption rate; and
(ii) trends in gap between technology uptake and
technical potential.
Figure 9: Global market trend for solar water heaters, 2000-2013
0
50
100
150
200
250
300
2000 2001 2002 2003 2004 2005 2006 2007 2008 2009 2010 2011 2012
Glazed collectors Unglazed collectors World total
Source: REN21, 2014.

24
These two indicators provide information on the scale and technical potential of the market to absorb each technology. If the technology is mature, such as solar water heaters or cold storage facilities, historical trends on adoption can be used to infer future potential. Figure 9 shows global trends on the adoption of solar water heaters in terms of capacity. Similar national and regional trends are often available through statistical offices, industry associations, etc. Extrapolations of such trends together with information on total market size can provide an indication of future market potential.
It is usually not possible for a country to assess trends for each of the priority technologies. Data may not be available, either because they have never been produced or because the technology is at an early deployment stage. If the technology/practice is at the demonstration or early commercialisation stage, then assessing the market potential is more challenging since little information is available upon which to base projections. If the stage of development is known, then it should be possible to extrapolate future market penetration using specific models on the basis of cost information (Packey, 1993). However, this methodology aims at allowing a simple and rapid assessment; and in most cases, even when data have been systematically collected over several years, it might not be efficient to evaluate the expected market penetration of a set of climate technologies/practices based on complex models. Together,
the MCA and the specific market indicators for the two criteria proposed in this methodology, aim to provide a practical alternative to assess market penetration that does not require complex classic models.
Current technology adoption rateCurrent technology adoption rate is the ratio of current market size (or total adoption potential) to current market penetration (or current adoption).
Market size can be given in terms of demand and supply, measured by the number of buyers and sellers in a particular market; or in terms of total exchange of money in the market. However, for the purpose of this methodology it is defined as the number of possible adopters of a technology or practice, or as a measure of the total potential for adoption. For instance, the market size of conservation agriculture could be measured as the maximum number of hectares where the practice could be deployed; while for manure management it could be the volume of manure managed in the country or the number of livestock units for which the manure is managed.
Market penetration can be defined both as a measure or a strategy. A business utilises a market penetration strategy to attempt to enter a new market in order to increase its market share. For the purpose of this study, market penetration is a measure of the current adoption of a technology or practice, measured in the same units as its market size. For instance, the
Table 4: Possible indicators to measure current technology adoption rate
type of technology Potential indicators for different technologies/practices
Change in agricultural practice/technology
Example:
• Number of hectares of land that uses drip irrigation over the total irrigated land that has the potential for drip irrigation*
• Area cultivated with minimum tillage over total arable land
Change in practice/technology related to livestock
Example:
• Number of hectares under improved grazing management over total area of degraded rangeland (appropriate as a land use change indicator)
• Number of livestock units benefiting from improved grazing management over total number of livestock units in free grazing systems (appropriate as an indicator for reducing emissions from enteric fermentation)
• Quantity of manure managed under improved practices over the quantity of managed manure in the country
Change in technology that affects energy use
Example:
• Number of solar boilers over the total number of boilers
• Energy consumption of solar boilers over total boilers’ energy consumption
• Number of most efficient tractors over the number of total tractors
• Volume of insulated cold storage according to international best practices over the total volume of cold storage
Source: Authors’ examples based on the experience from a pilot application of the methodology in Morocco (FAO, 2016).
*See footnote on irrigated land that can potentially use drip irrigation (suitable land).

Adoption of climate technologies in the agrifood sector - Methodology
25
number of hectares already under conservation agriculture or the quantity of manure currently being managed under improved practices.
The choice on how this indicator is measured will largely depend on data availability and reliability. Nevertheless, its choice should be coherent with and contribute to the assessment of three other directly related criteria, GHG emission reduction potential, trends in gap between current technology uptake and technical potential, and cost of mitigation.
A specific example of a market analysis is the potential for drip and overhead sprinkler irrigation systems in India (Chakrawal, 2010). These are both mature technologies that are suitable for a large number of farms. However, an analysis on the total area of cropped land suitable for either sprinkler or drip irrigation shows that less than 10 percent of suitable land29 is irrigated using these systems (current technology adoption rate of 10 percent) (Figure 10). Hence the market potential for further deployment is significant. As a result, the questions that arise from a government’s point of view are:
29 Suitability for drip irrigation should be defined in each case. A good example of the meaning of “suitable land” for drip irrigation is all land with water quality, topography, soil salinity, etc. that technically allows the use of drip irrigation. This definition of land suitability would correspond to the technical potential of drip irrigation as it would not consider, for instance, the economic feasibility of changing cropping systems when necessary (e.g. cereal cropped land)
• What would be the benefits of encouraging
more irrigation, or the negative externalities
associated with scaling up its use? A question
to be answered during Step 3; and
• Why has less than 10 percent of total suitable
land been installed with drip irrigation
systems? What are the barriers to further
deployment (such as lack of finance)? What
policies could help overcome these barriers?
These are questions to be explored further in
this step, but mostly in Step 4.
Trends in the gap between technology uptake and technical potentialTo measure this criterion, the gap between the two indicators used for the previous criteria – market penetration (technology uptake) and market size (technical potential) – should be plotted on a graph for the period of time for which there are available data.
In some cases, although there are data on current market size and adoption there are no data on past trends. In this case, the analysts might need to refer to a proxy indicator: for example, in the case of improved breeds and diets in dairy cattle in Morocco, there are official estimates of how many animals of each breed currently exist. It is then possible to calculate the ratio between pure (GHG efficient) dairy breeds and total dairy cows in the country to estimate the current technology adoption rate. However, there are no data on these indicators for the past 10 or 20 years. One imperfect, but possible,
Figure 10: Irrigation potential in India based on a study of suitable cropping land and crops grown
0
100
200
Total croppedarea and area
already irrigated
Area suitablefor sprinkler and area
already covered
Area suitablefor drip and areaalready covered
176.9
65.0
42.5
3.35
27.9
2.22
Mill
ion
hect
ares
Source: Based on Chakrawal, 2010.

26
Box 2: Approaching a cost-benefit analysis and estimate financial returns of selected agrifood technologies/practices
The first step in the construction of the CBA is to undertake a complete estimate of the incremental costs and benefits triggered by the introduction of a technology or practice for the period of analysis. These costs and benefits will usually first be estimated for a chosen unit of analysis. For example:
Drip irrigation system – Costs and benefits need to be determined for one surface unit (usually one hectare) of each crop and cropping system before and after the introduction of the technology (e.g. rainfed wheat, flood irrigated alfalfa, and flood irrigated potato vs. drip irrigated tomato, melon and pepper). The detail of the costs and benefits of one surface unit of a crop under a given production system is usually denominated by the crop budget.
Field machinery and equipment with impact on the cropping system – The improvement of field machinery (e.g. substitution of a traditional seeder by a direct seeder) will probably change the cropping system in terms of costs and benefits (yields). If the changes are limited to one or two variables (e.g. savings in seeds and fertilizers or incremental costs in herbicide), the change in net benefits can be easily computed for a surface unit. If the changes in cropping systems are large (e.g. installation of a greenhouse on formerly open air cultivated land), crop budgets for the situations before and after the introduction of the technology need to be produced.
Field machinery and equipment without an impact on the cropping system – This is the case, for example, of the purchase of a more efficient tractor. In such a case the introduced change is translated in terms of benefits from savings in diesel consumption by worked hour. The unit of analysis might not be the hectare, but the hour of tractor work, for which average diesel savings due to the introduction of the technology are estimated.
In the case of industrial technologies such as cold storage efficiency improvement, the benefits may be more easily translated in terms of the volume of cold storage (this will largely depend on data availability). For example, improved insulation will reduce energy consumption by x kWh/m3 of storage.
For a new industry such as a biogas producing plant – New industrial plants are usually better assessed as a unit. Analysts should provide information on yearly costs and benefits for the whole plant. When estimating recurrent costs (non-investment costs) of an industrial plant, it is of paramount importance to differentiate between variable (dependent on the level of production) and fixed (independent from the level of production in the short term) costs so as to estimate results for scenarios of different levels of capacity utilisation.
The second step is to aggregate the costs and benefits in models of production units. In the case of drip irrigation, it can be a farm model. Farm models will differ in their cropping patterns before and after the introduction of drip irrigation, i.e. different farm models will have different surfaces of each crop being harvest each year, both before and after the introduction of the new technology. Farm models are therefore composed of a number of crop budgets, for which costs and benefits are multiplied by the total area of land each crop occupies in a given year. Farm models should be representative, or at least illustrative, of the different realities of the regions in which the technology will be deployed. They can also be used for sensitivity analysis by changing key parameters in the analysis. For field machinery, the estimated costs and benefits should also be multiplied by the area a specific equipment will be covering or the number of hours it will be working. The volume of costs and benefits will thus depend on the level of utilisation that is expected for each machine. For cold storage, the energy savings can be multiplied by the number of typical cold storage equipment in the country.
As third step the incremental (“with technology” minus “without technology”) aggregated costs and benefits estimated for each model per year should be distributed in a yearly cash flow30. To this cash flow should be added general costs (e.g. equipment maintenance, or technical support services) and investment costs (e.g. purchase and installation of the drip irrigation system) to obtain an early net cash flow. At this point, all other financial flows that might exist should also be added to the cash flow, including subsidies, taxes, irrigation fees, etc. as the objective is to assess the financial attractiveness of the technology to the investor, and therefore her or his cash flow. The period of analysis will largely depend on the characteristics of the investment. Mature technologies that are not expected to lose competitiveness in the short to medium term and/or produce benefits in the long term (e.g. improved rangeland management) may justify longer periods of analysis. Investments that might see strong competition from alternative technologies (e.g. biogas production) or that have shorter economic lifespans (e.g. boilers) should have shorter periods of analysis.
(Cont.)

Adoption of climate technologies in the agrifood sector - Methodology
27
alternative is to use FAOSTAT data to plot the past trends of milk production and of enteric fermentation from dairy cows in Morocco. As milk production is steadily increasing and enteric fermentation has remained virtually constant over the past 20 years, one can assume that the gap between technology uptake (number of cows from GHG efficient breeds) and technical potential (total number of cows) has been steadily closing during the last 20 years.
Regardless of the indicator that is chosen, if the current gap is large and has been increasing recently, there may be a high potential to deploy the technology on a large scale. The same can be assumed if the technology is new or has not yet been adopted in the country. On the contrary, if the gap is small and stable or reducing over time, it indicates that soon there will be few possibilities for further deployment of the technology and therefore for its use as a significant contributor to GHG emission reduction.
Such a simple analysis cannot be absolutely conclusive. In some cases, expert opinions on future trends need to be incorporated into the analysis before the attribution of a final score. For example, if the area under cereal crops is deemed to reduce in the medium term with a corresponding increase of the area under vegetable crops, the area where direct seeding can potentially be adopted is smaller than the area currently occupied
30 A complete CBA would include, inter alia, monthly cash flows at least for the first years to estimate working capital needs and respective interest payments. However, as this methodology proposes a rapid assessment of technologies, the construction of monthly cash flows is left as optional
31 For more information, see FAO definitions: http://www.fao.org/docrep/w4343e/w4343e07.htm
by cereals. The analysis is nevertheless always complemented by the assessment of existing barriers to and opportunities for adoption in Step 4.
Economic assessment
For the MCA, the following two indicators related to economic performance are used:
(i) financial attractiveness; and
(ii) mitigation cost.
The two criteria were selected as they confer enough flexibility to the methodology in terms of time spent and required resources (data, expertise, etc.) and at the same time they are capable of providing key information about the main elements that render the adoption of a technology attractive to the country’s stakeholders: (i) the financial return to the user/investor; and (ii) the costs that are borne by the country in order to reduce emissions by 1 tonne of CO2eq.
The indicators to be chosen for each criteria should produce results that are comparable between technologies. The sections below provide some suggestions on the methodological approach for computing indicators of financial and economic attractiveness.
Financial attractivenessFor financial attractiveness, the most commonly used indicators are the minimum required investment, the investment net present value
Estimate of financial returns
Once the cash flow is complete, the analyst can estimate the indicators suggested above. As in the formula shown below, net present value (NPV) is the sum of all the discounted future cash flows, where t is the year of the cash flow, i the discount rate (see Box 3) and N the period of analysis (in years). The internal rate of return (IRR) is the rate at which NPV is zero.
Hence, the NPV and IRR are closely related indicators as both are time-adjusted measures of profitability, their mathematical formulas are almost identical, and they are based on the same set of data31. If the IRR exceeds cost of capital (discount rate), the project is worthwhile and the NPV is positive.
Payback time measures the time required for the net cash inflows to equal the original capital outlay. It is the number of years necessary to recover the investment through the annual cost savings/incremental benefits that result from that investment. The simple payback time (non-discounted) can be expressed as:
Where SPB is the minimum number of years required for the non-discounted sum of annual savings to equal the non-discounted incremental investment cost; ΔK is all of the incremental investment costs; and ΔS is the sum value of the annual benefits net of annual costs. The payback time can also be calculated for a discounted stream of annual net benefits.

28
(NPV)32 and internal rate of return (IRR), the benefit-cost ratio33 and the investment payback period. As they all require approximately the same data set for their estimation and are the product of a CBA, they can all be produced simultaneously. This criterion relies on the IRR or, alternatively, the investment payback period as indicators.
The IRR is in some regards a poorer indication than the NPV in terms of information since, for example, a high IRR can be linked to a very small absolute return in money terms (and in that case also to a very small investment) – e.g. signal a preference over a return of 500 percent to USD 1 rather than over 20 percent return on USD 100. The IRR can also be impossible to estimate when projects have two periods of negative cash flow. However, the IRR is an easy-to-interpret indicator, widely used by investment analysts, and it can be a more adequate indicator then the NPV when choosing amongst a set of non-mutually exclusive investments for which there is limited investment capital availability. In such a case, the rational investor will choose a set of investments starting with those with the highest IRR, until the maximum investment capacity is reached (provided risk, inclusion or exclusion of externalities and of transaction costs in the IRR estimate are comparable). Although it does not provide information on returns, the payback period, is an appreciated and sometimes preferred indicator by many investors when
32 The NPV, an absolute measure, provides information about the scale of the returns of the investment in each technology. Faced with the choice between mutually exclusive investments (e.g. different irrigation technologies), the rational investor will choose the one with the largest NPV (provided the risk is the same and there are no constraints to investment, such as capital availability). Its value depends on the scale of the investment and this may vary from one case to the other (e.g. from a farmer with a larger number of animals to a farmer with a smaller number, or from one technology to the other)
33 The benefit-cost ratio is also often seen by the investor as a measure of risk. The higher the ratio, the safer the investor is in case the assumptions made for its estimates do not verify. However, the risk of the investment is better assessed through a sensitivity analysis of the main variables
making decisions. As a rule of thumb, a short payback period means a high NPV, or, if the investment is small, at least a high return. It also gives indication of a rather small risk and availability of capital for further investments (new opportunities) in the short term.
The IRR allows an easy establishment of ranges for the three scores: one star for technologies with an IRR below the discount rate (see Box 3), three stars for clearly positive outliers and two stars for the remaining.
Adjustments to the score – i.e. attributing a different number of stars than defined by the selected IRR ranges – can be made for technologies that for example show a high sensitivity to some variables or that imply investments of a size that can hardly be matched by the average potential investor. In the case of drip irrigation in Morocco (Berrada, 2009), there are positive returns, but it is a technology that in the absence of generous subsidies only reaches farmers with sizeable available capital and/or access to credit.
The paragraphs below summarise the steps to the construction of a CBA that allow the estimation of these indicators for selected agrifood technologies/practices. More detailed guidance can be found extensively in the literature.34
Once the indicators have been calculated, it is important to conduct a sensitivity analysis for the most uncertain variables (both costs and benefits). The analysis should then report the range of IRR (and NPV) produced and comment on the results based on the reliability of the empirical data used in the models and the sensitivity of the results to specific parameters. The analysis will thus provide insights into the financial attractiveness of the technology for the investor and into the risk (or
34 A classical guide to CBA in agriculture is Gittinger (1982). Other examples are Bello et al. (1998) for general investment operations; Livermore et al. (2013) and Pearce et al. (2006) focus on the use of cost-benefit analysis for environmental policy decision making
Table 5: Suggestion for the attribution of the three star rankings to the market criteria
criterion score * ** ***
Market criteria
Current technology adoption rate
Technology market penetration or adoption of the practice is high, leaving little space for improvement.
The market for the technology or adoption of the practice is mature but there is still space for marginal improvements and small increases (possibly with reduced risk and limited profit).
The technology is in a growing phase but market share is still much reduced. Few innovators have adopted the practice.
Trends in gap between current technology uptake and technical potential
The gap is small and stable or reducing over time.
Relevant but reducing over time.
The gap is large and has been increasing in recent times.
Source: Authors’ compilation.

Adoption of climate technologies in the agrifood sector - Methodology
29
uncertainty) that is inherent to the investment. The analysis of costs and, in particular, the initial investment and working capital needs will provide important insights into the capital requirements and a first suggestion as to whether credit constraints will impede the adoption of a specific technology. The report should therefore be clear on the size of the required investment for each technology and discuss how accessible this may be to the average investor in the country/sector. Additionally, if relevant, different scenarios (and results) should be produced for situations with and without subsidies or with and without tax breaks
in order to illustrate the influence policies may have on the investors’ decision making process.
Mitigation costThe mitigation cost estimate for a technology or practice in terms of USD/tCO2eq avoided allows for an easy and quick comparison of technologies in terms of net cost/GHG emission reduction benefits. The approaches to methodologies that estimate mitigation costs vary significantly in the
Box 3: Elements in choosing a discount rate
The choice of a discount rate to apply to investments in key sustainable climate technology in the agrifood sector is not a straightforward one. In general, a discount rate should translate to the cost of capital, i.e. the opportunity cost of all the invested capital. Hence the average cost of capital is a function of debt and equity capital costs on the market as well as of the risk that is specific to each investment, i.e. the cost of capital for a particular investment depends on the interest rate on debt (after taxes) applicable to each particular investor and investment and on the cost of opportunity of the capital applied by the investor, calculated as the return on equity market time (a factor that expresses the risk of that particular investment vis-à-vis that of the market).
This is hardly a simple approach for the choice of discount rates for a plethora of technologies that imply different levels of risk and that target investors with different levels of access to capital and capital structures.
As an alternative, the cost of capital can be extrapolated from different sources. Such an approach is illustrated below for the case of Morocco:
• the government bond coupon in 2012 was around 4.5-5.5 percent (World Bank, 2015a; Cbonds, 2012);
• commercial lending interest rates in 2015 were between 5 and 7 percent (Morocco’s Central Bank: Bank al-Maghrib, 2016);
• the central bank’s official interest rate until late 2014 was 3 percent, and it is currently 2.5 percent (Bank al-Maghrib, 2016);
• the interest rate average spread (between loans and deposits) in 2014 was 4.1 percent (IMF, 2016);
• the deposit interest rate in 2014 was 3.9 percent (Trading Economics, 2016); and
• the weighted average cost of capital (WACC) for food and beverage sector in Morocco is estimated to be 10.55 percent (WaccExpert, 2016).
In addition to the cost of capital, the discount rate should take into account the risk or uncertainty of future cash flows, so it should include the so-called country risk premium, which for Morocco is between 2 and 3 percent. Moreover, investments in the agriculture sector may imply a further risk component. For instance, IRENA (2016) adds to the discount rate a technology-specific risk premium of 2 percent for nuclear, 2.5 percent for offshore wind and concentrated solar power, and 3 percent for less mature technologies. In the case of the assessment of climate technologies in Morocco, a unique discount rate for all practices/technologies was applied for simplicity, but the increase in risk connected to the agrifood sector was taken into consideration. A 12 percent financial discount rate was selected, which is in line with that recently adopted by the World Bank for the assessment of regional irrigation modernisation projects (World Bank, 2015b, Annex 5).
Selecting a financial discount rate to assess investments under the perspective of a private investor is different from selecting the economic discount rate to assess investment projects from the perspective of a country, region or of the overall global society. A country will probably borrow at a lower cost than the private sector. The benefits or costs of an investment for a society are different (or more) than those for a private investor (for instance, the investor does not benefit from the more regular water flows generated downstream to his land brought about by his investment on improved soil management, or in many cases investors do not bear the environmental costs an investment may generate). These externalities are often not quantified in the stream of costs and benefits when assessing a project or technology from the point of view of society. The analyst may therefore choose to adjust the discount rate to account for both possible different capital costs for society vis-à-vis the private investor and for unquantified externalities.
In the case of Morocco, the World Bank used a 10 percent discount rate for the economic analysis of water projects in rural areas (World Bank, 2014) and a 6 percent discount rate for a clean and efficient energy project in 2015 (World Bank, 2015a). In the assessment of climate technologies in Morocco that followed this methodological guideline, an 8 percent economic discount rate was used.

30
literature35. For example, to compare mitigation costs between countries, some authors may convert prices using purchase power parity (PPP) factors, while others may not. Fischedick et al. (2011) in a study on mitigation potential and costs observe that “there is enormous variation in the detail and structure of the models used to construct the scenarios… [and that] maintaining a global, long-term, integrated perspective involves trade-offs in terms of detail”36. For example, the models do not represent all the forces that govern decision making at the national or even the company or individual scale, in particular in the short term.
The approach suggested here is one that allows to build on the results from previously assessed criteria to obtain a mitigation costs for each technology – with relatively little effort. As such, it is suggested that the mitigation costs associated with each technology be defined as the ratio of NPV of investing in the technology, exclusive of GHG emission reduction benefits, taxes and subsidies, and other price distortions to the GHG emission reduction potential of the technology. The paragraphs below provide a summary of how the mitigation cost can be estimated.
Economic considerations
The estimation of the technology (economic) NPV used to measure the mitigation cost can be based on the model used for the NPV calculation in the assessment of the financial attractiveness criteria. However, as GHG mitigation costs are to be borne by society as a whole and not by private investors, it is important that the financial cash flow previously constructed is converted into an economic cash flow. The steps to achieve this are:
• Remove subsidies, import tariffs on inputs,
VAT, income taxes and any additional cash
flows that are transfers between agents
and therefore have no impact on costs
or benefits in a national perspective. As
much as possible, price distortions, such as
those caused by export quotas or storage
premiums, should also be eliminated;
• Quantify and include, as much as possible,
existing externalities into the cash flow. For
example, biogas production may require
considerable amounts of water that is free of
charge for the entrepreneur. However, water
is scarce and may have a value corresponding
to the price users in the region who would
35 As stated in the Climate Change Working Group III: Mitigation of Climate Change (2007) report: https://www.ipcc.ch/publications_and_data/ar4/wg3/en/tssts-ts-11-2-mitigation-costs.html
36 Fischedick et al., 2011: pp. 799-800
be willing to pay for its use, for example.
However, the value of GHG emissions
that are reduced through the use of the
technology should not be accounted for as
the purpose of this indicator is to compare
the cost of the reduction of GHG emissions
through the use of a technology with a
possible price of carbon credits in the market
or any other suitable benchmark (equally
expressed in USD/tonne of CO2eq); and
• Adopt, if relevant, an economic discount rate
different from the financial one (see Box 2).
The information required for the assessment of economic criteria implies preparatory work on data collection for related policies in the country (trade policies, tax system, subsidies, etc.). This information will also be necessary for the analysis in Step 4 and its collection should be undertaken as early as possible in the assessment. Still, information availability and quality can be a key constraint. Analysts should therefore try to balance accuracy (for example in considering all market failures and distortions in adapting from financial to economic pricing) with available resources and timeline of the analysis.
Mitigation cost estimation
As mentioned before, the cost of mitigation of a technology is the ratio of the estimated economic NPV to its GHG emission reduction potential. The GHG emission reduction potential estimate should be comparable to the estimate for the technical criteria. However, it is important to get the units right by either: (i) scaling up the NPV to an investment the size of the total adoption potential of the technology before dividing by the total annual emission reduction potential for the country for that same technology or (ii) simply estimating the GHG emission reduction potential in the same unit/scale as the NPV (for example 1 hectare of conservation agriculture or 1 solar pumping system).
This methodology presents some caveats that should be explicit in any technology assessment report. More often than not, the economic models that can be produced are not representative of all the contexts in which technologies can be applied: rather they are indicative of possible applications. In those cases, the mitigation costs should be interpreted as merely illustrative. Additionally, the NPV and consequently the mitigation cost will never incorporate all the externalities that are generated through the adoption of the technology. A CBA of improved rangeland management will most likely not account for benefits related to soil improvement and increased water infiltration, for example. Agricultural projects generally fail

Adoption of climate technologies in the agrifood sector - Methodology
31
to fully quantify and monetise the environmental effects of a change in input use.
The mitigation cost will also incorporate the caveats already described for the technology mitigation potential estimate. Nevertheless, it provides a means to benchmark the technology against alternatives in terms of GHG mitigating efficiency, which makes it a key indicator for the assessment of the technologies. In case of large uncertainty about the data used, the analysts can estimate a range of mitigation costs for each technology (through sensitive analysis of the NPV and GHG emission reduction scenarios) and compare these against benchmarks. Table 6 suggests how the classification (star ranking) can be done for these indicators. The ranges and thresholds can be adapted depending on the set of technologies being assessed and the international benchmarks for them.
The economic indicator of mitigation cost can be combined with the technical indicator potential to reduce annual national GHG emissions in order to produce MACCs for the specific country and range of technologies/practices under assessment (see more on this topic below –
Presentation of results). For each mitigation option, the potential GHG emission reduction volume (tCO2eq/yr) is presented along with the average abatement cost (USD) to give an annualised abatement cost per tonne CO2eq. In a situation where a country has already developed MACCs for specific technologies/options, it is possible to use the information directly as inputs into the techno-economic analysis in Step 2.
Data availability
Availability and quality of data is an important technical aspect to consider when assessing a climate technology. This methodology thus includes an indicator to specifically allow analysts to score the quality of the underlying information used. The score is attributed on the basis of the source, reliability, representativeness and statistical validity of the data (if applicable) as per Table 7.
Key results from Step 2
All calculations, estimates and results should be aggregated in a spreadsheet. The first sheet in this document should list all the technical coefficients and data common to
Table 7: Suggestion for the attribution of the three star rankings to data availability
criterion score * ** ***
Data availability Indicators based on ad hoc surveys or research: data are collected in the field by inspection of installations, undertaking surveys of equipment suppliers, analysing financial investments, etc.
More disaggregated indicators: data is sourced from a number of other sources, including informants in the industry (e.g. boilers manufacturers with a large market share and own data), from existing studies and/or ad-hoc surveys. The data is often of a specialised nature, e.g. from organizations that certify boilers or associations that import tractors. As a result, the data is not statistically valid in all cases, but it is deemed to be representative of the country context.
Data is statistically significant and representative of the use of the technology in the country. It is obtained from (national or international) official statistical sources or from specifically designed surveys and is available disaggregated to the required level of detail.
Source: Authors’ compilation.
Table 6: Suggestion for the attribution of the three star rankings to the economic criteria
criterion score * ** ***
economic criteria
Financial attractiveness
fIRR<discount rate, orPayback time > [threshold] years
fIRR discount rate [upper threshold to be defined], orPayback between a given range
fIRR > upper threshold to be defined, orPayback time over [threshold]
Mitigation cost Positive mitigation costBetween USD 0 and -20 /tCO2eq avoided (threshold can be adapted case by case)
< -20/tCO2eq avoided (threshold can be adapted case by case)
Source: Authors’ compilation.
* Negative mitigation costs are not uncommon for energy efficiency measures. A negative mitigation cost does not mean that the technology is automatically adopted by businesses. For example, there might be an incomplete understanding of the technology’s net benefits from the entrepreneurs or investors may have other investment priorities.

32
several technologies (e.g. national averages for emissions by unit of energy, energy prices, or exchange and discount rates). The document should also contain one sheet per technology with the estimate of GHG emission reduction potential, the estimate of the current technology adoption rate and the trends in gap between technology uptake and technical potential, as well as the model used for the estimate of the financial attractiveness and mitigation cost of each technology. Whenever a technical coefficient is used for more than one technology, it should be listed in the first sheet and linked to the other sheets where it is applied. For example, the price of diesel and diesel emissions (e.g. kgCO2eq/l) used for direct seeding and field machinery should be listed in the first sheet; the sheets characterising each of the two technologies would also link to it. This allows for quick adjustment and verification of assumptions. At the end of the analysis, sheets summarising and comparing the results should be built. This summary and comparison exercise can be done by attributing scores and specific weights to each criteria as suggested above (see Table 2) to produce an index that allows the ranking of technologies and practices on the basis of their techno-economic performance. Table 2 provides a sample summary table. Figure 11 also provides a sample summary presentation of results, in which the number inside the circle is a weighted average of all scores as suggested in Table 2.
Figure 12 provides another way to display the results from Step 2. The Y axis represents the mitigation cost, while the X axis is a quantitative aggregate final score based on the three star
system for each technology (excluding the mitigation cost and technical GHG mitigation potential scores). The figure visually indicates the technical mitigation potential of each technology through the size of the bubbles. For example, conservation agriculture shows a high potential to reduce GHG emissions (large bubble), a negative mitigation cost (approximately USD -25/tCO2eq) and a high score for the remaining indicators (above 2.10), signalling a good opportunity to reduce GHG emissions in the agrifood sector. At the other end of the spectrum lie small dams, with a low potential to reduce GHG emissions, a positive mitigation cost, and a low score in the remaining criteria.
Using the indicators used for the criteria potential to reduce annual GHG emissions and mitigation cost, it is possible to draw MACC-like graphs. These plot the estimated cost of mitigation by technology (Y-axis) and the cumulative technical GHG mitigation potential achievable (X-axis). MACCs, also known as McKinsey curves (Enkvist et al., 2007), provide useful information that can help compare a set of emission reduction options in the agrifood sector of a specific country.
They can also help compare the costs of mitigation of each technology with other alternative mitigation options or provide an indication of the impacts of future carbon prices on the attractiveness of each technology. For example, in the French example of an abatement curve (Figure 14), if the carbon price was around EUR 10/tCO2eq, biogas production and upgrading (methanisation) would become cost competitive. If it reached around EUR 50/tCO2eq, other
Figure 11: Example of a ranking of technologies/practices following the criteria and scoring system proposed for Step 2 (based on Table 2)
Drip irrigation 2.35
Solar/wind powered water pumping 2.00
Efficient field machinery 1.80
Conservation agriculture 1.75
Innovative greenhouse technologies 1.55
Biogas 2.15
Renewable energy systems 1.95
Source: FAO, 2016.

Adoption of climate technologies in the agrifood sector - Methodology
33
Figure 12: Estimated cost of mitigation (Y axis), other techno-economic criteria (X axis) and technical GHG mitigation potential by technology/practice (size of the bubbles).
Conservation agriculture
Renewable energy systems
Innovative greenhousetechnologies Biogas
Solar/wind poweredwater pumping
Dripirrigation
Efficient fieldmachinery
-150
-100
-50
0
50
100
1.50 1.60 1.70 1.80 1.90 2.00 2.10 2.20 2.30 2.40
Miti
gatio
n co
st (U
SD
/tC
O2e
q)
Higher techno-economic efficiency rating
Source: FAO, 2016.
Figure 13: Marginal abatement cost curve for Irish agriculture showing emission reductions from increased efficiency (green), land use change (yellow) and technological interventions (purple)
-600
-500
-400
-300
-200
-100
0
1000.5 1.0 1.5 2.0
2.5 3.0 3.5
200
300
400
500
EB
I
Tralling shoe
Band spreader
Wei
ght
gain
(bee
f)
Ext
. gra
zing
(bee
f)
Ext
. gra
zing
(dai
ry)
N-e
ffic
ienc
y (in
cl. c
love
r)
Min
imum
till
age
Sol
id b
iom
ass
for
heat
Sol
id b
iom
ass
for
elec
tric
ity
OS
R -
Bio
dies
el /
PP
O+
str
aw u
se
Whe
at -
Bio
etha
nol
+ s
traw
use
Sug
ar B
eet-
Bio
etha
nol
Cov
er c
rops
Slu
rry
man
agem
ent
Ana
erob
ic d
iges
tion
(Pig
slu
rry)
Nitr
ifica
tion
inhi
bito
rs(u
rine)
Measures based onincreased efficiency
Measures based onLand-use change
Measures based ontechnological interventions
Miti
gatio
n co
st (E
UR
/ t
CO
2eq)
Abatement potential (Mt CO2eq)
Source: Schulte and Donellan, 2012.
Note: EBI = economic breeding index for selecting suitable breeding animals.

34
practices such as covering effluent storage ponds or biogas flaring would become economically viable37. Although there is some controversy over the value of this approach (see for example Ackerman and Bueno, 2011), it can still be useful to stimulate dialogue about the different options available and does not add an extra burden to the
37 A gas flare is a gas combustion device that is used in industrial plants, including biogas and natural gas processing plants
assessors as it relies on data already compiled to produce the MCA.
MACCs can also be developed using different and more sophisticated methodologies and tools, such as the Marginal Abatement Cost Tool (MACTool) developed by the Energy Sector Management Assistance Program (ESMAP) and the World Bank, a transparent and flexible
Figure 14: Abatement potential and cost of a selection of mitigation options for French agriculture, 2030
Miti
gatio
n co
st (E
UR
/ t
CO
2eq)
Abatement potential (Mt CO2eq)
Pou
ltry
build
ings
Gra
zing
per
iod
Tem
pora
ry g
razi
ng p
erio
dG
rass
land
legu
mes
Trac
tors
Hea
ted
gree
nhou
ses
De-
Inte
nsifi
catio
n
2PA
A+
sow
fee
d
Tilla
ge 1
yea
r in
5
Agr
ofor
estr
yV
iney
ard/
orch
ard
cove
rcr
oppi
ng
Met
hani
satio
n
Legu
me
crop
sA
dditi
on o
f ni
trat
e
Cov
erin
g an
d fla
res
Nitr
ifica
tion
inhi
bito
rs
Hed
ges
Cov
er c
rops
Car
bohy
drat
e/fa
t su
bstit
utio
Gra
ss b
uffe
r st
rips
Elim
inat
ion
of f
irst
N a
pplic
atio
nP
rote
in in
die
t of
cow
s
Org
anic
fer
tiliz
er a
pplic
atio
n
Inco
rpor
ate
fert
ilize
r
Red
uctio
n in
dos
e (b
alan
ce)
Unp
rodu
ctiv
e gr
assl
and
-600
-500
-400
-300
-200
-100
0
100
5 10 15 20 25 30 35
200
300
400
500
Source: Pellerin et al., 2013.
Figure 15: Abatement potential and cost curves for cropland management practices in Ethiopia
Miti
gatio
n co
st (U
SD
/ t
CO
2eq)
Abatement potential (Mt CO2eq)
46.58
-20.89
-12.56
-25
-20
-15
-10
-5
0
5
5 10 15 20 25 30 35 40 45 50
6.18
55 60 65 70 75 80
10
45
50
Yield-increasing techniques
Small-scale irrigation
Lower-emitting techniques Large-scaleirrigation
Source: Federal Democratic Republic of Ethiopia, 2011.

Adoption of climate technologies in the agrifood sector - Methodology
35
MS Excel-based software tool38. Nevertheless, they can also be developed using an excel spreadsheet to build a bar chart. In this case, the width of one column will correspond to a given amount of GHG emissions (X-axis), each technology being represented by as many columns as necessary to reach its total GHG emissions reduction potential. The height of each column will correspond to the technology’s mitigation cost and repeated as many times as the number of columns by technology. Different MACC curves can be constructed for different scenarios of a sensitivity analysis. Examples of MACCs are shown in Figures 13, 14 and 15.
38 The tool is available at http://esmap.org/MACTool
The technologies/practices that rank higher according to Step 2 are those that have both the potential to significantly reduce GHG emissions at a low cost or even with net benefits to the adopters and society at large. However, these solutions may also carry negative externalities or face constraints to their adoption that have not yet been assessed. Environmental and social constraints that may arise from different dimensions (energy, water and food sector) are assessed in Step 3 of the methodology, which also assesses technologies/practices on the basis of their relevance to climate change adaptation. Step 4 proposes an assessment of the key barriers and risks associated with the adoption of each technology as well as possible solutions to overcome them.


Adoption of climate technologies in the agrifood sector - Methodology
37
Chapter 5 – Step 3: Evaluating sustainability issues
The selection of climate technologies/practices in Step 2 was based mainly on economics, market and technological considerations. However, there are also other factors that should come into play for a complete assessment that relate to sustainability issues and co-benefits. These are assessed in Step 3, which ensures that a government or project funding agency also takes into account resilience to climate change, synergies with climate change adaptation, water use, and human resources, even if only on a qualitative basis due to time and resources constraints.
The implications of expanding the market penetration of selected technologies/practices in terms of natural and human resource use efficiency can be largely guided by and based on the methodology as developed for the water-energy-food nexus analysis proposed by FAO (FAO, 2014d).
In essence, the Nexus Assessment developed by FAO enables the performance of an intervention
to be assessed based on how it impacts five resource factors: energy, water, food/land, capital/cost and labour. These five factors are also evaluated in terms of their intensity: having a high or low pressure in the given location. A scoring system for a set of indicators (typically three for each resource factor to be defined by the assessor) is applied and a summary “radar chart” is produced (Figure 16 shows some examples). The area of the resulting polygon is a measure of the overall performance of the intervention. Thus in the example in Figure 16, mini-hydro is more capital intensive and has a greater impact on food/land use which is scarce in this location (red background), whereas solar irrigation has a lower performance in using the water resource but because intensity is relatively low (light green background), this is not a major issue.
Knowing the resource use efficiency of each climate technology/practice in terms of water use, energy demands, and land use (including soil, crop rotations and productivity) is not enough for a fully detailed water-energy-food nexus analysis.
Box 4: The water-energy-food nexus in assessing sustainable climate technologies
A nexus approach can be used to help design the methodology needed to select sustainable climate technologies in a given country. Major impacts of climate change on the agrifood supply chain are expected to result from changes in the water cycle. As a result, the design of climate-smart agriculture strategies will also need to be viewed through a “water lens”. Moreover, the dependence of agrifood systems on fossil fuels contributes significantly to climate change. The challenge of reducing this dependency can be met by the up-scaling of energy-smart food systems. These systems use improved EE, increase the use and production of RE, and broaden the access to modern energy services in agrifood systems.
However, the availability of many RE resources depends on climatic conditions. Drought negatively impacts the cultivation of crops grown for transport biofuels or for biomass combusted for heat and power generation; water availability and seasonality of both floods and droughts for hydropower generation; variable atmospheric conditions reduces mean annual wind speeds; and cloud cover affects solar radiation levels. In addition, demand for energy to provide heating and cooling in buildings may see greater seasonal variations, while water use for cooling thermal or nuclear power plants may become constrained, resulting in less electricity generated from a given plant. These impacts may increase significantly with climate change, so the energy sector will need to learn how best to adapt. Therefore, the energy supply to agrifood systems will need to become “climate-proofed” as much as possible.
Under these circumstances, understanding the water, energy and food interlinkages, and managing them holistically, is critical to the sustainable growth of the agrifood sector. In this context, the water-energy-food nexus has emerged as a useful concept to describe and address the complex and interrelated nature of our global resource systems on which we depend to achieve different social, economic and environmental goals. The nexus approach adds value for agrifood enterprises as it can help:
• mitigate risks related to resource scarcity (such as clean water for the beverage industry);
• reduce costs (such as through reducing energy demand); and
• raise productivity.
See Annex 1 for further details.

38
Figure 16: Examples of interventions that have impacts on the nexus aspects already under stress.
Source: FAO, 2014d.
Note: E = energy; F = food/land use; L = labour; C = capital/cost; W = water.
Red background = resource scarcity (high bio-economic pressure); yellow = neutral; green = abundance (low bio-economic pressure).
Table 8: Potential synergies and trade-offs on water, energy, land/food aspects as well as other implications associated with selected agrifood technologies
climate technologies and practices
Water implications energy implications land / food implications
social and additional implications
conservation agriculture, i.e. (i) minimum soil disturbance, (ii) crop rotation and (iii) permanent soil cover
Soils under low tillage have very high water infiltration capacities, reducing surface runoff and therefore soil erosion. Low tilling may cause increased reliance on herbicides, which may cause water contamination.Permanent soil cover can result in less water use due to increased infiltration and enhanced water holding capacity from crop residues left on the soil surface
Low tillage can reduce farm energy use from less tractor use or other machinery that is normally used for tillage.Conservation agriculture encourages organic crop residues as soil additives, resulting in fewer chemical fertilizer amendments to achieve optimal yields over time. This can also reduce on farm (indirect) energy use.Crop residues left on the field could be used for energy generation (e.g. through biogas)
Conservation agriculture can enhance crop yield in the long run. Farmers using CA technologies typically report higher yields with fewer water and fertilizer use.Low tillage improves the soil’s biological fertility, making soils more resilient to pests.Crop rotation mitigates the build-up of pathogens and pests that occurs when one species is continuously produced. Incorporating leguminous plants alternately with non-leguminous plants restores the fertility of the soil and increases nitrogen content.Permanent soil cover improves soil quality and fertility. The organic soil cover increases the soil’s organic carbon content, which in turn increases soil fertility and reduces the need for chemical fertilizers.Ensuring soil cover can compete with the usage of crop residues for animal feed
In conservation agriculture, the land is not cleared before planting and involves less weeding and pest problems due to permanent soil cover/crop rotations. This reduces farmers’ labour inputs as compared to conventional farming.If crop residues left on the field are used for bioenergy, operators could enjoy additional revenue/savings on energy bills
(Cont.)

Adoption of climate technologies in the agrifood sector - Methodology
39
climate technologies and practices
Water implications energy implications land / food implications
social and additional implications
Efficient field machinery
- More efficient tractors reduce on-farm energy use as less diesel is consumed per unit of work done
- Fuel efficient tractors generally cost more than normal tractors, requiring higher upfront capital availability
drip irrigation Drip irrigation can help use water efficiently by reducing water run-off through deep percolation or evaporation
Drip irrigation requires less energy to move water, which can reduce the total on-farm energy use
Agricultural chemicals can be applied more efficiently and precisely with drip irrigation. Since only the crop root zone is irrigated, nitrogen that is already in the soil is less subject to leaching losses.Drip irrigation improves the crop yield for various crops
-
solar/wind-powered water pumping
Due to reduced cost of pumping in the long run, a rebound effect can result in excessive and unsustainable water pumping, lowering the groundwater table or reducing surface water availability
Solar/wind water pumps reduce fossil fuel consumption when it replaces fossil fuel-powered pumps, thereby decreasing on-farm energy use. In aggregate terms this can lead to lower fossil fuel dependency and import bills
Regarding irrigation, the introduction of this technology contributes to increasing yields
The initial cost of procuring and installing solar/wind water pumping systems is much higher than conventional pumping systems and requires upfront capital
innovative greenhouse technologies
Water use efficiency in greenhouse food production depends on greenhouse type, climate control and the irrigation management system in place. In general, water consumption expressed in litres/kg of food produced is lower in greenhouse crop cultivation as compared to open field production. Additional water may be required for cooling and humidity control, applied in situations where passive climate control is insufficient. Greenhouses can act as structures for rainwater harvesting for irrigation. Rainwater is mostly excellent quality, which is important in soilless cultivation and hydroponics. It is free, clean and its use for irrigation needs less energy as compared to pumping water from wells or surface water sources
Energy use in greenhouse cultivation is normally higher as compared to open field cultivation, in the case of active control of climate and growth parameters for intensive cropping systems. The large majority of greenhouses perform well with passive climate control without additional energy inputs
Yields in greenhouse food production are usually higher and of better quality compared to open field cultivation since it allows for careful control of the microenvironment to better fit the plant requirements, while improving pest and disease control. Greenhouse farming can extend the growing season of seasonal crops since it is less dependent on external weather conditions
-
(Cont.)

40
Managing the nexus means making optimal use of the natural and human resource base available vis-à-vis the different and sometimes competing local priorities and interests. A full nexus assessment needs to involve both information on the resource use efficiency of specific interventions, and the status of the context where the intervention is rolled out (in terms of bio-economic pressure). The FAO Nexus Assessment can be used for this purpose and can lay the basis for a stakeholder dialogue around nexus issues (see FAO, 2014d for further information).
In this methodology outline for Step 3, using the full nexus approach may be too detailed and time-consuming. Therefore, it can be applied only when a simpler qualitative assessment signals specific risks for the adoption of a technology/practice in the country.
Table 8 can guide the assessor in assessing the main trade-offs and synergies associated with specific technologies/practices. It discusses the positive and negative implications of selected climate technologies and practices on water resources, energy use, land use and food production, as well as potential impacts on labour and other issues.
As seen above, Table 8 explores many of the primary implications (both positive and negative) for the adoption of various climate-smart
agricultural technologies and practices in terms of water, energy, land/food implications, and others. These assessments are non-quantitative considerations that the project team can identify based on literature and discussions with local experts. To a great extent, the implications are usually specific to a technology or practice and depend on its socio-economic and technical characteristics, but their relevance and expected impacts also depend on the national context. In particular, the context can be especially important when certain impacts become significant once they are scaled up to the national level, given the technical potential for market penetration. As a result, the table is meant to serve as a guide to underline the unique impact of a particular technology or practice on the environment.
Step 3 therefore takes a different but important approach relative to Step 2, which focuses on the financial and economic considerations of each technology and practice. By underlining the environmental implications of implementation, Step 3 expands the economic considerations evaluated under Step 2. In particular, it assesses the scale effects of technological adoption; or in other words, the environmental and social implications of adopting a particular technology on a larger scale. In this way, policymakers can better understand the environmental feasibility of implementing a technology or practice.
climate technologies and practices
Water implications energy implications land / food implications
social and additional implications
Biogas from wastewater, agricultural and food waste and residues
Some water is needed for digester feedstock depending on waste/residue/ manure type and moisture content.Production of biogas requires animal or plant organic waste to be mixed with water which is then anaerobically digested. Depending on the scale of the biogas plant, the water footprint of biogas production can vary.Water recycling can provide water for agriculture, thereby reducing extraction or the pumping of surface or groundwater for irrigation
Use of manure to produce biogas is an alternative source of energy to fossil fuel or logging. In case sludge after methanisation is used as fertilizer, this lessens the demand for artificial fertilizer
Animal and crop residues are nutrient-rich and can be used as soil amendments. The use of animal and crop residues as soil cover or organic soil additives for energy production can negatively impact soil fertility and nutrients
Nutrients recycled are returned to the soil through digestate.Odours from manure management are reduced.If biogas is used for cooking, it can reduce smoke from fuelwood and improve health.Biogas production is an additional source of income, contributing to farmers’ income diversification.It can also reduce diseases associated with the presence of manure or with burning coal or wood indoors.Collection of crop and animal residues requires substantial extra hours of human activity compared with conventional energy sources.Skilled personnel are required to operate and manage recycling plants, which may be difficult to find locally
Source: Authors’ compilation.
Note: Colour code: Green: Synergy; Red: Trade-off; Orange: Possible synergy and/or trade-off for the given aspect.

Adoption of climate technologies in the agrifood sector - Methodology
41
Table 9: Climate adaptation benefits associated with the specific agrifood technology/practice
climate technologies and practices relevance for climate adaptation
conservation agriculture • Climate change can cause soil erosion and loss of fertility hence reducing agricultural productivity over time. Conservation agriculture, through minimum soil disturbance, increases soil biodiversity and organic matter content and contributes to the physical stabilisation of the soil structure.
• Crop rotation is a farming strategy preserving the nutrients and productive capacity of the soil. This can increase the farmers’ capacity to be resilient to climate-related loss of productivity.
• Permanent soil cover protects soil from erosion by water or wind.
• Improves drought resilience through increasing the water conservation capacity of the soil.
drip irrigation • Drip irrigation allows adequate and efficient water usage leading to increased resilience of agricultural production to climate change, especially where water availability is already limited.
• Drip irrigation only irrigates the crop root zone and hence nitrogen that is already in the soil is less subject to leaching losses.
• Drip irrigation is adaptable to many climatic and soil conditions and is particularly efficient in sandy areas.
solar/wind-powered water pumping
• Solar/wind-powered pumps can enable the farmer to actively manage water. This can increase resilience in places where water management was passive.
• They also allow timely and precise withdrawal of water, which can allow the farmer to deal with variable climate such as delay in rains or inadequate rain during planting season.
innovative greenhouse technologies
• Greenhouses can be used to grow food in controlled environment where external climate conditions are not favourable or to intensify crop production per unit of area, water and time. This can increase resilience to food shortages and facilitate the supply from local production in regions where extreme weather undermines agriculture.
• Greenhouse agriculture can result in high yielding crop production due to intensive application of external inputs, ability to control micro environments and also allow the use of efficient water management practices.
livestock production - grazing management
• Mixed farming with livestock and agriculture maintains soil fertility by recycling soil nutrients and allows intensified farming, and preserves biodiversity. It increases soil nutrients and minimises soil erosion.
• Grazing practices can be used to stimulate diverse grasses and the development of healthy root systems; feed both livestock and soil biota; maintain plant cover at all times, and promote natural soil forming processes. Grazing practices that ensure adequate plant recovery before re-grazing will enhance soil and biomass carbon, capitalise on animal based nutrients and offset ruminant methane emissions.
cold storage - energy efficiency and climate friendly refrigerants
• Energy efficient cold storage is an important measure to reduce food losses due to biological degradation by prolonging the storage life of perishable foods. Food loss reductions through climate-smart cold storage contributes to increased food availability and therefore increased resilience when food production is impacted due to adverse climate conditions.
Biogas from wastewater, agricultural and food waste and residues
• Livestock residue can be used to produce biogas which in turn can provide timely access to energy for various agricultural processes like irrigation. This can increase resilience and adaptation potential in case of extreme weather events due to which re-cropping may be required.
• The organic byproducts obtained after anaerobic digestion of animal or crop residues can be used as organic fertilizer. This can result in decreased dependence on external chemical fertilizer, especially where soil fertility has been depleted due to extreme weather conditions.
• Biogas produced can be used to cook, dry or process food in order to provide effective nutrition or to store food for longer periods of time increasing resilience in case of food shortages due to weather events due to climate change.
renewable energy systems
• Renewable and bio-energy heat and power can be used to cook, dry or process food in order to provide effective nutrition or to store food for longer periods of time.
• They can also provide timely access to energy for various agricultural processes like irrigation.
Source: Authors’ compilation.
Note: Colour code:
• technology/practice highly relevant for climate change adaptation• technology/practice relevant for climate change adaptation• technology/practice moderately relevant for climate change adaptation

42
In short, Step 3 identifies the technologies and practices that exhibit positive implications and synergies across the nexus aspects that are most relevant for climate adaptation and less constrained by sustainability concerns in their market development. This information complements the analysis of Steps 1 and 2 and, when merged together, can facilitate a new ranking of the most promising technologies/practices from a market adoption perspective; technologies that therefore rank high at the end of Step 2 are deemed more environmentally sustainable and are thus considered the most promising technologies. As a result, the technologies and practices that have the highest rankings achieve a rough balance between the three steps: (i) they have significant potential to reduce GHG emissions in the agrifood sector; (ii) they are attractive and feasible in terms of financial and economic considerations; and (iii) they incur benefits in terms of water, energy, land/food and social/other use, or alternatively they do not have notable negative impacts in terms of environmental and sustainability considerations.
Table 8 also underlines the fact that technologies and practices that may perform well in Step 2 (techno-economic analysis) may need to be carefully implemented in order to avoid unwanted negative impacts. There are several technologies and practices that may not be as suitable in certain countries due to local environmental constraints, despite not signalling any relevant trade-offs in other countries. Taking an example from the pilot study in Morocco, technologies that may be highly water intensive may not necessarily be suitable, but would be more useful in countries like Serbia, where water resources are more abundant. In this regard, some aspects of the environmental and social implications merit more weight than others. For example, in the context of Step 3, the high upfront costs associated with efficient field machinery and solar/wind-powered pumps assume less importance (due in part to the discussion of these factors elsewhere) when compared to the potential water implications of the latter technology – namely, that RE pumps may lead to groundwater overexploitation, which would incur serious environmental repercussions.
Table 9 discusses the main benefits for climate resilience. Climate change mitigation benefits are often not the most convincing argument for investors, but they can be considered co-benefits of other more relevant effects of the adoption of a technology/practice. Tables 8 and 9 highlight the co-benefits in adopting these climate technologies/practices besides relevance for climate change mitigation and cost of mitigation. The climate adaptation potential of different technologies/practices can vary considerably and a colour code has been proposed in Table 9 to highlight the most relevant (in dark blue).
Key results from Step 3
In summary, Step 3 examines the impact of selected technologies and practices on water resources, energy use, land use/food production, and other relevant issues. It is meant to complement the analyses conducted in Steps 1 and 2 by assessing the environmental and sustainability implications of each technology and practice. Following the merger of these three steps, policymakers are provided with a clearer understanding of: (i) the technologies and practices most suitable for reducing GHG emissions in the agrifood sector, in addition to (ii) the financial and economic implications of their adoption; and (iii) the impact the technology/practice may have on the environment and sustainable production. In this way, users of the methodology can more effectively rank technologies in terms of their appeal for emissions reduction, financial/economic feasibility and environmental sustainability.
Adoption of climate technologies in the agrifood sector - Methodology
43
Chapter 6 – Step 4: Addressing barriers hindering uptake
The key objective of Step 4 is to identify thematic policy areas that may warrant greater attention to promote or improve adoption of sustainable climate technologies in the agrifood sector.
Fostering adoption of new technologies/practices relies, among other factors, on a conducive institutional and legal framework, which encompasses regulatory and legislative acts, financial support and implementation structures39. Step 4 therefore analyses relevant policies and institutional barriers and/or support mechanisms that influence the potential deployment of climate technologies and practices for GHG emission reductions in a given country’s agrifood sector.
This step builds on the results from Steps 2 and 3 in that it uses the techno-economic analysis and the assessment of sustainability aspects to identify important barriers to the adoption of specific technologies. In addition, it brings an extra dimension to the report by describing key policies that may impact policy adoption and concludes which key thematic areas may deserve more attention from policymakers. It would be too ambitious in an exercise as rapid as a four step assessment to provide detailed policy guidance. Moreover, policy formulation is often more successful when different stakeholders are involved and reforms are carefully assessed and debated. The objective of this process is therefore limited to identifying policy themes and directions that can eventually be further developed by the country’s policymakers to support the deployment of climate technologies in the agrifood sector. This methodological guide proposes organizing this step as follows:
(i) Overall policy and institutional setting in the
country;
(ii) Review of past policy interventions aiming at
technology adoption;
(iii) Key barriers, risks and possible solutions to
overcome them, by technology; and
(iv) Discussion of the findings.
The last section would comprise subsections per technology. For each technology, a diagnostic of key policies and relevant institutions, a
39 This framework can be supported by promotional measures, communication campaigns and proximity policies on training, R&D, improving the general public’s awareness to climate issues
description of main barriers and risks to adoption, and a proposal of relevant policy themes should be undertaken.
Overall policy and institutional setting in the country
Step 4 begins by providing an overview of the policy and institutional setting in the country’s agrifood sector. Analysts should examine government initiatives to promote agricultural development and reduce GHG emissions, ranging from reforms to the launch of new programmes to support state objectives. Although part of Step 4, this work should start as early as possible in the implementation of the methodology, as it contributes to the general understanding of the technologies’ potential and more importantly provides essential elements for the financial attractiveness and mitigation cost analyses performed in Step 2. Here the analysts should look at national targets, national strategies, national communications to IPCC, intended nationally determined contributions under the UNFCCC and how these targets and strategies are met by government policies (e.g. fuel prices) and programmes. Finally, this subsection should also provide a quick overview of the institutional set up in the country regarding reducing GHG emissions and developing renewable energy sources. The overview paves the way for a brief discussion of potential barriers that could adversely impact the realisation of government goals in the sector.
Review of past policy interventions aimed at technology adoption
Step 4 should also investigate the impacts of past policies on increased market penetration of technologies, trying to identify any correlation between the two. It should focus on the relationship between the market uptake of a technology/practice and relevant policies which may have had an impact on it. For example, the uptake of solar water pumping among farmers can be directly impacted by a range of factors, such as incentives for renewable energy off-grid production, the introduction of a new regulation on maximum water withdrawal from underground aquifers or a change in fossil fuel subsidies, which will partly dictate the market development of this technology. The main limitation in this analysis is associated with the difficulty in establishing causality since the market development is normally the effect of
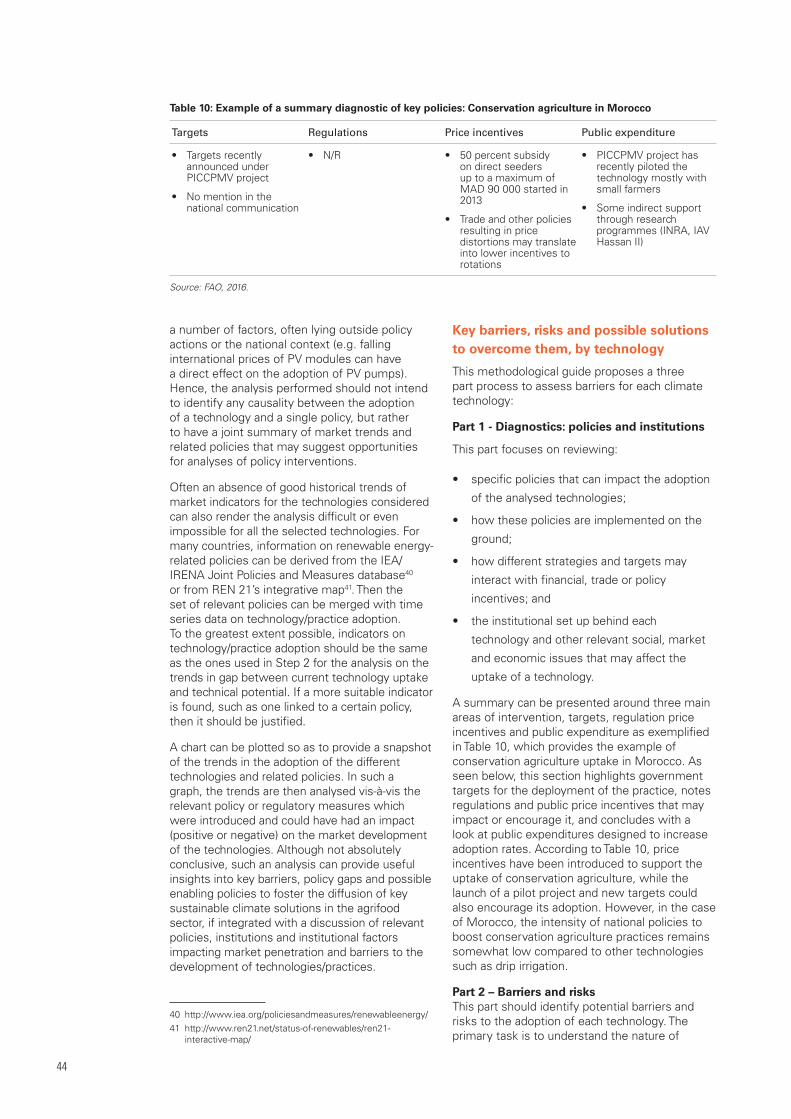
44
a number of factors, often lying outside policy actions or the national context (e.g. falling international prices of PV modules can have a direct effect on the adoption of PV pumps). Hence, the analysis performed should not intend to identify any causality between the adoption of a technology and a single policy, but rather to have a joint summary of market trends and related policies that may suggest opportunities for analyses of policy interventions.
Often an absence of good historical trends of market indicators for the technologies considered can also render the analysis difficult or even impossible for all the selected technologies. For many countries, information on renewable energy-related policies can be derived from the IEA/IRENA Joint Policies and Measures database40 or from REN 21’s integrative map41. Then the set of relevant policies can be merged with time series data on technology/practice adoption. To the greatest extent possible, indicators on technology/practice adoption should be the same as the ones used in Step 2 for the analysis on the trends in gap between current technology uptake and technical potential. If a more suitable indicator is found, such as one linked to a certain policy, then it should be justified.
A chart can be plotted so as to provide a snapshot of the trends in the adoption of the different technologies and related policies. In such a graph, the trends are then analysed vis-à-vis the relevant policy or regulatory measures which were introduced and could have had an impact (positive or negative) on the market development of the technologies. Although not absolutely conclusive, such an analysis can provide useful insights into key barriers, policy gaps and possible enabling policies to foster the diffusion of key sustainable climate solutions in the agrifood sector, if integrated with a discussion of relevant policies, institutions and institutional factors impacting market penetration and barriers to the development of technologies/practices.
40 http://www.iea.org/policiesandmeasures/renewableenergy/41 http://www.ren21.net/status-of-renewables/ren21-
interactive-map/
Key barriers, risks and possible solutions to overcome them, by technology
This methodological guide proposes a three part process to assess barriers for each climate technology:
Part 1 - Diagnostics: policies and institutions
This part focuses on reviewing:
• specific policies that can impact the adoption
of the analysed technologies;
• how these policies are implemented on the
ground;
• how different strategies and targets may
interact with financial, trade or policy
incentives; and
• the institutional set up behind each
technology and other relevant social, market
and economic issues that may affect the
uptake of a technology.
A summary can be presented around three main areas of intervention, targets, regulation price incentives and public expenditure as exemplified in Table 10, which provides the example of conservation agriculture uptake in Morocco. As seen below, this section highlights government targets for the deployment of the practice, notes regulations and public price incentives that may impact or encourage it, and concludes with a look at public expenditures designed to increase adoption rates. According to Table 10, price incentives have been introduced to support the uptake of conservation agriculture, while the launch of a pilot project and new targets could also encourage its adoption. However, in the case of Morocco, the intensity of national policies to boost conservation agriculture practices remains somewhat low compared to other technologies such as drip irrigation.
Part 2 – Barriers and risksThis part should identify potential barriers and risks to the adoption of each technology. The primary task is to understand the nature of
Table 10: Example of a summary diagnostic of key policies: Conservation agriculture in Morocco
targets regulations Price incentives Public expenditure
• Targets recently announced under PICCPMV project
• No mention in the national communication
• N/R • 50 percent subsidy on direct seeders up to a maximum of MAD 90 000 started in 2013
• Trade and other policies resulting in price distortions may translate into lower incentives to rotations
• PICCPMV project has recently piloted the technology mostly with small farmers
• Some indirect support through research programmes (INRA, IAV Hassan II)
Source: FAO, 2016.

Adoption of climate technologies in the agrifood sector - Methodology
45
Table 11: Guidance on typology of key barriers
Knowledge and information
organization/social
regulations/institutions
support services/structures
Financial returns
access /cost of capital
• Information asymmetries
• Lack of awareness about the technology
• Not enough technical expertise to use the technology adequately
• Collective action needed for technology to take off
• Social norms that can hinder adoption
• Focuses on private/non-governmental issues
• Laws, regulations and other that may prevent adoption
• Technology specifications not well defined
• Focuses on government/ public domain
• Existence of research institutes
• Efficiency and coverage of supplier networks
• Efficiency and coverage of maintenance companies
• Are low returns a barrier and in which cases?
• IRR, payback as per Step 2
• Credit market failures
• Is upfront investment cost very high?
• Cost of capital too high
Source: FAO, 2016.
Box 5: Stakeholder involvement process
For an assessment to have long-term impact, it needs to engage with key stakeholders and experts. This is useful beyond data collection, as the establishment of a stakeholder dialogue allows analysts to:
• engage and bring together actors from different sectors and levels of governance;
• develop a shared understanding of the national, regional and international context in which future interventions will be embedded and ensure that these interventions are aligned with national needs and priorities;
• directly link to ongoing and emerging decision-making processes; and
• create momentum to move from assessment outcomes to action, instilling a sense of ownership, leadership and mutual accountability.
While format and methods may vary depending on the context, the following process is suggested to actively engage decision-makers in assessing the status of climate technologies.
A stakeholder map may serve as a useful tool to identify important stakeholders and to better understand the roles and relative importance of different actors. The project team and advisors will jointly invite key organizations and people to take part in the assessment process. The selection of stakeholders will significantly shape the scope and reach of the assessment, which is strongly dependent on the expertise and contacts of national partners and advisors. An emphasis should be placed on inviting stakeholders from a broad range of sectors, including different ministries (e.g. agriculture, environment, energy, planning) as well as from different levels of governance (producer associations, farmers, food processors, equipment suppliers, irrigation agencies, among others).
It is important to clarify the different stages leading to the adoption of the technology/practice by the farmer or entrepreneur, as the process of stakeholder participation should be tailored to address barriers for one or more of these stages. Main adoption stages are:
• Awareness by a user/farmer who learns about the technology/practice (with technology transfer/diffusion/information and promotion playing a key role);
• Evaluation by a user/farmer of the technology in terms of costs and benefits;
• Trial/assimilation where a user/farmer tries a new technology/practice at a small scale to learn the various outcomes associated with the range of practical decisions linked to using the technology/practice; and
• Adoption by a user/farmer who decides to buy/adopt it in full, but modify or adapt it to suit the local situation and special needs. Adoption should be considered as a continuous measure. Defining adoption in a given context will depend on the type of technology/practice being promoted and how it relates to factors such as the variances between management practice and tools, who is adopting, what land size is allocated to the new technology/practice, and past experiences with the technology/practice.
As made clear above, consultation and stakeholder involvement should not and cannot conform to a step-by-step approach. Many aspects of the technologies’ assessment addressed through the four steps of this methodological guide are interlinked (e.g. financial attractiveness of Step 2 and barriers to adoption in Step 4) and should be addressed together during the consultations with stakeholders. Hence, when programming participatory work, it is important to have a complete picture of the demands in terms is information and suggestions for policy options that the study should seek to obtain from stakeholders from Step 1 to Step 4 of the methodology.

46
the individual barriers and any relationships between them to determine which barriers are important and which are easiest to remove. Different types of barriers should be selected by theme (see Table 11), ranging from knowledge and information gaps to access to credit and its cost. This can be done through a literature review and expert judgment in an initial stage and should then be validated and improved through consultations with key stakeholders.
The barriers and risks can be given a qualitative score (e.g. from one star – major barrier to three stars – not major barrier) to indicate the degree to which the constraint limits uptake. For example, the limited presence of support services and structures can be perceived as a major barrier to the implementation of conservation agriculture, while the financial returns from uptake can be seen as an incentive for adoption.
This part should also seek to identify if barriers may impact certain potential adopters relative to others. For example, credit constraints may discourage some farmers and not others seeking to adopt climate technologies. Finally, the section should draw on the results from Steps 2 and 3 to indicate any risks (in particular Step 3 - environmental and sustainability issues) that may need to be addressed or taken into consideration in developing support policies.
Table 12 illustrates the key barriers slowing the adoption of conservation agriculture. As seen below, the financial returns of this practice constitute a major barrier to increased adoption, as does a lack of knowledge amongst farmers. In
contrast, there are currently no major regulations or institutions that inhibit uptake.
Part 3 – Key instruments and drivers This part focuses on providing ideas on which thematic policy areas can be interesting to explore further. It should start by looking at the track record and impact of past policies implemented to encourage technology adoption insofar as possible given the difficulty in establishing exact causal links. It should then offer suggestions for potential policies, instruments and drivers that may help policymakers overcome the aforementioned barriers and risks. Annex 2 provides guidance on aspects the analysts may want to explore when defining the main thematic policy areas for each technology.
Suggested thematic areas for policy development to support the market penetration of the climate technologies/practices should consider the environmental sustainability and social issues as well as economic viability as assessed in Steps 2 and 3 of this methodology. While evaluating policy options, the analyst should also consider that many of these will certainly have been introduced in some countries and learning should be sought from their experiences.
This part should conclude by assessing the expected “policy reform intensity” for each technology in order to provide a rough evaluation of which technologies would require the biggest changes to current policies and/or the largest public support measures (including financial allocations) to encourage adoption. A table similar
Table 12: An example of key barriers for the adoption of conservation agriculture
Barriers
risksKnowledge and information
organization/social
regulations/institutions
support services/ structures
Financial returns access/cost of capital
• Lack of farmer knowledge about the technology is a major issue
• Among early adopters, appropriate knowledge on technology use is a problem and can influence initial results and sustainability
• Direct seeder rental markets or alternatively farmers organized to share equipment would help adoption
• Organization and social practices linked to livestock production do not favour maintaining crop cover
• N/R • Repair shops exist for conventional equipment and can be adapted but are still not able to service direct seeders adequately
• Direct seeders imported from abroad are heavy and not adapted to most local tractors
• Financially attractive
• Cash flow profile in first years can be problematic depending on farmer knowledge
• Rotations may not be incorporated by farmers due to price signals and value chain development constraints
• Upfront investment cost is high
• Access to credit for poorer farmers can be problematic
• Possible increase in the use of herbicides in the short term can potentially have a negative impact on water quality
Source: FAO, 2016.

Adoption of climate technologies in the agrifood sector - Methodology
47
to that used to summarise the “Diagnostics: policies and institutions” (see Table 10) can now be used for the proposed thematic policy areas. A column can be added for the score on the required policy reform intensity.
As seen in the example below, the Morocco pilot study concluded the Step 4 assessment of conservation agriculture by discussing potential targets, regulations and price incentives that could encourage the adoption of this technology. It also provided suggestions for areas in which investment could facilitate uptake, and finishes by giving a qualitative assessment for the intensity of the proposed policy reforms. In the case of conservation agriculture, establishing targets and designating public expenditures for pilot programmes and capacity development could be instrumental in increasing adoption rates, and therefore the policy reform intensity was deemed to be moderate.
Key results from Step 4
This section should provide a summary of the main trends, barriers and opportunities for intervention that were identified during Step 4 and classify or and provide: (i) a comparative description of the technologies in terms of barriers and ease of adoption; and (ii) thematic areas of policy development which should be seen as priorities to the government and how they would affect different technologies.
Table 13: Summary of relevant policy themes and assessment of policy reform intensity for conservation agriculture
targets regulations Price incentives Public expenditure Policy reform intensity
• Can help to signal CA as a policy priority
• N/R • Subsidy may not be required if support to rental market for direct seeders
• Rebalancing of support policies can promote rotations
• Pilot programmes with lead/larger farmers for demonstration
• Capacity development of public extension and private extension support services
**
Source: FAO, 2016.
Note: For the column “policy reform intensity”, the score reflects: * ranks low: needs high intensity of reform while *** ranks high: needs little / low intensity of reform.


Adoption of climate technologies in the agrifood sector - Methodology
49
Annex 1 – The FAO water-Energy-Food Nexus Assessment
The FAO water-energy-food nexus approach (Figure A1.1) explicitly addresses complex interactions and feedback between human and natural systems. The resource base includes both natural and socio-economic resources on which humans depend to achieve social, environmental and economic goals pertaining to water, energy and food. Nexus interactions concern how we use and manage resource systems, describe inter-dependencies, and identify constraints (that impose conditions or a trade-off) and synergies (that reinforce or have shared benefits).
In order to make the nexus concept operational, the three following non-sequential sets of activities can be distinguished that should be undertaken through stakeholder involvement.
42 FAO, 2014. Walking the Nexus Talk: Assessing the Water-Energy-Food Nexus in the Context of the Sustainable Energy for All Initiative
• evidence: Data is collected and analysed in
order to discuss and identify the inter-linkages
of water, energy and food systems and the
impacts that any change can have on the
system;
• scenario development: Possible impacts
of specific interventions or policies on
the natural environment and society are
identified, assessed and discussed; and
• response options: Different stakeholders
engage in an open and participatory dialogue
to build consensus among themselves on
specific policy issues and decide how to
intervene.
The Nexus Assessment addresses the first two sets through a series of activities related to both qualitative and quantitative assessments
Figure A1.1: The water-energy-food nexus
Source: FAO, 2014 42.

50
(Figure A1.2). It highlights the implications of the different response options on the resource base and what this means for achieving different goals and interests. This helps to prioritise and decide between different possible response options, for example.
The Nexus Assessment can be undertaken rapidly as a desk study, relying as much as possible on existing indicators and using a country typology. It can also be part of a broader approach, engaging with key stakeholders throughout the assessment process. The goal is to:
• have an idea of the sustainability of the
reference system/territorial context (e.g. a
country or a province) and its bio-economic
pressures; and
• evaluate the performance of specific
interventions (such as a new investment or
a new policy) in terms of natural and human
resource use efficiency43.
The assessment can be carried out at different levels and scales, but should always include adequate stakeholder involvement. Indicator matrices and tools can be used for the
43 Natural resources include water, energy and land/food, while human resources include labour and capital
quantitative assessment of the nexus. The specific methodology that can be used to assess and compare different (energy) interventions from a water-energy-food nexus perspective in relation to the context where they are rolled out is illustrated in FAO, 2014d.
Trade-offs and synergies
In practical terms, the nexus approach can help identify and build synergies through our responses to it. This, in turn, can allow for more integrated and cost-effective planning, decision-making, implementation, and monitoring and evaluation.
However, there are some possible trade-offs that can result:
(i) between energy and water efficiency – e.g.
treating wastewater in order to recycle it
requires energy inputs. In a full life-cycle
analysis, the manufacture, transport,
and installation of the various equipment
components, plus any materials consumed,
would need to be taken into account;
(ii) between energy access and energy efficiency
– e.g. distribution of electricity to rural areas
that can enable services such as milk cooling
Figure A1.2: The components of the Nexus Assessment methodology
Source: FAO, 2014.

Adoption of climate technologies in the agrifood sector - Methodology
51
or chilled vegetable storage that reduce
food waste, but can also result in increased
GHG emissions depending on the type of
electricity generation plant; and
(iii) between energy access to increase
agricultural productivity and climate change
mitigation – e.g. the use of cheaper, older
tractors can increase farm productivity and
reduce the drudgery of manual labour, but
they can be far less fuel efficient than more
expensive designs therefore producing higher
emissions of GHGs and also potentially
requiring more repairs and maintenance.
Improved tractor designs with greater energy
efficiency and/or the use of low-carbon
fuels such as biodiesel can reduce GHG
emissions44 but may be more costly to own
and operate.
44 The food versus fuel debate over biofuels, and their sustainable production, is not discussed in this report. For readers wanting more background, a recent STAP advisory document to the GEF “Optimizing the global environmental benefits of transport biofuels” provides relevant information. See: https://www.thegef.org/gef/sites/thegef.org/files/documents/EN_GEF.STAP_.C.48.Inf_.02.pdf
There are also possible synergies:
(i) production and use of biogas on-farm
to displace fossil fuels can reduce GHG
emissions, lead to increased crop yields
through the use of the by-product effluent
as an organic fertilizer, reducing the need for
energy-intensive chemical fertilizer manufacture
and transport thereby reducing crop production
costs and simultaneously enhancing the water
holding capacity of the soil;
(ii) agroforestry systems as a form of
conservation agriculture can sustainably
increase farm productivity, improve soil
quality, provide shade and shelter for
livestock, and also deliver biomass energy
sources from pruning and residues; and
(iii) (iii) increased access to modern energy
services to enable enhanced adaptive
capacity through the ability to increase and
diversify income, for example through adding
value to primary agricultural products and
through their enhanced storage to reduce
food losses.


Adoption of climate technologies in the agrifood sector - Methodology
53
Annex 2 – description of relevant policies
Policies most suited to specific climate technologies/practices under consideration in this methodology are detailed below.
Table A2.1: Main thematic policy and regulatory areas for agrifood climate technology and practices
Target setting Overall target Most countries promoting climate change mitigation and adaptation at the local level have set voluntary targets for GHG emission reductions and/or the promotion of climate-friendly technologies and practices. They often aim for energy savings and improved production efficiency, but can also include renewable energy.
Sector specific Some countries have voluntary or mandatory targets for reducing CO2 emissions from the agrifood sector. These may directly address the agriculture and/or food industry, or can target RE demand by specific sectors, including agrifood. Typical targets are in the range of a 10-20 percent reduction of CO2 emissions in around 20 years or 20-40 percent in around 30 years. In the agrifood sector, targets can apply to GHG emissions related to enteric fermentation and manure management, cropping systems, agricultural land, residue use, etc. Within the sector, targets can be technology-specific. Examples are targets set by governments in terms of total solar water heater collector area; increase in area under specific irrigation practices; or efficiency standards for agricultural machinery.
“Sticks”Regulatory schemes based on legal responsibility and jurisdiction
Standards and mandates
Performance standards apply mostly to technology and equipment and are usually established by national or state governments to prevent less efficient technology designs from entering the market. Performance standards create greater confidence in the reliability and performance of the technology, thus reducing investment risks. Mandates apply instead to both technologies and practices, and may influence their market deployment/adoption. For instance, mandatory quantities of biogas production from animal, crop and food processing residues may influence the adoption of these practices.
Tax impositions
A carbon levy has been introduced in some countries by the state or national governments. Taxation on emissions may be specific to industrial-related technology and practices such as food processing stages (heating, drying, cooling, etc.). Therefore, tax policies may be more appropriate to incentivise changes in these practices.
“Carrots”Financial incentive schemes
(i) Investmentincentives
Capital grants and rebates
While some of the changes in practices and technological interventions have relative low initial capital requirements, some other technologies and systems may require significant investments. For instance, installations such as solar thermal and geothermal heating and some irrigation systems may be capital intensive, but with relatively low running costs. Capital grants are a straightforward incentive to reduce the up-front investment costs for the purchaser. This is a very common type of support used by central governments as it is relatively easy to administer. Grants or subsidies may be offered either to the owners or developers of the installations, or directly to the manufacturers of the technologies. It is more usual that grants are offered in support of the demand-side market (owners and developers) as grants for selected manufacturers may interfere with competition.
Operating grants
Once a new technology/system is adopted, there can be operating costs that affect the payback time of the technology. The policymaker can thus intervene by providing grants to cover these costs for a period of time. For instance, in the case of energy producing technologies, these incentives provide cash payments based on the amount of energy generated, typically on a USD/kWh basis for the production of RE, or USD/GJ for heat. Payments based on system performance, rather than on capital investment, may place more emphasis on choosing better quality installations. The distributed nature of heat supply at the small- to medium-scale complicates the implementation of operation grants due to a lack of cost-effective metering and monitoring procedures that are often only practical for larger systems. As an example, the new French Heat Fund of EUR 1 billion for the 2009-2011 period supports the operation of RE heating installations based on the real heat production during the two first running years. Additional funds are already secured for the next period.

54
Additional relevant barriers or incentives lie outside the remit of climate change and the proposed technologies/practices. One obvious example concerns land tenure.
Land tenure consolidation has an important impact on reducing transport or tractor operations, hence energy consumption, but lack of clear tenure rights is a barrier to investment.
Soft loans and loan guarantees
Financial assistance in the form of low or zero-interest loans over a long term, and/or loan guarantees, effectively lowers the cost of capital. Since the high up-front cost is often a deterrent for potential investors, lowering it can effectively bring down the average cost per unit and hence reduce the investment risk. Loans offered at subsidised interest rates (defined as soft loans) may also incorporate long repayment periods and/or payment deferments. This type of incentive is easily implemented by banking institutions that normally provide investment support to developers.Banks often hesitate to provide loans for technologies/practices that are still developing a market presence, but when they become “bankable”, this may pave the way for project developers to accrue additional funding sponsorship. Very little risk for the administrative body is associated with soft loans and loan guarantees, but they do not necessarily encourage investors to purchase the most reliable systems or maintain them adequately.
(ii) Fiscal incentives
Tax credits and planning cost reductions
Under the definition of a tax deduction support scheme, investments in new technology/practice represent an expense to a taxpayer. Credits or deductions may be a percentage of the total investment or a pre-defined, fixed sum per intervention.Only parties with an income or property tax can usually benefit, which therefore provides no incentive to potential investors without such tax liabilities (unless, as in France, they receive a tax credit from the government that then, one year after the expenditure, pays about half of the eligible amount within a fixed limit). Investment tax credits cover either a percentage or the full costs of intervention. These are especially good for the early diffusion of early market technologies whose costs are relatively high, since they increase the rate of return or decrease the payback period.
Tax reductions and accelerated depreciation
A tax reduction or tax exemption system reduces the amount of tax that must be paid in total, thus reducing the total cost of investment in a project. The incentive option usually has a relatively low burden for administrative and transaction costs, but the overall level of fiscal incentive needs to be carefully established to achieve successful outcomes.Tax reduction systems could include relief from taxes on sales and property and exemptions of paying value-added tax on sustainable technologies and practices. External benefits provided to support these interventions could occur in the form of exemptions from eco-taxes and carbon charges, or local energy taxes imposed on conventional fuels.
“Guidance”Knowledge and education schemes
Information and promotion
A lack of information regarding resource availability, technology development and potential, and product availability may inhibit investment in applications simply due to a lack of awareness. Education to promote sustainable climate technologies and practices aims to enhance the awareness of the general public, specific stakeholders, or private businesses by undertaking information campaigns and promotional activities, such as project demonstrations. This type of support may take the form of technical assistance, financial advice, labelling of appliances, or information distribution. Information on resource availability (and analysis, where needed), the benefits and potential of sustainable climate technologies and practices, and assistance with applying for available central government incentives can be made available in a variety of forms.
Training Training programmes may be established in schools, universities, or amongst key professional groups so they consist of well-informed, skilled individuals and networks. Skilled professionals are needed to foster the adoption of sustainable climate technologies and practices, particularly when they required specific advanced technical knowledge. Information and knowledge-based promotion must be provided in conjunction with other political tools, including geographic information system databases (GIS) and media campaigns.
Source: Adapted from IEA, 2009.

55
ackerman, F. & Bueno, r. 2011. Use of McKinsey cost curves for climate economics modelling. Working Paper WP-US-1102. Stockholm Environment Institute. Available at: http://sei-international.org/mediamanager/documents/Publications/Climate/sei-workingpaperus-1102.pdf).
Bank al-Maghrib. 2016. Monetary and financial statistics. Interest rates. Available at: http://www.bkam.ma/wps/portal/net/kcxml/04.
Berrada, a. 2009. Assessment of Drip Irrigation in Morocco with Particular Emphasis on the Plain of Tadla. Available at: http://www.colostate.edu/dept/aes/Pubs/pdf/ltb09-1.pdf.
Beria, P., Maltese, i. & Mariotti, i. 2012. Multicriteria versus cost benefit analysis: a comparative perspective in the assessment of sustainable mobility. Eur. Transp. Res. Rev. 4, 137–152. DOI 10.1007/s12544-012-0074-9.
Browne, d. & ryan, l. 2011. Comparative analysis of evaluation techniques for transport policies. Environmental Impact Assessment Review, 31(3), 226-233.
cbonds. 2012. New bond issue: Morocco sells USD 1 bn in 2022 bonds with 4.250% coupon. Available at: http://cbonds.com/news/item/620001.
chakrawal, P. n. 2010. Micro-irrigation - an energy and water saving technique. Available at: http://www.plastemart.com/Plastic-Technical-Article.asp?LiteratureID=1822&Paper=micro-irrigation-water-energy-saving-technique.
ecoFYs. 2008. Global Potential of Renewable Energy Sources: a Literature Assessment. Background Report by Hoogwijk M and Graus W.
energypedia. 2013. Mongolia Energy Situation. Available at: https://energypedia.info/wiki/Mongolia_Energy_Situation.
energypedia. 2015. Uzbekistan Energy Situation. Available at: https://energypedia.info/wiki/Uzbekistan_Energy_Situation.
enkvist, P.a., naucler, t., & rosander, J. 2007. A cost curve for greenhouse gas reduction. In McKinsey Quarterly. Available at: http://www.mckinsey.com/insights/sustainability/a_cost_curve_for_greenhouse_gas_reduction.
eurasianet.org. Accessible at: http://www.eurasianet.org/node/69446;%20http://eneken.ieej.or.jp/data/4478.pdf.
european commission. 2013. How to develop a sustainable energy action plan (SEAP) in the Southern Mediterranean Partner Countries. Report by the Joint Research Centre of the European Commission.
european Parliament and council. 2008. Directive 2008/1/EC of the European Parliament and of the Council of 15 January 2008 concerning integrated pollution prevention and control. Available at: http://eur-lex.europa.eu/LexUriServ/LexUriServ.do?uri=OJ:L:2008:024:0008:0029:en:PDF.
euroradio. 2014. Belarus raises gas, heating and electricity tariffs for households. Available at: http://euroradio.fm/en/belarus-raises-gas-heating-and-electricity-tariffs-households.
Fao. The Ex-Ante Carbon-balance Tool (EX-ACT). Accessed at: http://www.fao.org/tc/exact/ex-act-home/en/.
Fao. The Global Livestock Environmental Assessment Model. Accessed at: http://www.fao.org/gleam/en/.
Fao. 2011a. Energy-smart food for people and climate. Issue Paper. Food and Agriculture Organization of the United Nations, Rome.
rEFErENCES

56
Fao. 2011b. Green manure/cover crops and crop rotation in Conservation Agriculture on small farms. In Integrated Crop Management. Vol.12-2010. Food and Agriculture Organization of the United Nations, Rome.
Fao. 2014a. Post 2015 and the Sustainable Development Goals – Nourishing People, Nurturing the Planet – Climate Change. Food and Agriculture Organization of the United Nations, Rome.
Fao. 2014b. Ukraine Soil Fertility to strengthen climate resilience. Preliminary assessment of the potential benefits of conservation agriculture. Food and Agriculture Organization of the United Nations & World Bank. Rome.
Fao. 2014c. The Water-Energy-Food Nexus. A new approach in support of food security and sustainable agriculture. Food and Agriculture Organization of the United Nations, Rome.
Fao. 2014d. Walking the nexus talk: assessing the water-energy-food nexus in the context of the Sustainable Energy for All initiative. Climate, Energy and Tenure Division (NRC), Food and Agricultural Organization of the United Nations. Rome. Available at: http://www.fao.org/3/a-i3959e.pdf.
Fao. 2016. Morocco: Adoption of climate technologies in the agrifood sector. Food and Agriculture Organization of the United Nations, Rome.
Fischedick, M., r. schaeffer, a. adedoyin, M. akai, t. Bruckner, l. clarke, V. Krey, i. savolainen, s. teske, d. Ürge-Vorsatz, r. Wright. 2011. Mitigation Potential and Costs. In IPCC Special Report on Renewable Energy Sources and Climate Change Mitigation [O. Edenhofer, R. Pichs-Madruga, Y. Sokona, K. Seyboth, P. Matschoss, S. Kadner, T. Zwickel, P. Eickemeier, G. Hansen, S. Schlömer, C. von Stechow (eds)], Cambridge University Press, Cambridge, United Kingdom and New York, NY, USA.
garmendia, e., & gamboa, g. 2012.Weighting social preferences in participatory multicriteria evaluations: a case study on sustainable natural resource management. Ecological Economics 84, 110-120. DOI: 10.1016/j.ecolecon.2012.09.004.
gittinger, J.P. 1982. Economic analysis of agricultural Projects. Series in Economic development. The World Bank. Baltimore.
hoff, h. 2011. Understanding the Nexus. Background Paper for the Bonn 2011 Conference “The Water, Energy and Food Security Nexus”. Stockholm, Sweden, Stockholm Environment Institute (SEI).
iea. 2008. Deploying Renewables. Principles for effective policies. Paris, OECD/IEA.
iea. 2014. World Energy Outlook 2014. Paris, OECD/IEA.
iMF. 2016. Morocco - 2015 Article IV Consultation—Press Release; Staff Report; and Statement by the Executive Director for Morocco. IMF Country Report No. 16/35. International Monetary Fund. Washington, D.C.
iPcc. 2006. Guidelines for National Greenhouse Gas Inventories. Available at: http://www.ipcc-nggip.iges.or.jp/public/2006gl/index.html.
irena. 2016. Renewable Energy Benefits: Measuring the Economics. IRENA, Abu Dhabi.
institute for War & Peace reporting (iWPr). 2014. Armenians Shocked at Electricity Price Rise. CRS Issue 743 (available at https://iwpr.net/global-voices/armenians-shocked-electricity-price-rise).
livermore, M.a., revesz, r.l. 2013. The Globalization of Cost-Benefit analysis in Environmental Policy. Oxford University Press. New York.
Ministry of Foreign affairs of the republic of tajikistan. 2016. The energy sector of the Republic of Tajikistan. Available at: http://mfa.tj/en/energy-sector/the-energy-sector-of-rt.html.
oilprice.com. 2014. Free Energy Ride over in Turkmenistan. Available at: http://oilprice.com/Energy/Energy-General/Free-Energy-Ride-Over-in-Turkmenistan.html.

57
Packey, d. J. 1993. Market penetration of new energy technologies. NREL/TP-462-4860, UC Category: 233, DE92016409. Colorado, USA, National Renewable Energy Laboratory. Available at: http://www.nrel.gov/docs/legosti/old/4860.pdf.
Pellerin s., Bamière l., angers d., Béline F., Benoît M., Butault J.P., chenu c., colnenne-david c., de cara s., delame n., doreau M., dupraz P., Faverdin P., garcia-launay F., hassouna M., hénault c., Jeuffroy M.h., Klumpp K., Metay a., Moran d., recous s., samson e., savini i., & Pardon l. 2013. How can French agriculture contribute to reducing greenhouse gas emissions? Abatement potential and cost of ten technical measures. Synopsis of the study report, INRA. France. 92 pp.
Regional Center for Renewable Energy and Energy Efficiency (RCREEE). 2013. Latest Electricity Price Schemes in RCREEE Member States. Available at: http://www.rcreee.org/sites/default/files/rs_latest_-electricity_-prices_schemes_in_rcreee_-ms_6-2013_en.pdf.
reeeP. 2014. Making the Case: How Agrifood Firms are Building New Business Cases in the Water-Energy-Food Nexus. Paper prepared for FAO.
schlömer, s., Bruckner, t., Fulton, l., hertwich, e., McKinnon, a., Perczyk, d., roy, J., schaeffer, r., sims, r., smith, P., & Wiser, r. 2014. Annex III. Technology-specific cost and performance parameters. In Climate Change 2014: Mitigation of Climate Change. Contribution of Working Group III to the Fifth Assessment Report of the Intergovernmental Panel on Climate Change. Available at: https://www.ipcc.ch/pdf/assessment-report/ar5/wg3/ipcc_wg3_ar5_annex-iii.pdf.
schulte, r., crosson, P., donnellan, t., Farrelly, n., Finnan, J., lalor, s., lanigan, g., o’Brien, d., shalloo, l., & thorne, F. 2012. A marginal abatement cost curve for Irish agriculture. Teagasc submission to the National Climate Policy Development Consultation. Teagasc, Oak Park, Carlow. April 2012. Available at: http://www.teagasc.ie/publications/2012/1186/1186_Marginal_Abatement_Cost_Curve_for_Irish_Agriculture.pdf.
sims, r.e.h., Flammini, a., Puri, M., Bracco, s. 2015. Opportunities for Agrifood Chains to Become Energy-Smart. FAO/USAID. Available at: http://www.fao.org/publications/card/en/c/0ca1c73e-18ab-4dba-81b0-f8e480c37113/.
sims, r.e.h., schock, r.n., adegbululgbe, a., Fenhann, J., Konstantinaviciute, i., Moomaw, W., nimir, h.B., schlamadinger, B., torres-Martínez, J., turner, c., uchiyama, Y., Vuori, s.J.V., Wamukonya, n., & zhang, X. 2007. Energy supply. In Climate Change 2007: Mitigation. Contribution of Working Group III to the Fourth Assessment Report of the Intergovernmental Panel on Climate Change. Cambridge, United Kingdom and New York, NY, USA, Cambridge University Press.
smith, J., smith, P., Wattenbach, M., gottschalk, P., romanenkov, V.a., shevtsova, l.K., sirotenko, o.d., rukhovich, d.o., Koroleva, P.V., romanenko, i.a., & lisovo, n.V. 2007. Projected changes in the organic carbon stocks of cropland mineral soils for Europe, the Russian Federation and the Ukraine, 1990-2070. In Global Change Biology, 13, 342-356.
trading economics. 2015. CO2 emissions from solid fuel consumption (kt) in Morocco. Available at: http://www.tradingeconomics.com/morocco/co2-emissions-from-solid-fuel-consumption-kt-wb-data.html.
united nations economic commission for europe (unece). Promoting Energy Efficiency Investments for Climate Change Mitigation and Sustainable Development: Case Study, Azerbaijan. Available at: http://www.unece.org/fileadmin/DAM/energy/se/pdfs/gee21/projects/cs/CS_Azerbaijan.pdf.
Waccexpert. 2016. Country – Sector. Online. Available at: http://www.waccexpert.com/?country=1732§or=140&detailledView=true
Wang, J., Jin, Y-Y. & zhang, c-F. 2009. Weighting methodologies in multi‐criteria evaluations of combined heat and power systems, International Journal of Energy Research, 33(12), 1023 - 1039. DOI:10.1002/er.1527.

58
World Bank. 2010. Farm Mechanization: A New Challenge for Agriculture in Low and Middle Income Countries of Europe and Central Asia. Working paper no. P 533’ 8-SA5. World Bank and Food and Agricultural Organization of the United Nations.
World Bank. 2014. Maroc - Projet d’approvisionnement en eau potable en milieu rural. Washington, DC: World Bank Group. Available at: http://documents.worldbank.org/curated/en/2014/04/19737537/morocco-rural-water-supply-project-maroc-projet-d’approvisionnement-en-eau-potable-en-milieu-rural.
World Bank. 2015a. Morocco - Clean and Efficient Energy Project. Washington, DC: World Bank Group. Available at: http://documents.worldbank.org/curated/en/2015/04/24328711/morocco-clean-efficient-energy-project.
World Bank. 2015b. Morocco - Large Scale Irrigation Modernization Project. Washington, D.C.: World Bank Group. Available at: http://documents.worldbank.org/curated/en/2015/07/24677692/morocco-large-scale-irrigation-modernization-project.


Please address comments and inquiries to:Investment Centre DivisionFood and Agriculture Organization of the United Nations (FAO)Viale delle Terme di Caracalla – 00153 Rome, Italy [email protected]/investment/en
Report No. 12 – April 2017
Adoption of climate technologies in the agrifood sector - M
ethodologyReport N
o. ?
Adoption of climate technologies in the agrifood sectorMethodology
I7022EN/1/03.17
ISBN 978-92-5-109704-5
9 7 8 9 2 5 1 0 9 7 0 4 5