Adopting Agile Software Development Practices: Success ...Agile software development is an emerging...
280
Adopting Agile Software Development Practices: Success Factors, Changes Required, and Challenges by Subhas Chandra Misra M.C.S. (Computer Science), University of New Brunswick, Fredericton, Canada M.Tech. (Computer Science), Indian Institute of Technology (IIT), Kharagpur B.Eng. (Electronics & Telecommunications Engineering), Andhra University, India A thesis submitted to the Faculty of Graduate Studies and Research in partial fulfillment of the requirements for the degree of Doctor of Philosophy in Management Carleton University Ottawa, Ontario, Canada © Subhas Chandra Misra April 15, 2007 Reproduced with permission of the copyright owner. Further reproduction prohibited without permission.
Transcript of Adopting Agile Software Development Practices: Success ...Agile software development is an emerging...

Adopting Agile Software Development
Practices: Success Factors, Changes
Required, and Challenges
by
Subhas Chandra Misra
M.C.S. (Computer Science), University of New Brunswick, Fredericton, Canada
M.Tech. (Computer Science), Indian Institute of Technology (IIT), Kharagpur
B.Eng. (Electronics & Telecommunications Engineering), Andhra University, India
A thesis submitted to the
Faculty of Graduate Studies and Research
in partial fulfillment
of the requirements for the degree of
Doctor of Philosophy in Management
Carleton University
Ottawa, Ontario, Canada
© Subhas Chandra Misra
April 15, 2007
Reproduced with permission of the copyright owner. Further reproduction prohibited without permission.

Library and Archives Canada
Bibliotheque et Archives Canada
Published Heritage Branch
395 Wellington Street Ottawa ON K1A 0N4 Canada
Your file Votre reference ISBN: 978-0-494-27106-3 Our file Notre reference ISBN: 978-0-494-27106-3
Direction du Patrimoine de I'edition
395, rue Wellington Ottawa ON K1A 0N4 Canada
NOTICE:The author has granted a nonexclusive license allowing Library and Archives Canada to reproduce, publish, archive, preserve, conserve, communicate to the public by telecommunication or on the Internet, loan, distribute and sell theses worldwide, for commercial or noncommercial purposes, in microform, paper, electronic and/or any other formats.
AVIS:L'auteur a accorde une licence non exclusive permettant a la Bibliotheque et Archives Canada de reproduire, publier, archiver, sauvegarder, conserver, transmettre au public par telecommunication ou par I'lnternet, preter, distribuer et vendre des theses partout dans le monde, a des fins commerciales ou autres, sur support microforme, papier, electronique et/ou autres formats.
The author retains copyright ownership and moral rights in this thesis. Neither the thesis nor substantial extracts from it may be printed or otherwise reproduced without the author's permission.
L'auteur conserve la propriete du droit d'auteur et des droits moraux qui protege cette these.Ni la these ni des extraits substantiels de celle-ci ne doivent etre imprimes ou autrement reproduits sans son autorisation.
In compliance with the Canadian Privacy Act some supporting forms may have been removed from this thesis.
While these forms may be included in the document page count, their removal does not represent any loss of content from the thesis.
Conformement a la loi canadienne sur la protection de la vie privee, quelques formulaires secondaires ont ete enleves de cette these.
Bien que ces formulaires aient inclus dans la pagination, il n'y aura aucun contenu manquant.
i * i
CanadaReproduced with permission of the copyright owner. Further reproduction prohibited without permission.

Dedicated to my family
2
Reproduced with permission of the copyright owner. Further reproduction prohibited without permission.

Acknowledgements
I would like to acknowledge sincere gratitude to those people whose help, support, and
encouragement enabled me to write this Doctoral Thesis. First and foremost, I am
sincerely thankful to Professor Vinod Kumar, and Professor Uma Kumar for
mentoring, encouraging, and supporting me at all stages of my Ph.D. program. Apart
from providing extremely commendable advices for resolving the academic challenges
involved with this Doctoral Thesis, they also provided me with extreme encouragement
for encountering the other challenges that are typically faced during any doctoral
program. They are always very eager to see me succeed and progress further. They
have been parent-like figures for me, and will also remain as role models in my career.
I am grateful to Professor Roland Thomas for providing me valuable guidance with
some of the Statistics related issues that I encountered while analyzing the survey data.
The members of the Doctoral Thesis Committee, particularly Professor Aaron
Nsakanda and Professor Shaobo Ji, deserve my special thanks for willing to
painstakingly review this work and provide valuable comments. Sincere thanks are also
due to Professor Lousie Heslop for all the support and encouragement she has been
provided to me in different ways during the last few years. The administrative staff in
the Sprott School, particularly Ms. Janice Walker and Ms. Anne Irvin, for the number
of ways they helped me during the course of this degree program.
I am also thankful to the Ontario Government for providing me the Ontario
Graduate Scholarship (OGS) during three consecutive years (2004-2005, 2005-2006,
and 2006-2007), Carleton University for awarding me the Tuition Fee Waiver
scholarship and the F.C. Mittal Award, and Eric Sprott School of Business for
awarding me the Sprott Scholarship. I am also thankful to the organizers of the BIS
2003 (USA) for providing me a Best Student Paper Award for one of my published
articles, which encouraged me to do research in this domain. I am also thankful to the
Natural Sciences and Engineering Research Council of Canada (NSERC) for
encouraging me to do further research in the area of Agile Software Development by
offering me the prestigious NSERC Post-Doctoral Fellowship.
3
Reproduced with permission of the copyright owner. Further reproduction prohibited without permission.

I would like to thank all the survey participants who took their valuable time to
respond to the survey questionnaire. During the course of the survey, several respondents
even wrote words of encouragement regarding the work done in this Thesis. Since it is
not possible to name each and all of them, I would take this opportunity to thank them all
for their good words and support.
Finally, and most importantly, I would like to thank all my family members, for their
continuous encouragement and support during the course of this Doctoral program.
4
Reproduced with permission of the copyright owner. Further reproduction prohibited without permission.

Abstract
Agile software development is an emerging approach in software engineering, initially
proposed and promoted by a group of seventeen software professionals who practice a set
of “lightweight” methods, and share a common set of values of software development.
They consolidated their thoughts, and defined these methods as “agile”. The approaches
are based on experiences, and best practices from the past by the above-mentioned group
of seventeen software professionals. As an emerging approach of this century, agile
software development has undergone limited number of empirical studies.
In this Thesis, we advance the state-of-the-art of the research in this area by conducting
survey-based ex-post-facto empirical (quantitative) studies by identifying the success
factors from the perspective of software practitioners in agile software development
projects, determining the key changes traditional projects have to undergo to adopt agile
practices in their projects, and the challenges/risks they have to undergo for transition.
We describe theoretical frameworks we have developed to address our research
questions, the hypotheses we have conjectured, the research methodology, the data
analysis techniques we have used, and the results we have obtained from the data
analysis.
The study was conducted using a survey-based methodology consisting of respondents
who practice agile software development methodologies and who have experience
practicing plan-driven software development in the past. The study indicates that nine of
the fourteen hypothesized factors have statistically significant relationship with success.
It also suggests a ranked list of changes required and challenges involved in adopting
5
Reproduced with permission of the copyright owner. Further reproduction prohibited without permission.
agile software development methodologies by projects practicing plan-driven software
development.
6
Reproduced with permission of the copyright owner. Further reproduction prohibited without permission.

Table of Contents
ACKNOWLEDGEMENTS.......................................................................................................................... 3
ABSTRACT................................................................................................................................................... 5
TABLE OF CONTENTS.............................................................................................................................. 7
LIST OF FIGURES.................................................................................................................................... 11
LIST OF TABLES.......................................................................................................................................12
CHAPTER 1 INTRODUCTION................................................................................................................ 15
1.1 B a c k g r o u n d ........................................................................................................................................................................ 15
1.2 M o t iv a t io n a n d R e s e a r c h Q u e s t io n s .................................................................................................................. 16
1.3 R e l e v a n t T h e o r ie s .......................................................................................................................................................... 20
1.4 Re s e a r c h M e t h o d o l o g y ............................................................................................................................................. 21
1.5 D a t a A n a l y s is T e c h n iq u e s ........................................................................................................................................ 22
1.6 O r g a n iz a t io n o f t h is T h e s is ......................................................................................................................................23
CHAPTER 2 AGILE SOFTWARE DEVELOPMENT...........................................................................24
2.1 E v o l u t io n o f So f t w a r e D e v e l o p m e n t .................................................................................................................24
2 .2 H is t o r y a n d E v o l u t io n o f A g il e So f t w a r e D e v e l o p m e n t ......................................................................28
2.3 A g il e M a n if e s t o ............................................................................................................................................................... 28
2 .4 P r in c ip l e s o f A g il e So f t w a r e D e v e l o p m e n t ...................................................................................................29
2.5 C r it ic is m s o f A g il e So f t w a r e D e v e l o p m e n t ...................................................................................................33
CHAPTER 3 SUCCESS FACTORS OF AGILE SOFTWARE DEVELOPMENT PROJECTS 37
3.1 A g il e So f t w a r e D e v e l o p m e n t P r o je c t Su c c e s s ............................................................................................ 37
3 .2 Su c c e s s F a c t o r s ...............................................................................................................................................................44
3.2.1 Organizational F actors .................................................................................................................................... 44
3.2.2 People Factors..................................................................................................................................................... 51
3.2.3 Summary o f Independent Variables...............................................................................................................57
3.3 Re s e a r c h H y p o t h e s e s f o r Id e n t if y in g t h e Su c c e s s F a c t o r s .................................................................60
CHAPTER 4 CHANGES AND CHALLENGES/RISKS IN ADOPTING AGILE PRACTICES IN
TRADITIONAL SOFTWARE DEVELOPMENT PROJECTS.............................................................63
4.1 H o m e -G r o u n d C h a r a c t e r is t ic s : R a t io n a l e fo r C h a n g e ......................................................................64
7
Reproduced with permission of the copyright owner. Further reproduction prohibited without permission.
4 .2 C h a n g e s a n d C h a l l e n g e s ...........................................................................................................................................67
4.2.1 Changes Required................................................................................................................................................72
4.2.2 Challenges Involved............................................................................................................................................74
CHAPTER 5 RESEARCH METHODOLOGY....................................................................................... 81
5.1 R e s e a r c h M e t h o d o l o g ie s : C h o ic e s & R a t io n a l e .........................................................................................82
5.1.1 Research D esign ..................................................................................................................................................82
5.1.2 D ata Source: Surveys ........................................................................................................................................ 82
5.1.2.1 Survey Technique............................................................................................................................................83
5.1.2.2 Questionnaire Design...................................................................................................................................... 85
5.1.2.3 Identifying the Respondents.......................................................................................................................... 86
5.1.2.4 Response Rate................................................................................................................................................. 89
5.1.2.5 Pre-Testing the Questionnaire........................................................................................................................ 91
CHAPTER 6 DATA ANALYSIS............................................................................................................... 92
6.1 D a t a P r e p a r a t io n ........................................................................................................................................................... 93
6.1.1 D ata Logging ........................................................................................................................................................93
6.1.2 E ditin g ....................................................................................................................................................................94
6.1.3 D ata E n try ............................................................................................................................................................ 95
6.2 D a t a A n a l y s i s ........................................................................................................................................................... 95
6.2.1 Research Question 1 .......................................................................................................................................... 96
6.2.1.1 Descriptive Statistics...................................................................................................................................... 96
6.2.1.2 Test of Internal Consistency Reliability...................................................................................................... 105
6.2.1.3 Linear Multiple Regression Analysis...........................................................................................................106
6.2.1.4 Success Factors Suggested by Respondents...............................................................................................119
6.2.1.5 Discussions.....................................................................................................................................................128
6.2.2 Research Question 2 ........................................................................................................................................ 131
6.2.2.1 Descriptive Statistics.....................................................................................................................................132
6.2.2.2 Test of Internal Consistency Reliability...................................................................................................... 133
6.2.2.3 t-test.................................................................................................................................................................135
6.2.2.4 Ranking.......................................................................................................................................................... 136
6.2.2.5 Changes Suggested by Respondents............................................................................................................139
6.2.2.6 Discussions.....................................................................................................................................................143
6.2.3 Research Question 3 ........................................................................................................................................ 144
6.2.3.1 Descriptive Statistics.....................................................................................................................................145
6.2.3.2 Test of Internal Consistency Reliability...................................................................................................... 147
6.2.3.3 t-test.................................................................................................................................................................147
6.2.3.4 Ranking.......................................................................................................................................................... 148
6.2.3.5 Challenges Suggested by Respondents....................................................................................................... 152
8
Reproduced with permission of the copyright owner. Further reproduction prohibited without permission.

6 .23.6 Discussions 155
CHAPTER 7 DISCUSSIONS................................................................................................................... 158
7.1 P e r s p e c t iv e ....................................................................................................................................................................... 158
7 .2 Su c c e s s F a c t o r s .............................................................................................................................................................159
7.3 C h a n g e s R e q u ir e d ......................................................................................................................................................... 181
7 .4 C h a l l e n g e s In v o l v e d ..................................................................................................................................................186
CHAPTER 8 CONCLUSIONS................................................................................................................ 196
8.1 Su m m a r y ............................................................................................................................................................................. 196
8 .2 C o n t r ib u t io n s .................................................................................................................................................................198
8.3 F u t u r e W o r k ...................................................................................................................................................................201
APPENDIX A COVERING LETTERS..................................................................................................220
A .I . L e t t e r 1 .............................................................................................................................................................................220
A .2. L e t t e r I I ............................................................................................................................................................................221
A .3. L e t t e r I I I .......................................................................................................................................................................... 222
APPENDIX B SURVEY QUESTIONNAIRE........................................................................................223
APPENDIX C LABELS OF VARIABLES USED IN THE STUDY....................................................230
C. 1. V a r ia b l e s u s e d in R e s e a r c h Q u e s t io n 1 ........................................................................................................230
C .2. V a r ia b l e s u s e d in R e s e a r c h Q u e s t io n 2 ........................................................................................................231
C .3. V a r ia b l e s u s e d in R e s e a r c h Q u e s t io n 3 ........................................................................................................232
APPENDIX D FEEDBACK TO OPEN-ENDED QUESTIONS...........................................................234
D .l . L ist o f O t h e r Su c c e s s F a c t o r s O b t a in e d f r o m O p e n -E n d e d Q u e s t io n s ..................................... 234
D .2. L ist o f O t h e r C h a n g e s O b t a in e d f r o m O p e n -E n d e d Q u e s t io n s .......................................................242
D .3. L ist o f O t h e r C h a l l e n g e s O b t a in e d fr o m O p e n -E n d e d Q u e s t io n s ............................................... 245
APPENDIX E ADDITIONAL STATISTICAL RESULTS...................................................................247
E. 1. R e s e a r c h Q u e s t io n 1: C o n s o l id a t e d D e p e n d e n t V a r ia b l e Su c c e s s ..............................................247
E l .l . D etailed D escriptive Statistical R esu lts .................................................................................................... 247
E l. 2. Inter-Item Correlation M atrices fo r Variables M easured with M ultiple Item s..............................248
E.1.3. D etailed Regression Analysis T ables ........................................................................................................249
E .2. R e s e a r c h Q u e s t io n 1: In d iv id u a l D e p e n d e n t V a r ia b l e s M e a s u r in g Su c c e s s .........................253
E.2.1. Reduced Delivery Schedules....................................................................................................................... 253
E.2.2. Increased R O I .........................................................................................................................................................2 5 5
E.2.3. Increased Ability to M eet with Current Customer Requirements..................................................... 256
9
Reproduced with permission of the copyright owner. Further reproduction prohibited without permission.

E.2.4. Increased Flexibility to M eet with Changing Customer Requirements...........................................258
E.2.5. Im proved Business Processes ...................................................................................................................... 259
E .3. R e s e a r c h Q u e st io n 2 ................................................................................................................................................. 260
E.3.1. D etailed Results o f Descriptive S tatistics.................................................................................................260
E.3.2. D etailed results o f t- te s t................................................................................................................................266
E.3.3. D etailed Results o f Reliability A n alysis ................................................................................................... 267
E.4. Re s e a r c h Q u e s t io n 3 .......................................................................................................................................... 268
E.4.1. D etailed Descriptive S ta tistics ....................................................................................................................269
E.4.2. Inter-Item Correlation ................................................................................................................................... 276
E.4.3. t-Test................................................................................................................................................................... 2 7 7
APPENDIX F SUMMARY OF SURVEY RESPONSES...................................................................... 278
F .l . Su c c e s s F a c t o r s Su r v e y ..........................................................................................................................................278
F.2. C h a n g e s Su r v e y ............................................................................................................................................................279
F.3 . C h a l l e n g e s Su r v e y ....................................................................................................................................................279
10
Reproduced with permission of the copyright owner. Further reproduction prohibited without permission.

List of Figures
F ig u r e 3.1: Q u a l it y /T im e /C o s t T r a d e o f f T r ia n g l e in S o f t w a r e D e v e l o p m e n t .......................................39
F ig u r e 3 .2: T h e o r e t ic a l Fr a m e w o r k : Su c c e s s F a c t o r s .........................................................................................58
F ig u r e 4.1 : T r a n s it io n in g T r a d it io n a l So f t w a r e D e v e l o p m e n t P r o c e s s e s in t o A g il e .......................69
F ig u r e 4 .2 : T h e c h a n g e s r e q u ir e d fo r a d o p t in g a g il e pr a c t ic e s in t r a d it io n a l p r o je c t s , a n d t h e
a s s o c ia t e d c h a l l e n g e s /r is k s ......................................................................................................................................70
F ig u r e 6 .1: H is t o g r a m Sh o w in g Fr e q u e n c y V e r s u s R e g r e s s io n S ta n d a r d iz e d R e s id u a l ............... 116
F ig u r e 6 .2: N o r m a l P -P P l o t o f Re g r e s s io n St a n d a r d iz e d R e s id u a l ........................................................... 117
F ig u r e 6 .3: C h e c k f o r e r r o r v a r ia n c e ........................................................................................................................... 118
F ig u r e 7.1 : Re v is e d Su c c e s s F a c t o r s F r a m e w o r k o n t h e B a sis o f S u r v e y D a t a ..................................160
11
Reproduced with permission of the copyright owner. Further reproduction prohibited without permission.

List of Tables
T a b l e 3 .1: A S u m m a r y o f t h e s u c c e ss f a c t o r s a n d t h e ir r e s p e c t iv e a d v o c a t e s .................................... 59
T a b l e 4 .1 : H o m e g r o u n d s o f a g il e a n d t r a d it io n a l / p l a n -d r iv e n m e t h o d s [t a k e n f r o m B o e h m
a n d T u r n e r (2 0 0 3 ) ] ........................................................................................................................................................... 65
T a b l e 6.1: R e s e a r c h Q u e s t io n 1: Su m m a r iz e d D e s c r ip t iv e St a t is t ic s ...........................................................98
T a b l e 6 .2 : P r im a r y id e n t it y o f t h e r e s p o n d e n t s ’ o r g a n iz a t io n s .....................................................................99
T a b l e 6 .3: T h e n u m b e r o f e m p l o y e e s in t h e r e s p o n d e n t s ’ o r g a n iz a t io n s ................................................. 100
T a b l e 6 .4 : T h e n u m b e r o f e m p l o y e e s in t h e r e s p o n d e n t s ’ t e a m .....................................................................101
T a b l e 6 .5: T h e r o l e in t h e r e s p o n d e n t s ’ t e a m ...........................................................................................................101
T a b l e 6 .6: D u r a t io n fo r w h ic h t h e r e s p o n d e n t s h a v e b e e n d e v e l o p in g s o f t w a r e u s in g a g il e
p r in c ip l e s /m e t h o d s ......................................................................................................................................................... 102
T a b l e 6 .7 : D e g r e e o f p r a c t ic e o f a g il e s o f t w a r e d e v e l o p m e n t pr in c ipl e s b y t h e r e s p o n d e n t s .
T h e p e r c e n t a g e v a l u e s r e p r e s e n t t h e p e r c e n t a g e o f t h e r e s p o n d e n t s w h o r e s p o n d e d w h o
SELECTED THAT OPTION IN THE 1 TO 5 LlKERT SCALE.............................................................................................103
T a b l e 6 .8: Re s e a r c h Q u e s t io n 1: R e l ia b il it y S t a t is t ic s Su m m a r y ...............................................................106
T a b l e 6 .9: R e s e a r c h Q u e s t io n 1: Su m m a r iz e d C o r r e l a t io n s T a b l e ............................................................ 107
T a b l e 6 .10: R e s e a r c h Q u e s t io n 1: R e g r e s s io n C o e f f ic ie n t s ..............................................................................112
T a b l e 6 .11: R e s e a r c h Q u e s t io n 1: Re g r e s s io n M o d e l S u m m a r y ..................................................................... 112
T a b l e 6 .12 : R e s e a r c h Q u e s t io n 1: A N O V A T a b l e f r o m R e g r e s s io n A n a l y s is ........................................ 115
T a b l e 6 .13: Re s e a r c h Q u e st io n 1: R e s id u a l s S t a t is t ic s f r o m Re g r e s s io n A n a l y s is .......................... 116
T a b l e 6 .14: Re g r e s s io n M o d e l s fo r D l , D 2, D 3, D 4, a n d D 5 ............................................................................... 119
T a b l e 6 .15 : R e s e a r c h Q u e st io n 2: Su m m a r iz e d D e s c r ip t iv e St a t is t ic a l Re s u l t s ............................... 133
T a b l e 6 .16: Re s e a r c h Q u e st io n 2: R e l ia b il it y St a t is t ic s ...................................................................................134
T a b l e 6 .17 : Re s e a r c h Q u e st io n 2: In t e r -It e m C o r r e l a t io n M a t r k ..............................................................134
T a b l e 6 .18: R e s e a r c h Q u e st io n 2: O n e -S a m p l e t -T e s t .......................................................................................... 136
T a b l e 6 .19: R e s e a r c h Q u e st io n 2: R a n k in g o f t h e C o n s o l id a t e d C h a n g e It e m C a t e g o r ie s 137
T a b l e 6 .20: R e s e a r c h Q u e st io n 2: R a n k in g o f a l l t h e In d iv id u a l C h a n g e It e m s in E a c h C h a n g e
C a t e g o r y ............................................................................................................................................................................. 138
T a b l e 6 .21: R e s e a r c h Q u e st io n 3: S u m m a r iz e d D e s c r ip t iv e S t a t is t ic a l R e s u l t s ............................... 146
T a b l e 6 .22: R e s e a r c h Q u e st io n 3: R e l ia b il it y St a t is t ic s ...................................................................................147
T a b l e 6.23: R e s e a r c h Q u e s t io n 3: S u m m a ry I te m S t a t i s t i c s .............................................................................147
T a b l e 6 .24: R e s e a r c h Q u e st io n 3: O n e -S a m p l e t -T e s t .......................................................................................... 149
T a b l e 6 .25: R e s e a r c h Q u e s t io n 3: R a n k in g o f t h e C h a l l e n g e s ...................................................................... 150
T a b l e C .8 .1 : V a r ia b l e s u s e d in R e s e a r c h Q u e st io n 1 ........................................................................................... 230
T a b l e C .8 .2 : V a r ia b l e s u s e d in R e s e a r c h Q u e st io n 2 ........................................................................................... 231
12
Reproduced with permission of the copyright owner. Further reproduction prohibited without permission.

T a b l e C .8 .3 : V a r ia b l e s U s e d in R e s e a r c h Q u e s t io n 3 ........................................................................................... 232
T a b l e E . 1: R e s e a r c h Q u e s t io n 1: D e t a il e d D e s c r ip t iv e St a t is t ic a l Re s u l t s ......................................... 247
T a b l e E .2 : R e s e a r c h Q u e s t io n 1: In t e r -It e m C o r r e l a t io n M a t r ix fo r It e m s in In d 7 .........................248
T a b l e E .0 .3 : R e s e a r c h Q u e s t io n 1: In t e r -It e m C o r r e l a t io n M a t r ix f o r It e m s in In d I 1 .................. 248
T a b l e E .4: R e s e a r c h Q u e s t io n 1: In t e r -It e m C o r r e l a t io n M a t r ix fo r It e m s in In d 1 2 ...................... 248
T a b l e E .5: R e s e a r c h Q u e s t io n 1: In t e r -It e m C o r r e l a t io n M a t r ix fo r It e m s in In d I 3 ...................... 248
T a b l e E .6: R e s e a r c h Q u e s t io n 1: In t e r -It e m C o r r e l a t io n M a t r ix fo r It e m s in D e p e n d e n t 249
T a b l e E .7: R e s e a r c h Q u e s t io n 1: D e t a il e d C o r r e l a t io n s Re s u l t s .............................................................. 250
T a b l e E .8 : R e s e a r c h Q u e s t io n 1: V a r ia b l e s E n t e r e d /R e m o v e d D u r in g S t e p w is e R e g r e s s io n ....251
T a b l e E .9 : R e s e a r c h Q u e s t io n 1: E x c l u d e d V a r ia b l e s in St e p w is e R e g r e s s io n ....................................252
T a b l e E . 10: R e s e a r c h Q u e s t io n 1: R e g r e s s io n M o d e l S u m m a r y fo r R e d u c e d D e l iv e r y Sc h e d u l e s
................................................................................................................................................................................................... 253
T a b l e E . 11: Re s e a r c h Q u e s t io n 1: A N O V A T a b l e f r o m Re g r e s s io n A n a l y s is w it h R e d u c e d
D e l iv e r y Sc h e d u l e s ...................................................................................................................................................... 254
T a b l e E .12 : R e s e a r c h Q u e s t io n 1: R e g r e s s io n C o e f f ic ie n t s fo r R e d u c e d D e l iv e r y S c h e d u l e s .254
T a b l e E .13 : R e s e a r c h Q u e s t io n 1: R e g r e s s io n M o d e l Su m m a r y f o r In c r e a s e d R O I ..........................255
T a b l e E. 14: R e s e a r c h Q u e s t io n 1: A N O V A T a b l e fr o m R e g r e s s io n A n a l y s is w it h In c r e a s e d R O I
................................................................................................................................................................................................... 255
T a b l e E . 15: R e s e a r c h Q u e s t io n 1: R e g r e s s io n C o e f f ic ie n t s f o r In c r e a s e d R O I ...................................256
T a b l e E . 16: R e s e a r c h Q u e s t io n 1: R e g r e s s io n M o d e l Su m m a r y fo r In c r e a s e d A b il it y t o M e e t
w it h C u r r e n t C u s t o m e r R e q u ir e m e n t s .............................................................................................................256
T a b l e E . 17: R e s e a r c h Q u e s t io n 1: A N O V A T a b l e fr o m R e g r e s s io n A n a l y s is w it h In c r e a s e d
A b il it y t o M e e t w it h C u r r e n t C u s t o m e r R e q u ir e m e n t s ........................................................................ 257
T a b l e E . 18: R e s e a r c h Q u e s t io n 1: R e g r e s s io n C o e f f ic ie n t s T a b l e fo r In c r e a s e d Ab il it y t o M e e t
w it h C u r r e n t C u s t o m e r R e q u ir e m e n t s .............................................................................................................257
T a b l e E . 19: R e s e a r c h Q u e s t io n 1: R e g r e s s io n M o d e l S u m m a r y fo r In c r e a s e d F l e x ib il it y t o
M e e t w it h C h a n g in g C u s t o m e r R e q u ir e m e n t s ..............................................................................................258
T a b l e E .20 : R e s e a r c h Q u e s t io n : A N O V A T a b l e fr o m R e g r e s s io n A n a l y s is w it h In c r e a s e d
F l e x ib il it y t o M e e t w it h C h a n g in g C u s t o m e r R e q u ir e m e n t s ............................................................. 258
T a b l e E .2 1 : R e s e a r c h Q u e s t io n 1: R e g r e s s io n C o e f f ic ie n t s fo r In c r e a s e d F l e x ib il it y t o M e e t
w it h C h a n g in g C u s t o m e r Re q u ir e m e n t s .......................................................................................................... 258
T a b l e E .22 : R e s e a r c h Q u e s t io n 1: R e g r e s s io n M o d e l S u m m a r y fo r I m p r o v e d B u s in e ss P r o c e s s e s
................................................................................................................................................................................................... 259
T a b l e E .23 : R e s e a r c h Q u e s t io n 1: A N O V A T a b l e f r o m R e g r e s s io n A n a l y s is w it h Im p r o v e d
B u s in e s s P r o c e s s e s .........................................................................................................................................................259
13
Reproduced with permission of the copyright owner. Further reproduction prohibited without permission.
T a b l e E .24 : R e s e a r c h Q u e s t io n 1: Re g r e s s io n C o e f f ic ie n t s T a b l e fo r Im p r o v e d B u s in e ss
Pr o c e s s e s .............................................................................................................................................................................260
T a b l e E .25 : R e s e a r c h Q u e s t io n 2: D e t a i l e d D e s c r ip t iv e S t a t i s t i c s ( P a r t I ) .......................................... 260
T a b l e E.26: R e s e a r c h Q u e s t io n 2: D e t a i l e d D e s c r ip t iv e S t a t i s t i c s ( P a r t II)....................................... 262
T a b l e E.27: R e s e a r c h Q u e s t io n 2: O n e -S a m p le T e s t f o r I te m s in C l ........................................................266
T a b l e E.28: R e s e a r c h Q u e s t io n 2: O n e -S a m p le T e s t f o r I te m s in C 2 ........................................................266
T a b l e E.29: R e s e a r c h Q u e s t io n 2: O n e -S a m p le T e s t f o r I te m s in C 4 ........................................................266
T a b l e E .30 : R e s e a r c h Q u e s t io n 2: P a ir e d Sa m p l e s T e s t w it h C o n s o l id a t e d C h a n g e It e m s 267
T a b l e E .3 1: R e s e a r c h Q u e s t io n 2: P a ir e d Sa m p l e s T e s t w it h In d iv id u a l C h a n g e It e m s ................. 267
T a b l e E.32: R e s e a r c h Q u e s t io n 2: R e l i a b i l i t y S t a t i s t i c s f o r I te m s in C l .............................................. 267
T a b l e E .33 : R e s e a r c h Q u e s t io n 2: In t e r -It e m C o r r e l a t io n M a t r ix fo r It e m s in C l ..........................267
T a b l e E.34: R e s e a r c h Q u e s t io n 2: R e l i a b i l i t y S t a t i s t i c s f o r I te m s in C 2.............................................. 268
T a b l e E.35: R e s e a r c h Q u e s t io n 2: I n t e r - I t e m C o r r e l a t i o n M a t r i x f o r I te m s in C 2 .........................268
T a b l e E.36: R e s e a r c h Q u e s t io n 2: R e l i a b i l i t y S t a t i s t i c s f o r I te m s in C 4.............................................. 268
T a b l e E .37 : R e s e a r c h Q u e s t io n 2: In t e r -It e m C o r r e l a t io n M a t r ix f o r It e m s in C 4 ..........................268
T a b l e E .38 : R e s e a r c h Q u e s t io n 3: D e t a il e d D e s c r ip t iv e St a t is t ic s ............................................................269
T a b l e E.39: R e s e a r c h Q u e s t io n 3: I n t e r - i t e m C o r r e l a t i o n M a t r i x ............................................................276
T a b l e E .40 : R e s e a r c h Q u e s t io n 3: P a ir e d S a m pl e s t -T e s t o f C h a l l e n g e V a r ia b l e s .......................... 277
14
Reproduced with permission of the copyright owner. Further reproduction prohibited without permission.

Chapter 1 Introduction
1.1 Background
Agile Software Development (ASD) is currently an emerging software engineering
approach constituting of a set of principles initially advocated by a group of seventeen
software practitioners, and now practiced by many software professionals. The principles
they advocated leading to the emergence of the ASD philosophy are based on best
practices and their previous success and failure experiences with many software
development projects regarding what works and what does not. Each of these
practitioners had their own different philosophies about how they approached software
development. However, all of them advocated close collaboration between software
development and business teams, as opposed to silo development by software teams;
face-to-face communication, as opposed to over-emphasis on written documentation in
projects; frequent delivery of portions of working software, as opposed to final delivery
of the complete product at the end; accepting changing requirements by customers, as
opposed to defining a fixed set of requirements “cast-in-stone”; and adaptive
organizational capability of teams according to changing business requirements. These
principles underlie the philosophy of ASD1 (Fowler and Highsmith, 2001; Fowler, 2002).
1 Chapter 2 has been dedicated for further discussions about A gile Software Development.15
Reproduced with permission of the copyright owner. Further reproduction prohibited without permission.

On the contrary, the traditional software development projects prior to agile were more
focused on following well-defined plans and detailed documentations2. This will be
further clear from the discussions in Chapter 2.
1.2 Motivation and Research Questions
In February 2001, these advocates of the agile philosophy met together, and prepare the
Manifesto for Agile Software Development. Following 20013, many other software
practitioners were inspired by the philosophy behind ASD.
The overall goal of the Thesis is to improve the understanding of the emerging ASD
approach using empirical studies involving projects that have adopted agile software
development practices. In particular, we try to address the following research questions:
Research Question 1. What are the factors that will influence the success o f projects
that want to adopt agile software development practices from
the perspective o f agile software development practitioners?
Research Question 2. What are the important changes required for adopting agile
software development practices in projects practicing
traditional plan-driven software development? Can we rank
them according to their level o f importance?
2 Throughout this Thesis, we use the terms “traditional development” and “plan-driven development” interchangeably. Since traditional development projects were plan-driven, they refer to the same thing. The use o f these terminologies are consistent with the existing pieces o f literature on agile software development.3 It should be clarified that the practices advocated by ASD are not newly identified in 2001. Some o f the practices were being followed by different practitioners for years in their projects. However, the development o f the Agile Manifesto led to the emergence o f a new approach advocated by practitioners
16
Reproduced with permission of the copyright owner. Further reproduction prohibited without permission.

Research Question 3. What are the most important challenges/risks that projects
may encounter for adopting agile software development
practices? Can we rank them according to their level o f
importance?
There is scarcity of literature reporting empirical studies concerning ASD projects.
Although there are plenty of anecdotal experiences reported in the literature with agile
practices, the number of empirical studies is limited to only a few. Some notable
empirical studies can be found in Abrahamson and Koskela (2004), Baheti et al. (2002),
Reiffer (2002), Rumpe and Schroder (2002), Kalermo and Rissanen (2002), and Shine
Technologies (2003).
Reiffer (2002) is one of the first articles reporting survey results on agile methods.
Although the nature of the survey is very simple, using only a small data space, it is
important because it captures the experience of agile software engineers in various
industry types. His studies report a productivity improvement, cost reduction, and time-
to-market compression of agile practice adopters. He found that five firms reported that
their defect rates from product were at par with their other projects.
Baheti et al. (2002) conducted empirical studies on distributed pair programming. They
gathered empirical data in favor of pair programming in distributed teams, a very
important issue in the current world of offshoring and outsourcing of IT business
processes. Their study resulted in the creation of an special environment for distributed
programming using dual screen projectors, and hypermedia-enhanced video streams.
having a similar mindset about software development. The term “Agile” was also coined with the
Reproduced with permission of the copyright owner. Further reproduction prohibited without permission.

Rumpe and Schroder (2002) conducted a survey on Extreme Programming (XP)
projects. They evaluated 45 questionnaires. They found out that the continuous presence
of customers was important in XP projects. They also found out that although there are a
plenty of problems in XP’s success, it was found to be superior to some of traditional
software development approaches. However, their survey had few limitations in terms of
size, application domains, and seeded biases. They called for further surveys on XP.
Kalermo and Rissanen (2002) used an empirical case study in the context of agile in-
house software development in corporate venturing to find results supporting the
principles and values of the Agile Manifesto (discussed in Chapter 2). Their study
confirmed that tacit knowledge, motivation of employees, and their skills and knowledge
levels are important in agile software development.
Shine Technologies (2003) conducted a simple survey of the global experiences with
agile software development. They found that companies that follow agile practices have
lower costs, better productivity, better quality, and better business satisfaction.
Abrahamson and Koskela (2004) performed a controlled case study on XP in practical
settings. They did not set any hypothesis at the outset. In their study, they got four
software engineers to implement a web-based system of 7698 lines of code over a period
of 820 hours in eight weeks. They obtained favorable results in support of the usefulness
of XP.
However, all of these studies are limited in their magnitude and exhaustiveness of
investigation.
emergence o f the Manifesto in 2001. jg
Reproduced with permission of the copyright owner. Further reproduction prohibited without permission.

Finally, let us summarize the motivations behind the work. Since its birth, ASD is
increasingly becoming popular in the last few years. Because of the attractive claims of
ASD, many organizations are switching to adopt agile practices in their software
development projects. However, as this is an emerging software development philosophy,
there are concrete empirical studies required to assess its different aspects. In this work, I
am not assessing whether agile works or not. Rather what I am trying to investigate are
the empirical evidences in support of the three research questions that I have documented
earlier. Large scale empirical studies having the scope and magnitude of what has been
performed as part of this Thesis work are scarce, if not unavailable in totality (availability
of such work is not within my knowledge), and I am attempting to address this
deficiency. What are more widely available are the experiential reports from different
ASD practitioners while working in 1-2 projects.
The potential contributions are as follows. Let us assume that a software practitioner
who used to practice plan-driven software development wants to adopt ASD practices in
a project that is about to start. He/she would be interested to know:
(1) What are the factors on which his/her team should focus that would lead to the
success of his/her project? There are potentially many factors to focus on. What is
interesting to know are the critical success factors.
(2) What are the important changes to be focused on to adopt ASD practices?
(3) What are the important challenges he/she is likely to face while adopting ASD?
These are the issues that I have addressed in this work. My hope is that the work
would aid the future software practitioners wanting to adopt ASD practices in their
projects. This affirms the motivations behind the work.
19
Reproduced with permission of the copyright owner. Further reproduction prohibited without permission.

1.3 Relevant Theories
While there is no theory that can be firmly associated to our works (specifically, the exact
research questions that I have considered), some of the “somewhat” relevant theories and
their relevance to the works here are outlined below.
Perhaps the most relevant theory is the Theory o f Constraints (ToC) (Goldratt, 1990;
Goldratt, 1998; TOC 2). ToC aims to maximize the outcome of an activity or a set of
activities having a common goal. It is often used in the context of manufacturing where
the goal is to maximize the profitability from a manufacturing process by possibly
decreasing the inventory and the operating expense, and increasing the throughput
(Anderson 2003; TOC 1). As has been pointed out in the online article (TOC 1), the
concept of ASD has parallelisms in ideas with that of the concept of ToC in that the agile
methods (such as XP) aim at maximizing the outcome (more specifically, the number of
features delivered in unit time), minimizing the inventory, and the number of steps
required to achieve this (Anderson 2003, TOC 1). However, mapping software
development processes with those of manufacturing has obvious limitations. We do not
discuss them here as we will be digressing from our focal theme in this work.
Another theory, the Sociotechnical Systems Theory, suggests optimizing both the
social and the technological systems for increasing the effectiveness of worksites
(Chems, 1976; Clegg, 2000, SST 1). It also emphasizes on self-directed work teams, in
which teams are given autonomy to a considerable extent to control changes in work
processes. It emphasizes percolating the communication and decision making from the
higher levels in the organizational structure to the lower level. Thus these concepts have
20
Reproduced with permission of the copyright owner. Further reproduction prohibited without permission.

parallelism with some of the concepts behind ASD such as emphasis on customer
collaboration, communication, and autonomy of teams over decision making.
Some of the concepts of ASD projects such as the dynamic and adaptive nature of
such projects and their characteristic of being adaptive and constantly interacting with
their environment have similarities in idea with the Open Systems Theory. The central
idea of open systems theory when applied to management problems is that open system
organizations are dynamic organizations that constantly interact with their environments.
An open system organization has the ability to affect and be affected by the environment
in which it operates. On the other hand, closed system organizations operate in fairly
stable environments. Such organizations are self-contained to a great extent, and they do
not interact constantly with their environment. The dynamic and constantly interacting
nature of ASD projects is primarily the major resemblance one can draw with that of the
open systems theory.
1.4 Research Methodology
We will design our research methodology based on the methodologies used in innovation
diffusion and related streams of business and information systems (IS) research (e.g.,
Clover and Balsley 1979; Karahanna et al. 1999; Kumar et al. 2004; Maheshwari 2002;
Maheshwari et al. 2005; Adrion 1993; Kontio 2001; Lazaro and Marcos 2005; Zelkowitz
and Wallace 1998).
The nature of our research questions requires a post-facto design, wherein the
parameters are not controlled. In order to address the first research question, we
developed a theoretical (conceptual) framework based on previously published literature.
21
Reproduced with permission of the copyright owner. Further reproduction prohibited without permission.
This framework leads to the formulation of a set of hypotheses by keeping the research
questions in mind. In order to address the second and the third research questions, we
collected a set of items (changes/challenges) from the literature, and we wanted to rank
the items based on survey responses. For addressing all the three research questions, a
questionnaire is designed, and pre-tested before it is actually administered to the field for
data collection. Then, data is collected and analyzed to assess the validity of the
hypotheses. In our research, we survey multiple organizations that had adopted agile
software development practices in the past.
The details of the research methodologies we use in this research are described in
Chapter 5.
1.5 Data Analysis Techniques
The data that are collected from the surveys are statistically analyzed to validate the
hypotheses formulated to investigate the research questions under consideration. We
summarize below some of the statistical analysis methodologies we have used. Their
details are provided in Chapter 6.
Descriptive statistical methods will be used for data exploration to gain an overall
understanding of the nature of the data collected. The inter-question reliability will be
tested using Cronbach’s alpha test. This will help us to understand whether the responses
to the different questionnaire items show high inter-question correlation. Correlation and
regression analyses will be performed to understand the relationships between the
dependent and independent variables.
22
Reproduced with permission of the copyright owner. Further reproduction prohibited without permission.

1.6 Organization of this Thesis
This Thesis is organized as follows. In addition to this introductory Chapter, there are six
Chapters.
Chapter 2 is dedicated to introducing the fundamental concepts in Agile Software
Development. It describes the evolution, manifesto and the principles behind agile
software development. Chapters 3 and 4 are dedicated to describing the three research
questions, relevant literature, the theoretical frameworks, and the formulated hypothesis
that will be tested using survey data. Chapter 5 describes the research methodology.
Chapter 6 describes the data analysis techniques that we used and the results that we
obtained. Chapter 7 provides in-depth discussions of the results obtained. Finally, we
conclude in Chapter 8 by summarizing the work, the main research contributions, and
thoughts for future research.
23
Reproduced with permission of the copyright owner. Further reproduction prohibited without permission.

Chapter 2
Agile Software Development
2.1 Evolution of Software Development
In this Section, we summarize some of important phases of the evolution of different
software development methods. In the rest of the Chapter, we elaborate on how ASD
came into being.
The very early software development methods include the code-and-fix methodf, the
stagewise method (Benington, 1956), the waterfall method (Royce, 1970), the
evolutionary development method (McCracken and Jackson, 1982), the transform method
(Balzer et al., 1983), and the spiral method (Boehm, 1988).
The code-and-fix method is one of the earliest available process models that were used
in traditional software development. In this method, the software development activities
are normally undertaken in two stages: writing the code, and then fixing the problems in
the code. The major limitations of the code-and-fix method were the following. First,
they made code fixes expensive after a few iterations of coding and fixing. Second,
scalability using such a method became limited because there was no explicit recognition
of planning, requirements, and design stages before actually undertaking the coding work
for the incorporation of feedback from users.
The stagewise method was proposed by Benington in 1956. Unlike the code-and-fix
method, software development in the stagewise method is conducted in different stages:
24
Reproduced with permission of the copyright owner. Further reproduction prohibited without permission.

operational plan, operational specifications, coding specifications, coding parameter
testing, assembly testing, shakedown, system evaluation. The limitation of the stagewise
method is that it does not have provisions for improving the latter stages of the software
based on the experience gathered from the earlier stages. In 1970, one of the most
popularly used methods, called the waterfall method (Royce, 1970), was proposed with a
two-fold improvement over the stagewise method (Royce, 1970; Boehm, 1988). The
waterfall method uses feedback loops between successive stages of the software
development process and it incorporates “prototyping” as an independent stage that
would be conducted in concurrence with the early software development stages of
requirements analysis and design, before undertaking the actual development of the
software.
The waterfall method for software development remained a popular method for many
years, as it was able to eliminate many of the limitations of the previous methods, and
was used by different organizations for developing large-scale software. The waterfall
method too was shown to have some limitations. While it worked well for the
development of compilers, and operating systems, it had strong emphasis on document
driven software development that was shown to be of limited help in the development of
spreadsheets and small business applications. Additionally, excessive documentation of
the specification of poorly understood applications, and their user interfaces was
considered unnecessary.
4 http://users.evtek.fi/~jaanah/DP AD/lectures/lec2/diff_m.html#codeandfix25
Reproduced with permission of the copyright owner. Further reproduction prohibited without permission.

McCracken and Jackson, in 1982, proposed the evolutionary software development
method, in which the operational experience of users was incorporated in the software
development lifecycle in its different stages. In this method, the users specify the
functional characteristics of the initial operational software, and then feed their
experience for determining subsequent product improvements. However, one of the
limitations of this approach is that it is often difficult to change the users’ existing
software to incorporate the additional changes. In other words, using such a process, the
maintenance and evolution of operational software can be a challenge.
The above methods still lacked the flexibility of easily modifying code through
repeated re-optimizations as such code would often become poorly structured, difficult to
test, maintain, and evolve. The transform method was proposed in 1983 by Balzer et al.
to overcome this difficulty. In the transform method, all later modifications to code are
made only to the specification, and not to the design, implementation, and testing stages.
However, this method requires that one can convert formal specification of software into
code that specifies the requirements. This method is effective in reducing the amount of
software development time, and cost.
Then Boehm (1988) proposed the spiral method that evolved from the application of
the above mentioned software development methods, especially the waterfall method.
The proposition of the spiral method was an important contribution to software
development because it was the first lifecycle method that explicitly took a risk-driven
approach to software development, in contrast to the document driven, and the code
driven approaches of the previous methods (Boehm, 1988). The spiral method takes an
26
Reproduced with permission of the copyright owner. Further reproduction prohibited without permission.

iterative approach to software development in contrast to sequentially approaching the
phases of software development as was done previously. In this method, the lifecycle is
presented in the form of a spiral, wherein the inception of software development is shown
at the epicenter of the spiral and proceeds iteratively through every cycle of the spiral as
software development progresses.
The above mentioned software development methods (including that of Boehm’s) were
heavily process based, with heavy emphasis on documentation. The limitations of these
methods were realized by many software practitioners and were criticized by them. Some
of the perceived limitations of these methods include their difficulty to learn and use
them quickly, some of them are labor intensive, they are time consuming and thus slow
down the development process, many of them are poorly defined and ambiguous to
implement in practical situations (Tolvanen, 1998). Some of the other perceived
limitations include the ability of the projects to adapt to the changing circumstances in the
organizations and their projects, changing customer requirements. These limitations make
them more restrictive and bureaucratic in their behavior (Kalermo and Rissanen, 2002).
The agile philosophy came into being to overcome some of the above challenges so as
to become more usable in modem day dynamic organizations. The primary shift from the
traditional software development practices to the agile ones involved laying lesser
emphasis on process and documentation and paying more emphasis on quickly
developing products and satisfying customers by incorporating their changing needs.
Unlike the previous practices, the agile practices do not focus on plan-driven
development. Further details about the usefulness of the agile methods will be discussed
27
Reproduced with permission of the copyright owner. Further reproduction prohibited without permission.

in the sections that follow. Table 4.1 in Chapter 4 discusses the major differences
between the traditional plan-driven and the agile practices5.
2.2 History and Evolution of Agile Software Development
A group of seventeen software practitioners, who have been following some light-weight
software-development methods, met in Snowbird, Utah, USA in 2001 to rationalize their
common philosophy, and termed their shared philosophy of software development as
“agile”. They developed the Manifesto fo r Agile Software Development, which states the
values and principles of the ASD philosophy. The Agile Manifesto is explained in
Section 2.3.
2.3 Agile Manifesto
The Manifesto fo r Agile Software Development (Fowler and Highsmith, 2001; Fowler,
2002) is described below:
We are uncovering better ways o f developing software by doing it and helping others do it. Through this work we have come to value:
• Individuals and interactions over processes and tools• Working software over comprehensive documentation• Customer collaboration over contract negotiation• Responding to change over following a plan
That is, while there is value in the items on the right, we value the items on the left more.
(Agile Manifesto)
5 W e do not focus on any particular methodology within these practices. In this Thesis, we focus on the philosophical viewpoints advocated in these practices.
28
Reproduced with permission of the copyright owner. Further reproduction prohibited without permission.
2.4 Principles of Agile Software Development
The agile methodologies are based on a set of principles, which guide the generic nature
of all the different agile methodologies that are proposed. Instead of evaluating whether
the stated principle are right or wrong, which can, in fact be situation-dependent, in this
Section we explain the principles behind agile software development.
The twelve principles stated in the Agile Manifesto are formally written below6:
1. Highest priority is given to satisfying the customer through early and continuous
delivery o f valuable software.
2. Changing requirements are welcome, even late in development. Agile processes
harness change for the customer's competitive advantage.
3. Working software is delivered frequently, from a couple o f weeks to a couple o f
months, with a preference to the shorter timescale.
4. Business people and developers work together daily throughout the project.
5. Projects are built around motivated individuals. They are given the environment
and support they need, and trusted to get the job done.
6. It is believed that the most efficient and effective method o f conveying information
to and within a development team is face-to-face conversation.
7. It is believed that working software is the primary measure o f progress.
6 Taken from http://www.agilemanifesto.org/principles.html29
Reproduced with permission of the copyright owner. Further reproduction prohibited without permission.

8. It is believed that agile processes promote sustainable development. The
sponsors, developers, and users should be able to maintain a constant pace
indefinitely.
9. It is believed that continuous attention to technical excellence and good design
enhances agility.
10. It is believed that simplicity—the art o f maximizing the amount o f work not done—
is essential.
11. It is believed that the best architectures, requirements, and designs emerge from
self-organizing teams.
12. It is believed that success is achieved when at regular intervals the team reflects
on how to become more effective, then tunes and adjusts its behavior accordingly.
Elaborate discussions about the agile principles can be found in a number of pieces of
literature such as Abrahamson et al. (2002), Ambler (2005c), Cockbum (2001),
Cockbum (2002a), Cockbum (2002b), Fowler and Highsmith (2001), Fowler (2002),
Highsmith (2004), and Schwaber (2004). We synthesize below some of the important
discussions available in these pieces of literature on the agile principles.
One of the important principles behind ASD is giving high importance to customers.
The agile practices aim to satisfy customers by producing valuable pieces of the final
product early in the development lifecycle than handing in a finished product towards the
end of the contract, as is normally done by traditional software development practices. As
the customers are concerned about the working software, the ASD practices do not give
30
Reproduced with permission of the copyright owner. Further reproduction prohibited without permission.

importance to artifacts such as requirements and design drafts. The ASD practices
emphasize fast and early delivery of pieces of software incrementally in shorter
timescales.
To adapt with the volatility with today’s businesses, the ASD practices also aim at
continuously accepting changing requirements even late in the development. This is a
significant difference with the traditional software development practices wherein the
requirements are frozen towards the initial stages of the software development lifecycle.
The ASD practices, on the other hand, are targeted to cope with the turbulences and
uncertainties that typically accompany modern-day dynamic business environments.
The proponents of ASD believe that unlike purchasing tangible commodities,
software cannot be ordered with a list of functionalities. Both the software developers and
the business people need to work with each other to be able to come up with the final
required product. Software development projects are normally very dynamic - in
modern-day projects, requirements change, designs change, blocks of code, test processes
change, and functionalities change due to valid reasons as development progresses.
Therefore, it is important for the business, and the development teams to work hand-in-
hand throughout the entire duration of the project.
Due to the requirements of high agility proposed by the agile practitioners, the nature
of communication plays an important role in the success of the agile practice being
employed. Face-to-face communication is found to be effective in achieving this. The
most popular form of communication in traditional development projects is
documentation. However, documentation is often detrimental to agility. Furthermore,
31
Reproduced with permission of the copyright owner. Further reproduction prohibited without permission.

documentation increases the development overhead, which the agile practices aim to
reduce. The reader may recall that the “agilists” advocate the production of those artifacts
that will demonstrate working software to the customers.
ASD practices give importance to development around motivated individuals, give
them the freedom and flexibility to make them productive, and “think outside of the box”.
The agile philosophy believes in project implementation around motivated individuals.
Motivated individuals should be provided the environment, and support needed for them
to make them successful.
Agile philosophers advocate that central to customer satisfaction is the development
of working software. In other words, agile philosophers lay more importance on
developing those artifacts that will directly lead to the development of the end product -
the working software. Project progress and performance measurement should be centered
around the development of working software.
The agile philosophy believes in sustainable development, i.e., working with a
constant pace, instead of working irresponsibly affecting the health of the developers. For
instance, the agile philosophy discourages the development teams from working on a
particular issue overtime, burning down the efficiency of the team members, and
decreasing their future productivity. Instead, they should work a constant number of
hours every week.
Agile philosophy pays equal importance to speed, flexibility, and quality of designs.
They believe that agility is enhanced by good-quality designs. For example, the agile
3 2
Reproduced with permission of the copyright owner. Further reproduction prohibited without permission.

methodology, XP, emphasizes on refactoring for evolving the quality of designs with
iterations, and time.
One of the important requirements of agile practices is to infuse simplicity in
development. Using simple approaches in development increases the changeability of
designs and processes. Agile methods encourage development to restrict to what is
absolutely required. Minimizing the unnecessary overhead will help in keeping designs
simple.
The agile practices encourage lean development using iterative, evolutionary
approaches and self-organizing teams. Flexibility in the roles and responsibilities of the
team members helps in innovation and creativity of the team members. Self-organizing
teams also help in increasing the dynamics of interactions and communication between
the team members. The agile methods do not give importance to following strict
processes. There is no single methodology or process that can be applied to every
situation. Artifacts developed using agile methods evolve, and the methodologies used
are improved over time based on the local parameters in which a particular methodology
is employed.
2.5 Criticisms of Agile Software Development
While the agile philosophy has been embraced since its inception by lot of software
professionals, there have been criticisms from different comers of the software
development community. The acceptance of the agile software development principles in
industries (especially the large private, government or bureaucratic organizations) has
been greatly influenced by how well the agile principles have been proven to have33
Reproduced with permission of the copyright owner. Further reproduction prohibited without permission.

succeeded in the previous projects. Because of the infancy7 of the agile philosophy,
O Q
concrete evidences in favor of agile are relatively few. Many projects are gradually
trying to use the agile methods in their development project and are reporting success
stories using them. We feel, considering the age of the agile paradigm in software
development, the number of success stories reported using it has been considerable.
These success stories are mostly based on the practitioners’ experiences and their
perceptions. Our literature search does not reveal any concrete failure stories using
agile10. However, there have been some criticisms about the usefulness of this
philosophy. We summarize below some of those criticisms11 reported in the literature.
1. Agile is over-hyped and misunderstood (Irons, 2006)
2. It is difficult to get the right people involved (Irons, 2006)
3. There is a danger of inappropriate application (Irons, 2006)
4. It can reduce quality through lack of rigor (Irons, 2006)
5. There is limited support for distributed development environments (Mahanti,
2006; Turke et al., 2002)
6. There is limited support for subcontracting (Turke et al., 2002)
7 It should be noted that agile software development has become popular primarily from the beginning of the 21st century and (arguably) it has the promise o f transforming the software development activities in the future.8 F o r exam ple, R e ife r et al. (2002), in a very sm all-sca le p re lim inary study invo lv ing 14 organizations, reports o f organizations that had productivity improvement, cost reduction, time-to-market compression using the agile methods.9 Agile Alliance maintains a library o f articles on agile, many o f which report people’s experiences using agile methodologies.10 However, it should be noted that although there are no failure stories reported, people have reported limitations and “lessons learned” using agile.
3 4
Reproduced with permission of the copyright owner. Further reproduction prohibited without permission.

7. There is limited support for building reusable artifacts (Mahanti 2006; Turke et
al., 2002)
8. There is limited support for development involving large teams (Mahanti 2006;
Turke et al., 2002)
9. There is limited support for developing safety-critical software (Mahanti 2006;
Turke et al., 2002)
10. There is limited support for developing large, complex software (Turke et al.,
2002)
11. Requires significant cultural change for adoption in projects (Stephens and
Rosenberg, 2003)
12. Will work only when senior development team members are involved (Stephens
and Rosenberg, 2003).
13. The amount of software design that is done may be insufficient (Stephens and
Rosenberg, 2003).
14. Contractual negotiations may be difficult to attain (Stephens and Rosenberg,
2003).
15. Does not work for development projects for safety critical and reliable systems
(Lindvall et al., 2002).
11 The criticisms 11-14 are particularly attributed to XP, which is one o f the most popular agile methodologies.
35
Reproduced with permission of the copyright owner. Further reproduction prohibited without permission.

16. Will work only when the performance requirements are explicitly stated at the
outset of the projects, and suitable test plans are planned (Lindvall et al., 2002).
17. Will work the best only for applications that can be built quickly without
involving much complexity (Lindvall et a l, 2002).
However, we feel, that most of the criticisms listed above are debatable, and there is
insufficient data in the literature on support of these claims. Most of the unsupported
claims of criticisms are taken from disparate patches of literature mentioning them.
Having said the above, we should clarify that our goal is not to establish whether
ASD works in practice or not. Our goal is to identify the success factors from the
perspective of software practitioners in ASD projects, identify the important changes
required and the challenges that can be potentially encountered by projects willing to
adopt ASD practices in projects.
36
Reproduced with permission of the copyright owner. Further reproduction prohibited without permission.

Chapter 3
Success Factors of Agile Software Development Projects
In this Chapter we review the potential factors that affect the success12 of projects that
want to adopt ASD practices. We review the parameters that affect the success of projects
adopting ASD practices. The objective is to finally uncover empirical evidence in support
of or against the above.
First we propose a theoretical framework (a priori framework) supporting the
research objective on the basis of the previously published literature on agile software
development. Thereafter, we formulate a set of hypotheses and validate them by
collecting data from ASD practitioners in different industries. The later two are detailed
in Chapter 5 and Chapter 6.
3.1 Agile Software Development Project Success
There are different works available in the literature that discuss the success of any IS
activity (Delone and McLean, 1992; Delone and McLean, 2003). Delone and McLean’s
framework of IS success (Delone and McLean, 1992; Delone and McLean, 2003) is
considered to be one of the most pioneering, popular, and breakthrough amongst the IS
professionals. At the heart of their success framework are the considerations of use and
user satisfaction as indicators of system and information quality. Use and user
satisfaction, in turn, determine the individual impact and the organizational impact.
37
Reproduced with permission of the copyright owner. Further reproduction prohibited without permission.

Many other studies on measuring success are available, but we strongly believe that user
or customer satisfaction13 is the ultimate goal of any IS activity, because all the other
criteria that can be come up with would finally lead to determining the satisfaction of the
users or the customers.
While there can be a list of different factors that can be identified, the holistic view of
what project managers consider success in any software development project is worth
considering. From a project manager’s viewpoint, time, cost, and quality (Net Worth
Consulting, 2004; PMI, 2004; Schwaber and Beedle, 2002) are three key components of
any project’s success. These are competitive criteria for software development project
managers. Any disciplined software development activity has the primary goals of
developing high quality software, with less time, and cost. We believe that these are three
key attributes characterizing the success of any software development project, and most
other success characteristics can be transformed into any of them. For example,
productivity, customer satisfaction, and functionality can be perceived as quality criteria.
The challenging task for any software development project manager is balancing these
three success criteria - time, cost, and quality. As shown in Figure 3.1, the position of
“O” in the triangle signifies the cost, time, and quality impact in a software development
project. For instance, greater quality of a software product can be achieved if there is
greater budget and time at disposal. But project managers are normally constrained with
12 In this document, at certain places we have used the term “agile software development success” to mean the success factors from the perspective o f software practitioners in ASD projects.13 Here we assume that the customer is the user o f the system.
38
Reproduced with permission of the copyright owner. Further reproduction prohibited without permission.

respect to both the time and budget they are allowed to work with, and the quality of the
software the project is expected to deliver.
The same expectations are still valid for projects using agile practices. The reader
should recall that the whole notion of agility in software development is “uncovering
better ways of developing software” (Fowler and Highsmith, 2001; Fowler, 2002). In
other words, any project using agile practices would be considered to have succeeded if it
can deliver better quality software in shorter “timeboxes”, and reduced budget than the
traditional software development practices.
CostTime
Quality
Figure 3.1: Quality/Time/Cost Tradeoff Triangle in Software Development
Jim Highsmith, in his popular book, “Agile Project Management” lists five business
objectives o f exploration processes, i.e., processes that are capable o f operating in
uncertain environments. They are listed below (Highsmith, 2004):
3 9
Reproduced with permission of the copyright owner. Further reproduction prohibited without permission.

1. Continuous innovation: This requires delivering products and services
according to current customer needs and requirements. These needs are
requirements that do not stem out of structured, plan driven environments.
Continuous innovation is supported by adaptive organizational culture
involving self-organization and self-discipline. It is measured by how a project
can deliver customer value today.
2. Product adaptability. This requires delivering products according to changing
customer requirements. These changes may happen within the duration of few
weeks to few years. The product should be adaptable to the changing
requirements. Ideally, such changes should be efficient and cost-effective.
3. Reduced delivery schedules: This requires reducing delivery schedules to meet
the market requirements. Reducing delivery schedule should be accompanied
by increasing return on investment (ROI). Careful attention is given to
delivering primarily those features that are important to the customer.
Marginally beneficial features are considered secondary.
4. People and process adaptability: This requires being dynamic with the changes
in the business and the product. Similar to the adaptability of product, the
people and the process need to adapt to the changes in the time-varying nature
of the market. Instead of viewing changes with a resistive attitude, they should
be made part and parcel of the businesses.
5. Reliable results: Traditionally, good traditional/plan-driven (predictable)
processes required delivering products using processes having repeatable
40
Reproduced with permission of the copyright owner. Further reproduction prohibited without permission.

outcome, i.e., processes that would deliver the same even when undertaken
after a lapse of time. These processes resulted in predictable outcome within the
specified time and budget. However, for exploration processes, what is
important is whether the project was able to deliver a valuable product to the
customer within the specified time and budget. In exploration processes,
although the outcome is not repeatable, innovative results are delivered to the
customers in line with their vision.
Other pieces of published literature reveal the following expected quality criteria from
agile software development projects:
1. Improved customer/business satisfaction (Opperthauser, 2003; Shine
Technologies, 2003).
2. Increased flexibility to meet client’s special needs (Opperthauser, 2003).
3. Improved business processes (Opperthauser, 2003).
4. Improved productivity (Shine Technologies, 2003).
5. Cost reduction (Reifer, 2002)
A good quality system can either possess perceived integrity or conceptual integrity
(Poppendieck and Poppendieck, 2003). A system is said to possess perceived integrity if
the product is holistically considered to be usable, reliable, operational, and economical.
On the other hand, it is said to possess conceptual integrity if all the core functions and
concepts work together smoothly. Whether a system has perceived integrity or conceptual
41
Reproduced with permission of the copyright owner. Further reproduction prohibited without permission.

integrity, what is important is that the customer should perceive the system to be cost-
effective and easily usable (Poppendieck and Poppendieck, 2003).
Based on the discussions of the different determinants of success in Section 3.1, we
feel that they can be broadly classified to have the following three dimensions:
(i) Reduction of delivery schedules,
(ii) Increase in the return of investment (ROI) and the decrease in the costs.
o There are different models of ROI calculation (El Emam, 2004). The
most simplified and the commonly used model in practice is as follows
(Nucleus Research, 2002):
Average benefit over a time periodKOI — --------------------------------------------------- .
initial cost
These benefits can be tangible or intangible. Increased return on
investment, therefore, is directly proportional to the increase in the
average tangible or intangible benefits with respect to the initial
investments made.
(iii) Improvement of quality. The improvement of quality criterion can have
multiple dimensions. We consider the following attributes to represent the
quality dimension:
(a) Ability to meet with the current customer requirements
(continuous innovation)
(b) Flexibility to meet with the changing customer requirements
(product adaptability)42
Reproduced with permission of the copyright owner. Further reproduction prohibited without permission.

(c) Improved business processes
(a) and (b) above primarily determine the criteria for the satisfaction of the customers.
In other words, to satisfy the customer it should be ensured that all the present and future
requirements of the customers are met in time and within budget. In this work, we have
intentionally opted to have (a) and (b) as separate criteria for customer satisfaction
(instead of having a single criteria determining it), to understand if and how much the
agile methods perform better in projects having changing requirements, which is one of
the important promises of the agile philosophy.
This also aligns with the balanced scorecard methodology14, which views an
organization from learning and growth, business process, financial, and customer
perspectives and measures an organizations success accordingly. Here we are assuming
that the success of an organization is partially dependent on the success of the software
development projects.
To summarize, the following five criteria will be used to determine the success of
(agile) software development (projects). All the other determinants of success discussed
above are either logically included in any of the following criteria, or are considered
relatively less important for the purpose of this research. These criteria will form the
dependent variable in our research. They capture the three important dimensions of the
success of any project, reduced time, reduced cost, increased quality, as mentioned
14 The balanced scorecard methodology aligns with some o f the ideas of Total Quality Management (TQM) such as continuous improvement, customer-defined quality and measurement-based management (http://www.balancedscorecard.org/basics/bscl.html).
43
Reproduced with permission of the copyright owner. Further reproduction prohibited without permission.

earlier. The above discussions provide the rationale behind the choice of these five
dependent variables.
• Reduced delivery schedules
• Increased return on investment (ROI)
• Increased ability to meet with the current customer requirements
• Increased flexibility to meet with the changing customer requirements
• Improved business processes
3.2 Success Factors
3.2.1 Organizational Factors
Customer Centric Issues
Some of the authors who have advocated/cited customer centric issues as a factor are
Cohn and Ford, 2003; Lindvall et al., 2002; McMahon, 2004; Nerur et al., 2005;
Opperthauser, 2003; Turner and Boehm, 2003. The three types of customer centric issues
they have considered can be broadly classified as:
• Customer Satisfaction
• Customer Collaboration
• Customer Commitment
The Agile Manifesto (Fowler and Highsmith, 2001) advocates customer collaboration
as one of the important requirements for successful software development. One of the
principles of ASD is giving highest priority to achieving customer satisfaction through
early and continuous delivery of valuable software (Fowler and Highsmith, 2001). This
requires that the customers are not only available on site with the software development
44
Reproduced with permission of the copyright owner. Further reproduction prohibited without permission.

team, but also highly motivated, active, and consider themselves responsible elements in
the project. Customer commitment is, thus, an important success factor.
Close collaboration with customers provides the customers to closely involve/engage
themselves into the development process, and also have a better opportunity of
participating in some of the important business decisions taken inside the organization in
regards to the project (Lindvall et al., 2002). For the development teams as well, having
customers closely collaborate with them gives them an opportunity to adhere to changes
in customer requirements faster without having to go through a formal approval processes
for the changes. Of course, the above depends on the size and nature of the changes as
well. Thus, in a project following the agile approach the customers and the developers
have a better partnership opportunity, and finally, deliver a high quality product.
Unlike other products, software has different characteristics. It cannot be purchased
as material items such as groceries. In software development, to be able to get a good
quality product that would satisfy the customers, the process of outlining the
requirements, setting up the deadline, and specifying the budget will not fetch a good
product. It is also typical in software development projects that the requirements, budget,
and the delivery time change as the customers and the development team interact more.
Additionally, as customer requirements can be infeasible or difficult to meet as sought, it
is also suggested that the customers and developers work together to understand the
requirements, issues, and the feasible and infeasible items well. Without properly doing
so, a software development project will be prone to failure.
Assertion: Customer satisfaction is important for the success o f agile software development
projects.
45
Reproduced with permission of the copyright owner. Further reproduction prohibited without permission.

Assertion: Customer
development projects.
collaboration is important for the success of agile software
Assertion: Customer
development projects.
commitment is important for the success of agile software
Decision Time
In the words of Ken Auer, “Agile is about taking control of your own destiny to the point
that you can” (eWorkshop, 2002). Successful agile software development teams are
normally left on their own, thereby allowing them to take their own decisions and
succeed (eWorkshop, 2002). Also, as close customer, business area and software
developer collaborations are advocated by agile practices (Fowler and Highsmith, 2001),
important project decisions are likely to be made within a short timeframe. Agile
practices are perceived to likely succeed in environments where rapid communication is
enabled (eWorkshop, 2002). Rapid communication is likely to cut down the amount of
time expended on major decisions. Therefore, fast decision-making is prominently an
enabler of agility.
Assertion: Taking quick decisions is important for the success o f agile software
development projects.
Team Distribution
• Having centralized teams is also a likely factor positively affecting the success of
projects. According to Ken Schwaber (eWorkshop, 2002), co-located teams are one
46
Reproduced with permission of the copyright owner. Further reproduction prohibited without permission.

of the important vehicles for successful communication, which is, in turn, identified
by Scott Ambler (eWorkshop, 2002) as one of the important success factors of
software development. Companies involved in distributed international projects will
be affected by the cultural, and political situations in those regions. The geographic
distribution and the location of the teams is important because the local political,
cultural, and behavioral habits and situations greatly influence the productivity of the
project team. For instance, in regions of the world where people are used to working
collectively, agile approach will likely to be more successful in organizations that are
located there than in organizations located in regions where that is not the case.
Turner and Boehm (2003) have also advocated the team distribution factor.
• Further, the far off geographic distribution of teams may make communication,
especially face-to-face communication, extremely difficult, thereby slowing down
the pace of the projects.
Assertion: Team distribution is an important concern for the success o f agile software
development projects.
Team Size
The number of members in a team greatly influences the degree of communication
that can be had between team members. For instance, in a team that has a large number
of members, it is quite likely that frequent, informal, and rapid interactions will become
difficult. Whereas the pace of informal communications can be made faster in small
47
Reproduced with permission of the copyright owner. Further reproduction prohibited without permission.

teams. Based on the literature (Dyba, 2000; eWorkshop, 200215), we hypothesize a team
with maximum 20-40 people would be optimum for good for agility. Having a larger
team might pose great hindrance to fast communication and decision making in projects.
However, if there are more people in a project, it is suggested that large teams be broken
down into few smaller teams. Further, with the growth of the team size, efficiently
coordinating/managing the interactions between people might also pose to be an
important issue to be taken care of. The issue of team size has also been cited by Boehm
and Turner (2003) as one of the factors.
Assertion: Appropriate team size is important for the success of agile software development
projects.
Corporate Culture
“To be agile is a cultural thing. If the culture is not right, then the organization cannot be
agile” (Lindvall et al., 2002). Having the right corporate culture is almost unanimously
perceived by agile experts to be a necessary factor determining the introduction of agile
practices (eWorkshop, 2002; Lindvall et al., 2002). Since agile practices emphasize
“individuals and interactions over processes and tools”, and “customer collaboration over
contract negotiation” (Agile Manifesto), intuitively the nature of organizations
individuals work in is important. For example, agile is not appropriate in bureaucratic
organizations (eWorkshop, 2002).
15 In this reference different team sizes are suggested, but we accept the suggestion o f 20-40 members made by Alistair Cockburn, which was agreed by the majority o f the participants.
48
Reproduced with permission of the copyright owner. Further reproduction prohibited without permission.

A dynamic, and fast changing organization will find agile methods extremely suitable
for it (Abrahamson et al., 2002). Since the agile practices pay emphasis on customer
collaboration and feedback, the organizational culture should be adaptive to changes. The
organizational culture should also be supportive of working in a collaborative
environment. Organizations that want to adapt agile practices need to have the culture of
rapid communication, trusting people, supporting the decisions of the developers,
encouraging changing requirements, and vehicles for fast feedback from customers
(Lindvall et al., 2002).
In a bureaucratic organization, in which there are strict procedural requirements for
making changes or introducing new ideas, agile will clearly be inappropriate in such an
organization. Also, such organizations have the culture for proving the success of a
methodology, tool, or process before it can be accepted by the management. This
becomes resistive to introducing innovation in the organizations, and also increasing the
pace of development that agile practices aim for. The more deeply rooted such a culture
is in the organization, the more resistive the organizations will be to introducing and
efficiently using the agile methodologies (Highsmith, 2000).
Some of the other authors who have advocated/cited corporate culture as a factor are
Ambler, 2005c; Boehm and Turner, 2003; Cockbum and Highsmith, 2001; Cohn and
Ford, 2003, Nerur et al., 2005 and Turner and Boehm, 2003.
Based on the previous discussions, we want to investigate whether the following
aspects of corporate culture will have any implication on the success of agile software
development projects:
49
Reproduced with permission of the copyright owner. Further reproduction prohibited without permission.

• Culture for rapid communication
• Culture for trusting people.
• Culture for supporting the decisions of the developers.
• Customer centric culture.
• Culture for encouraging fast feedback from customers.
• Culture for encouraging changing requirements.
• Non-bureaucratic management culture.
• Culture where the management, developers, and testers are in total agreement to
use agile processes.
Assertion: Supportive corporate culture is important for the success o f agile software
development projects.
Planning & Control
One of the important aspects that characterize the implementation of agile software
development practices is the nature of organizational, management, and project planning
and control. For instance, documented plans, accompanied by quantitative performance
measures are considered key to the success of organizations practicing traditional/plan-
driven software development. On the contrary, internalized plans, and qualitative control
are considered to succeed organizations adopting agile practices (Boehm and Turner,
2003). Some of the other authors who give importance to planning and control as a factor
are Cockbum, 2002; Cohn and Ford, 2003; McMahon, 2004.
50
Reproduced with permission of the copyright owner. Further reproduction prohibited without permission.

Assertion: Internalized plans are important for the success of agile software development
projects.
Assertion: Qualitative control is important for the success of agile software development
projects.
3.2.2 People Factors
The success of a software development project depends on the how people and human
resource factors. Evidently, this becomes more so in agile software development. This is
because in agile practices, there is emphasis on individuals and interactions, customer
collaboration, and responding to changes suggested by customers. We list below some of
the important people factors.
Some of the factors mentioned below could equally be classified as organizational
factors. However, instead of getting bogged down into the unimportant issue (according
to the goals of this Thesis) of which category they belong to, we simply describe them
here.
Competency
Competency means whether one has real-world experience in the technology domain, has
built similar systems in the past, and possesses good interpersonal & communication
skills (Lindvall et al., 2002).
In the context of talent hunt, the following principle of Barry Boehm should be kept in
mind “use better, and fewer people” (Cohn and Ford, 2003; Keith, 2002). Since the agile
practices emphasize delivering working software fast, evidently, the competency of the
51
Reproduced with permission of the copyright owner. Further reproduction prohibited without permission.

team members in a project is important. From the discussions in Lindvall et al. (2002), it
can be inferred that having at least 25% technically competent people in the projects is
important. Previous experience in developing alike software as the current one is
important in a project. The competency of the team members dictate not only the pace of
development of a software, but also delivering the software according to the requirements
of the customers.
Some of the other authors who talk about competency as a factor are Boehm and
Turner, 2005 and Cockbum and Highsmith, 2001.
Assertion: Having at least 25% competent team members is important for the success of
agile software development projects.
Personal characteristics
People factor plays a key role in the success of agile methods. According to Alistair
Cockbum, “Good people are key to success with big teams” (eWorkshop, 2002). Ken
Auer believes that having high quality people does not necessarily mean having
experienced ones (eWorkshop, 2002). Not only the experience and competency of the
team members is important, but also their personal characteristics such as honesty,
collaborative attitude, sense of responsibility, readiness to learn, and work with others are
considered equally important, if not more (eWorkshop, 2002).
Agile philosophers believe that just professional competencies are not enough anymore
for a programmer. Agile principle’s emphasis on the criticality of communication has
indirect effects on the requirements of team members’ qualities - without communication
52
Reproduced with permission of the copyright owner. Further reproduction prohibited without permission.

abilities, and desire to work in an agile team, even an expert may become an hindrance to
the success of the project.
Thus having “good people” in the team, rather than following specific principles and
practices, is considered important for the success if agile methods (Lindvall et al., 2002).
Some of the other authors who talk about personal characteristics as a factor are
Ambler, 2005c; Boehm and Turner, 2003; Boehm and Turner, 2005; Cockbum and
Highsmith, 2001 and Cockbum, 2002.
Assertion: Personal characteristics o f the team members is an important for the success of
agile software development projects.
Communication and Negotiation
Communication plays an important role in the implementation of agile practices in a
software development project (Turner and Boehm, 2003). Effective communication is
identified as one of the important factors for agile practices to succeed (Ambler, 2005b).
According to Scott Ambler (eWorkshop, 2002), both processes and organization need to
have in place a vehicle for communication. One of the important requirements for agility
is fast and effective communication between developers, operations, support, customers,
management, and business areas.
There are different modes of communication - paper-based, e-mail, telephone, video,
and face-to-face (Ambler, 2005b; Cockburn, 2001). According to Cockbum (2001),
person-to-person and face-to-face communication modes, accompanied by white-boards,
flip-charts, and index-cards are the most effective means of communication for agile
53
Reproduced with permission of the copyright owner. Further reproduction prohibited without permission.

software development. Face-to-face communication is also identified as an efficient and
effective mode of communication in one of the twelve principles of agile software
development. However, the degree to which a particular mode of communication is
effective over another is situational. The following are some of the factors affecting
communication (Ambler, 2005b):
• Physical Proximity: Physical proximity, i.e., how close people are to one
another, affects the level of communication. Close physical proximity may not
necessarily mean having two or more people working together side-by-side.
Two people working together in different floors of the same building, or two
nearby buildings may also be considered to have close physical proximity.
• Temporal Proximity: This determines whether two or more people are working
in the same (or similar) time-zones. This affects the way people can
communicate with each other. In the current era of outsourcing, when many
North American jobs are outsourced to Asian and European countries, temporal
proximity has become an important issue. Asian and European outsourcing
partners often end up matching their hours of work with their North American
clients, who are in the opposite time-zones.
• Amicability: According to Cockbum (2001), amicability between people
communicating with one another is an important factor affecting
communication. This is because if people communicating with one another can
tmst each other, and speak with good will, greater flow of quality information
54
Reproduced with permission of the copyright owner. Further reproduction prohibited without permission.
can take place. Ambler (2005b) believes that the concept of everyone learning
from everyone else is a critical success factor for effective communication.
Both physical and temporal proximity often enhances “osmotic communication”, i.e.,
subconscious flow of information through overhearing of conversations between people,
seeing things happening around them, and so on (Ambler, 2005b).
All the above forms of communication enhance the ability of the people to negotiate
between themselves, by continuously talking and learning from each other.
Communication and negotiation are, thus, by definition, important factors for the success
of software development adopting the agile approach (eWorkshop, 2002).
Some of the other authors who have advocated the importance of communication as a
factor are Boehm and Turner, 2003; Cockbum, 2001; McMahon, 2004 and Turner and
Boehm, 2003.
Assertion: Communication and negotiation play important roles in the success o f agile
software development projects.
Societal Culture
Software development is similar to the development of other products in that the culture
of the society in which the organization operates is important. As any other human
activity, software development is highly influenced by regional (local) culture. The Agile
Manifesto (Fowler, 2002) lays emphasis on individuals and interactions between people
over processes and tools. The agile principles (Fowler and Highsmith, 2001) require
motivated individuals. People should be eager to learn from each other, be honest,
55
Reproduced with permission of the copyright owner. Further reproduction prohibited without permission.

collaborative, and responsible (eWorkshop, 2002). All these are affected by the societal
cultural factors as well. For instance, if a society has communicative people, if they are
dynamic and progressive by their nature this will affect their work habits as well. Since
we have emphasized earlier that personal characteristics are important success factors, so
would be the societal culture, because the personal characteristics of the people are
greatly influenced by their societal culture and vice versa.
Assertion: Societal culture plays an important role for the success of agile software
development projects.
Training and Learning
An important concern that has been raised in the previous literature is how much training
is required for successfully implementing agile practices in an organization (Lindvall et
al., 2002). According to Bil Kleb, ‘“continued learning’ is one of the fundamental
differences between ‘agile’ and ‘others’” (eWorkshop, 2002). People should be eager to
share information with one other, continuously learn. This increases the chances of agile
practices. The eWorkshop on agile (eWorkshop, 2002) had discussions around training of
people - how important is training in agile methods, whether formal training is needed or
not, and how much important training is in agile? The eWorkshop participants asserted
that agile practices require less formal training (especially in the case of XP, because of
pair programming), mentoring, and professionally guided discussions were more useful
in agile than formal training, so that tacit knowledge could be transferred between
individuals. According to Ken Auer (eWorkshop, 2002), training gets much easier if the
people in the project are honest and collaborative.
56
Reproduced with permission of the copyright owner. Further reproduction prohibited without permission.

Some of the other authors who talk about training and learning as a factor are Boehm
and Turner, 2005 and Drobka et al., 2004.
Assertion: Having team members willing to continuously learn and train each other is
important for the success of agile software development projects.
3.2.3 Summary of Independent Variables
To summarize from the discussions in the above Section, all the above factors and their
respective advocates or the authors who have cited these factors are listed in Table 3.116.
These factors will serve as the independent variables. A summary of them is listed as
follows:
• Customer Satisfaction
• Customer Collaboration
• Customer Commitment
• Decision Time
• Team Distribution
• Team Size
• Corporate Culture
• Internalized Planning
• Qualitative Control
16 Some of the discussions in few of the papers listed in this table and in the previous discussions led us to believe that they indirectly advocate the corresponding factor. These few papers did not always directly cite the corresponding factor.
57
Reproduced with permission of the copyright owner. Further reproduction prohibited without permission.

• Competency
• Personal characteristics
• Communication and Negotiation
• Societal Culture
• Training and Learning
OrganizationalFactors
PeopleFactors
CustomerSatisfaction
Competency H01a (+)HP1(+) Customer
CollaborationH01b (+)
H01c (+)
H02(+)
SuccessHP2(+) Customer
CommitmentPersonal
CharacteristicsHP3(+)
Decision Time
HP4(+)Team
DistributionCommunication & Negotiation
HP5(+)
H06b(+) Team Size
CorporateCulture
Societal Culture
Planning
Training & Learning Control
Figure 3.2: Theoretical Framework: Success Factors
58
Reproduced with permission of the copyright owner. Further reproduction prohibited without permission.

Table 3.1: A Summary of the success factors and their respective advocates.
Factor Authors that have advocated/cited the factor
1 Customer Centric Issues Cohn and Ford, 2003; Lindvall et al., 2002;
McMahon, 2004; Nerur et al., 2005;
Opperthauser, 2003; Turner and Boehm, 2003
2 Decision Time eWorkshop, 2002; Lindvall et al., 2002
3 Team Distribution eWorkshop, 2002; Turner and Boehm, 2003
4 Team Size Dyba, 2000; Boehm and Turner, 2003;
5 Corporate Culture Abrahamson et al., 2002; Ambler, 2005c;
Boehm and Turner, 2003; Cockbum and
Highsmith, 2001; Cohn and Ford, 2003;
eWorkshop, 2002; Highsmith, 2000; Lindvall et
al., 2002; Nerur et al., 2005; Turner and Boehm,
2003
6 Planning and Control Boehm and Turner, 2003; Cockbum, 2002; Cohn
and Ford, 2003; McMahon, 2004;
7 Competency Boehm and Turner, 2005; Cockbum and
Highsmith, 2001; Cohn and Ford, 2003;
eWorkshop, 2002; Lindvall et al., 2002; Keith,
2002; Turner and Boehm, 2003
8 Personal Characteristics Ambler, 2005c; Boehm and Turner, 2003;
Boehm and Turner, 2005; Cockbum and
Highsmith, 2001; Cockbum, 2002; eWorkshop,
2002; Fowler and Highsmith, 2001; Lindvall et
al., 2002; Nemr et al., 2005; Turner and Boehm,
2003
9 Communication and
Negotiation
Ambler, 2005b; Boehm and Turner, 2003;
Cockbum, 2001; McMahon, 2004; Turner and
Boehm, 2003
59
Reproduced with permission of the copyright owner. Further reproduction prohibited without permission.

10 Societal Culture Cockbum and Highsmith, 2001; eWorkshop,
2002; Lindvall et al., 2002
11 Training and Learning Boehm and Turner, 2005; Drobka et al., 2004;
eWorkshop, 2002; Lindvall et al., 2002
3.3 Research Hypotheses for Identifying the Success Factors
On the basis of the theoretical framework developed from the previous literature, the
following research hypotheses are formulated. These hypotheses are written as assertions
in rectangular shaped boxes in Section 3.1. These assertions are based on evidences from
the literature cited in the descriptions of the different success factors in Section 3.1. The
truth of the hypotheses will then be validated using empirical data.
HOla: The greater the satisfaction of the customers in projects, the more likely would be
the success of agile software development projects.
HOlb: The greater the collaboration of the customers in projects, the more likely would
be the success of agile software development projects.
HOlc: The greater the commitment of the customers in projects, the more likely would
be the success of agile software development projects.
H02: The quicker the decisions are taken in projects, the more likely would be the
success of agile software development projects.
H03: The more closely located the project teams are, the more likely would be the
success of agile software development projects.
60
Reproduced with permission of the copyright owner. Further reproduction prohibited without permission.

H04: The smaller the size of the teams in a project, the more likely would be the success
of agile software development projects.
H05: The stronger the corporate culture for agile software development projects, the
more likely would be their success.
H06a: The more informalized the plans are in an agile project, the more likely would be
the success of agile software development projects.
H06b: The more qualitative controls the projects have, the more likely would be the
success of agile software development projects.
HP1: The more technically competent the team members are in a project, the more likely
would be the success of agile software development projects.
HP2: The better the personal characteristics of the team members in a project, the more
likely would be the success of agile software development projects. [Note: Some of the
important personal characteristics for the success of agile projects include honesty,
collaborative attitude, sense of responsibility, readiness to learn, and work with others].
HP3: The more the communication and negotiation is between people, the more likely
would be the success of agile software development projects.
HP4: The more favorable the societal culture is for agile projects, the more likely would
be the success of agile software development projects. [Note: The word “favorable” here
refers to the individuals in the society being communicative, dynamic, progressive, and
of similar societal culture].
61
Reproduced with permission of the copyright owner. Further reproduction prohibited without permission.

HP5: The more the environment is for continuously learning, and informal training, the
more evident would be the success of agile software development projects.
62
Reproduced with permission of the copyright owner. Further reproduction prohibited without permission.

Chapter 4
Changes and Challenges/Risks in Adopting Agile Practices in
Traditional Software Development Projects
Most of the changes and challenges identified in the existing literature that are required
for adopting agile processes in a traditional development projects are either based on
experience of the developers, or are based on the opinions of agile experts without much
empirical support. Additionally different previous research papers report long lists of
such changes and challenges. However, for a project considering the adoption of agile
practices, such long lists are of limited help. In this part of the research, we take a survey-
based approach for obtaining empirical evidences of changes/challenges that need to be
focused on while adopting agile processes. The list of changes/challenges we have come
up with is not new to our work. Our contribution is something different. Specifically, we
are interested in the statistical ranking of the changes/challenges that will be of help to
project managers wanting to adopt agile software development practices.
In contrast to Chapter 3, where we were interested in identifying the factors responsible
for the success of agile software development, in this Chapter we are interested in
identifying the critical changes/challenges responsible for the transition of traditional
software development projects into agile. This is an exploratory study. The objective is to
determine possible candidates that are likely to affect the transition, and then rank them
according to their importance, based on empirical evidences. As the list of changes
required can be long and formidable for use, the idea is to help the transition managers in
63
Reproduced with permission of the copyright owner. Further reproduction prohibited without permission.

traditional projects by providing them with a ranked list of items (both changes and
challenges/risks), which they can use to focus on the activities of primary importance.
4.1 Home-Ground Characteristics: Rationale for Change
Before discussing further about what changes are required and what challenges would be
involved for transforming projects practicing traditional approaches into agile ones, let us
first look at some of the home-ground characteristics of both of these development
approaches. This will help us further to understand what changes in these home-ground
characteristics the projects that want to adopt agile approaches would need to make.
A theoretical analysis of the propositions of both the agile approaches and the
traditional disciplined ones was already done by Boehm and Turner (2003). According to
them, no one methodology can be regarded as the best. Each of them has its own home
ground, where it works better than the other - this should be, obviously, intuitive to most
people, and should not be a surprise to anyone, because in reality it is hard to find some
approach which can be regarded as a “silver bullet”. Boehm and Turner proposed that
instead of adopting just one methodology, balanced approaches dealing with a mix of
both the agile and plan driven practices would be successful in the future. While agile
approaches are better in dealing with issues relating to customer satisfaction, lower defect
rates, faster changeability of requirements, and faster development times, the
traditional/plan-driven approaches are better in ascertaining the predictability, stability,
and high-assurance in the development processes. Their findings are summarized in
Table 4.1. However, they have not cited any reference providing empirical support for
their statements - their propositions seem to be experiential in nature.64
Reproduced with permission of the copyright owner. Further reproduction prohibited without permission.

Table 4.1: Home grounds of agile and traditional/plan-driven methods [taken from
Boehm and Turner (2003)]
Characteristics Agile Plan-driven
Application
Primary Goals Rapid value; responding to change.
Predictability, stability, high assurance.
Size Smaller teams and projects. Larger teams and projects.
Environment Turbulent; high change; project-focused
Stable; low-change; project/organization focused.
Management
Customer Relations Dedicated on-site customers; focused on prioritized increments
As-needed customer interactions; focused on contract provisions.
Planning and Control Internalized plans; qualitative control.
Documented plans, quantitative control.
Communications Tacit interpersonal knowledge.
Explicit documented knowledge.
Technical
Requirements Prioritized informal stories and test cases; undergoing unforeseeable change.
Formalized project, capability, interface, quality, foreseeable evolution requirements.
Development Simple design; short increments; refactoring assumed inexpensive.
Extensive design; longer increments; refactoring assumed expensive.
Test Executable test cases define requirements and testing.
Documented test plans and procedures.
Personnel
Customers Dedicated, collocated “CRACK” (Collaborative, Representative, Authorized, Committed, Knowledgeable)
“CRACK” performers not always collocated.
65
Reproduced with permission of the copyright owner. Further reproduction prohibited without permission.

performers.
Developers At least 30% full-time Cockbum* Level 2 and 3 experts; no Level IB or -1 personnel.
50% Cockbum* Level 3s early; 10% throughout; 30% Level IBs workable; no Level -Is .
Culture Comfort and empowerment via many degrees of freedom (thriving on chaos).
Comfort and empowerment via framework of policies and procedures (thriving on order).
* Cockbum levels of software method understanding and use:
Level 3: Able to revise a method (break its rules) to fit an unprecedented new situation.
Level 2: Able to tailor a method to fit a precedented new situation.
Level 1 A: With training, able to perform discretionary method steps (e.g., sizing stories to fit increments, composing patterns, compounding refactoring, and complex COTS integration). With experience can become Level 2.
Level IB: With training, able to perform procedural method steps (e.g., coding a simple method, simple refactoring, following coding standards and CM procedures, running tests). With experience can master some Level 1A skills.
Level -1: May have technical skills, but unable or unwilling to collaborate or follow shared methods.
We believe, Boehm and Turner’s statement is easily said than done. Given the
substantially opposite philosophies of the two approaches (e.g., emphasis on well-
documented plans in traditional approaches versus paying less importance on plans in
agile approaches), it would be useful to stick to one type of philosophy in its most part to
avoid confusions in the adoption of a particular type of philosophy over another during
the course of the project. For traditional development projects intending to transform into
agile, what should be instead done is to identify the most important changes required
(instead of changing them all), and then focus on only those that are critical for the
success of projects. Similarly, it would be useful to identify the critical challenges that
such a transforming project would face.66
Reproduced with permission of the copyright owner. Further reproduction prohibited without permission.

Irrespective of whether a project would like to transform in whole or in part to agile, in
any transformation project, it is a common practice to focus on only the key areas at first
and then gradually move attention to the other areas. To be able to do that, identifying the
key changes required and the challenges involved for adopting agile philosophies in a
project would be useful.
4.2 Changes and Challenges
In this Section, we present our work that may be helpful for software projects in the
future while transforming projects that follow traditional software development processes
into agile methods. Key to the work is the identification of the different key changes that
will be required, and the challenges that need to be undertaken for adopting agile
methods in a traditional software development project. A pictorial depiction of this is
shown in Figure 4.1, and they are described in further detail in the latter part of this
section. The different changes and challenges are identified based on some of the
important existing literature discussing such issues. In this Thesis, we do not focus on the
technical and application level changes. To avoid clumsiness of the Figure 4.1, we have
listed these key identified changes and challenges in Figure 4.2. The native attribute types
in Figure 4.2 are based on the home grounds of Boehm and Turner (2003), and the major
challenge categories identified by Nerur et al. (2005).
In Figure 4.2, we present the list of changes that are required for adopting agile
practices in traditional development projects, and the associated challenges/risks that are
likely to affect such changes. As can be seen from this Figure, the challenges/risks have a
negative relationship with the required changes, thereby indicating that the former are
67
Reproduced with permission of the copyright owner. Further reproduction prohibited without permission.

likely candidates to affect the transformation of traditional development processes into
agile ones. The list17 of changes and challenges has been prepared based on the previous
literature.
What we have tried to list in Figure 4.2 is all possible change candidates, and the risk
factors. What would be interesting to know is what are the critical changes required and
the risk factors. These will be empirically identified. As can be seen in Figure 4.2 the list
of the changes and the challenges/risks is large. The intention is to obtain a list of
empirically ranked changes, and challenges/risks that transformation managers can use to
focus their attention on.
17 In our list, we have tried to identify most of the important items. However, as agile software development is an emerging practice, our literature review reveals inadequate understanding of practitioners regarding all the different factors that are likely to affect the adoption of agile methodologies. Thus, we do not claim that the list is exhaustive. We, however, believe that we have been able to identify some of the important ones appearing in the literature.
68
Reproduced with permission of the copyright owner. Further reproduction prohibited without permission.

Plan-Driven (Native Attribute Types)
ManagementOrganizational
PersonnelProcess
Agile(Native Attribute Types)
Process Changes.
ManagementOrganizational
PersonnelProcess
Changes Required
Figure 4.1: Transitioning Traditional Software Development Processes into Agile.
69
Reproduced with permission of the copyright owner. Further reproduction prohibited without permission.

Changes Required
Changes in organizational culture- From policy and procedure based to freedom of development and management by team members.- From individually assigned roles to that o f team-work.- From solitary development attitudes to working with different teams.- From no competency requirements o f team composition to minimum competency requirements.- From non-customer-centric to customer-centric development.
Changes in Management Style- From command-and-control management to leadership-and-collaboration.- From authoritative to collaborative and pluralist decision making.
Changes in Knowledge Management Strategies- From heavy documentation-based to tacit knowledge management.
Changes in Development Processes- From heavily process-centric to short, iterative, test-driven, people-centric development.- From standards compliance and measurement driven development to development under uncertainty.- From contract-compliant to change-tolerant development.- From lifecycle-based development to feature- driven evolutionary and iterative development.
NegativeEffect
Challenges/Risks
Developer resistanceDeveloper perceptions o f micromanagementDeveloper perceptions o f freedomDistributed developmentProductivity differences between team membersDecrease in productivity during transitionOverzealous teamsTester resistanceUpper management resistanceHuman Resources resistanceVariability in subsystems and teamsDifferences in lifecyclesProblems with incorporating agile in legacysystemsDifferences in development processes Differences in performance measurements and benchmarksConformance with traditional process standards Differences in management attitude towards project successProblems with team-size scalability.Problems with selecting the right agile methodology.
Figure 4.2: The changes required for adopting agile practices in traditional projects,
and the associated challenges/risks.
There are a plenty of pieces of literature that talk about the changes required and the
challenges involved in the transformation of traditional projects into agile - Boehm and
Turner (2005), Cohn and Ford (2003), McMahon (2005), and Nerur et al. (2005) are a
few recent important ones, to name a few. However, without elaborating the list of such
authors, we have identified below some of the changes and challenges, which have
7 0
Reproduced with permission of the copyright owner. Further reproduction prohibited without permission.

gained a common consensus among different researchers and practitioners. Following the
practice that is usual in similar kinds of Business/Information Systems research, initially
we attempted to classify all the changes and challenges, as we did in Figure 4.2, and then
tabulate the list of authors who have advocated/cited the change/challenge required (i.e.,
constructing a table similar to Table 3.1). However, after considerable investigation of all
the relevant pieces of literature, we realized that the construction of such a table of
citations is less important, and perhaps, irrelevant here. This is because the entries in list
of these changes/challenges are intuitive, and fundamental, and therefore, most agile
software development researchers/practitioners would agree with the change/challenge,
whether they cite them explicitly or not. In other words, it is not appropriate in this work
to classify authors who advocate a change/challenge item from one who would not. It
would be unjustified to categorize the change/challenge items based on their advocates.
The list in Figure 4.2 is obtained after critically examining and appraising the works of
the previous authors. We should emphasize that all the changes and the challenges
discussed below are not our suggestions/contributions - they have been listed in the
literature mentioned above. Our contribution is to obtain a ranking of the
changes/challenges according to their level of importance perceived from survey data.
This ranking will help the managers planning to adopt agile practices in the future to
focus on only the most important items instead of getting buried under the heavy load of
working with all of them during a planned transition.
71
Reproduced with permission of the copyright owner. Further reproduction prohibited without permission.

4.2.1 Changes Required
Changes in organizational culture
One of the most important classes of changes that is required is the change in
organization culture. Organizational culture needs a change from policy and procedure
based to that of freedom of development and management by team members. The
incorporation of agile practices influences the values, norms, behavior and actions of
people, the decision making processes, problem resolution strategies, customary
practices, and the relationships between employees and managers (Nerur et al. 2005).
The cultural changes are challenging to achieve, as these require the change in the habits
and mindsets of the people with which they have worked over the years.
Many authors, e.g., Boehm and Turner (2005), and Nerur et al. (2005) have identified
people issues to play an important role in the adoption of agile practices. In traditional
organizations many developers are used to solitary programming activities. These
development habits that these programmers in traditional organizations have inculcated
over the years can stand in the way of the successful adoption of agile practices. Many
agile practices are based on the concepts of pair programming, collaborative decision
making, onsite customers, and shared learning. The success of all of these activities is
dependent on the attitudes of people in the team towards one another. Nerur et al. (2005)
propose that working effectively in a team, high level of competence, and the
relationships with the customers in terms o f the commitment, knowledge, proximity,
trust, and respect and important people issues that organizations should be concerned
while transforming the existing processes into the agile ones.
7 2
Reproduced with permission of the copyright owner. Further reproduction prohibited without permission.

Customer centric people issues are especially important in agile organizations, because
most agile practices require the developers to work closely with the customers. Both the
customers and developers are responsible for successful collaborative decision-making.
As a result due to the involvement of so many people from different backgrounds and
psychology decision making can be more difficult than in traditional organizations, where
the project managers are primarily responsible for most of the decision-making activities
(Nerur et al. 2005).
Changes in Management Style
The adoption of agile processes in traditional organizations require a change in
management styles from command-and-control management to leadership-and-
collaboration. In traditional development projects, the project managers’ roles are that of
someone who would chalk out a well defined and documented plan and would exercise
and control them. However, because of the paradigm shift from traditional/plan-driven in
traditional projects to depending on ad hoc plans in agile, the role of the project managers
also requires a change to someone who would facilitate the overall development of the
projects, work with the team members equally, collaborate with them and coordinate their
activities to ensure a smooth completion of the projects. Therefore, as we see, the project
managers who are keen on adopting agile approaches in their organizations would also
need to change their management style.
Changes in Knowledge Management Strategies
Another important issue is a paradigm shift in knowledge management strategies from
heavy documentation-based to that of the management of tacit knowledge that mostly
73
Reproduced with permission of the copyright owner. Further reproduction prohibited without permission.

resides within the agile developers. This is a consequence of the agile approaches paying
less importance on documentation. If there is a lack of documentation, most of the
knowledge resides with the developers. Consequently, how this tacit knowledge will be
managed brings in a new focus area in agile projects.
Changes in Development Processes
One of the important differences between traditional development practices and the agile
practices is that while the former is heavily process-based, the emphasis on processes is
relatively less in the latter. Instead, the agile practices pay more importance to people-
centric development.
Development processes need to change from heavily process-centric to short, iterative,
test-driven, people-centric development, from standards compliance and measurement
driven development to development under uncertainty, from contract-compliant to
change-tolerant development, and from lifecycle-based development to feature-driven
evolutionary and iterative development (Nerur et al., 2005). Most of these changes have
also been supported, implicitly or explicitly, by other authors listed at the beginning of
Section 4.2.
4.2.2 Challenges Involved
Developer resistance
Developers in traditional development projects are accustomed to heavyweight
development processes including production of non-code artifacts such as design
diagrams, and data models. Production of such artifacts, and their documentation is often
considered an important milestone of success in traditional development. However, as7 4
Reproduced with permission of the copyright owner. Further reproduction prohibited without permission.

agile practices pay more attention to the production of code artifacts, and as the project
success is dependent on that, agile practices can often lead to frustration, and therefore
face resistance by the developers habituated with the traditional development processes
Developer perceptions o f micromanagement
In agile software development projects, the managers interact with the developers more
closely, and frequently than they do in traditional development projects. This might
sometimes be greeted with unease by the developers used to traditional development
processes, where the managers meet with their employees mostly primarily during the
periodic status meetings. Meeting with their managers often might wrongly signal the
agile developers that their managers are chasing them for the upcoming or missed
deadlines. Similarly, managers lacking competency in agile principles might often forget
the fine line of difference between micromanagement, and collaborative decision making
and close developer-manager interactions required by some agile practices.
Developer perceptions o f freedom
As agile practices do not have heavy-weight processes similar to the traditional
development processes, some developers, especially the inexperienced ones, might take
agile practices to have given them freedom of not having a day-to-day work schedule
based on a Gantt/Pert Chart.
Distributed development
Agile teams are expected to expedite the decision making process. This requires faster
communication between development team members, managers, and customers. Agile
teams often rely upon face-to-face communication than written documented e-mails,
75
Reproduced with permission of the copyright owner. Further reproduction prohibited without permission.

mails, and notes. This, in turn, requires that teams be collocated. Distributed development
may decrease the pace of communication, and in turn slow down the decision making
required in agile-based development.
Productivity differences between team members
Differences in productivity of the team members can often stand in the way of the
success of agile teams, especially when they are working on software delivery related
activities. While it is not expected that all members in a team be competent, the ratio
between the number of competent, and non-competent people in a team is often critical to
agile software development projects.
Decrease in productivity during transition
During the transition from traditional development processes to the agile practices, the
productivity of the teams may be decreased due to the team members’ inexperience with
the new techniques and ways of operation.
Overzealous teams
Overzealousness might also pose to be a roadblock in some development teams due to the
perceptions of agility and fast decision making characterizing agile practices.
Overzealousness might sometimes lead to making decisions without any forethought.
Tester resistance
Unlike in traditional development, agile practices do not separate the coding and testing
phases, and the latter is not done sequentially after the former is completed. The testers
and developers are required to work very closely in agile software projects to do both
7 6
Reproduced with permission of the copyright owner. Further reproduction prohibited without permission.

testing and coding simultaneously in every iteration. However, simultaneous coding and
testing is often not warmly greeted by traditional testers. They might get a feeling of
micromanagement due to their close interactions with the development teams.
Upper management resistance
Upper management often resist moving to agile practices, as they become concerned
about promising features to customers within a contracted deadline, tracking project
progress, and integrating agile teams with non-agile teams in a project. The traditional
managers often feel a loss of control in the absence of Gantt charts, project plans, and
work-breakdown structures.
The managers in traditional projects adopting agile practices perceive that they will
not be able to commit the deliverables within a specific time to the customers. The
managers often feel that adopting agile practices would lead to imprecise deliverables and
goals.
Human Resources resistance
The human resource representatives in traditional organizations are used to assigning
fixed roles and responsibilities to employees and measuring their performance based on
those fixed assignments. They have a very constrained view of timekeeping, roles, and
responsibilities of employees. Concepts of pair programming, and work-sharing are often
resisted by human resource.
As agility requires dynamism of the team members with respect to the above
parameters, there could be human resource issues that need to be dealt with when trying
to introduce agile processes in a traditional development organization. The human
77
Reproduced with permission of the copyright owner. Further reproduction prohibited without permission.
resource strategies in traditional organizations are often hard-lined with strict descriptions
of what each individual can and cannot do. This can be a hindrance while implementing
agile methods, which promote developers to “think outside the box”. Consequently, agile
developers often end up taking non-traditional approaches. Human Resource
preparedness is important in organizations before employing agile practices.
For successful transitioning human resource teams should be educated of the need for
agile practices.
Variability in subsystems and teams
Both agile development and traditional development teams developing software for the
same system can end up developing a completely different set of artifacts, which might
cause integration issues. In other words, if one team is working with traditional software
development practices, and the other working with the agile software development
practices, they can be significant problems in the system integration level. For example,
the need for agile teams requiring refactoring their designs according to the changing
customer requirements can cause conflicts with the traditional software development
approach of freezing interface specifications in the early stages of software development.
Differences in lifecycles
Differences in lifecycles can also cause development process conflicts. While agile
processes believe in test-driven design, short, and focused iterations of development, the
traditional development processes are heavyweight, and have long iterations. Agile
developers target delivering immediate value to the customers, whereas in traditional
78
Reproduced with permission of the copyright owner. Further reproduction prohibited without permission.

development the customers see the entire product towards the end of the development
lifecycle.
Problems with incorporating agile in legacy systems
Agile development calls for prompt adaptiveness of systems to changing requirements.
Thus, adopting agile processes in legacy systems could be a problem, because refactoring
is inherently difficult in such systems.
Differences in development processes
While agile approaches tend to advocate the gathering of informal functional
requirements, the traditional requirements processes are more formal, and they emphasize
both functional and non-functional requirements such as reliability and security.
Differences in performance measurements and benchmarks
In traditional software development organizations, contract negotiation, and performance
measurements are based on strict sequential milestone targets (with room for parallel
development at times). This can cause problems while implementing agile practices,
because agile developers go beyond the traditional code and design reviews by
incorporating continuous customer feedback into the development lifecycle, and
delivering functionalities in shorter timeboxes.
Conformance with traditional process standards
Many organizations have adopted process standards, e.g., CMM, CMMI, and ISO, in the
past. Many of such organizations have even certified themselves to have attained certain
process standardization levels. Although both CMM Level 5 (Optimized) and agile
79
Reproduced with permission of the copyright owner. Further reproduction prohibited without permission.

processes have some commonalities in terms of their philosophies of continuous
improvement, and optimization of processes iteratively, they significantly differ in some
of their fundamental philosophies. For example, the emphasis the traditional methods lay
on documentation do not strictly conform with the agile philosophy.
Differences in attitude towards project success
Organizations often end up taking either of the two extreme steps towards success or
failure of projects employing agile practices. The project managers are either fired or are
promoted/rewarded for the project failures or successes. However, this type of
organizational attitudes can pose as roadblocks to the successful implementation of agile
processes in organizations.
Problems with team-size scalability
Agile approach fits better for projects with small team sizes. Team dimension influences
communication between team members. The agile approach with face-to-face
communication suites perfect for teams less than 20-40 people (Dyba, 2000). Therefore,
traditional development projects with large teams transforming into agile will have its
own challenges.
Problems with selecting the right agile methodology
According to Nerur et al. (2005), the other important process-centric issue of concern in the
adoption of agile practices is the determination of the agile methodology of right-fit in a
particular organization. Different organizations have different characteristics, and different agile
methodologies differ with respect to different parameters such as team size, and the duration of
the iterations.
80
Reproduced with permission of the copyright owner. Further reproduction prohibited without permission.

Chapter 5
Research Methodology
As mentioned briefly in Chapter 1, the research methodologies we use in this Thesis are
those typically used in survey-based business research. The core of the methodology is
survey-based, post-facto investigation. Broadly it consists of the following three phases:
Phase I: Formulation of the research questions, construction of the theoretical
frameworks and the development of hypotheses based on the research questions.
Phase II: Collection of data.
Phase III: Analysis of the data collected as part of Phase II.
We use the theoretical frameworks we have constructed in Chapters 3 and 4, and the
hypotheses we have formulated, to design a questionnaire, which were pre-tested for its
validity, usefulness, and readability before it was sent out for data gathering from the
field. The data that were gathered were then statistically analyzed using suitable data
analysis techniques explained in Chapter 6.
We use those techniques to gain an understanding of the important factors responsible
for the success of projects that want to adopt agile practices, a ranked list of changes
(according to their importance) that are necessary for transforming a project practicing
traditional software development into an agile one, and the critical challenges/risks that
the projects should be prepared to undertake.
81
Reproduced with permission of the copyright owner. Further reproduction prohibited without permission.

5.1 Research Methodologies: Choices & Rationale
5.1.1 Research Design
Our research methodology closely relates to the scientific and empirical types18.
The two options that we considered to choose from in this methodology are: (i)
experimental, or (ii) ex-post-facto, depending on whether the causal factors (or the
independent variables) could be controlled or not.
In experimental studies involving cause-effect analyses, it is customary to investigate
how one causal factor influences the dependent variable. To do so, normally, all the other
possible causal factors, expect the one whose influence on the dependent variable is being
investigated, is controlled. If, on the other hand, the researcher takes no action to control
any of the independent variables whose effect on the dependent variable is being
undertaken, the research design is called the ex-post-facto. As this study is based on the
survey respondents’ previous experience and perception using agile software
development practices, our research design is of the ex-post-facto type.
5.1.2 Data Source: Surveys
We conducted a survey type research, where multiple software development projects
practicing agile software development techniques were surveyed. We did not restrict our
18 In the scien tific m ethod, a theo ry is in itia lly developed in con junction w ith a phenom enon to exp la in the latter, then a hypothesis is proposed, and different alternatives o f the hypothesis are tested using data collected. The collected data may either support the hypothesis, or reject its claims. In the em pirical method also, a hypothesis is developed. Then the hypothesis is validated using statistical mechanisms. Although the empirical method may sound similar to the scientific method, the difference between the two is that, unlike the latter, the former may not have a formal method or theory that can explain the hypothesis. In empirical
82
Reproduced with permission of the copyright owner. Further reproduction prohibited without permission.

surveys to any particular industry type, sector, or size. The only requirement we had was
that the survey respondents practice agile software development, and they have
transitioned in the past from traditional software development practices to those
advocated by the “agile” software development community.
5.1.2.1 Survey Technique
The survey was administered using both the web-based and mail questionnaire
techniques. The advantages of using these techniques stem out of the nature of the
problem we investigate. Since we were interested in gathering the experiences of a large
number of users of agile software development practices, we sent our survey
questionnaire to potential respondents in various industrial sectors (such as
manufacturing, electronics, telecommunications, aerospace, oil and gas) that are
practicing agile software development techniques. Similarly, we did not restrict ourselves
to particular organization/project size, culture, or nationality. With this approach we were
able to survey agile software development professionals19 that are widely geographically
distributed across continents, it was cost-efficient, and that the respondents were able to
answer the questions more thoughtfully by taking their own time. Additionally, both the
web-based and the mail questionnaires allowed the survey respondents to complete parts
of the survey according to their own time. This also enabled them to do some
“homework”, if necessary, before being able to answer some of the questions.
method, the hypothesis is verified only using the collected data (Adrion 1993; Kontio 2001; Lazaro and Marcos. 2005; Zelkowitz and Wallace 1998).19 The eligibility o f the respondents o f the survey questionnaire is given in Section 5.1.2.3.
83
Reproduced with permission of the copyright owner. Further reproduction prohibited without permission.
For sending out the questionnaires by mail, as it was a challenge to find the exact
postal addresses of respondents practicing agile software development, the addresses of
the human resource departments were obtained from the company web-sites, and then
they were approached to help us find the appropriate contact person(s) within their
organization.
The mail questionnaire technique is reported in the literature to be intrinsically
plagued by the limitation of very limited turnaround from the respondents (Clover and
Balsley 1979; Creswell 2003; Newman 2005). In our study, we observed that we received
all the responses through the web-based survey, and surprisingly, there were no returned
filled-in questionnaires from those that were sent by post. The reason for this could be
that the mailed questionnaires were sent to the general human resources departments of
different organizations asking them to forward them to agile practitioners in their
organizations who have practised plan-driven software development in the past. It would
have likely happened that the human resource departments were not aware of exactly
which individuals in their organizations would satisfy the eligibility criteria. It is also an
undocumented fact that the human resource departments are generally more resistant to
make the employees in their organizations overburdened with additional works like this.
On the other hand, the web-based surveys were sent to the specific individuals and teams
who work with agile methodologies. Secondly, in many cases the human resource
departments were sent an e-mail with the same request as was sent by post. It might have
happened in many cases that the human resource departments had forwarded the e-mails
to the concerned people who filled out the web-based questionnaire and ignored the
questionnaire they had received by post, as for many people filling out an web-based84
Reproduced with permission of the copyright owner. Further reproduction prohibited without permission.

questionnaire is faster than sending by post. Finally, most of the questionnaires were sent
outside Canada (within Canada only two organizations were approached with postage
prepaid envelopes). Although a return envelope was enclosed with the questionnaires sent
overseas, it was not possible to affix prepaid postage with the return envelopes that were
sent out. This might have discouraged most respondents to pay for the postage and send it
back.
5.1.2.2 Questionnaire Design
Respondents were asked to fill out a structured questionnaire (see Appendix B). The
questionnaire has primarily close-ended, multiple choice type questions, with some open-
ended questions at the end.
The advantage of the open-ended questions is that they enable the respondents to
provide some additional information, which was not captured in the close-ended
questions. These open ended questions were not used in statistical analysis, but their
responses to such questions are summarized in Chapter 6. The multiple-choice type
questions ask the respondents to rank their responses on a scale of 1 to 5 (Likert’s scale).
The close-ended multiple-choice type questions helped us to perform statistical analysis
on the available data.
The nature of the questions helps to primarily assess the following three issues:
• The factors the respondents think will influence the success o f projects that want to
adopt agile software development projects.
85
Reproduced with permission of the copyright owner. Further reproduction prohibited without permission.

• The changes they think are important to transform a plan-driven software
development project into an agile project.
• The challenges/risks they think will impact the transformation of a plan-driven
software development project into an agile project.
The questionnaire also has classification type questions (e.g., occupation, and industry
sector of the respondents) (Clover and Balsley 1979; Creswell 2003; Newman 2005). The
classification type questions aid in gaining an understanding of the respondents’
background20.
5.1.2.3 Identifying the Respondents
In our research, identifying the respondents was a challenge, because agile software
development is still an emerging approach that has gained popularity only in the last 4-5
years. In organizations, often only a few teams are practicing agile software development.
Therefore, it was challenging to identify the specific respondents (and teams) in
organizations who qualify to respond to our questionnaire.
We did considerable amount of research on this issue, and have been fortunate to find
the following sources for collection of data:
20 This was done in the following way. In the questionnaire, there is a section that collects the respondents’ background information such as the primary business o f the organization o f the respondent, organization size, team size o f the respondent, the respondent’s role in the team, the number o f years o f knowledge o f agile software development practices, and the number o f years of experience developing software following agile practices. In the final analysis results, we provide a summary o f the background o f the respondents. This summary can help one to gain an overall understanding o f the group o f respondents whose consolidated responses were used in the data analysis.
86
Reproduced with permission of the copyright owner. Further reproduction prohibited without permission.

• CIO Magazine’s August 2004 issue lists the awardee organizations of the “Agile
100” awards. However, this list identifies only the candidate organizations on
which we can focus. Determining the specific contacts in these organizations still
remained a challenging issue.
• Agile Alliance (http://www.agilealliance.org) has a publicly available list of all its
corporate members. As they are members of the Agile Alliance, it is likely that
these organizations have teams who practice agile software development. We sent
our questionnaires by post to these organizations.
• Agile Alliance was also requested to circulate the questionnaire to its individual
members as they were not willing to reveal the contact e-mail addresses of those
members. They agreed to help in this process.
• Previous research papers and experience reports published in this area by industry-
based authors were collected. Those authors were approached by e-mail to fill out
the web-based questionnaire.
• The contact person of different agile user groups throughout the world was
contacted by e-mail to fill out the web-based questionnaire. They were also
requested to forward the questionnaire to other members in their user group and
also to the other team members at their place of work.
• The committee members of the different agile conferences that are currently
announced or have already taken place in the past were also approached.
87
Reproduced with permission of the copyright owner. Further reproduction prohibited without permission.

• Several blog and website postings of the survey link were also done. The
respondents were also requested to help in doing this in blogs they were associated
with.
In cases where we knew the names of the organizations that potentially practice agile
software development, but did not have the contacts of the specific teams which practice
agile software development, we approached the human resources departments of those
organizations and asked them to forward the questionnaires to the potentially eligible
respondents within their organizations.
In almost all cases in which we were successful in obtaining the specific names of
individuals who potentially practice agile, we sent out a reminder after a week or so to
remind them, in case they had not already filled out the questionnaire.
In both the web-based and the mail questionnaire techniques, we did not keep track of
the names (or similar other particulars) of the individuals who filled out the
questionnaire. Of course, in the web-based survey that we had performed, the survey tool
that we had used, i.e., Survey Monkey, keeps track of the IP addresses of the computers
that were used to fill out the questionnaire and disallows multiple submissions from the
same IP address.
The depth of data analysis that we could perform depended on the number of responses
that we could obtain. Our initial target was to obtain at least 150 responses. Further
discussions about the minimum sample size for our study are provided in Section 6.2.
The respondent eligibility criteria that were set to consider responses for further
consideration of data analysis were the following:
88
Reproduced with permission of the copyright owner. Further reproduction prohibited without permission.

91(1) Does the respondent’s team practice at least six of the twelve agile
software development principles?
(2) Has s/he ever been part of a team that used to practice traditional, plan-
driven software development, and had adopted agile practices in the past?
5.1.2.4 Response Rate
We received 241 responses, of which there were 174 were eligible responses, i.e.,
responses which satisfied the eligibility criteria mentioned above, for the success factors
survey, and 165 for the changes survey, and 161 for the challenges survey, respectively.
It was not possible to calculate the response rate because, in contrast to mail-in
questionnaires in which a fixed number of survey questionnaires is printed and sent out to
potential respondents, and the response rate is calculated based on the number of returned
filled-in questionnaires, in web-based or e-mail surveys that use the methodology similar
to the one in this Thesis it is difficult to keep track of actually how many people get to
see and fill out the questionnaire.
In this context, it is also pertinent to mention that some of the agile experts
(respondents) sent back messages encouraging and supporting this work. Excerpts of
their responses are mentioned below. Their names are withheld in the interest of
maintaining their anonymity.
21 The rationale behind this is that it might be infeasible to find projects which follow all the 12 agile principles. This is because as agile software development was still an emerging philosophy, finding projects that follow agile practices is difficult, and finding projects that follow all the practices was even more difficult (if not, nearly impossible). Therefore, initially we set the target to identifying projects that follow at least 50% of those principles. W hile there was no hard rationale behind choosing this figure, we felt that this figure was neither too high nor too low.
89
Reproduced with permission of the copyright owner. Further reproduction prohibited without permission.

Respondent A: I think it's good fo r those o f us in the agile community to support
this type o f research. The survey doesn't take long and it sounds like the results
will be o f interest.
Respondent B: This is one o f the few surveys I have seen in this area that was
not a total waste o f my time. Congratulations to you and your committee.
Respondent C: I have more than ten year o f experience in software development
and five o f this within an agile context. I've ju st completed your survey and think
questions are very relevant. I would appreciate to receive the result o f this work.
You got a very good subject fo r your thesis.
Respondent D: ...My next book will be on scaling agile methods to large
projects. Also, as you may know from my 'agile...' book and its "Evidence"
chapter, I collect evidence, and write it up (which i'll do again in my next book).
Therefore, I'm interested in any data from this survey you can share. Possible?
Respondent E: I am on the commercial side and so would be very interested in
seeing your thesis when published. Do you have any objection to sending me a
copy when complete?
In addition to the above experts, there were plenty of other respondents who showed
interest in the final results from this work. This shows that, at least initially, a number of
agile software development practitioners have “warmly greeted” the nature of this work,
and have shown interest in it.
90
Reproduced with permission of the copyright owner. Further reproduction prohibited without permission.

5.1.2.5 Pre-Testing the Questionnaire
It was necessary to pre-test the questionnaire, before sending it out for the actual survey.
Request for pre-testing was sent out to ten potentially qualified software development
professionals. Out of the ten requests, only five agreed to help (50% turnaround rate).
Pre-testing was finally done with the help of those five software development
professionals. They had different experience levels and work functions and worked in
both the government and the private sectors. While four of the five respondents did not
have any major suggestions for improvement, one suggested a few changes for improving
the clarity of the questions. Overall, there were not much revision that was required as a
result of the pre-testing.
Pre-testing the questionnaire was helpful for clarifying any ambiguities in the
questionnaire, its readability, and the ordering of the questions. Based on the results of
the pre-test, the original questionnaire was revised to reflect the feedback of the pre-test
respondents.
91
Reproduced with permission of the copyright owner. Further reproduction prohibited without permission.

Chapter 6
Data Analysis
After all the data were collected from the surveys, they were analyzed in an attempt to
draw meaningful conclusions out of them. Different techniques for analyzing survey data
were used. In this Thesis, the following procedures were undertaken:
1. Data Preparation: Here the main goal was to check the consistency of the raw
data that was obtained, log them, edit them, code them, and thus, prepare them
for analysis in the next step.
2. Data Analysis: The processed data from the previous step were then used with
different techniques to “mine” information out of them.
3. Documentation: All the findings from previous two steps were then documented
(which constitutes the bulk of the Thesis here). Apart from the fact that
documentation in the form of this Thesis is a degree requirement, documentation
is important because without proper documentation, the effort expended in the
previous two steps could be wasted. However simple it may sound, we advocate
this to be an important knowledge management step, because in the absence of
this step all the results that are obtained, and the results of the analysis that are
performed on them may not be beneficial to future researchers.
92
Reproduced with permission of the copyright owner. Further reproduction prohibited without permission.

6.1 Data Preparation
As part of data preparation, we mainly performed three main steps: data logging, data
editing, and data entry. They are further explained below22.
6.1.1 Data Logging
Data logging was done to help us to keep track of the sent out, returned, edited, coded,
and data entered questionnaires. However, simple it may sound, this was an important
step because we adopted a variety of avenues for data collection (as mentioned in the
Chapter 5), and there were a plenty of respondents that we had to communicate with.
Without doing it in a structured, carefully planned, and organized manner it could have
lead to cumbersomeness, and ambiguity later on, which could consequently lead to errors
in data analysis.
93 9 4In our research, we used Excel ’ to keep track of such information in an ad hoc
manner. There was no particular template that was used for this purpose. The different
variables used in this study were coded (labeled) for ease in representation, and analysis
using SPSS. The different codes that were used for each of the variables used for
performing the studies are listed in Appendix C.
22 The techniques we used are standard, and can be found in any business research method books such as Clover and Balsley 1979; Creswell 2003 and Newman 2005.23 http://www.microsoft.com/24 This is in addition to the built-in data logging capabilities o f the online survey tool “SurveyMonkey” (http://wwwsurveymonkey.com).
93
Reproduced with permission of the copyright owner. Further reproduction prohibited without permission.

6.1.2 Editing
The data that were collected were first edited before they were used for further analysis,
to ensure that the data used for analysis reporting were accurate, uniform, legible, and
consistent (Clover and Balsley 1979; Creswell 2003; Newman 2005).
During editing we checked for omissions to see whether all answers, and other
associated data were recorded. Similarly, we checked whether the filled-in questionnaires
returned by the respondents had any prominent inconsistent information. No prominently
inconsistent filled-in questionnaires that were found. However, there were a few
responses in which although a bulk of questions had been answered by the respondents,
but there were a few missing entries. We decided not to remove those data points
altogether from the main data sheet used in the data analysis. This was because, by doing
so, we could end up losing information contained in the rest of the correctly filled out
questionnaires. However, while doing some of the analysis using SPSS, SPSS by default
ignores those points that have a missing value and performs the analysis only with the
non-missing values . We decided to go ahead with this strategy because by removing the
data points with missing values altogether from the main data sheet, we would not be able
to get even the descriptive statistical patterns underlying all the data.
Also, since errors might creep in due to misinterpretation or misunderstanding of the
question on the part of the survey respondent, as mentioned in Chapter 5, we took
precautionary measures by pre-testing the questionnaire. The respondents were also
25 The default option of SPSS ignores those sample points that have even one missing value. The other option could have been to replace the missing value with the average of all the others. However, we adopted the default option, as
94
Reproduced with permission of the copyright owner. Further reproduction prohibited without permission.

provided our contact information to enable to contact us, in case they needed any
clarification.
6.1.3 Data Entry
Since all the responses we obtained were through the web-based survey tool,
“SurveyMonkey”, we used the export capability of the tool to collect data obtained
through the tool into Excel to enable their structured viewing, and manipulation. As a
consequence, no separate manual entry of data was required. This, of course, minimized
the possibilities of errors occurring during manual data entry. The Excel data sheet that is
produced by the tool also automatically adds some additional columns such as the IP
address of the computers that the respondents used for filling out the surveys. Those
undesired columns were removed because they were not given any consideration during
the further processing of the data. Later on during statistical analysis using SPSS, the
Excel data sheet was imported as an SPSS data sheet to be able to perform statistical
analysis using it in SPSS.
6.2 Data Analysis
The approach for data analysis was quantitative (statistical) in nature, with some stints of
qualitative analysis of the data collected through replies to the open-ended questions in
the questionnaire. The responses to the open-ended questions from the survey participants
are listed in Appendix D.
we felt it was a fairer judgment to ignore such points instead of replacing them with the average (which could very easily be misrepresentative of what that respondent would have actually responded).
95
Reproduced with permission of the copyright owner. Further reproduction prohibited without permission.

We performed different statistical studies with the processed data of the closed-ended
questions. They are listed below for each research question.
6.2.1 Research Question 1
As part of our first research question, on the basis of the survey data we obtained, we
wanted to understand the success factors from the perspective of software practitioners in
agile software development projects. It is a relationship study, and we have 14
independent variables (some of which have multiple questions measuring them) and a
consolidated dependent variable (“Success”), which has 5 parts in our study . In
addition, we go one step further, and show the regression models with each of these
constituents of Success as a dependent variable and the rest of the fourteen potential
factors as the independent variables.
6.2.1.1 Descriptive Statistics
First we performed descriptive statistics to help us in summarizing the information latent
in the data that we obtained from surveys for this research question. First, for each
question corresponding to both the independent and the dependent variables, we tried to
gain an understanding of the minimum, maximum, mean, and standard deviation of the
survey data obtained from respondents. Table 6.1 shows the descriptive statistical results.
It should be observed that, just by considering the mean values, amongst all the fourteen
independent variables Indl has the highest mean o f 4.77 with a standard deviation o f
26 For variables that have multiple questions measuring them, for every respondent, we decided to average his/her responses over all the questions measuring it. Similarly, since “Success” has 5 measures, we decided to average out the responses over all the measures to obtain its consolidated measure.
96
Reproduced with permission of the copyright owner. Further reproduction prohibited without permission.

0.59. In other words, nearly most of the participants in this survey strongly agree that
they give highest priority to customer satisfaction more than anything else. Ind2
(customer collaboration), Ind3 (customer commitment), Ind4 (decision time), Ind6 (team
size), Ind7 (corporate culture), IndlO (technical competency), Ind ll (personal
characteristics), Indl2 (communication and negotiation), and Ind 14 (training and
learning), according to the survey results were also considered to be in the range of
(somewhat agree, strongly agree). The means of all the independent variables also show
that Ind5 has the least mean value of 3.22. This shows that most of the participants
remained neutral regarding whether most of the team members in their projects were
geographically closely located, and the other teams that they interact with are
geographically closely located. It should also be observed that none of the independent
variables has a mean score below 3 (“Neither Agree nor Disagree” in the 5-point Likert
scale that we used). This shows that on an average, the participants that were surveyed
were not in disagreement with the factors in their projects.
It addition to the summarized descriptive statistical results presented in Table 6.1, the
detailed descriptive statistical results with the individual variables constituting to form
the consolidated independent variables are listed in Section E. 1.1 in Appendix E.
9 7
Reproduced with permission of the copyright owner. Further reproduction prohibited without permission.

Table 6.1: Research Question 1: Summarized Descriptive Statistics
Descriptive Statistics
N Mean Std. DeviationInd 1 174 4.76 .595Ind 2 174 4.17 .925Ind 3 174 3.95 1.074Ind 4 173 4.30 .815Ind 5 174 3.22 1.267Ind 6 174 4.64 .899Ind 7 174 4.16 .793Ind 8 174 3.70 1.227Ind 9 174 3.60 1.501Ind 10 173 4.11 .985Ind 11 174 4.39 .577Ind 12 173 4.02 .748Ind 13 172 3.75 1.001Ind 14 171 4.34 .783Dependent 173 4.37 .557Valid N (listwise) 167
Table 6.2 gives an overall idea of the different types of organizations to which the
different respondents belong. It can be seen that the majority of the respondents (around
32.5%) belong to industries whose primary line of business is computer related, followed
by respondents who belong to consulting organizations (around 29.8%). There were also
around 10.2% responses from organizations having the primary line of business as
banking/insurance industries, around 5.1% having the primary line of business as
education/research, and around 2.4% each from medical/health organizations, and
aerospace organizations.
In addition to the above organizations, there were about 7.9% respondents who
belong to other organizations having primary line of business such as travel, logistics,
transportation, government contractor, agriculture, and integrated workplace
management. There were no responses from the hospitality, legal services, and non-profit
98
Reproduced with permission of the copyright owner. Further reproduction prohibited without permission.

organizations. Thus we can see that there has been a fair share of responses from different
organization sectors.
Table 6.2: Primary identity of the respondents’ organizations
Identity Response percent
1 Computer related(IS/MIS/DP/Hardware/Software/Telecommunications)
32.5%
2 Banking/insurance 10.2%
3 Real estate 1.2%
4 Business supplies/services 1.2%
5 Education/research 5.1%
6 Entertainment/media/publishing 1.2%
7 Hospitality 0%
8 Medical/health care 2.4%
9 Government 2%
10 Engineering/construction 0.8%
11 Consulting 29.8%
12 Legal services 0%
13 Manufacturing/distribution 2%
14 Consumer retail/wholesale 0.8%
15 Non-profit/membership organization 0%
16 Electrical machines 0.4%
17 Aerospace 2.4%
18 Others 7.9%
The respondents were also requested to identify the number of employees in their
organizations. Their responses are summarized in Table 6.3. O f all the respondents,
roughly 27.6% belong to organizations having 501-1000 employees, roughly 26.8%
having more than 1000 employees, roughly 11.8% having less than 10 employees,
99
Reproduced with permission of the copyright owner. Further reproduction prohibited without permission.
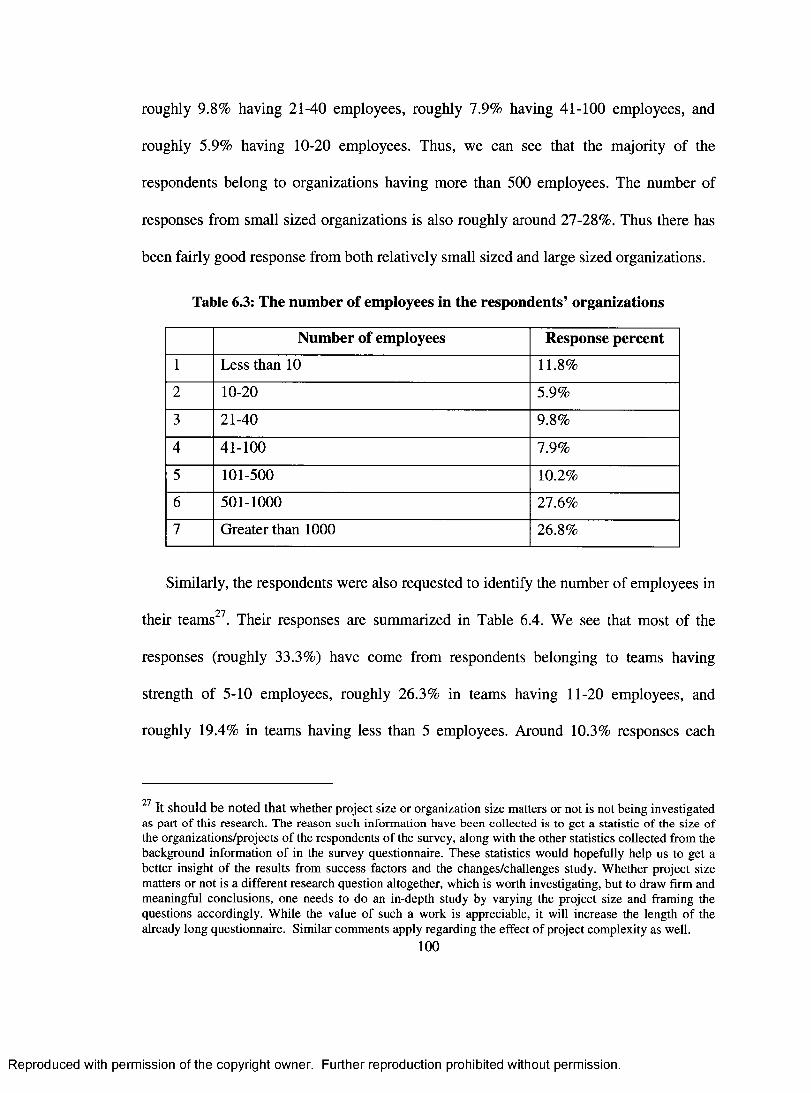
roughly 9.8% having 21-40 employees, roughly 7.9% having 41-100 employees, and
roughly 5.9% having 10-20 employees. Thus, we can see that the majority of the
respondents belong to organizations having more than 500 employees. The number of
responses from small sized organizations is also roughly around 27-28%. Thus there has
been fairly good response from both relatively small sized and large sized organizations.
Table 6.3: The number of employees in the respondents’ organizations
Number of employees Response percent
1 Less than 10 11.8%
2 10-20 5.9%
3 21-40 9.8%
4 41-100 7.9%
5 101-500 10.2%
6 501-1000 27.6%
7 Greater than 1000 26.8%
Similarly, the respondents were also requested to identify the number of employees in
01their teams . Their responses are summarized in Table 6.4. We see that most of the
responses (roughly 33.3%) have come from respondents belonging to teams having
strength of 5-10 employees, roughly 26.3% in teams having 11-20 employees, and
roughly 19.4% in teams having less than 5 employees. Around 10.3% responses each
27 It should b e noted that whether project size or organization size matters or not is not being investigated as part o f th is research . T he reason such in fo rm ation have been co llec ted is to get a statistic o f the size o f the organizations/projects o f the respondents o f the survey, along with the other statistics collected from the background information o f in the survey questionnaire. These statistics would hopefully help us to get a better insight o f the results from success factors and the changes/challenges study. Whether project size matters or not is a different research question altogether, which is worth investigating, but to draw firm and meaningful conclusions, one needs to do an in-depth study by varying the project size and framing the questions accordingly. While the value o f such a work is appreciable, it will increase the length o f the already long questionnaire. Similar comments apply regarding the effect o f project complexity as well.
100
Reproduced with permission of the copyright owner. Further reproduction prohibited without permission.

were obtained from teams having 21-40 employees, and greater than 40 employees. Thus
we can see that more than 50% of the respondents belong to small sized teams (having
less than 10 employees). Roughly another 50% responses came from teams having more
than 10 employees. This shows a fair distribution of participation from all sizes of teams.
Table 6.4: The number of employees in the respondents’ team
Number of employees Response percent
1 Less than 5 19.4%
2 5-10 33.3%
3 11-20 26.2%
4 21-40 10.3%
5 Greater than 40 10.3%
Table 6.5 shows the roles of the different respondents. Most of the responses (about
29.5%) have been obtained from developers/testers, about 18.9% from team leaders,
about 17.7% from project managers, and 7.9% from functional managers. There were
also about 25% responses from respondents having other roles such as director, business
analyst, software architect, scrum master, and usability analyst.
Table 6.5: The role in the respondents’ team
Role Response percent
1 Functional Manager 7.9%
2 Project Manager 17.7%
3 Team Leader 18.9%4 Developer/T ester 29.5%
5 Other 26%
101
Reproduced with permission of the copyright owner. Further reproduction prohibited without permission.

The summary of responses of the duration for which the respondents have been
developing software using agile principles/methods is depicted in Table 6.6. Majority of
the respondents (roughly 30%) have been developing software using agile
principles/methods for 1-3 years, 26.4% for 3-5 years, 24% for greater than 5 years, and
19.6% for less than 1 year. This shows that we had participants from fairly all duration
levels.
Table 6.6: Duration for which the respondents have been developing software using
agile principles/methods
Duration Response percent
1 Less than 1 year 19.6%
2 1-3 years 30%
3 3-5 years 26.4%
4 Greater than 5 years 24%
In order to assess the degree to which the different respondents practice agile
software development principles, the respondents were asked to mark their response in
the 1 to 5 Likert scale (1 - Strongly Disagree, and 5 - Strongly Agree). Their responses
are summarized in Table 6.7. The response average values imply that on an average the
majority of the respondents agree with the statement that they practice most of the
principles to a great extent (greater than 4). In fact, a majority of the respondents have
stated that for all of 12 principles they strongly agree with the statement that they follow
them. Gaining further understanding of the nature of distribution of the responses across
all the scale items can be had by closely going through Table 6.7.
102
Reproduced with permission of the copyright owner. Further reproduction prohibited without permission.

Table 6.7: Degree of practice of agile software development principles by the respondents.
The percentage values represent the percentage of the respondents who responded who
selected that option in the 1 to 5 Likert scale.
StronglyDisagree
(1)
SomewhatDisagree
(2)
Neither Disagree
nor Agree (3)
Somewhat Agree (4)
StronglyAgree
(5)
Not Applicable
or Don’t Know (X)
ResponseAverage
We give high priority to satisfying customers through early and continuous delivery of valuable software
2% 2% 5% 12% 77% 2% 4.63
We welcome changingrequirements, even late during development
3% 7% 9% 37% 42% 2% 4.11
We deliver working software more frequently, from couple of weeks to couple of months, with a preference to a shorter timescale
3% 2% 5% 19% 69% 2% 4.52
Our business people and developers work together daily (very closely) throughout the project
4% 10% 6% 29% 49% 2% 4.12
We build projects around motivated individuals. We give them the environment and trust them to get the job done.
2% 6% 8% 31% 51% 2% 4.24
W e emphasize more on face-to-face communication for conveying information to and within the development team.
1% 3% 8% 23% 63% 2% 4.46
We measure and track progress based on working software
3% 7% 6% 27% 55% 3% 4.28
W e promote sustainable development, Our sponsors, developers, and users maintain a
5% 10% 11% 32% 39% 3% 3.93
103
Reproduced with permission of the copyright owner. Further reproduction prohibited without permission.

constant pace indefinitely.Our software development project team follows continuous attention to technical excellence and good design for development.
4% 5% 7% 39% 43% 2% 4.14
We practice simple designs, processes, and approaches in our software development methodologies. We implement features that are required by the customers - nothing more.
2% 11% 10% 33% 41% 2% 4.01
Our development teams are selforganizing - our teams can (re)- organize continuously in different configurations to meet the changing requirements and the newly arising challenges of the business.
5% 12% 14% 33% 33% 3% 3.79
At regular intervals, our team reflects on how to become more effective, then tunes and adjusts its behavior accordingly.
3% 6% 14% 33% 43% 1% 4.08
In addition to the above summary of the respondents’ backgrounds, the consolidated
summary of the responses (in percentage figures) obtained from all the respondents for
the different success factor variables is captured in Section F.l of Appendix F. The
results presented there are self-explanatory and are, thus, not explained further over here
to maintain the brevity of this Chapter. However, three interesting observations are given
below:
10 4
Reproduced with permission of the copyright owner. Further reproduction prohibited without permission.

• Amongst all the independent variables, Indl (i.e., customer satisfaction) was
strongly agreed as being practiced by the largest (roughly 77%) number of
respondents.
• Amongst all the independent variables, the largest percentage (roughly 28%) of
respondents strongly disagreed that the other teams that they interacted with
within or outside their organizations were geographically closely related to theirs
(see the row corresponding to Ind5b in the table).
• Amongst the five items measuring dependent variable, “increased flexibility to
meet with the changing customer requirements” was voted as being true by the
largest percentage (71%) of respondents.
6.2.1.2 Test of Internal Consistency Reliability
Our next step was to understand the internal consistency of items in a scale. This helps us
to understand how consistent the different questions are within a variable or how
consistently the survey respondents have responded to the items.
For testing internal consistency reliability, we used Cronbach’s alpha28. Cronbach’s
alpha helps in estimating the proportion of systematic or consistent variance in a given
sample of test scores. The value of Cronbach’s alpha lies between 0 (no consistent
variance can be accounted for) and 1 (variance is all consistent). A higher value of
Cronbach’s alpha indicates a greater consistency in variance o f the sample test scores.
28 There is another variation o f the commonly used Cronbach’s alpha, called the “Standardized Item Cronbach’s Alpha”. It is computed by standardizing the scale items so that they have equal means and variances. Some researchers use this value o f alpha in their tests. In our study, we will present the results o f both o f these versions.
105
Reproduced with permission of the copyright owner. Further reproduction prohibited without permission.

Usually, a Cronbach’s alpha value greater than 0.6 is considered standard in survey
research. Some statisticians use 0.7 as the required cut-off point. A higher value of
Cronbach’s alpha would indicate a greater reliability or accuracy of the statistical
inferences from the data. For example, if in a study the Cronbach’s alpha for a set of test
scores turns out to be 0.7, it would mean that there is 70% consistency, and 100%-70% =
30% of inconsistency of test scores. Table 6.8 shows the Cronbach’s alpha of those
constructs that are measured with multiple items. As we can see the Cronbach’s alpha for
all items are at greater than or equal to 0.6 (in fact, they are mostly at least 0.7). This
indicates that there are no problems with the internal consistency reliability tests. The
inter-item correlation matrices corresponding to the items in Ind7, Ind ll, Indl2, and
Indl3 are given in Section E l.2 in Appendix E.
Table 6.8: Research Question 1: Reliability Statistics Summary
Items in Number of items Chronbach’s Alpha Chronbach’s Alpha Based on
Standardized Items
Ind7 8 .872 .878Indll 6 .847 .852Indl2 5 .700 .664Indl3 2 .784 .779
Dependent 5 .717 .744
6.2.1.3 Linear Multiple Regression Analysis
The purpose of this study is to understand how the 14 independent variables relate to the
dependent variable (Success). Throughout the analysis, the dependent variable was log
(base e)-transformed, as it was found that the log (base e)-transformed distribution gives
a better linear regression model. The distribution obtained gets closer to normal.106
Reproduced with permission of the copyright owner. Further reproduction prohibited without permission.

One of the outputs of running linear multiple regression analysis in SPSS is a table
with the analysis of inter-correlations. Correlation analysis helps us to understand the
degree of relationship between all our 14 independent variables and the dependent
variable (Success). Table 6.9 shows the summarized correlation results, between the
dependent variable and each of the independent variables, for items with non-missing
values. The detailed inter-independent variable correlation results are presented in
Appendix E.
Table 6.9: Research Question 1: Summarized Correlations Table
Variables Correlationcoefficient
Significance
Indl .140 .036
Ind2 .232 .001
Ind3 .253 .001
Ind4 .254 .000
Ind5 .074 .171
Ind6 .097 .107
Ind7 .241 .001
Ind8 .075 .168
Ind9 .301 .000
IndlO .102 .096Indll .180 .010
Indl2 .104 .092
Indl3 .381 .000Indl4 .283 .000
*N = 166
This analysis results in mainly two sets of values: (i) the Pearson’s coefficient of
correlation and (ii) the values of significance. The coefficient of correlation between a
107
Reproduced with permission of the copyright owner. Further reproduction prohibited without permission.

pair of variables indicates the degree of relationship between them. Its value lies between
0 and 1. The higher the value of the correlation coefficient, the greater the strength of the
relationship. A positive value of the coefficient indicates a positive relationship, whereas
a negative value indicates an inverse relationship between those variables. The values of
significance indicate the significance of each correlation coefficient in (i). The tests of
significance are normally conducted at values 0.01 or 0.05. In this study, the test was
conducted at level 0.05. If for a particular relationship, we find that the significance value
is very small (less than 0.05), then it would indicate that the relationship is significant. If
the relationship is between an independent variable and the dependent variable (Success),
it indicates that, that particular independent variable has significant effect on Success. On
the basis of the data that we have obtained we see that the independent variables Indl,
Ind2, Ind3, Ind4, Ind7, Ind9, Ind ll, Indl3, and Indl4 are statistically significantly related
to the dependent variable, Success, whereas the independent variables Ind5, Ind6, Ind8,
IndlO, and Indl2 were found not to have any significant relationship with Success. In
sum, the following factors are significantly related to Success:
• Customer satisfaction
• Customer collaboration
• Customer commitment
• Decision time
• Corporate culture
• Control
108
Reproduced with permission of the copyright owner. Further reproduction prohibited without permission.

• Personal characteristics
• Societal culture
• Training and learning
The following are not significantly related with Success:
• Team distribution
• Team size
• Planning
• Technical competency
• Communication and negotiation
On the basis of the significance values and the values of correlation coefficients, we
either accept or reject our 14 hypotheses we have listed in Chapter 3. The
acceptance/rejection results of hypotheses mentioned in Chapter 3 are as shown below:
HOla: The greater the satisfaction of the customers in projects, the more likely would be
the success of agile software development projects. Accepted.
HOlb: The greater the collaboration of the customers in projects, the more likely would
be the success of agile software development projects. Accepted.
HOlc: The greater the commitment of the customers in projects, the more likely would
be the success of agile software development projects. Accepted.
H02: The quicker the decisions are taken in projects, the more likely would be the
success of agile software development projects. Accepted.
109
Reproduced with permission of the copyright owner. Further reproduction prohibited without permission.

H03: The more closely located the project teams are, the more likely would be the
success of agile software development projects. Not Accepted.
H04: The smaller the size of the teams in a project, the more likely would be the success
of agile software development projects. Not Accepted.
H05: The stronger the corporate culture for agile software development projects, the
more likely would be their success. Accepted.
H06a: The more informalized the plans are in an agile project, the more likely would be
the success of agile software development projects. Not Accepted.
H06b: The more qualitative controls the projects have, the more likely would be the
success of agile software development projects. Accepted.
HP1: The more technically competent the team members are in a project, the more likely
would be the success of agile software development projects. Not Accepted.
HP2: The better the personal characteristics of the team members in a project, the more
likely would be the success of agile software development projects. Accepted.
HP3: The more the communication and negotiation is between people, the more likely
would be the success of agile software development projects. Not Accepted.
HP4: The more favorable the societal culture is for agile projects, the more likely would
be the success of agile software development projects. Accepted.
HP5: The more the environment is for continuously learning, and informal training, the
more evident would be the success of agile software development projects. Accepted.
110
Reproduced with permission of the copyright owner. Further reproduction prohibited without permission.

Another outcome of the multiple regression analysis that was conducted is a table
containing the coefficients of the estimated regression model. It is shown in Table 6.10.
These coefficients help us to construct a regression model showing the relationships
between the dependent variable (Success) and the 14 independent variables, viz.:
Success = ^ a ixi .ieN
In the above model, N represents the set of independent variables, and 0 ̂ and
Xj represent respectively the elements of the set of coefficients and the independent
variables.
In our study, we perform stepwise linear multiple regression. In our stepwise
regression study, the following criteria (default criteria in SPSS) are used in steps until
these criteria are no longer satisfied:
Probability-of-F-to-enter <= .050, Probability-of-F-to-remove >= .100
Section E.1.3 in Appendix E shows the variables that are entered/removed in each
step Each of these steps produces a model. Hence they are referred to be so to be
consistent with the terminology used in SPSS. The Beta, t, Significance, and Collinearity
Statistics for the excluded variables corresponding to each of these four steps are also
presented in Section E.1.3 in Appendix E.
Reproduced with permission of the copyright owner. Further reproduction prohibited without permission.

Table 6.10: Research Question 1: Regression Coefficients
Coefficients?
Model
UnstandardizedCoefficients
StandardizedCoefficients
t Sid.Correlations Collinearih Statistics
B Std. Error Beta Zero-order Partial Part Tolerance VIF1 (Constant) 1.268 .039 32.860 .000
Ind 13 .052 .010 .381 5.274 .000 .381 .381 .381 1.000 1.0002 (Constant) 1.131 .052 21.850 .000
Ind 13 .053 .010 .388 5.590 .000 .381 .401 .388 .999 1.001Ind 3 .034 .009 .264 3.801 .000 .253 .285 .264 .999 1.001
3 (Constant) 1.081 .052 20.686 .000Ind 13 .049 .009 .358 5.275 .000 .381 .383 .355 .982 1.018Ind 3 .031 .009 .239 3.522 .001 .253 .267 .237 .987 1.013Ind 9 .021 .006 .230 3.369 .001 .301 .256 .227 .972 1.029
4 (Constant) .940 .068 13.889 .000Ind 13 .044 .009 .323 4.819 .000 .381 .355 .316 .955 1.047Ind 3 .031 .008 .246 3.728 .000 .253 .282 .244 .986 1.014Ind 9 .020 .006 .213 3.197 .002 .301 .244 .209 .966 1.036Ind 14 .037 .012 .212 3.179 .002 .283 .243 .208 .962 1.040
a- Dependent Variable: Log dependent
Table 6.11: Research Question 1: Regression Model Summary
Model R R SquareAdjusted R
SquareStd. Error of the Estimate
1 .330(a) .109 .104 .126852 .436(b) .190 .180 .121363 .491(c) .241 .227 .117834 .530(d) .281 .263 .11505a Predictors: (Constant), Ind 13 b Predictors: (Constant), Ind 13, Ind 3 c Predictors: (Constant), Ind 13, Ind 3, Ind 9 d Predictors: (Constant), Ind 13, Ind 3, Ind 9, Ind 14 e Dependent Variable: LOG (base e) DEP
2QTable 6.10 and Table 6.11 show the regression coefficients and the regression
model summary that are obtained. The R values for each model estimate the coefficients
of multiple correlation. It indicates the degree of linear relationship between the observed
and predicted values of Success. As we can see, the values of R for all the above four
models produced by the stepwise regression procedure belong to the range (0,1). In
general, greater the R values, the stronger the relationships are. The proportion of
variation in Success explained by the regression model is estimated by the R squared
112
Reproduced with permission of the copyright owner. Further reproduction prohibited without permission.

values. The R squared values also lie in the range (0,1). Model 4 has the highest value of
R squared amongst all the four models. It has four predictors: Indl3, Ind3, Ind9, and
Indl4. Thus, stepwise regression, in this example, reveals only four variables as
predictors of Success. This is consistent with the commonly used idea that there should
not be too many predictors in a good multiple regression model. In order to better reflect
the goodness of fit of the model, the adjusted R squared is used. The adjusted R squared
for Model 4 is also the highest amongst all the four models.
In Table 6.10, the B values in the “unstandardized coefficients” column are the
coefficients of the estimated regression model. Thus, in this study, the estimated model
is:
In (Success) = .940 +0.044(Ind 13) + 0.031(Ind 3) +.020(Ind 9) + .037(Ind 14)
In the above equation:Ind 3 represents Customer CommitmentInd 9 represents ControlInd 13 represents Societal CultureInd 14 represents Training and Learning
The standardized coefficients (the Beta values) are an attempt to measure the strength
of one regression predictor relative to another. They are measured in standard deviation
units. In this study, in Model 4, the largest Beta is .323 and the smallest Beta is .212. This
indicates that a 1 standard deviation increase in Ind 13 (or Ind 14) would lead to .323 units
(or .212 units) increase in standard deviation of Success.
29 Figures 6.10 and 6.11 and alike figures in this Thesis are obtained as outputs from SPSS.113
Reproduced with permission of the copyright owner. Further reproduction prohibited without permission.

If, prior to performing the regression analysis, we had transformed all the outcome
and the predictor variables to a standard set of scores called the z scores, we would get
the Beta coefficients as the unstandardized coefficients.
By looking at the t-statistics in Table 6.10, we can estimate the importance of one
variable relative to another in the model. The general rule of thumb used for looking at t
values is to look for t values below -2 or above +2. Here all the variables Indl3, Ind3,
Ind9, and Ind 14 have t value well above +2.
Also, the collinearity statistics indicates that in Model 4, all the VIF values are well
below the threshold of 2 (VIF values greater than 2 are considered problematic), and all
the tolerance values are above the threshold of 0. This indicates that with this model,
multicollinearity is not a problem.
Table 6.12 summarizes the results of analysis of variance corresponding to each of
the 4 models. Corresponding to each model, the sum of squares, degrees of freedom, and
mean square are shown. The amount of variation that can be accounted for by each of
these four models is shown in Regression row of the table, the amount of variation that
cannot be accounted for by each of these models is shown in the Residual row, and the
total variation (i.e., the sum of the variations accounted for by both the Regression, and
the Residual) is also shown thereafter for each of the four models. Amongst all the four
models, Model 4 has the largest regression sum of squares compared to the residual sum
of squares. It has the least residual compared to the other three models. The F statistic
results in the table reveal that the independent variables Indl3, Ind3, Ind9, and Indl4 are
11 4
Reproduced with permission of the copyright owner. Further reproduction prohibited without permission.

good (significant) predictors of variation in Success, because the significance value (i.e.,
.000) is less than .05 (the test of significance cut off value).
The residual statistics, i.e., the minimum, maximum, mean, and standard deviation,
for the predicted, and the residual (i.e., the difference in the value that is observed, and
the one that is predicted), and the standardized values (those that have been normalized to
have a mean of 0 and a standard deviation of 1) are shown in Table 6.13.
Table 6.12: Research Question 1: ANOYA Table from Regression Analysis
ANOVtf
ModelSum of
Squares df Mean Square F Sig.1 Regression .454 1 .454 27.815 .000a
Residual 2.679 164 .016Total 3.133 165
2 Regression .672 2 .336 22.270 ,000bResidual 2.461 163 .015Total 3.133 165
3 Regression .833 3 .278 19.573 ,000cResidual 2.299 162 .014Total 3.133 165
4 Regression .969 4 .242 18.031 .000dResidual 2.164 161 .013Total 3.133 165
a- Predictors: (Constant), Ind 13
b- Predictors: (Constant), Ind 13, Ind 3
c- Predictors: (Constant), Ind 13, Ind 3, Ind 9
d- Predictors: (Constant), Ind 13, Ind 3, Ind 9, Ind 14
6- Dependent Variable: Log dependent
115
Reproduced with permission of the copyright owner. Further reproduction prohibited without permission.

Table 6.13: Research Question 1: Residuals Statistics from Regression Analysis
Minimum Maximum Mean Std. Deviation N
Predicted Value 1.2031 1.6049 1.4648 .07651 166
Std. Predicted Value -3.412 1.829 .001 .998 166
Standard Error of
Predicted Value.010 .042 .019 .006 166
Adjusted Predicted Value 1.1874 1.6058 1.4651 .07599 166
Residual -1.45311 .23446 -.00831 .15946 166
Std. Residual -12.535 2.023 -.072 1.376 166
Stud. Residual -12.369 2.089 -.072 1.381 166
Deleted Residual -1.45311 .25005 -.00860 .16279 166
Stud. Deleted Residual -12.369 2.111 -.074 1.386 166
Mahal. Distance .284 21.076 3.958 3.747 166
Cook's Distance .000 .426 .011 .039 166
Centered Leverage Value .002 .128 .024 .023 166
a Dependent Variable: Log (base e) dependent
Histogram
Dependent Variable: Log dependent
70 -
5 0 -
4 0 -O *
u- 3 0 -
20 -
10 -
-15 -10 -5 0R egression S tandardized Residual
Figure 6.1: Histogram Showing Frequency Versus Regression Standardized Residual
116
Reproduced with permission of the copyright owner. Further reproduction prohibited without permission.

Ideally, for a good regression model, the residuals should follow a normal
distribution. Figure 6.1 shows the histogram of the regression standardized residual,
which is the value of the difference between the observed value and that predicted by the
model for the dependent variable, Success. As the shape of the histogram in Figure 6.1
closely follows the shape of the normal curve, it is acceptable. Similarly, from Figure 6.2
we see that the P-P plotted residuals follow the 45-degree line. Thus we see that neither
the histogram nor the P-P plot indicates that the normality assumption in linear multiple
regression is violated. Figure 6.3 shows that the error variance is more or less constant.
Normal P-P Plot of Regression Standardized Residual
Dependent Variable: Log dependent
0 .8 -
nok.CL£ 0.6- 3o■oOo 0 .4 - 0) o. x
LU
0 .2 -
0.0 -
0.0 0.2 0.4 0.6 0.8 1.0
O bserved Cum Prob
Figure 6.2: Normal P-P Plot of Regression Standardized Residual
117
Reproduced with permission of the copyright owner. Further reproduction prohibited without permission.

Scatterplot
Dependent Variable: Log dependent
Oo
O CL
-4 -3 -2 -1 0 1 2
Regression Standardized Predicted Value
Figure 6.3: Check for error variance
In exactly similar manner, stepwise linear multiple regression was also run on the
data taking each of the five dependent variables, D l, D2, D3, D4, and D5 individually as
representatives of Success, instead of consolidating them all together to represent
Success, as was done thus far. The regression models that are obtained for each of D l,
D2, D3, D4, and D5 are presented in Table 6.14. The detailed results of regression are
omitted from here in the interest of maintaining the readability of this Chapter. The
detailed results are given in Section E.2 in Appendix E. They are obtained by exactly
following the steps mentioned in the previous discussions.
118
Reproduced with permission of the copyright owner. Further reproduction prohibited without permission.

Table 6.14: Regression Models for D l, D2, D3, D4, and D5
Predictors Regression Model
1 Indl3,Ind14 D l = 2.343 + .255 (Indl3) + .197 (Indl4)
2 Indl4, Ind9, Ind2 In (D2) = .626 + .098 (Indl4) + .048 (Ind9) + .052 (Ind2)
3 Ind3, Ind7 In (D3) = 1.232 + .036 (Ind3) + .038 (Ind7)
4 Ind3 D4 = 4.24 + .013 (Ind3)
5 Ind4, Ind7, Ind3 In (D5) = .722 + .079 (Ind4) + .052 (Ind7) + .033 (Ind3)
6.2.1.4 Success Factors Suggested by Respondents
The respondents were also requested to list up to five additional success factors. As it
was an optional question, some of the participants responded to it, while some did not. A
visual inspection of all the listed factors reveal the following high level categories to
which all the factors can be classified. The comments written against each of these high
level dimensions below are based on the synthesis of the responses from the survey
respondents. The raw forms of the responses, as written by the respondents, are listed in
Appendix D. However, I have synthesized them below by providing my own perspective
whenever required and deemed appropriate. It should be noted that many of the success
factor dimensions/categories that we have identified below overlap with those of the ones
that we had previously identified, but the individual factors within them are different.
Therefore, we list all the dimensions even if they were previously identified so that we do
not lose any data that we have obtained. However, it should be remembered that what is
important for us is the identification of the major dimensions of the success factors. The
list of factors contributing to any of the dimensions that we have identified could be large
119
Reproduced with permission of the copyright owner. Further reproduction prohibited without permission.

(not restricted to the ones we had in the questionnaire and the ones brought forward
through the open-ended questions).
Customer centric issues
Customer centric issues constitute important success factors. These were not only
revealed from our search of existing literature, but also from the open-ended responses
from the survey participants. Our open-ended survey responses reveal that they are
perhaps the most emphasized of all factors. In the words of one of the survey
respondents:
“Customer must participate effectively in process and be able to balance
business and technical goals. I f not, you are doomed to fail over and over... or at
minimum do Agile very badly”.
There should not only be continuous customer involvement and collaboration, but
there should also be an understanding of the process by the customer. There should be
strong buy-in from the customers. The customers (or even business area or product
owners) should not only be involved and committed but should also be competent and
authorized to make decisions. The involvement of the customers should be of different
forms including frequent visits and teleconferences. One of the respondents suggests
having non-colocated customers without any further elaboration.
In fact, the commitment should come not only from the customers but from the
business areas in the general sense. The commitment should be significant. The business
areas or the customers should participate in the prioritization of all development
activities. The customers should have no incentives that are contradictory to use of agile
approaches.120
Reproduced with permission of the copyright owner. Further reproduction prohibited without permission.

Some of the respondents suggested that customers should have trust on the developers
of the product. This trust should be from all respects particularly when it comes to adding
additional features for the betterment of the product being developed, without their
consent or without any restriction such as the initial contract or statement of work.
One of the respondents has also mentioned that the maturity of the clients is also very
important. In his/her words:
“Some just do not want to cooperate - they try to buy software like groceries".
One of the respondents also suggested without any further elaboration that having a
track record with the client is also a success factor.
Learning from failure
An important dimension suggested by a few respondents is that learning from failure is
an important success factor. It is important to note, analyze, and understand what failed
earlier and why, perform a root cause analysis of the core problems if something proves
to be problematic. All the problems should be analyzed and core problems should be
identified and analyzed in detail.
Training and learning
Mentoring, training, and learning are considered important success factors by many
respondents that were surveyed. One of the respondents even suggested having full time
Agile coach(es). One respondent suggested having external coaching services to be
important.
121
Reproduced with permission of the copyright owner. Further reproduction prohibited without permission.

Several respondents suggested programming in pairs. Pair programming has many
benefits which include discussing designs, understanding them better, and efficiently
sharing knowledge between different team members.
Competency
Competency in different forms has been identified as success factors by many
respondents. The individual capabilities of the team members, having skilled developers,
and craftmanship were suggested as being important success factors. The competency
should not only be from the technical side but should also be from the business side. The
competency factor is not only for the developers but should also be for the customers.
The customers should be technically sound.
The team members should be talented, smart, experienced with software development
practices in general and agile approaches in particular, familiar with the technical
platform, have sound domain and business knowledge, and should be capable of being
their own customers when required.
Personal characteristics
In addition to competency, personal characteristics such as having intellect, ability and
initiativeness to take up responsibility, having good principles, being passionate, not
being a perfectionist, being able to self-criticize, having respect for other individuals,
humility, having courage for bringing up the truth about the project fate, and willingness
to work together and program in pairs (said to be difficult among the experienced team
members) were suggested as important success factors.
122
Reproduced with permission of the copyright owner. Further reproduction prohibited without permission.

Communication
Communication as a success factor was suggested by many respondents in different
forms. It was suggested that there should be open and continuous feedback mechanism
between developers themselves, and between developers and customers. It was suggested
to set up communication rules, use information radiators such as wall charts and
postcards. Usage of simple communication tools such as Wiki was also suggested by a
respondent.
Timing issues
Timing issues such as time to delivery and time to market were suggested to be important
success factors. One of the respondents suggested that “Time Boxing is probably the
most important thing”. It is important to segment the time into short frames, scale down
the requirements to be very specific so that they can be delivered in short time frames.
One of the respondents mentioned that:
“We estimate task duration and have the customer choose tasks & priorities”.
Corporate culture and management issues
Different aspects related to corporate culture and management issues were suggested as
success factors. Of all one of the most emphasized factors is that there should be
management support from all levels in favor of agile practices. The management buy-in
and support especially from the highest level should be present. The management should
understand the principles and values behind the agile practices and should be supportive
of them and be committed. It was suggested that the level of maturity of the management
in the organizations in the field of agile development is important.
123
Reproduced with permission of the copyright owner. Further reproduction prohibited without permission.

The organization culture should be supportive of establishing an agile value system
instead of following a pre-defined set of practices advocated by the agile philosophy.
This requires that all members in the organization including the developers, management,
QA people and data owners should be agile. This in turn requires that ideally there should
be buy-in from most stakeholders.
The organization culture should be free from all politics, support adaptability to rapid
changes involved with agility, and all development should be driven by the business
necessities and not be driven by IT/IS/IM. The organization culture should have a firmly
established customer-vendor relationship.
Use of tools
Using good and appropriate tools is also suggested by many respondents to be a success
factor. Using agile specific project management tools such as Rally, using ProjectCards
for project organization, using tools that help in continuous integration and governance
were suggested. One respondent also suggest that properly using the tools is also an
important success factor.
Team characteristics
Characteristics of the team such as having a dynamic team that works in groups, works
towards a common goal, and is empowered to take decisions on their own are suggested
to be important success factors. Having matured members in the team is suggested as a
success factor. The team members should believe in the motivation behind the agile
practices, should be matured, capable of programming in pairs (pair programming),
should be adaptive (particularly for the test team because they are subject to continuous
124
Reproduced with permission of the copyright owner. Further reproduction prohibited without permission.

changes in test plans), and the development members should be familiar with the project
model. The importance of pair programming can be estimated by the fact that a number
of suggestions were received for it. One of the respondents has suggested that:
“Paired programming is a critical success factor in keeping the teams up to
speed on development issues, and cross training1’.
The stability of the team was considered to be important. Openness and honesty of
the team members about the project status was also considered to be an important success
factor. In the words of one of the respondents:
“Open and honest about the project status ...good or bad to recognize
problems earlier”.
Planning
The suggested success factors centering on planning include performing efficient
estimations, and maintaining their integrity. One of the respondents also suggested
maintaining “lightweight written plans (like bumdown charts)”. Interestingly, the
suggestions from these respondents are not completely against maintaining any plans but
for maintaining some plans that are not heavily weighed with strong processes.
Control
Some of the suggested success factors are centered on project control. Most of the
suggested factors support a qualitative control mechanism. They are listed below:
• Having w eekly showcases to show progress to customer
• Disciplined yet light documentation
• Daily Standup
125
Reproduced with permission of the copyright owner. Further reproduction prohibited without permission.

One of the respondents suggested that the progress should be visible to everyone
including the customer. However, this respondent suggests “completed story points per
iteration” (a quantitative measure) to measure progress.
Other factors
Some of the other suggested success factors that are not classified to belong to any of the
above mentioned categories include:
• Having full-time team members on the project.
• Staff changes through attrition or reorganizing
• Criticality of the software - what is at stake?
• Disciplined yet light processes
• Quantitative demonstration of benefits of agile (DSDM) - independent
metrics case study
• Not working on systems with closed list of modules
• Full time iteration manager (internally-facing project manager)
• Business priorities change, conflicts between availability of business
versus IT technical staff
• Dynamism of the project - how many changes in requirements per month
Close inspection of all the suggested factors (dimensions) mentioned in the above
categories shows that most o f the dimensions were already considered in the study as part
of the closed-ended questions. Of course, even though most of these high level
dimensions overlap with the ones that we considered already, they suggest different new
126
Reproduced with permission of the copyright owner. Further reproduction prohibited without permission.

aspects for measuring those dimensions. These serve as valuable resources for future
researchers and practitioners because many of them cannot be found in existing pieces of
literature. They are obtained here from the first hand experience of practitioners working
on agile software development projects.
It should be noted that the list of success factors already considered as part of the
closed-ended questions were prepared based on literature review and review of a plenty
of experience reports. Therefore, it is not surprising that most of the important
dimensions of success factors were already captured. The different questions that we had
already considered to be measuring the high level dimension were revealed from existing
literature.
The new dimensions, in addition to those that were already considered, that are
revealed from the open-ended questions responses are learning from failure, timing
issues, use of tools, and other team characteristics. It should be noted that some aspects of
team characteristics such as the team size and team distribution were already considered
in the hypothesized theoretical framework. Other team characteristics are also revealed
through the responses to the open-ended questions which were not revealed by our
success factors literature survey. Similarly, the decision time aspect of timing issues were
already considered in the theoretical framework.
Technical factors
In addition to the above, many of the factors that were suggested could be classified as
technical factors. Although, in this study, we focused only on organizational and people
127
Reproduced with permission of the copyright owner. Further reproduction prohibited without permission.

factors, we thought of listing them below without any further elaboration, and not losing
the valuable technical factor suggestions that are obtained from the survey:
• Integrating code constantly.
• Test Driven Development
• Type of Application Deliverable (In-House IT project vs Shrink Wrap
Software)
• Goal-driven functionality and User Interface design
• Technical support environment
• Automated Testing: allows for shared code ownership (developers can
feel free to make changes, having unit/functional/integration tests as
safeguards)
• Getting the team test infected using xUnit and some kind of mocking
tool
• Writing unit tests before writing code
• Refactoring the code often
• Mocks are important, if you can't mock, you can't unit test
• User Interface should develop along with the software
• Design architecture stable
• (Known) architecture
6.2.1.5 Discussions
We have seen that solely from the analysis of the quantitative data obtained, nine factors
emerge to have statistically significant relationship with Success, whereas five do not.
128
Reproduced with permission of the copyright owner. Further reproduction prohibited without permission.

The ones that emerge to be so are customer satisfaction, customer collaboration, customer
commitment, decision time, corporate culture, personal characteristics, societal culture,
and training and learning. Among the ones that did not show significant relationship are
team distribution, team size, planning, technical competency, and communication and
negotiation. As we will see in Chapter 7, based on the citations from the existing pieces
of literature in this area, and the results obtained from the analysis of the qualitative
responses obtained through the open-ended questions, all the nine factors that show
statistically significant relationship with Success are strongly justifiable. Further
statements of support from the literature, in addition to the ones already given in Chapter
4, are given in an attempt to further establish the results. However, after analyzing the
results obtained corresponding to the other five factors that did not emerge as significant
success factors, using logical justification, using support from the previously published
literature, and using the responses obtained through the open-ended questions, we feel
that there are in-depth studies that should be performed to establish or reject the observed
results through this study.
Finally, as we have seen, multiple regression modeling reveals that out of all the
factors, only four emerge to be the best predictors of Success. These four predictors are:
customer commitment, control, societal culture, and training and learning. Since we were
not able to find any literature support comparing the different potential success factors we
considered, let us intuitively examine the sensibility of this observation, although
attempting such an intuitive reasoning is difficult. Logically, if customers remain
committed in a project, they will closely collaborate, and are likely to be satisfied.
Having customer adequately committed to a project (particularly if they are collocated129
Reproduced with permission of the copyright owner. Further reproduction prohibited without permission.

with the rest of the development team) will also make sure that there will be lots of
internalized, informal planning between the development teams and the customers,
thereby relieving the customers or the development team to depend on formal
documented plans. In other words, having customers committed to a project is very
important. The other predictor revealed from regression modeling is the societal culture.
From one perspective, corporate culture is strongly influenced by the societal culture. For
example, it is unlikely that in an oppressive societal culture, the culture of an organization
operating in that society will be non-bureaucratic, the management will be supportive of
the decisions of the developers, and so on. Of course, having the right corporate culture
does not necessarily mean that there are “right type” of people in the society. But societal
culture does have a strong influence on the corporate culture. Also, the personal
characteristics of people, their communication and negotiation mechanisms, and their
other non-technical competencies are strongly influenced by the societal culture. Training
and Learning are also perhaps very important. If there is a suitable training and learning
mechanism, the technical competencies of the employees will strongly be governed by it.
This is particularly true for those who are in the low experience groups. Control is
another predictor that we have obtained. If there are efficient qualitative control
mechanisms in a project, the decision time would also be reduced, and there is likely to
be informal planning processes. It should also be observed that there is no significant
logical overlap between the four predictors of Success that we have obtained, indicating
that these four predictors are an absolute minimum set of predictors that would help in
predicting success in a project. We also expected team factors such as team size and team
distribution to show up in the list of predictors. However, the reason they are not in the
130
Reproduced with permission of the copyright owner. Further reproduction prohibited without permission.

list of predictors that we have obtained could be attributed to the fact that there are
varying opinions regarding these issues as to whether or not they are important as
determinants of success. We will examine such issues in considerable detail in Chapter 7.
Further detailed discussions justifying the results obtained from the data analysis for
this research question can be found in Chapter 7. In the interest of not being repetitive in
our discussions regarding these, we do not address them any further in this Chapter.
6.2.2 Research Question 2
We recall that in Research Question 2 our goal is to determine the critical changes that
are required for adopting agile software development practices in projects practicing
traditional life-cycle-based software development and rank the changes according to their
level of importance. The data analysis for these studies was performed using two
datasheets showing separate lists of changes required corresponding to which every
survey respondent had ranked his/her judgment of the level of importance of each of the
change items on a 5-point Likert scale. The results of the statistical analyses are
summarized below.
It should be noted that, similar to as mentioned in Section 6.2.1, many of the change
dimensions/categories that we have identified below overlap with those of the ones that
we had previously identified, but the individual change items within them are different.
Therefore, we list all the change dimensions even if they were previously identified so
that we do not lose any data that we have obtained. However, it should be remembered
that what is important for us is the identification of the major dimensions of change. The
list of individual change items contributing to any of the dimensions that we have
131
Reproduced with permission of the copyright owner. Further reproduction prohibited without permission.

identified could be large and not restricted to the ones we had in the questionnaire and the
ones brought forward through the open-ended questions.
6.2.2.1 Descriptive Statistics
As we did for Research Question 1, for Research Question 2 as well we first performed
descriptive statistics to gain an understanding of the overall distribution of the survey
responses. We determined the various statistics such as mean and standard deviation
corresponding to each change. The means obtained from this step are then used to come
up with the desired rankings later on.
Table 6.15 shows the means and standard deviations corresponding to the data obtained
from the respondents for each of the different change item variables. It shows that, on an
average, the respondents felt that the majority of the change items are in the range
(“Somewhat Important”, “Very Important”), whereas a few are in the range (“Neutral”,
“Somewhat Important”), although in the later case the values are close to “Somewhat
Important”.
In addition to the means and standard deviations corresponding to each of the change
item variables presented in Table 6.15, Section E.3.1 in Appendix E, we also computed
the 95% confidence interval, median, variance, minimum value, maximum value,
skewness and kurtosis. The data in each case follows close to normal distribution.
Although there is slight skewness or kurtosis detected for some of the variables, they are
not significantly large.
132
Reproduced with permission of the copyright owner. Further reproduction prohibited without permission.

Table 6.15: Research Question 2: Summarized Descriptive Statistical Results
Variables N MeanStd.
DeviationCl 165 4.19 0.90
C l.l 165 4.04 1.32C1.2 165 4.25 1.08C l.3 165 4.56 0.93C1.4 165 3.74 1.38C l.5 165 4.38 1.13C2 165 4.35 1.01
C2.1 165 4.46 1.11C2.2 164 4.23 1.11C3 165 3.86 1.18C4 165 4.19 0.93
C4.1 165 4.61 1.02C4.2 164 3.64 1.36C4.3 165 4.12 1.31C4.4 165 4.39 1.05
The consolidated distribution of the responses (in percentage figures) obtained from
all the respondents for the different change items is captured in Section F.2 of Appendix
F. Amongst all the change items, C4.1 (i.e., from heavily process centric to short,
iterative, test-driven, and people centric development) was considered by the largest
percentage (amongst all the percentage figures displayed in the table) of respondents
(roughly 77%) to be very important.
6.2.2.2 Test of Internal Consistency Reliability
As part of Research Question 2 as well, we try to understand the internal consistency of
the change items. Table 6.16 shows the reliability statistics using the four consolidated
change items C l, C2, C3, and C4, and Table 6.17 shows the inter-item correlations
corresponding to all possible pairs formed by C l, C2, C3, and C4. It can be seen that the
133
Reproduced with permission of the copyright owner. Further reproduction prohibited without permission.

value of Cronbach’s alpha is .822, which implies that there is 82.2% of internal
consistency, whereas 17.8% inconsistency in test scores. Also, since the value of
Cronbach’s alpha is well above the acceptable cut of limit of .6 and the adequate cut of
limit of .7, there is significant internal consistency between the test items.
The reliability statistics and the correlations between items constituting to form the
higher level change variables C l, C2, and C430 are presented in Section E.3.3 of
Appendix E. The value of Cronbach’s alpha for items within Cl is .819, that
corresponding to the items within C2 is .799 and that corresponding to the items within
C4 is .786. All of these values of Cronbach’s alpha are well above the adequacy cut off
limit of .7.
Table 6.16: Research Question 2: Reliability Statistics
Cronbach'sAlpha
Cronbach's Alpha Based
onStandardized
Items N of Items.822 .833 4
Table 6.17: Research Question 2: Inter-Item Correlation Matrix
C1 C2 C3 C4C1 1.000 .661 .487 .692C2 .661 1.000 .457 .521C3 .487 .457 1.000 .509C4 .692 .521 .509 1.000
30 It should be noted that C3 is measured with only a single item.
Reproduced with permission of the copyright owner. Further reproduction prohibited without permission.

6.2.2.3 t-test
We performed one sample t-test to determine if the means of each of the variables C l,
C2, C3, C4 and each of the variables constituting them significantly differed from the
specified constant “3” (Neutral), which is the mid-point of the 5-point Likert scale. Table
6.18 shows the results of the one sample t-test for C l, C2, C3, and C4. As we can see, the
significance value in each of these cases is .000, which is less than .05 (the significance
level we have used for all the studies in this Thesis.) This indicates that the observed
means are significantly different from Neutral. In fact, the mean difference corresponding
to each of these change variables shows that the difference is significantly greater than
the test value. The significant difference between the observed mean and the test value is
also substantiated by the fact that the 95% confidence interval (range) corresponding to
each of these change items does not contain the value, 0.
In addition to Table 6.18, the one sample t-test results for each of the variables
constituting the higher level variables C l, C2, and C4 are also presented in Section E.3.2
in Appendix E. The one sample t-test results for all cases shows that the observed means
for each of those variables constituting the higher level variable C l, C2, and C4 are
significantly greater than the test value, 3.
135
Reproduced with permission of the copyright owner. Further reproduction prohibited without permission.

Table 6.18: Research Question 2: One-Sample t-Test
Test Value = 395% Confidence Interval
of the Difference
t df Sig. (2-tailed)Mean
Difference Lower UpperC1 17.073 164 .000 1.19273 1.0548 1.3307C2 17.060 164 .000 1.34545 1.1897 1.5012C3 9.380 164 .000 .86061 .6794 1.0418C4 16.447 164 .000 1.19192 1.0488 1.3350
6.2.2.4 Ranking
For determining the importance of the change items and ranking them, we use the means
of all the responses from all the respondents for each change item presented in Table 6.15
earlier. Based on all the mean scores from all the change items, we rank them in the order
of their importance. We note that all the variables pass the one sided t-test, as explained
in the previous section. Table 6.19 presents the ranking of only the consolidated change
items C l, C2, C3, and C4. C l and C4 have similar mean values but Cl has slightly less
standard deviation value compared to C4. Therefore Cl was ranked slightly higher than
C4. All the individual change items that constitute the composite change variables Cl,
C2, C3, and C4 are also ranked separately. Their results are presented in Table 6.20.
Although one sample t-test provides us an estimate of whether the change item means
are significantly greater than the fixed test value 3 (corresponding to Neutral of the
scale), it does not provide us any information about whether the means of two
successively occurring change items in the ranked list of items shown in Tables 6.19 and
6.20 are significantly different from each other. To test this, we performed pair-wise t-
test, the results of which are provided in Appendix E, Tables E.30 and E.31. In Table
136
Reproduced with permission of the copyright owner. Further reproduction prohibited without permission.

E.30, the pairs considered were C1-C2, C1-C4, and C3-C4. From this table, we observe
that the mean of C2 is significantly different from that of C l, the mean of C3 is
significantly different from C4, whereas the mean of C4 is not significantly different
from Cl. Similarly, from Table E.31, except the pair C1.2-C1.5, the means of all the
other successively occurring pairs in the ranked list were found to have a significant
difference. Therefore, we can conclude that although purely on the basis of the means of
the change variables, we have ranked C l.5 higher than C l.2, there is not statistically
significant difference in their means.
Table 6.19: Research Question 2: Ranking of the Consolidated Change Item Categories
Rank Variables N MeanStd.
Deviation1 C2 165 4.35 1.012 Cl 165 4.19 0.903 C4 165 4.19 0.934 C3 165 3.86 1.18
Based on the results from this study, we observe that the respondents opined that the
Changes in Management Style are the most important (critical) changes required
followed by Changes in Organization Culture, Changes in Development Processes, and
Changes in Knowledge Management Strategies. Changes in Organization Culture and
Changes in Development Processes have similar level of importance according to the
survey results.
137
Reproduced with permission of the copyright owner. Further reproduction prohibited without permission.

Table 6.20: Research Question 2: Ranking of all the Individual Change Items in Each Change Category
Rank Variables N MeanStd.
DeviationCl
1 C l.3 165 4.56 0.932 C1.5 165 4.38 1.133 C1.2 165 4.25 1.084 C l.l 165 4.04 1.325 C1.4 165 3.74 1.38
C21 C2.1 165 4.46 1.112 C2.2 164 4.23 1.11
C31 C3 165 3.86 1.18
C41 C4.1 165 4.61 1.022 C4.4 165 4.39 1.053 C4.3 165 4.12 1.314 C4.2 164 3.64 1.36
Within each of the above change item categories, the following is the ranking of the
individual change items:
Changes in Management Style
• Rank 1: From command-and-control management to leadership-and-collaboration.
• Rank 2: From authoritative to collaborative and pluralistic decision making.
Changes in Organization Culture
• Rank 1: From solitary development attitudes o f team members to that o f working in
teams.
• Rank 2: From non-customer-centric to customer-centric development.
138
Reproduced with permission of the copyright owner. Further reproduction prohibited without permission.

• Rank 3: From individually assigned roles to that of team-work. (Note: Based on the
discussions above, although this change item have been ranked below the
immediately preceding one (with Rank 2 above) purely on the basis of their
respective means, there is no statistically significant difference of their means, as
indicated by pairwise t-test).
• Rank 4: From policy and procedure based development culture to freedom of
development and management by team members.
• Rank 5: From non-customer-centric to customer-centric development.
Changes in Development Processes
• Rank 1: From heavily process-centric to short, iterative, test-driven, and people-
centric development.
• Rank 2: From lifecycle-based development to feature-driven evolutionary and
iterative development.
• Rank 3: From contract-compliant to change-tolerant development.
• Rank 4: From standards compliance and measurement driven development to
development under uncertainty.
6.2.2.5 Changes Suggested by Respondents
The respondents were also requested to list up to five additional changes they believe are
required for adopting agile software development practices in organizations practicing
traditional, plan-driven methodologies. Their detailed responses, as written by the
139
Reproduced with permission of the copyright owner. Further reproduction prohibited without permission.
respondents, are listed in Appendix D. However, as in the success factors survey, the
changes below are synthesized from my own perspective based on the raw responses
from the survey respondents. Being an optional question, some of the participants
responded to the open-ended questions, while some did not. Close inspection of all the
suggested changes reveals the following interesting dimensions of change.
Changes in organization culture
It was suggested that for agile software development there should be changes in
organization culture that is supportive of continuous communication, knowledge sharing,
increasing the culture of trust that is generally absent in many organizations, making the
business sponsors responsible for prioritization of tasks, and planning of the releases,
increasing the level of honesty and openness in communication in the organizations,
having a suitable development team environment, involvement of all members in team
activities, and increasing the culture of being adaptive rather than being predictive. It was
also suggested that there should be “a right to errors culture”, meaning that the
organization culture should be such that errors can happen and the developers should not
be penalized for the same.
Changes in management style
The changes in management style for agile approaches include having management
permissive of making changes, having the openness in management activities, trusting
their developers, shifting away from large-scale scope management to continuous (micro)
scope management (without micromanaging the activities of the developers), risk and
uncertainty acceptance by the management, having transparent radiators of project status
140
Reproduced with permission of the copyright owner. Further reproduction prohibited without permission.

and information, being honest while communicating about the progress of the project,
and having non-dictating or non micromanaging management. According to the view of
one of the respondents:
“Drive to Agile has to come from within the team - allow team to control not
managers dictating method’’
It was suggested that in agile practices the business analysts should be engaged from
the early stages by the management. One of the respondents also cautioned that (since
the agile approaches part away from quantitative measures of control) it can be disastrous
for the project if there is a significantly diminished level of focus on progress
measurement.
Changes in knowledge management strategies
Traditionally in heavy process-centric organizations there is a high emphasis on
documentation as a medium for knowledge management. However, the agile practices
tend to part away from heavy documentation centric development approach and
emphasize more on “show working software” type development approach. As aptly put
by forward by one of the respondents:
“One o f the ability to reject structured documentation, such as a survey
instrument, when it doesn’t help my client”.
Changes in development processes
The following changes in development processes favoring agile software development
were suggested. The development processes in agile require a shared team room for pair
programming and continuous interactions, performing continuous integration and mocks,
141
Reproduced with permission of the copyright owner. Further reproduction prohibited without permission.

performing test driven development (in which the test plans dictate further development
activities), having tools that enable the kind of collaboration required in agile practices,
reducing the scope of the projects, performing lots of prototyping, performing continuous
builds in small steps and performing weekly releases, performing functional testing along
with coding, and having the customers and other stakeholders to provide continuous
feedback. It was also suggested that the development processes in agile software
development methodologies require the architects to work alongside the programmers.
Changes in personal characteristics
Different suggestions for changing the personal characteristics of the team members were
also received. It was suggested that individual team members should be self-motivated to
make continuous changes as and when required, they should be knowledgeable about the
business, they should be courageous, should develop the habit of collectively owning the
solutions, they should earn the trust of the customers and other stakeholders, and they
should have high degrees of tenacity. It was also suggested by a respondent that the
technical folks in the teams should have sales skills. However, the reason for that is not
apparent, but it is worth capturing.
Changes in customer attitude
It was suggested by a few respondents that adopting agile practices require changes in
attitudes and behaviors of customers such as trusting the development team members and
their willingness to negotiate when required (of course, the willingness to negotiate is
also expected of the development team members). It was also suggested that the unlike in
traditional plan-driven development, in agile development culture, the programmers
142
Reproduced with permission of the copyright owner. Further reproduction prohibited without permission.

should not be required to provide justification of each task they perform. It should be
sufficient if they deliver the required working software.
Changes in the knowledge and education
All stakeholders (particularly the upper management) should be educated about the
principles and values guiding the agile practices. The same holds for the development
team members. They should in fact be knowledgeable about how to perform development
using the agile methodologies. In the words of one of the survey respondents:
“If one person does not have the knowledge about agile development and is
unwilling to learn, he can be a real stopper for the project, (management
included)”.
The above discussions show that most of the change categories were considered
earlier. However, many new individual change items measuring the high level change
categories are discussed. It should be noted that the list of changes already considered as
part of the closed-ended questions have been prepared based on literature review and
review of a plenty of experience reports. Therefore, it is not surprising that most of the
important dimensions of change are already considered.
6.2.2.6 Discussions
We have seen that solely from the analysis of the quantitative data obtained, all the
change dimensions that we considered show statistically significant results. The most
important of all change dimensions is the changes in the management style. Changes in
management style are followed by the changes in organization culture, changes in
143
Reproduced with permission of the copyright owner. Further reproduction prohibited without permission.
development processes, and changes in knowledge management strategies, in decreasing
order of their importance. In the absence of the availability of any previous literature that
ranks or prioritizes the different change items, we were not able to validate the results
that we have obtained with the findings from the literature. However, in Chapter 7, we
use qualitative logical reasoning and citations from the literature to support the
reasonings/justifications we make in favor or against the observations we make. Further
statements of support from the literature, in addition to the ones already given in Chapter
4, are given in an attempt to establish the results.
As we will see in Chapter 7, in the absence of any particular literature justifying our
ranking results, based on the discussions from the existing pieces of literature in this area,
and the results obtained from the analysis of the qualitative responses obtained through
the open-ended questions, we find that all the four change categories are appropriately
justifiable.
Further detailed discussions attempting to justify the results obtained from the data
analysis for this research question can be found in Chapter 7. In the interest of not being
repetitive in our discussions regarding these, we do not address them any further in this
Chapter.
6.2.3 Research Question 3
Having ranked all the change items according to their levels of important, we proceed in
Research Question 3 to rank all the challenges using the same strategies. Our intention is
to determine the critical challenges that are involved in adopting agile software
development practices in projects practicing traditional life-cycle-based software
144
Reproduced with permission of the copyright owner. Further reproduction prohibited without permission.

development. We want to arrive at a ranked list of challenges according to the level of
importance (in the 1 to 5 point Likert scale) judged by the respondents that participated in
the survey. The results of the statistical analyses are summarized below.
6.2.3.1 Descriptive Statistics
As we did for Research Questions 1 and 2, for Research Question 3 as well, performing
descriptive statistics first was necessary to gain an understanding of the overall
distribution of the data that we have. We determined the various statistics such as mean
and standard deviation corresponding to each challenge item. In the same way as we did
for change items, the mean values for each of those challenge items are then used to
come up with the desired rankings later on, keeping in mind the results of significance of
the t-tests.
Table 6.21 shows the mean values, the standard deviations, and the standard errors
corresponding to each of the challenge variables.
Like before, in addition to these statistics of the challenge items, Section E.4 in
Appendix E lists the 95% confidence interval values, the medians, variances, minimum
values, maximum values, skewnesses and kurtosis of all the variables. We observe that
corresponding to almost all of these variables the median value is close to the mean
value, implying a close to normal distribution in each case.
145
Reproduced with permission of the copyright owner. Further reproduction prohibited without permission.
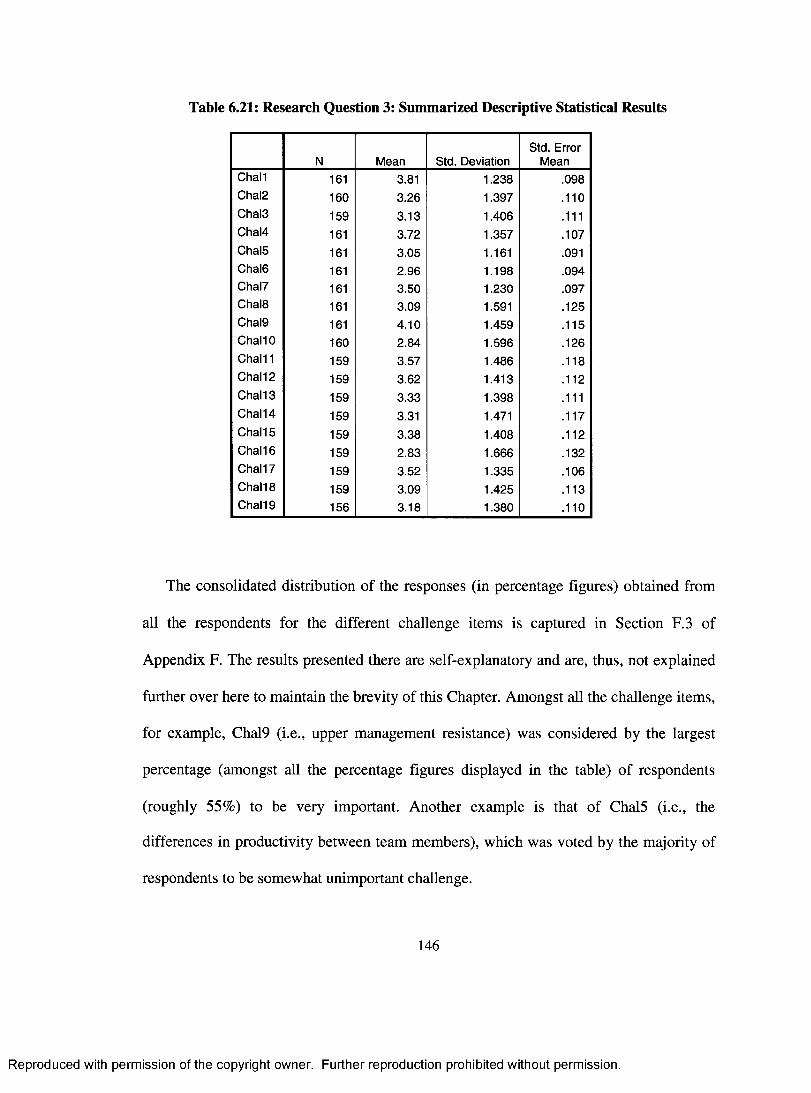
Table 6.21: Research Question 3: Summarized Descriptive Statistical Results
N Mean Std. DeviationStd. Error
MeanChaM 161 3.81 1.238 .098Chal2 160 3.26 1.397 .110Chal3 159 3.13 1.406 .111Chal4 161 3.72 1.357 .107Chal5 161 3.05 1.161 .091Chal6 161 2.96 1.198 .094Chal7 161 3.50 1.230 .097Chal8 161 3.09 1.591 .125Chal9 161 4.10 1.459 .115ChaMO 160 2.84 1.596 .126Chal11 159 3.57 1.486 .118ChaM 2 159 3.62 1.413 .112ChaM 3 159 3.33 1.398 .111Chall 4 159 3.31 1.471 .117Chall 5 159 3.38 1.408 .112Chall 6 159 2.83 1.666 .132Chall 7 159 3.52 1.335 .106Chall 8 159 3.09 1.425 .113Chall 9 156 3.18 1.380 .110
The consolidated distribution of the responses (in percentage figures) obtained from
all the respondents for the different challenge items is captured in Section F.3 of
Appendix F. The results presented there are self-explanatory and are, thus, not explained
further over here to maintain the brevity of this Chapter. Amongst all the challenge items,
for example, Chal9 (i.e., upper management resistance) was considered by the largest
percentage (amongst all the percentage figures displayed in the table) of respondents
(roughly 55%) to be very important. Another example is that of Chal5 (i.e., the
differences in productivity between team members), which was voted by the majority of
respondents to be somewhat unimportant challenge.
146
Reproduced with permission of the copyright owner. Further reproduction prohibited without permission.

6.2.3.2 Test of Internal Consistency Reliability
Table 6.22 and Table 6.23 shows the results of the test of internal consistency reliability
involving all the 19 challenge items. The Cronbach’s alpha value is .911, implying that
there is 91.1% internal consistency, and the remainder 8.9% of inconsistency. As the
Cronbach’s alpha value is significantly greater than the adequate cut-off value .7, there is
high degree of internal consistency between the test items.
Table 6.22: Research Question 3: Reliability Statistics
Cronbach'sAlpha
Cronbach's Alpha Based on Standardized Items N of Items
.911 .911 19
Table 6.23: Research Question 3: Summary Item Statistics
Mean Minimum Maximum RangeMaximum / Minimum Variance N of Items
Item Means 3.336 2.833 4.090 1.256 1.443 .113 19Inter-Item Correlations .351 .075 .671 .596 8.901 .009 19
For the Independent variable, Cronbach's alpha is 0.911. This means that the test is
91% Reliable and 9% Unreliable. The inter-item correlations are shown in Section E.4.2
in Appendix E.
6.2.3.3 t-test
As we did for Research Question 2, we also performed one sample t-test to determine if
the means of each of the variables Chall, Chal2, Chal3, ChaM, Chal5, Chal6, Chal7,
Chal8, Chal9, ChallO, Chall 1, Chall2, Chall3, Chall4, Chall5, Chall6, Chall7,
147
Reproduced with permission of the copyright owner. Further reproduction prohibited without permission.

Chall8, and Chall9 significantly differs from the specified constant “3” (Neutral)
corresponding to the mid-point of the 5-point Likert scale. Table 6.24 displays the results
of the one sample t-test for each of the above mentioned variables.
As we can see, the significance value corresponding to each of the 11 variables
Chall, Chal2, ChaM, Chal7, Chal9, Chall 1, Chall2, Chall3, Chall4, Chall5, and Chall7
is .000, which is less than .05 (the significance level cut-off). Therefore, the observed
means for these 11 variables are significantly different from Neutral.
It should also be observed that the 95% confidence interval corresponding to each of
these challenges does not contain the value, 0. On the other hand, the variables Chal3,
Chal5, Chal6, Chal8, ChallO, Chall6, Chall8, and Chall9 have significance values
greater than .05, and the 19% confidence interval corresponding to each of them includes
the value, 0. So the difference between the sample mean and the test value is not
significant.
6.2.3.4 Ranking
We consider the mean values listed in Table 6.21 for determining the importance of the
challenge items and ranking them. Based on all the mean scores from all the challenge
items, and considering only the variables that pass the one-sample t-test, we rank them in
the order of their importance. The ranking of these variables according to the decreasing
order of their importance is presented in Table 6.25.
148
Reproduced with permission of the copyright owner. Further reproduction prohibited without permission.

Table 6.24: Research Question 3: One-Sample t-Test
Test Value = 395% Confidence Interval
of the Difference
t df Sig. (2-tailed)Mean
Difference Lower UpperChaM 8.279 160 .000 .807 .61 1.00Chal2 2.320 159 .022 .256 .04 .47Chal3 1.185 158 .238 .132 -.09 .35Chal4 6.739 160 .000 .720 .51 .93Chal5 .543 160 .588 .050 -.13 .23Chal6 -.395 160 .694 -.037 -.22 .15Chal7 5.188 160 .000 .503 .31 .69Chal8 .694 160 .489 .087 -.16 .33Chal9 9.564 160 .000 1.099 .87 1.33ChaMO -1.238 159 .217 -.156 -.41 .09Chal11 4.856 158 .000 .572 .34 .81ChaM 2 5.499 158 .000 .616 .39 .84ChaM 3 2.949 158 .004 .327 .11 .55ChaM 4 2.642 158 .009 .308 .08 .54ChaM 5 3.379 158 .001 .377 .16 .60ChaM 6 -1.285 158 .201 -.170 -.43 .09ChaM 7 4.870 158 .000 .516 .31 .72ChaM 8 .779 158 .437 .088 -.14 .31ChaM 9 1.625 155 .106 .179 -.04 .40
As done in Section 6.2.2.4 for ranking the change items, we also performed pair-wise
t-test to determine whether the means of the successively occurring pairs of challenge
items are significantly different from each other. We did that only for the items that
passed the one sample t-test (as shown in boldface in Table 6.25). The results of the pair
wise t-test of the successively occurring boldfaced challenge items in Table 6.25 show
that except the pair Chall-Chal9, all the other pairs of challenge items do not have a
statistically significant difference of their means. Therefore, although we have ranked the
challenge items in the order as shown in Table 6.25 purely on the basis of their mean
values, we should note that there is no statistical significance of the ordering of these
149
Reproduced with permission of the copyright owner. Further reproduction prohibited without permission.

challenges. In other words, although we can infer that out of the 19 challenges, 11 of
them are statistically significant, we cannot really rank them in a statistically significant
order. This statement excepts the Chall-Chal9 pair. In other words, upper management
resistance was found to be statistically significantly greater than the resistance from
developers.
Table 6.25: Research Question 3: Ranking of the Challenges
Rank Variables N MeanStd.
Deviation1 Chal9 161 4.10 1.46
2 Chall 161 3.81 1.24
3 Chal4 161 3.72 1.36
4 Chall2 159 3.62 1.41
5 C halll 161 3.57 1.49
6 Chall7 161 3.52 1.34
7 Chal7 161 3.50 1.23
8 Chall5 161 3.38 1.41
9 ChaI13 159 3.33 1.40
10 Chall4 161 3.31 1.47
11 Chal2 160 3.26 1.40
12 Chall 9 156 3.18 1.38
13 Chal3 159 3.13 1.41
14 Chall 8 159 3.09 1.42
15 Chal8 161 3.09 1.59
16 Chal5 161 3.05 1.16
17 Chal6 161 2.96 1.20
18 ChallO 161 2.84 1.60
19 Chall 6 161 2.83 1.67
Reproduced with permission of the copyright owner. Further reproduction prohibited without permission.

All the significant challenges (that have passed the one-sample t-test) are highlighted
in Table 6.25 from most important to least important. They are stated below31:
• Rankl: Upper management resistance due to factors such as lack of development
under contract, and well-defined project charters, project plans and Gantt Charts
in agile development.
• Rank2: Resistance from developers to transform from traditional heavyweight
process centric development.
• Rank 3: Problems with development teams that are geographically distributed
and not colocated in agile development.
• Rank 4: Development process conflicts due to the differences in lifecycle
between agile methodologies (which are characterized by test driven design,
short, and focused iterations of development), and traditional methodologies
(which have heavyweight processes and long iterations).
• Rank 5: Challenges of the agile teams in integrating the development processes
and subsystems with teams within the same organization practicing traditional
development methodologies.
• Rank 6: Differences in attitudes towards project success between the
management practicing traditional and agile methodologies.
31 It should be noted that although we have provided the ranks o f these challenge items purely on the basis of their mean values, they do not have statistical difference in their means. This statement excepts the items in Ranks 1 and 2 in the list.
151
Reproduced with permission of the copyright owner. Further reproduction prohibited without permission.

• Rank 7: Overzealousness (excessive enthusiasm) in team members due to
perceptions of agility and fast decision making, leading to decision making
without much forethought in agile development.
• Rank 8: Differences in performance management approaches in traditional
methodologies (which are more contract and milestone driven), and agile
methodologies (which are based on incorporating continuous customer feedback
into the development lifecycle.)
• Rank 9: Adopting agile methodologies for use in legacy systems, which are more
resistant to changes in internal source code.
• Rank 10: Differences in development processes between agile methodologies
(which are more informal requirements driven), and traditional methodologies
(which are more formal requirements driven).
• Rank 11: Developer perceptions of micromanagement due to close and frequent
interaction with management in agile development.
6.2.3.5 Challenges Suggested by Respondents
As in the success factors survey and the changes survey, the respondents were also
requested to list up to five additional challenges they believe are important challenges
that would be faced while adopting agile software development practices in organizations
practicing traditional, plan-driven methodologies. Their detailed responses, as written by
the respondents, are listed in Appendix D. However, as before, the challenges below are
152
Reproduced with permission of the copyright owner. Further reproduction prohibited without permission.

synthesized below by giving my own perspective. As in the previous two surveys, being
an optional question, some of the participants responded to it, while some did not.
It should be noted that, as mentioned for the case of success factors or changes, many
of the challenge dimensions/categories that we have identified below overlap with those
of the ones that we had previously identified, but the individual challenge items within
them are different. Therefore, we list all the dimensions even if they were previously
identified so that we do not lose any data that we have obtained. However, it should be
remembered that what is important for us is the identification of the major dimensions of
the challenges. The list of individual challenge items contributing to any of the
dimensions that we have identified could be large, and may not restrict to the ones we
had in the questionnaire and the ones brought forward through the open-ended questions.
Resistance from team members
One of the most important challenges suggested by different respondents is the resistance
from the team members fearing change. The adoption of agile practices can be treated as
a threat by the different developers. This is particularly true for those who are less
adaptive to change. It is required by the developers to work with the testers in test driven
development which is the common approach taken in agile methodologies. This can
prove to be resistive by both the developers and the testers.
Management resistance
Resistance can arise from middle level management as well. Managers used with
traditional development approaches are used with fixed scope and budget and are less
153
Reproduced with permission of the copyright owner. Further reproduction prohibited without permission.

adaptive to change. It is also suggested that it can also be challenging for having a good
and flexible project manager.
Customer involvement
It is suggested by some of the respondents that keeping the customers frequently engaged
as opposed to their involvement after a long duration (after a few months or after a
release) can be challenging. It is also challenging to obtain the buy-in of the customers
for agile practices.
Differences in management attitude towards success
Managers often look for demonstration of success in the form of the budget expended,
time spent, and the returns obtained. Managers used with traditional software
development approaches often perceive agile practices as ‘something "new" and needs to
be "tried out" first’.
Doing away with documentation
It is suggested by some of the respondents that people tend to feel secure with having a
good set of documentations. Less emphasis on documentations or a lack of it can make
people insecure.
Decrease in productivity during transition
Some people feel there is an added responsibility associated with agile methodologies.
They feel that the productivity can decrease due to this. This can be challenging.
Differences in development processes
Differences in requirements management processes is suggested to be challenging. It is
also suggested that it is challenging to have developers accept test driven development.
154
Reproduced with permission of the copyright owner. Further reproduction prohibited without permission.

Customers; who are used to aeeepting the delivery of "almost-ready" eode; ean prove tobe resistive to the development processes associated with agile methodologies.
Differences in performance measurements and project status updates
In agile practices, it can be challenging to communicate the status of projects because
there is often qualitative control and a lack of metric.
Variability in team dynamics
The variability of the team dynamics can be challenging. Different people have different
opinions regarding the functioning of the teams. It is mentioned by one of the
respondents that while some people might be pushing forward, others might be resisting
backwards. Also, it can be challenging to identify whether it is essential for a particular
team member to accompany another, as is often required for pair programming.
The above categories of challenges reveal that they capture most of the important
dimensions already considered through the closed-ended questions. It should be noted
that the list of challenges already considered as part of the closed-ended questions were
prepared based on literature review and review of plenty of experience reports. Therefore,
it is not surprising that most of the important dimensions of challenges were already
captured.
6.2.3.6 Discussions
We have seen that solely from the analysis of the quantitative data obtained, eleven out of
nineteen challenge dimensions that we considered show statistically significant results.
The most important of all challenge dimensions is the upper management resistance.
155
Reproduced with permission of the copyright owner. Further reproduction prohibited without permission.

Challenges with respect to upper management resistance are followed by the developer
resistance, problems with geographically distributed teams, differences in lifecycle,
variability in subsystems and teams, differences in management attitude towards project
success, overzealousness of teams, differences in performance management approaches,
adopting agile in legacy systems, and differences in development processes, in decreasing
order of their importance32. The challenges such as problems with selecting the right agile
methodology, developer perceptions of freedom, problems with team size scalability,
tester resistance, productivity differences between team members, decrease in
productivity during transition, human resources resistance, and conformance with
traditional process standards were not found to be statistically significant challenges
based on the survey ratings. In the absence of the availability of any previous literature
that ranks or prioritizes the different challenge items, we were not able to validate the
results that we have obtained with the findings from the literature. However, in Chapter
7, we use qualitative logical reasoning and citations from the literature to support the
reasonings/justifications we make in favor or against the observations we make. Further
statements of support from the literature, in addition to the ones already given in Chapter
4, are given in an attempt to establish the results we have obtained.
As we will see in Chapter 7, in the absence of any particular literature justifying our
results, based on the discussions from the existing pieces of literature in this area, and the
results obtained from the analysis of the qualitative responses obtained through the open-
ended questions, we find that all the eleven challenge categories that have been found to
32 This ordering is purely on the basis o f their mean values.156
Reproduced with permission of the copyright owner. Further reproduction prohibited without permission.

be statistically significant are justifiable. However, as we will discuss in Chapter 7, the
statistical non-inclusion of all the rest of the eight challenge items in the list of significant
challenges is not justifiable in all cases using the logical reasonings and the literature
evidences. We call for their further detailed investigation using other research
methodologies such as case studies.
Further detailed discussions attempting to justify the results obtained from the data
analysis for this research question can be found in Chapter 7. In the interest of not being
repetitive in our discussions regarding these, we do not address them any further in this
Chapter.
157
Reproduced with permission of the copyright owner. Further reproduction prohibited without permission.

Chapter 7
Discussions
7.1 Perspective
This Chapter reviews the results shown in Chapter 6, and analyzes them from the
perspective of the research goals that were set at the outset. This research started with the
following three primary goals:
[Goal 1] Identifying the factors that lead to the success of software development
projects that want to adopt agile software development practices
[Goal 2] Identifying the important changes required for adopting agile software
development practices in projects practicing traditional plan-driven
software development, and ranking them according to their level of
importance.
[Goal 3] Identifying the critical challenges/risks that projects may encounter for
adopting agile software development practices in organizations practicing
traditional lifecycle-based software development, and ranking them
according to their level of importance.
To achieve these goals, theoretical frameworks were developed based on what is
available in the literature. Different hypotheses, which were subjected to validation
through findings from a survey of different agile software development practitioners,
were constructed. Many interesting findings have emerged in this process. In this Chapter
each of these findings are discussed. They are analyzed from different perspectives such
158
Reproduced with permission of the copyright owner. Further reproduction prohibited without permission.

as those that are stated in the literature and those that are available from the qualitative
responses from the respondents. Further statements of support from the literature, in
addition to the ones already given in Chapter 3 and Chapter 4, are given in an attempt to
establish/justify the results we have obtained.
7.2 Success Factors
On the basis of data analysis, we found that nine out of fourteen hypothesized factors
have significant relationship with Success, whereas five do not. The nine factors that
showed significant relationship are: customer satisfaction, customer collaboration,
customer commitment, decision time, corporate culture, personal characteristics, societal
culture, and training and learning. The five that did not show significant relationship are
team distribution, team size, planning, technical competency, and communication and
negotiation. This led us to revise the a priori theoretical model we had developed in
Chapter 3. The revised model is shown in Figure 7.1.
1 59
Reproduced with permission of the copyright owner. Further reproduction prohibited without permission.

OrganizationalFactors
PeopleFactors
H01a (+)
.HOI b (+)•
*H01c (+)|
H02(+)
SuccessHP2(+)
HP3(+)SH03(+)
HP4(+)
HP5(+)
H06b(+)
Planning
Team Size
TeamDistribution
Control
Decision Time
CorporateCulture
CustomerSatisfaction
Communication & Negotiation
Competency
Training & Learning
SocietalCulture
PersonalCharacteristics
CustomerCollaboration
CustomerCommitment
Figure 7.1: Revised Success Factors Framework on the Basis of Survey Data
Let us revisit all the hypothesized factors.
Customer centric issues
It is worth noting that all the three hypothesized customer centric issues viz., customer
satisfaction, customer collaboration, and customer commitment were found to have a
significant relationship with Success.
Although solely from the correlation significance point of view all of these three
customer centric issues were found to have a significant relationship, by looking at their
160
Reproduced with permission of the copyright owner. Further reproduction prohibited without permission.

coefficients of correlation it can be seen that customer commitment was found to have a
strongest relationship of all, followed by the customer collaboration, and customer
satisfaction respectively. This relative behavior is observed solely based on the analysis
of the data obtained, and there is no apparent logical justification or literature support that
can be provided in support of or against this behavior. It is worthy of further investigation
using other means. In an absolute sense, customer commitment and customer
collaboration are undoubtedly very important from the point of view of the agile
practitioners. It is, however, interesting to observe that while customer collaboration and
customer commitment were at least somewhat agreed to be practiced in approximately
78% and 71% percent of cases, customer satisfaction was at least somewhat agreed to be
practiced in approximately 97% of the cases. This is, again, not surprising because
irrespective of what approach the project teams take, it is likely that most people would
agree that they try to satisfy their customers.
Viewing it from what the different respondents have suggested as other success
factors in the open-ended questions, almost all of them suggested in different forms that
customer commitment, and customer collaboration were important success factors. There
were no significant additional suggestions in favor of the customer commitment factors.
Thus the results of the open-ended questions are also intrinsically suggestive of the
customer commitment and collaboration in different morphs. Development teams want
the customers to remain closely associated, engaged, and committed to the project. They
do not want buying software to be viewed by the customers as similar to buying
commodities such as groceries! Thus the results of the analysis of the suggestions
161
Reproduced with permission of the copyright owner. Further reproduction prohibited without permission.

obtained from the open-ended questions are also in conformance with those obtained
from the analysis of the data obtained from the closed-ended question.
The whole idea of agility is trying to develop software efficiently so as to satisfy the
customers. This requires that the customers are committed on the project, and they
involve/engage themselves closely with the development team. It is worth recalling that
customer commitment was even found to be one of the four predictors of the consolidated
dependent variable Success in its regression model measured with the help of the five
measures mentioned in Chapter 3, whereas customer collaboration was found to be a
predictor of the increased return on investment taken alone as a measure of Success.
In conclusion, it can be said that it is sensible that we found significant relationship
between Success and customer centric issues. However, it is contextual to warn that there
may be practical challenges trying to engage customers. In an interesting article (Deias et
al., 2002), the authors describe their experiences of introducing the agile methodology
XP in a start-up company, and found that there were several challenges from the
customers while involving customers and collaborating with them. For example, they
mention:
“Our customers do not like contractual provisions that address the risk o f
changing requirements. Most o f our customers regard software as just one of
the goods that they acquire, and want to buy it using the same kind of
contractual agreements used fo r buying other products. ... The fear o f the
business people is that by opening up the development process to our
162
Reproduced with permission of the copyright owner. Further reproduction prohibited without permission.

customers, we will end up having customer going around shopping for specific
people, trying to build the team o f their choice for specific projects
There are also other practical challenges of having customers on-site that have been
brought forward by them, that should be addressed.
Jensen (2002) reports his experience from several projects that for having success in a
project, cooperation between users (customers) and developers is very important. The
importance of customer commitment, collaboration, and involvement is also evident from
the findings of Graffin (2001) from implementing an agile methodology in an
organization. Our findings regarding the importance of such customer centric issues as
important success factors is further strengthened by the findings from such pieces of
literature.
Decision time
The factor, decision time, also demonstrated significant correlation with Success. The
coefficient of correlation also shows that the strength of the relationship is relatively high
as compared to the rest of the fourteen factors. These results are not surprising
considering that the whole idea behind agility is being fast. Fast communication, informal
communication, effective communication, which are cited by many researchers such as,
Turner and Boehm (2003) and Ambler (2005b) in different ways enable fast decision
making (eWorkshop, 2002), which in turn leads to the success of projects practicing agile
software development. This is further evidenced from the fact that 84% of the agile
practitioners that were surveyed agreed that they strove to make important project
decisions rapidly and within short timeframes. Timing is an important factor. As seen
from the additional success factor responses obtained from the survey participants,163
Reproduced with permission of the copyright owner. Further reproduction prohibited without permission.

cutting down on the time to delivery and time to market are suggested as important
factors. One of the respondents even considered “time boxing” as one of the most
important factors. It is suggested that to be successful, it is important to scale down the
requirements, and slice the whole time into short durations. The implicit idea behind this
is that by doing all of the above, among other advantages, the decisions can be made
more rapidly and efficiently. By looking at the responses to the open-ended questions, we
feel that a better construct in the hypothesized theoretical framework could have been the
consolidated factor “timing issues”. However, we based all the constructs in the
theoretical framework initially purely based on the surveyed literature, and came up with
the “decision time”, which captures a singular dimension of the timing issues.
Corporate culture
The factor, corporate culture, was also found to be statistically significantly correlated
with Success. The strength of this relationship was also found out to be high relative to
the strengths of the other fourteen factors that were considered in this study.
It is not surprising to see that the responses from the practitioners of agile software
development have shown significant relationship with Success, considering the citations
from the existing pieces of literature. For instance, Lindvall et al. (2002) have mentioned
that:
“To be agile is a cultural thing. I f the culture is not right, then the organization
cannot be agile”.
During the eWorkshop that was held in 2002 (eWorkshop, 2002), most of the experts
agreed that the corporate culture was an important success factor. It may be recalled that
164
Reproduced with permission of the copyright owner. Further reproduction prohibited without permission.

successful agile software development requires that the organizations are dynamic and
are fast changing (Abrahamson et al., 2002). The organization should have the right
culture such as supporting rapid communication, dynamicity in requirements changes,
trusting people, and obtaining fast feedback from customers. These were evidenced from
the discussions in Lindvall et al. (2002).
Our results are as well in conformance with the findings of Bossavit (2002) in using an
agile methodology in two different organizations that there are, indeed, certain cultural
values that are necessary. The following statements of the author provides good light into
the issue:
“... the most crucial feature o f any successful corporate culture must be a
willingness to reflect upon itself, to assess whether it needs to change itself,
and, i f need be, to embark on such changes as it finds necessary”.
Corporate culture is an important success factor, indeed. In fact, the statements made
by Bossavit (2002) not only reflect upon corporate culture, but also the importance of
different personal characteristics. This is not surprising because organizations are made
up of people and the characteristics of people are undoubtedly very important to success.
In the survey, the dimension, corporate culture, was captured with the help of the
following eight measures:
• Encouraging rapid communication.
• Culture for trusting people.
• Management has the culture for supporting the decisions of the developers.
165
Reproduced with permission of the copyright owner. Further reproduction prohibited without permission.

• Culture is customer centric.
• Encouragement of fast feedback from customers
• Encouragement of changing requirements.
• Absence of a bureaucratic management structure.
• Management, developers, and testers are in total agreement to use agile practices.
The analysis of the percentage responses obtained against each of these eight
measures suggests that the majority of the practitioners of agile software development
strongly agree that they have all the above cultural factors in their organizations.
It should be further observed that although corporate culture has not been found
during regression analysis to be a significant predictor of the consolidated dependent
variable Success (measured with the help of the five measures mentioned in Chapter 3), it
was found to be a predictor of the Success measures, increased ability to meet with the
current customer requirements, and improved business processes, each taken in isolation
as the dependent variable.
Corporate culture, as a success factor, was further evidenced from the responses of the
open-ended success factor questions. Many of the additional success factors that were put
forward by the different respondents broadly captures the dimension of corporate culture.
For instance, the respondents felt that there should be an environment of supportive
management, there should be buy-in from all stakeholders (inclusive of management),
there should be lack of politics, good customer-vendor relationship in the organization,
and adaptability to changes.
166
Reproduced with permission of the copyright owner. Further reproduction prohibited without permission.

Control
The factor, control, was found to have a statistically significant relationship with Success.
By looking at the correlation coefficient, which indicates its strength of its relationship
with Success, it is perhaps the second strongest (the strongest being societal culture, to be
discussed shortly) amongst all the fourteen hypothesized factors. We measured this
construct by asking respondents whether they practice qualitative control (as against
having quantitative performance measures). Of the majority of the respondents,
approximately 62%, at least somewhat agreed to practice it.
Anderson (2002) reports a practical experience story with using “morning roll call”
(daily standup) in having project success. Such a report supports our finding that
qualitative control is an important success factor. The observations from statistical
analysis are also supportive of the comments made in literature such as Boehm and
Turner (2003), Cockbum (2002), Cohn and Ford (2003), McMahon (2004). Their
observations and comments are also implicitly or explicitly suggestive of qualitative
control.
Not only from the correlation analysis results, but also by observing the regression
model for the consolidated dependent variables Success (measured with the help of the
five dimensions mentioned in Chapter 3), we see that it emerges as one of the four
predictors of Success. However, in the regression models corresponding to each of the
five dependent variables taken in isolation, it appears as a predictor only for increased
return on investment, and it does not appear as a predictor for reduced delivery schedules,
increased ability to meet with the current customer requirements, increased flexibility to
167
Reproduced with permission of the copyright owner. Further reproduction prohibited without permission.

meet with the changing customer requirements, and improved business processes. This
indicates that control has a relatively strong influence on increasing the return on
investment. Such a behavior is only observed from analyzing the data obtained from the
closed-ended questions. Our literature survey cannot justify this observation either in
favor or against. It is worthy of validation through further studies.
Analysis of the responses obtained through the open-ended success factor questions
also suggest different qualitative ways of demonstrating project progress such as weekly
progress showcases to the customers, and/or daily standups. Interestingly, one of the
respondents also suggested showing progress in terms of “completed story points per
iteration”.
In sum, as has been evidenced from statistical analysis, qualitative analysis of the
open-ended responses, and the existing literature, qualitative control emerged to be a
significant success factor.
Personal characteristics
Although personal characteristics were also found to have a significant relationship with
Success, the strength of its relationship relative to the other hypothesized factors is not
commendable. This observation is somewhat surprising when the existing literature is
revisited.
According to Alistair Cockbum (eWorkshop, 2002), one of the pioneers and prominent
figures of agile software development, “Good people are key to success with big teams”.
The participants of the eWorkshop that was held in 2002 (eWorkshop, 2002) were
supportive of personal characteristics such as having honesty, collaborative attitude,
168
Reproduced with permission of the copyright owner. Further reproduction prohibited without permission.
sense of responsibility, readiness to learn, and work with others as important success
factors. Technical expertise and professional qualifications alone cannot succeed a
project. The importance of personal characteristics such as cooperativeness is also
reported in the literature (Jensen, 2002). Similar observations suggestive of the above
facts can be made by reviewing the following pieces of literature: Ambler, 2005c; Boehm
and Turner, 2003; Boehm and Turner, 2005; Cockbum and Highsmith, 2001 and
Cockbum, 2002. They were already discussed in Chapter 3.
The constmct, personal characteristics, was measured with the help of the following
dimensions:
• Having majority of the members with strong interpersonal and communication
skills.
• Having majority of the people who are honest.
• Having majority of the people who are motivated.
• Having majority of the people who have collaborative attitude.
• Having majority of the team members consisting of people who have sense of
responsibility.
• Having majority of the team members consisting of people who have readiness to
learn.
The majority of the respondents at least somewhat agreed (in fact, most of them
strongly agreed) to have team members having such kind of personal characteristics.
However, it did not show a strong relationship with Success compared to the other
169
Reproduced with permission of the copyright owner. Further reproduction prohibited without permission.

factors. However, a number of responses to the open-ended success factor questions were
suggestive of personal characteristics as an important success factor. They are as follows:
Having intellect; Taking up responsibility; Having a base of good principles; Willingness
of programmers to work as pairs; Passionate; Not being a perfectionist; Self-criticism;
Courage to tell the truth about project; Respect of individual; Good People; and Humility.
Although it is not to be denied that the construct personal characteristics does show
that its relationship with success is significant, we expected that the relationship would be
stronger than what we obtained. This observation is contrary to earlier research that is
supportive of the role of personal characteristics. Therefore, further studies using other
methodologies should be warranted to closely observe this observed phenomenon.
Societal culture
In this study, the societal culture was measured with the help of the following four
dimensions:
• Having people in the society who are in general communicative.
• Having people in the society who are in general dynamic.
• Having people in the society who are in general have progressive attitude.
• Having majority of the members of the team with similar social culture, even
though they might be belonging to different nationalities and provinces.
The consolidated percentage figures for the responses obtained suggest that a
majority of the surveyed team members have somewhat agreed to possess or abide by the
above dimensions of societal culture.
170
Reproduced with permission of the copyright owner. Further reproduction prohibited without permission.

Societal culture was observed to have a significant relationship with Success
suggesting that having people in the society who are communicative, dynamic,
progressive in attitude, and having team members with similar social culture, taken
together, are important success factors. The correlation analysis results also demonstrate
a relatively very strong coefficient of correlation (in fact, the strongest of all), thereby
being strongly suggestive of the presumption based on observations from the existing
literature that societal culture does play a significant role as a success factor.
It should be noted that multiple regression analysis suggests that societal culture was
found to be a significant predictor of the consolidated Success variable amongst all the
fourteen factors considered together. Even when regression models were constructed with
each of the five measures of Success (see Chapter 3) taken in isolation, it was observed
that societal culture is a significant predictor of the return on investment. This
observation is obtained purely from the data obtained from the closed-ended questions,
and cannot be supported with the existing literature that were surveyed.
Interestingly, the additional success factor responses obtained from the respondents
against the open-ended questions, do not reveal any additional dimensions of societal
culture.
Training and learning
The construct, training and learning, was found to have a statistically significant
correlation with Success. Furthermore, it was also found to have a relatively strong
relationship. These results are not surprising because there is a strong evidence in the
171
Reproduced with permission of the copyright owner. Further reproduction prohibited without permission.

existing literature (Boehm and Turner, 2005; Drobka et al., 2004; eWorkshop, 2002,
Lindvall et al., 2002) which is suggestive of training and learning as a success factor.
This construct was measured with the determination of the willingness to
continuously learn from one another and train the team members through mentoring and
professionally guided discussions than through formal training. Thus the emphasis is on
continuous, informal learning. The results showing that the majority of the respondents
strongly agree that they practice this approach of training and learning in their teams. The
results showing significant and relatively strong correlation with Success imply that the
majority of the agile practitioners that were surveyed believed that continuous, informal
learning (over formal training) was a significant success factor. Informal learning helps in
knowledge diffusion in an organization. However, it should be noted that there are
authors such as Dingsoyr and Hansen (2004) who believe that informal learning
methodologies such as pair programming alone cannot be effective means of knowledge
diffusion in an organization. Dingsoyr and Hansen (2004) have suggested postmortem
reviews as a lightweight mechanism to aid in such a purpose.
The regression model for Success also shows training and learning to be a significant
predictor of Success. Even the results of the regression modeling with each of the five
measures of Success, taken in isolation as a dependent variable, also show the training
and learning construct to be a significant predictor of the reduced delivery schedules and
increased return on investments.
The above results are further supported by the responses to the open-ended questions,
which indicate usage of informal training methods such as pair programming. This will
172
Reproduced with permission of the copyright owner. Further reproduction prohibited without permission.

enable transfer of knowledge through discussion of designs. However, there were a few
respondents who believed in having full time coaches and taking help of outside coaching
services to succeed.
Team distribution
Team distribution was measured with the help of two dimensions:
• Having members in the team that are geographically closely located.
• Having other teams (with which interactions are made) geographically closely
located to ours.
The results of the analysis of the closed-ended data obtained from the respondents do
not suggest any significant relationship with Success. While the majority of the
respondents maintained that they strongly agreed to have geographically closely located
members of their own team, they strongly disagreed with the need to have other teams
with which they interact geographically closely located to theirs. Thus from the results of
the correlation analysis it can be suggested that geographical collocation of own team
members or members of other teams with which interactions are made does not show any
significant relationship with Success.
The above results are contrary to the suggestions from existing literature for having
collocated teams as a success factor (e.g, eWorkshop, 2002; Lindvall et al., 2002).
Further, there are earlier authors (Ambler 2005b; Boehm and Turner, 2003; Cockburn,
2001; McMahon, 2004 and Turner and Boehm, 2003) who have emphasized on close
proximity, and communication issues such as face-to-face communication. Our findings
173
Reproduced with permission of the copyright owner. Further reproduction prohibited without permission.

are also not in conformance with the suggestions made by Turk et al. (2002), in which
they have mentioned the identification of limited support for distributed development of
agile processes as one of the important factors in agile development. In other words, team
distribution should be an important success factor. In this context, it is worth citing the
experience of Motorola, Inc., in their global development projects. Copeland (2001)
mentions that Motorola, Inc. had used an agile methodology, XP, in some of their
development projects, and found that it was not suitable for their global development
projects. The reason cited relates to the fact that XP encourages working in small teams,
and they had difficulty doing so in their global development projects. This is further
suggestive of the fact that team distribution should be an important factor in determining
success.
The apparent inconsistencies with the literature that we have obtained through the
analysis of the data obtained from the closed-ended questions could be attributed to the
differences in measures of success that we considered in this study, with the ones that are
suggested by the authors. The suggestions to the open-ended questions from the
respondents are not suggestive of any significant success factors that can be attributed to
this dimension. This behavior could be partially justified by the fact that may be a
significant number of respondents would not justify team distribution, or even
communication and negotiation, as a major success factor as compared to many of the
others that we considered. Let us take the example of the case reported by Fowler (2006)
in which he reported success in using agile practices in offshore development project, in
spite of the fact that in offshore development environments communication and
174
Reproduced with permission of the copyright owner. Further reproduction prohibited without permission.

negotiation would pose major challenges. Fowler (2006) mentioned some strategies
which could successfully overcome the challenge of having distributed teams.
Thus, because it is hard to justify the results we have obtained, team distribution is a
candidate for further detailed investigation using other research methodologies such as
case studies.
Team size
The construct, team size, failed to demonstrate a significant correlation with Success.
Using this construct it was measured whether the respondents worked in small teams.
This is contrary to the popular belief in the literature that we surveyed. Ambler (2005b),
among others, emphasize on close face-to-face communication. Having small teams was
suggested in the literature (eWorkshop, 2002, Dyba, 2000). Among the suggestions
obtained from the eWorkshop participants (eWorkshop, 2002), Frank Maurer suggested
small teams in university setting, Ken Auer said 12 using pure XP, Tim Mackinnon
provided different figures (corresponding to different situations) for team size, but all of
his suggestions are for a team size less than 25. There were other figures ranging in
hundreds were also proposed. The rejection of small team size could be connected with
these suggestions because we have surveyed different types of people working in
different project types. This is in conformance with the following statement33 of Randy
Miller in the eWorkshop (eWorkshop, 2002):
33 The exact form in which this statement and the one below for Alistair Cockburn were made might be slightly different from what is stated here. The quotation here is taken verbatim from the eWorkshop(2002).
175
Reproduced with permission of the copyright owner. Further reproduction prohibited without permission.

(team) size is not an issue specific to agile development. I t’s a best
practice for any type o f development to break into smaller teams.”
The reason, however, why we hypothesized small team size to be a success factor is,
logically, and as mentioned in some of the above mentioned pieces of literature (see the
discussions on team size in the eWorkshop (2002)), having a small team size enables
effective communication, fast feedback, and prompt decision making. Our intuition is in
conformance with the suggestion of statement of Alistair Cockbum in the eWorkshop
(eWorkshop, 2002), which reads:
(team) size is an issue. As size grows, coordinating interfaces becomes a
dominant issue. Agile with face-to-face breaks down (becomes more
difficult/complex) past 20-40 people (interface becomes an issue).”
Our findings are also inconsistent with the Turk et al. (2002) who have identified that
limited support for development involving large teams in agile processes as one of the
challenges in agile development. Also Parrish et al. (2004) in their early study found that
productivity influences of pair programming as the team/organization size increases.
Since pair programming is a common practice in agile software development, this gives
us another clue that team size should be an important factor.
Of course there are other instances reported in the literature of using agile practices in
large team environments. Pine (2001) mentions his positive experience of successfully
using XP (a methodology following the agile practices) in a large, multi-team
environment. Of course, whether he received success according to our definition cannot
be inferred from his paper. The instance of Harrisson (2003) is also worth noting. They
176
Reproduced with permission of the copyright owner. Further reproduction prohibited without permission.

have reported of positive experiences using agile practices in large projects that have
large number of teams, and large team size. All these stories of different opinions may
also partially help us justify our observation from data analysis that team size or project
size may not be a success factor.
Because of the varying thoughts, opinions, arguments, and justifications regarding
this issue, we call for further research to investigate this issue in detail. In particular, we
suggest that different projects with varying team size should be investigated in detail
preferably using a case study based approach, which might be helpful in making detailed
observations regarding this issue.
Planning
Planning was not found to have a significant relationship with Success. The aspect of
planning that we measured is internalized, informal, and undocumented plans (as against
formal plans). Insignificant relationship with Success is contrary with the literature we
surveyed which suggest internalized planning over the formal ones (Boehm and Turner,
2003; Cockbum, 2002; Cohn and Ford, 2003; McMahon, 2004). This indicates that
formal planning cannot be discarded from consideration. Although, by abiding by the
literature, we hypothesized for internalized undocumented planning, and against formal
planning, it being not a success factor is not counter-intuitive. Agile practices are
relatively new, most experienced people we surveyed have been working in traditional
type projects for years, and it is unlikely that by surveying such kind of people we will
get its strong relationship with Success. Furthermore, many of these people work in
complex projects, involving a large number of personnel, and in big organizations, which
177
Reproduced with permission of the copyright owner. Further reproduction prohibited without permission.

would require daaiimeiited planning. Since thfiK afg multiple faetSfS that affSCt SUCCeSS,
intuitively, there can be Success in a project (attributable to other factors), even when
formal planning was undertaken. The above statements could possibly justify the results
we have obtained through data analysis of responses to the closed-ended questions for the
possibility of “planning” as a success factor.
Technical competency
It was found out through analysis of data from closed-ended questions that technical
competency does not have a statistically significant correlation with Success. The
majority of the people that we surveyed at least somewhat agreed that they have
technically competent people. However, no significant relationship was found between
technical competency and Success. First, this is counter-intuitive. This is because,
logically, having competent or incompetent people should make a difference to the
success of a project. Secondly, our literature survey (Cohn and Ford, 2003; Boehm and
Turner, 2005; and Cockbum and Highsmith, 2001) is also implicitly or explicitly
suggestive of the competency dimension. Also, this is contrary to Barry Boehm’s
suggested principle of using fewer and better people (Boehm, 1981).
In regards to competency as a success factor, the practical experience of Deias et al.
(2002) introducing agile in a start-up Internet company is also worth noting. According to
them:
“If the team lacks the necessary programming experience results will be at best
marginally better than what one would expect from any other methodology”.
178
Reproduced with permission of the copyright owner. Further reproduction prohibited without permission.

Our initial hypothesis of having competency as a success factor is also not in
conformance with the observations of Deias et al. (2002). Experience and competency
are very important.
In addition to the citations from the literature, when the respondents were surveyed
through open-ended questions for additional success factors, there were a number of them
who suggested different factors that are suggestive of different competencies such as the
following: Talent; Developers know the business and can sometimes be their own
customers; Smart people; Individual capabilities of team members; Craftsmanship;
Developers’ experience; Domain knowledge; Developer familiarity with the technical
platform; and Developer skills.
In view of the above discussions, we are unable to come to any conclusions regarding
the insignificant relationship of the competency construct with success. We see that many
respondents have made many suggestions in favor of different technical and non
technical competencies. Thus, we call upon further investigation regarding this issue.
Communication and negotiation
The construct, communication and negotiation, was measured with the help of the
following dimensions:
• Having mechanisms that enable personnel to communicate and negotiate
quickly and effectively with developers, operations, support, customers,
management, and business areas.
• Having face-to-face communication and negotiation.
179
Reproduced with permission of the copyright owner. Further reproduction prohibited without permission.

• Communication and negotiation between people who are physically close to
one another.
• Communication and negotiation between people who work in the same
(similar) time zone.
• Having people in projects that are amicable to each other to such an extent that
they communicate with each other with trust and good will.
Communication and negotiation was also found not to have a significant relationship
with Success, based on the survey data obtained through the closed-ended questions. This
is, perhaps, the most surprising of all the above factors that were found not to have a
significant relationship with Success.
Several previous pieces of literature support effective communication mechanisms to
be in place for success. Some of them that are implicitly or explicitly suggestive of the
same include Ambler (2005b), Cockbum (2001), eWorkshop (2002), Lindvall et al.
(2002), Turner and Boehm (2003), and McMahon (2004). Logically, as well, fast and
effective communication supports fast decision making, adapting with the dynamicity of
projects, and fast knowledge transfer between team members in a project.
Considering the points of view raised through the additional open-ended success
factor questions, as well, we see that a number of factors such as open and continuous
feedback between team members, using simple but effective communication tools, using
information radiators such as charts and cards on the walls, and using communication
rules that are suggestive of communication as a success factor were raised.
180
Reproduced with permission of the copyright owner. Further reproduction prohibited without permission.

As both previous literature and our logical justification are not in consistence with the
results of the data analysis that communication and negotiation do not have any
significant relationship with success, we call for further studies in this domain to be able
to draw any conclusive inference.
7.3 Changes Required
In Chapter 6, we had seen the statistical ranking of the change items based on the data
obtained. Since our literature search did not reveal any study that ranks or prioritizes the
different change items, we will not be able to validate the results that we have obtained
with findings from existing literature. However, we will use qualitative logical reasoning
and citations from the literature to support our reasonings/justifications of the
observations.
We considered four categories of changes, namely:
1. Changes in organization culture
2. Changes in management style
3. Changes in knowledge management strategies
4. Changes in development processes
Based on the results we have obtained, we have seen that the most important of all
changes is the changes in the management style, followed by, in decreasing order of
importance, the changes in organization culture, changes in development processes, and
changes in knowledge management strategies. Our results from data analysis lead us to
believe that although one change category is more important than another; all of them are
statistically significant (passed the one-sided t-test). This is consistent with our literature
181
Reproduced with permission of the copyright owner. Further reproduction prohibited without permission.
survey finding that all the four change categories we considered are important (of course,
as just said, one is more important than another).
Logically, from our perspective, of all the four categories of changes, changes in
management style, and the changes in development processes are probably the most
important of all changes that are required. The agile approaches use lightweight
processes. They encourage individuals and interactions over processes and tools,
responding to changes over following plans, and paying more emphasis on collaborating
with customers over negotiating contracts with them, and providing working software
over providing a comprehensive documentation (Fowler and Highsmith, 2001; Fowler,
2002).
Changes in management style
The discussions in the last section showed that in agile approaches there is a strong
emphasis required on shifting the style of management style. The management in
organizations that have been used to traditional, plan-driven approaches to software
development for long are often the most resistive. As one of the respondents pointed out:
“(there is) management desire for fixed price, fixed scope”.
This type of management attitude for fixed scope and fixed price is resistive to
change and adaptation, which are important for agile approaches. As long as the
management does not change34, the development processes cannot change, the culture
cannot change, or the knowledge management strategies cannot change. Thus it is
intuitive that changes in management attitude are the most important of all the four
34 Obviously, in practical situations, it is never the case that one has to take place before the other can happen. Such justifications are made in order to assess the relative importance o f each other.
182
Reproduced with permission of the copyright owner. Further reproduction prohibited without permission.

categories of changes. As has been indicated in the previous pieces of literature such as
Boehm and Turner (2005), Cohn and Ford (2003), McMahon (2005), and Nerur et al.
(2005), management styles must change from command-and-control management to
leadership-and-collaboration, from authoritative to collaborative and pluralist decision
making.
Based on the results of the data obtained through responses to the closed ended
questions, the responses to the open-ended questions, and the citations available in the
literature, it is suggested that for becoming agile, the most important thing would be that
the management in organizations adopting agile practices collaborate with the rest of the
development team members, work closely with them, seek their suggestions, remain open
about the status of their projects with the rest of the team members, perform small-scale
scope management, without, however, micromanaging the developers, accept uncertainty
and risk, and remain open to changes as might be required by the customers or developers
for developing a quality product. Management who are traditionally habituated to
drawing up well-defined plans, negotiating contracts with the customers, following them,
and sticking to them would need to change their style of management. The role of the
management should be to facilitate the overall development activities without
commanding and controlling the development team and charging them for work they
have done in their intention for developing a quality product.
183
Reproduced with permission of the copyright owner. Further reproduction prohibited without permission.

Changes in organization culture
Having justified the importance of management style amongst all the types of changes,
let us now examine the remaining categories of changes, i.e., the changes in the
organization culture, the changes in development processes, and the development in the
knowledge management strategies. The issue of knowledge management is clearly the
least important amongst all the three above, because the issue of knowledge management
arises only when the development has started. The development processes required in
agile development cannot sustain if there is no suitable organization culture.
Changes in culture that are required include culture to work in teams rather than
developing solitarily with individually assigned roles, culture which considers satisfying
customers as the most important and doing all development centering around that goal,
culture which provides freedom to the developers for choosing which modules to develop
and how to develop. In addition to the results that we have obtained from data analysis,
the discussions in the existing pieces of literature such as Boehm and Turner (2005), and
Nerur et al. (2005) are also in conformance with these ideas.
Remaining changes
Having discussed the importance of the changes in management style, and organization
culture, the remaining change categories are the changes in the development processes,
and the changes in the knowledge management strategies. Clearly, the issue of changes in
knowledge management strategies is secondary relative to the changes in the
development processes.
Of all the changes in development processes, the most important changes that are
required are shifting from heavyweight process centric development in organizations184
Reproduced with permission of the copyright owner. Further reproduction prohibited without permission.

practicing traditional, plan-driven development. As has been seen earlier, the agile
approaches require close interactions between individual team members themselves and
between the team members and the customers, responding to change, having a working
software rather than following fixed plans, processes, and tools, and documenting them.
The agile approaches encourage development in short iterations (time frames) that are
driven by (automated) test plans. The development processes in agile approaches part
away from following traditional lifecycles such as the Boehm’s spiral model discussed in
Chapter 2. The development in agile approaches is evolutionary meaning that a small
piece of functionality is developed first, and then it is revised incrementally by
collaborating with the customers. The last important change that is required in the
development processes is to part away from development guided by standard contracts,
and quantitative measures of success. While it is difficult to justify (logically or with the
help of existing literature) the order of importance of the above change items that are
obtained from the closed-ended survey results, all the above changes in development
processes are considered important and are cited in the exiting pieces of literature such
as Nerur et al. (2005), and Boehm and Turner (2003).
The above observations are also in conformance with the large number of suggestions
received against the open-ended questions for changing the development processes such
as follow test-driven development, develop in small steps, and build incrementally and
continuously, program in pairs, and develop functional tests in conjunction with writing
the code.
Finally, changes in how knowledge is managed are important. But the results of data
analysis, the results of the analysis of open-ended questions, and the logical reasoning
185
Reproduced with permission of the copyright owner. Further reproduction prohibited without permission.

seen above ranks it last amongst all categories of changes. Since the agile approaches lay
more importance to delivering working software over documenting, the tacit knowledge
should be captured and managed in agile approaches, so that valuable information is not
lost and/or successes are pursued, and failures are not repeated. However, it is pertinent
to mention in this context that, as pointed out in a discussion in an earlier section, there
are authors such as Dingsoyr and Hansen (2004) who believe that informal learning
methodologies such as pair programming alone cannot be effective means of knowledge
diffusion and management in an organization. Dingsoyr and Hansen (2004) have
suggested lightweight knowledge management mechanism to aid in such a purpose. As
pointed out by one of the respondents in an open-ended question only that knowledge
should be captured that will help the customers.
7.4 Challenges Involved
Nineteen challenges were hypothesized from the literature and were ranked. As in the
case of the changes required, our literature search does not reveal any ranking of different
challenges. We, therefore, try to justify below the findings from data analysis with the
help of logical justifications and giving citations from literature whenever appropriate
and feasible. These justifications apply to challenge item rankings obtained purely on the
basis of their mean values. It should recalled that most of the subsequently occurring
significant challenge items were not found to have a significant difference of their means.
Resistance is the biggest challenge in any transformation. In our study, we considered
resistance from four classes of employees:
• Developers
186
Reproduced with permission of the copyright owner. Further reproduction prohibited without permission.

• Testers
• Upper management
• Human resources
Of all these employees, the results of the analysis of data obtained from the closed-
ended questions reveal that the resistance from the upper management is most
challenging, followed by resistance from developers, and insignificant from testers and
human resources. These results are very much intuitive. As we have seen in the earlier
section, management, whether it is upper management or middle management35, is
probably the most resistive of all. Managers used to develop software using traditional,
plan-driven approaches tend to favor “fixed price, fixed scope” approaches. They want to
demonstrate success in progress. They are much less tolerant of risks of failure in
undertaking new approaches, more so for the ones that are new, unproven, and do not
have adequate track records of success. In this context, it is also worth citing the article
by Copeland (2001). Copeland (2001) makes citations about the findings of James Knox,
an Ottawa-based independent consultant, who observed that it was difficult to introduce
XP (a particular type of methodology following the agile philosophy), because he
received no support from management at all. This further strengthens our finding that
management resistance is a very important challenge in agile development. Having said
that, it was also worth mentioning that there are exceptions, and ways of overcoming
management resistance. Different people can suggest different ways of overcoming
35 Resistance from middle management was suggested, in addition to the resistance from upper management, in the responses to the open ended questions. However, it did not show up in the initial set o f
187
Reproduced with permission of the copyright owner. Further reproduction prohibited without permission.
resistance. Let us take the example of pair programming. Pair programming is an often
used programming technique used in agile software development. In general, as seen
earlier, management, who are especially resistive of paying two programmers to do the
same work. However, Williams and Kessler (2002) provides their positive experience on
how to successfully overcome such a management resistance.
Compared to the resistance from managers, the resistance from developers is relatively
less challenging, because the developers often do not see the large scope of the projects,
they develop small functionalities that they are asked to. It is intuitive and convincing
that if the management is convinced and supportive of adopting agile practices, a major
challenge can be overcome. Of course, there are still other challenges that come from
developers as resistance to adopting agile practices such as resistance to learning and
using new way of developing software, and using tools that they are not familiar with,
laying lesser emphasis on producing artifacts that do not accompany the final desired
deliverable - the working software. Having on-site customers in development can also be
challenging and resistive (Deursen, 2001; Thorup and Jensen, 2003). Thorup and Jensen
(2003) share their thoughts of how customer-developer collaboration can be improved.
Such and other challenges are further evident from existing pieces of literature such as
Cohn and Ford (2003), Highsmith (2000), and Nerur et al. (2005). Furthermore, there are
challenges we considered, because they were collected based on the existing pieces o f literature that we surveyed.36 Although there can be developer resistances to working with customers, there are success stories available as well. For instance, Crispin (2005) reports a successful experience o f involving customers in test-driven development. In her experience report, she mentions o f having customers to drive the test- driven development processes. Further, since working with customers can be resistive, Farrell et al. (2002) shares their practical experiences and recommendations as how best to improve customer-developer collaboration. Their recommendations include having customers and developers work as a single team, stories be owned by customers, and having improved mechanisms for tracking and steering.
188
Reproduced with permission of the copyright owner. Further reproduction prohibited without permission.
additional challenges that are obtained through the open-ended questions and that can be
attributed to developer resistance. Those are further supportive of the importance of
developer resistance to accepting agile practices.
Much less (in fact, statistically insignificant) importance is shown by the results of data
analysis for tester resistance and human resource resistance to adopting agile practices
(Cohn and Ford, 2003). In general, testers should not be much resistive to agile practices
because they test what they are asked to. The resistance of the testers should not be an
extremely challenging issue. The resistance of testers can arise from the fact that some
testers who are used to the traditional idea of testing after coding might be resistive of
testing while coding (a common approach used in agile methodologies). Therefore, the
lesser ranking that is obtained for tester resistance as compared to the management and
developer resistance is intuitive. Existing surveyed literature also do as not evidence
reports are substantially contrary to this claim. In fact, the additional responses obtained
through the open-ended questions do not depict any interesting challenges that can be
related to tester resistance.
Human resource resistance does not show as an important statistically significant
challenge as well. This is also intuitive because in most cases human resource personnel
do not bother about what development methodologies and processes are undertaken by
the teams. However, having said that, it should be clarified that this was considered as a
challenge item by following the statements mentioned in Cohn and Ford (2003), which
suggested that the concepts of work sharing and pair programming are often resisted by
the human resource teams in traditional organizations because in such cases it becomes
189
Reproduced with permission of the copyright owner. Further reproduction prohibited without permission.

difficult for them to track progress of each team member. However, we feel that in most
practical situations the reality might be different. The progress reports of the individuals
come from the development team managers. The human resource professionals do not
come to see the periodic progress of employees.
In addition to the above discussions surrounding potential resistance from different
stakeholders mentioned earlier, it should be mentioned that our results regarding the
important resistances are also consistent with the findings of Graffin (2001), obtained
while implementing an agile methodology in an organization, that buy-in from all key
participants is very important prior to an agile methodology’s implementation.
Other than the most challenging resistances from management and developers to
adopting agile practices, the next major challenge obtained from the results of the data
analysis is problems with distributed teams. This is, indeed, an important issue. The agile
approaches call for close interactions, and feedback between team members. Having
close interactions becomes challenging with geographically distributed teams. The
existing literature (Cohn and Ford, 2003) is also supportive of this fact. Working in
distributed teams decreases the pace of communication, and decision making required in
agile approaches. Thus the relatively high importance obtained from data analysis for this
type of challenge is not surprising. Our findings are consistent with the findings of Turk
et al. (2002), in which they have identified that limited support for distributed
development o f agile processes is one o f the important challenges. O f course, their
findings cannot help us rank the level of importance of this challenge. In this context, it is
also worth citing the article by Copeland (2001). Copeland (2001) makes citations about
190
Reproduced with permission of the copyright owner. Further reproduction prohibited without permission.

Motorola, Inc., who have used an agile methodology, XP, in some of their development
projects, and have found that it is not suitable for their global development projects. The
reason cited relates to the fact that XP encourages working in small teams, and they had
difficulty doing so in their global development projects. This further strengthens our
finding that distributed development can be a very important challenge in agile
development.
The construct, differences in lifecycle, was statistically ranked to be important next to
management and developer resistance. This somewhat high rank of this challenge item is
not surprising, and it is supportive of the following observation made by Boehm and
Turner (2005). Agile practices focus on delivering immediate value to the customers. In
contrary to the plan-driven development processes, which are heavyweight having long
iterations and delivering value at the end of the complete lifecycle, agile processes are
test-driven, and have short, focused frames of development.
Because of the differences in the development processes, there can be significant
challenges that might arise in integrating agile processes in one team or subsystem, when
the other teams or subsystem with which interactions are made practice traditional
development methodologies. However, this is much less challenging compared to the
challenges arising due to the changes in development processes in the team itself. This
logically justifies the fact that data analysis shows that such integration issues are
important challenges.
Overzealousness of teams was ranked relatively higher compared to the other
hypothesized challenges. The importance of the challenge arising due to overzealousness
191
Reproduced with permission of the copyright owner. Further reproduction prohibited without permission.

of teams could be attributed to the observation made by Cohn and Ford (2003) that since
the agile practices are characterized by fast decision making, overzealousness might very
well lead to making decisions without much forethought.
As seen in Section 7.3, the survey results show that the changes in management style
are critical. The reasons were logically justified as well. Though they do not rank the
challenges, they have identified this to be an important challenge. The above reasoning
also justifies the importance obtained through data analysis of the challenges surrounding
the differences of the attitudes towards project success of the management practicing
traditional and agile methodologies, and the differences in performance management
approaches. In agile approaches the managers do not have fixed plans and performance
measures to rely on for demonstrating success. Ideally, the managers do not have any
contracts to abide by or milestones to dictate progress. Success in agile approaches is
qualitative, and is, generally governed by the continuous satisfaction of the customers.
Considering the case of incorporating agile in legacy systems, although it is a
challenge to subject these systems’ requirements and their associated processes to rapid
changes, such issues are manageable because such situations are unlikely or practically
low in number in legacy systems which have been there for years. However, there are
instances reported in the literature (e.g., Gawlas, 2003; Rasmusson, 2003) where large,
legacy-type, and/or mission-critical systems were done better (or at least done properly)
using agile practices. Therefore, the relatively low rank obtained for adopting agile
methodologies for use in legacy systems is understandable, because it is likely that there
would be varying opinions from respondents regarding this issue. Not everyone would
192
Reproduced with permission of the copyright owner. Further reproduction prohibited without permission.

consider it a major challenge. Thus, it is comprehensible that it has been ranked not as
important challenges as compared to the others mentioned above.
As discussed in Section 7.3, there are vast changes in development processes that take
place while transitioning from development using traditional, plan-driven approaches to
that using agile. Changes from heavyweight process centric development to those using
lightweight processes can be extremely challenging. Close interactions between
individual team members themselves and between the team members and the customers,
responding to change, parting away from following fixed plans, processes, and tools, and
documenting them, development in short iterations (time frames) driven by (automated)
test plans are almost a paradigm shift in development approaches in plan-driven
development organizations. However, although this is found to be a statistically
significant challenge, the logical reasoning expects it to have been ranked higher. This
observation cannot be justified from our existing literature review, and should be
subjected to analysis using other methodologies.
Since the management style in agile approaches requires the managers to closely
interact with the rest of the development team members, qualitatively monitor the
progress of the project, and take quick decisions, the developers might feel getting
micromanaged. This might lead to frustrations, less job satisfaction, and ultimately
decrease in the productivity of the team members. These observations and the results of
the data analysis ranking developer perceptions of micromanagement as an important
challenge are also in conformance with the citations in the literature (Cohn and Ford,
2003; Nerur et al., 2005). Although perceptions of micromanagement are important, they
can be easily overcome by educating the managers. They are not as important as the193
Reproduced with permission of the copyright owner. Further reproduction prohibited without permission.

previously mentioned factors. This justifies their relative low rank. Nevertheless they are
an important challenge.
Challenges such as problems with selecting the right agile methodology, developer
perceptions of freedom, and team size scalability were found to be statistically
insignificant. Such observations are understandable. Regarding the challenges of
developer perceptions of freedom, or team size scalability - such challenges are relatively
easy to mitigate by educating the managers and the developers appropriately of the
potential problems surrounding the agile approaches. Also such potential perceptions are
unlikely to critically affect the overall performance in team environments. So they are
understandably not critical challenges, as shown by the results of data analysis. With
respect to team size scalability, as mentioned in Section 7.3, there are varying opinions
regarding whether team size is an issue or not. It is not unbelievable that this varying
opinion might have been reflected in the survey results as well regarding this issue. We
initially hypothesized them as challenges based on reviewing the existing literature such
as Cohn and Ford (2003), Nerur et al. (2005), Parrish et al. (2004), and Boehm and Turner
(2003). However, none of these pieces of literature ranks these challenges, show
instances, or have discussions which can be used as guides for justifying these low ranks
obtained through data analysis. Therefore, we had to resort to logical justifications above
in support of the observed results.
Finally, interestingly, decrease in productivity during transition ranked low and
insignificant as compared to overzealousness of teams, problems with team size
scalability, developer perceptions of micromanagement, or developer perceptions of
194
Reproduced with permission of the copyright owner. Further reproduction prohibited without permission.

freedom, thereby suggesting that according to the respondents there is not a significant
level of decrease in productivity while transitioning from plan-driven processes to agile.
Although our search of previous literature cannot substantiate this observation, intuitive
reasoning suggests that since the whole approach to how software is developed changes,
it is likely that there will be decrease in productivity during the transition period when
developers are getting used to the new ways and approaches.
195
Reproduced with permission of the copyright owner. Further reproduction prohibited without permission.

Chapter 8
Conclusions
8.1 Summary
Agile software development has recently gained widespread popularity. The Agile
Manifesto states valuing “individuals, and interactions over processes, and tools, working
software over comprehensive documentation, customer collaboration over contract
negotiation, and responding to change over following a plan” (Fowler, 2002). Although
there have been anecdotal and experiential reports available from practitioners of
software development projects using agile practices, empirical studies on agile practices
are scarce.
The overall goal of this Thesis was to advance the state-of-the-art of the research in
this area. Specifically, we have addressed the following three research questions of
current interest to software practitioners, in general, and (potential) agile software
development practitioners, in particular:
1. What are the factors that lead to the success of software development projects,
that want to adopt agile software development practices, from the perspective of
agile software development practitioners?
2. What are the important changes required for adopting agile software development
practices in projects practicing traditional plan-driven software development? Can
we rank them according to their level of importance?
196
Reproduced with permission of the copyright owner. Further reproduction prohibited without permission.

3. What are the critical challenges/risks that projects may encounter for adopting
agile software development practices in organizations practicing traditional
lifecycle-based software development? Can we rank them according to their level
of importance?
We undertook a survey-based ex-post-facto empirical (quantitative) study approach by
identifying the success factors from the perspective of software practitioners in agile
software development projects, determining the key changes traditional projects have to
undergo to adopt agile practices in their projects, and the challenges/risks they have to
undergo for transition. First theoretical framework was developed based on previous
literature. Thereafter, different software development practitioners, practicing agile
principles in their projects, were approached with both closed-ended and open-ended type
questions. While the closed-ended questions formed the core of the study, the open-ended
questions helped in getting fresh perspectives from currently practicing agile software
development practitioners from different industry sectors. The responses were obtained
from different industry sectors including those having the primary line of business as
computer related (hardware/software/IS/MIS), consulting, banking/insurance, healthcare,
and aerospace. The respondents belonged to both small and large sized organizations and
teams. Responses came from all role types - software developers/testers, and all
management levels.
The responses to the closed-ended questions were then statistically analyzed using
different techniques. The important contributions are summarized in Section 7.2.
197
Reproduced with permission of the copyright owner. Further reproduction prohibited without permission.

We conducted an unprecedented large-scale empirical study. Most of the previous
empirical studies have been localized within a few projects/organizations. The feedback
we received while conducting the survey has been overwhelming. Many of the
respondents, who are also experts in this area, have shown interest in the work and its
results. Some of their comments can be found in the Chapter 5.
In the context of the first research question it should be noted that the success factors
are not the operationalized forms of the 12 principles. Some of the success factors may
coincidentally map to some of the 12 principles. The hypothesized success factors are
taken from what the previous pieces of literature on agile software development say are
the success factors of a project. We are not testing whether the 12 principles work in
practice or not. Our interest was to identify the success factors from the perspective of
software practitioners in agile software development projects. For that I conducted a
survey by asking different software practitioners (who had the background of following
the Agile Manifesto) regarding what in their experience were the different success factors
in any software development project. They did not need to be concurrent with the 12
principles. Also, someone practicing an agile software development principle may not
necessarily agree that a particular principle to be a success factor.
8.2 Contributions
Our research contributions are as follows:
• Determining the factors that lead to the success of software development projects
that want to adopt agile software development practices. We have found that 9 of
the 14 hypothesized factors significantly relate with success. They are customer
198
Reproduced with permission of the copyright owner. Further reproduction prohibited without permission.

satisfaction, customer collaboration, customer commitment, decision time,
corporate culture, control, personal characteristics, societal culture, and training
and learning. Team distribution, team size, planning, technical competency and
communication and negation were not found to have a significant relationship with
success.
We also arrived at linear multiple regression models for the consolidated
dependent variable success, and the regression models for five measures of success
we considered in the study viz., reduced delivery schedule, increased return on
investment, increased ability to meet with current customer requirements,
increased flexibility to meet with changing customer requirements, and improved
business processes. The regression models are summarized below:
. log (Success) = .940 +0.044(Ind 13) + 0.031 (Ind 3) +.020(Ind 9) + .037(Ind 14)
• D1 = 2.343 + .255 (Indl3) + .197 (Indl4)
• log (D2) = .626 + .098 (Indl4) + .048 (Ind9) + .052 (Ind2)
. log (D3) = 1.232 + .036 (Ind3) + .038 (Ind7)
. D4 = 4.24 + .013 (Ind3)
• log (D5) = .722 + .079 (Ind4) + .052 (Ind7) + .033 (Ind3)
The interpretations of each of the variables used in the above equations can be
found in Appendix C.
• Determining the important changes required to be undergone for adopting agile
software development practices. Based on the results from this study, we observe
199
Reproduced with permission of the copyright owner. Further reproduction prohibited without permission.

that the respondents opined that the Changes in Management Style are the most
important (critical) changes required followed by Changes in Organization
Culture, Changes in Development Processes, and Changes in Knowledge
Management Strategies. Changes in Organization Culture and Changes in
Development Processes have similar level of importance according to the survey
results.
• Determining the important challenges/risks that should be faced for transitioning
their traditional software development practices to those advocated by the agile
philosophy. Based on the results from this study, we observe that the respondents
opined that the three most important (critical) challenges were Upper management
resistance, Resistance from developers, and Problems with geographically
distributed teams (Note: this observation is purely based on the relative ordering of
the mean values of the challenge items. Upper management resistance was found
out to have a statistically significantly greater mean value than the Resistance from
developers, whereas the mean value of Resistance from developers was not found
to have a statistically different mean of Problems with geographically distributed
teams).
• Determining additional success factors, changes, and challenges, if any. From the
responses obtained from the open-ended questions, we were successful in finding
additional success factor, and changes. N o significant challenge categories were
identified. Among others four seemingly important success factor dimensions have
emerged. They are: Learning from failure, Timing issues, Other team
200
Reproduced with permission of the copyright owner. Further reproduction prohibited without permission.

characteristics, and Use o f tools. Similarly, two seemingly important change
categories emerged. They are: Changes in customer attitude and Changes in
personal characteristics. The above items did not initially appear in our
hypothesized list of success factors, and changes. This is because we hypothesized
all the success factors, and changes based on our search of existing literature, and
our search of existing literature did not find sufficient evidences supporting the
consideration of such factors in the literature. This, however, does not indicate that
these newly suggested success factors or changes are not important. As the
identification of such success factors and changes is a complex problem guided by
several factors, we call for additional research to examine them.
8.3 Future Work
Many issues are worthy of detailed investigation in the future. Some of them are outlined
below:
1. Further research should be done to validate the results obtained from this study in
practice. Practitioners should attempt to use the results obtained in this study in
actual projects and test the degree of usefulness of the results in practice. This is
important because although the results obtained in this Thesis have been obtained
by statistically analyzing the responses from currently practicing agile software
professionals, unless they are deemed to be of use in practice, the research results
would be of limited use other than serving as an inspiration for future researchers
to conduct further research in this direction.
201
Reproduced with permission of the copyright owner. Further reproduction prohibited without permission.

2. Due to the nature of these studies, controlled experiments, where by one factor is
kept constant while varying others to different degrees, are difficult to conduct in
real-life projects. To overcome that it is suggested that computer-based simulation
studies should be performed to validate the results obtained from this study. Such
controlled experiments would be helpful to examine the detailed
behavior/characteristics of one particular issue.
3. In this Thesis, additional success factors, changes and challenges were suggested
by several respondents as a part of open-ended questions. Future work should
target empirically evaluate them.
4. In this Thesis, we have analyzed the consolidated data obtained from various
respondents of different continents around the world. It would be interesting to
conduct a detailed investigation of the transcontinental/cultural differences in the
success factors, critical changes, and critical challenges, because as we have seen
to some extent in this Thesis, agile software development is influenced by
behavioral/personal characteristics of respondents. Such an investigation would
require capturing not only the country/continent of origin of the respondent, but
also their places of work. There is a significant amount of complexity involved in
this kind of research, because in today’s global economy, organizations are
distributed throughout the world, many employees travel across continents, they
might have been educated/trained in one culture, but their work behavior has
changed over the years by working in different cultural environments. The
202
Reproduced with permission of the copyright owner. Further reproduction prohibited without permission.

investigation of this issue was scoped out of the Thesis. However, it is worth
investigating in the future.
5. Similar to the point mentioned above, whether the project size, project
complexity, or the organization size matters or not was scoped out from
investigation as part of this Thesis. While the value of such a work was
appreciable, it was felt that inclusion of such a research question would increase
the length of the already long questionnaire (it should be noted that many people
have commented critically about the size of the questionnaire). However, in this
Thesis, I have collected such information to get a statistic of the size/complexity
of the organizations/projects of the respondents of the survey. This was done with
the idea that these statistics would hopefully help us to get an insight about the
type of respondents of the survey whose responses have produced the results that
we have obtained. Whether project size, organization size, or project complexity
matters or not is a different question altogether from the ones that we investigated
in this Thesis. They are worth investigating in the future, but to draw firm, and
meaningful conclusions, one needs to do an in-depth study (a controlled
simulation study is suggested) by varying the above parameters, and framing all
the research questions accordingly.
6. In this Thesis, we have analyzed consolidated data obtained from all kinds of
sectors. It would be very interesting to investigate if there are any differences in
success factors, critical changes and critical challenges across different sectors.
Detailed studies, perhaps more appropriately detailed case studies, are required to
203
Reproduced with permission of the copyright owner. Further reproduction prohibited without permission.

be performed to draw any meaningful conclusions regarding this issue. We
encourage further work on this issue in the future.
7. We have analyzed data by assuming the data obtained across different work
functions are equally important. It would be quite interesting to investigate if at all
there will be any differences in the results based on the work functions of the
respondents.
8. The role of experience/competency in agile software development has been
debated in the literature. We have analyzed data assuming all levels of experience
equally important. It would be required to investigate if there are any differences
in the results based on the levels of experience. Detailed case studies are required
to draw any meaningful conclusions regarding such an issue.
9. It is important to investigate if there are any differences in the results obtained at
different levels of agility, i.e., organizations which are highly agile versus the
ones that are moderately agile or not much agile at all.
10. In this Thesis, we did not consider technical factors. We focused on management,
organizational, and people centric factors. The analysis of technical factors is a
substantial, important area that requires future attention in the future. This
requires the knowledge about software development, and can be best done in
conjunction with developers working on practical real-life projects.
11. The influence of type and complexity of projects should also be investigated.
Complexity has many dimensions such as technical and economic dimensions.
204
Reproduced with permission of the copyright owner. Further reproduction prohibited without permission.

12. It is necessary for conducting large-scale interviews. From our study we realized
that practitioners have a lot to say. Several new dimensions might pop up from
interviews, which were not evident as such through closed-ended survey
questionnaire administration.
13. In this Thesis we studied agile practices in general. The results obtained do not
provide an in-depth understanding of how they relate to the specific agile software
development methodologies such as Scrum, XP, and DSDM. It would be
interesting to study the success factors, changes, and challenges that particularly
concern the individual agile software development methodologies that are guided
by the agile principles mentioned in Chapter 2.
14. The nature of the research methodology we considered constrained us from
gaining useful environmental, and in-depth understanding of issue, which might
be possible through site visits of the individual respondents. Although such an
approach restricts the scalability of the study, they are helpful in gaining in-depth
understanding of issues. Since our research results in this Thesis provides an
exploratory level understanding of the success factors, changes, and challenges,
in-depth understanding of issues is called for.
205
Reproduced with permission of the copyright owner. Further reproduction prohibited without permission.

References
P. Abrahamson, O. Sallo and J. Ronkeinen. 2002. Agile software development methods
- review and analysis. VTT Publications 478.
http://www.inf.vtt.fi/pdf/publications/2002/P478.pdf (Last accessed: December 2005).
P. Abrahamson and J. Koskela. 2004. Extreme Programming: A Survey of Empirical
Data from a Controlled Case Study. Proceedings o f the 2004 International Symposium on
Empirical Software Engineering (ISESE’04). Redondo Beach, California, USA. pp. 73-
92.
W.R. Adrion. 1993. Research Methodology in Software Engineering. Summary of the
Dagstuhl Workshop on Future Directions in Software Engineering. ACM SIGSOFT
Software Engineering Notes. Vol. 18. No. 1. pp. 36-37.
S.W. Ambler. 2002a. Lessons in Agility from Internet-Based Development. IEEE
Software. March/April, pp. 66-73.
S.W. Ambler. 2002b. Agile Modeling. John Wiley & Sons.
S.W. Ambler. 2005a. Where is the Proof that Agile Methods Work. Online article that
can be found at http://www.agilemodeling.com/essays/proof.htm (Last accessed:
December 2005).
S.W. Ambler. 2005b. Communication on Agile Software Projects. Online article that
can be found at http://www.agilemodeling.com/essays/communication.htm (Last
accessed: December 2005).
206
Reproduced with permission of the copyright owner. Further reproduction prohibited without permission.

S.W. Ambler. 2005c. Remaining Agile. Online article that can be found at
http://www.agilemodeling.com/essays/remainingAgile.htm (Last accessed: December
2005).
S. Ambler. 2005d. Quality in an Agile World. Software Quality Professional. Vol. 7.
No. 4. pp. 34-40.
D. Anderson. 2002. Morning Roll Call, http://dn.codegear.com/article/29686 (Last
accessed: March 4, 2007).
D. J. Anderson. 2003. Agile Management for Software Engineering: Applying the
Theory o f Constraints for Business Results. Prentice Hall PTR, ISBN 0-13-142460-2.
P. Baheti, L. Williams, E. Gehringer, D. Stotts and J.M. Smith. 2002. Distributed Pair
Programming: Empirical Studies and Supportive Environments. Technical Report TR02-
010. Department of Computer Science. University of North Carolina at Chapel Hill.
March.
R. Balzer, T.E. Cheetham and C. Green. 1983. Software Technology in the 1990s:
Using a New Paradigm, Computer, November, pp. 39-45.
H. D. Bengington. 1956. Production of Large Computer Programs. Proceedings o f the
ONR Symposium on Advanced Programming Methods for Digital Computers, June, pp.
15-27.
B. Boehm. 1981. Software Engineering Economics. Prentice Hall.
B. W. Boehm. 1988. A Spiral Model of Software Development and Enhancement.
Computer, May, pp. 61-72.
207
Reproduced with permission of the copyright owner. Further reproduction prohibited without permission.

B. Boehm and R. Turner. 2003. Observations on Balancing Discipline and Agility.
Proceedings o f the Agile Development Conference (ADC’03). June. Salt Lake City, Utah,
USA.
B. Boehm and R. Turner. 2005. Management Challenges to Implementing Agile
Processes in Traditional Development Organizations. IEEE Software. September/October
2005, pp. 30-39.
L. Bossavit. 2002. The Unbearable Lightness of Programming: A Tale of Two
Cultures. Cutter IT Journal. Vol. 15, No. 9, pp. 5-11.
T.A. Boyle. 1999. Quality Management in the R&D Departments o f Quality Award
Winning Manufacturing Organizations. MMS Thesis. Eric Sprott School of Business.
Carleton University. Ottawa, Ontario, Canada.
T.A. Boyle. 2003. Organizational Diffusion of Integrated Product Developmebt:
Determinants and Performance Consequences. PhD Thesis. Eric Sprott School of
Business. Carleton University. Ottawa, Ontario, Canada.
A. Chems. 1976. The Principles of Sociotechnical Design. Human Relations. Vol.2.
No. 9. pp 783-792.
C. W. Clegg. 2000. Sociotechnical Principles for Systems Design. Applied
Ergonomics. Vol. 31. pp 463-477.
V.T. Clover and H.L. Balsley. 1979. Business Research Methods. 2nd Edn. Grid
Publishing, Inc. Columbus, Ohio.
A. Cockbum. 2001. Agile Software Development. Addison-Wesley, 1st Edition.
208
Reproduced with permission of the copyright owner. Further reproduction prohibited without permission.

A. Cockbum and J. Highsmith. 2001. Agile Software Development: The People Factor.
Software Management. November, pp. 131-133.
A. Cockbum. 2002a. Learning From Agile Software Development - Part One.
CrossTalk: Journal o f Defense Software Engineering. October.
http://www.stsc.hill.af.mil/crosstalk/2002/10/cockbum.html
A. Cockbum. 2002b. Learning From Agile Software Development - Part Two.
CrossTalk: Journal o f Defense Software Engineering. November, pp. 9-12.
M. Cohn and D. Ford. 2003. Introducing an Agile Process to an Organization. IEEE
Computer. June. pp. 74-78.
L. Copeland. 2001. Developers Approach Extreme Programming with Caution.
Computerworld. October 22.
http://www.cornputerworld.eom/industrytopics/automotive/story/0,10801,64957,00.html
(Last accessed: March 4, 2007).
J.W. Creswell. 2003. Research Design: Qualitative, Quantitative, and Mixed Methods
Approaches. Sage Publications. USA.
L. Crispin. 2005. User Customer Tests to Drive Development.
http://www.methodsandtools.com/archive/archive.php?id=23 (Last accessed: March 5,
2007).
R. Deias, G. Mugheddo and O. Murro. 2002. Introducing Agile in a Startup.
http://www.agilealliance.org/system/article/file/873/file.pdf (Last accessed: March 4,
2007).
2 0 9
Reproduced with permission of the copyright owner. Further reproduction prohibited without permission.

W.H. Delone and E.R. McLean. 1992. Information Systems Success: The Quest for
the Dependent Variable. Information Systems Research, Vol. 3, No. 1, pp. 60-95.
W.H. Delone and E.R. McLean. 2003. The DeLone and McLean Model of Information
Systems Success: A Ten Year Update. Journal o f Management Information Systems. Vol.
19, No. 4, pp. 9-30.
A. v. Deursen. 2001. Customer Involvement in Extreme Programming.
http://homepages.cwi.nl/~arie/wci2001/wci-report.pdf (Last accessed: March 5, 2007)
T. Dingsoyr and G.K. Hansen. 2004. Extending Agile Methods: Postmortem Reviews
as Extended Feedback. Lecture Notes in Computer Science. Vol. 2630. pp. 4-12.
J. Drobka, D. Noftz and R. Raghu. 2004. Piloting XP on Four Mission-Critical
Projects. IEEE Software. November/December. pp70-75.
T. Dyba. 2000. Improvisation In Small Software Organizations. IEEE Software. Vol.
17. No. 5. pp. 82-87.
K. El Emam. 2004. The ROI from Software Quality: An Executive Briefing. 3rd Edn.,
Ottawa Software Quality Association. ISBN 0-9734744-0-8.
A. Elssamadisy. 2001. XP on a Large Project - A Developer’s View.
http://www.xpuniverse.com/2001/pdfs/EP202.pdf (Last accessed: December 2005).
eWorkshop. 2002. Summary of the First eWorkshop on Agile Methods. http://fc-
md.umd.edu/projects/Agile/Summary/SummaryPF.htm. April.
210
Reproduced with permission of the copyright owner. Further reproduction prohibited without permission.

C. Farrell, R. Narang, S. Kapitan and H. Webber. 2002. Towards an Effective Onsite
Customer Practice, http://www.agilealliance.org/system/article/file/1014/file.pdf (Last
accessed: March 5, 2007).
M. Fowler and J. Highsmith. 2001. The Agile Manifesto. Software Development
Magazine. August. http://www.sdmagazine.com/documents/s=844/sdm0108a/0108a.htm
(Last accessed: December 2005).
M. Fowler. 2002. The Agile Manifesto: Where It Came From and Where It May Go.
http://martinfowler.com/articles/agileStory.html (Last accessed: December 2005).
M. Fowler. 2006. Using an Agile Software Development Process with Offshore
Development. http://www.martinfowler.com/articles/agileOffshore.html (Last accessed:
March 4, 2007).
J. Gawlas. 2003. Mission-Critical Development with XP & Agile Processes. Dr.
Dobb’s Journal. December Issue, http://www.ddj.com/184405520 (Last accessed: March
4, 2007).
L. Geeck. 2005. Offshore Improvements. Software Development Magazine. May.
http://www.sdmagazine.com/documents/s=9693/sdm0505g/sdm0505g.html (Last
accessed: December 2005).
R. Gittins, S. Hope and I. Williams. 2001. Qualitative Studies of XP in a Medium
Sized Business. Proceedings o f the 2nd International Conference on Extreme
Programming and Flexible Processes in Software Engineering. Sardina, Italy. May.
E. M. Goldratt. 1990. What is this thing called Theory o f Constraints and how should it
be implemented? North River Press, Great Barrington, MA, USA. ISBN 0-88427-166-8.
211
Reproduced with permission of the copyright owner. Further reproduction prohibited without permission.

E. M. Goldratt. 1998. Essays on the Theory o f Constraints. North River Press, Great
Barrington, MA, USA. ISBN 0-88427-159-5.
A. Gopal, M.S. Krishnan, T. Mukhopadhyay and D.R. Goldenson. 2002. Measurement
Programs in Software Development: Determinants of Success. IEEE Transactions on
Software Engineering. Vol. 28. No. 9. pp. 863-875
L.A. Graffin. 2001. A Customer Experience: Implementing XP.
http://www.agilealliance.org/system/article/file/930/file.pdf (Last accessed: March 4,
2007).
N.B. Harrison. 2003. A Study of Extreme Programming in a Large Company.
http://www.agilealliance.org/system/article/file/1292/file.pdf (Last accessed: March 4,
2007).
J. Highsmith. 2000. Retiring Lifecycle Dinosaurs. Software Testing and Quality
Engineering Magazine. http://www.jimhighsmith.com/articles/Dinosaurs.pdf (Last
accessed: December 2005).
J. Highsmith. 2004. Agile Project Management. Addison Wesley.
A. Irons. 2006. Agile Methods Silver Bullet or Red Herring. Northumbria University.
UK. An online document that can be found at
http://www.newcastle.bcs.org/BCS%20Agile%20methods.ppt (Last accessed: July 2006)
[The year 2006 mentioned in this reference corresponds to the year of last access of this
online document. The year of publication of this document is unknown].
212
Reproduced with permission of the copyright owner. Further reproduction prohibited without permission.

O. Jensen. 2002. Time Constrained Requirements Engineering - The Cooperative
Way. http://www.agilealliance.org/system/article/file/913/file.pdf (Last accessed: March
4, 2007).
J. Kalermo and J. Rissanen. 2002. Agile Software Development in Theory and Practice.
Master’s Thesis, Department of Computer Science and Information Systems. University
of Jyvaskyla. Finland.
E. Karahanna, D.W. Straub, N. L. Chervany. 1999. Information Technology Adoption
Across Time: A Cross-Sectional Comparison of Pre-Adoption and Post-Adoption Beliefs.
MIS Quarterly. Vol. 23. No. 2. pp. 183-213.
E. R. Keith. 2002. Agile Software Development Processes: A Different Approach to
Software Design, http://www.agilealliance.com/articles/keitheveretteragileso/file (Last
accessed: December, 2005).
N. Kini and S. Collins. 2003. Steering the Car: Lessons Learned from an Outsourced
XP Project. http://www.xpuniverse.com/2001/pdfs/XPU03.pdf (Last accessed: December
2005).
J. Kontio. Software Engineering Risk Management: A Method, Improvement
Framework, and Empirical Evaluation. Doctoral Dissertation. Department of Computer
Science and Engineering, Helsinki University of Technology, Finland.
U. Kumar, M. Maheshwari and V. Kumar. 2004. A Framework for Achieving E-
business Success. Journal o f Industry and Higher Education. Vol. 18, No. 1, pp. 47-51.
213
Reproduced with permission of the copyright owner. Further reproduction prohibited without permission.
C. Larman. 2004. Agile & Iterative Development: A Manager’s Guide. Addison-
Wesley.
M. Lazaro and E. Marcos. 2005. Research in Software Engineering: Paradigms and
Methods. Proceedings o f the First International Workshop on Philosophical Foundations
of Information Systems Engineering. Porto, Portugal. June.
M. Lindvall, V. Basili, B. Boehm, P. Costa, K. Dangle, F. Shull, R. Tesoriero, L.
Williams and M. Zelkowitz. 2002. Empirical Findings in Agile Methods. Proceedings of
Extreme Programming and Agile Methods - XP/Agile Universe 2002, pp. 197-207.
A. Mahanti. 2006. Challenges in Enterprise Adoption of Agile Methods - A Survey.
Journal o f Computing and Information Technology, Vol. 14, No. 3, pp. pp. 197-206.
B. Maheshwari, V. Kumar and U. Kumar. 2006. Optimizing Success in Supply Chain
Partnerships. Journal o f Enterprise Information Management, Vol. 19, No. 3, pp. 277-
291.
M. Maheshwari. 2002. Critical Success Factors o f E-Business: An Empirical Study.
M.B.A. Thesis. Eric Sprott School of Business. Carleton University, Ottawa, Ontario,
Canada.
D. D. McCracken and M. A. Jackson. 1982. Life-Cycle Concept Considered Harmful.
ACM Software Engineering Notes, April, pp. 29-32.
P.E. McMahon. 2004. Bridging A gile and Traditional Development Methods: A
Project Management Perspective. CrossTalk: The Journal o f Defense Software
214
Reproduced with permission of the copyright owner. Further reproduction prohibited without permission.

Engineering. May. http://www. stsc. hill. af. mil/crosstalk/2004/05/0405McMahon. html
(Last accessed: December 2005).
S. Nerur, R. Mahapatra and G. Mangalaraj. 2005. Challenges of Migrating to Agile
Methodologies. Communications o f the ACM. Vol. 48, No. 5, May, pp. 73-78.
Net Worth Consulting. 2004. Time/Cost/Quality Trade-offs in the Budget Process.
Quantum White Paper 10.25.04. Leadership Series: Measurement.
http://quantum.dialog.com/q2_resources/whitepapers/budget_process.pdf (Last accessed:
December 2005).
W.L. Newman. 2005. Social Research Methods: Quantitative and Qualitative
Approaches. Allyn & Bacon.
Nucleus Research. 2002. Measuring Return on Investment Quick Reference Guide.
Research Note B20. http://www.nucleusresearch.com/research/b20.pdf (Last accessed:
August 11, 2006).
D. Opperthauser. 2003. Defect Management in an Agile Development Environment.
CrossTalk: The Journal o f Defense Software Engineering. September.
http://www.stsc.hill.af.mil/crosstalk/2003/09/03090pperthauser.html (Last accessed:
December 2005).
OST. 1. Open Systems Theory.
http://en.wikibooks.org/wiki/Systems_Theory/Open/Closed_System_Structure
OST. 2. Open Systems Theory. http://faculty.ncwc.edu/TOConnor/417/4171ect01.htm
215
Reproduced with permission of the copyright owner. Further reproduction prohibited without permission.

F. Paetsch, A. Eberlin and F. Maurer. 2003. Requirements Engineering and Agile
Software Development. Proceedings o f the 12th International Workshops on Enabling
Technologies: Infrastructure for Collaborative Enterprises (WETICE’03). Austria.
A. Parrish, R. Smith, D. Hale and J. Hale. 2004. A Field Study of Developer Pairs:
Productivity Impacts and Implications. IEEE Software. Vol. 21. No. 5. pp. 76-79.
S.M. Pine. 2001. An Application of XP in a Multiple Team/Multi-Process
Environment, http://www.agilealliance.com/articles/pinestephenmanapplica/file (Last
accessed: December 2005).
A.N.S. Persaud. 1999. Synergistic Innovations in Internationally Dispersed R&D Labs.
PhD Thesis. Eric Sprott School of Business. Carleton University. Ottawa, Ontario,
Canada.
S.L. Pfleeger. 1995. Experimental Design and Analysis in Software Engineering.
Annals o f Software Engineering. Vol. 1. pp. 219-253.
S.M. Pine. 2001. Application of XP in a Multiple Team/Multi Process Environment.
http://www.agilealliance.org/system/article/file/1000/file.pdf (Last accessed: March 4,
2007).
M. Poppendieck and T. Poppendieck. 2003. Lean Software Development: An Agile
Toolkit. Addison-Wesley.
D.J. Power, A.S. Sohal and S.U. Rahman. 2001. Critical Success Factors in Agile
Supply Chain Management: An Empirical Study. International Journal o f Physical
Distribution & Logistics Management. Vol. 31. No. 4. pp. 247-265.
216
Reproduced with permission of the copyright owner. Further reproduction prohibited without permission.
PMI. 2004. Project Management Body o f Knowledge (PMBOK). 3rd Edition. Project
Management Institute. USA.
J. Rasmusson. 2003. Introducing XP into Greenfield Projects: Lessons Learned. IEEE
Software, March/April Issue.
http://www.computer.Org/portal/site/software//homepage/2003/s3ras.htm (Last accessed:
March 4, 2007).
D J. Reifer. 2002. How Good Are Agile Methods? IEEE Software. July/August, pp. 14-
17.
W. W. Royce. 1987. Managing the Development of Large Software Systems: Concepts
and Techniques, Proceedings of Wescon, August. (Also available in Proceedings of
ICSE9, IEEE Computer Society Press, 1987).
B. Rumpe and A. Schroder. 2002. Quantitative Survey on Extreme Programming
Projects. Proceedings o f International Conference on Extreme Programming and
Flexible Processes in Software Engineering (XP2002). Alghero. Italy. May. pp. 95-100.
B. Schatz, K. Schwaber and R.C. Martin. 2004. Best Practices in Scrum Project
Management and XP Agile Software Development. White Paper. Object Mentor, Inc.
http://www.objectmentor.com/resources/articles/Primavera. July.
K. Schwaber and M. Beedle. 2002. Agile Software Development with Scrum. Prentice
Hall, New Jersey, USA.
K. Schwaber. 2004. Agile Project Management with Scrum. Microsoft Press,
Redmond, Washington, USA.
217
Reproduced with permission of the copyright owner. Further reproduction prohibited without permission.

Shine Technologies. 2003. Agile Methodologies: Survey Results. Shine Technologies
Pty Ltd. http://www.shinetech.com (Last accessed: December 2005).
G. Sieve and R. Gioia. Agile Before Agile Was Cool. 2002. Agile Before Agile Was
Cool. CrossTalk: The Journal o f Defense Software Engineering. October.
http://www.stsc.hill.af.mil/crosstalk/2002/10/sleve.html (Last accessed: December 2005).
P.G. Smith and R. Pichler. 2005. Agile Risks, Agile Rewards. Software Development
Magazine. April, pp. 50-53.
M.R. Spiegel and L.J. Stephens. 1998. Theory and Problems o f Statistics. 3rd Edn.
McGraw Hill, Schaum’s Outline Series.
SST. 1. Sociotechnical Systems Theory.
http://en.wikipedia.org/wiki/Sociotechnical_systems_theory
M. Stephens and D. Rosenberg. 2003. Extreme Programming Refactored: The Case
Against XP. Apress L.P., Berkeley, California.
J. Stevens. 1996. Applied Multivariate Statistics for the Social Sciences. Lawrence
Erblaum Associates, Hillsdale, NJ.
L. Thorup and O. Jepsen. 2003. Report on XP Workshop at JAOO 2003 - Improving
Customer Developer Collaboration.
http://www.agilealliance.org/article/articles_by_category/19
TOC. 1. Theory o f Constraints and Agile Software Development.
http://theagileblog.net/2006/03/theory_of_constraints_and_agil_l.html
TOC. 2. Theory o f Constraints. http://en.wikipedia.org/wiki/Theory_of_constraints
218
Reproduced with permission of the copyright owner. Further reproduction prohibited without permission.

J.-P. Tolvanen. 1998. Incremental Method Engineering With Modeling Tools:
Theoretical Principles and Empirical Evidence. Doctoral Dissertation. University of
Jyvaskyla, Jyvaskyla.
D. Turk, R. France and B. Rumpe. 2002. Limitations of Agile Software Processes. In
the Proceedings o f the 3rd International Conference on Extreme Programming and Agile
Processes in Software Engineering. Sardinia. Italy.
R. Turner and B. Boehm. 2003. People Factors in Software Management: Lessons
From Comparing Agile and Plan Driven Methods. CrossTalk: The Journal o f Defense
Software Engineering. December, pp. 4-8.
L. Williams and R. Kessler. 2002. Overcoming Management Resistance to Pair
Programming. Chapter 4 in Pair Programming Illuminated. Addison Wesley
Professional. 1st Edition.
M.V. Zelkowitz and D.R. Wallace. 1998. Experimental Models for Validating
Technology. IEEE Computer. Vol. 31. No. 5. pp. 23-31.
219
Reproduced with permission of the copyright owner. Further reproduction prohibited without permission.

Appendix ACovering Letters
A.1. Letter IMain letter accompanying the survey questionnaires sent by post
Dear Sir/Madam:
Let me at first introduce myself. My name is Subhas C. Misra. I am a PhD degree candidate in the Eric Sprott School of Business, Carleton University, Ottawa, Ontario, Canada. As part of my Thesis, I am conducting a survey on Agile Software Development (ASD) practices. Specifically, I am trying to assess the success factors of projects from the perspective of ASD practitioners, the important changes required and the challenges involved in adopting these practices.
I would be extremely grateful if you would kindly help me in my research pursuits by completing the attached questionnaire. You have been particularly selected to fill out this questionnaire because we felt that you are knowledgeable about and/or experienced working with some or all of the ASD principles. Please note that the questionnaire is designed in such a way that you might be able to fill it out, even if that is strictly not the case. This questionnaire may be completed by any software practitioner, e.g., director, senior manager, manager, architect, team leader, developer, tester, who has experience practicing software development using both plan-driven (traditional) and agile approaches and methodologies.
All your responses will be kept strictly confidential. The results of the study will be aggregated and/or reported in such a way that no single person, project team, or organization is identified. All data collected from this survey would be stored in a password protected personal computer and would be destroyed on completion of this research project. Thus, we do not see any risk to you or your company if you complete this questionnaire. Once again, your response will significantly help me in completing my PhD degree successfully in time. In addition, by responding to the questionnaire you will be joining me in attempting to benefit the global community of software practitioners by providing an improved understanding of ASD practices. You can also benefit from receiving a complimentary copy of the research report upon request.
Should you be interested in further information about this study, please feel free to contact me at [email protected] or my supervisor, Professor Vinod Kumar, at vinod [email protected] (Telephone: 613-520-2379). Please also feel free to let me know if you are interested in knowing the final results of the study.
Finally, thank you very much in taking your valuable time considering responding to the enclosed questionnaire. Your input is very much appreciated.
Sincerely yours,
Subhas C. Misra, Ph.D. Student Eric Sprott School of Business Carleton University 1125 Colonel By Drive Ottawa, Ontario, K1S 5B6, CANADA E-mail: [email protected]
220
Reproduced with permission of the copyright owner. Further reproduction prohibited without permission.

A.2. Letter II
Forwarding letter sent to the human resource departments of the Agile Corporate MemberOrganizations
Dear Sir/Madam,
Let me at first introduce myself. My name is Subhas C. Misra. I am a PhD student in the Eric Sprott School of Business, Carleton University, Ottawa, Ontario, Canada. As part of my Thesis, I am conducting a survey on Agile Software Development (ASD) practices. Specifically, I am trying to assess the factors that will influence the success of projects that want to adopt ASD practices, the important changes required, and the challenges involved in adopting these practices.
I am contacting you because your organization is listed as a corporate member of the Agile Alliance (http://www.agilealliance.org/agiledevelopment/portal_url/corporatemembers). There are 5 survey questionnaire booklets enclosed along with this letter. Could you kindly forward each of the 5 attached questionnaires to 5 different software practitioners (preferably belonging to different teams) in your organization?
The questionnaires may be completed by any software practitioner, e.g., director, senior manager, manager, architect, team leader, developer, tester, who has experience practicing software development using both plan-driven (traditional) and agile approaches and methodologies.
All the responses from the survey will be kept strictly confidential. The results of the study will be aggregated and/or reported in such a way that no single person, project team, or organization is identified. All data collected from this survey would be stored in a password protected personal computer and would be destroyed on completion of this research project. Thus, we do not see any risk to you or your company if you forward this questionnaire.
Once again, your help in forwarding this survey questionnaire to the above mentioned software development teams will significantly help me in completing mv PhD degree successfully in time. In addition, by responding to the questionnaire your organization’s software development teams will be joining me in attempting to benefit the global community of software practitioners an improved understanding of ASD practices. The survey respondents may also benefit from receiving a complimentary copy of the research report upon request.
Should you be interested in further information about this study, please feel free to contact me at [email protected] or my supervisor, Professor Vinod Kumar, at [email protected]. Please also feel free to let me know if you are interested in knowing the final results of the study.
Finally, thank you very much in taking your valuable time considering helping me in my research pursuits.
Sincerely,
Subhas C. Misra
221
Reproduced with permission of the copyright owner. Further reproduction prohibited without permission.
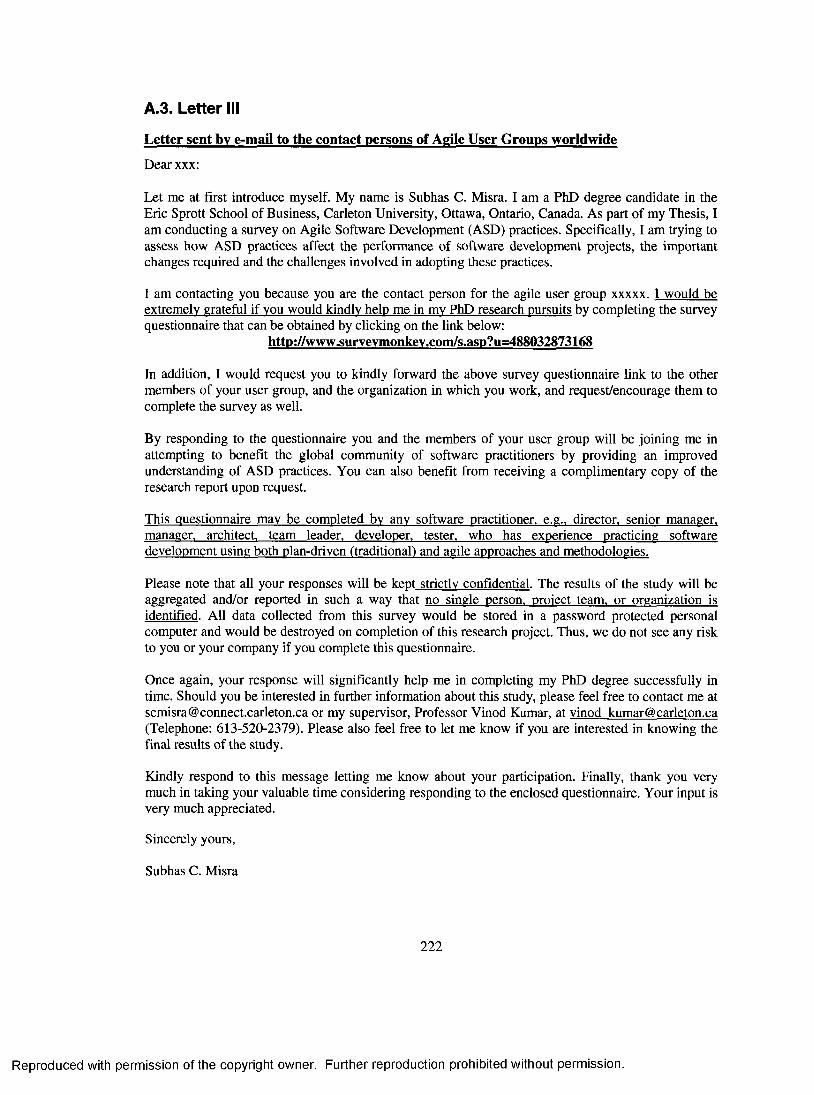
A.3. Letter III
Letter sent by e-mail to the contact persons of Agile User Groups worldwideDear xxx:
Let me at first introduce myself. My name is Subhas C. Misra. I am a PhD degree candidate in the Eric Sprott School of Business, Carleton University, Ottawa, Ontario, Canada. As part of my Thesis, I am conducting a survey on Agile Software Development (ASD) practices. Specifically, I am trying to assess how ASD practices affect the performance of software development projects, the important changes required and the challenges involved in adopting these practices.
I am contacting you because you are the contact person for the agile user group xxxxx. I would be extremely grateful if you would kindly help me in mv PhD research pursuits by completing the survey questionnaire that can be obtained by clicking on the link below:
http://www.survevmonkev.com/s.asp?u=488032873168
In addition, I would request you to kindly forward the above survey questionnaire link to the other members of your user group, and the organization in which you work, and request/encourage them to complete the survey as well.
By responding to the questionnaire you and the members of your user group will be joining me in attempting to benefit the global community of software practitioners by providing an improved understanding of ASD practices. You can also benefit from receiving a complimentary copy of the research report upon request.
This Questionnaire may be completed by any software practitioner, e.g.. director, senior manager, manager, architect, team leader, developer, tester, who has experience practicing software development using both plan-driven (traditional) and agile approaches and methodologies.
Please note that all your responses will be kept strictly confidential. The results of the study will be aggregated and/or reported in such a way that no single person, project team, or organization is identified. All data collected from this survey would be stored in a password protected personal computer and would be destroyed on completion of this research project. Thus, we do not see any risk to you or your company if you complete this questionnaire.
Once again, your response will significantly help me in completing my PhD degree successfully in time. Should you be interested in further information about this study, please feel free to contact me at [email protected] or my supervisor, Professor Vinod Kumar, at vinod [email protected] (Telephone: 613-520-2379). Please also feel free to let me know if you are interested in knowing the final results of the study.
Kindly respond to this message letting me know about your participation. Finally, thank you very much in taking your valuable time considering responding to the enclosed questionnaire. Your input is very much appreciated.
Sincerely yours,
Subhas C. Misra
222
Reproduced with permission of the copyright owner. Further reproduction prohibited without permission.

Appendix B
Survey Questionnaire
Respondent's Background Information
Response Choices( M a r k 'X ')
P r im a ry identity o f o u r o rg a n iz a tio n C o m p u te r re la ted (IS /M IS /D P/H ardw are/Softw are)T eleco m m u n icatio n sBankinci/insuranceR eal E s ta teB u s in e ss su p p lie s /se rv icesE d u ca tio n /re searchE nterta inm ent/m edia/publish ingHospitalityM edical/health c a reG o v ern m en tEngineerinq/constructionConsultinqLegal s e rv ic esM anufacturing/distributionC o n su m e r retail/w holesaleN on-profit/m em bership organizationElectrical m ach in esA e ro sp a ceO ther. (P le a s e specifv: \
T h e n u m b e r o f e m p lo y e e s in o u r organization is L e ss th an 1010-2021-4041-1 0 0101-5005 01-1000G re a te r th a n 1000
T h e n u m b e r o f e m p lo y e e s in o u r team is L e ss th an 55 -1011-2021-40G re a te r th an 40
M y role in t h e te a m : Functional M anaqerP ro jec t M anaqerT e a m L ead erD eveloper/T este rO ther. (P le a se specifv: 1
1 h a v e b e c o m e knowledgeable a b o u t a g ile s o f tw a r e d e v e lo p m e n t p r a c t ic e s fo r: L ess th an 1 vear
1 -3 v e a rs3-5 v e a rsG re a te r th an 5 v e a rs
1 h a v e b e e n developing software u s in g a g ile p r in c ip le s /m e th o d s fo r: L e ss th an 1 vear
1-3 v e a rs3 -5 v e a rsG re a te r th a n 5 v e a rs
223
Reproduced with permission of the copyright owner. Further reproduction prohibited without permission.

The checklist below will help in assessing the degree of practice of agile software development principles by your team. It contains 12 statements. For each of the principles, please mark in the scale of 1 (disagree) to 5 (strongly agree) your degree of practice of each of the principles.
Checklist
R esponse
We practice th is principle
StronglyDisagree
SomewhatDisagree
Neither Disagree nor Agree
SomewhatAgree
StronglyAgree
Not Applicable
or Don't know (XI
1 2 3 4 5
1W e give high priority to satisfying custom ers through early and continuous delivery of valuable software. X
2 W e welcome changing requirem ents, even late during development. X
3W e deliver working software m ore frequently, from couple of w eeks to a couple of m onths, with a preference to a shorter tim escale X
4 Our b usiness people and developers work together daily (very closely) throughout the project
X
5 W e build projects around motivated individuals. W e give them the environment and support they need, and trust them to qet the job done.
X
6W e em phsize m ore on face-to-face communication for conveying information to and within the developm ent team . X
7 W e m easure and track progress based on working software. X
8W e promote sustainable developm ent. Our sponsors, developers, and users maintain a constant pace indefinitely. X
9Our software developm ent project team follows continuous attention to technical excellence and aood design for developm ent. X
10W e practice sim ple designs, p rocesses, and approaches in our software developm ent m ethodologies. W e implement features that are required by the custom ers -- nothing more.
X
11Our developm ent team s a re self-organizing -- our team s can (re)- organize continuously in different configurations to m eet the changing requirem ents and the newly arising challenges of the business.
X
12At regular intervals, our team reflects on how to becom e m ore effective, then tunes and adjusts its behaviour accordingly. X
Success Factors SurveyPlease Indicate your level of agreement of the following statem ents based on your experience of agile software development practices in your team within your organization. Please mark your choice on a scale of 1 to 5, where 1 is 'Strongly Disagree', and 5 is "Strongly Agree". Your replies should reflect your best guess from your knowledge and experience of software development projects performed by your team in your organization.
StronglyDisagree
SomewhatDisagree
Neither Disagree
nor Agree
SomewhatAgree
StronglyAgree
Not Applicable
or Don'tCustomer SatisfactionIn our projects, we give very high priority to achieving customer satisfaction. 1 2 3 4 5 X
Customer CollaborationIn our projects, customers closely collaborate with the development team members. 1 2 3 4 5 X
Customer CommitmentIn our software development projects, customers are commited to the project, i.e., they are motivated, active, and consider themselves to be responsible elements of the project.
1 2 3 4 5 X
Decision TimeW e s tr iv e to m a k e im p o r ta n t p r o je c t d e c i s io n s rap id ly w ith in s h o r t t im e f r a m e s . 1 2 3 4 5 X
224
Reproduced with permission of the copyright owner. Further reproduction prohibited without permission.

Team DistributionThe members in our team are geographically closely located. 1 2 3 4 5 X
The other teams that we interact with within or outside our organization are geographically closely located to ours.
1 2 3 4 5 X
Team sizeW e work in small team s (no more than 20-40 members) in our projects. 1 2 3 4 5 X
Corporate cultureOur organization encourages rapid communication. 1 2 3 4 5 XOur organization has the culture for trusting people. 1 2 3 4 5 XOur management has the culture for supporting the decisions of the developers. 1 2 3 4 5 X
Our organizational culture is customer centric. 1 2 3 4 5 XOur organization encourages fast feedback from customers 1 2 3 4 5 X
Our organization encourages changing requirements. 1 2 3 4 5 XOur organization does not have a bureaucratic management structure. 1 2 3 4 5 X
Our management, developers, and testers are in total agreem ent to use agile practices. 1 2 3 4 5 X
PlanningOur software development team relies on internalized, informal, undocumented plans (as against formal documented plans).
1 2 3 4 5 X
ControlOur software development team has qualitative control (as against quantitative performance measures). 1 2 3 4 5 X
Technical competencyOur team generally consists of technically competent and experienced people (who have developed alike software in the past, have practical experience of the technology domain).
1 2 3 4 5 X
Personal characteristicsThe majority of our team members have strong interpersonal and communication skills. 1 2 3 4 5 X
The majority of the members of our team consists of people who are honest. 1 2 3 4 5 X
The majority of the members of our team consists of people who are motivated. 1 2 3 4 5 X
The majority of the members of our team consists of people who have collaborative attitude. 1 2 3 4 5 X
The majority of the members of our team consists of people who are have sense of responsibility. 1 2 3 4 5 X
The majority of the members of our team consists of people who have readiness to learn. 1 2 3 4 5 X
225
Reproduced with permission of the copyright owner. Further reproduction prohibited without permission.

Communication and NegotiationOur projects have mechanisms that enable personnel to communicate and negotiate quickly and effectively with developers, operations, support, customers, management, and business areas.
1 2 3 4 5 X
In most cases, communication and negotiation in our projects are face-to-face. 1 2 3 4 5 X
In most cases, communication and negotiation in our projects happen between people who are physically close to one another.
1 2 3 4 5 X
In most cases, communication and negotiation in our projects happen between people who work in the same (similar) time zone as ours.
1 2 3 4 5 X
Most people in our projects are amicable to each other to such an extent that they communicate with each other with trust and good will.
1 2 3 4 5 X
Societal CultureThe people of our country are in general communicative. 1 2 3 4 5 X
The people of our country are in general dynamic. 1 2 3 4 5 XThe people of our country in general have progressive attitude. 1 2 3 4 5 X
The majority of the members of our team have similar social culture, even though they might be belonging to different nationalities and provinces.
1 2 3 4 5 X
Training and LearningOur team members are in general always willing to continuously learn from one another and train them through mentoring and professionally guided discussions than through formal training.
1 2 3 4 5 X
You are invited to specify any additional factors that you believe impact the success of agile software development projects. Please rate your responses on a scale of 1 to 5.
StronglyBelieve
SomewhatBelieve
Neutral Don'tStrongly
Disbelieve
StronglyDisbelieve
Other factors
1.1 2 3 4 5
2.1 2 3 4 5
3.1 2 3 4 5
4.1 2 3 4 5
5.1 2 3 4 5
226
Reproduced with permission of the copyright owner. Further reproduction prohibited without permission.

Please rate, on a scale of 1 to 5, your assessm ent of the degree of impact of practicing agile software development in your projects.______________________________________________________________________________________________________
StronglyDisagree
SomewhatDisagree
Neither Disagree nor Agree
SomewhatAgree
StronglyAgree
Not Applicable
or Don't know (X)
Reduced delivery schedules. 1 2 3 4 5 X
Increased return on investment (ROI). 1 2 3 4 5 XIncreased ability to meet with the current customer requirements. 1 2 3 4 5
X
Increased flexibility to meet with the changing customer requirements. 1 2 3 4 5
X
Improved business processes. 1 2 3 4 5 X
Changes and Challenges Survey
T h e in fo rm a tio n c o lle c te d f ro m th e s u r v e y q u e s t i o n s b e lo w w ill e n a b le u s t o e n h a n c e o u r u n d e r s t a n d in g o f t h e c r i t ic a l c h a n g e s r e q u i r e d a n d t h e c h a l l e n g e s / r i s k s in v o lv e d in in tro d u c in g a g ile s o f tw a r e d e v e lo p m e n t p r a c t ic e s in o rg a n iz a t io n s p ra c t ic in g p la n -d r iv e n ( tr a d it io n a l) s o f tw a r e d e v e lo p m e n t m e th o d o lo g ie s .
ICHANGES REQUIRED ~]
A c c o rd in g t o y o u r v iew , a r e t h e fo llo w in g c h a n g e s r e q u i r e d fo r a d o p t in g a g ile s o f tw a r e d e v e lo p m e n t p r a c t ic e s in o r g a n iz a t io n s p ra c t ic in g tra d i t io n a l , p la n d r iv e n s o f tw a r e d e v e lo p m e n t m e th o d o lo g ie s ? P l e a s e r a n k t h e d e g r e e o f im p o r ta n c e o f e a c h .
N o t a t all Im p o r ta n t
S o m e w h a tU n im p o rta n t
N e u tra l S o m e w h a tIm p o r ta n t
V eryIm p o r ta n t
C a n 't s a y
C h a n g e s in o r g a n iz a t io n a l c u ltu r e (F ro m P la n D riv en t o A gile)
From policy a n d p ro c e d u re b a s e d d e v e lo p m en t cu ltu re to f reed o m of d e v e lo p m e n t a n d m a n a g e m e n t by tea m m em b e rs . 1 2 3 4 5 X
From individually a s s ig n e d ro le s to th a t of team -w o rk . 1 2 3 4 5 X
From solitary d e v e lo p m en t a tti tu d e s of te a m m e m b e rs to th a t of w orking in te a m s . 1 2 3 4 5 X
From no tech n ica l a n d in te rp erso n a l c o m p e te n cy req u irem e n ts in te a m com position to es tab lish in g a m inim um s e t of c o m p e te n cy req u irem e n ts of te a m m em b e rs .
1 2 3 4 5 X
From n o n -cu s to m er-cen tric to cu sto m e r-c en tr ic d ev e lo p m en t. 1 2 3 4 5 X
C h a n g e s in m a n a g e m e n t s ty l e (F ro m P la n D riv en t o A gile)
From co m m an d -an d -co n tro l m a n a g e m e n t to lead e rsh ip -an d - co llaboration . 1 2 3 4 5 X
From au thorita tive to co llab o ra tiv e a n d pluralistic d ec is io n m ak ing (i.e., w h ere all th e d ev e lo p m e n t te a m m e m b e rs a r e g iven sufficient im p o rtan ce in dec is io n m aking)
1 2 3 4 5 X
C h a n g e s in k n o w le d g e m a n a g e m e n t s t r a te g y (F ro m P la n D riv en t o A gile)From h eav y d o c u m e n ta tio n -b a se d to tac it (not sp o k e n ) k n o w led g e m an a g e m en t. 1 2 3 4 5 X
C h a n g e s in d e v e lo p m e n t p r o c e s s e s (F ro m P la n D riv en to A gile)From heavily p ro c e s s -c e n tric to sh o rt, iterative, te s t-d riv en , a n d p eo p le -cen tric d e v e lo p m en t. 1 2 3 4 5 X
From s ta n d a rd s co m p lian c e a n d m e a s u re m e n t driven d e v e lo p m en t to d e v e lo p m e n t u n d e r uncerta in ty . 1 2 3 4 5 X
From co n trac t-co m p lian t to ch a n g e -to le ra n t d ev e lo p m en t.1 2 3 4 5 X
F rom lifecy c le -b ased d e v e lo p m e n t to f ea tu re -d riv en evolu tionary a n d iterative d ev e lo p m en t. 1 2 3 4 5 X
227
Reproduced with permission of the copyright owner. Further reproduction prohibited without permission.

P le a s e id e n tify a n y o t h e r c h a n g e s y o u fe e l a r e r e q u i r e d f o r a d o p t in g a g ile s o f tw a r e d e v e lo p m e n t p r a c t ic e s in o r g a n iz a t io n s p ra c t ic in g traditional, plan driven software development methodologies.
N o t a t all Im p o r ta n t
S o m e w h a tU n im p o rta n t
N eu tra l S o m e w h a tIm p o r ta n t
V eryIm p o r ta n t
C a n 't s a y
O th e r c h a n g e s r e q u i r e d (F ro m P la n D riv en to A gile)
1.1 2 3 4 5 X
2.1 2 3 4 5 X
3.1 2 3 4 5 X
4.1 2 3 4 5 X
5.1 2 3 4 5 X
ICHALLENGES / RISKS INVOLVED
A c c o rd in g t o y o u r v iew , r a n k t h e d e g r e e o f im p o r ta n c e o f t h e c h a l l e n g e s / r i s k s in v o lv e d in a d o p t in g a g ile s o f tw a r e d e v e lo p m e n t p r a c t ic e s in o r g a n iz a t io n s p ra c t ic in g tra d i t io n a l , p la n d r iv e n s o f tw a r e d e v e lo p m e n t m e th o d o lo g ie s . P le a s e r a n k th e i r im p o r ta n c e in a s c a l e o f 1 t o 5 a c c o r d in g t o y o u r v ie w s .
N o t a t all Im p o r ta n t
S o m e w h a tU n im p o rta n t
N eu tra l S o m e w h a tI m p o r ta n t
V eryI m p o r ta n t
C a n 't s a y
R e s is ta n c e from d e v e lo p e rs to tran sfo rm from trad itional heav y w eig h t p ro c e s s cen tric dev e lo p m en t. 1 2 3 4 5 X
D ev e lo p er p e rc e p tio n s of m ic ro m a n a g e m e n t d u e to c lo s e a n d fre q u e n t in te rac tio n with m a n a g e m e n t in ag ile d ev e lo p m en t. 1 2 3 4 5 X
D ev e lo p er p e rc e p tio n s of freed o m from trad itional d ay -to -d ay w ork s c h e d u le (b a s e d o n G an tt C hart). 1 2 3 4 5 X
P ro b le m s with d ev e lo p m e n t te a m s th a t a re geog rap h ically d istribu ted a n d n o t c o lo c a ted in ag ile d ev e lo p m en t. 1 2 3 4 5 X
D iffe ren ces in productivity b e tw e en te a m m e m b e rs in ag ile so ftw are d ev e lo p m en t. 1 2 3 4 5 X
D e c re a s e in th e productivity b e tw e en te a m m e m b e rs during tran sitio n to ag ile so ftw a re d e v e lo p m e n t d u e to th eir in ex p erien ce with th e a g ile m e th o d o lo g ies .
1 2 3 4 5 X
O v e rz e a lo u s n e ss (ex c e s s iv e e n th u s ia sm ) in tea m m e m b e rs d u e to p e rc e p tio n s of agility a n d f a s t d ec is io n m ak ing , lead in g to dec is io n m ak in g w ithout m u ch fo re th o u g h t in ag ile d e v e lo p m en t.
1 2 3 4 5 X
T e s te r re s is ta n c e to w orking c lo se ly with d e v e lo p e rs in ag ile d e v e lo p m en t. 1 2 3 4 5 X
U p p er m a n a g e m e n t re s is ta n c e d u e to fac to rs s u c h a s lack of d e v e lo p m e n t u n d e r co n trac t, a n d w ell-defined p ro jec t c h a rte rs , p ro jec t p lan s a n d G an tt C h a r ts in ag ile d ev e lo p m en t.
1 2 3 4 5 X
H u m an re s o u rc e re s is ta n c e in th e a b s e n c e of b e in g a b le to a s s ig n fixed ro le s a n d resp o n sib ilities to e m p lo y e e s in ag ile d ev e lo p m en t, a n d b e in g a b le to t ra c k th eir p e rfo rm a n c e b a s e d o n th o s e fixed a s s ig n m e n ts
1 2 3 4 5 X
C h a lle n g e s of th e a g ile t e a m s in in teg rating th e d e v e lo p m e n t p ro c e s s e s a n d s u b s y s te m s with t e a m s within th e s a m e o rgan iza tion p ractic ing trad itional d e v e lo p m e n t m eth o d o lo g ies .
1 2 3 4 5 X
D ev e lo p m en t p r o c e s s conflicts d u e to th e d iffe re n c e s in lifecycle b e tw e en ag ile m e th o d o lo g ie s (which a re c h a ra c te r ize d by te s t driven d e sig n , sh o rt, a n d fo c u s s e d ite ratio n s of d ev e lo p m en t) , a n d trad itional m eth o d o lo g ie s (which h a v e heav y w eig h t p r o c e s s e s an d long iterations).
1 2 3 4 5 X
A dopting ag ile m e th o d o lo g ie s for u s e in leg acy s y s te m s , which a re m o re re s is ta n t to c h a n g e s in in ternal s o u rc e co d e . 1 2 3 4 5 X
228
Reproduced with permission of the copyright owner. Further reproduction prohibited without permission.

D ifferen ces in d e v e lo p m e n t p r o c e s s e s b e tw e en ag ile m e th o d o lo g ie s (which a re m o re inform al req u irem e n ts driven), a n d trad itional m eth o d o lo g ie s (which a r e m o re form al req u irem e n ts driven).
1 2 3 4 5 X
D iffe ren ces in p e rfo rm a n c e m a n a g e m e n t a p p ro a c h e s in trad itional m e th o d o lo g ie s (which a re m o re co n tra c t a n d m ile s to n e driven), an d ag ile m eth o d o lo g ie s (which a r e b a s e d o n in corporating c o n tin u o u s c u s to m e r fee d b a c k into th e d ev e lo p m e n t lifecycle.)
1 2 3 4 5 X
C o n tin u ed c o n fo rm a n c e to trad itional certified p r o c e s s s ta n d a rd s (su ch a s CMM, a n d ISO ) in o rg an iza tio n s th a t h a v e a d o p te d th em , a n d a re in th e p r o c e s s of ad o p tin g ag ile m eth o d o lo g ie s .
1 2 3 4 5 X
D ifferen ces in a ttitu d e s to w a rd s p ro jec t s u c c e s s b e tw e en th e m a n a g e m e n t p ractic ing trad itional a n d ag ile m eth o d o lo g ie s . 1 2 3 4 5 X
D ifferen ces b e tw e en th e tea m s iz e req u irem e n ts a n d suitability of th e ag ile a n d trad itional m eth o d o lo g ie s . 1 2 3 4 5 X
P ro b le m s with se le c tin g th e a p p ro p r ia te ag ile m eth o d o lo g y a n d th e su p p o rtin g to o ls acco rd in g to o rgan iza tiona l n e e d s a n d ch a ra c te ris tic s .
1 2 3 4 5 X
P le a s e id e n tify a n y o th e r c h a l l e n g e s / r i s k s y o u fe e l a r e in v o lv e d in a d o p t in g a g ile s o f tw a r e d e v e lo p m e n t p r a c t ic e s in o r g a n iz a t io n s p ra c t ic in g tra d i t io n a l , p la n d r iv e n s o f tw a r e d e v e lo p m e n t m e th o d o lo g ie s . P le a s e r a n k t h e i r im p o r ta n c e in a s c a l e o f 1 to 5 a c c o r d in g to y o u r v ie w s .
V eryIm p o r ta n t
S o m e w h a tIm p o r ta n t
N e u tra l S o m e w h a tU n im p o rta n t
N o t a t all Im p o r ta n t
C a n 't s a y
O th e r c h a l l e n g e s / r is k s
1.1 2 3 4 5 X
2.1 2 3 4 5 X
3.1 2 3 4 5 X
4.1 2 3 4 5 X
5.1 2 3 4 5 X
229
Reproduced with permission of the copyright owner. Further reproduction prohibited without permission.

Appendix C
Labels of Variables Used in the Study
In this Appendix, we list the labels/codes that were assigned to the different variables
used in this study. These labels are then used throughout during statistical analysis using
SPSS, and also while presenting the results of statistical analysis.
C.1. Variables used in Research Question 1
In this Section, the different independent and dependent variables used in the Success
Factors survey and their corresponding labels are listed.
Table C.8.1: Variables used in Research Question 1
Variables LabelCustomer Satisfaction IndlCustomer Collaboration Ind2
Customer Commitment Ind3Decision Time Ind4Team Distribution Ind5Team size Ind6Corporate culture Ind7Planning Ind8Control Ind9Technical competency IndlOPersonal characteristics IndllCommunication and Negotiation Indl2Societal Culture Indl3Training and Learning Indl4Reduced delivery schedules. D1
230
Reproduced with permission of the copyright owner. Further reproduction prohibited without permission.

Increased return on investment (ROI). D2
Increased ability to meet with the current customer requirements. D3
Increased flexibility to meet with the changing customer requirements.
D4
Improved business processes. D5
Success Dependent
In cases where the independent variables are measured using multiple sub-questions, those subquestions are represented as a, b, c , ... etc. in the same sequence as they appear in the survey questionnaire in Appendix B.
C.2. Variables used in Research Question 2
In this Section, the different change item variables used in the Changes survey and their
corresponding labels are listed.
Table C.8.2: Variables used in Research Question 2
Variables LabelChanges in organizational culture (From Plan Driven to Agile) C l
From policy and procedure based development culture to freedom of development and management by team members.
C l. l
From individually assigned roles to that of team-work. C1.2
From solitary development attitudes of team members to that of working in teams.
C1.3
From no technical and interpersonal competency requirements in team composition to establishing a minimum set of competency requirements of team members.
C1.4
From non-customer-centric to customer-centric development. C1.5
Changes in management style (From Plan Driven to Agile) C2
From command-and-control management to leadership-and- collaboration.
C2.1
From authoritative to collaborative and pluralistic decision making (i.e., where all the development team members are given sufficient importance in decision making)
C2.2
Changes in knowledge management strategy (From Plan Driven to Agile)
C3
From heavy documentation-based to tacit (not spoken) knowledge management.
C3.1
231
Reproduced with permission of the copyright owner. Further reproduction prohibited without permission.

Changes in development processes (From Plan Driven to Agile) C4From heavily process-centric to short, iterative, test-driven, and people-centric development.
C4.1
From standards compliance and measurement driven development to development under uncertainty.
C4.2
From contract-compliant to change-tolerant development. C4.3From lifecycle-based development to feature-driven evolutionary and iterative development.
C4.4
C.3. Variables used in Research Question 3
In this Section, the different challenge item variables used in the Challenges survey and
their corresponding labels used in are listed.
Table C.8.3: Variables Used in Research Question 3
Variables LabelResistance from developers to transform from traditional heavyweight process centric development.
Chall
Developer perceptions of micromanagement due to close and frequent interaction with management in agile development.
Chal2
Developer perceptions of freedom from traditional day-to-day work schedule (based on Gantt Chart).
Chal3
Problems with development teams that are geographically distributed and not colocated in agile development.
Chal4
Differences in productivity between team members in agile software development.
Chal5
Decrease in the productivity between team members during transition to agile software development due to their inexperience with the agile methodologies.
Chal6
Overzealousness (excessive enthusiasm) in team members due to perceptions of agility and fast decision making, leading to decision making without much forethought in agile development.
Chal7
Tester resistance to working closely with developers in agile development.
Chal8
Upper management resistance due to factors such as lack of development under contract, and well-defined project charters, project plans and Gantt Charts in agile development.
Chal9
Human resource resistance in the absence of being able to assign fixed roles and responsibilities to employees in agile development, and being able to track their performance based on those fixed assignments
ChallO
Challenges of the agile teams in integrating the development Challl
232
Reproduced with permission of the copyright owner. Further reproduction prohibited without permission.

processes and subsystems with teams within the same organization practicing traditional development methodologies.Development process conflicts due to the differences in lifecycle between agile methodologies (which are characterized by test driven design, short, and focused iterations of development), and traditional methodologies (which have heavyweight processes and long iterations).
Chall 2
Adopting agile methodologies for use in legacy systems, which are more resistant to changes in internal source code.
Chall 3
Differences in development processes between agile methodologies (which are more informal requirements driven), and traditional methodologies (which are more formal requirements driven).
Chall4
Differences in performance management approaches in traditional methodologies (which are more contract and milestone driven), and agile methodologies (which are based on incorporating continuous customer feedback into the development lifecycle.)
Chall 5
Continued conformance to traditional certified process standards (such as CMM, and ISO) in organizations that have adopted them, and are in the process of adopting agile methodologies.
Chall 6
Differences in attitudes towards project success between the management practicing traditional and agile methodologies.
Chall 7
Differences between the team size requirements and suitability of the agile and traditional methodologies.
Chall 8
Problems with selecting the appropriate agile methodology and the supporting tools according to organizational needs and characteristics.
Chall 9
233
Reproduced with permission of the copyright owner. Further reproduction prohibited without permission.

Appendix D
Feedback to Open-Ended Questions
In this Appendix, we list the feedback obtained to some of the open-ended questions from
the surveys. The lists below are dumped “as is” from what was obtained from the survey
responses. A visual inspection of all these lists reveal that many of them can be classified
to belong to the major success factors, changes, and challenges listed as closed-ended
questions in the survey questionnaire.
D.1. List of Other Success Factors Obtained from Open-Ended Questions
We list below the other success factors that were suggested by different respondents
through the open questions in the Success Factors survey.
• Customer must participate effectively in process and be able to balance business
and technical goals. If not, you are doomed to fail over and over... or at minimum
do Agile very badly.
• Understanding of what failed before
• Mentoring and training
• Pair Programming: designs are discussed, knowledge is transferred between
members
• Business Commitment to process
• Buy in to agile practices, especially from management
• Talent
• Open and continuous feedback between team members
• Time Boxing is probably the most important thing
234
Reproduced with permission of the copyright owner. Further reproduction prohibited without permission.

• Involvement from customer
• Management Support from the highest level
• Realizing the service-providing role over specification-demanding
• Time to market
• Testing
• Are your team members full-time on this project?
• We integrate code constantly.
• Team dynamic & Team development
• Organizational management understands and supports agile values and principles
• Adaptability
• My developers know the business and can sometimes be their own customers
• Flexibility: Not all the practices are adopted/used religiously, but rewards are still
evident.
• Top management commitment to agile practices
• Having intellect
• We have weekly showcases to show progress to customer
• Simple communication tools like wiki
• Our customers are technically adapt
• Staff changes through attrition or reorganizing
• How mature the management of our organisation is in the field of agile
development
235
Reproduced with permission of the copyright owner. Further reproduction prohibited without permission.

• Scale down and specify the requirements so that it can be delivered in a short
time.
• Full time Agile coach(es)
• Understanding of the process by the customer
• Progress Visibility (completed story points per iteration) for everyone - including
customer.
• Test Driven Development
• Organizational buy-in and support of the processes
• Management infrastructure in place
• Agile contract
• Information radiators for communication (charts and cards on the wall)
• We sometimes use non-agile methodologies in order to satisfy timelines.
• Smart people
• Good Tool
• Reflection
• Pair Programming
• Type of Application Deliverable (In-House IT project vs Shrink Wrap Software)
• Agile Specific Project Management Tooling (Rally)
• Everyone (including data people, QA people,...) is agile
• Taking up responsibility
• Having a base of good principles
• Team empowerment
236
Reproduced with permission of the copyright owner. Further reproduction prohibited without permission.

• Maturity of the team members
• Use of a common information radiator
• Goal-driven functionality and UI design
• Technical support environment
• Use of ProjectCards to organize the project
• Criticality of the software - what is at stake?
• Disciplined yet light processes
• Continuous integration & governance tools are needed
• Willingness of programmers to work as pairs. Is difficult among experienced
developers?
• Anxiety
• Formal contracts
• Team workings towards same known goal
• The client organization having incentives that are not contradicting the use of
agile methods
• Analysis of what our core problems are
• Permission to do quality work
• Automated Testing: allows for shared code ownership (developers can feel free to
make changes, having unit/functional/integration tests as safeguards)
• Quantitative demonstration of benefits of agile (DSDM ) - independent metrics
case study
• Root cause analysis, if something goes wrong
237
Reproduced with permission of the copyright owner. Further reproduction prohibited without permission.

• Getting the team test infected using xUnit and some kind of mocking tool
• Individual capabilities of team members
• Process transparency to key stakeholders
• Not working on systems with closed list of modules
• Continuous feedback
• Are your team members experienced with agile development practices?
• We write unit tests before writing code
• Communication rules
• Passionate
• Our customers trust our developers to add new features without their consent
• People have other day jobs to do at same time doing project
• Constant collaboration with customer
• Team believe in the motivation behind agile practices
• How mature the client is (some just do not want to cooperate - they try to buy
software like groceries)
• Full time iteration manager (internally-facing project manager)
• Integrity of estimations
• Open and honest about the project status - good or bad to recognize problems
earlier.
• Use of continuous integration
• Frequent customer visits (not co-located) and telecons
• Stakeholder buyin
238
Reproduced with permission of the copyright owner. Further reproduction prohibited without permission.

• Pair programming (constant code review)
• Trusting customers
• Training
• Planning Game
• Outside Coaching Services (Rally)
• Establishing the agile value system is more important than following pre-defined
practices
• Frequent delivery of used software
• Significant Business Commitment
• CMM Background
• Developer familiarity with the project model
• Craftsmanship
• You need buy-in from customer
• Complexity of the software
• Disciplined yet light documentation
• Refactoring the code often
• Agile approach differs among business units.
• Customer-Vendor relationship
• Having a competent, committed and authorized product owner/customer
• Refactoring
• Track record with client
• Not being a perfectionist
2 3 9
Reproduced with permission of the copyright owner. Further reproduction prohibited without permission.

• Mocks are important, if you can't mock, you can’t unit test
• Prioritisation of all development activities decided by the business
• Are your developers experienced?
• We have a weekly "show and tell" for our customers: strongly agree.
• Self-criticism
• Business priorities change, conflicts between availability of business versus IT
technical staff
• Ability for test team to adapt is essential
• UI should develop along with the software
• Design architecture stable
• Lack of politics
• Test driven development (ensures quality and no unnecessary code)
• Strong estimation
• Courage to tell the truth about project
• Domain knowledge (not technology)
• Risk sharing contracts with suppliers
• Distributed agile development
• Developer familiarity with the technical platform
• Time to delivery
• Developer skills
• Business driven not IT/IM/IS led
• We estimate task duration and have the customer choose tasks & priorities
240
Reproduced with permission of the copyright owner. Further reproduction prohibited without permission.

• Task orientation
• Respect of individual
• Skilled developers
• Good People
• Daily Standup
• Lightweight written plans (like bumdown charts)
• Proper usage of tools
• Dynamism of the project - how many changes in requirements per month
• Select a strong Agile partner when getting started
• (Known) architecture
• Documented Process NOT JDI!
• Paired programming is a critical success factor in keeping the teams up to speed
on development issues, and cross training.
• We program in pairs: strongly agree.
• Humility
• Fun
• The major benefit of agility is to reduce risk bby knowing about the real status of
the project
• The goal isn't to be agile: It's to be effective.
• Command and control way of working
• Stability of team
• Domain knowledge
241
Reproduced with permission of the copyright owner. Further reproduction prohibited without permission.

D.2. List of Other Changes Obtained from Open-Ended Questions
We list below the other change items that were suggested by different respondents
through the open questions in the Changes survey.
• Permission from management to make the change
• Shared team room
• Unit Testing, mocks, and continuous integration
• Knowledge sharing
• The ability to reject structured documentation, such as a survey instrument, when
it doesn't help my client
• Early involvement of business analysts (Menlo Innovations calls them "High
Tech Anthropologists").
• Openness management
• Trust your developers
• The information about agile methodologies. If one person does not have the
knowledge about agile development and is unwilling to learn, he can be a real
stooper for the project, (management included).
• Test-driven development (automated tests specify the behaviour)
• Education
• Pair Programming to foster learning is very important
• Increase of trust that seems to be lacking within a lot of organizations
• Size of teams kept small (beck etc.)
242
Reproduced with permission of the copyright owner. Further reproduction prohibited without permission.

• Flexibility of customers
• Business sponsor responsibility for prioritisation and release planning
• Honesty in communication
• Test Driven Development
• Agile specific tooling for collaboration, planning and tracking
• Shift in management thinking
• From predict to adaptive
• From large-scale scope management to continuous (micro) scope management
• Management acceptance of risk
• Test Driven Development
• Away with micromanagement
• Open communication
• Individual motivation to make changes
• Sales skills in the technical ranks
• Weekly releases as soon as the project begins.
• A right to errors culture
• Make sure your developers know your business
• Continuous integration / shared code base
• Architects develop alongside team
• Trust by customers
• Take small steps
• Continuous builds
243
Reproduced with permission of the copyright owner. Further reproduction prohibited without permission.

• Drive to Agile has to come from within the team - allow team to control not
managers dictating method
• Scope of projects should be reduced
• Management acceptance of uncertainty
• Continuous build
• Programmers shouldn't have to justify each task, but deliver working software
• Proper development team environment
• Involvement in team activities
• Functional test development in parallel with code.
• Courageous
• Collective ownership of the solution
• More decisions through prototyping (spikes) and willingness to throw away these
spikes
• Lack of focus on progress measurement can be a disaster
• Developers earning that trust
• Automated Tests
• Willingness to negotiate
• Paired programming
• Clear project information radiators
• Development teams assigned prioritized tasks with NO OTHER
EXPECTATION.
• Trust
244
Reproduced with permission of the copyright owner. Further reproduction prohibited without permission.

• Early, continuous feedback (from customers, QA, automated tests)
• Viewing agile as different from "hacking"
• Continuous communication
• Honesty and integrity in communication about the development team progress (or
lack thereof)
• Tenacity
D.3. List of Other Challenges Obtained from Open-Ended Questions
We list below the other challenges that were suggested by different respondents through
the open questions in the Challenges survey.
• Fear of change from team members
• Getting the customer to buy into it
• Those experienced in traditional methodologies feeling threatened when the
company adopts an agile methodology.
• Ability to engage the customer every iteration as opposed to every few months or
every release.
• Perception that this is something "new" and needs to be "tried out" first.
• Focus on development not deployment of system
• Middle level management resistance
• Developer resistance to working with testers
• Documentation makes people feel secure
• Requirements management process
245
Reproduced with permission of the copyright owner. Further reproduction prohibited without permission.

• Non-technically driven purchases of software products that are hard to test and
integrate
• Difficulty in communicating project status for Agile process
• Different conceptions of how the team should be working. Some people pushing,
others resisting.
• Getting developers to accept TDD
• Lack of metric
• Still requires good system testing
• Management desire for fixed price, fixed scope
• Some people don't like the additional responsibility of an agile project
• Finding a good PM who can be flexible
• Lack of success demonstration
• Perceived lack of documentation
• Business users sometimes find it difficult to accept we don't deliver bells and
whistles
• Unrequired accompaniment of team member
• Delivery of "almost-ready" code
• Some people find it difficult to adapt to constant change
• Seeing agile as a silver bullet
• Patchy quality of testing
246
Reproduced with permission of the copyright owner. Further reproduction prohibited without permission.

Appendix E
Additional Statistical ResultsIn this Appendix, we present the detailed statistical analysis results that were obtained
while analyzing the three research questions considered in our study.
E.1. Research Question 1: Consolidated Dependent Variable Success
The detailed statistical analysis results using the consolidated dependent variable Success
are presented in this Section.
E1.1. Detailed Descriptive Statistical Results
Table E.l: Research Question 1: Detailed Descriptive Statistical Results
Descriptive Statistics
N Ranae Minimum Maximum Mean Std. Skewness KurtosisStatistic Statistic Statistic Statistic Statistic Statistic Statistic Std. Error Statistic Std. Error
Ind 1 174 5 0 5 4.76 .595 -4.192 .184 25.669 .366Ind 2 174 5 0 5 4.17 .925 -1.357 .184 2.224 .366Ind 3 174 5 0 5 3.95 1.074 -1.210 .184 1.506 .366ind 4 173 5 0 5 4.30 .815 -1.452 .185 3.803 .367Ind 5 174 4 1 5 3.22 1.267 -.220 .184 -.992 .366Ind 6 174 5 0 5 4.64 .899 -3.044 .184 9.511 .366Ind 7 174 4 1 5 4.16 .793 -1.377 .184 1.621 .366Ind 8 174 5 0 5 3.70 1.227 -.873 .184 -.050 .366Ind 3 174 5 0 5 3.60 1.501 -1.157 .184 .463 .366Ind10 173 4 1 5 4.11 .985 -1.109 .185 .758 .367Ind 11 174 3 2 5 4.39 .577 -1.304 .184 2.130 .366Ind 12 173 3 2 5 4.02 .748 -.551 .185 -.462 .367bid 13 172 5 0 5 3.75 1.001 -1.086 .185 1.829 .368bid 14 171 4 1 5 4.34 .783 -1.273 .186 1.950 .369Dependent 173 2 3 5 4.37 .557 -.871 .185 .079 .367bid 7a 174 3 2 5 4.51 .831 -1.749 .184 2.276 .366Ind 7b 174 4 1 5 4.36 .956 -1.626 .184 2.170 .366bid 7c 174 5 0 5 4.22 1.069 -1.624 .184 2.343 .366Ind7d 174 5 0 5 4.15 .980 -1.349 .184 2.019 .366bid 7e 173 5 0 5 4.27 1.046 -1.643 .185 2.357 .367Ind 7f 174 4 1 5 3.87 1.163 -.832 .184 -.271 .366Ind 7g 174 4 1 5 3.94 1.363 -1.045 .184 -.294 .366bid 7h 174 5 0 5 3.95 1.192 -1.093 .184 .524 .366Ind 11a 174 4 1 5 3.94 .878 -.768 .184 .357 .366Ind 11b 174 2 3 5 4.64 .568 -1.348 .184 .857 .366bid 11c 174 4 1 5 4.43 .732 -1.503 .184 3.150 .366bid 11d 174 3 2 5 4.37 .755 -1.149 .184 1.055 .366Ind 11e 174 5 0 5 4.47 .795 -2.244 .184 7.509 .366bid 11f 174 4 1 5 4.47 .830 -1.727 .184 2.796 .366Ind 12a 173 5 0 5 4.13 1.000 -1.436 .185 2.360 .367bid 12b 173 4 1 5 3.94 1.204 -.979 .185 -.139 .367bid 12c 172 4 1 5 3.79 1.267 -.786 .185 -.610 .368Ind 12d 172 5 0 5 3.90 1.284 -.942 .185 -.267 .368bid 12e 172 4 1 5 4.32 .829 -1.719 .185 4.302 .368bid 13a 172 5 0 5 3.79 1.244 -1.349 .185 1.665 .368bid 13b 172 5 0 5 3.69 1.309 -1.284 .185 1.385 .368bid 13c 172 5 0 5 3.63 1.402 -1.206 .185 .913 .368bid 13d 172 5 0 5 3.89 1.192 -1.210 .185 1.276 .368Dep 1 173 5 o 5 4.14 1.002 -1.476 .185 2.730 .367
Dep 1 172 5 0 5 4.24 1.059 -1.968 .185 4.705 .368Dep 3 173 3 2 5 4.65 .626 -1.867 .185 3.435 .367Dep 4 173 3 2 5 4.75 .544 -2.505 .185 7.433 .367Dep 5 173 5 0 5 4.08 1.078 -1.670 .185 3.644 .367bid 5a 174 4 1 5 3.78 1.494 -.798 .184 -.947 .366bid 5bValid N (listwise)
170159
5 0 5 2.61 1.520 .210 .186 -1.219 .370
247
Reproduced with permission of the copyright owner. Further reproduction prohibited without permission.

E1.2. Inter-Item Correlation Matrices for Variables Measured with Multiple Items
Table E.2: Research Question 1: Inter-Item Correlation Matrix for Items in Ind7
Ind 7a Ind 7b Ind 7c Ind 7d Ind 7e Ind 7f Ind 7q Ind 7hInd 7a 1.000 .721 .470 .356 .523 .483 .687 .412Ind 7b .721 1.000 .657 .342 .443 .409 .646 .443Ind 7c .470 .657 1.000 .426 .467 .365 .466 .373Ind 7d .356 .342 .426 1.000 .632 .424 .365 .262Ind 7e .523 .443 .467 .632 1.000 .529 .590 .357Ind 7f .483 .409 .365 .424 .529 1.000 .548 .385Ind 7g .687 .646 .466 .365 .590 .548 1.000 .445Ind 7h .412 .443 .373 .262 .357 .385 .445 1.000
Table E.0.3: Research Question 1: Inter-Item Correlation Matrix for Items in Indll
Ind 11a Ind 11b Ind 11c Ind 11d Ind 11e Ind 11fInd 11a 1.000 .444 .375 .492 .405 .408Ind 11b .444 1.000 .553 .477 .407 .438Ind 11c .375 .553 1.000 .659 .518 .621Ind 11d .492 .477 .659 1.000 .468 .576Ind 11e .405 .407 .518 .468 1.000 .507Ind 11f .408 .438 .621 .576 .507 1.000
Table E.4: Research Question 1: Inter-Item Correlation Matrix for Items in Indl2
Ind 12a Ind 12b Ind 12c Ind 12d Ind 12eInd 12a 1.000 .237 .166 -.031 .201Ind 12b .237 1.000 .728 .535 .141Ind 12c .166 .728 1.000 .701 .091Ind 12d -.031 .535 .701 1.000 .064Ind 12e .201 .141 .091 .064 1.000
Table E.5: Research Question 1: Inter-Item Correlation Matrix for Items in Indl3
Ind 13a Ind 13b Ind 13c Ind 13dInd 13a 1.000 .760 .590 .252Ind 13b .760 1.000 .656 .276Ind 13c .590 .656 1.000 .278Ind 13d .252 .276 .278 1.000
248
Reproduced with permission of the copyright owner. Further reproduction prohibited without permission.

Table E.6: Research Question 1: Inter-Item Correlation Matrix for Items in Dependent
Dep 1 Dep 1 Dep 3 Dep 4 Dep 5Dep 1 1.000 .517 .290 .320 .315Dep 1 .517 1.000 .346 .248 .374Dep 3 .290 .346 1.000 .669 .306Dep 4 .320 .248 .669 1.000 .286Dep 5 .315 .374 .306 .286 1.000
E.1.3. Detailed Regression Analysis Tables
Here we list those regression analysis tables that were not presented in the Data Analysis
Chapter.
Reproduced with permission of the copyright owner. Further reproduction prohibited without permission.

Reproduced
with perm
ission of the
copyright ow
ner. Further
reproduction prohibited
without
permission.
Table E .7 : Research Question 1: Detailed Correlations Results
Correlations
Dep. Ind 1 Ind 2 Ind 3 Ind 4 Ind 5 Ind 6 Ind 7 Ind 8 Ind 9 Ind 10 Ind 11 Ind 12 Ind 13 Ind 14Pearson Correlation Dep. 1.000 .140 .232 .253 .254 .074 .097 .241 .075 .301 .102 .180 .104 .381 .283
Ind 1 .140 1.000 .396 .309 .101 -.072 -.050 .259 -.103 .158 -.033 .050 -.002 -.023 -.008Ind 2 .232 .396 1.000 .562 .238 .070 -.035 .321 -.048 .139 -.103 .050 .179 .030 .048Ind 3 .253 .309 .562 1.000 .252 .056 -.068 .342 -.089 .106 -.149 -.076 .158 -.028 -.031Ind 4 .254 .101 .238 .252 1.000 .098 .165 .456 .129 .250 -.015 .052 .213 .123 .181Ind 5 .074 -.072 .070 .056 .098 1.000 .228 .146 .051 .074 -.074 .017 .573 .050 .099Ind 6 .097 -.050 -.035 -.068 .165 .228 1.000 .039 .106 .066 .092 .130 .193 -.041 .066Ind 7 .241 .259 .321 .342 .456 .146 .039 1.000 .196 .186 -.022 .275 .310 .005 .271Ind 8 .075 -.103 -.048 -.089 .129 .051 .106 .196 1.000 .238 .218 .170 .142 -.043 .125Ind 9 .301 .158 .139 .106 .250 .074 .066 .186 .238 1.000 .132 .133 .051 .127 .097Ind 10 .102 -.033 -.103 -.149 -.015 -.074 .092 -.022 .218 .132 1.000 .384 .041 .065 .339Ind 11 .180 .050 .050 -.076 .052 .017 .130 .275 .170 .133 .384 1.000 .225 .148 .560Ind 12 .104 -.002 .179 .158 .213 .573 .193 .310 .142 .051 .041 .225 1.000 .099 .229Ind 13 .381 -.023 .030 -.028 .123 .050 -.041 .005 -.043 .127 .065 .148 .099 1.000 .177Ind 14 .283 -.008 .048 -.031 .181 .099 .066 .271 .125 .097 .339 .560 .229 .177 1.000
Sig. (1 -tailed) Dep. .036 .001 .001 .000 .171 .107 .001 .168 .000 .096 .010 .092 .000 .000Ind 1 .036 .000 .000 .097 .177 .263 .000 .094 .021 .337 .263 .490 .383 .460Ind 2 .001 .000 .000 .001 .186 .328 .000 .268 .037 .093 .263 .011 .349 .270Ind 3 .001 .000 .000 .001 .235 .193 .000 .128 .086 .028 .164 .021 .361 .348Ind 4 .000 .097 .001 .001 .105 .017 .000 .048 .001 .424 .254 .003 .058 .010Ind 5 .171 .177 .186 .235 .105 .002 .030 .256 .171 .173 .412 .000 .261 .102Ind 6 .107 .263 .328 .193 .017 .002 .310 .087 .199 .118 .047 .006 .302 .201Ind 7 .001 .000 .000 .000 .000 .030 .310 .006 .008 .391 .000 .000 .475 .000Ind 8 .168 .094 .268 .128 .048 .256 .087 .006 .001 .002 .014 .034 .290 .054Ind 9 .000 .021 .037 .086 .001 .171 .199 .008 .001 .044 .044 .256 .052 .106Ind 10 .096 .337 .093 .028 .424 .173 .118 .391 .002 .044 .000 .302 .202 .000Ind 11 .010 .263 .263 .164 .254 .412 .047 .000 .014 .044 .000 .002 .029 .000Ind 12 .092 .490 .011 .021 .003 .000 .006 .000 .034 .256 .302 .002 .103 .002Ind 13 .000 .383 .349 .361 .058 .261 .302 .475 .290 .052 .202 .029 .103 .011Ind 14 .000 .460 .270 .348 .010 .102 .201 .000 .054 .106 .000 .000 .002 .011
N Dep. 166 166 166 166 166 166 166 166 166 166 166 166 166 166 166Ind 1 166 166 166 166 166 166 166 166 166 166 166 166 166 166 166Ind 2 166 166 166 166 166 166 166 166 166 166 166 166 166 166 166Ind 3 166 166 166 166 166 166 166 166 166 166 166 166 166 166 166Ind 4 166 166 166 166 166 166 166 166 166 166 166 166 166 166 166Ind 5 166 166 166 166 166 166 166 166 166 166 166 166 166 166 166Ind 6 166 166 166 166 166 166 166 166 166 166 166 166 166 166 166Ind 7 166 166 166 166 166 166 166 166 166 166 166 166 166 166 166Ind 8 166 166 166 166 166 166 166 166 166 166 166 166 166 166 166Ind 9 166 166 166 166 166 166 166 166 166 166 166 166 166 166 166Ind 10 166 166 166 166 166 166 166 166 166 166 166 166 166 166 166Ind 11 166 166 166 166 166 166 166 166 166 166 166 166 166 166 166Ind 12 166 166 166 166 166 166 166 166 166 166 166 166 166 166 166Ind 13 166 166 166 166 166 166 166 166 166 166 166 166 166 166 166Ind 14 166 166 166 166 166 166 166 166 166 166 166 166 166 166 166

Table E.8: Research Question 1: Variables Entered/Removed During Stepwise
Regression
ModelVariablesRemoved Method
1
Ind 13
Stepwise(Criteria:Probability-of-F-to-enter <=.050,Probability -of-F-to- remove >= .100).
2
Ind 3
Stepwise(Criteria:Probability-of-F-to-enter <=.050,Probability -of-F-to- remove >= .100).
3
Ind 9
Stepwise(Criteria:Probability-of-F-to-enter <=.050,Probability -of-F-to- remove >= .100).
4
Ind 14
Stepwise(Criteria:Probability-of-F-to-enter <=.050,Probability -of-F-to- remove >= .100).
a Dependent Variable: Log dependent
Reproduced with permission of the copyright owner. Further reproduction prohibited without permission.
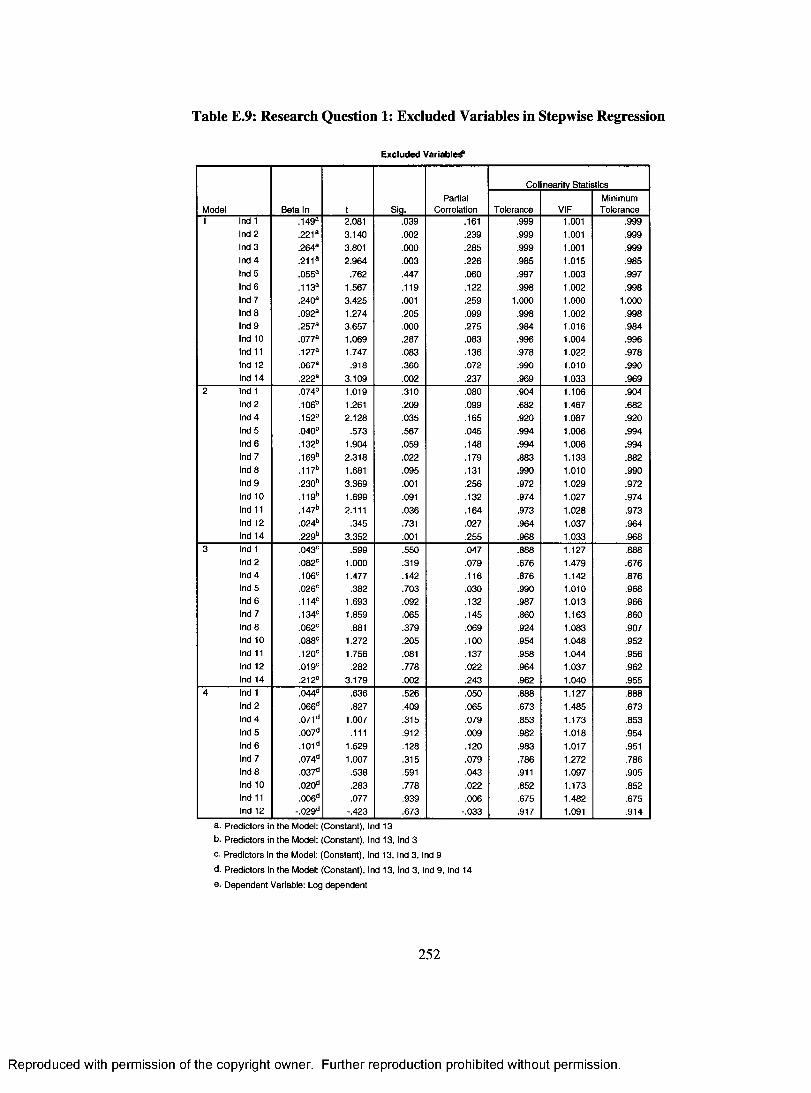
Table E.9: Research Question 1: Excluded Variables in Stepwise Regression
Excluded Variable^
M odel B e ta In t S ig .P a r tia l
C o rre la tio n
C o llin earitv S ta tis t ic s
T o le ra n c e VIFM inim um
T o le ra n c e1 Ind 1 ,1 4 9 a 2 .081 .0 3 9 .161 .9 9 9 1.001 .9 9 9
Ind 2 .2 2 1 a 3 .1 4 0 .0 0 2 .2 3 9 .9 9 9 1.001 .9 9 9
Ind 3 ,2 6 4 a 3 .801 .0 0 0 .2 8 5 .9 9 9 1.001 .9 9 9
Ind 4 .2 1 1a 2 .9 6 4 .0 0 3 .2 2 6 .9 8 5 1 .0 1 5 .9 8 5
Ind 5 ,0 5 5 a .7 6 2 .4 4 7 .0 6 0 .9 9 7 1 .0 0 3 .9 9 7
Ind 6 ,1 1 3 a 1 .5 6 7 .1 1 9 .1 2 2 .9 9 8 1 .0 0 2 .9 9 8
Ind 7 ,2 4 0 a 3 .4 2 5 .001 .2 5 9 1 .0 0 0 1 .0 0 0 1 .0 0 0
Ind 8 ,0 9 2 a 1 .2 7 4 .2 0 5 .0 9 9 .9 9 8 1 .0 0 2 .9 9 8
Ind 9 ,2 5 7 a 3 .6 5 7 .0 0 0 .2 7 5 .9 8 4 1 .0 1 6 .9 8 4
Ind 10 ,0 7 7 a 1 .0 6 9 .2 8 7 .0 8 3 .9 9 6 1 .0 0 4 .9 9 6
Ind 11 .1 2 7 a 1 .7 4 7 .0 8 3 .1 3 6 .9 7 8 1 .0 2 2 .9 7 8
Ind 12 ,0 6 7 a .9 1 8 .3 6 0 .0 7 2 .9 9 0 1 .0 1 0 .9 9 0
Ind 14 ,2 2 2 a 3 .1 0 9 .0 0 2 .2 3 7 .9 6 9 1 .0 3 3 .9 6 9
2 Ind 1 ,0 7 4 b 1 .0 1 9 .3 1 0 .0 8 0 .9 0 4 1 .1 0 6 .9 0 4
Ind 2 ,1 0 6 b 1.261 .2 0 9 .0 9 9 .6 8 2 1 .4 6 7 .6 8 2
Ind 4 ,1 5 2 b 2 .1 2 8 .0 3 5 .1 6 5 .9 2 0 1 .0 8 7 .9 2 0
Ind 5 ,0 4 0 b .5 7 3 .5 6 7 .0 4 5 .9 9 4 1 .0 0 6 .9 9 4
Ind 6
£1CMCO 1 .9 0 4 .0 5 9 .1 4 8 .9 9 4 1 .0 0 6 .9 9 4
Ind 7 ,1 6 9 b 2 .3 1 8 .0 2 2 .1 7 9 .8 8 3 1 .1 3 3 .8 8 2
Ind 8 .1 1 7 b 1.681 .0 9 5 .131 .9 9 0 1 .0 1 0 .9 9 0
Ind 9 ,2 3 0 b 3 .3 6 9 .001 .2 5 6 .972 1 .0 2 9 .9 7 2
Ind 10 .1 1 9 b 1 .6 9 9 .091 .1 3 2 .9 7 4 1 .0 2 7 .9 7 4
Ind 11 ,1 4 7 b 2 .1 1 1 .0 3 6 .1 6 4 .9 7 3 1 .0 2 8 .9 7 3
Ind 12 ,0 2 4 b .3 4 5 .731 .0 2 7 .9 6 4 1 .0 3 7 .9 6 4
Ind 1 4 ,2 2 9 b 3 .3 5 2 .001 .2 5 5 .9 6 8 1 .0 3 3 .9 6 8
3 Ind 1 .0 4 3 ° .5 9 9 .5 5 0 .0 4 7 .8 8 8 1 .1 2 7 .8 8 8
Ind 2 .0 8 2 ° 1 .0 0 0 .3 1 9 .0 7 9 .6 7 6 1 .4 7 9 .6 7 6Ind 4 ,1 0 6 c 1 .4 7 7 .1 4 2 .1 1 6 .8 7 6 1 .1 4 2 .8 7 6Ind 5 ,0 2 6 c .3 8 2 .7 0 3 .0 3 0 .9 9 0 1 .0 1 0 .9 6 8
Ind 6 .1 1 4 ° 1 .6 9 3 .0 9 2 .1 3 2 .9 8 7 1 .0 1 3 .9 6 6Ind 7 .1 3 4 ° 1 .8 5 9 .0 6 5 .1 4 5 .860 1 .1 6 3 .8 6 0
Ind 8 .0 6 2 ° .881 .3 7 9 .0 6 9 .9 2 4 1 .0 8 3 .9 0 7
Ind 10 ,0 8 8 c 1 .2 7 2 .2 0 5 .1 0 0 .9 5 4 1 .0 4 8 .9 5 2
Ind 11 .1 2 0 ° 1 .7 5 6 .081 .1 3 7 .958 1 .0 4 4 .9 5 6Ind 12 .0 1 9 C .2 8 2 .7 7 8 .0 2 2 .9 6 4 1 .0 3 7 .9 6 2
Ind 14 .2 1 2 c 3 .1 7 9 .0 0 2 .2 4 3 .962 1 .0 4 0 .9 5 5
4 Ind 1 .0 4 4 d .6 3 6 .5 2 6 .0 5 0 .8 8 8 1 .1 2 7 .8 8 8
Ind 2 ■066d .8 2 7 .4 0 9 .0 6 5 .6 7 3 1 .4 8 5 .6 7 3
Ind 4 .0 7 1 d 1 .0 0 7 .3 1 5 .0 7 9 .8 5 3 1 .1 7 3 .8 5 3
Ind 5 .0 0 7 d .111 .9 1 2 .0 0 9 .982 1 .0 1 8 .9 5 4
Ind 6 .1 0 1 d 1 .5 2 9 .1 2 8 .1 2 0 .9 8 3 1 .0 1 7 .951
Ind 7 ,0 7 4 d 1 .0 0 7 .3 1 5 .0 7 9 .7 8 6 1 .2 7 2 .7 8 6
Ind 8 •037d .5 3 8 .591 .0 4 3 .911 1 .0 9 7 .9 0 5
Ind 10 .0 2 0 d .2 8 3 .7 7 8 .0 2 2 .852 1 .1 7 3 .8 5 2
Ind 11 .0 0 6 d .0 7 7 .9 3 9 .0 0 6 .6 7 5 1 .4 8 2 .6 7 5Ind 1 2 - ,0 2 9 d - .4 2 3 .6 7 3 - .0 3 3 .9 1 7 1 .091 .9 1 4
a . P re d ic to rs in th e M odel: (C o n s ta n t) , Ind 13
t>. P re d ic to rs in th e M odel: (C o n s ta n t) , Ind 1 3 , Ind 3
C. P re d ic to rs in th e M odel: (C o n s ta n t) , Ind 13 , Ind 3 , Ind 9
d . P re d ic to rs in th e M odel: (C o n s ta n t) , Ind 13 , Ind 3 , Ind 9 , Ind 14
e . D e p e n d e n t V ariab le : L og d e p e n d e n t
252
Reproduced with permission of the copyright owner. Further reproduction prohibited without permission.

E.2. Research Question 1: Individual Dependent Variables Measuring
Success
In this Section, we report the stepwise multiple regression results taking each of the five
variables measuring Success, viz., Reduced Delivery Schedules (Dl), Increased ROI
(D2), Increased Ability to Meet with Current Customer Requirements (D3), Increased
Flexibility to Meet with Changing Customer Requirements (D4), and Improved Business
Processes (D5), as the dependent variables. The procedure taken is similar to that used in
the Chapter 6 for the regression analysis of Success. Where the log transformation of the
dependent variable gives a better regression result, the dependent variable has been log
transformed in such a case. If analysis revealed that that was not the case, they were left
untransformed. In the regression results below, only the most important tables are shown.
E.2.1. Reduced Delivery Schedules
Table E.10: Research Question 1: Regression Model Summary for Reduced Delivery
Schedules
Model R R SquareAdjusted R
SquareStd. Error of the Estimate
1 .286(a) .082 .076 .9282 .327(b) .107 .096 .918a Predictors: (Constant), Ind 13 b Predictors: (Constant), Ind 13, Ind 14 c Dependent Variable: Dep 1
253
Reproduced with permission of the copyright owner. Further reproduction prohibited without permission.

Table E.ll: Research Question 1: ANOVA Table from Regression Analysis with Reduced
Delivery Schedules
ANOV/P
ModelSum of
Squares df Mean Square F Sig.1 Regression 12.573 1 12.573 14.587 ,000a
Residual 141.355 164 .862Total 153.928 165
2 Regression 16.440 2 8.220 9.746 .000bResidual 137.487 163 .843Total 153.928 165
a- Predictors: (Constant), Ind 13
b- Predictors: (Constant), Ind 13, Ind 14
c- Dependent Variable: Dep 1
Table E.12: Research Question 1: Regression Coefficients for Reduced Delivery
Schedules
Coefficient#
Model
UnstandardizedCoefficients
StandardizedCoefficients
t Sig.95% Confidence Interval for B Correlations Collinearitv Statistics
B Std. Error Beta Lower Bound Upper Bound Zero-order Partial Part Tolerance VIF1 (Constant) 3.087 .289 10.671 .000 2.516 3.658
Ind 13 .284 .074 .286 3.819 .000 .137 .431 .286 .286 .286 1.000 1.0002 (Constant) 2.343 .450 5.206 .000 1.454 3.232
Ind 13 .255 .075 .256 3.403 .001 .107 .402 .286 .258 .252 .966 1.035Ind 14 .197 .092 .161 2.141 .034 .015 .379 .208 .165 .159 .966 1.035
a- Dependent Variable: Dep 1
On the basis of the above regression results, it can be inferred that the best regression
model for D l that can be had with the obtained data is:
Dl = 2.343 + .255 (Indl3) + .197 (Indl4)
254
Reproduced with permission of the copyright owner. Further reproduction prohibited without permission.

E.2.2. Increased ROI
Table E.13: Research Question 1: Regression Model Summary for Increased ROI
Model R R SquareAdjusted R
SquareStd. Error of the Estimate
1 .370(a) .137 .131 .228382 .483(b) .233 .223 .215933 .520(c) .271 .257 .21124
a Predictors: (Constant), Ind 14 b Predictors: (Constant), Ind 14, Ind 9 c Predictors: (Constant), Ind 14, Ind 9, Ind 2 d Dependent Variable: LOGD2
Table E.14: Research Question 1: ANOVA Table from Regression Analysis with Increased
ROI
ANO Vtf
ModelSum of
Squares df Mean Square F Siq.1 Regression 1.322 1 1.322 25.351 .0 0 0 a
Residual 8.345 160 .052Total 9.667 161
2 Regression 2.254 2 1.127 24.166 .0 0 0 b
Residual 7.414 159 .047Total 9.667 161
3 Regression 2.617 3 .872 19.546 ,0 0 0 c
Residual 7.051 158 .045Total 9.667 161
a- Predictors: (Constant), Ind 14
b. Predictors: (Constant), Ind 14, Ind 9
c- Predictors: (Constant), Ind 14, Ind 9, Ind 2
d- Dependent Variable: LOGD2
255
Reproduced with permission of the copyright owner. Further reproduction prohibited without permission.

Table E.15: Research Question 1: Regression Coefficients for Increased ROI
Coefficient^
Model
UnstandardizedCoefficients
StandardizedCoefficients
t Siq.95% Confidence Interval for B Correlations Collinearitv Statistics
B Std. Error Beta Lower Bound Upper Bound Zero-order Partial Part Tolerance VIF1 (Constant) .946 .100 9.496 .000 .749 1.143
Ind 14 .114 .023 .370 5.035 .000 .069 .159 .370 .370 .370 1.000 1.0002 (Constant) .814 .099 8.251 .000 .620 1.009
Ind 14 .100 .022 .324 4.611 .000 .057 .143 .370 .343 .320 .978 1.022Ind 9 .053 .012 .314 4.469 .000 .030 .076 .361 .334 ,310 .978 1.022
3 (Constant) .626 .117 5.341 .000 .394 ,857Ind 14 .098 .021 .318 4.628 .000 .056 .140 .370 .346 .314 .978 1.023Ind 9 .048 .012 .284 4.081 .000 .025 .071 .361 .309 .277 .956 1.046Ind 2 .052 .018 .196 2.852 .005 .016 .088 .258 .221 .194 .974 1.026
a- Dependent Variable: LOGD2
On the basis of the above regression results, it can be inferred that the best regression model is:
Log (D2) = .626 + .098 (Indl4) + .048 (Ind9) + .052 (Ind2)
E.2.3. Increased Ability to Meet with Current Customer Requirements
Table E.16: Research Question 1: Regression Model Summary for Increased Ability to
Meet with Current Customer Requirements
Model R R SquareAdjusted R
SquareStd. Error of the Estimate
1 .334(a) .112 .106 .138842 .387(b) .150 .139 .13627
a Predictors: (Constant), Ind 3 b Predictors: (Constant), Ind 3, Ind 7 c Dependent Variable: LOGD3
256
Reproduced with permission of the copyright owner. Further reproduction prohibited without permission.

Table E.17: Research Question 1: ANOVA Table from Regression Analysis with Increased
Ability to Meet with Current Customer Requirements
ANOV4P
ModelSum of
Squares df Mean Square F Sig.1 Regression .398 1 .398 20.657 .0 0 0 a
Residual 3.161 164 .019Total 3.559 165
2 Regression .533 2 .266 14.340 .0 0 0 b
Residual 3.027 163 .019Total 3.559 165
a- Predictors: (Constant), Ind 3
b- Predictors: (Constant), Ind 3, Ind 7
c. Dependent Variable: LOGD3
Table E.18: Research Question 1: Regression Coefficients Table for Increased Ability to
Meet with Current Customer Requirements
Coefficients
Model
UnstandardizedCoefficients
StandardizedCoefficients
t Siq.95% Confidence Interval for B Correlations ColiinearitN Statistics
B Std. Error Beta Lower Bound Upper Bound Zero-order Partial Part Tolerance VIF1 (Constant) 1.350 .041 32.815 .000 1.268 1.431
Ind 3 .046 .010 .334 4.545 .000 .026 .066 .334 .334 .334 1.000 1.0002 (Constant) 1.232 .060 20.680 .000 1.114 1.349
Ind 3 .036 .011 .263 3.419 .001 .015 .057 .334 .259 .247 .881 1.135Ind 7 .038 .014 .207 2.690 .008 .010 .065 .298 .206 .194 .881 1.135
a. Dependent Variable: LOGD3
On the basis of the above regression results, it can be inferred that the best regression model is:
Log (D3) = 1.232 + .036 (Ind3) + .038 (Ind7)
257
Reproduced with permission of the copyright owner. Further reproduction prohibited without permission.

E.2.4. Increased Flexibility to Meet with Changing Customer Requirements
Table E.19: Research Question 1: Regression Model Summary for Increased Flexibility to
Meet with Changing Customer Requirements
Model R R SquareAdjusted R
SquareStd. Error of the Estimate
1 .262(a) .069 .063 .516a Predictors: (Constant), Ind 3 b Dependent Variable: Dep 4
Table E.20: Research Question : ANOVA Table from Regression Analysis with Increased
Flexibility to Meet with Changing Customer Requirements
ANOV/P
ModelSum of
Squares df Mean Square F Siq.1 Regression 3.222 1 3.222 12.107 .001a
Residual 43.651 164 .266Total 46.873 165
a- Predictors: (Constant), Ind 3
b- Dependent Variable: Dep 4
Table E.21: Research Question 1: Regression Coefficients for Increased Flexibility to Meet with Changing Customer Requirements
Coefficient#
Model
UnstandardizedCoefficients
StandardizedCoefficients
t Sid-95% Confidence Interval for B Correlations Collinearih Statistics
B Std. Error Beta Lower Bound Upper Bound Zero-order Partial Part Tolerance VIF1 (Constant)
ind 34.240
.130.153.037 .262
27.7433.479
.000
.0013.938
.0564.542
.204 .262 .262 .262 1.000 1.000a. Dependent Variable: Dep 4
Although the above regression results here show a poor model, on the basis of the above results,
it can be inferred that the best regression model fitting the data is:
D4 = 4.24 + .013 (Ind3)
258
Reproduced with permission of the copyright owner. Further reproduction prohibited without permission.

E.2.5. Improved Business Processes
Table E.22: Research Question 1: Regression Model Summary for Improved Business
Processes
Model R R SquareAdjusted R
SquareStd. Error of the Estimate
1 .422(a) .178 .173 .200542 .473(b) .224 .214 .195533 .496(c) .246 .232 .19327
a Predictors: (Constant), Ind 4b Predictors: (Constant), Ind 4, Ind 7c Predictors: (Constant), Ind 4, Ind 7, Ind 3d Dependent Variable: LOGD5
Table E.23: Research Question 1: ANOVA Table from Regression Analysis with Improved
Business Processes
ANOVA*
ModelSum of
Squares df Mean Square F Siq.1 Regression 1.385 1 1.385 34.445 ,000a
Residual 6.394 159 .040Total 7.780 160
2 Regression 1.739 2 .869 22.741 ,000bResidual 6.041 158 .038Total 7.780 160
3 Regression 1.915 3 .638 17.094 .000cResidual 5.864 157 .037Total 7.780 160
a- Predictors: (Constant), Ind 4
b- Predictors: (Constant), Ind 4, Ind 7
c - Predictors: (Constant), Ind 4, Ind 7, Ind 3
d. Dependent Variable: LOGD5
2 5 9
Reproduced with permission of the copyright owner. Further reproduction prohibited without permission.

Table E.24: Research Question 1: Regression Coefficients Table for Improved Business
Processes
Coefficient#
Model
Unstandardi2 edCoefficients
StandardizedCoefficients
t Siq.95% Confidence Interval for B Correlations Collinearih Statistics
B Std. Error Beta Lower Bound Upper Bound Zero-order Partial Part Tolerance VIF1 (Constant) .921 .085 10.813 .000 .753 1.089
Ind 4 .113 .019 .422 5.869 .000 .075 .152 .422 .422 .422 1.000 1.0002 (Constant) .778 .095 8.152 .000 .590 .967
Ind 4 .084 .021 .314 3.996 .000 .043 .126 .422 .303 .280 .796 1.256Ind 7 .065 .021 .239 3.041 .003 .023 .107 .381 .235 .213 .796 1.256
3 (Constant) .722 .098 7.378 .000 .529 .915Ind 4 .079 .021 .296 3.782 .000 .038 .121 .422 .289 .262 .787 1.271Ind 7 .052 .022 .193 2.398 .018 .009 .095 .381 .188 .166 .741 1.349Ind 3 .033 .015 .161 2.174 .031 .003 .063 .298 .171 .151 .876 1.142
a. Dependent Variable: LOGD5
On the basis of the above results, it can be inferred that the best regression model fitting
the data is:
Log (D5) = .722 + .079 (Ind4) + .052 (Ind7) + .033 (Ind3)
E.3. Research Question 2
The detailed statistical analysis results obtained while investigating the data
corresponding to Research Question 2 are presented in this Section.
E.3.1. Detailed Results of Descriptive Statistics
In Table E.24, we present the descriptive statistical results for C l, C2, C3, and C4.
Table E.25: Research Question 2: Detailed Descriptive Statistics (Part I)
Statistic Std. ErrorC1 Mean 4.1927 .06986
95% Confidence Interval for Mean
Lower Bound
Upper Bound4.0548
4.3307
5% Trimmed Mean 4.3155Median 4.4000Variance .805Std. Deviation .89739
260
Reproduced with permission of the copyright owner. Further reproduction prohibited without permission.

Minimum .00Maximum 5.00Range 5.00Interquartile Range .80Skewness -2.866 .189Kurtosis 10.291 .376
C2 Mean 4.3455 .0788795% Confidence Lower Bound A 1 QQ7
Interval for Mean 4.ioy/
Upper Bound4.5012
5% Trimmed Mean 4.5051Median 4.5000Variance 1.026Std. Deviation 1.01305Minimum .00Maximum 5.00Range 5.00Interquartile Range 1.00Skewness -2.732 .189Kurtosis 8.590 .376
C3 Mean 3.8606 .0917595% Confidence Lower Bound Q C7Q4
Interval for Mean o.o/y4
Upper Bound4.0418
5% Trimmed Mean 4.0101Median 4.0000Variance 1.389Std. Deviation 1.17855Minimum .00Maximum 5.00Range 5.00Interquartile Range 1.00Skewness -1.807 .189Kurtosis 3.583 .376
C4 Mean 4.1919 .0724795% Confidence Lower Bound A f \ A OQ
Interval for Mean 4.U4oo
Upper Bound4.3350
5% Trimmed Mean 4.3155Median 4.5000Variance .867Std. Deviation .93090Minimum .00Maximum 5.00
261
Reproduced with permission of the copyright owner. Further reproduction prohibited without permission.

Range 5.00Interquartile Range .75Skewness -2.373 .189Kurtosis 6.999 .376
In Table E.25, we present the detailed descriptive statistical analysis results for each
of the change items constituting to form the change items C l, C2, C3, and C4 (such as
C l.l, C1.2, C l.3, etc.).
Table E.26: Research Question 2: Detailed Descriptive Statistics (Part II)
Statistic Std. ErrorC1.1 Mean 4.0307 .10350
95% Confidence Interval for Mean
Lower Bound
Upper Bound
3.8263
4.2351
5% Trimmed Mean 4.2007Median 4.0000Variance 1.746Std. Deviation 1.32135Minimum .00Maximum 5.00Range 5.00Interquartile Range 1.00Skewness -1.812 .190Kurtosis 3.003 .378
C1.2 Mean 4.2454 .0848795% Confidence Interval for Mean
Lower Bound
Upper Bound
4.0778
4.4130
5% Trimmed Mean 4.3964Median 5.0000Variance 1.174Std. Deviation 1.08350Minimum .00Maximum 5.00Range 5.00Interquartile Range 1.00Skewness -2.007 .190Kurtosis 4.713 .378
Reproduced with permission of the copyright owner. Further reproduction prohibited without permission.

C1.3 Mean 4.5521 .0728995% Confidence Lower Bound A A C lQ O
Interval for Mean 4 .4 U o ^
Upper Bound4.6961
5% Trimmed Mean 4.7089Median 5.0000Variance .866Std. Deviation .93064Minimum .00Maximum 5.00Range 5.00Interquartile Range 1.00Skewness -3.271 .190Kurtosis 12.605 .378
C1.4 Mean 3.7239 .1084595% Confidence Lower Bound o c n n oInterval for Mean o.ouyo
Upper Bound3.9381
5% Trimmed Mean 3.8599Median 4.0000Variance 1.917Std. Deviation 1.38461Minimum .00Maximum 5.00Range 5.00Interquartile Range 2.00Skewness -1.399 .190Kurtosis 1.405 .378
C1.5 Mean 4.3742 .0887995% Confidence Lower Bound A ̂QQQ
Interval for Mean 4 . i y » y
Upper Bound4.5496
5% Trimmed Mean 4.5532Median 5.0000Variance 1.285Std. Deviation 1.13358Minimum .00Maximum 5.00Range 5 .0 0
Interquartile Range 1.00Skewness -2.374 .190Kurtosis 5.762 .378
C2.1 Mean 4.4540 .0875595% Confidence Lower Bound A OO H H
Interval for Mean 4 .^ 0 1 1
263
Reproduced with permission of the copyright owner. Further reproduction prohibited without permission.

Upper Bound4.6269
5% Trimmed Mean 4.6554Median 5.0000Variance 1.249Std. Deviation 1.11777Minimum .00Maximum 5.00Range 5.00Interquartile Range 1.00Skewness -2.904 .190Kurtosis 8.685 .378
C2.2 Mean 4.2209 .0870495% Confidence Lower Bound A H A G f \Interval for Mean 4.U 4yU
Upper Bound4.3927
5% Trimmed Mean 4.3828Median 4.0000Variance 1.235Std. Deviation 1.11125Minimum .00Maximum 5.00Range 5.00Interquartile Range 1.00Skewness -2.224 .190Kurtosis 5.683 .378
C4.1 Mean 4.6012 .0804995% Confidence Lower Bound A A A OOInterval for Mean 4 .4 4 ^ o
Upper Bound4.7602
5% Trimmed Mean 4.7975Median 5.0000Variance 1.056Std. Deviation 1.02764Minimum .00Maximum 5.00Range 5.00Interquartile Range .00Skewness -3.352 .190Kurtosis 11.495 .378
C4.2 Mean 3.6319 .1062295% Confidence Lower Bound O yfOOOInterval for Mean
Upper Bound3.8417
264
Reproduced with permission of the copyright owner. Further reproduction prohibited without permission.

5% Trimmed Mean 3.7577Median 4.0000Variance 1.839Std. Deviation 1.35609Minimum .00Maximum 5.00Range 5.00Interquartile Range 2.00Skewness -1.305 .190Kurtosis 1.201 .378
C4.3 Mean 4.1166 .1031295% Confidence Interval for Mean
Lower Bound
Upper Bound
3.9129
4.3202
5% Trimmed Mean 4.2962Median 5.0000Variance 1.733Std. Deviation 1.31653Minimum .00Maximum 5.00Range 5.00Interquartile Range 1.00Skewness -1.976 .190Kurtosis 3.512 .378
C4.4 Mean 4.3865 .0822595% Confidence Interval for Mean
Lower Bound
Upper Bound
4.2241
4.5489
5% Trimmed Mean 4.5521Median 5.0000Variance 1.103Std. Deviation 1.05013Minimum .00Maximum 5.00Range 5.00Interquartile Range 1.00Skewness -2.545 .190Kurtosis 7.501 .378
265
Reproduced with permission of the copyright owner. Further reproduction prohibited without permission.

E.3.2. Detailed results of t-test
Table E.27: Research Question 2: One-Sample Test for Items in Cl
Test Value = 395% Confidence Interval
of the Difference
t df Sig. (2-tailed)Mean
Difference Lower UpperC1.1 10.120 164 .000 1.03636 .8342 1.2386C1.2 14.868 164 .000 1.24848 1.0827 1.4143C1.3 21.600 164 .000 1.55758 1.4152 1.7000C1.4 6.866 164 .000 .73939 .5268 .9520C1.5 15.725 164 .000 1.38182 1.2083 1.5553
Table E.28: Research Question 2: One-Sample Test for Items in C2
Test Value = 3
t df Sig. (2-tailed)Mean
Difference
95% Confidence Interval of the Difference
Lower UpperC2.1C2.2
16.864
14.146
164
163
.000
.0001.460611.22561
1.2896
1.0545
1.63161.3967
Table E.29: Research Question 2: One-Sample Test for Items in C4
Test Value = 395% Confidence Interval
of the Difference
t df Sig. (2-tailed)Mean
Difference Lower UpperC4.1 20.180 164 .000 1.60606 1.4489 1.7632C4.2 6.046 163 .000 .64024 .4311 .8493C4.3 10.991 164 .000 1.12121 .9198 1.3226C4.4 17.120 164 .000 1.39394 1.2332 1.5547
266
Reproduced with permission of the copyright owner. Further reproduction prohibited without permission.

Table E.30: Research Question 2: Paired Samples Test with Consolidated Change Items
P a i r e d S a m p le s T e s t
Paired Differences
t df Sid. (2-tailed)Mean Std. DeviationStd. Error
Mean
95% Confidence Interval of the
DifferenceLower Upper
Pair 1 C1 - C2 -.15273 .79385 .06180 -.27476 -.03070 -2.471 164 .014Pair 2 C1 - C4 .00081 .71792 .05589 -.10955 .11117 .014 164 .988Pair 3 C 3-C 4 -.33131 1.06663 .08304 -.49527 -.16735 -3.990 164 .000
Table E.31: Research Question 2: Paired Samples Test with Individual Change Items
P a i r e d S a m p le s T e s t
Paired Differences
t df Siq. (2-tailed)Mean Std. DeviationStd. Error
Mean
95% Confidence Interval of the
DifferenceLower Upper
Pair 1 C1.3-C1.5 .17576 .89682 .06982 .03790 .31361 2.517 164 .013Pair 2 C1.2-C1.5 -.13333 1.10174 .08577 -.30269 .03602 -1.555 164 .122Pair 3 C1.1 - C1.2 -.21212 1.26292 .09832 -.40625 -.01799 -2.157 164 .032Pair 4 C1.1 -C1.4 .29697 1.41518 .11017 .07943 .51451 2.696 164 .008Pair 5 C1.1 -C1.2 -.21212 1.26292 .09832 -.40625 -.01799 -2.157 164 .032Pair 6 C4.1 - C4.4 .21212 .82483 .06421 .08533 .33891 3.303 164 .001Pair 7 C4.3 - C4.4 -.27273 1.29428 .10076 -.47168 -.07377 -2.707 164 .008Pair 8 C4.2 - C4.3 -.48171 1.37226 .10716 -.69330 -.27012 -4.495 163 .000
E.3.3. Detailed Results of Reliability Analysis
Table E.32: Research Question 2: Reliability Statistics for Items in Cl
Cronbach'sAlpha
Cronbach's Alpha Based
onStandardized
Items N of Items.819 .834 5
Table E.33: Research Question 2: Inter-Item Correlation Matrix for Items in Cl
C1.1 C1.2 C1.3 C1.4 C1.5C1.1 1.000 .458 .549 .451 .352C1.2 .458 1.000 .697 .375 .503C1.3 .549 .697 1.000 .504 .635C1.4 .451 .375 .504 1.000 .486C1.5 .352 .503 .635 .486 1.000
267
Reproduced with permission of the copyright owner. Further reproduction prohibited without permission.

Table E.34: Research Question 2: Reliability Statistics for Items in C2
Cronbach'sAlpha
Cronbach's Alpha Based
onStandardized
Items N of Items.799 .799 2
Table E.35: Research Question 2: Inter-Item Correlation Matrix for Items in C2
C2.1 C2.2C2.1C2.2
1.000.665
.6651.000
Table E.36: Research Question 2: Reliability Statistics for Items in C4
Cronbach'sAlpha
Cronbach's Alpha Based
onStandardized
Items N of Items.786 .799 4
Table E.37: Research Question 2: Inter-Item Correlation Matrix for Items in C4
C4.1 C4.2 C4.3 C4.4C4.1 1.000 .488 .514 .682C4.2 .488 1.000 .472 .415C4.3 .514 .472 1.000 .415C4.4 .682 .415 .415 1.000
E.4. Research Question 3
The detailed statistical analysis results obtained while investigating the data
corresponding to Research Question 3 are presented in this Section.
Reproduced with permission of the copyright owner. Further reproduction prohibited without permission.

E.4.1. Detailed Descriptive Statistics
Table E.38: Research Question 3: Detailed Descriptive Statistics
Statistic Std. ErrorChall Mean 3.80 .101
95% Confidence Lower Bound 3.60
4.00
Interval for MeanUpper Bound
5% Trimmed Mean 3.93Median 4.00Variance 1.580Std. Deviation 1.257Minimum 0Maximum 5Range 5Interquartile Range 2Skewness -1.237 .194Kurtosis 1.236 .386
Chal2 Mean 3.23 .11295% Confidence Lower Bound 3.01
3.45
Interval for MeanUpper Bound
5% Trimmed Mean 3.31Median 4.00Variance 1.972Std. Deviation 1.404Minimum 0Maximum 5Range 5Interquartile Range 2Skewness -.886 .194Kurtosis .042 .386
Chal3 Mean 3.13 .11395% Confidence Lower Bound 2.90
3.35
Interval for MeanUpper Bound
5% Trimmed Mean 3.20Median 3.00Variance 2.009Std. Deviation 1.417Minimum 0Maximum 5Range 5
269
Reproduced with permission of the copyright owner. Further reproduction prohibited without permission.

Interquartile Range 2Skewness -.822 .194Kurtosis -.111 .386
Chal4 Mean 3.72 .10895% Confidence Lower Bound 3.51
3.94
Interval for MeanUpper Bound
5% Trimmed Mean 3.86Median 4.00Variance 1.827Std. Deviation 1.352Minimum 0Maximum 5Range 5Interquartile Range 2Skewness -1.248 .194Kurtosis 1.220 .386
Chal5 Mean 3.05 .09495% Confidence Lower Bound 2.87
3.24
Interval for MeanUpper Bound
5% Trimmed Mean 3.09Median 3.00Variance 1.378Std. Deviation 1.174Minimum 0Maximum 5Range 5Interquartile Range 2Skewness -.197 .194Kurtosis -.330 .386
Chal6 Mean 2.97 .09695% Confidence Lower Bound 2.78
3.16
Interval for MeanUpper Bound
5% Trimmed Mean 3.00Median 3.00Variance 1.438Std. Deviation 1.199Minimum 0Maximum 5Range 5Interquartile Range 2Skewness -.347 .194
270
Reproduced with permission of the copyright owner. Further reproduction prohibited without permission.

Kurtosis -.353 .386Chal7 Mean 3.51 .098
95% Confidence Lower Bound 3.31
3.70
Interval for MeanUpper Bound
5% Trimmed Mean 3.61Median 4.00Variance 1.503Std. Deviation 1.226Minimum 0Maximum 5Range 5Interquartile Range 1Skewness -1.026 .194Kurtosis .924 .386
Chal8 Mean 3.12 .12795% Confidence Lower Bound 2.86
3.37
Interval for MeanUpper Bound
5% Trimmed Mean 3.18Median 3.00Variance 2.516Std. Deviation 1.586Minimum 0Maximum 5Range 5Interquartile Range 2Skewness -.536 .194Kurtosis -.724 .386
Chal9 Mean 4.09 .11895% Confidence Lower Bound 3.86
4.32
Interval for MeanUpper Bound
5% Trimmed Mean 4.27Median 5.00Variance 2.185Std. Deviation 1.478Minimum 0Maximum 5Range 5Interquartile Range 1Skewness -1.843 .194Kurtosis 2.354 .386
ChaUO Mean 2.85 .128
271
Reproduced with permission of the copyright owner. Further reproduction prohibited without permission.

95% Confidence Lower Bound2.60
3.10
Interval for MeanUpper Bound
5% Trimmed Mean 2.89Median 3.00Variance 2.539Std. Deviation 1.594Minimum 0Maximum 5Range 5Interquartile Range 2Skewness -.317 .194Kurtosis -.973 .386
Chain Mean 3.58 .12095% Confidence Lower Bound 3.34
3.81
Interval for MeanUpper Bound
5% Trimmed Mean 3.70Median 4.00Variance 2.233Std. Deviation 1.494Minimum 0Maximum 5Range 5Interquartile Range 2Skewness -1.267 .194Kurtosis .760 .386
Chah 2 Mean 3.63 .11395% Confidence Lower Bound 3.41
3.86
Interval for MeanUpper Bound
5% Trimmed Mean 3.76Median 4.00Variance 2.001Std. Deviation 1.415Minimum 0Maximum 5Range 5Interquartile Range 2Skewness -1.171 .194Kurtosis .716 .386
Chal13 Mean 3.35 .11295% Confidence Lower Bound 3.13Interval for Mean
272
Reproduced with permission of the copyright owner. Further reproduction prohibited without permission.

Upper Bound3.57
5% Trimmed Mean 3.45Median 4.00Variance 1.946Std. Deviation 1.395Minimum 0Maximum 5Range 5Interquartile Range 1Skewness -.970 .194Kurtosis .324 .386
ChaM 4 Mean 3.32 .11995% Confidence Lower Bound 3.09
3.55
Interval for MeanUpper Bound
5% Trimmed Mean 3.41Median 4.00Variance 2.193Std. Deviation 1.481Minimum 0Maximum 5Range 5Interquartile Range 1Skewness -.917 .194Kurtosis -.018 .386
Chal15 Mean 3.38 .11395% Confidence Lower Bound 3.16
3.61
Interval for MeanUpper Bound
5% Trimmed Mean 3.48Median 4.00Variance 2.006Std. Deviation 1.416Minimum 0Maximum 5Range 5Interquartile Range 1Skewness -.984 .194Kurtosis .288 .386
ChaM 6 Mean 2.83 .13595% Confidence Lower Bound 2.57
3.10
Interval for MeanUpper Bound
273
Reproduced with permission of the copyright owner. Further reproduction prohibited without permission.

5% Trimmed Mean 2.87Median 3.00Variance 2.824Std. Deviation 1.680Minimum 0Maximum 5Range 5Interquartile Range 2Skewness -.502 .194Kurtosis -.944 .386
ChaM 7 Mean 3.52 .10795% Confidence Lower Bound 3.31
3.73
Interval for MeanUpper Bound
5% Trimmed Mean 3.63Median 4.00Variance 1.800Std. Deviation 1.342Minimum 0Maximum 5Range 5Interquartile Range 1Skewness -1.097 .194Kurtosis .801 .386
ChaM 8 Mean 3.12 .11395% Confidence Lower Bound 2.89
3.34
Interval for MeanUpper Bound
5% Trimmed Mean 3.18Median 3.00Variance 2.000Std. Deviation 1.414Minimum 0Maximum 5Range 5Interquartile Range 2Skewness -.651 .194Kurtosis -.306 .386
ChaM 9 Mean 3.18 .11095% Confidence Lower Bound 2.96
3.40
Interval for MeanUpper Bound
5% Trimmed Mean 3.24Median 3.00
274
Reproduced with permission of the copyright owner. Further reproduction prohibited without permission.

Variance 1.903Std. Deviation 1.380Minimum 0Maximum 5Range 5Interquartile Range 2Skewness -.403 .194Kurtosis -.683 .386
275
Reproduced with permission of the copyright owner. Further reproduction prohibited without permission.

Reproduced
with perm
ission of the
copyright owner.
Further reproduction prohibited
without perm
ission.
E.4.2. Inter-Item Correlation
Table E.39: Research Question 3: Inter-item Correlation Matrix
Inter-Item Correlation Matrix
Chall Chal2 Chal3 Chal4 Chal5 Chal6 Chal7 ChalS Chal9 Chall 0 Chall 1 Chall 2 Chall 3 Chall 4 Chall 5 Chall 6 Chall 7 Chall 8 Chall 9Chall 1.000 .545 .434 .260 .129 .253 .388 .393 .239 .249 .168 .304 .316 .395 .395 .204 .291 .340 .352
Chal2 .545 1.000 .565 .234 .267 .288 .501 .466 .291 .433 .342 .452 .288 .479 .338 .271 .391 .165 .148Chal3 .434 .565 1.000 .322 .229 .253 .419 .473 .404 .468 .312 .400 .326 .466 .438 .383 .385 .211 .222
Chal4 .260 .234 .322 1.000 .322 .241 .338 .352 .355 .257 .411 .369 .223 .325 .322 .426 .275 .283 .317
Chal5 .129 .267 .229 .322 1.000 .327 .421 .264 .075 .487 .325 .326 .347 .465 .357 .250 .315 .261 .285Chal6 .253 .288 .253 .241 .327 1.000 .362 .263 .205 .328 .316 .267 .300 .275 .212 .183 .259 .269 .300
Chal7 .388 .501 .419 .338 .421 .362 1.000 .411 .220 .362 .304 .368 .370 .422 .329 .264 .318 .338 .316Chal8 .393 .466 .473 .352 .264 .263 .411 1.000 .384 .418 .402 .364 .355 .454 .477 .349 .414 .259 .368Chal9 .239 .291 .404 .355 .075 .205 .220 .384 1.000 .400 .452 .463 .332 .308 .455 .416 .500 .177 .166
Cha)10 .249 .433 .468 .257 .487 .328 .362 .418 .400 1.000 .418 .397 .299 .504 .486 .345 .483 .314 .282
Chal11 .168 .342 .312 .411 .325 .316 .304 .402 .452 .418 1.000 .671 .289 .359 .355 .406 .422 .246 .341
Chal12 .304 .452 .400 .369 .326 .267 .368 .364 .463 .397 .671 1.000 .432 .527 .418 .427 .532 .399 .325Chall 3 .316 .288 .326 .223 .347 .300 .370 .355 .332 .299 .289 .432 1.000 .495 .457 .328 .381 .411 .312
Chal14 .395 .479 .466 .325 .465 .275 .422 .454 .308 .504 .359 .527 .495 1.000 .547 .439 .458 .343 .328Chal15 .395 .338 .438 .322 .357 .212 .329 .477 .455 .486 .355 .418 .457 .547 1.000 .358 .431 .355 .351Chall 6 .204 .271 .383 .426 .250 .183 .264 .349 .416 .345 .406 .427 .328 .439 .358 1.000 .396 .299 .280Chal17 .291 .391 .385 .275 .315 .259 .318 .414 .500 .483 .422 .532 .381 .458 .431 .396 1.000 .455 .347
Chall 8 .340 .165 .211 .283 .261 .269 .338 .259 .177 .314 .246 .399 .411 .343 .355 .299 .455 1.000 .429
Chall 9 .352 .148 .222 .317 .285 .300 .316 .368 .166 .282 .341 .325 .312 .328 .351 .280 .347 .429 1.000
The covariance matrix is calculated and used in the analysis.

Reproduced
with perm
ission of the
copyright ow
ner. Further
reproduction prohibited
without
permission.
E.4.3. t-Test
Table E.40: Research Question 3: Paired Samples t-Test of Challenge Variables
Paired Differences95% Confidence
Interval of the Difference
MeanStd.
DeviationStd. Error
Mean Lower Upper t df Sig. (2-tailed)
Pair 1 Chall - Chal9 -.292 1.672 .132 -.552 -.032 -2.215 160 .028Pair 2 Chall - Chal4 .087 1.587 .125 -.160 .334 .695 160 .488Pair 3 Chal4 -
Chal12 .088 1.552 .123 -.155 .331 .715 158 .476
Pair 4 Chall 1 - Chal12 -.044 1.182 .094 -.229 .141 -.470 158 .639
Pair 5 Chal11 - Chall 7 .057 1.531 .121 -.183 .296 .466 158 .642
Pair 6 Chal7 - Chall 7 -.025 1.509 .120 -.262 .211 -.210 158 .834
Pair 7 Chal7 - Chall 5 .113 1.534 .122 -.127 .354 .930 158 .354
Pair 8 Chal13 - Chall 5 -.050 1.462 .116 -.279 .179 -.434 158 .665
Pair 9 Chall 3 - Chal14 .019 1.443 .114 -.207 .245 .165 158 .869
Pair10
Chal2 - Chall 4 -.057 1.481 .117 -.289 .175 -.482 158 .630
277

Appendix F Summary of Survey Responses
In this Appendix, we present the consolidated summary (in percentage figures) of responses
corresponding to the different Likert scale items obtained from the survey.
F.1. Success Factors Survey
Table F.l: Summary of Success Factor Survey Responses
1 2 3 4 5 XInd1 0% 1% 1% 20% 77% 1%Ind2 2% 9% 10% 40% 38% 1%Ind3 3% 10% 14% 38% 33% 1%Ind4 0% 3% 12% 38% 46% 1%Ind5Ind5a 14% 15% 5% 17% 49% 0%Ind5b 28% 23% 11% 17% 15% 5%Ind6 3% 2% 4% 11% 79% 1%Ind7Ind7a 1% 6% 7% 22% 63% 0%Ind7b 2% 7% 9% 25% 56% 0%Ind7c 4% 7% 8% 33% 47% 1%Ind7d 1% 7% 14% 35% 42% 1%Ind7e 4% 10% 7% 27% 50% 1%Ind7f 6% 13% 15% 31% 34% 0%Ind7g 10% 12% 8% 22% 47% 0%Ind7h 4% 14% 12% 29% 38% 2%Ind8 9% 14% 15% 35% 26% 1%Ind9 4% 10% 16% 31% 31% 8%Ind10 1% 9% 11% 38% 41% 0%Ind11Ind11a 1% 11% 15% 46% 27% 0%Ind11b 0% 1% 6% 25% 68% 0%Ind11c 0% 2% 7% 39% 50% 0%Ind11d 1% 4% 10% 38% 47% 0%Ind11e 1% 3% 6% 32% 57% 1%Ind11f 1% 6% 7% 26% 59% 0%Ind12Ind12a 5% 6% 12% 37% 38% 1%Ind12b 6% 13% 9% 31% 39% 1%Ind12c 7% 16% 9% 31% 36% 1%Ind12d 6% 15% 8% 24% 46% 1%Ind12e 2% 2% 10% 41% 45% 0%Ind13Ind13a 1% 9% 14% 41% 31% 4%Ind13b 0% 11% 13% 43% 28% 5%Ind13c 1% 8% 18% 36% 30% 6%Ind13d 2% 10% 14% 36% 35% 2%Ind14 2% 3% 11% 39% 45% 0%DependentD1 1% 6% 13% 37% 38% 4%D2 1% 3% 12% 30% 47% 6%D3 0% 2% 7% 24% 64% 2%D4 0% 2% 4% 20% 71% 1%D5 2% 5% 19% 32% 38% 4%
Reproduced with permission of the copyright owner. Further reproduction prohibited without permission.

F.2. Changes Survey
Table F.2: Summary of Changes Survey Responses
1 2 3 4 5 X
C1
C1.1 1% 2% 13% 32% 4 6% 6%C1.2 2% 2% 11% 29% 5 3% 3%C1.3 0% 1% 3% 24% 6 9% 3%
C1.4 2% 5% 13% 39% 33% 6%C1.5 1% 3% 6% 21% 65% 4%
C2
C2.1 1% 2% 3% 23% 67% 4%
C2.2 1% 3% 7% 37% 49% 4%C3 1% 5% 11% 52% 26% 5%
C 4
C4.1 1% 1% 3% 15% 77% 3%C4.2 3% 6% 16% 4 2% 26% 6%C4.3 0% 5% 7% 33% 48% 6%C4.4 0% 2% 7% 27% 60% 3%
F.3. Challenges Survey
Table F.3: Summary of Challenges Survey Responses
1 2 3 4 5 X
Chall 4% 8% 14% 38% 32% 4%Chal2 5% 14% 19% 40% 15% 7%Chal3 7% 10% 25% 36% 13% 8%Chal4 2% 5% 20% 32% 34% 7%Chal5 3% 29% 26% 27% 11% 3%Chal6 7% 25% 23% 32% 9% 4%Chal7 3% 9% 24% 3 8% 21% 4%Chal8 5% 17% 16% 2 5% 24% 12%Chal9 2% 2% 7% 25% 55% 9%ChaMO 10% 17% 21% 22% 18% 13%Chal11 2% 6% 14% 41% 27% 10%Chall 2 3% 8% 16% 37% 29% 7%Chall 3 6% 8% 23% 35% 19% 8%Chall 4 6% 8% 21% 35% 22% 8%Chan 5 6% 8% 23% 36% 19% 7%Chall 6 5% 14% 20% 27% 17% 17%Chall 7 5% 7% 21% 37% 23% 8%Chall 8 8% 12% 26% 3 1% 15% 9%Chall 9 11% 16% 22% 28% 19% 5%
279
Reproduced with permission of the copyright owner. Further reproduction prohibited without permission.