
ADO 2014_2014-04-01_NEPAL
18
1
-
Upload
chandan-sapkota -
Category
Documents
-
view
218 -
download
3
Transcript of ADO 2014_2014-04-01_NEPAL

1
Asian Development Outlook (ADO) 2014: NEPAL
Chandan Sapkota
Asian Development Bank
Nepal Resident Mission
ADO launch (press conference), Kathmandu, 01 April 2014
2014-04-01 2
The views expressed in this document are those of the author and do not necessarily reflect the views and policies of the Asian Development Bank, or its Board of Governors, or the governments they represent.

2014-04-01 3
Presentation Outline
• FY2013 Economic Performance • GDP growth
• Inflation
• External sector
• Fiscal and monetary developments
• FY2014 and FY2015 Economic Prospects • GDP growth
• Inflation
• External sector
• Policy Challenge: Taming High Inflation
• Medium-term Economic Challenges

• Significant drop in agriculture output and the delay in introducing a full budget dragged down GDP growth.
• Inflation remained high.
• Current account surplus contracted as remittance inflows decelerated.
2014-04-01 4
FY2013 Economic Performance

2014-04-01 5
GDP Growth (Basic Prices)
3.9 4.3
3.8 4.5
3.6
-2
0
2
4
6
2009 2010 2011 2012 2013
Percentage points
Supply-side contributions to growth
Services Industry Agriculture GDP
GDP growth decelerated to 3.6% in FY2013 • Unfavorable monsoon • Shortage of chemical fertilizers • Delayed full FY2013 budget • Weak industrial sector
Growth driven by: • Services sector (wholesale and
retail trade; hotels and restaurants)
2014-04-01 6
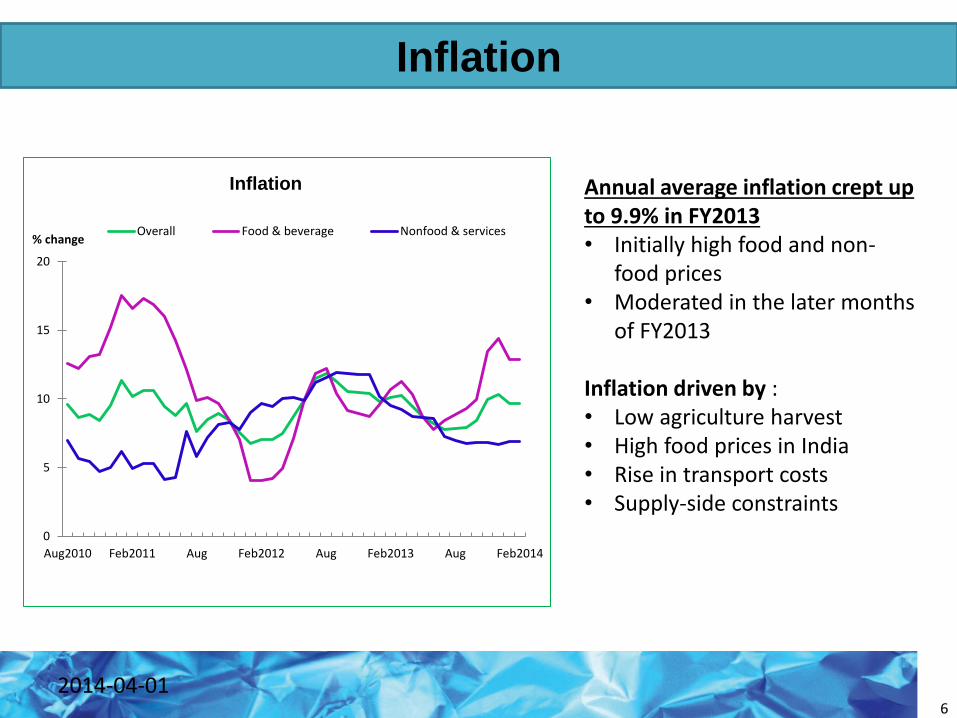
Inflation
Annual average inflation crept up to 9.9% in FY2013 • Initially high food and non-
food prices • Moderated in the later months
of FY2013
Inflation driven by : • Low agriculture harvest • High food prices in India • Rise in transport costs • Supply-side constraints
0
5
10
15
20
Aug2010 Feb2011 Aug Feb2012 Aug Feb2013 Aug Feb2014
% change
Inflation
Overall Food & beverage Nonfood & services

2014-04-01 7
External Sector
Current account surplus narrowed to 3.4% of GDP in FY2013 • Deceleration of remittance
inflows • Increase in trade deficit
• BOP surplus moderated to $786.5 million
• Forex reserves increased to $5.6 billion • Covers 9.3 months of
imports of goods and services
-30
-20
-10
0
10
20
30
2009 2010 2011 2012 2013
% of GDP
Trade, tourism, and workers' remittances
Trade balance Remittances Tourism (travel) Current account balance

2014-04-01 8
Fiscal and Monetary Developments
-5
0
5
10
15
20
25
2009 2010 2011 2012 2013 2014BE
% of GDP
Fiscal indicators Recurrent expenditure Capital expenditureRevenue including grants Deficit
0
5
10
15
20
25
30
35
2009 2010 2011 2012 2013
% change Credit to private sector
Budget surplus: 0.4% of GDP • Total expenditure growth slowed
• Delayed FY2013 full budget • Weak implementation capacity
• Actual capital expenditure just 81% of planned capital expenditure
• Strong revenue performance
Consolidation of BFIs Credit to private sector increased
• Largest credit increase to construction, wholesale and retail trade, services and mines
• Annual average weighted lending rate remained stable at around 12%

• Economic outlook optimistic than FY2013 • Successful second Constituent Assembly elections
• Favorable monsoon
• Strengthening of remittance inflows
• Improved business and investor confidence
• Downside risk of political instability • Unsettled constitutional and governance issues
2014-04-01 9
FY2014 and FY2015 Economic Prospects

FY2014: 4.5%
• Favorable monsoon
• More rapid growth of remittance inflows
• Timely FY2014 full budget
• Political stability
• Improved business confidence
FY2015: 4.7%
• Normal monsoon
• Timely full budget
• Continued strong remittance inflows
• Rebound of real estate and housing markets
• Better growth outlook in India
2014-04-01 10
GDP Growth Outlook for FY2014 and FY2015

FY2014: 10%
• Wage pressures
• Higher administered fuel prices
• High inflation in India
• Weak currency
• Persistent energy deficit
• Supply-side constraints
FY2015: 9.5%
• Good harvest
• Lower inflation in India
• Cautious monetary and fiscal policies
• Subsiding domestic wage pressures
2014-04-01 11
Inflation Outlook for FY2014 and FY2015

FY2014: 3.6% of GDP
• Improved growth of exports
• Higher remittance inflows
• Higher tourism income
• Further pick up in exports growth
• Moderation in import demand
• Sustained remittance inflows
2014-04-01 12
External Sector Outlook for FY2014 and FY2015
FY2015: 3.7% of GDP

Age of high prices! Average inflation > 9% since
FY2009 (except FY2012: 8.3%)
12.6% in FY2009 highest in the past 2 decades
Food inflation averaged 11.8% in the past 4 years
High costs of inflation • Erodes consumer’s purchasing
power
• Makes producers less competitive
2014-04-01 13
Policy Challenge: Taming High Inflation
0
2
4
6
8
10
12
14
16
18
20
% change
Average food and non-food inflation
Food & bevereges inflation Non food & services inflationOverall inflation
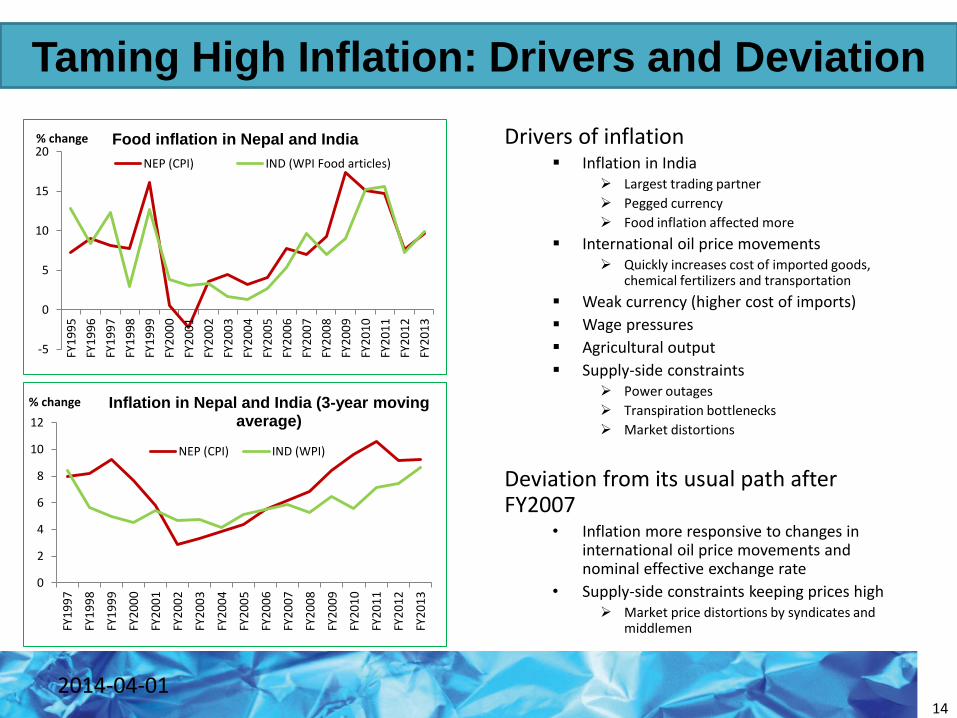
Drivers of inflation Inflation in India
Largest trading partner
Pegged currency
Food inflation affected more
International oil price movements Quickly increases cost of imported goods,
chemical fertilizers and transportation
Weak currency (higher cost of imports)
Wage pressures
Agricultural output
Supply-side constraints Power outages
Transpiration bottlenecks
Market distortions
Deviation from its usual path after FY2007
• Inflation more responsive to changes in international oil price movements and nominal effective exchange rate
• Supply-side constraints keeping prices high Market price distortions by syndicates and
middlemen
2014-04-01 14
Taming High Inflation: Drivers and Deviation
-5
0
5
10
15
20
FY1
99
5
FY1
99
6
FY1
99
7
FY1
99
8
FY1
99
9
FY2
00
0
FY2
00
1
FY2
00
2
FY2
00
3
FY2
00
4
FY2
00
5
FY2
00
6
FY2
00
7
FY2
00
8
FY2
00
9
FY2
01
0
FY2
01
1
FY2
01
2
FY2
01
3
% change Food inflation in Nepal and India
NEP (CPI) IND (WPI Food articles)
0
2
4
6
8
10
12
FY1
99
7
FY1
99
8
FY1
99
9
FY2
00
0
FY2
00
1
FY2
00
2
FY2
00
3
FY2
00
4
FY2
00
5
FY2
00
6
FY2
00
7
FY2
00
8
FY2
00
9
FY2
01
0
FY2
01
1
FY2
01
2
FY2
01
3
% change Inflation in Nepal and India (3-year moving average)
NEP (CPI) IND (WPI)

• Monetary policies are less effective • Effect tends to fade away quickly
• Rectify market distortions • Effective market supervision and monitoring
• Ban syndicates and anti-competitive practices
• Check inflationary expectations • Prudent fiscal and monetary policies
• Remove uncertainty over supplies of fuel and cooking gas
• Boost agricultural production
• Effectively address structural bottlenecks
2014-04-01
15
Taming High Inflation: Policy Options

Fiscal management Rationalization of recurrent expenditure Higher quantum and quality of capital expenditure Boosting overall absorptive capacity and effective budget execution Rationalizing fuel and electricity tariffs to reflect true import and production costs, respectively Good governance (sound PFM) Fiscal policy for inclusive growth:
Public expenditure have stronger impact on income distribution than changes in revenue Increase public spending on education and healthcare, targeted subsidies, and physical infrastructure Strengthened revenue mobilization financially enables government to take on the above measures
Improved investment climate
Enacting revised Electricity Act, Labor Act, Industrial Enterprises Act, SEZ Act, FITT Act, [PPP Act] Political and policy stability Adequate electricity supply Industrial relations and labor productivity
Financial sector stability Consolidation of BFIs Enhanced monitoring, supervision and regulation (both BFIs and cooperatives) Rethinking directed lending Sound corporate governance Liquidity management
2014-04-01 16
Medium-term Economic Challenges [1]

Strong manufacturing sector and export competitiveness Shift from low value added and low productivity activities to high value added and high productivity
activities (manufacturing, high productivity agriculture and services activities) Boost export competitiveness by tackling supply-side constraints, namely lack of adequate and
quality infrastructure, political instability and strikes, recurring labor disputes, lack of skilled human resources, deficient research and development, and policy inconsistencies and implementation paralysis
Taming high inflation Monetary policies less effective Rectify market distortions Ban syndicates and anti-competitive practices Check inflationary expectations Boost agriculture production Effectively address structural bottlenecks
Management of migration and remittances Wider literacy on pros and cons of overseas migration for work Skills development Reduction in transaction/transfer costs Attractive foreign employment bond Easing cost of doing business, especially for SMEs Financial literacy Innovative loan products to migrants and remittance-receiving households
2014-04-01 17
Medium-term Economic Challenges [2]

2014-04-01 18
THANK YOU!
Selected economic indicators (%)
2014 2015
GDP growth 4.5 4.7
Inflation 10.0 9.5
Current account balance (share of GDP) 3.6 3.7
![Biomass Auto Guard Ado] Auto Guard Ado]](https://static.fdocuments.net/doc/165x107/577d2a201a28ab4e1ea8b9ec/biomass-auto-guard-ado-auto-guard-ado.jpg)


![fne 2014_2014 - 2015 manual de apoio ao docente desempregado [01 set].pdf](https://static.fdocuments.net/doc/165x107/577cc5781a28aba7119c7c97/fne-20142014-2015-manual-de-apoio-ao-docente-desempregado-01-setpdf.jpg)


