Admiral Group plc Annual Report and Accounts 2016 · PDF fileAdmiral Group plc Annual Report...
148
Annual Report and Accounts 2016
Transcript of Admiral Group plc Annual Report and Accounts 2016 · PDF fileAdmiral Group plc Annual Report...

Registered office
Tŷ Admiral
David Street
Cardiff CF10 2EH
www.admiralgroup.co.uk
Annual Report and Accounts 2016
Adm
iral Group plc
Annual R
eport and Accounts 2016


01Admiral Group plc · Annual Report and Accounts 2016
Absolute focus on delivering what the customer wants
4.3mUK customers
Introduction03 Highlights
Strategic report 04 Chairman’s statement 08 What we do and where we work 12 How we do it – our model14 How we do it – our strategy16 Chief Executive’s Statement18 Chief Financial Officer’s review20 Group financial review23 UK Insurance review30 International Car Insurance review36 Price Comparison review40 Principal risks and uncertainties
Corporate Governance 44 Governance overview46 Board of Directors48 Governance Report54 The Audit Committee58 The Group Risk Committee62 The Nomination Committee64 The Remuneration Committee65 Directors’ Remuneration Report78 Directors’ Report
Financial statements82 Independent Auditor’s Report88 Consolidated Income statement89 Consolidated statement of
comprehensive income90 Consolidated statement of
financial position 91 Consolidated cash flow statement92 Consolidated statement of
changes in equity93 Notes to the financial statements133 Parent Company Financial Statements 136 Notes to Parent Company
Financial Statements140 Consolidated Financial Summary
Additional information 141 Glossary144 Directors and advisors
Contents
What a great… year Read more on Page 03
What a great… business Read more on Page 08
What a great… performance Read more on Page 16
What a great… customer experience Read more on Page 28
What a great… place to work Read more on Page 34
What a great… view Read more on Page 44
Financial Statements Additional InformationCorporate GovernanceStrategic Report Introduction
International customers
864,200
01Admiral Group plc · Annual Report and Accounts 2016

Introduction: Highlights
02 Admiral Group plc · Annual Report and Accounts 2016

“ 2016 saw very strong advances in turnover (a record and 22% higher than 2015), customer numbers (another record at 5.2 million) and net revenue (up 13% to £1 billion)”
Geraint Jones, Chief Financial Officer
What a great… year
Group highlightsGroup’s share of profit before tax*1 (Pre Ogden) of £389.7 million (2015: £376.8 million)
Group’s share of profit before tax*1 (Post Ogden) of £284.3 million (2015: £376.8 million)
Group statutory profit before tax of £278.4 million (2015: £368.7 million)
Earnings per share (Pre Ogden) of 109.6 pence (2015: 107.3 pence)
Earnings per share (Post Ogden) of 78.7 pence (2015: 107.3 pence)
Final dividend of 51.5 pence per share, bringing full year dividend to 114.4 pence per share (2015: 114.4 pence)
Return on equity*1 of 37% (2015: 49%)
Group turnover*1 of £2.58 billion (2015: £2.12 billion)
Group net revenue of £1.0 billion (2015: £0.9 billion)
Group customers*1 of 5.15 million (2015: 4.43 million)
UK insurance customers*1 of 4.12 million (2015: 3.61 million)
International car insurance customers*1 of 864,200 (2015: 673,000)
Group’s share of price comparison profit before tax*1 of £2.7 million (2015: loss of £7.2 million)
Statutory price comparison result of £2.9 million loss (2015: loss of £15.5 million)
Solvency ratio (post dividend)*2 of 212% (2015: 206%)
Almost 9,000 staff eligible to receive free shares worth a total of £3,600 each in the employee share scheme based on the full year 2016 results
Financial highlights
2016 2016
2016 2016
389.7
£389.7m
109.6p
£2.58bn
5.15m
£383.8m
49%
£1.02bn
114.4p
£284.3m
78.7p
£278.4m
37%
383.8
109.6 49
2016 2016
2016 2016
284.3 278.4
78.7 37
2015 2015
2015 2015
2014 2014
2014 2014
376.8 368.7
107.3 49
356.5 350.7
103.0 52
Group’s share of profit before tax (£million)
Earnings per share (pence)
Turnover (£billion)
Customers (million)
Pre Ogden
Pre Ogden
Pre Ogden
Pre Ogden
Post Ogden
Post Ogden
Post Ogden
Post Ogden
Statutory profit before tax (£million)
Return on equity (%)
Net revenue (£billion)
Full year dividend per share (pence)
Financial Statements Additional InformationCorporate GovernanceStrategic Report Introduction
*1 Alternative Performance Measures – refer to the Glossary on page 141 for definition and explanation.
*2 Refer to capital and financial position section for further information
2016 2016
2016 2016
2.58 1.02
5.15 114.4
114.4
2015 2015
2015 2015
2014 2014
2014 2014
2.12 0.90
4.43
1.97 0.88
4.05 98.4
pre Ogden pre Ogden
pre Ogden pre Ogden
post Ogden post Ogden
post Ogden post Ogden
03Admiral Group plc · Annual Report and Accounts 2016

“ I have thoroughly enjoyed every year I have chaired Admiral. It is a special business”
Chairman’s statement
SuccessionAs announced recently this will be my last statement as Chairman as I shall be retiring at the forthcoming AGM. Given Admiral’s distinctive culture which underpins the success the business has achieved I have considered it my responsibility to ensure the Board should have a choice of strong internal candidates as my successor. I am very grateful to Penny James for leading the selection process which confirmed that the Board already had within its ranks individuals with the skills and experience to lead the Board through the challenges of the next five to ten years. I am delighted that as the outcome to that process the Board has selected Annette Court as my successor and I wish her every success.
If I may be excused a little nostalgia, when I became Chairman in June 2000 Admiral provided private car insurance in the UK to 512k customers with a 3% market share and employed 1,270 people just in Cardiff and Swansea. Turnover and profitability in 2000 were £262 million and £24 million respectively. We now have 5.2 million customers across 5 countries and employ almost 9,000 people across 16 sites and 8 countries. 2016 turnover and profits achieved £2.6 billion and £284 million, or £390 million if we back out the impact of the Ogden rate change – that’s almost a 10-fold increase in turnover and a 16-fold increase in profitability in 16 years. We are valued at over £5 billion and are ranked 84 in the FTSE. We have 5 motor insurance businesses; 4 price comparison businesses; a household insurance business; 2 legal businesses; a start-up loans business and not to mention a price comparison incubator.
The essence of AdmiralOn the one hand Admiral has changed enormously, on the other not very much at all. Fundamental to our success remains our culture – Admiral is different in the way in which we engage and lead our people: in demonstrating in so many practical ways that
everyone matters regardless of their role: in how we motivate their aiming for continuous improvement in everything they do: in our use of teamwork and our openness to share and support others to do a great job, whether or not they are in the same department, business, or even country: in our use of wide share ownership, both actual and potential, as a driver of common purpose. To maintain a culture requires it to be continually reinforced – to be lived by our leaders in the way in which they interact with those they lead: to be trained into our people as part of our development plans: to be the basis on which we select those who should be promoted to greater responsibility. I consider one of our management’s greatest achievements to be that as we have broadened our base, both geographically and by business-line, we have been able to establish that culture in these new businesses. Whichever of Admiral’s offices I visit, from Seville to Swansea, I know I am in Admiral because of the way in which our people interact with our customers and with each other; their quest to identify the small changes in what we do and how we do it that, taken together, create a big competitive difference; and their openness to discuss problems and willingness to embrace the thoughts of others.
Test and learn has always been core to Admiral’s culture. Rather than spending a lot of time analysing an opportunity from every perspective and then committing a large investment we would rather make a small investment of time and/or money quickly and learn by doing. Partnering test and learn is the willingness to acknowledge openly when something hasn’t worked and either change or move on recognising these as opportunities to improve rather than mistakes for which blame should be attributed. This approach of test and learn is central to our assessing which we will pursue seriously amongst the other business lines that could complement our core strengths in car insurance, either because our customers
2000
512kcustomers
just in the UK
2016
5.2mcustomers across
5 countries
Alastair Lyons, CBE Chairman
04 Admiral Group plc · Annual Report and Accounts 2016
Strategic Report: Chairman’s statement

would view the new products as relevant to their existing relationship with Admiral or because the new line of business uses experience and skills that we have developed for car insurance. Our current piloting of personal loans is a case in point here, whilst our UK household insurance portfolio of 470,000 policies and already profitable three years after launch is a great example of a line of business that has passed successfully from pilot into full production.
Whilst we devote time and resource to exploring new opportunities outside of car insurance we also recognise fully that this remains our core focus with significant potential for growth beyond our current 13% market share as and when it is the right point in the cycle to grow. So the capability required to develop our business must be, and is, incremental to, rather than dilutive of, our core. We continue to invest as much thought and resource as we ever have in improving the effectiveness of our motor insurance proposition, whether it be in pricing analytics, claims management, or customer self-service. However we also recognise that if we are to develop successfully new lines of business such as personal loans we need to add new skills and experience to our existing management whilst at the same time assimilating this new talent within our distinctive culture.
We are also strong believers in the potential of partnership to combine the skills, experience and resources of others with those that Admiral has developed and to share both risk and reward when entering new markets, particularly those that require material levels of investment. Our long term partnership with Munich Re has lasted for 17 years and is committed through to at least 2020 in the UK: we are partnering with Mapfre in Spanish and US price comparison and in Preminen, our price comparison incubator: White Mountains, the US insurance venture capital specialist, is also invested alongside Admiral in compare.com
What we do Read more on Page 10
How we do it Read more on Page 12
“The agent who set up my policy, Kath, was excellent. She was extremely efficient and was able to quickly sort out a quote for me based on two vehicles and a household on a multi-product policy. She was also able to cancel the previous two policies. I don’t know what you’re feeding these folks, but these aren’t just normal agents, they’re some kind of ‘super-agents’” UK New Business
A great customer experience
which has made strong progress again this year, increasing the number of insurer partners and, therefore, the number of quotes returned to customers, driving down cost per sale, and raising its penetration of its target markets. But changing the pattern of distribution in US auto insurance is a big nut to crack and we may take others into partnership along this journey.
2016 in overviewThis year’s performance is testament to our focussing successfully on our core UK motor business, our book growing by 11% to 3.6 million cars, a 13% market share whilst UK motor generated profits of £441 million (before the impact of the Ogden rate change), maintaining last year’s level. The UK motor profit after the impact of the Ogden change is £336 million. We have continued to take advantage of firm market conditions to move prices ahead a little more slowly than the average of the market allowing us to grow our book whilst returning a good underwriting result for Admiral and its reinsurance partners. Effective pricing supported by data analysis and predictive modelling, and really insightful claims management underpin our success and we are always looking for new ways to make risk analysis more reflective of the characteristics of the individual driver. In this vein we believe we are now the largest deployer of telematics in the UK.
2016 was broadly a year of growth across our insurance businesses outside the UK, taking advantage of the sound platforms that have now been created in Italy, the US, and Spain and the move in France last year to in-source all our operations as the precursor of growth. In the US we had 20% more customers at the end of 2016 than at the beginning, whilst our European operations grew by 31%. The insurance business model in the US is different to Europe with much higher new business acquisition costs, so growth requires investment. In Europe, there will also be periods when countries decide the market conditions are right to accelerate which may in turn justify further investment, as in Spain this year.
Our price comparison sector combines a highly competitive operation in a largely mature market (Confused); market-leading players with large market shares but whose challenge is growth in markets where there is little incentive for customers to look to switch insurers (Rastreator and LeLynx); and a business that is seeking to rewrite the rules of insurance customer engagement (compare.com). Across the piece our combined price comparison operations made a small profit, supported by encouraging progress by Confused as it seeks to establish a differentiated market positioning as ‘No. 1 for car savings’.
Financial Statements Additional InformationCorporate GovernanceIntroduction
05Admiral Group plc · Annual Report and Accounts 2016
Strategic Report

For the last couple of months the resetting of the Ogden rate by the Ministry of Justice has represented a significant area of uncertainty outside of our control. The announcement on 27 February 2017 by the Lord Chancellor of the new rate of minus 0.75% has allowed this to be reflected within our 2016 accounts and represents a very material reduction from the previous 2.5% rate, increasing claims reserves by more than we would want to absorb within the, albeit significant, margin that we hold over best estimate. We have, therefore, reduced our second half reported results by £105 million, and to a much lesser extent the profits of subsequent years will also be reduced as the affected claims settle. Given, however, our strong capital position, this has not impacted our ability to maintain our 2016 final dividend at the level we declared in 2015. We anticipate that if market pricing adjusts future premiums to reflect the lower discount rate, there will be no significant impact on future business and its profitability after the change. We strongly support the ABI’s call for a fundamental review of the basis on which the Ogden rate is set in order to ensure that the relevant compensation awards are set appropriately and welcome the intent of the Lord Chancellor and the Chancellor of the Exchequer to implement this review expeditiously.
A proposed final dividend of 51.5 pence per share brings dividends for the year to 114.4 pence per share, a yield of 6.3% on the £18.18 share price at the 2016 year end.
The teamMay last year marked the retirement of Henry Engelhardt after 25 years as Chief Executive albeit I am delighted he is continuing to give us some of his time working in the UK and overseas. That the transition from Henry to David Stevens has been seamless is itself testament to Admiral’s culture of teamwork and open management. Henry always said that he would time his retirement when he judged the business had the required depth of management and over the years the Board has focussed on understanding the talent emerging within the business and how it has been, and is planned to be, developed. It is, therefore, very gratifying to see David now ably supported by Cristina Nestares leading the UK Insurance business, with Alistair Hargreaves working alongside her, and by Milena Mondini leading the European insurance businesses. Cristina and Milena have both been with Admiral for 11 years having founded, and successfully developed, our Spanish and Italian insurance businesses and then broadened their management responsibilities leading to their current roles. Alistair has been with Admiral eight years, having begun his career in finance and investor relations and then taken increasingly significant management roles within the UK motor business. Development and recruitment of management talent is a core enabler of Admiral’s continued growth and development and I am very encouraged by the quality and potential of those I meet in middle and senior management positions as I spend time across our various businesses.
Thank youI have thoroughly enjoyed every year I have chaired Admiral. It is a special business because of the way in which it does business, its absolute focus on delivering what the customer wants, and its beliefs that if people enjoy what they are doing and own part of the business that employs them they will do a better job. In the same way as Admiral seeks to assess the right price for each driver as an individual so it respects the contribution of each individual who works with us, caring about their well-being and giving them the opportunity to develop and progress to fulfil their individual potential. It is a company with which I am very proud to have been associated and I thank everyone in Admiral with whom I have worked for a great experience.
With a core business in such good form, a nursery of other businesses at varying stages of maturity, and a hothouse of opportunities which may or may not take root and get planted out, but most of all with the people we have in the business, I am confident that Admiral will continue to develop and prosper over the next 16 years as it has over the last.
Alastair Lyons, CBEChairman 7 March 2017
Chairman’s statement continued
06 Admiral Group plc · Annual Report and Accounts 2016
Strategic Report: Chairman’s statement

Our year in pictures1. ConTe winning 2nd best
large work place 2016 in Great Place to Work® in Italy 2016
2. Henry and Diane’s gift of £1,000 to each member of staff
3. Confused.com’s new advertising campaign with James Corden
4. David’s first day as CEO
5. Elephant starts selling in two new US states
6. 5 millionth customer
7. Admiral Seguros’ 10th birthday
1 2
3
5
4 76
Financial Statements Additional InformationCorporate GovernanceStrategic Report Introduction
07Admiral Group plc · Annual Report and Accounts 2016

What a great… business
Admiral Group is one of the UK’s largest and most recognised car insurance providers, with market leading financial results.
How we do it
See our strategy on Page 14
View our business model on Page 12
Read more on Page 10
What we do
UK Car Insurance
Price ComparisonInternational Car Insurance
UK Household Insurance
Great place to work
Shareholder returns
Efficient capital
employment
Focus on profitability
Controlled test & learn
Investing in our core
Investing in our future
08 Admiral Group plc · Annual Report and Accounts 2016
Strategic Report: What we do and where we work

1
24 3
7
6
5
Where we work
Admiral offers motor and household insurance in the UK and the Group includes Confused.com, a leading price comparison website. Outside the UK, Admiral owns four insurance and three price comparison businesses.
1. UK
Admiral
Bell
Diamond
elephant.co.uk
Confused.com
Admiral Household
Gladiator
Admiral Law
BDE Law
Admiral Loans
2. France
L’olivier – assurance auto
LeLynx
3. Italy
ConTe
4. Spain
Balumba
Qualitas Auto
Rastreator
Seguros.es
5. USA
Elephant Auto
compare.com
6. Canada
Admiral
7. India
Admiral Solutions
Admiral Technologies
Global
Preminen
9,000staff employed
Financial Statements Additional InformationCorporate GovernanceStrategic Report Introduction
09Admiral Group plc · Annual Report and Accounts 2016
What we do
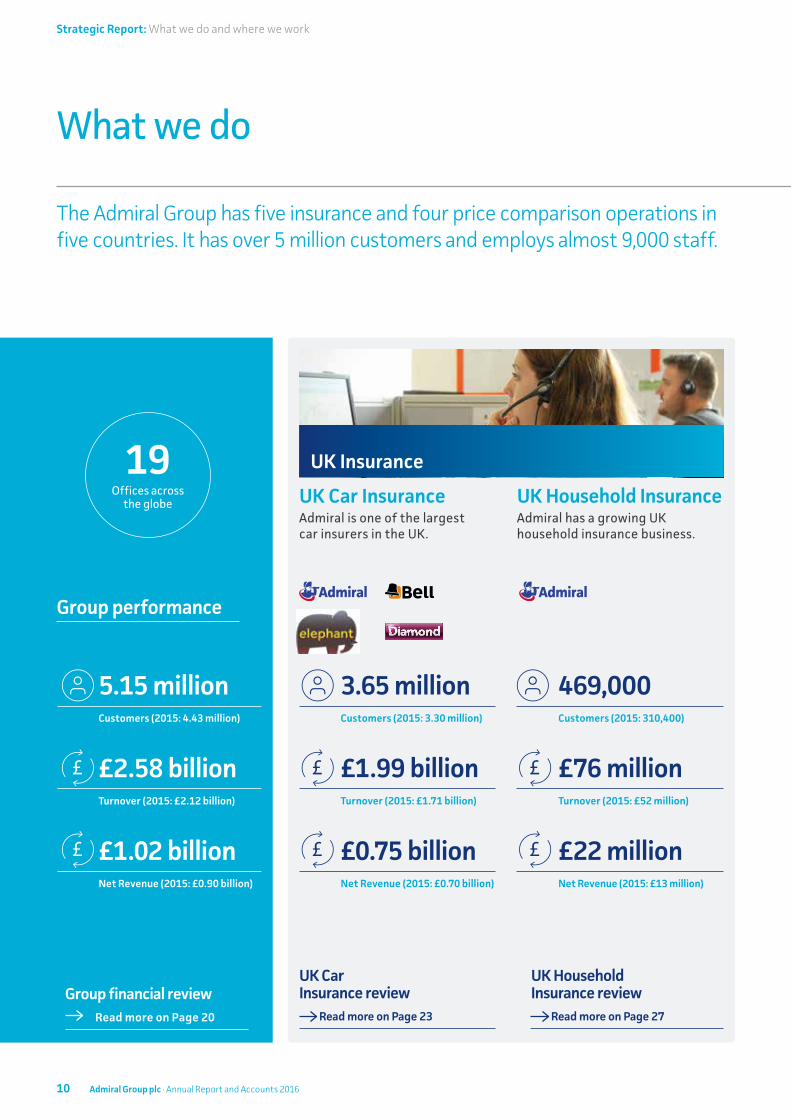
The Admiral Group has five insurance and four price comparison operations in five countries. It has over 5 million customers and employs almost 9,000 staff.
UK Car Insurance review
Read more on Page 23
UK Household Insurance review
Read more on Page 27
UK Car InsuranceAdmiral is one of the largest car insurers in the UK.
UK Household InsuranceAdmiral has a growing UK household insurance business.
UK Insurance
3.65 millionCustomers (2015: 3.30 million)
£1.99 billionTurnover (2015: £1.71 billion)
£0.75 billionNet Revenue (2015: £0.70 billion)
469,000Customers (2015: 310,400)
£76 millionTurnover (2015: £52 million)
£22 millionNet Revenue (2015: £13 million)
Group performance
5.15 millionCustomers (2015: 4.43 million)
£2.58 billionTurnover (2015: £2.12 billion)
£1.02 billionNet Revenue (2015: £0.90 billion)
Group financial review Read more on Page 20
19Offices across
the globe
10 Admiral Group plc · Annual Report and Accounts 2016
Strategic Report: What we do and where we work

International Car Insurance review
Read more on Page 30
Price Comparison review Read more on Page 36
Growing car insurance businesses in Spain, Italy, France and the US.
Confused.com, one of the UK’s leading price comparison websites, profitable operations in Spain and France, and a developing business in the US.
Commercial vehicle insurance broking and other central costs (including share scheme charges and finance costs).
864,200Customers (2015: 673,000)
£366 millionTurnover (2015: £232 million)
£107 millionNet Revenue (2015: £72 million)
21.5 millionQuotes (2015: 19.5 million)
£129 millionTurnover (2015: £108 million)
£129 millionNet Revenue (2015: £108 million)
170,800Customers (2015: 146,600)
International Car Insurance Price Comparison Other Group items
“Spoke to both Gabrielle and Josh. They were both extremely professional and friendly. I am very happy with the service provided today, I feel they both went above and beyond to ensure I got the best quote possible. I am very happy to be staying with Diamond for another year :)”
UK Renewals
A great customer experience
Financial Statements Additional InformationCorporate GovernanceStrategic Report Introduction
11Admiral Group plc · Annual Report and Accounts 2016

Every day revolves around attracting, keeping and satisfying customers. We value customers above everything else and strive to design products that customers want and that represent value for money.
How we do it – our model
We go out of our way to make Admiral a GREAT place to work and believe that if people like what they do, they’ll do it better. We have created an environment where Admiral employees look forward to coming to work and providing great service to customers.
Sharing risk with co- and reinsurance partners is an important part of Admiral’s business and these relationships are underpinned by strong underwriting results. Sharing risk allows Admiral to only provide capital backing for a minority of its business; this results in a superior return on capital for Admiral shareholders whilst also providing protection for losses.
We are committed to returning excess capital to shareholders. We believe that keeping management hungry for cash keeps them focused on the most important aspects of the business. We don’t starve our businesses, but neither do we allow them the luxury of excess capital.
Admiral continues to focus on bottom-line profitability both in the short, medium and long term, and this perspective guides the decisions we make across all of our business operations. The Group’s strategy is to build profitable and sustainable business operations for the long term.
All our growth, at home and overseas, has been organic. We have built each business from the ground up, identifying and understanding the opportunity, taking measured steps to test how well we understand the challenge ahead and the effectiveness of our solutions, and then to learn from that experience and from the experience of those who have tried other strategies.
Satisfied customers
Valued loyal customers
Great place to work
Motivated employees
Shareholder returns
Focused management team
Efficient capital employment
Risk mitigation
Focus on profitability
Sustainable operations
Controlled test and learn
Effective solutions
12 Admiral Group plc · Annual Report and Accounts 2016
Strategic Report: How we do it – our model

Customer feedback
Customers who would renew following a claim (%)
95%
Target: >85%
Customer Service feed back score (max. 10)
9.2
Target: >8.0
Complaints per 1,000 vehicles
1.0
Target: <1.4
“Abbey was amazing throughout the calls she made for several days to get me a better deal for my two cars and home insurance, She’s definitely a good sales person, very enthusiastic and intelligent.”
UK New Business
A great customer experience
95
1.01.01.0
2016
2016
2016
2015
2015
2015
2014
2014
2014
9494
9.29.19.2
Financial Statements Additional InformationCorporate GovernanceStrategic Report Introduction
13Admiral Group plc · Annual Report and Accounts 2016

How we do it – our strategy
Our strategy is simple: To continue to grow in the UK insurance market whilst taking what we do well to new markets and products.
Sustained Competitive AdvantageMaintain strong performance of our UK Car Insurance business.
Price ComparisonDevelop websites that allow consumers to compare a range of general insurance, financial services and other products.
Respond to 2017 market conditions and price effectively to underwrite profitable business whilst providing customer value for money. Maintain a cost conscious culture with a focus on expenses and costs.
Focus on the UK driver centric strategy and develop new products to help UK drivers save time and money.
Develop and grow a multi-product strategy in Europe and beyond.
Take advantage of growth opportunities and disruption in the UK motor and household insurance markets to grow the UK insurance business.
Increase customer retention by providing an excellent level of customer service.
Continue to build the brand profiles developed by our strong management teams.
Take advantage of changes in markets, regulations and consumer shopping habits to grow policy base.
Identify and take advantage of new technology to develop products for customers that add value.
Identify whether there are products outside of insurance in the UK that play to our strengths. Test and learn and understand if there is an opportunity to create a competitive advantage and differentiation.
Test and learn from Admiral Loans – primarily unsecured personal lending initially focused on our existing customer base but with the potential to expand beyond that.
Continued GrowthGrow profitably our share of the UK private motor and household markets whilst giving excellent service to customers.
International InsuranceDevelop profitable, growing, sustainable insurance businesses that mirror the UK model.
Continued DevelopmentMaximise the value of our core business and lay the foundation for growth.
UK New ProductsDevelop a competitive advantage in products beyond insurance.
Objectives 2017 Focus
Investing in our core
Investing in our future
14 Admiral Group plc · Annual Report and Accounts 2016
Strategic Report: How we do it – our strategy
What a great… business
Read more on Page 08
Key performance indicators Our strategy in action
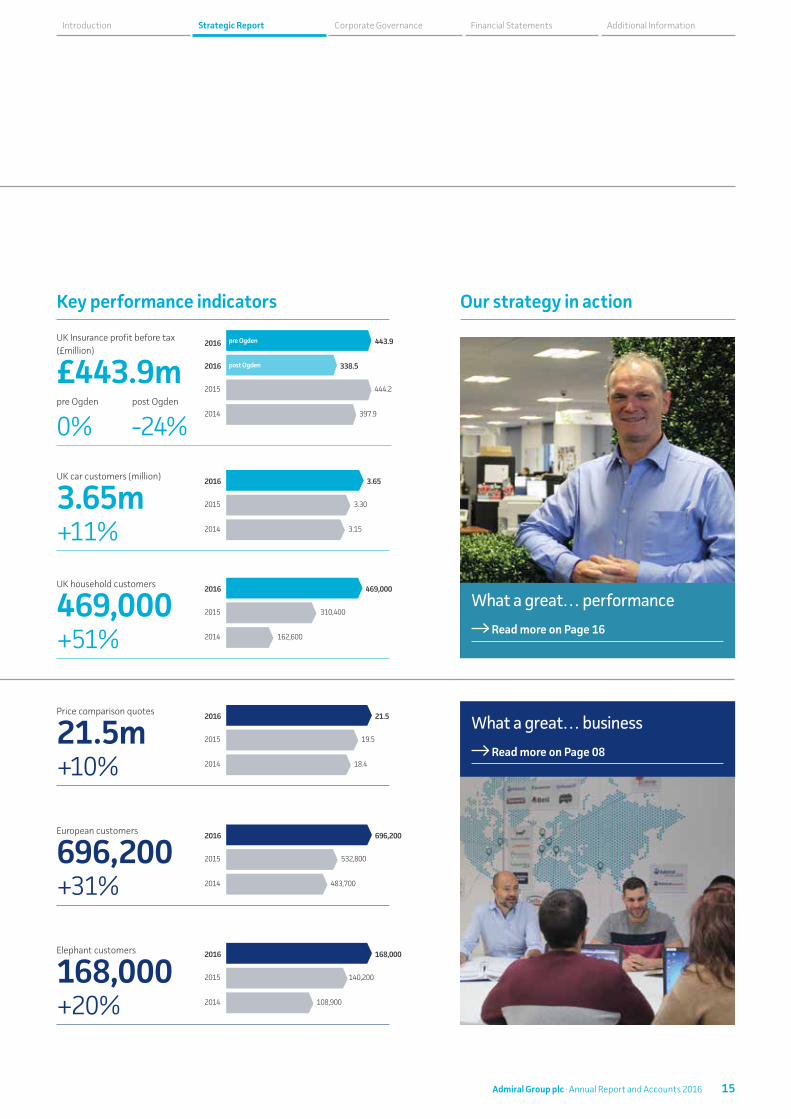
UK Insurance profit before tax (£million)
£443.9mpre Ogden post Ogden
0% -24%
Price comparison quotes
21.5m +10%
UK car customers (million)
3.65m +11%
European customers
696,200 +31%
UK household customers
469,000 +51%
Elephant customers
168,000 +20%
2016
2016
338.5
443.9
2015 444.2
2014 397.9
2016 3.65
2015 3.30
2014 3.15
2016 469,000
2015 310,400
2014 162,600
2016 696,200
2015 532,800
2014 483,700
2016 168,000
2015 140,200
2014 108,900
What a great… performance
Read more on Page 16
2016 21.5
2015 19.5
2014 18.4
Financial Statements Additional InformationCorporate GovernanceStrategic Report Introduction
15Admiral Group plc · Annual Report and Accounts 2016
pre Ogden
post Ogden

What a great… performance
Very few people can claim to have contributed as much to Admiral’s success as Alastair Lyons. So it’d be wrong to start my first Chief Executive report with anything other than a tribute to his contribution over the last 16 years. The Board collectively, Admiral’s senior managers, and Henry and myself in particular, have benefitted from his wisdom, experience and thoughtfulness, and during our (occasional) moments of crisis, his composure.
Perhaps most importantly, notwithstanding an apparently conservative profile as a Chartered Accountant and financial services veteran, Alastair has consistently been an encouraging supporter of Admiral’s distinctiveness rather than an advocate of the apparently safe option of convergence to industry norms.
In his statement, Alastair has laid out the transformation, in scale and breadth, of Admiral over the 16 years of his stewardship. He describes how 2016 has been another year of substantial growth both in our core UK car insurance business and across the Group as a whole.
Rather than re-visit 2016 myself (and to duck the challenge of trying to find a pithy culinary metaphor to describe the year – see previous Chief Executive Statements), I’ll look forward and answer a question some shareholders may be asking. Namely: “Should I sell Admiral and buy Insurtech?”
For those of you with limited time, or for whom the suspense is too much, the short answer, in my view, is “no”. Read on for a longer answer.
Insurtech is generating lots of excitement. Visiting investment bankers, who historically would have arrived with fat packs on attractive big ticket acquisitions, now also include charts showing the explosive growth in Insurtech, along with a busy “Insurtech landscape” page, packed with the colourful logos of whizzily named Insurtech start-ups, bunched (sometimes shoe-horned) into helpful categories (“sharing economy”, “P2P”, “mobile insurance”, “telematics”, “auto comparison”, “short term cover”). A big brand consulting firm recently shared the results of a survey suggesting that “insurance CEO’s” expect new entrants to capture 30% of the insurance market over the next five years.
I disagree.
I say that not because the ideas emerging aren’t interesting, far from it. Nor because many of the Insurtech pioneers aren’t very bright and creative (and it’s great to see that creativity focussed on insurance).
I disagree for two reasons.
The first reason is that many of the ideas won’t work in practice. Many, while technologically feasible, even impressive, involve an under-appreciation of the complexity of insurance; the importance, for example, of avoiding customers you really don’t want to insure or the challenge of engaging policyholders in a deeper interaction with their insurance when, in truth, most of our customers want the opposite. Insurtech start-ups promising on-again, off-again, item by item insurance are offering a consumer “benefit” that most of our customers wouldn’t recognise as such.
The second reason is that Admiral already, in many important respects, is “Insurtech”. The two most fundamental Insurtech sectors; “fundamental” in terms of their ability to transform the competitive landscape and substantially re-distribute market share, are “auto-comparison” and “telematics”. On “auto-comparison” we are leading players with established businesses in the UK, Spain and France and a pioneering, potentially transformational US price comparison business in compare.com. And as for “telematics”, we sell telematics-based car insurance in three countries and in the UK we are, by some margin, the largest player in the market with over 200,000 live policies. Beyond those sectors, our ever-evolving range of products (“Airbnb” home insurance, Admiral short-term cover, insurance cover for the peer to peer car sharing sites) show we’re not neglecting the interesting, if at this point more marginal, emerging opportunities. Admiral’s success has always been about embracing change when that’s in the interest of our customers and shareholders. So stick with us and enjoy the best of insurance, and Insurtech, all in one bundle.
David StevensChief Executive Officer 7 March 2017
The highlights
13%UK Motormarket share
3rd yearof ConTe profits
50%growth in
UK Household customers
17consecutive years Best Companies to Work For Awards
“ Admiral’s success has always been about embracing change when that’s in the interest of our customers and shareholders”David Stevens, CBE Chief Executive Officer
16 Admiral Group plc · Annual Report and Accounts 2016
Strategic Report: Chief Executive’s Statement

My priorities for the forthcoming year are set out below. I expect them to remain my priorities for a number of years to come.
Ensure Admiral remains one of, if not the, best car insurers in the UK
Admiral has built its success on doing car insurance more effectively that its peers. Maintaining our lead in cost efficiency, rigorous risk selection and effective claims management has required Admiral to keep evolving and innovating and we need to continue to do so in the future.
Demonstrate Admiral can be a great car insurer beyond the UK
Our insurance operations beyond the UK are at different stages of development and relative competitive competence. Mobilising, ideally, all the collective talents of the Group, to ensure most, or all, of these operations become sources of sustainable profitable growth is a priority.
Develop sources of growth and profits beyond car insurance
Admiral’s first major diversification from car insurance was household insurance, launched three years ago in the UK. I expect the second will be personal lending in the UK. Both take us into huge markets and in both cases our car insurance heritage provides some of the necessary skills and assets to succeed. Our priority will be to grow both, focussing on a long term objective of developing sources of competitive advantage, not short term top or bottom-line objectives.
Ensure Admiral stays a great place to work
I don’t run Admiral purely for the benefit of shareholders. It’s important that those of us who work for Admiral are glad we do, most of the time. Happily, what’s good for staff is normally good for shareholders. A key reason for Admiral’s success over the last 25 years has been the loyalty of talented staff to the company, and the collective sense of shared endeavour that has helped us do lots of things a little better than our competitors.
My priorities
17Admiral Group plc · Annual Report and Accounts 2016
Financial Statements Additional InformationCorporate GovernanceStrategic Report Introduction
It’s tempting to focus almost entirely on Ogden in writing a review of 2016’s results, but whilst it deserves attention (and it’s coming), there is more to talk about.
Given Ogden, the Group’s share of pre-tax profit reduced materially to £284 million from £377 million last year. On a statutory basis, the reduction is similar, with Group profit before tax at £278 million compared to £369 million in 2015.
Without the Ogden change, the Group’s share of pre-tax profit would have been £390 million, of which the UK Car Insurance business would have contributed £441 million, in line with last year. Our combined international insurance businesses improved their result (£19 million loss v £22 million loss) whilst the comparison operations recorded a profit of £3 million after making losses of £7 million in 2015. On a statutory basis, the price comparison result is a loss of £3 million compared to a loss of £16 million last year.
Notwithstanding the Ogden impact, the strength of the Group’s capital position has allowed us to propose a final dividend of 51.5 pence per share, in line with the final 2015 dividend (before adding the return of surplus capital that was paid a year ago).
If forced to describe the year in one word, for me it would be Growth. 2016 saw very strong advances in turnover (a record and 22% higher than 2015), customer numbers (another record at 5.2 million) and net revenue (up 13% to £1 billion). Whilst UK motor grew healthily, our businesses in other markets (including UK household) grew very nicely and continue to represent a bigger share of the Group’s KPIs.
Our international operations in insurance and comparison continued to make meaningful and pleasing progress against their objectives.
It’s inevitably hard to pick highlights, but some of mine would be:
• 720,000 – the number of new customers we welcomed to the Group in 12 months.
• 1,035,000 – customers beyond UK Insurance, up 215,000 in a year.
• 212% – solvency ratio after the Ogden impact and proposed final dividend.
• 100% – all UK insurance new business now transacted on the new policy system, Guidewire.
• Record profits at Rastreator in Spain and another profit (for the third successive financial year) from ConTe in Italy.
Full detail on the results follows but let me cover a couple of things:
Ogden (inevitably), capital and dividend Readers will be aware I’m sure, but in December 2016 we heard that a new Ogden discount rate was imminent (the first change since 2001). The announcement came at the end of February 2017 that the new rate would be minus 0.75% – a substantial reduction on the previous rate of 2.5%.
We estimate that the ultimate cost (net of reinsurance and tax) on open claims and claims arising on business written to the date of change of a move to minus 0.75% from 2.5% will be approximately £150 million.
1 millioncustomers beyond
UK Insurance
720,000new customers
212%solvency ratio
Chief Financial Officer’s review
“ If forced to describe the year in one word, for me it would be Growth”Geraint Jones Chief Financial Officer
18 Admiral Group plc · Annual Report and Accounts 2016
Strategic Report: Chief Financial Officer’s review
The reduction in profit in 2016 means that a large portion of the impact of the change has been recognised already, with the balance (something in the order of £65 million post-tax) to be reflected in the coming years in the form of lower reserve releases and profit commission than would otherwise have been the case with an unchanged rate.
Ogden is of course only one variable involved in estimating the reserves, and as you would expect of Admiral, our booked reserves in the financial statements continue to include a prudent and significant margin above best estimates, the size of which is largely in line in relative terms with a year earlier.
The Solvency II balance sheet technical provisions are also now on a minus 0.75% Ogden basis.
After accounting for the proposed final dividend, the Group solvency ratio is a very satisfactory 212%. Excluding amounts relating to return of surplus capital, full year dividends for 2016 are held at their 2015 level of 102.5 pence per share.
The solvency ratio is above where we expect to operate in the medium to long term (no change on our previously indicated 125%-150%). However we consider it prudent to maintain a higher ratio in the near term as we move towards submission of our application to use an internal model to calculate our solvency capital requirement later in the year (we’re still hoping to ‘go live’ with the model in 2018). For the foreseeable future, we envisage dividends will be in the order of 90-95% of earnings.
In terms of the future impact of higher injury costs resulting from the substantially lower discount rate, we expect that pricing action (including our own material pre-emptive rate changes in December 2016 and most likely more to follow) should mean profitability on business written after the date of the change will not be materially adversely affected.
BrexitAnother 2016 surprise (in a year full of them) was the result of the EU referendum in June.
Admiral currently has three insurers and two comparison businesses in continental Europe, all benefitting from passporting arrangements. Although the UK is very early in the process of extricating itself from the EU, there is clearly a risk we lose access to these markets via the passporting mechanism.
We are planning for potential outcomes and expect to be able to establish new entities and/or arrangements which should result in minimal disruption to our businesses and customers in those markets.
We also currently enjoy free movement of staff between our sites in Europe which might also be restricted. Again we’ll work to ensure the impact on our staff is minimised to the extent possible under whatever arrangements are put in place.
ChairmanFinally, at the 2017 AGM we will say farewell to Alastair, our Chairman of over 16 years. David’s tribute sums up Alastair’s contribution eloquently so I’ll just say that I’ve hugely admired Alastair as a Chairman and colleague since I’ve worked with him. We will miss him greatly. We’re fortunate to have an extremely capable successor in Annette who’s been on the Board since 2012. My best wishes go to both.
Geraint Jones Chief Financial Officer 7 March 2017
“Ben was extremely helpful and covered all the policy options with me without pushing any covers or excesses that I did not want – I told him, as I now tell you, that he provided me with the best customer service from a call centre environment that I have ever had...and that’s in 46 years!”
UK New Business
A great customer experience
Financial Statements Additional InformationCorporate GovernanceStrategic Report Introduction
19Admiral Group plc · Annual Report and Accounts 2016

2016 Group overviewThe Group has seen strong growth in 2016 with turnover up 22% to £2.58 billion (2015: £2.12 billion). Net revenue increased by 13% to £1.02 billion (2015: £0.90 billion). Customer numbers were 16% higher at 5.15 million (2015: 4.43 million).
The Group’s share of pre-tax profits of £284.3 million (2015: £376.8 million) and statutory profit before tax of £278.4 million (2015: £368.7 million) have both been materially affected by the impact of the change by the UK Government to the UK discount rate (commonly referred to as the ‘Ogden discount rate’), used to value personal injury claims, which has reduced UK Insurance profits. See below for further information. If the rate had remained unchanged, the Group’s share of pre-tax profit would have been approximately £390 million.
During 2016, the Group’s UK Insurance business, consisting of UK Car and UK Household, enjoyed favourable market conditions and delivered strong growth in turnover to £2.06 billion (2015: £1.76 billion). Net revenue increased by 8% to £770.9 million (2015: £711.2 million). Customer numbers reached 4.1 million (2015: 3.6 million). The UK Insurance business accounts for 80% of Group turnover and customers (2015: 83% and 81% respectively).
Outside the UK, Admiral’s International Insurance businesses grew combined turnover by 57% to £365.9 million (2015: £232.4 million). Net revenue increased by 49% to £107.3 million (2015: £72.2 million). Customer numbers grew by 28% to 864,000 (2015: 673,000). Encouraging progress was made in combined ratio terms, and in aggregate the segment recorded reduced losses of £19.4 million (down from £22.2 million) with the Group’s Italian insurer ConTe recording a profit for the third consecutive year.
Finally, Admiral’s Price Comparison businesses made a combined profit, again excluding minority interests’ shares, of £2.7 million (2015: loss £7.2 million). Confused.com in the UK grew revenue and saw a 29% increase in profit to £16.1 million from £12.5 million. The international price comparison businesses reported a reduced aggregate loss of £13.4 million (2015: loss £19.7 million) with growing profit in the European operations (£2.8 million, up from £1.8 million) offset by the loss in compare.com of £16.2 million (2015: loss £21.5 million).
Other Group key performance indicators include:
• Group loss ratio 72.0% post Ogden, 64.2% pre Ogden (2015: 65.1%) – an improved international ratio offset by an Ogden-impacted higher UK car insurance ratio;
• Group expense ratio 22.4% (2015: 20.5%) – an increased UK ratio reflecting an increase in acquisition costs resulting from growth offset by a small improvement in the international ratio; and
• Group combined ratio 94.4% post Ogden, 86.7% pre Ogden (2015: 85.6%).
Earnings per shareEarnings per share decreased by 27% to 78.7 pence (2015: 107.3 pence), reflecting the decrease in Group profit as a result of the change in the Ogden discount rate. If the rate had remained unchanged, earnings per share would have risen to 109.6 pence per share.
DividendsThe Group’s dividend policy is to pay 65% of post-tax profits as a normal dividend and to pay a further special dividend comprising earnings not required to be held in the Group for solvency or buffers.
Notwithstanding the lower second half profits, the strength of the Group’s capital position has allowed the Board to propose a final dividend of 51.5 pence per share (£144 million), as follows:
• 15.0 pence per share representing a normal element, based on the dividend policy of distributing 65% of post-tax profits; and
• A special element of 36.5 pence per share.
The final dividend is in line with the final 2015 dividend (excluding the return of surplus capital of 11.9 pence per share that was paid with the final 2015 dividend).
The total dividend for the 2016 financial year is 114.4 pence per share (including 11.9 pence return of surplus capital), in line with 2015 (which also included 11.9 pence return of surplus capital).
The payment date is 2 June 2017, ex- dividend date 11 May 2017 and record date 12 May 2017.
Return on equityThe impact of the changed Ogden discount rate on profit has led to a reduction in return on equity to 37% from 49%. Had the rate remained unchanged, return on equity would have been in line with 2015.
A key part of Admiral’s business model is the extensive use of co- and reinsurance across the Group which provides both loss protection and capital relief and, when combined with high levels of profitability, leads to a superior return on equity.
Change in UK discount rate (‘Ogden’) On 27 February 2017, the UK Government announced the outcome of the review of the discount rate (referred to as the Ogden discount rate) used for calculating the value of lump sum personal injury compensation. The new rate is minus 0.75% and will apply to all unsettled and new claims from 20 March 2017.
Group financial review
20 Admiral Group plc · Annual Report and Accounts 2016
Strategic Report: Group financial review

Cash and investments analysis
£m 2014 2015 2016
Fixed income and debt securities 1,021.8 1,428.2 1,469.2
Money market funds and other fair value instruments 909.2 627.7 781.0
Cash deposits 263.1 267.6 170.0
Cash 255.9 265.3 326.6
Total 2,450.0 2,588.8 2,746.8
Money market funds, fixed income and debt securities comprise the majority of the total; 82% at 31 December 2016 (2015: 79%).
Investment and interest income in 2016 was £53.1 million, an increase of £20.5 million on 2015 (£32.6 million). £9.2 million of the increase is due to a release of an accrual relating to quota share reinsurance arrangements, whilst £4.9 million of the increase relates to unrealised gains on forward foreign exchange contracts. The balance is due to additional investment income earned on higher average balances.
The underlying rate of return for the year (excluding the reinsurance accrual) on the Group’s cash and investments was 1.4% (2015: 1.3%).
The Group continues to generate significant amounts of cash and its capital-efficient business model enables the distribution of the majority of post-tax profits as dividends.
Cash flow
£m 2014 2015 2016
Operating cash flow, before transfers to investments 521.9 487.2 525.1
Transfers to financial investments (258.4) (112.5) (18.1)
Operating cash flow 263.5 374.7 507.0
Tax payments (77.0) (63.8) (74.6)
Investing cash flows (capital expenditure) (50.6) (47.8) (31.6)
Financing cash flows (65.8) (256.3) (364.7)
Foreign currency translation impact 3.0 2.6 25.2
Net cash movement 73.1 9.4 61.3
Movement in unrealised gains on investments 10.9 (12.6) 35.2
Movement in accrued interest 22.8 29.5 43.4
Net increase in cash and financial investments 365.2 138.8 158.0
The main items contributing to the operating cash inflow are as follows:
£m 2014 2015 2016
Profit after tax 281.6 291.8 214.1
Change in net insurance liabilities 187.5 148.7 206.8
Net change in trade receivables and liabilities (34.7) (55.7) 25.3
Non-cash income statement items 18.4 25.5 14.6
Taxation expense 69.1 76.9 64.3
Operating cash flow, before transfers to investments 521.9 487.2 525.1
Total cash plus investments increased by £158 million or 6% (2015: £139 million, 6%).
The estimated total impact, net of reinsurance and post tax, of the change to minus 0.75% from 2.5% is approximately £150 million.
The change in rate has been treated as an adjusting post balance sheet event and the UK motor actuarial best estimates and Solvency II technical provisions have been prepared on the basis of the new rate. The booked reserves in the financial statements continue to include a prudent and significant margin above the actuarial best estimates in line with the Group’s reserving policy.
The majority of the financial impact in respect of premiums earned up to the date of change (£105 million pre-tax, £87 million post-tax), has been recognised in the form of reduced 2016 profits. The balance, along with the impact on business written but unearned at the date of change, will be recognised in the form of lower reserve releases and profit commission over the subsequent three to five financial years as the affected claims settle.
The Group anticipates that if UK market pricing adjusts future premiums to reflect the lower Ogden rate, there will be no significant impact on future business and its profitability after the change. The Group is confident that its strong capital position, along with its prudent approach to claims reserving, will allow it to manage the outcome without significant change to its business or long term financial outlook.
Investments and cashInvestment strategyAdmiral’s investment strategy was unchanged in 2016 and the Group continued to invest in the same asset classes as previous years.
The main focus of the Group’s strategy is capital preservation, with additional priorities including low volatility of returns and high levels of liquidity. All objectives continue to be met.
The Group’s Investment Committee performs regular reviews of the strategy to ensure it remains appropriate.
Financial Statements Additional InformationCorporate GovernanceStrategic Report Introduction
21Admiral Group plc · Annual Report and Accounts 2016

Group financial review continued
The Group’s capital includes £200 million 10 year dated subordinated bonds. The rate of interest is fixed at 5.5% and the bonds mature in July 2024. The bonds qualify as tier two capital under the Solvency II regulatory regime.
Estimated sensitivities to the current Group solvency ratio are presented in the table below. These sensitivities cover the two most material risk types, insurance risk and market risk, and within these risks cover the most significant elements of the risk profile. Aside from the catastrophe events, estimated sensitivities have not been calibrated to individual return periods.
Solvency ratio sensitivities
UK Motor – incurred loss ratio +5% -31%
UK Motor – 1 in 200 catastrophe event -1%
UK Household – 1 in 200 catastrophe event -2%
Interest rate – yield curve down 50 bps -12%
Credit spreads widen 100 bps -4%
Currency – 25% movement in euro and US dollar -3%
ASHE*1 – long term inflation assumption up 0.5% -9%
*1 Refer to the glossary on page 141.
TaxationThe tax charge reported in the Consolidated Income Statement is £64.3 million (2015: £76.9 million), which equates to 23.1% (2015: 20.9%) of profit before tax. The higher effective rate of taxation compared to 2015 results from the unrecognised deferred tax asset arising on losses in the Group’s US businesses.
The Group’s results are presented in the following sections as UK Insurance, International Car Insurance and Price Comparison.
Capital structure and financial positionA key feature of the business model is the extensive use of co- and reinsurance across the Group. The Group’s co-insurance and quota share reinsurance arrangements for the UK Car Insurance business are in place until at least the end of 2018. In 2017 and 2018, the Group will reduce its net share of that business from 25% to 22%.
Similar long term arrangements are in place in the Group’s International Insurance operations and UK Household Insurance business.
The Group continues to manage its capital to ensure that all entities within the Group are able to continue as going concerns and that regulated entities comfortably meet regulatory capital requirements. Surplus capital within subsidiaries is paid up to the Group holding company in the form of dividends.
The Group’s regulatory capital from January 2016 is based on the Solvency II Standard Formula, with a capital add-on to reflect recognised limitations in the Standard Formula with respect to Admiral’s business (predominantly in respect of profit commission arrangements in co- and reinsurance agreements and risks arising from claims including Periodic Payment Order (PPO) claims).
The capital add-on to the Standard Formula for 2017 is subject to the usual regulatory approval process. The Group plans to submit an application for approval to use an internal model to calculate capital requirements during 2017.
The majority of the Group’s capital requirement is derived from its European insurance operations, Admiral Insurance (Gibraltar) Limited (AIGL) and Admiral Insurance Company Limited (AICL). The estimated (and unaudited) Solvency II position for the Group at the date of this report was as follows:
Group capital position
Group £bn
Eligible Own Funds (pre 2016 final dividend) 1.07
2016 final dividend 0.14
Eligible Own Funds (post 2016 final dividend) 0.93
Solvency II capital requirement*1 0.44
Surplus over regulatory capital requirement 0.49
Solvency ratio (post dividend)*2 212%
*1 Solvency capital requirement includes updated capital add-on which is subject to regulatory approval. *2 Solvency ratio calculated on a volatility adjusted basis.
22 Admiral Group plc · Annual Report and Accounts 2016
Strategic Report: Group financial review

UK Insurance review
UK Insurance financial performance
£m 2014 2015 2016
Turnover*1 1,632.0 1,760.2 2,063.1
Total premiums written*1 1,481.5 1,590.4 1,862.6
Net insurance premium revenue 399.0 397.4 454.4
Underwriting profit*1 161.7 198.3 109.2
Profit commission and other income 236.2 245.9 229.3
UK Insurance profit before tax 397.9 444.2 338.5
*1 Alternative performance measures – refer to the Glossary on page 141 for definition and explanation.
Split of UK Insurance profit before tax
£m 2014 2015 2016
Car 398.0 443.0 335.8
Household (0.1) 1.2 2.7
UK Insurance profit 397.9 444.2 338.5
Key performance indicators
2014 2015 2016
Vehicles insured at year end 3.15m 3.30m 3.65m
Households insured at year end 0.16m 0.31m 0.47m
Total UK Insurance customers 3.31m 3.61m 4.12m
It’s always fun to write an annual review like this – and always surprising when we look back and remember how much has happened and changed in just 12 months.
Clearly the reported results of the UK Car insurance business have been impacted by the change in the Ogden discount rate, but Alastair and Geraint have covered this in detail, so I will focus on the underlying business.
One of the more obvious achievements is the rate of growth of the car insurance segment. We grew by 11% during 2016, adding almost 350,000 to the customer base, which is about the same as we added in the previous four years combined. But the more encouraging aspect is that this wasn’t achieved through chasing volume through price cuts and acquisition spend, but through sensible underwriting and leveraging the still-growing price comparison distribution channel that has facilitated our
growth over the last ten years and more.
What do I mean by sensible underwriting? We’ve always approached pricing in a rational way, growing when we think it’s the right time, and holding back when the market is looking less attractive. That means that we grew very modestly (in Admiral’s historical context at least) over the previous two or three years, but grew significantly more during 2016 as the market continued to increase prices quite significantly. We’ve also seen some slight de-risking in our portfolio as some of our competitors have been changing prices to attract higher-premium (higher risk) drivers, and we’ve consciously decided not to follow.
Increasing market prices, whilst good for profitability, does however bring some additional scrutiny both from the media and regulators. Following the focus during the previous hardening part of the cycle, the Government announced a number of changes in February 2017, which are aimed at reducing the costs of small bodily injury claims and therefore the cost of motor insurance.
The Prisons and Courts Bill included a number of changes that will affect the process of dealing with minor whiplash claims,
Investing in our core“ We’ve always approached pricing
in a rational way, growing when we think it’s the right time, and holding back when the market is looking less attractive.”
including tariff-based damages that award compensation based on the severity of the injury, and the banning of offers before medical evidence is obtained. The Government also announced its intention to increase the small claims limit for motor accident claims from £1,000 to £5,000. All of these changes will bring down the cost of claims, but will level the playing field and make it a little harder for insurers to obtain a competitive advantage. However, we think that Admiral is well placed because of the increased importance of a quick and efficient claims handling process, which is one of Admiral’s historical strengths.
Whilst the return to growth in our car insurance business was encouraging, the 50% growth of our household business was particularly impressive, to end the year with nearly 470,000 customers. A key driver of that growth was an improvement in our online customer journey, but equally pleasing was that growth was driven both by a growing price comparison market and more customers being drawn directly to our household product.
Aside from top line growth, we benefitted from another relatively benign year in terms of weather events, and an improvement in claims frequency. We made some efficiency gains from our increased size and website development, and the small decrease in the underlying expense ratio (despite the addition of the Flood Re levy in the year) contributed to another improvement in the reported result. We expect distribution to continue moving towards price comparison in 2017, which will enable us to continue growing our book in a very familiar channel.
Finally, the mention of efficiency and an ability to react to changes (whether externally or internally driven) brings me onto the IT transformation process we have undertaken to replace the insurance policy system that we selected before we launched back in 1993. It served us amazingly well for the first 20+ years, but the Guidewire platform we’ve successfully rolled out over the last 12 months is a key development that will enable us to continue testing, learning and growing and succeeding. In summary, a big change that will paradoxically allow us to remain the same innovative company we’ve always been.
Cristina NestaresCEO, UK Insurance 7 March 2017
Financial Statements Additional InformationCorporate GovernanceStrategic Report Introduction
23Admiral Group plc · Annual Report and Accounts 2016
UK Insurance financial performanceUK insurance includes the results of the UK Car and UK Household insurance segments.
Admiral delivered strong growth in turnover and customers in its UK Insurance business in 2016, taking advantage of favourable market conditions with increasing prices and shopping activity. UK insurance turnover of £2.06 billion increased by 17% (2015: £1.76 billion) primarily due to growth in customer numbers in both UK Car and UK Household. Net revenue increased by 8% to £770.9 million (2015: £711.2 million). Increases in average premiums in UK Car insurance also contributed to a 17% increase in total premiums written to £1.86 billion (2015: £1.59 billion).
Profit was lower in 2016 at £338.5 million (2015: £444.2 million) due to the impact of the change in the Ogden discount rate which is discussed above. If the rate had remained unchanged, UK Insurance profit would have been £444 million.
UK Insurance review continued
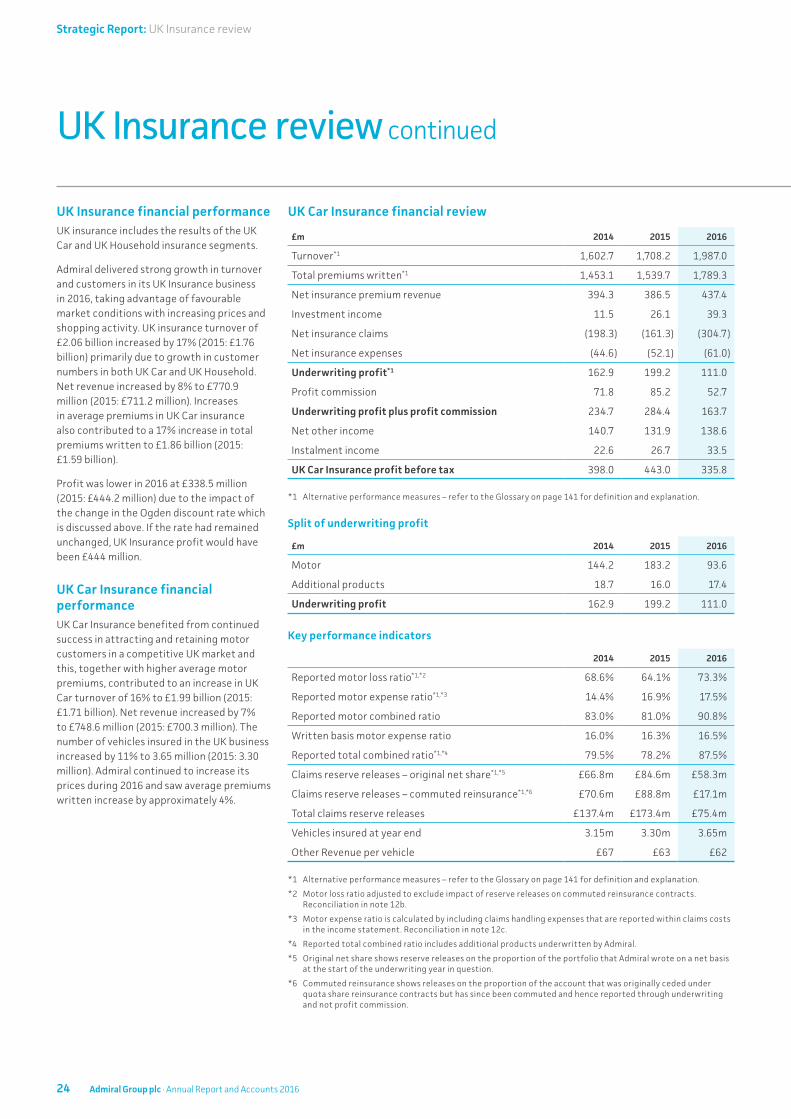
UK Car Insurance financial review
£m 2014 2015 2016
Turnover*1 1,602.7 1,708.2 1,987.0
Total premiums written*1 1,453.1 1,539.7 1,789.3
Net insurance premium revenue 394.3 386.5 437.4
Investment income 11.5 26.1 39.3
Net insurance claims (198.3) (161.3) (304.7)
Net insurance expenses (44.6) (52.1) (61.0)
Underwriting profit*1 162.9 199.2 111.0
Profit commission 71.8 85.2 52.7
Underwriting profit plus profit commission 234.7 284.4 163.7
Net other income 140.7 131.9 138.6
Instalment income 22.6 26.7 33.5
UK Car Insurance profit before tax 398.0 443.0 335.8
*1 Alternative performance measures – refer to the Glossary on page 141 for definition and explanation.
Split of underwriting profit
£m 2014 2015 2016
Motor 144.2 183.2 93.6
Additional products 18.7 16.0 17.4
Underwriting profit 162.9 199.2 111.0
Key performance indicators
2014 2015 2016
Reported motor loss ratio*1,*2 68.6% 64.1% 73.3%
Reported motor expense ratio*1,*3 14.4% 16.9% 17.5%
Reported motor combined ratio 83.0% 81.0% 90.8%
Written basis motor expense ratio 16.0% 16.3% 16.5%
Reported total combined ratio*1,*4 79.5% 78.2% 87.5%
Claims reserve releases – original net share*1,*5 £66.8m £84.6m £58.3m
Claims reserve releases – commuted reinsurance*1,*6 £70.6m £88.8m £17.1m
Total claims reserve releases £137.4m £173.4m £75.4m
Vehicles insured at year end 3.15m 3.30m 3.65m
Other Revenue per vehicle £67 £63 £62
*1 Alternative performance measures – refer to the Glossary on page 141 for definition and explanation.
*2 Motor loss ratio adjusted to exclude impact of reserve releases on commuted reinsurance contracts. Reconciliation in note 12b.
*3 Motor expense ratio is calculated by including claims handling expenses that are reported within claims costs in the income statement. Reconciliation in note 12c.
*4 Reported total combined ratio includes additional products underwritten by Admiral.
*5 Original net share shows reserve releases on the proportion of the portfolio that Admiral wrote on a net basis at the start of the underwriting year in question.
*6 Commuted reinsurance shows releases on the proportion of the account that was originally ceded under quota share reinsurance contracts but has since been commuted and hence reported through underwriting and not profit commission.
UK Car Insurance financial performanceUK Car Insurance benefited from continued success in attracting and retaining motor customers in a competitive UK market and this, together with higher average motor premiums, contributed to an increase in UK Car turnover of 16% to £1.99 billion (2015: £1.71 billion). Net revenue increased by 7% to £748.6 million (2015: £700.3 million). The number of vehicles insured in the UK business increased by 11% to 3.65 million (2015: 3.30 million). Admiral continued to increase its prices during 2016 and saw average premiums written increase by approximately 4%.
24 Admiral Group plc · Annual Report and Accounts 2016
Strategic Report: UK Insurance review

Claims reservingAdmiral’s reserving policy (both within the claims function and in the financial statements) is initially to reserve conservatively, above internal and independent projections of actuarial best estimates. This is designed to create a margin held in reserves to allow for unforeseen adverse development in open claims and typically results in Admiral making above industry average reserve releases. Admiral’s booked claims reserves continue to include a significant margin above projected best estimates of ultimate claims costs.
As profit commission income is recognised in the income statement in line with loss ratios accounted for on Admiral’s own claims reserves, the reserving policy also results in profit commission income being deferred and recognised over time.
Underwriting result and profit commissionThe UK Car Insurance motor combined ratio is shown below:
UK Car Insurance Motor combined ratio 2014 2015 2016
Loss ratio excluding reserve releases from original net share and commuted reinsurance 86.9% 87.7% 87.7%
Reserve releases – original net share 18.3% 23.6% 14.4%
Loss ratio net of releases – original net share*1 68.6% 64.1% 73.3%
Expense ratio 14.4% 16.9% 17.5%
Combined ratio – original net share*1 83.0% 81.0% 90.8%
*1 Ratios calculated on original net share use the proportion of the portfolio that Admiral wrote on a net basis at the start of the underwriting year in question.
ProfitAs a result of the impact of the change in Ogden, profit was lower in 2016 (£335.8 million v £443.0 million in 2015). Excluding the Ogden impact, profit would have been £441 million. The combined ratio increased to 87.5% (2015: 78.2%), or 77.8% pre Ogden. The underlying UK Car insurance profit was also impacted by a number of other factors:
• Significantly higher net insurance premium revenue (£437.4 million v £386.5 million) resulting from the growth in the portfolio over the past year
• Underlying positive back year claims development, though lower reserve releases on the portion of reserves originally reinsured but now commuted
• Higher expense ratio of 17.5% (2015: 16.9%) as a result of strong growth in new business
• Higher contribution from Other Revenue sources (£172.1 million v £158.6 million) resulting from growth in the portfolio, with Other Revenue per vehicle stable when compared with 2015
• Higher investment return (£39.3 million v £26.1 million) as explained in the Investments and Cash section on page 21.
The projected ultimate loss ratio for Admiral for the 2016 accident year is 82%, which is in line with the projection of the previous year at the same point in its development despite the Ogden discount rate change.
The earned motor expense ratio increased modestly to 17.5% from 16.9% mainly reflecting the increase in acquisition costs resulting from the strong growth in the business. The written basis expense ratio also increased to 16.5% from 16.3% for similar reasons.
The projected ultimate combined ratio (ultimate loss ratio plus written expense ratio) for Admiral for the 2016 accident year is 98%. The reported combined ratio for the UK market (excluding Admiral) for 2015, excluding reserve releases was 115%.
The reported motor combined ratio was 90.8% (2015: 81.0%) (both figures exclude the impact of reserve releases from commuted reinsurance contracts) and was materially impacted by the change in Ogden discount rate and the resulting increase in ultimate loss ratios. Despite the Ogden impact, the Group continued to see positive claims development during 2016 that resulted in improvements in the projected ultimate loss ratios, especially for the 2012 to 2015 underwriting years.
Excluding reserve releases, the loss ratio remained flat at 87.7% (2015: 87.7%). Excluding the Ogden impact, the loss ratio before reserve releases would have improved to 85.6% as a result of the more favourable loss ratio assumptions for business earned during 2016 compared to 2015.
Financial Statements Additional InformationCorporate GovernanceStrategic Report Introduction
25Admiral Group plc · Annual Report and Accounts 2016

UK Insurance review continued
UK Car Insurance – co-insurance and reinsuranceAdmiral makes significant use of proportional risk sharing agreements, where insurers outside the Group underwrite a majority of the risk generated, either through co-insurance or quota share reinsurance contracts. These arrangements include profit commission terms which allow Admiral to retain a significant portion of the profit generated.
The two principal advantages of the arrangements are:
• Capital efficiency: a significant proportion of the capital supporting the underwriting is held outside the Group. As Admiral is typically able to retain much of the profit generated via profit commission, the return on Group capital is higher than in an insurance company with a standard business model.
• Risk mitigation: co- and reinsurers bear their proportional shares of claims expenses and hence provide protection should results worsen substantially.
The Munich Re Group will underwrite 40% of the UK motor business until at least 2020. 30% of this total is on a co-insurance basis, with the remaining 10% under a quota share reinsurance agreement from 2017 onwards.
The Group also has other quota share reinsurance arrangements confirmed to the end of 2018 covering 38% of the business written.
The Group has reduced its net underwriting share from 25% to 22% with effect from 2017.
The nature of the co-insurance proportion underwritten by Munich Re (via Great Lakes, a subsidiary of Munich Re) is such that 30% of all motor premium and claims for the 2017 year will accrue directly to Great Lakes and will not appear in the Group’s income statement. Similarly, Great Lakes reimburses the Group for its proportional share of expenses incurred in acquiring and administering the motor business. This share was 40% previously.
Admiral has options to commute quota share reinsurance contracts and typically does so after two or three years of an underwriting year’s development when there is a reasonably certain view on the year’s outcome.
After commutation, movements in booked loss ratios result in reduced or increased net claims costs (and not profit commission).
At 31 December 2016, all material UK quota share reinsurance contracts for underwriting years up to and including 2014 had been commuted. All reinsurance for the 2015 and 2016 years remain in effect.
UK Household Insurance – reinsurance The Group’s Household business is also supported by proportional reinsurance arrangements covering 70% of the risk. For the 2016 year the business is shared between Munich Re, 40% and Swiss Re, 30%. The arrangements for 2017 will remain the same. In addition, the Group has non-proportional reinsurance to cover the risk of catastrophes stemming from weather events.
Commutations of quota share reinsuranceAdmiral tends to commute its UK Car Insurance quota share reinsurance contracts for an underwriting year 24 months from inception, assuming there is sufficient confidence in the profitability of the business covered by the reinsurance contract.
After the commutation is executed, movements in booked loss ratios result in reserve releases (or strengthening if the booked loss ratio were to increase) rather than reduced or increased reinsurance claims recoveries or profit commission.
During 2016, reinsurance contracts covering the 2014 underwriting year were commuted. Whilst there is a satisfactory level of confidence in the ultimate outcome of that year, Admiral’s prudent approach to booking loss ratios, which tend to improve over time from an initial cautious level to the ultimate outcome, has meant that the 2014 year is booked at a loss making combined ratio. Refer to note 5 (vi) of the financial statements for analysis of reserve releases on commuted quota share reinsurance contracts.
The ultimate projection of the 2014 year continues to show a profitable outcome.
A further impact of the 2014 year commutation is a release of an accrual held for notional investment income relating to the funds-withheld nature of the contract. As noted on page 21, movements in the notional investment income accruals resulted in an increase in investment income of £9.2 million compared to 2015.
Profit commissionAdmiral is potentially able to earn material amounts of profit commission revenue from co- and reinsurance partners, depending on the profitability of the insurance business underwritten by the partner. Revenue is recognised in the income statement in line with the booked loss ratios on Admiral’s retained underwriting.
In 2016 Admiral recognised UK car insurance profit commission revenue of £52.7 million down from £85.2 million in 2015. If reserve releases from business that was originally ceded under quota share reinsurance contracts that have since been commuted, are added to profit commission, the total for 2016 would be £69.8 million compared to £174.0 million in 2015, a decrease of 60%. The decrease arose mainly due to less positive development of prior year booked loss ratios as a result of the change in Ogden discount rate.
Note 5c to the financial statements analyses profit commission income by underwriting year.
26 Admiral Group plc · Annual Report and Accounts 2016
Strategic Report: UK Insurance review
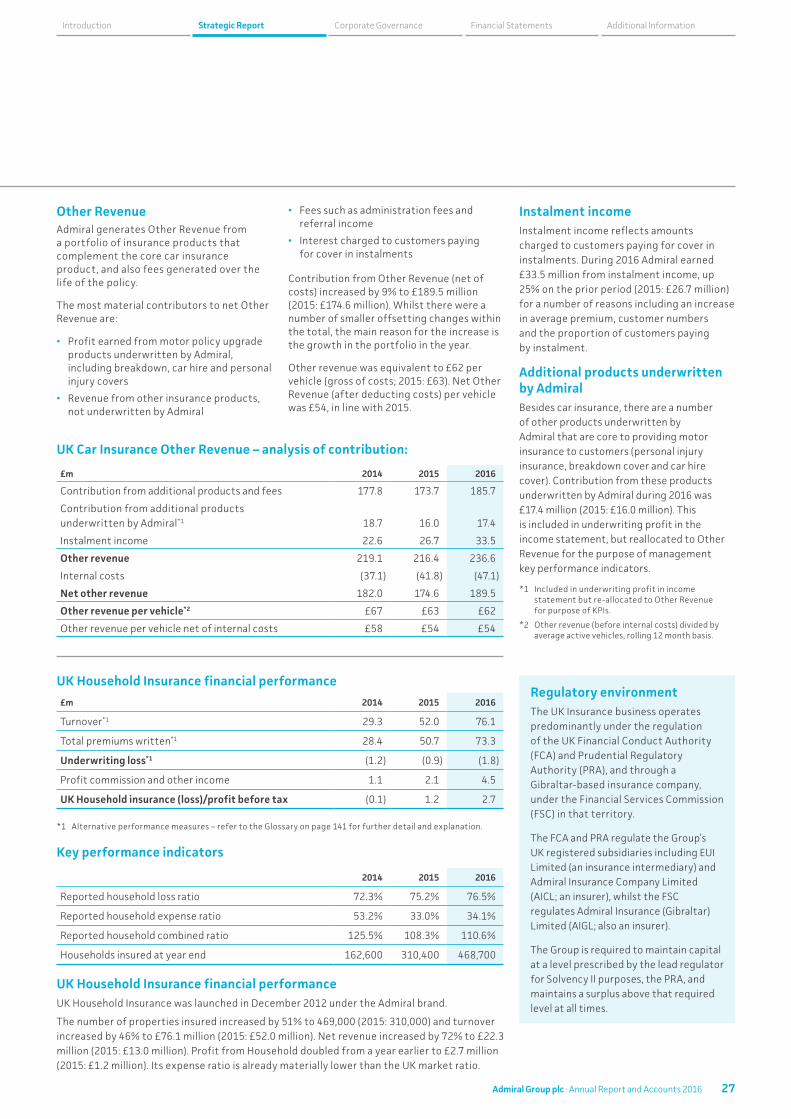
UK Household Insurance financial performance
£m 2014 2015 2016
Turnover*1 29.3 52.0 76.1
Total premiums written*1 28.4 50.7 73.3
Underwriting loss*1 (1.2) (0.9) (1.8)
Profit commission and other income 1.1 2.1 4.5
UK Household insurance (loss)/profit before tax (0.1) 1.2 2.7
*1 Alternative performance measures – refer to the Glossary on page 141 for further detail and explanation.
Key performance indicators
2014 2015 2016
Reported household loss ratio 72.3% 75.2% 76.5%
Reported household expense ratio 53.2% 33.0% 34.1%
Reported household combined ratio 125.5% 108.3% 110.6%
Households insured at year end 162,600 310,400 468,700
UK Household Insurance financial performance UK Household Insurance was launched in December 2012 under the Admiral brand.
The number of properties insured increased by 51% to 469,000 (2015: 310,000) and turnover increased by 46% to £76.1 million (2015: £52.0 million). Net revenue increased by 72% to £22.3 million (2015: £13.0 million). Profit from Household doubled from a year earlier to £2.7 million (2015: £1.2 million). Its expense ratio is already materially lower than the UK market ratio.
Other RevenueAdmiral generates Other Revenue from a portfolio of insurance products that complement the core car insurance product, and also fees generated over the life of the policy.
The most material contributors to net Other Revenue are:
• Profit earned from motor policy upgrade products underwritten by Admiral, including breakdown, car hire and personal injury covers
• Revenue from other insurance products, not underwritten by Admiral
• Fees such as administration fees and referral income
• Interest charged to customers paying for cover in instalments
Contribution from Other Revenue (net of costs) increased by 9% to £189.5 million (2015: £174.6 million). Whilst there were a number of smaller offsetting changes within the total, the main reason for the increase is the growth in the portfolio in the year.
Other revenue was equivalent to £62 per vehicle (gross of costs; 2015: £63). Net Other Revenue (after deducting costs) per vehicle was £54, in line with 2015.
Instalment incomeInstalment income reflects amounts charged to customers paying for cover in instalments. During 2016 Admiral earned £33.5 million from instalment income, up 25% on the prior period (2015: £26.7 million) for a number of reasons including an increase in average premium, customer numbers and the proportion of customers paying by instalment.
Additional products underwritten by AdmiralBesides car insurance, there are a number of other products underwritten by Admiral that are core to providing motor insurance to customers (personal injury insurance, breakdown cover and car hire cover). Contribution from these products underwritten by Admiral during 2016 was £17.4 million (2015: £16.0 million). This is included in underwriting profit in the income statement, but reallocated to Other Revenue for the purpose of management key performance indicators.
*1 Included in underwriting profit in income statement but re-allocated to Other Revenue for purpose of KPIs.
*2 Other revenue (before internal costs) divided by average active vehicles, rolling 12 month basis.
Regulatory environmentThe UK Insurance business operates predominantly under the regulation of the UK Financial Conduct Authority (FCA) and Prudential Regulatory Authority (PRA), and through a Gibraltar-based insurance company, under the Financial Services Commission (FSC) in that territory.
The FCA and PRA regulate the Group’s UK registered subsidiaries including EUI Limited (an insurance intermediary) and Admiral Insurance Company Limited (AICL; an insurer), whilst the FSC regulates Admiral Insurance (Gibraltar) Limited (AIGL; also an insurer).
The Group is required to maintain capital at a level prescribed by the lead regulator for Solvency II purposes, the PRA, and maintains a surplus above that required level at all times.
UK Car Insurance Other Revenue – analysis of contribution:
£m 2014 2015 2016
Contribution from additional products and fees 177.8 173.7 185.7
Contribution from additional products underwritten by Admiral*1 18.7 16.0 17.4
Instalment income 22.6 26.7 33.5
Other revenue 219.1 216.4 236.6
Internal costs (37.1) (41.8) (47.1)
Net other revenue 182.0 174.6 189.5
Other revenue per vehicle*2 £67 £63 £62
Other revenue per vehicle net of internal costs £58 £54 £54
Financial Statements Additional InformationCorporate GovernanceStrategic Report Introduction
27Admiral Group plc · Annual Report and Accounts 2016

51%increase in
home insurance customers “Quick support and detailed explanations.
Claim was settled without difficulties and return by train and taxi the same day, choice of hours and terms and the agent was very kind.”
L’olivier – assurance auto Claims
A great customer experience
Strategic Report: The customer, the customer, the customer
28 Admiral Group plc · Annual Report and Accounts 2016

Price Comparison review
International Car Insurance review
UK Insurance review
What a great… customer experience
The customer, the customer, the customer
Customer serviceOur customers are the most important part of our business; without them, there would be no business. Our staff and departments are rewarded through incentive schemes that place emphasis on the quality of service provided to our customers. We encourage customers to provide feedback, whether good or bad, so that we can continue to improve the level of service that we provide.
Value for moneyWe build insurance around our customers and strive to design and offer products that customers want and that provide the right level of protection at the right price.
CommunicationWe want our customers to feel fully informed; to know what the next step in the process is, whether that is making a payment for a policy or knowing which garage will be repairing their vehicle. At times of stress, clear communication is important and we want our customers to know that everything is under control.
Peace of mindYou can rely on us. We have a tradition of excellence and millions of happy customers.
In 2016 we were honoured to be again voted by consumers as the Best Motor Insurance Provider at the Personal Finance Awards for the FOURTH year in a row.
Claims answer rate
96%
Customer Service, New Business and Renewals call answer rate
94%
Read more on Page 23
Read more on Page 30
Read more on Page 36
94%
96%
94%
97%
95%
98%
2016
2016
2015
2015
2014
2014
Financial Statements Additional InformationCorporate GovernanceStrategic Report Introduction Financial Statements Additional InformationCorporate GovernanceStrategic Report Introduction
29Admiral Group plc · Annual Report and Accounts 2016

International Car Insurance strategyAdmiral’s strategy is to exploit the knowledge, skills and resources attached to the established UK businesses to promote expansion overseas in private car insurance. Admiral’s objective is to create profitable, sustainable and growing businesses.
Investing in our future
International Car Insurance review
After achieving breakeven on an underwriting year basis in 2015, our focus in Spain in 2016 has been on sustainable growth. We increased customer numbers by 18% with pleasing technical results.
It was a year of change in the Spanish market, with the introduction of the new “Baremo” regulating indemnities paid in bodily injury cases. The Baremo change increases claims costs, especially for more serious injuries. It adds pressure to an auto-insurance market that reported underwriting losses in 2015 for the first time in more than a decade.
We had hoped that the Baremo would trigger a price reaction and insurance shopping. Many companies did raise prices towards the beginning of the year, but changes were muted and not enough to encourage
consumers to shop around. We expect 2016 will turn out to be another unprofitable year for the market as a whole.
In this context we made strong progress against our growth objective. Both acquisition and retention processes were significantly improved. We modernised our website allowing customers to buy from us more easily. Investment in our Qualitas Auto brand – via a campaign starring Pierce Brosnan – raised brand awareness to 57%. Meanwhile, strong technical results allowed us to reduce prices and take a larger share of the price comparison channel.
And the outlook for 2017? At a market level we don’t expect much change. Our focus will continue to be on scaling up the business in a sustainable way.
ConTe closed for the third year in a row in profit. Market average premium fell by 4.5% but in the last quarter we have seen timid signals of market cycle upturn including a slight increase in claims frequency and the end of the average premium downtrend.
Despite this scenario, we consciously decided to grow in 2016 and our active customer base grew by over 30% year-on-year up to 415,000. This result is a mix of three effects: an increase in quote volumes of price comparison sites; the improvement of our customer journey; and the growth in brand awareness generated by the new TV campaign and the second year of the Serie B Football League sponsorship. To better serve our customers, we are continuing to invest in technology and develop our services.
The direct channel now represents around 12% of the overall motor market in Italy and the comparison sites are growing at an encouraging pace.
The back years continue to develop well and the latest actuarial projections indicate that 2011 was profitable on an underwriting basis as is already the case for 2012, 2013 and 2014.
Putting together all the pieces of the puzzle, 2016 was a good year, where ConTe grew again and invested to reinforce technological capabilities and brand awareness and, as a consequence, built a solid basis for sustainable growth in the future.
International customers
864,200(2015: 673,000)
International turnover
£366m(2015: £232 million)
Elephant in
6states in the USA
SpainAdmiral Seguros (Seville)
Launched in October 2006
ItalyConTe (Rome)
Launched in May 2008
Sarah Harris CEO, Admiral Seguros
Costantino Moretti CEO, ConTe
30 Admiral Group plc · Annual Report and Accounts 2016
Strategic Report: International Car Insurance review

The US car insurance market grew again in 2016. Definitive numbers are not yet available, but general consensus is that premium increases are outrunning claims inflation following last year’s deterioration in the industry loss ratio.
We estimate claims inflation to be running at circa 3–5% and premium increases at circa 5–7%. 2016 has seen claims frequency increasing across the industry as miles driven has increased. Texas in particular has seen some large price increases this year as unusually severe weather events in the first half of the year caused claims to spike in the state.
Elephant also grew again in 2016. Written premium increased 46% to $198 million, as we increased our turnover in each of our existing states as well as launching into two new states in the year. Elephant started writing car insurance in Indiana and
Tennessee in 2016. We continued to see very satisfactory results from our marketing initiatives and were able to increase our share of sales in both Texas and Virginia despite price increases applied to both states. The loss ratio improved nicely in the year. We also saw some expense ratio improvement from economies of scale, offset by an increase in our marketing investment. The combined effect of this was an improvement in the combined ratio on a written basis of 11 percentage points.
Elephant expects to continue to grow in 2017 and to see further improvement in the combined ratio as a result of further progress on each of the core metrics as we move the business towards the goal of profitability. We do not anticipate further new states in the next 12 months, rather an increased investment in our existing states and development of the marketing efforts in the two new states launched in 2016.
“I called various insurance companies asking for a quote, and finally chose Balumba for the good treatment, the patience and clarity of the explanations of your employee. I got the feeling being a nuisance to the agents in the other companies, the Balumba agent was thoughtful, kind and professional, and repeated the information as many times as I needed. After that, I received a welcome call from another agent, and his manner was excellent too. Congratulations to your employees!!”
Admiral Seguros Sales
A great customer experience
USAElephant Auto (Virginia)
Launched in October 2009
FranceL’olivier – assurance auto (Paris)
Launched in December 2010
Kevin Chidwick CEO, Elephant Auto
Pascal Gonzalvez CEO, L’olivier –
assurance auto
Despite challenging market conditions (stable market prices and a flat aggregator market), L’olivier – assurance auto managed to play its cards right with strong growth.
We grew the business substantially again and we ended the year up, with 61% more customers. The effects of “Loi Hamon” (the law that made the switching process much smoother) are becoming more tangible.
L’olivier accelerated its branding efforts with two new TV spots focused on service quality, helping to demonstrate to customers that direct insurance and good quality are not mutually exclusive. As a consequence, we managed to capture more customers than ever from traditional channels willing to switch to a direct insurer. On top of the branding efforts, we kept building strong foundations in 2016. Technical results improved significantly thanks to our distinctive pricing process in the market, helping us to build a clear competitive advantage in a high combined ratio market.
Market profitability didn’t improve in 2016. Indeed, for the second consecutive year, the highly competitive environment hampered insurers’ willingness to increase motor insurance prices. Consequently, market combined ratio remained high (it is expected to be around 104–105%). In the past, weak technical results were offset by investment results but in a low interest rate environment, this is not sustainable anymore. In this context, motor insurance prices are expected to increase in 2017 by 2–3% and several insurers have already announced some price increases (though more discreetly than in the previous years to avoid media noise).
With strong foundations, L’olivier – assurance auto is well prepared to scale up the business over the coming years and 2017 should be another year of strong growth.
Financial Statements Additional InformationCorporate GovernanceStrategic Report Introduction
31Admiral Group plc · Annual Report and Accounts 2016

International Car Insurance review continued
International Car Insurance financial performance
£m 2014 2015 2016
Turnover*1 206.2 232.4 365.9
Total premiums written*1 185.4 213.3 331.3
Net insurance premium revenue 58.1 62.3 91.3
Investment income 0.2 – 0.4
Net insurance claims (50.5) (50.9) (75.5)
Net insurance expenses (34.0) (40.1) (46.2)
Underwriting result*1 (26.2) (28.7) (30.0)
Net other income 6.3 6.5 10.6
International Car Insurance result (19.9) (22.2) (19.4)
Key performance indicators
2014 2015 2016
Loss ratio*2 77% 77% 76%
Expense ratio*2 50% 49% 49%
Combined ratio*3 127% 126% 125%
Combined ratio, net of Other revenue*4 116% 115% 113%
Vehicles insured at period end 592,600 673,000 864,200
*1 Alternative performance measures – refer to the Glossary on page 141 for definition and explanation.
*2 Loss ratios and expense ratios have been adjusted to remove the impact of reinsurer caps so the underlying performance of the business is transparent.
*3 Combined ratio is calculated on Admiral’s net share of premiums and excludes Other Revenue. It excludes the impact of reinsurer caps. Including the impact of reinsurer caps the reported combined ratio would be 2016: 133%; 2015: 146%; 2014: 145%.
*4 Combined ratio, net of Other Revenue is calculated on Admiral’s net share of premiums and includes Other Revenue. Including the impact of reinsurer caps the reported combined ratio, net of Other Revenue would be 2016: 122%; 2015: 136%; 2014: 134%.
Geographical analysis*1
2016 Spain Italy France US Total
Vehicles insured at period end 189,200 415,500 91,500 168,000 864,200
Turnover (£m) 49.8 118.2 38.3 159.6 365.9
2015 Spain Italy France US Total
Vehicles insured at period end 160,700 315,300 56,800 140,200 673,000
Turnover (£m) 38.6 77.9 21.2 94.7 232.4
*1 Alternative performance measures – refer to the Glossary on page 141 for definition and explanation.
International Car Insurance financial performanceAdmiral’s international insurance businesses continued to grow by 28%, adding over 191,000 customers during the year. Turnover grew by 57% to £365.9 million (2015: £232.4 million). Net revenue increased by 49% to £107.3 million (2015: £72.2 million). Turnover and customers in these businesses represent 14% (2015: 11%) and 17% (2015: 15%) of the Group totals respectively.
The combined ratio improved marginally to 125% (2015: 126%). Continued improvement in ConTe’s prior years claims development and higher net insurance premium revenue has been offset by continued investment in operations in France and the US, resulting in an decreased loss of £19.4 million in 2016 (2015: £22.2 million). The expense ratio has remained level at 49% (2015: 49%). The expense ratio is high in comparison to Admiral’s UK business because of high acquisition costs as the businesses grow and also the continued need to build scale. There are also market specific reasons why the expense ratios are higher, for example higher acquisition costs in the US cause a strain on the expense ratio when the business is growing.
As the Group’s international insurance operations grow, it is expected that they will make losses until appropriate scale has been achieved. The Group is satisfied with the progress each business continues to make towards the goal of becoming a sustainable, growing, profitable operation.
Admiral Seguros (Spain) which launched in 2006 is the oldest of Admiral’s international operations and operates under two brands, Balumba and Qualitas Auto. Admiral Seguros focused on growth in 2016, following the achievement of break-even on an underwriting year basis in 2015, and took advantage of market conditions resulting in growth of 18% and ending the year with 189,200 customers at the end of 2016.
32 Admiral Group plc · Annual Report and Accounts 2016
Strategic Report: International Car Insurance review

“I just completed a transaction with Patrice in your Customer Service Department. Seldom do I have the opportunity to speak with as kind and considerate an employee.
I called to update my payment information and was greeted by the warm and considerate voice of Patrice. She courteously and rapidly addressed all of my concerns, resolved the reason for my call and offered further assistance. It is no small matter for me that in the process she considerably discounted the price of my policy and insured my continued patronage of Elephant Insurance”
Elephant Auto Customer Service
The Group’s largest international operation is ConTe in Italy, which insured 415,500 vehicles at the end of 2016, up 32% on 2015. ConTe was launched in 2008 and in 2016 continued to experience positive development in the projected ultimate outcomes of most underwriting years allowing further reserve releases in 2016 and a third year of profits. Despite this, ConTe continues to hold a prudent margin in its claims reserves above actuarial best estimate.
Admiral’s youngest and smallest international insurance business is L’olivier – assurance auto, which launched in 2010 in France. L’olivier insured 91,500 vehicles at the end of 2016, up over 60% on the prior year and has focused on growth and accelerating brand development during the year.
The consolidated result of Admiral’s insurance operations in Spain, Italy and France was a loss of £3.7 million, almost 50% down on 2015 (2015: £7.0 million). The combined ratio net of other revenue (excluding the impact of reinsurer caps) improved to 99% from 103% primarily due to improved claims experience.
In the USA, Admiral underwrites motor insurance in six states (Virginia, Maryland, Illinois, Texas, Indiana and Tennessee) through its Elephant Auto business, which launched at the end of 2009. At the end of 2016 Elephant Auto insured over 168,000 vehicles, up 20% year-on-year. Turnover was £159.6 million, up almost 70% on the prior year (2015: £94.7 million). Elephant’s result for the period was a loss of £15.7 million, which is broadly consistent with £15.2 million in 2015, despite significant growth, and reflects the ongoing investment in the business. Elephant Auto’s combined ratio net of other revenue improved from 134% in 2015 to 130% in 2016.
A great customer experience
Regulatory environmentAdmiral’s European insurance operations are generally subject to the same regulation as the UK Car Insurance business, details of which are summarised above, but also comply with local requirements as appropriate. The Group’s US insurer, Elephant Insurance Company, is regulated by the Virginia State Corporation Commission’s Bureau of Insurance. The Company is required to maintain capital at levels prescribed by the regulator and holds a surplus above these requirements at all times.
International Car Insurance co-insurance and reinsuranceAs noted earlier, Admiral makes significant use of proportional risk sharing agreements, where insurers outside the Group underwrite a majority of the risk generated, either through co-insurance or quota share reinsurance contracts.
For the 2016 year Admiral retained 35% (Italy), 30% (France and Spain) and 33% (USA) of the underwriting risk respectively. The arrangements for 2017 will remain the same.
All contracts are subject to certain caps on the co-insurers and reinsurers’ exposures and all contracts have profit commission terms that allow Admiral to receive a proportion of the profit earned on the underwriting once the business reaches cumulative profitability. The contracts include proportional sharing of Other Revenue.
Financial Statements Additional InformationCorporate GovernanceStrategic Report Introduction
33Admiral Group plc · Annual Report and Accounts 2016

34 Admiral Group plc · Annual Report and Accounts 2016
People and culture
“I can honestly say that the chap I spoke to today on the phone was the politest, most helpful, non-robotic in conversation individual I have Come across from any car insurance provider I have ever had. To build a great company you need great employees and in my opinion Admiral have one in him. Thank you.” UK Renewals
A great customer experience
Strategic Report: People and culture
34 Admiral Group plc · Annual Report and Accounts 2016

Financial Statements Additional InformationCorporate GovernanceStrategic Report Introduction
35Admiral Group plc · Annual Report and Accounts 2016
CommunicationWe believe that it is really important for everyone to understand what is happening in the business and we share information in a number of ways, but communication is two-way and we remain impressed by the openness of our staff and their willingness to share their experiences and suggestions for improvements for customers.
EqualityWe want every member of staff to feel part of the Admiral collective endeavour; after all everyone is a shareholder, no matter what their role or location. There are no obvious signs of separation or inequality and everyone values each staff member’s contribution.
Reward and RecognitionWe believe in sharing Admiral’s success with our staff, but reward and recognition is more than just money; it is about praising people for good performance, providing feedback or simply saying ‘thank you’ for a job well done.
FunWe encourage our staff to take part, to have fun, to do something a bit wild or to just spend some time with their colleagues outside of work. We firmly believe that people who enjoy what they do deliver outstanding performance for our customers and Admiral’s success is built upon that.
In the last year we achieved recognition for creating an exceptional working environment and picked up 12 national and international awards for best work place.
All staff8,997
Male: 4,372Female: 4,625
Believe this is a friendly place to work
Believe the Admiral Group is truely customer focused
Management is approachable, easy to talk with
People care about each other here
96%
87%
88%
89%
Our annual staff survey
Happy people make happy customers and happy customers make for a successful, thriving company. Our success goes hand-in-hand with having a strongculture. So our philosophy is a simple yet effective one: People who enjoy what they do, do it better.
What a great… place to work
Financial Statements Additional InformationCorporate GovernanceStrategic Report Introduction
35Admiral Group plc · Annual Report and Accounts 2016
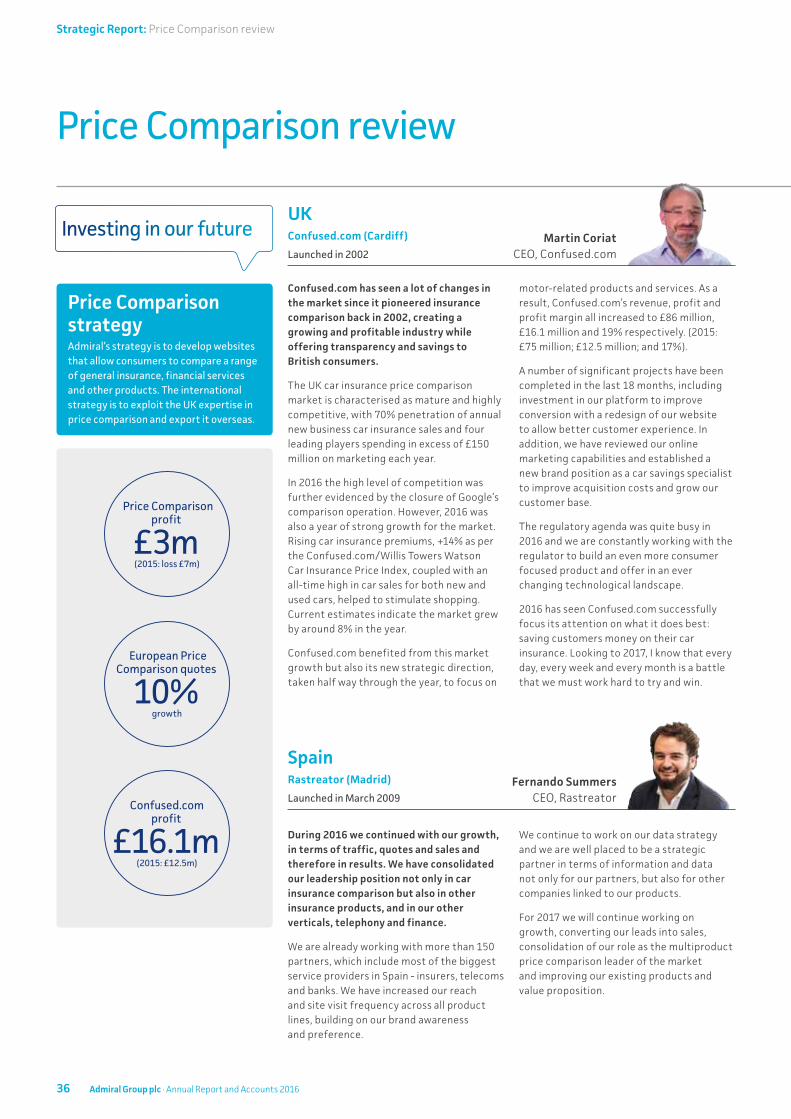
Confused.com has seen a lot of changes in the market since it pioneered insurance comparison back in 2002, creating a growing and profitable industry while offering transparency and savings to British consumers.
The UK car insurance price comparison market is characterised as mature and highly competitive, with 70% penetration of annual new business car insurance sales and four leading players spending in excess of £150 million on marketing each year.
In 2016 the high level of competition was further evidenced by the closure of Google’s comparison operation. However, 2016 was also a year of strong growth for the market. Rising car insurance premiums, +14% as per the Confused.com/Willis Towers Watson Car Insurance Price Index, coupled with an all-time high in car sales for both new and used cars, helped to stimulate shopping. Current estimates indicate the market grew by around 8% in the year.
Confused.com benefited from this market growth but also its new strategic direction, taken half way through the year, to focus on
motor-related products and services. As a result, Confused.com’s revenue, profit and profit margin all increased to £86 million, £16.1 million and 19% respectively. (2015: £75 million; £12.5 million; and 17%).
A number of significant projects have been completed in the last 18 months, including investment in our platform to improve conversion with a redesign of our website to allow better customer experience. In addition, we have reviewed our online marketing capabilities and established a new brand position as a car savings specialist to improve acquisition costs and grow our customer base.
The regulatory agenda was quite busy in 2016 and we are constantly working with the regulator to build an even more consumer focused product and offer in an ever changing technological landscape.
2016 has seen Confused.com successfully focus its attention on what it does best: saving customers money on their car insurance. Looking to 2017, I know that every day, every week and every month is a battle that we must work hard to try and win.
Price Comparison review
Price Comparison strategy Admiral’s strategy is to develop websites that allow consumers to compare a range of general insurance, financial services and other products. The international strategy is to exploit the UK expertise in price comparison and export it overseas.
Investing in our future
During 2016 we continued with our growth, in terms of traffic, quotes and sales and therefore in results. We have consolidated our leadership position not only in car insurance comparison but also in other insurance products, and in our other verticals, telephony and finance.
We are already working with more than 150 partners, which include most of the biggest service providers in Spain - insurers, telecoms and banks. We have increased our reach and site visit frequency across all product lines, building on our brand awareness and preference.
We continue to work on our data strategy and we are well placed to be a strategic partner in terms of information and data not only for our partners, but also for other companies linked to our products.
For 2017 we will continue working on growth, converting our leads into sales, consolidation of our role as the multiproduct price comparison leader of the market and improving our existing products and value proposition.
Martin Coriat CEO, Confused.com
UKConfused.com (Cardiff)
Launched in 2002
SpainRastreator (Madrid)
Launched in March 2009Fernando Summers
CEO, RastreatorConfused.com
profit
£16.1m(2015: £12.5m)
European Price Comparison quotes
10%growth
Price Comparison profit
£3m(2015: loss £7m)
36 Admiral Group plc · Annual Report and Accounts 2016
Strategic Report: Price Comparison review

While there are some differences among the 51 distinct auto insurance markets, an overall steady economy with sustained low gas prices has led to an increase in miles driven among US consumers. In 2016, that led to higher frequency for many of our insurance partners and they took action with higher rates for consumers. This was both an opportunity as rate increases drive more consumers to shop and a challenge for us as carriers shrink risk appetite and convert at lower levels. We continued optimizing both our national and state-by-state advertising investments in light of the market conditions and our product offering to take advantage of this swing in the auto insurance pricing cycle.
compare.com made significant strides this year on both the quality of our product offering and the efficiency of our customer acquisition. We nearly doubled our number of auto insurance brands under contract, our average number of rates returned nationwide and the number of policies we helped our carrier partners bind. We also launched a second product for customers looking for bundled auto and property
policies, which is how many US consumers prefer to shop. Over the same period this year, our acquisition costs have dropped by nearly two thirds proving that we can compete on acquisition economics at a level only achieved by a few large personal lines insurance carriers in the US market. We outgrew our office building this year and moved our staff into a new space three times the size and customized to support the growth of our open and fun culture.
In early 2016, we also saw our largest auto insurance comparison competitor – Google – make the decision to withdraw for their own strategic reasons, which gave us the opportunity to use earmarked IT resources to broaden our relationships with key partners into even more states. We even added a partner in Hawaii, so we can now quote in 50 of the 51 markets. Other players continued to press into the comparison market with similar, but different, models. The state-by-state and carrier-by-carrier nature of the US insurance market gives us a solid foothold as the largest auto insurance comparison site in the US.
While delivering a smaller than planned loss in 2016 it was on a smaller than planned business. We remain very cognizant that we are one of Admiral’s largest investments and while we do have the great opportunity to transform the US market we do not yet have the guarantee of doing so. In fact we anticipate delivering continued losses in 2017 depending on the dynamics and scale of the business and the overall behavior of the market.
While the US price comparison market starts 2017 still in its infancy, the potential remains enormous. A recent survey by Acxiom shows consumers are six times more likely to buy their insurance via a comparison site than in the past. compare.com has built the carrier network as well as the acquisition funnel to be the leading player as consumers continue to adopt this better way to shop for insurance products. We remain cautiously optimistic about our opportunity for success in transforming the landscape of the US insurance market.
2016 was a challenging year for LeLynx.fr.
Based on the 2015 results, our expectations of the impact of Loi Hamon, in terms of changing behavior in 2016, were optimistic, however, the aggregator market only grew by 1%. The French consumer has not yet taken advantage of the opportunity to change their insurance provider, even if the process has been simplified substantially.
In an effort to unblock the market and as a way to build trust, LeLynx launched a TV campaign based on a well known celebrity.
Our vision is still positive on the French market and we remain competitive in an increasingly crowded environment. We are focused on maintaining our position as one of the market leaders, based on delivering a superior product and customer experience.
Elena Betés European Price Comparison Director
Andrew Rose CEO, compare.com
FranceLeLynx (Paris)
Launched in January 2010
USAcompare.com (Virginia)
Launched in March 2013
“Thanks! I’m going to contract the insurance. It’s been great checking your website, I’ve saved 300€, you can suppose that I have been pleasantly surprised”
Rastreator
A great customer experience
Financial Statements Additional InformationCorporate GovernanceStrategic Report Introduction
37Admiral Group plc · Annual Report and Accounts 2016

UK Price Comparison – Confused.comThe UK price comparison market remained very competitive in 2016, but favourable market conditions (rising prices and more shopping activity) saw more visitors to Confused.com’s website and consequently higher quote volumes. Despite this competitive environment, Confused.com achieved a strong result, with revenue 14% higher than 2015 at £85.7 million (2015: £75.4 million) from growth of 8% in the UK price comparison market as well as a new driver-centric strategy supported by new marketing. Profit increased by 29% to £16.1 million (2015: £12.5 million).
Confused.com’s operating margin improved to 19% (2015: 17%).
International Price ComparisonAdmiral operates three price comparison businesses outside the UK: in Spain (Rastreator), France (LeLynx) and the US
(compare.com). Admiral Group owns 75% of Rastreator, with the remaining 25% owned by Mapfre. Admiral Group owns 71% of compare.com, with the remaining 29% owned by White Mountains and Mapfre.
The combined revenue from the European operations in 2016 increased to £36.2 million (2015: £28.6 million), reflecting nearly 10% more quotes provided to customers and improved conversion rates. Both Rastreator and LeLynx have strong brand recognition in their respective markets. The Group’s share of the combined result for Rastreator and LeLynx was a profit of £2.8 million (2015: £1.8 million), the increase reflecting strong performance from Rastreator which continues to build on its multi-product strategy covering insurance, telephony and utilities, amongst other product lines, and which doubled its profits in 2016, offset by marketing investment in LeLynx. Statutory profit before tax increased to £3.9 million (2015: £2.3 million).
Price Comparison review continued
Price Comparison financial review
£m 2014 2015 2016
Revenue
Car insurance price comparison 81.0 82.3 97.7
Other 26.5 25.8 31.5
Total Revenue 107.5 108.1 129.2
Expenses (110.3) (123.6) (132.1)
Loss before tax (2.8) (15.5) (2.9)
Confused.com profit 15.8 12.5 16.1
International price comparison result (18.6) (28.0) (19.0)
(2.8) (15.5) (2.9)
Group’s share of profit/(loss) before tax*1
Confused.com profit 15.8 12.5 16.1
International price comparison result (12.2) (19.7) (13.4)
3.6 (7.2) 2.7
*1 Alternative performance measures – refer to the Glossary on page 141 for further detail and explanation.
The Group continues to invest in compare.com, its US comparison operation based in Virginia. During 2016 Admiral’s share of compare.com’s loss reduced to £16.2 million before tax (2015: £21.5 million) reflecting a focus in key states on efficient advertising and reducing acquisition costs. Statutory loss before tax decreased to £22.8 million (2015: £30.3 million). The Group plans continued investment in compare.com during 2017 and anticipates that the Group’s share of compare.com’s losses for 2017 will be in the range of $15-25 million.
The combined result for International Price Comparison was therefore a loss of £13.4 million (2015: loss £19.7 million) – the profit from the European operations offset by investment in compare.com. Statutory loss before tax was £19.0 million (2015: £28.0 million).
Preminen, the Group’s newest price comparison operation continues to explore the potential of price comparison in new markets overseas, in partnership with Mapfre.
Regulatory environmentConfused.com is regulated by the Financial Conduct Authority (FCA) as an insurance intermediary and is subject to all relevant intermediation rules, including those on solvency capital.
The European operations are all structured as branches of UK companies, with the UK insurance intermediary permission passported into Europe.
compare.com is a regulated insurance agency domiciled in Virginia, US, and licensed in all other US states.
38 Admiral Group plc · Annual Report and Accounts 2016
Strategic Report: Price Comparison review

The Group operates a UK Commercial Vehicle insurance broker (Gladiator) offering van insurance and associated products, typically to small businesses, via telephone and the internet, including price comparison websites. Gladiator has increased customer numbers from 146,600 to 170,800 at the end of 2016 and operating profit increased to £2.0 million (2015: £1.5 million).
Other interest and investment income includes £4.9 million (2015: £nil) of unrealised gains on forward foreign exchange contracts which have been impacted during 2016 by downward movements in the value of sterling. These gains have the potential to reverse over time if the sterling rate recovers before the contracts expire.
Share scheme charges relate to the Group’s two employee share schemes (refer to note 8 to the financial statements). The increase in the charge is due to an increase in the number of awards reflecting the increasing Group headcount.
Business development costs include costs associated with potential new ventures, including investment in Admiral Loans and Preminen, the Group’s price comparison incubator.
Finance charges of £11.4 million (2015: £11.1 million) mainly represents interest on the £200 million subordinated notes issued in July 2014 (refer to note 6 to the financial statements).
UK Exit from the European Union (‘Brexit’)On 23 June 2016, the UK voted in a referendum to leave the EU. At the date of this report, the timetable for and details of the implementation of this decision remain unclear.
Market volatility, including that which resulted from the Brexit vote (notably very significant reductions in risk free interest rates) adversely impacted the Group’s solvency position reported in the interim results in August 2016. This was due to an increased regulatory valuation of claims liabilities, in particular in relation to longer dated potential PPO claims, and hence reduced capital. Since August 2016, market volatility has reduced, risk free interest rates have increased and the Group has received approval to use a volatility adjusted yield curve in discounting claim liabilities. This has led to a reduced regulatory valuation of claims liabilities and a stronger solvency position.
As discussed above, the solvency ratio remains very strong at 212% after the proposed final dividend is accounted for. The Directors are satisfied this represents a very satisfactory level of surplus above regulatory requirements and buffers.
Other Group items financial review
£m 2014 2015 2016
UK Commercial Vehicle operating profit 2.2 1.5 2.0
Other interest and investment income 3.7 6.5 13.4
Share scheme charges (21.2) (27.2) (31.9)
Business development costs (0.7) (1.9) (5.8)
Other central overheads (3.9) (5.6) (4.1)
Finance charges (4.6) (11.1) (11.4)
“I would like to express my deepest satisfaction for this Insurance Company. After having been involved in an accident with a complicated evolution, I have received the total reimbursement of the damages. I would like to point out the work conducted by your agent who with competence, courtesy and non common helpfulness satisfied my needs completely.”
UK New Business
A great customer experience
Brexit also brings additional risks including:
• potential further market volatility, particularly in interest and exchange rates
• the potential for the uncertainty or the emerging terms of exit regarding Brexit to trigger or exacerbate less favourable economic conditions in the UK and other countries in which Admiral operates (though it is worth noting that car insurance has tended to be resilient to economic downturns)
• potential changes to or withdrawal of the right of UK financial services firms to trade in Europe without the need for locally regulated entities (‘passporting’)
• potential changes to the rules relating to the free movement of people between the UK and EU member states
The Group is making plans to be able to deal with the withdrawal of passporting, should this transpire, after the UK’s exit from the EU is finalised and will continue to closely monitor developments over the coming months and years.
At the current time the Group does not foresee a material adverse impact on day to day operations (including customers or staff), whilst recognising that other issues may emerge over time.
Financial Statements Additional InformationCorporate GovernanceStrategic Report Introduction
39Admiral Group plc · Annual Report and Accounts 2016

Principal risks and uncertainties
The Board, with support from the Group Risk Committee and the Group Risk Department, undertakes a regular and robust assessment of the principal risks. These risks have been summarised as those which would threaten its business model, future performance, liquidity and solvency.The table below sets out the principal risks which Admiral has identified through its Enterprise Risk Management Framework (‘ERMF’). The impact of those risks and actions taken to mitigate them are explained below.
Insurance RiskReserving Risk in UK and International Insurance
Admiral is exposed to reserving risk through its underwriting of motor and household insurance policies. Claims reserves in the financial statements may prove inadequate to cover the ultimate cost of earned claims which are by nature uncertain.
This is a particular risk for motor insurance liabilities, where the amount payable for bodily injury claims (particularly large claims) can change significantly during the lifetime of the claim as a result of external risks such as changes in Ogden rates and impacts of increased levels of Periodical Payment Orders.
Impact
Adverse run-off leading to higher claims costs in the financial statements.
PPO claims are capital intensive owing to increased uncertainty of the cost of significant claims over a longer term.
Mitigating factors
Admiral has a conservative reserving policy and continues to hold a material margin in its financial statement claims reserves above actuarially determined best estimates.
Best estimate reserves are estimated both internally and externally by an independent actuary.
For very large claims Admiral purchases excess of loss reinsurance, which mitigates a portion of the loss.
Admiral holds a margin in booked reserves to cover changes impacting claims. Furthermore, Admiral continues to hold an additional margin in its reserves in excess of the projected ultimate outcomes to cover other potential claim shocks.
Regular reviews of both settled and potential PPO cases are undertaken by the Claims and Actuarial teams, with independent Actuarial opinions provided as part of the external reserving analysis.
Admiral’s investment portfolio is the result of a structured, disciplined and transparent investment process which considers settled and potential future PPOs.
Premium Risk and Catastrophe Risk
The Group is exposed to the risk that claims cost on future business is higher than allowed for in the premiums charged to customers.
The group is exposed to the risk of increased claims and reduced business volumes following both a UK and European recession.
Catastrophe Risk: Admiral is exposed to the risk of high losses due to the occurrence of man-made catastrophes or natural weather events.
Impact
Higher claims costs and loss ratios, resulting in reduced profits or underwriting losses.
A large flood or windstorm causes extensive property damage (both motor and household) to a significant proportion of the portfolio, leading to a large total claims cost in relation to the event.
Mitigating factors
There are a number of aspects which contribute to Admiral’s strong UK underwriting results, including:
• Experienced and focused senior management and teams in key business areas including pricing and claims management;
• Highly data-driven and analytical approach to regular monitoring of claims and underwriting performance;
• Capability to identify and resolve underperformance promptly through changes to key performance drivers, particularly pricing; and
• Continuous appraisal of and investment in staff, systems and processes.
Admiral purchases excess of loss reinsurance, designed to mitigate the impact of very large individual or catastrophe event claims.
40 Admiral Group plc · Annual Report and Accounts 2016
Strategic Report: Principal risks and uncertainties

Group RiskErosion of competitive advantage in UK Car Insurance
Admiral typically maintains a significant combined ratio advantage over the UK market. This advantage and/or the level of underwriting profit (and associated profit commission) could be eroded.
This risk could be exacerbated by irrational competitor pricing and/or new technologies used within the insurance market. It may arise from new or existing competitors.
Impact
A worse UK Car Insurance result and lower return on capital employed.
A sustained and uncorrected erosion of competitive advantage could affect the ability of Admiral to extend its reinsurance arrangements, which might in turn require Admiral to hold more capital.
Mitigating factors
Admiral’s focus remains on the wide range of factors that contribute to Admiral’s combined ratio outperformance of the UK market. Some are set out earlier in the Strategic Report, but in addition:
• Track record of innovation and ability to react quickly to market conditions and developments; and
• Keen focus on maintaining a low-cost infrastructure and efficient acquisition costs.
Failure of geographic and/or product expansion
Admiral continues to develop the UK household and overseas operations.
One or more of the operations could fail to become a sustainable, profitable long term business.
Product expansion into new areas could lead to unprofitable business and increased regulatory risk.
Growth in business plans exceeds the scale of infrastructure of the operation.
Impact
Higher than planned losses (and potentially closure costs) and distraction of key management.
A collective failure of these businesses would threaten Admiral’s objective to diversify its earnings by expanding into new markets and products.
Mitigating factors
Admiral’s approach to expansion and product development remains conservative, applying the ‘test and learn’ philosophy that has proven successful for previous operations. International insurance businesses have generally executed cautious launch strategies and are all backed by proportional reinsurance support which provides substantial mitigation against start-up losses in the early years.
New price comparison businesses have aligned their marketing investment with the extent of improvement in key performance indicators such as average cost per quote and conversion ratio. The Group also accepts partial disposals of equity to share start-up losses with partners.
The Directors are mindful of management stretch and regularly assess the suitability of the infrastructure and management structure in place for Admiral’s new UK and international operations.
Reduced availability of co-insurance and reinsurance arrangements
Admiral uses proportional co-insurance and reinsurance across its insurance businesses to reduce its own capital needs (and increase return on the capital it does hold) and to mitigate the cost and risk of establishing new operations.
There is a risk that support will not be available in the future if the results and/or future prospects of either the UK business or (more realistically) one or more of the newer operations are not satisfactory to the co- and/or reinsurers.
Impact
A potential need to raise additional capital to support an increased underwriting share. This could be in the form of equity or debt.
Return on capital might reduce compared to current levels.
Mitigating factors
Admiral mitigates the risk to its reinsurance arrangements by ensuring that it has a diverse range of financially secure partners.
Admiral continues to enjoy a long term relationship with one of the world’s largest reinsurers, Munich Re, which has supported Admiral since 2000.
Admiral also has relationships with a number of other reinsurers.
As well as UK Motor, long term arrangements are also in place for UK Household and International businesses.
Financial Statements Additional InformationCorporate GovernanceStrategic Report Introduction
41Admiral Group plc · Annual Report and Accounts 2016
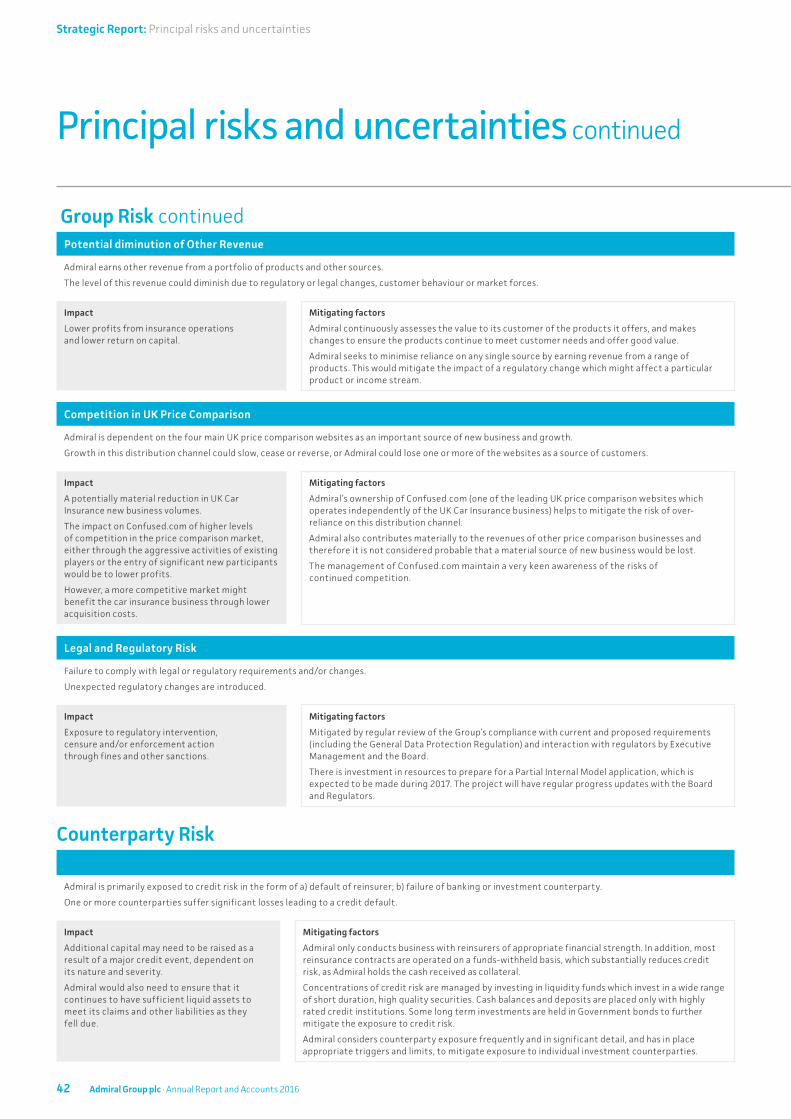
Principal risks and uncertainties continued
Group Risk continuedPotential diminution of Other Revenue
Admiral earns other revenue from a portfolio of products and other sources.
The level of this revenue could diminish due to regulatory or legal changes, customer behaviour or market forces.
Impact
Lower profits from insurance operations and lower return on capital.
Mitigating factors
Admiral continuously assesses the value to its customer of the products it offers, and makes changes to ensure the products continue to meet customer needs and offer good value.
Admiral seeks to minimise reliance on any single source by earning revenue from a range of products. This would mitigate the impact of a regulatory change which might affect a particular product or income stream.
Competition in UK Price Comparison
Admiral is dependent on the four main UK price comparison websites as an important source of new business and growth.
Growth in this distribution channel could slow, cease or reverse, or Admiral could lose one or more of the websites as a source of customers.
Impact
A potentially material reduction in UK Car Insurance new business volumes.
The impact on Confused.com of higher levels of competition in the price comparison market, either through the aggressive activities of existing players or the entry of significant new participants would be to lower profits.
However, a more competitive market might benefit the car insurance business through lower acquisition costs.
Mitigating factors
Admiral’s ownership of Confused.com (one of the leading UK price comparison websites which operates independently of the UK Car Insurance business) helps to mitigate the risk of over-reliance on this distribution channel.
Admiral also contributes materially to the revenues of other price comparison businesses and therefore it is not considered probable that a material source of new business would be lost.
The management of Confused.com maintain a very keen awareness of the risks of continued competition.
Legal and Regulatory Risk
Failure to comply with legal or regulatory requirements and/or changes.
Unexpected regulatory changes are introduced.
Impact
Exposure to regulatory intervention, censure and/or enforcement action through fines and other sanctions.
Mitigating factors
Mitigated by regular review of the Group’s compliance with current and proposed requirements (including the General Data Protection Regulation) and interaction with regulators by Executive Management and the Board.
There is investment in resources to prepare for a Partial Internal Model application, which is expected to be made during 2017. The project will have regular progress updates with the Board and Regulators.
Counterparty Risk
Admiral is primarily exposed to credit risk in the form of a) default of reinsurer; b) failure of banking or investment counterparty.
One or more counterparties suffer significant losses leading to a credit default.
Impact
Additional capital may need to be raised as a result of a major credit event, dependent on its nature and severity.
Admiral would also need to ensure that it continues to have sufficient liquid assets to meet its claims and other liabilities as they fell due.
Mitigating factors
Admiral only conducts business with reinsurers of appropriate financial strength. In addition, most reinsurance contracts are operated on a funds-withheld basis, which substantially reduces credit risk, as Admiral holds the cash received as collateral.
Concentrations of credit risk are managed by investing in liquidity funds which invest in a wide range of short duration, high quality securities. Cash balances and deposits are placed only with highly rated credit institutions. Some long term investments are held in Government bonds to further mitigate the exposure to credit risk.
Admiral considers counterparty exposure frequently and in significant detail, and has in place appropriate triggers and limits, to mitigate exposure to individual investment counterparties.
42 Admiral Group plc · Annual Report and Accounts 2016
Strategic Report: Principal risks and uncertainties

Market Risk
Market risk arises as a result of fluctuations in the value of market prices of investment assets, liabilities, or the income from our investment portfolio.
Impact
Market volatility (notably very significant reductions in risk free interest rates) can adversely impact the Group’s solvency due to an increased regulatory valuation of claims liabilities, in particular in relation to longer dated potential PPO claims.
Mitigating factors
The Group’s low appetite for market risk results in an investment strategy that focuses on capital preservation, low volatility of returns and strong liquidity. The majority of the portfolio is invested in high quality fixed income and other debt securities, and money market funds in order to achieve these objectives.
The Group’s mitigation for interest rate risk resulting from long duration PPO liabilities includes a comprehensive level of reinsurance cover and continuing focus on strategies to ensure that the risks relating to both assets and liabilities are appropriately matched.
The Group has relatively low exposure to net assets and liabilities in currencies other than pounds sterling.
Operational Risk People, processes, business continuity
Operational Risk arises within all areas of the business. The principal categories of operational risk for Admiral are:
• People
• Processes
• IT Systems
• Information Security
• Business Continuity
• Customer Outcomes
Impact
The risk of reductions in earnings and/or value, through financial or reputational loss, from inadequate or failed internal processes and systems, or from people related or external events.
In particular:
Potential customer detriment and/or potential regulatory censure/ enforcement and/or reputational damage as a result of Admiral’s action.
Risk to Admiral occurs through the losses that could occur if the internal control framework to manage these business processes fails.
Availability of systems & data
Integrity of data
Confidentiality of data
Mitigating factors
We aim to attract, retain and motivate quality staff to deliver quality customer service and achieve business objectives.
Succession planning is based on targeted recruitment, identifying potential leaders through internal development, talent management and retention processes.
Internal controls are in place and monitored to mitigate the risk and the control framework is regularly reviewed.
The internal audit function has an agreed cycle of testing of the adequacy and effectiveness of controls.
Regular review of the effectiveness of the Group’s IT capability by Executive Management and the Board.
Strong project governance and oversight of new systems implementations with external specialist review and assurance where required.
Admiral continues to invest in its Security Programme in order to mitigate Information Security risks.
Within IT there is a major incident team which is tasked with maintaining system availability, with business continuity and disaster recovery plans in place.
Data is backed up to allow for its recovery in the event of corruption.
Admiral operates the three lines of defence model for overseeing its products, processes and service. At each stage of the customer journey customer outcomes are monitored, managed and reported in order to mitigate customer detriment.
Admiral purchases a range of insurance covers to mitigate the impact of a number of operational risks.
This Strategic Report was approved by the Board of Directors and signed on its behalf by:
David Stevens, CBEChief Executive Officer 7 March 2017
Financial Statements Additional InformationCorporate GovernanceStrategic Report Introduction
43Admiral Group plc · Annual Report and Accounts 2016

What a great… view
*1 Owen Clarke joined the Audit Committee with effect from 1 January 2016 and the Remuneration Committee with effect from 28 April 2016.
*2 Penny James joined the Nomination Committee with effect from 28 April 2016.
Board of Directors
Audit Committee
Membership at 31 December 2016••Colin Holmes (Chair) ••Owen Clarke*1 ••Annette Court ••Penny James
Meetings during 2016: 7
Read more on Page 54
Nomination Committee
Membership at 31 December 2016••Alastair Lyons (Chair) ••Colin Holmes ••Penny James*2
Meetings during 2016: 2
Read more on Page 62
Group Risk Committee
Membership at 31 December 2016••Jean Park (Chair) ••Annette Court ••Manning Rountree ••David Stevens
Meetings during 2016: 6
Read more on Page 58
Remuneration Committee
Membership at 31 December 2016••Annette Court (Chair) ••Owen Clarke*1 ••Jean Park
Meetings during 2016: 5
Read more on Page 64
Board Committees
People and Corporate responsibility Read more on Gender diversity on Page 78
Board composition
Gender diversity
Chairman: 1Executive: 2Non-Executive: 7
Male: 6Female: 4
Admiral Group plc · Annual Report and Accounts 201644
Corporate Governance: Governance overview
Governance overview
Succession planning has been a key area of focus for the Board in 2016
Dear Shareholder,On behalf of the Board I am pleased to present the Corporate Governance Report for the financial year ended 31 December 2016. The focus of the Board continues to be on maintaining high standards of corporate governance which it achieves by ensuring the appropriateness and effectiveness of the Group’s management and control framework. This Report sets out the Admiral framework of governance and the approach the Board has taken during 2016 to promote the standards of good corporate governance that are rightly expected by our shareholders.
We believe that having a sound corporate governance framework enables effective and efficient decision making and promotes the right balance of skills and experience to assess and manage the risks in the markets in which the Group operates.
Succession planning has been a key area of focus for the Board in 2016. As you will have seen from my Chairman’s letter earlier in this report, I will be retiring as Chairman at the forthcoming AGM in April after serving for 16 years. I am delighted that Annette Court has been selected by the Board to take
the chair as she has considerable experience, both of the industry and as a non-executive director of Admiral. As a consequence there will be review of the composition of the Group’s committees, in particular those of which Annette is currently a member, to ensure that they continue to comply with governance requirements. In May, Henry Engelhardt retired as Chief Executive although he continues to work with our businesses in the UK and overseas. The Group was fortunate to have someone of David Stevens’ capability and experience to pursue the Group’s successful development as CEO. In April, we also said goodbye to Non-Executive Directors Lucy Kellaway and Margaret Johnson who both stepped down at the AGM in April, each having served 9 years on the Board.
In the context of the Board changes that occurred during the year and in order to ensure that the Board continued to represent the right mix of skills, experience and background, the Nomination Committee reviewed the balance and composition of the Board. Following this review, we were pleased to welcome Justine Roberts who joined the Board in June. Justine is CEO and co-founder of internet company, Mumsnet.com, which has grown into the UK’s biggest online network for parents. Justine has been responsible for the creation, strategic direction and overall management of Mumsnet, building it into one of the most recognisable internet brands in the UK. She brings a wealth of experience interacting with consumers across social media. Such experience will be invaluable as the Group seeks to grow its digital channels in the coming years.
As I highlighted in last year’s annual report, the Board undertook an externally facilitated evaluation this year, being three years after the last external evaluation. This was facilitated by Ian White, an independent external consultant with extensive experience of
carrying out board evaluations of listed companies. The process of evaluating the Board’s performance this year consisted of each Board member completing a questionnaire detailing specific areas of focus for the Board including succession planning and Board composition, the priorities for change, the impact of previous evaluations, and board expertise to meet future challenges. The completed questionnaires then formed the basis for discussion during the separate meetings that Ian had with each Board member and attendee. Ian presented the results of the evaluation and areas for development to the Board at the meeting in February 2017. A summary of the outcomes of the Board’s discussion and consideration of the results of the evaluation are set out in more detail at page 49 of this report.
We confirm the Group’s compliance with the principles and provisions set out in the UK Corporate Governance Code 2014 (the Code) which is applicable to the year under review. A new version of the Code was introduced in September 2016 and will apply to the Group’s 2017 financial year: we will report on the implementation of the new responsibilities set out in the Code in next year’s report.
This Corporate Governance Report is structured in order to demonstrate to shareholders that the Board has complied during 2016 in all respects with each section of the Code - Leadership; Effectiveness; Accountability; and Relations with Shareholders. Remuneration is dealt with in the separate Remuneration Report.
Alastair Lyons, CBE Chairman 7 March 2017
Admiral Group plc · Annual Report and Accounts 2016 45
Corporate Governance Financial Statements Additional InformationStrategic Report Introduction
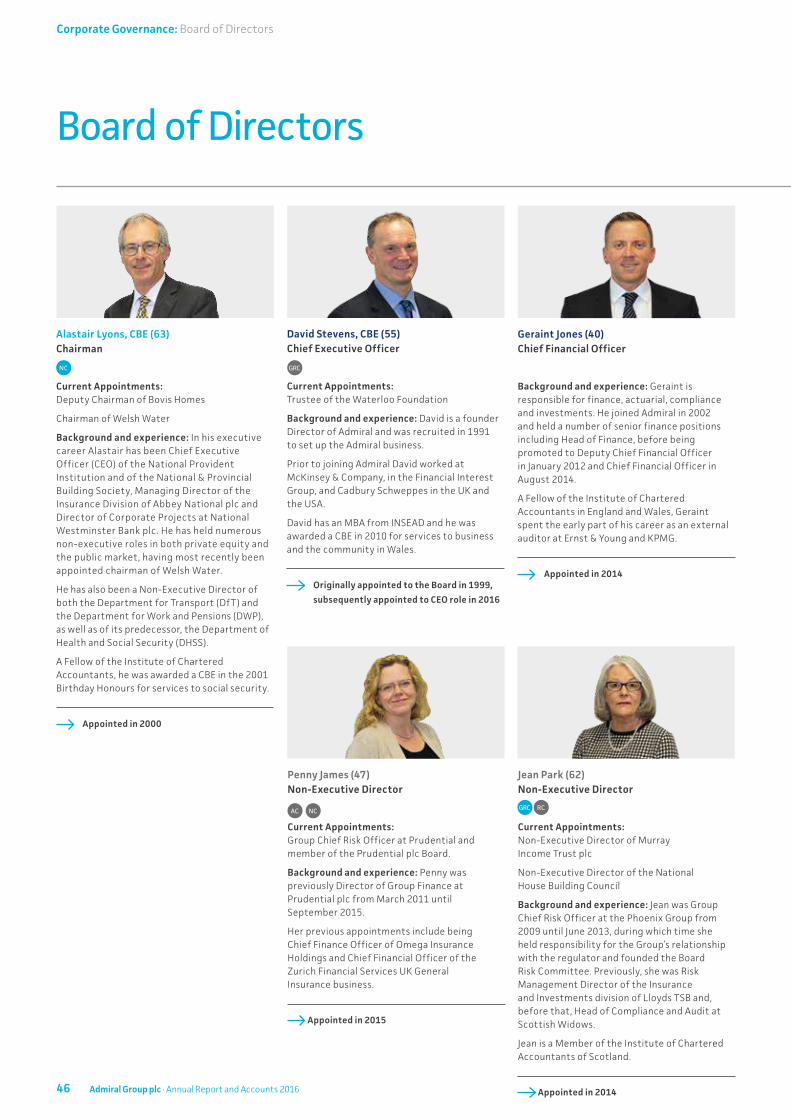
Board of Directors
Alastair Lyons, CBE (63) Chairman
Current Appointments: Deputy Chairman of Bovis Homes
Chairman of Welsh Water
Background and experience: In his executive career Alastair has been Chief Executive Officer (CEO) of the National Provident Institution and of the National & Provincial Building Society, Managing Director of the Insurance Division of Abbey National plc and Director of Corporate Projects at National Westminster Bank plc. He has held numerous non-executive roles in both private equity and the public market, having most recently been appointed chairman of Welsh Water.
He has also been a Non-Executive Director of both the Department for Transport (DfT) and the Department for Work and Pensions (DWP), as well as of its predecessor, the Department of Health and Social Security (DHSS).
A Fellow of the Institute of Chartered Accountants, he was awarded a CBE in the 2001 Birthday Honours for services to social security.
Appointed in 2000
David Stevens, CBE (55) Chief Executive Officer
Current Appointments: Trustee of the Waterloo Foundation
Background and experience: David is a founder Director of Admiral and was recruited in 1991 to set up the Admiral business.
Prior to joining Admiral David worked at McKinsey & Company, in the Financial Interest Group, and Cadbury Schweppes in the UK and the USA.
David has an MBA from INSEAD and he was awarded a CBE in 2010 for services to business and the community in Wales.
Originally appointed to the Board in 1999,
subsequently appointed to CEO role in 2016
Jean Park (62) Non-Executive Director
Current Appointments: Non-Executive Director of Murray Income Trust plc
Non-Executive Director of the National House Building Council
Background and experience: Jean was Group Chief Risk Officer at the Phoenix Group from 2009 until June 2013, during which time she held responsibility for the Group’s relationship with the regulator and founded the Board Risk Committee. Previously, she was Risk Management Director of the Insurance and Investments division of Lloyds TSB and, before that, Head of Compliance and Audit at Scottish Widows.
Jean is a Member of the Institute of Chartered Accountants of Scotland.
Appointed in 2014
Geraint Jones (40) Chief Financial Officer
Background and experience: Geraint is responsible for finance, actuarial, compliance and investments. He joined Admiral in 2002 and held a number of senior finance positions including Head of Finance, before being promoted to Deputy Chief Financial Officer in January 2012 and Chief Financial Officer in August 2014.
A Fellow of the Institute of Chartered Accountants in England and Wales, Geraint spent the early part of his career as an external auditor at Ernst & Young and KPMG.
Appointed in 2014
Penny James (47) Non-Executive Director
Current Appointments: Group Chief Risk Officer at Prudential and member of the Prudential plc Board.
Background and experience: Penny was previously Director of Group Finance at Prudential plc from March 2011 until September 2015.
Her previous appointments include being Chief Finance Officer of Omega Insurance Holdings and Chief Financial Officer of the Zurich Financial Services UK General Insurance business.
Appointed in 2015
NC GRC
GRC RCAC NC
46 Admiral Group plc · Annual Report and Accounts 2016
Corporate Governance: Board of Directors

Annette Court (54) Non-Executive Director
Current Appointments: Non-Executive Director of Jardine Lloyd Thompson Group plc, Foxtons plc and Workshare
Chairman of the Dining Club
Background and experience: Between 2007 and 2010 Annette was CEO of Europe General Insurance for Zurich Financial Services and a member of the Group Executive Committee.
Annette is former CEO of the Direct Line Group (formerly known as RBS Insurance). In this role Annette was also a member of the RBS Group Executive Management Committee.
Annette has previously served as a member on the Board of the Association of British Insurers (ABI).
Appointed in 2012
Owen Clarke (53) Non-Executive Director
Current Appointments: Chief Investment Officer of Equistone Partners Europe (formerly Barclays Private Equity, ‘BPE’).
Background and experience: Previous Director of Admiral (1999-2004). Led BPE’s participation in the Management Buy Out.
Appointed in 2015
Manning Rountree (44) Non-Executive Director
Current Appointments: Chief Executive Officer and Director of White Mountains Insurance Group Limited and Director of OneBeacon Insurance Group Ltd, a subsidiary of White Mountains Insurance Group Limited.
Director of Build America Mutual Assurance Company.
Background and experience: Manning joined White Mountains in 2004 and is the former President of WM Advisors.
Prior to joining White Mountains, Manning spent two years with Putnam Investments and three years with McKinsey & Company.
Appointed in 2015
Justine Roberts, CBE (49) Non-Executive Director
Current Appointments: CEO & Founder, Mumsnet.com & Gransnet.com
Advisory board member of Britain Thinks and Portland Communications
Background and experience: Justine founded Mumsnet in 2000 and is responsible for creation, strategic direction and overall management. In May 2011, Justine founded Gransnet, a sister site to Mumsnet, for the over-50s. Before that Justine was a freelance football and cricket journalist for the Times and Daily Telegraph, after working for Deutsche Bank, managing the South African equity operation in US.
Justine was awarded a CBE in the 2017 New Year’s honours list for services to the economy.
Appointed in 2016
Colin Holmes (51) Senior Independent Director
Current Appointments:Chair of the British Heart Foundation Retail CommitteeMember of the Chartered Institute of Management Accountants Advisory Panel
Background and experience: Previous roles include Chairman of GoOutdoors and Non-Executive Director at Bovis Homes Group plc. Until 2010 Colin was a member of the Executive Committee of Tesco plc and during a 22 year career at Tesco held a wide range of positions, including UK Finance Director and CEO of Tesco Express. He is a Fellow of the Chartered Institute of Management Accountants.
Appointed in 2010
Committee membership key
AC Audit Committee member
GRC Group Risk Committee member
NC Nomination Committee member
RC Remuneration Committee member
Committee Chair
Senior Independent Director
AC RC
GRC
GRC AC NCAC RC
Financial Statements Additional InformationCorporate GovernanceStrategic Report Introduction
47Admiral Group plc · Annual Report and Accounts 2016

Leadership The role of the BoardThe Board is the principal decision-making forum for the Group providing entrepreneurial leadership, both directly and through its Committees, and delegating authority to the Executive team. The Board is responsible for organising and directing the affairs of the Group in a manner that is most likely to promote its success for the benefit of its members as a whole. The Board is accountable to shareholders for setting and achieving the Group’s strategic objectives; for the creation and delivery of strong sustainable financial and operational performance; for ensuring that in carrying out its duties the Group’s legal and regulatory obligations are being met; and for ensuring that it operates within appropriately established risk parameters. The Group’s UK regulated entities are responsible to the Financial Conduct Authority (FCA) and the Prudential Regulatory Authority (PRA) for ensuring compliance with the Group’s UK regulatory obligations and that dealings with the FCA and PRA are handled in a constructive, co-operative and transparent manner. Similar provisions apply in respect of the Group’s international businesses with regard to the relevant regulatory authorities in those overseas jurisdictions in which the Group also operates.
The Board has adopted a formal schedule of matters reserved for the Board’s consideration. This is monitored by the Company Secretary and reviewed by the Board on an annual basis. Specific matters reserved to the Board include the approval of:
• The Group’s long term objectives and corporate strategy
• Operating and capital budgets, financial results, and any significant changes to accounting practices or policies
• The Group’s capital structure
• Results and financial reporting
• The system of internal control and risk management
• The Group’s overall risk appetite
• Changes to the structure, size and composition of the Board, including new appointments
• Succession plans for the Board and senior management
• Dividend policy and proposals for dividend payments
• Major acquisitions, disposals, and other transactions outside delegated limits
• The annual review of its own performance and that of its Board Committees
• Annual review of the Group’s Board policies
• The review of the Group’s overall corporate governance arrangements
Board activity during 2016At each scheduled meeting the Board receives updates from the Chief Executive and Chief Financial Officer as to the financial and operational performance of the Group and any specific developments in the areas of the business for which they are directly responsible and of which the Board should be aware. Items that are considered on an annual basis are included in an annual schedule of rolling agenda items to ensure that they are considered at the appropriate point in the financial and regulatory cycle. Meetings are structured so as to allow for consideration and debate of all matters. The heads of the Group’s US and European insurance businesses and the head of UK Insurance (respectively Kevin Chidwick, Milena Mondini and Cristina Nestares) are invited to attend every Board meeting and Board dinner. This has proved an effective means of ensuring that senior managers below Board level have exposure to and gain experience of the operation of the Board.
The Board met on seven occasions in 2016 with all these meetings being held over two days and one of the meetings being a separate strategy meeting held offsite. In addition to the seven scheduled meetings, there were two additional unscheduled telephone meetings that were called at short notice.
In addition to the regular consideration of financial and operating performance and risk management and compliance, the Board received presentations on a variety of topics including updates from the management teams of each of the Group’s businesses and regular reviews of Solvency II related activities.
In addition to his visits to the Group’s UK operations, the Chairman has sought to visit each of the Group’s overseas operations every year and Non-Executive Directors are invited to join either him or the Chief Executive on one or more of their overseas visits each year. In addition, the Non-Executive Directors and the Chairman met during the year without the Executive Directors being present. Non-Executive Directors also attended briefing sessions in Cardiff on different aspects of the Group’s UK business. In order to increase their understanding of the depth and breadth of management across the Group below Board level, the Non-Executive Directors and the Chairman also attended a dinner with members of the Group’s senior management team without the Executive Directors being present. When management teams present to the Board on their operations they are invited to join the Board for dinner which gives the opportunity for informal interaction between directors and management.
Governance Report
48 Admiral Group plc · Annual Report and Accounts 2016
Corporate Governance: Governance Report

Meetings and attendanceDirectors are expected to attend all meetings of the Board and the Committees on which they serve and to devote sufficient time to the Group to perform their duties. Where Directors are unable to attend meetings they receive papers for that meeting giving them the opportunity to raise any issues with the Chairman in advance of the meeting. The number of scheduled Board meetings and Committee meetings of which they are a member attended by each Director during 2016 is provided in the table below.
Scheduled Board meetings
Audit Committee
meetings
Group Risk Committee
meetings
Nomination Committee
meetings
Remuneration Committee
meetings
Total meetings held 7 7 6 2 5
Alastair Lyons (Chairman) 7 2
Henry Engelhardt (Chief Executive Officer)*1 3/3
David Stevens (Chief Executive Officer) 7 4
Geraint Jones (Chief Financial Officer) 7
Owen Clarke 7 7 3/3
Annette Court 7 7 6 5
Colin Holmes 7 7 2
Penny James 7 7 1/1
Margaret Johnson*2 3/3 3/3 2/2
Lucy Kellaway*3 2/3 1/2 1/1
Jean Park 7 6 5
Justine Roberts*4 3/3
Manning Rountree 7 6
*1 Henry Engelhardt stepped down from the Board with effect from 12 May 2016.
*2 Margaret Johnson stepped down from the Board with effect from 28 April 2016.
*3 Lucy Kellaway stepped down from the Board with effect from 28 April 2016.
*4 Justine Roberts joined the Board with effect from 17 June 2016.
Agendas and papers are circulated to the Board electronically in a timely and secure manner in preparation for Board and Committee meetings. The Board agenda is structured by the Chairman in consultation with the Company Secretary and Chief Executive. Routine Board papers are supplemented by information specifically requested by the directors from time to time. All Board and Committee meetings during the year were held in an open atmosphere conducive to robust and constructive challenge and debate. All Directors have, therefore, been able to bring independent judgement to bear on issues such as strategy, risk management, performance, and resources. Additional meetings are called when required and there is contact between meetings, where necessary, to progress the Group’s business.
The Company SecretaryAll the Directors have access to the advice and services of the Company Secretary. He has responsibility for ensuring that Board procedures are followed and for advising the Board, through the Chairman, on governance matters. The Company Secretary provides updates to the Board on regulatory and corporate governance issues, new legislation, and Directors’ duties and obligations. The appointment and removal of the Company Secretary is one of the matters reserved for the Board.
Board effectivenessHaving last carried out an external Board evaluation in 2013 and in accordance with the Code requirement that FTSE 350 companies should carry out an externally facilitated evaluation of the Board at least every 3 years, this year the Board evaluation process was led by Ian
White. Ian is an independent external consultant with experience of evaluating and making recommendations to improve Board effectiveness of a number of listed companies. Other than being a customer of one of the Group’s subsidiaries, Ian has no connection with the Group.
The objectives of the evaluation were to provide an assessment of the effectiveness of the Board and make recommendations to improve the Board process; provide guidance for the new Chairman in leading the Board and working with the CEO; and establish a clear set of actions and objectives for the Board to prioritise and focus on in 2017.
The Chairman, supported by the Company Secretary and in consultation with Ian, compiled a comprehensive questionnaire that was circulated by the Company Secretary for completion by all Directors and Board attendees.
Financial Statements Additional InformationCorporate GovernanceStrategic Report Introduction
49Admiral Group plc · Annual Report and Accounts 2016

The questionnaire considered:
• Time management of Board meetings;
• Board composition and dynamics;
• The effectiveness of the Board in considering the Group’s risk management framework and internal controls;
• The Board’s strategic and operational oversight;
• Succession planning including the oversight of the Group’s processes for managing, developing and retaining talent;
• Management of group subsidiaries;
• Content of discussion and focus at Board meetings; and
• Priorities for change that would improve Board performance.
The results of the review were presented by Ian to the Board in February 2017. Overall the review found that the Board continued to work effectively and that each Director demonstrates full commitment to his/her duties and contributes in an open and transparent way, enabling a detailed level of debate and discussion around material matters affecting the Group. The review also identified good awareness by the Board of the governance and regulatory environment in which the Group operates and the main risks impacting the Group and how they should be managed and mitigated.
The following recommendations were identified in review as areas to which the Board might give particular focus in 2017 in order to enhance the Board’s effectiveness:
• Greater Board visibility of potential successors to key positions from within the business was an area of focus identified in last year’s Board evaluation. It was recommended that Non-Executive Directors spend time, on an informal basis, with the next level of management below Board level to ensure that these individuals are being developed as part of the Group’s longer term succession plans. Although some progress has been made in this area during 2016 with succession plans and talent management on the Board agenda, the evaluation this year recommended the development of a more structured and robust process for management development and succession planning identifying a greater number of potential future leaders of the business;
• Keep strategic focus and development at the top of the Board’s agenda. This continues the theme identified in last year’s evaluation to ensure that more time is available in the Board agenda to discuss strategic topics in the context of the development of the Group;
• Standardising the format of reports that are presented to the Board was identified as an area for improvement in last year’s evaluation. Although progress had been made, it was identified this year that further improvements could be made to review the length and level of detail of some reports with more Executive Summaries, particularly for technical reports;
• Hold more Board meetings in Cardiff in order to give Non-Executive Directors greater exposure to more up and coming managers thereby helping with succession planning and management development. The introduction of sessions organised around Board meetings for Non-Executive Directors to visit, and receive presentations from, the Group’s main UK business units now gives Non-Executive Directors more of an opportunity to see the Group’s main business units as part of their continuing induction and exposure to the Group’s culture;
• Develop a clear recruitment strategy for Board appointments to encompass future skills and identify the characteristics of directors that will be of benefit to the Board together with the development of a clear process to be adopted by the Nomination Committee in appointing directors;
• The Non-Executive Directors should meet in private on a more regular basis with the CEO also invited periodically to these sessions where matters such as succession planning and management development are being discussed;
• Consider in greater depth matters such as competitors, understanding the customers of today and tomorrow, digital, cyber and technical matters such as capital allocation, pricing analytics and operations.
The Chief Executive, to whom he reports, appraises annually the performance of the Executive Director. The Chairman, taking into account the views of the other Directors, reviews the performance of the Chief Executive. The performance of the Chairman is reviewed by the Board led by the Senior Independent Director (SID). Following the latest review, the SID considered and discussed with the Chairman the comments and feedback that had been received from the Directors as part of the Chairman’s evaluation questionnaire, and was able to confirm that the performance of the Chairman continues to be effective and that he continues to demonstrate appropriate commitment to his role.
The roles of the Chairman and Chief ExecutiveThe Board has approved a statement that sets out the clear division of responsibilities between the Chairman and the Chief Executive. The Chairman is primarily responsible for the leadership and workings of the Board, setting its agenda, and monitoring its effectiveness. The Chairman is not involved in the day-to-day management of the business. Save for matters reserved for decision by the Board, the Chief Executive, with the support of the other Executive Director and the senior executives, is responsible for proposing the strategy to be adopted by the Group; running the business in accordance with the strategy agreed by the Board; and implementing specific Board decisions relating to the operation of the Group. The statements of division of responsibilities and matters reserved for decision by the Board are reviewed annually.
Governance Report continued
50 Admiral Group plc · Annual Report and Accounts 2016
Corporate Governance: Governance Report

Board balance and independenceIn the context of recent and forthcoming Board changes, careful consideration continues to be given to the composition and balance of the Board. As a result the Group continues to monitor the need to refresh Board and Committee membership in an orderly manner so as to maintain the continuity of Board process and the strength of personal interaction which underlies the effectiveness of the Board as a team. The Board remains satisfied that it has the appropriate balance of skills, experience, independence and knowledge of the Group to enable it and its Committees to discharge their duties and responsibilities effectively, as required by the Code.
The table below details the length of service of the Chairman and each of the Non-Executive Directors and illustrates the balance of experience and fresh perspectives.
The Board currently comprises 10 Directors, the Chairman (who was independent on appointment), two Executive Directors, and seven independent Non-Executive Directors. As can be seen from the Directors’ biographies on pages 46 to 47, the Directors have a broad range of skills and experience and can bring independent judgement to bear on issues of strategy, performance, risk management, resources and standards of conduct which are integral to the success of the Group.
Appointments to the Board are the responsibility of the Board as a whole, acting on the advice and recommendations of the Nomination Committee. The Nomination Committee seeks to balance the retirement and recruitment of Non-Executive Directors ahead of their replacement so as to avoid dislocation of Board process by losing experience and skills. Appointments are made on merit and against objective criteria, having due regard to the benefits of diversity, including gender, with a view to ensuring the Board has the appropriate mix of personality, skills, and experience. Following a formal, rigorous and transparent process led by the Nomination Committee,
the Board was delighted to appoint Justine Roberts as an independent Non-Executive Director with effect from 17 June 2016. Justine will be subject to election by shareholders at the forthcoming AGM.
Manning Rountree is the Chief Executive Officer for White Mountains Insurance Group Limited (White Mountains) and acts as Board Observer for White Mountains on the Board of the Group’s US price comparison subsidiary, in which White Mountains has a minority shareholding. Given the relatively small size of White Mountains’ shareholding in an overseas Group subsidiary company, the Board has determined that Manning Rountree remains independent in character and judgement and that his attendance at Inspop USA LLC Board meetings does not affect his ability to present an objective, rigorous and constructive challenge to the assumptions and viewpoints presented by management and the Board. A process for managing any potential conflicts has been agreed by the Board such that Manning Rountree will recuse himself from any Group Board discussions where a potential conflict of interest with his role with White Mountains has been identified.
16 years 6 months
4 years 9 months
6 years 1 month
Director
Alastair Lyons (Chairman) 1 July 2000
Penny James 1 January 2015 2 years
Annette Court 21 March 2012
Owen Clarke 19 August 2015 1 year 4 months
Colin Holmes 3 December 2010
Manning Rountree 16 June 2015 1 year 6 months
Jean Park 17 January 2014 2 years 11 months
Justine Roberts 17 June 2016 6 months
Date of Appointment Current length of service as a Non-Executive Director at 31 December 2016
The Board, having given thorough consideration to the matter, considers the seven Non-Executive Directors to be independent and is not aware of any relationships or circumstances, other than the above, which are likely to affect, or could appear to affect, the judgement of any of them. It is the view of the Board that the independent Non-Executive Directors are of sufficient calibre and number that their views carry significant weight in the Board’s decision making.
Independent Non-Executive Directors are currently appointed for fixed periods of three years, subject to election by shareholders. The initial three-year period may be extended for two further three-year periods subject to re-election by shareholders. Their letters of appointment may be inspected at the Company’s registered office or can be obtained on request from the Company Secretary.
Financial Statements Additional InformationCorporate GovernanceStrategic Report Introduction
51Admiral Group plc · Annual Report and Accounts 2016

Alastair Lyons has served in the role of Chairman since July 2000 and has already confirmed that he will not be seeking re-election at the AGM in April. His successor as Chairman, Annette Court, along with all the Directors, seek re-election by shareholders annually.
Colin Holmes is the Senior Independent Non-Executive Director (SID). He has the requisite knowledge and experience gained through his Board position, his Chairmanship of the Audit Committee, and his appointments to the boards of other companies. He is available to shareholders if they have concerns that contact through the normal channels of Chairman, Chief Executive, or Chief Financial Officer have failed to resolve or for which such contact is inappropriate. He is also responsible for leading the Board’s discussion on the Chairman’s performance and the appointment of a new Chairman, as and when appropriate. Full details of the process of selecting a new Chairman are set out in the Nomination Report on pages 62 and 63.
In accordance with the requirement under the Code for annual election of Directors, all Directors will be submitting themselves for re-election by shareholders at the forthcoming AGM. The Board is satisfied that all are properly qualified for their reappointment by virtue of their skills and experience and their contribution to the Board and its Committees.
The Directors are given access to independent professional advice at the Group’s expense, should they deem it necessary to carry out their responsibilities.
Professional developmentOn appointment, Directors take part in a comprehensive induction programme whereby they receive financial and operational information about the Group; details concerning their responsibilities and duties; as well as an introduction to the Group’s governance, regulatory and control environment.
This induction is supplemented by visits to the Group’s head office in Cardiff and certain overseas offices, and meetings with members of the senior management team and their departments. Development and training of Directors is an ongoing process. Throughout their period in office the Directors are regularly updated on the Group’s business; legal matters concerning their role and duties; the competitive environments in which the Group operates; and any other significant changes affecting the Group and the industry of which it is a part.
The Board receives presentations from senior managers within the Group on a regular basis and Non-Executive Directors are encouraged to make informal visits to different parts of the Group to meet with local management.
Engagement with shareholdersThe Company attaches considerable importance to communications with shareholders and engages with them regularly. Open and frequent dialogue with investors enables them to understand fully the Group’s strategy, objectives and governance. The Investor Relations team has day-to-day primary responsibility for managing communications with institutional shareholders through a combination of briefings to analysts and institutional shareholders, both at the half-year and full-year results. A number of analysts and investors visited the Group’s Cardiff office during the year to meet with the Executive Directors and senior management in order to get a better understanding of how the Group operates and how it intends to achieve its strategic and operational objectives. Senior executives from the Group’s overseas businesses also visit the UK in order to present to, and meet with, analysts and investors. Site visits and individual discussions with the Executive Directors are also arranged throughout the year with individual shareholders.
In addition the Chairman had individual meetings during the year with major shareholders and reported to the Board on issues raised with him.
This is supplemented by feedback to the Board on meetings between management and investors. In addition, the Investor Relations team produces a quarterly Investor Relations Report that is circulated to the Board for their consideration. The Report contains an analysis of share price performance; a summary of analyst reports received during the month and of meetings that have been held with investors and analysts; together with details of any significant changes to the shareholders’ register.
The Senior Independent Director has specific responsibility to be available to investors who have any issues or concerns, and in cases where contact with the Chairman, Chief Executive Officer and Chief Financial Officer has either failed to resolve their concerns, or where such contact is inappropriate. No such concerns have been raised in the year under review.
All shareholders are invited to attend the Company’s Annual General Meeting (AGM). The Chairs of the Audit, Remuneration, Nomination and Group Risk Committees attend the AGM along with the other Directors and are available to answer shareholders’ questions on the activities of the Committees they chair. Shareholders are also invited to ask questions during the meeting and have an opportunity to meet with Directors after the formal business of the meeting has been concluded. Details of proxy voting by shareholders, including votes withheld, are made available on request and are placed on the Company’s website following the meeting.
Governance Report continued
52 Admiral Group plc · Annual Report and Accounts 2016
Corporate Governance: Governance Report

The Group maintains a corporate website (www.admiralgroup.co.uk) containing a wide range of information of interest to institutional and private investors. The major shareholders of the Company are listed on page 79.
Conflicts of interestIn compliance with the requirements of the Companies Act 2006 regarding Directors’ duties in relation to conflicts of interest, the Group’s Articles of Association allow the Board to authorise potential conflicts of interest that may arise and to impose such limits as it thinks fit. The Company has put in place a Conflicts of Interest Policy to deal with conflicts of interest. These procedures include each Board member completing, annually, a conflicts of interest questionnaire that sets out any situation in which they, or their connected persons have, or could have, a direct or indirect interest that could conflict with the interests of the Company. Any current directorships that they, or their connected persons hold, any advisory roles or trusteeships held, together with any companies in which they hold more than 1% of the issued share capital are also disclosed. These procedures were reviewed by the Board in April 2016 and it was concluded that they continued to operate effectively.
Board committeesThe Board has delegated authority to a number of permanent Committees to deal with matters in accordance with written Terms of Reference. The principal Committees of the Board - Audit, Remuneration, Group Risk and Nomination - all comply fully with the requirements of the Code.
All Committees are chaired by an independent Non-Executive Director, except the Nomination Committee which is chaired by the Chairman of the Board, and comprise a majority of independent Non-Executive Directors. Appointments to the Committees are made on the recommendation of the Nomination Committee and are for a period of up to three years, which may be extended for two further three year periods, provided the Director remains independent. The Committees are constituted with written Terms of Reference that are reviewed annually to ensure that they remain appropriate and reflect any changes in good practice and governance. These Terms of Reference are available on request from the Company Secretary and can also be found on the Company’s website: www.admiralgroup.co.uk. Directors are fully informed of all Committee matters by the Committee Chairmen reporting on the proceedings of their Committee at the subsequent Board meeting. Copies of Committee minutes are also distributed to the Board. Committees are authorised to obtain outside legal or other independent professional advice if they consider it necessary. The Chairman of each Committee attends the Annual General Meeting to respond to any shareholder questions that might be raised on the Committee’s activities.
Financial Statements Additional InformationCorporate GovernanceStrategic Report Introduction
53Admiral Group plc · Annual Report and Accounts 2016

Statement from Colin Holmes, Chairman of the Audit Committee
“ The impact of a change to the Ogden Discount Rate on outstanding claims was also carefully considered, with the Committee supporting management’s view that claims reserves remain prudent and appropriate at the raised rate of minus 0.75%”
Summary of key activities during 2016The agenda for the meetings taking place during the year are agreed by the Committee Chairman and detail the matters to be discussed and considered at each meeting. The agenda are updated regularly to allow for new items to be included.
During the year the Committee reviewed the following:
The Annual Report and interim results
Reports from the Internal Audit departments within the Group on the effectiveness of the Group’s risk management and internal control procedures, details of key audit findings, and actions taken by management to manage and reduce the impact of the risks identified
Reports from the external auditor on the principal findings from their review of the Group’s systems and controls, and on their key accounting and audit issues and conclusions on the half and full year reporting
Reports from the Chair of the Group Risk Committee on the principal risks faced by the Group and the work undertaken by the Committee to ensure risk is appropriately managed
A review of the Group’s Reserving methodology
Presentations from independent actuaries to assist the Committee in concluding on the adequacy of the Group’s reserves
Reports from the external auditor on their proposed audit scope, fees, audit findings, and auditor independence
Performance and effectiveness of the Internal Audit department
All reports from Internal Audit including management responses to the conclusions set out in the reports
Reports and updates on the project and financial controls of the new UK IT system
The effectiveness of the Group’s Whistleblowing Policy which sets out the arrangements for raising and handling allegations from whistle blowers
The Committee also had presentations and discussions on a range of important issues including: IT Security, controls in overseas subsidiaries, deferred tax assets and Solvency II preparatory phase reporting requirements
The requirements from 2018 to include enhanced reporting from the auditor on their findings
Its own Terms of Reference
Its own effectiveness
The Audit Committee
54 Admiral Group plc · Annual Report and Accounts 2016
Corporate Governance: The Audit Committee

Dear Shareholder,I’m pleased to provide an update on the main activities of Admiral’s Audit Committee in 2016.
During the year, the key areas of focus of the Committee have been to provide support to the Board in its oversight of financial reporting and the control environment across the Group. The setting of insurance claims reserves continues to be a key accounting judgement in the Group’s financial statements, and the Committee placed considerable focus on this subject. The analysis of outstanding claims by management was reviewed alongside that of the Group’s independent actuaries and external auditor. The impact of a change to the Ogden Discount Rate on outstanding claims was also carefully considered, with the Committee supporting management’s view that claims reserves remain prudent and appropriate at the revised rate of minus 0.75%.
The Committee reviewed the Group’s reserving policy to ensure that it remained appropriate under the requirements of Solvency II. In addition, the Committee continued to monitor the appropriateness of the Group’s system of risk management and internal control as well as the robustness of the internal and external audit processes.
During the year, Admiral’s UK operation completed the roll out of a new software system for all new business transactions. Updates were received from the Project Team and Internal Audit, with the Committee being satisfied with the controls in place during the implementation of the system. Given the importance of this new software platform it will remain a focus of the Committee in 2017. The Committee also studied a number of issues, particularly around IT Security and Controls, highlighted through a range of different sources including the Risk Register, Internal Audit and the Committee’s previous work. In each case the Committee was satisfied with the proposed management actions.
Consideration of the impact of the Group’s new reporting requirements under Solvency II continued to take up a considerable amount of the Committee’s time in 2016.
The appointment of Deloitte LLP, as the Group’s external auditor, was approved by shareholders at the AGM in April 2016. Deloitte have, therefore, led the audit process for the finalisation of the Group’s Half Year and Full Year 2016 financial statements. The transition from the Group’s previous external auditor, KPMG LLP, has occurred in an effective and seamless manner.
Finally, given that Annette Court will step down from the Committee at the AGM in April to take on the role of Chair of the Board, I would like to take this opportunity to thank her for her important contribution.
I hope you find the above summary, and the more detailed report, both useful and informative.
Colin HolmesChairman of the Audit Committee 7 March 2017
Financial Statements Additional InformationCorporate GovernanceStrategic Report Introduction
55Admiral Group plc · Annual Report and Accounts 2016

MembershipMembership of the Committee at the end of the year was: Colin Holmes (Chair), Annette Court, Penny James and Owen Clarke who joined the Committee with effect from 1 January 2016.
The Company Secretary acts as Secretary to the Committee. The Committee meets at least four times per year and has an agenda linked to events in the Company’s financial calendar and other important issues that arise throughout the year which fall for consideration by the Committee under its remit.
Mindful of the changes to the Code which will apply to the 2017 financial year and requires the Committee as a whole to have competence relevant to the sector in which the company operates, the Board considers that Committee members already have a broad range of skills, experience and knowledge of the insurance sector such that they are able to effectively analyse, challenge and debate the issues that fall within the Committee’s remit. The Board further considers that Colin Holmes (Committee Chair), as a Chartered Management Accountant, has appropriate recent and relevant financial experience having previously been the UK Finance Director for Tesco plc.
The Committee is kept up to date with changes to Accounting Standards and relevant developments in financial reporting, company law, and the various regulatory frameworks through presentations from the Group’s external auditor, Chief Financial Officer and Company Secretary. In addition, members attend relevant seminars and conferences provided by external bodies. The Terms of Reference of the Audit Committee include all the matters required under the Code.
Other individuals such as the Chairman of the Board, Chief Executive Officer, Chief Financial Officer, the Chief Risk Officer, Heads of Compliance and Internal Audit, and representatives of different parts of the Group may be invited to attend all or part of any meeting as and when appropriate. The external auditor was invited to attend all of the Committee’s meetings held in 2016, excepting those agenda items when its own performance/appointment was to be reviewed and provision of non-audit services
discussed. In addition, a number of private meetings were held between members of the Committee and the auditor.
The Audit Committee’s primary responsibilities are to:
• Monitor the integrity of the Group’s financial statements and any formal announcement relating to the Group’s financial performance, reviewing any significant financial reporting judgements which they contain;
• Keep under review the effectiveness of the Company’s internal financial controls, internal control and risk management systems;
• Review the Group’s procedures for handling allegations from whistleblowers and for detecting fraud;
• Monitor and assess the role and effectiveness of the Group’s Internal Audit functions in the context of the Group’s overall internal control and risk management systems;
• Consider and make recommendations to the Board, to be put to shareholders for their approval at the AGM, in relation to the appointment, reappointment and removal of the Group’s external auditor;
• Review the external auditor’s independence and objectivity and the effectiveness of the audit process;
• Review the policy on the engagement of the external auditor to provide non-audit services, considering the relevant regulatory guidance regarding the provision of non-audit services by the external auditor.
Significant issues considered by the CommitteeAfter discussion with both management and the external auditor, the Audit Committee determined that the key risks of misstatement of the Group’s financial statements related to insurance liabilities and profit commissions.
These issues were discussed with management during the year and with the auditor at the time the Committee reviewed and agreed the auditor’s Group audit plan; when the auditor reviewed the interim financial statements in August 2016 and also at the conclusion of the audit of these full year financial statements.
Insurance liabilitiesGiven the important judgements involved in estimating outstanding claims the Committee continued to spend significant time reviewing and challenging the approach and methodology adopted by management in setting reserves for insurance liabilities in the financial statements. The Committee noted the proposals of management to continue to enhance the methodology applied and were supportive of these plans.
The Committee held separate meetings with the external actuaries at which there was challenge and debate on the best estimates developed by the external actuaries. At these meetings management provided further information on the reserving levels proposed and were challenged by the Committee as to their adequacy and level of inherent prudence.
Prior to the announcement by the Lord Chancellor that revises the Ogden discount rate, the impact of potential various rate changes was studied by the Committee, including the review of the calculated impact of the change provided by both management and the external actuaries. Following the Lord Chancellor’s announcement of the revised rate, the Committee is satisfied that a comprehensive approach has been taken to calculating the impact, and also that following the change, the value contained in the balance sheet for future claims is appropriate and prudent.
Whilst acknowledging that the setting of reserves to cover future claims is a complex and judgemental area and having had the opportunity at the separate meetings referred to above to consider and question the recommended best estimates, the Committee is satisfied that an appropriate process has been followed and that there has been scrutiny, challenge and debate to give confidence that the reserving levels set provide an appropriate margin above best estimates, though noted the continued high level of prudence that remains within the reserves.
The Committee also received an update from the auditor regarding the procedures they had used to test management’s methodology in setting best estimates and considered the auditor’s assertion that they had challenged the reserving approach taken by management and were satisfied with management’s assumptions
The Audit Committee continued
56 Admiral Group plc · Annual Report and Accounts 2016
Corporate Governance: The Audit Committee

and that the Group’s approach to setting reserves was in compliance with current accounting standards.
Profit commissionThe Committee considered the impact on profit commission income of future changes in claims reserves as the recognition of this income is dependent on the loss ratio booked in the financial statements and cash receivable is dependent on actuarial projections of ultimate loss ratios. The Committee remained satisfied that profit commission was correctly accounted for by the Group and was in accordance with the contractual arrangements that were in place.
The Audit Committee considered the auditor’s overall findings on this area which indicated that it considered the profit commission recognised was appropriate in the context of the financial statements as a whole.
MisstatementsNo material unadjusted audit differences were reported by the external auditor. The Committee confirms that it is satisfied that the auditor has fulfilled its responsibilities with diligence and professional scepticism.
After reviewing the presentations and reports from management and consulting where necessary with the auditor, the Committee is satisfied that the financial statements appropriately address the critical judgements and key estimates (both in respect to the amounts reported and the disclosures). The Committee is also satisfied that the significant assumptions used for determining the value of assets and liabilities have been appropriately scrutinised, challenged and are sufficiently robust.
Non-audit feesThe Committee reviewed and approved its policy on non-audit services in February 2017, and were satisfied that it was aligned with current regulatory guidance. Under the policy, the Group’s statutory auditor would only be engaged to carry out non-audit work in exceptional circumstances or where there was a regulatory or tax authority request and where agreed by the Committee.
Unless required by law, regulatory or tax authority any non-audit services will: a) be subject to prior approval from the Committee and b) in aggregate, shall not cost more than 70% of the average statutory audit fee for the past three financial years. In considering
whether to approve such non-audit services, the Committee shall ensure that:
• There is no direct effect, or in the view of an objective, reasonable and informed third party, would have an inconsequential effect, of the non-audit services on the Group’s financial statements;
• The estimation of the effect on the financial statements is comprehensively documented and explained in a report to the Committee;
• The non-audit services provided comply with the principle of independence; and
• The audit firm must not place significant reliance on the output of the non-audit services for the audit work.
The Committee will continue to monitor regulatory developments in this area to ensure that its policy on non-audit fees adheres to current guidance.
Effectiveness of the external audit processThe Committee undertakes an annual review to assess the independence and objectivity of the external auditor and the effectiveness of the audit process, taking into consideration relevant professional and regulatory requirements, the progress achieved against the agreed audit plan, and the competence with which the auditor handled the key accounting and audit judgements. Following this review the Committee concluded that the auditor, Deloitte LLP, remained independent and provided a service that was robust and fit for purpose.
Audit tenderAs noted in this report last year, and in compliance with the requirements of the Competition & Markets Authority’s Statutory Audit Services for Large Companies Market Investigation (Mandatory Use of Competitive Tender Processes and Audit Committee Responsibilities) Order 2014, the Group completed a transparent and independent audit tender process in 2015. Following this process, Deloitte LLP was recommended to shareholders as the Group’s auditor at the AGM in April 2016 and a resolution passed to that effect.
Internal audit The Group Head of Internal Audit attends all Audit Committee meetings and provides a range of presentations and papers to the Committee, through which the Committee
monitors the effectiveness of the Group’s internal controls. The Committee reviewed and approved the Group Internal Audit Terms of Reference which set out the role; objectives; reporting lines and accountability; authority; independence; and objectivity of the Internal Audit function. The role and competence of each Internal Audit function across the Group was also assessed and considered by the Committee. As agreed last year, the Group Head of Internal Audit continues to have responsibility to ensure the quality of the Internal Audit activities in the Group’s overseas locations.
Members of the Committee also receive all issued audit reports, enabling them to challenge the reports’ content and related recommendations. The Committee approves the Internal Audit programmes at the start of each calendar year whilst the effectiveness and workload of the Internal Audit functions and the adequacy of available resources are monitored throughout the year.
In accordance with agreed parameters, the overseas operations in Spain, Italy and the US have their own locally based internal auditors, who report to their respective country heads. All reports are evaluated by the Group Head of Internal Audit to ensure the quality and effectiveness of the reported findings. In addition, the UK Internal Audit department carries out high level governance reviews of all foreign operations, assessing the internal control frameworks and system of risk management. The overseas internal auditors attend Committee meetings periodically.
Committee effectiveness reviewAs part of the Committee’s detailed annual review of its performance and processes, each Committee member completed a comprehensive questionnaire designed to provide objective assessment of the Committee’s performance, including its effectiveness in monitoring internal and external audit. The Committee discussed the results of the review and it was concluded that, overall, the Committee and the audit process were effective; that the Committee had full access to all the information it required; that the Committee had appropriate Terms of Reference; and that it was adequately discharging its responsibilities.
Financial Statements Additional InformationCorporate GovernanceStrategic Report Introduction
57Admiral Group plc · Annual Report and Accounts 2016

The Group Risk Committee
Statement from Jean Park, Chair of the Group Risk Committee
“ A significant amount of time has been dedicated to developing the Group’s Partial Internal Model for Solvency II with an application due to be submitted to the regulators in 2017.”
Summary of key activities in 2016 During the year the Committee:
Reviewed the Group’s updated risk strategy, risk appetite and associated triggers and limits in the context of the Group’s agreed strategic objectives
Reviewed the Group’s proposed dividend level, capital plan and capital buffer in line with the capital policy
Reviewed the Group’s regulatory capital add-on application as part of Solvency II capital requirements
Reviewed the Undertaking Specific Parameters and Volatility Adjustment applications submitted to the regulators
Through stress and scenario testing and reverse stress testing, considered in-depth analysis of a number of the Group’s most significant risk areas, including the default of a reinsurer
Considered the adequacy of risk mitigation measures and contingency plans including a review of the Group’s reinsurance arrangements
Recommended to the Board approval of the 2016 ORSA Report prior to submission to the regulator and approved the ORSA policy
Considered the provisions of the Senior Insurance Managers Regime and approved the Group’s approach
Completed a review of the Solvency II Material Risk Takers
Reviewed a number of new product propositions
Received regular updates on IT Security and presentations on a number of key risk topics including cyber risk, GDPR, reinsurance and the Partial Internal Model
Reviewed regular reports on the risks and progress of the major change programme responsible for the implementation of a new policy administration system and data warehouse, known as Project Bolt
Received regular risk monitoring reports on performance of Key Risk Indicators within the overall risk management framework
Received regular monitoring reports on conduct risk and complaint handling and approved the introduction of Group minimum compliance standards.
58 Admiral Group plc · Annual Report and Accounts 2016
Corporate Governance: The Group Risk Committee

Dear Shareholder,During the year the Committee has focused on embedding the Board’s risk strategy and risk appetite across the Group. This has been established as a key part of the Group’s Enterprise Risk Management Framework (‘ERMF’). A further refresh to the suite of Key Risk Indicators with associated triggers and limits was completed. These updates have improved the effectiveness of the risk management system by placing greater focus on the main risks affecting the business.
A significant amount of time has been dedicated to developing the Group’s Partial Internal Model for Solvency II with an application due to be submitted to the regulators in 2017. In the interim period the Group continues to maintain a regulatory capital add-on to cover risks not captured within the standard formula. The Committee has also reviewed the Group’s proposed dividend level, capital plan and capital buffer in line with the capital policy. Further Solvency II applications relating to Undertaking Specific Parameters (USPs) and the Volatility Adjustment (VA) have also been submitted with approval granted for the latter in February 2017.
During the first half of 2016 the volatility of the yield curves led to increased volatility in the Solvency Ratio as a result of the interest rate risks associated with settled and potential PPOs. The increase in yield curves through the second half of 2016 as well as further mitigating actions has led to a reduced exposure to interest rate risk at year end 2016.
The Committee continues to focus on key operational risks that affect the Group. A full programme of work to reduce cyber risk has been agreed throughout the year. This programme will also support the data protection work as the Group seeks to comply with the upcoming GDPR requirements.
The Committee challenged and reviewed the setting of and outputs from the regular stress and scenario testing and reverse stress testing. The output was incorporated into the Own Risk and Solvency Assessment (‘ORSA’) report for 2016, which the Committee also reviewed.
Regular reports have been received on the risks and progress of the major change programme responsible for the implementation of a new policy administration system and data warehouse, known as Project Bolt. The first phase of the programme was successfully implemented in December 2015 and continued to be rolled out to other brands throughout 2016.
The focus on monitoring and reporting customer outcome risks continued during the year and included reports showing progress against the Group minimum compliance standards, which introduces the levels of compliance resources and monitoring levels that all Group firms must apply to their respective regulatory obligations.
I look forward to continuing the good work this year.
Jean ParkChair of the Group Risk Committee 7 March 2017
Financial Statements Additional InformationCorporate GovernanceStrategic Report Introduction
59Admiral Group plc · Annual Report and Accounts 2016
Composition of the Group Risk Committee Membership at the end of the year was: Jean Park (Chair), Annette Court, David Stevens and Manning Rountree. The Company Secretary acts as Secretary to the Committee.
The Committee met six times during the year.
Duties and responsibilities of the Group Risk CommitteeThe duties and responsibilities of the Committee are set out in Terms of Reference that were approved by the Board in January 2013 and updated and approved in January 2016. The responsibilities of the Committee can be summarised as:
• Oversee the development, implementation and maintenance of the Group’s overall Risk Management Framework and ensure that it is in line with emerging regulatory, corporate governance and best practice guidelines;
• Monitoring the Group’s prudential risk exposure, which includes ensuring that the Group’s capital resources and liquidity profile are appropriate to its needs whilst meeting minimum regulatory requirements, including overseeing and challenging the design and execution of the Group’s stress and scenario testing;
• Monitoring the Group’s current and future conduct risk exposure;
• Ensuring the adequacy and effectiveness of the Group’s systems and controls for the prevention of financial crime, data protection systems and controls;
• Monitoring the adequacy and effectiveness of the Group’s Compliance functions;
• Reviewing the Group’s progress towards achieving Solvency II compliance;
• Reviewing compliance with Group policies, including the established Reserving Policy and process;
• Considering and recommending to the Board for approval the Group’s risk appetite, including any changes to the appetite for each material type of risk faced by the Group;
• Approving the annual plans for the Group Risk and Compliance functions which include reviewing regulatory developments and regular meetings with the PRA and FCA;
• Review the ORSA report each year with recommendations being provided to the Group Board for approval;
• Review and approve the Solvency II Actuarial Function Reports on Reinsurance and Underwriting each year;
• Review and approve the remuneration report from the Chief Risk Officer prior to Remuneration Committee sign off.
The Committee Chairperson reports formally to the Board on its proceedings after each meeting on all matters within its duties and responsibilities, as set out in previously circulated minutes to the Board. The Committee Chairperson also reports on the activities of the Committee in a formal written report that is submitted to and discussed by the Board every six months.
The work of the Committee is supported by more detailed work undertaken by executive Risk Management Committees in each of the Group’s operational entities. At each meeting, the Risk Management Committees consider significant movements in the operation’s risk profile, any risks that have arisen and any emerging risks. Risk Management Committees also assess and monitor any regulatory issues, ensuring that their resolution and the action taken are appropriately recorded. In the UK, the Risk Management Committee receives regular information on Conduct Risk, such as complaint handling reports and other related management information. The Group Risk Management function reviews and collates information from across the group for consideration by the Group Risk Committee.
Internal Control And Risk Management StatementThe Board is ultimately responsible for the Group’s system of risk management and internal control and, through the Audit Committee, has reviewed the effectiveness of this system. The system of risk management and internal control over insurance, operational, market, credit and group risks is designed to manage rather than eliminate the risk of failure to achieve business objectives and breaches of risk appetites and can only provide reasonable and not absolute assurance against material misstatement or loss.
The Board is of the view that there is an ongoing process for identifying, evaluating and managing the Group’s risks and internal controls; that it has been in place for the year ended 31 December 2016; and that, up to the date of approval of the Annual Report and Accounts, it is regularly reviewed by the Board and accords with the internal control guidance for Directors provided in the UK Corporate Governance Code.
The Board confirms that it has performed a robust assessment of the Group’s principal risks. These risks, along with explanations of how they are being managed and mitigated, are included in the Strategic Report on pages 40 to 43.
The Board is responsible for determining the nature and extent of the principal risks it is willing to take in achieving its strategic objectives. The Board meets at least seven times a year to discuss the direction of the company and provide oversight of the Group’s risk management and internal control systems. The role and responsibilities of the Board are documented within their Terms of Reference and these are reviewed annually.
A key element of the control system is that the Board meets regularly with a formal schedule of matters reserved to it for decision and has put in place an organisational structure with clearly defined lines of responsibility. As described above, in order to ensure these responsibilities are properly discharged, the Board has delegated to the Audit Committee to keep under review the adequacy and effectiveness of the Company’s internal financial controls, internal control and risk management systems.
The Board has delegated the development, implementation and maintenance of the Group’s overall risk management framework to the Group Risk Committee. The Group Risk Committee reports on its activities to the Board and the Audit Committee, supporting the overall assurance provided by the Audit Committee that the Group’s internal control, risk management and compliance systems continue to operate effectively.
The Group Risk Committee continued
60 Admiral Group plc · Annual Report and Accounts 2016
Corporate Governance: The Group Risk Committee
The Group has a ‘three lines of defence’ approach to Internal Control, including those controls that relate to the financial reporting process. The Board recognises that the day-to-day responsibility for implementing policies lies with the senior management, the ‘first line of defence’, whose operational decisions must take into account risk and how this can be controlled effectively.
The ‘second line of defence’ describes the Committees and functions that are in place to provide an oversight of the effective operation of the internal control framework. The Group Risk Department and the Compliance functions are part of the second line of defence.
The Group Risk Department defines and prescribes the insurance, operational, market, credit and group risk assessment processes for the business. It performs second line reviews, including of the reserving, capital modelling and business planning processes, and undertakes regular reviews of all risks in conjunction with management, with the results of these reviews recorded in risk registers collated centrally on the Group risk management system. Furthermore, Group Risk records any actual losses or near misses that occur as a consequence of the crystallisation of risk and analyses the sufficiency of the action taken to avoid reoccurrence. The Chief Risk Officer has responsibility for ensuring that managers are aware of their risk management obligations, providing them with support and advice, and ensuring that risk management strategies are properly communicated. Reports are produced showing the most significant risks identified and the controls in place. Internal Audit uses the risk registers to plan and inform their programme of audits around the most significant risks to the Group to ensure that the prescribed controls are in place and are operating effectively.
There is Compliance resource assigned to each operation who review and report on the first line of defence’s compliance with designated control activities. The Group Compliance function consolidates these reviews and provides reports to the Group Risk Committee.
The ‘third line of defence’ describes the independent assurance provided by the Audit Committee and the Group Internal Audit function that reports to that Committee. Internal Audit undertakes a programme of risk based audits covering all aspects of both the first and second lines of defence. The findings from these audits are reported to all three lines, i.e. management, the executive and oversight Committees, and the Audit Committee.
The Group Risk Committee, UK Risk Management Committee and other UK and overseas Risk Committees receive reports setting out key performance and risk indicators and consider possible control issues brought to their attention by early warning mechanisms that are embedded within the operational units. They, together with the Audit Committee, also receive regular reports from the Internal Audit function, which include recommendations for improvement of the control and operational environment. The Chair of the Group Risk Committee provides a comprehensive written report to the Board of the activities carried out by the Committee on an annual basis. In addition, the Board receives reports from the Chair of the Audit Committee as to its activities, together with copies of the minutes of the Group Risk Committee and Audit Committee.
The Audit Committee’s ability to provide the appropriate assurance to the Board depends on the provision of periodic and independent confirmation, primarily by Internal Audit, that the controls established by management are operating effectively and where necessary provides a high-level challenge to the steps being taken by the Group Risk Committee to implement the risk management strategy.
ViabilityIn accordance with provision C.2.2 of the 2014 revision of the Code, the Directors have assessed the prospect of the Company over a longer period than the 12 months required by the ‘Going Concern’ provision. The Board conducted this review for a period of three years to December 2019. This assessment has been made taking into account the current financial position of the Group, the Group’s business plans, the Group’s ‘Own Risk and Solvency Assessment’ (ORSA) process, and the principal risks and uncertainties faced by the Group, which are disclosed on pages 40 to 43 of the Strategic Report.
The ORSA is performed in line with Solvency II regulations and requires the Group to demonstrate that it has a detailed understanding of the risks facing the business over a three-year time horizon. In addition to this the Group Risk Committee and the Group Board review regular updates to the Group’s capital and solvency projections.
Quantitative and qualitative assessments of risks are performed as part of the ORSA process. The quantitative assessment (in line with the Group’s capital and solvency projections) considers how the regulatory capital requirements, economic capital needs, own funds and the solvency position of the Company is projected to change over the three year time horizon. It also includes a series of stress tests, linked to the Group’s principal risks and reports the impact of these stresses alongside any mitigating factors that reduce the impact.
The results of the stress tests form part of the process to set the Group’s capital risk appetite, which ensures that a buffer on top of the Group’s regulatory capital requirement is held to protect its capital position against shocks and stresses. Refer to the Strategic Report for information on sensitivities to the reported 2016 solvency ratio position.
Based on the results of this analysis, the Directors have a reasonable expectation that the Company will be able to continue in operation and meet its liabilities as they fall due over this three year period.
Financial Statements Additional InformationCorporate GovernanceStrategic Report Introduction
61Admiral Group plc · Annual Report and Accounts 2016

The Nomination Committee
Statement from Alastair Lyons, Chairman of the Nomination Committee
“ What is important is diversity of thought, experience and approach and each new appointment must complement what already exists at the Board table”
Dear Shareholder,Succession planning has clearly been a key area of focus for the Committee during the year. We were pleased to welcome Non-Executive Director, Penny James, who joined the Committee in April following Lucy Kellaway stepping down from Board at the AGM in April 2016. Given the significance of the appointment of Chairman and in order to ensure that a formal, rigorous and transparent process was followed, it was agreed by the Board in June 2016 that the new Chairman should be decided by the whole Board but excluding myself and any Non-Executive Directors who declared themselves as candidates. The Chairman succession process was led by Penny James. Penny led a Selection Board consisting of all Board members excluding the current Chairman and any directors who declared themselves as candidates. Further details of the comprehensive succession process that was followed are set out later in this report.
In addition to the Chairman succession process and in keeping with its remit to review regularly the composition and experience of the Board, the Committee led the process of Non-Executive Board appointments during the year. The Committee carried out a robust recruitment process resulting in the appointment of Justine Roberts in June 2016, further enhancing the range of skills, breadth of experience and diversity around the Board table.
The Committee continued the development of a structured succession plan that would ensure appropriate action was taken well ahead of the dates on which individuals would be retiring in order to achieve their replacement, if appropriate, with individuals of the appropriate skills, experience and fit to the Board.
In accordance with the requirements of Solvency II and the Senior Insurance Manager Regime, the Committee reviewed and approved the Group’s Fit and Proper
Policy which sets out the process of assessment for every person who performs a key function to ensure that they meet the requirements in terms of qualifications, capability, honesty and integrity.
Alastair Lyons, CBEChairman of the Nomination Committee 7 March 2017
The membership of the Committee at the year end was Alastair Lyons (Chairman), Colin Holmes and Penny James. The Company Secretary acts as Secretary to the Committee. The Committee invites the Chief Executive to attend meetings when it deems appropriate. The Committee met formally on two occasions in 2016 although members of the Committee corresponded and met informally on a number of occasions to consider and meet with individuals that the Committee had identified as possible candidates to join the Board.
The Committee leads the process for making appointments to the Board or where the appointee is likely to become a Board member. The Committee ensures there is a formal, rigorous and transparent process for the appointment of new Directors to the Board embracing a full evaluation of the skills, knowledge and experience required of Directors. The Committee also ensures plans are in place for orderly succession for appointments to the Board and reviews the succession plans for other senior management positions. Responsibility for making senior management appointments rests with the Chief Executive.
The Chairman succession process was led by Penny James. Where preparatory research was required ahead of meetings of the Selection Board Penny was assisted by Executive Director Geraint Jones to ensure that there was a balance of Non-Executive and Executive input. The principal aspects against which potential candidates would be assessed for suitability were agreed based on discussions held jointly by Penny and Geraint with the Selection Board and Board attendees, as well as with others who would have insightful perspectives as to what competencies, experience, and personal characteristics the next
62 Admiral Group plc · Annual Report and Accounts 2016
Corporate Governance: The Nomination Committee

Admiral Chairman would ideally have. The views expressed by leading institutional shareholders with whom the Chairman had recently conducted Corporate Governance meetings indicated that the majority were supportive of an internal process, given the Group’s distinctive culture and market position and subject to there being sufficient suitably qualified and experienced internal candidates.
The proposed suitability criteria were then discussed and agreed by the whole Board at its October meeting. At this meeting it was also agreed to appoint external search firm, Zygos, to assist with the process based on their depth of experience and understanding of the requirements of a FTSE 100 Chairman. Zygos carried out psychometric testing of, and had individual meetings with, each of the candidates. The candidates were benchmarked against the external marketplace with the assistance of Zygos, considering their knowledge of the other potential candidates and their relative strengths. Each internal candidate held individual sessions with Selection Panel members and the CEO and presented to the Selection Board at the December Board meeting in order to explain their view of the role and answer any questions raised.
Based on all of the input Penny and the Selection Board had received, it was agreed that they had more than one highly capable internal candidate. Having reviewed the external candidate list and discussed with Zygos their relative strengths, and after taking to account feedback from the Selection Board after the panel session, it was concluded that the internal candidates were sufficiently strong that approaching additional external candidates was unnecessary.
At the Board meeting in January 2017, Penny recommended on behalf of the Selection Board that the Board approve the appointment of Annette Court, as Chairman of the Board, subject to regulatory approval. Throughout the process it was agreed that Annette had demonstrated good strategic alignment with the Executive and the Board,
breadth of experience across different organisations and boards, varied board experience including experience of chairing boards and board committees, experience of working with complex, multi-line and international companies, deep knowledge of the insurance sector, and clarity of the direction of the Board itself.
The Group has in place a policy of recruiting well ahead of impending retirements in order to ensure continuity of knowledge and Board dynamics, hence the recruitment of Owen Clarke in 2015. In the context of the retirements that took place during 2016, with Henry Engelhardt, Margaret Johnson and Lucy Kellaway stepping down from the Board and having regard to forthcoming retirements and the changing nature of the Group’s business, the Board initiated a search for a new Non-Executive Director. The Committee developed an appropriate specification for a new Non-Executive Director and identified the required skills and experience. Following this process, the Committee identified Justine Roberts as best placed to fill the role identified.
Justine is CEO and co-founder of internet company, Mumsnet.com, which has grown into the UK’s biggest online network for parents. Justine has been responsible for the creation, strategic direction and overall management of Mumsnet, building it into one of the most recognisable internet brands in the UK. She brings a wealth of experience in interacting with consumers across social media. Given Justine’s background, experience and competence, and the external references that were obtained, the Committee did not consider it either necessary or appropriate to undertake a full search led by an external recruitment consultancy.
Each Committee member met separately with Justine and agreed that she would bring invaluable experience to the Board. The Board approved the Committee’s recommendations and following regulatory approval Justine was formally appointed to the Board with effect from 17 June 2016.
The Board, at its meeting in April 2016, considered talent management within the Group and identified where there were individuals who, with further experience and guidance, might be capable of moving into particular senior management roles. The Committee remains satisfied that succession plans for Directors and senior management are in place to ensure the continued ability of the Group to implement strategy and compete effectively in the markets in which it operates.
The Group remains strongly supportive of the principle of boardroom diversity, of which gender is an important, but not the only, aspect. What is important is diversity of thought, experience and approach and each new appointment must complement what already exists at the Board table. Accordingly, appointments will always be made on merit against objective criteria, including diversity, and not just to achieve an externally prescribed number. Given women constitute 40% of our plc Board, the Group has already met the target set by both Lord Davies in his report: Women on Boards, and the Hampton Alexander Review (that builds on the Davies Review) which encourages FTSE 350 companies to achieve at least 33% women on Boards by 2020. The Group also already meets the Hampton Alexander Review target of 33% women’s representation across executive committees below Board level and direct reports to those committees, as shown by the gender diversity table on page 44. The Group remains committed to providing equal opportunities, eliminating discrimination, and encouraging diversity amongst its workforce both in the UK and overseas. A breakdown of the gender of Company Directors and senior employees at the end of the financial year together with details of the Group’s Equality, Diversity and Dignity at Work Policy are set out in the Directors’ Report on page 78.
Financial Statements Additional InformationCorporate GovernanceStrategic Report Introduction
63Admiral Group plc · Annual Report and Accounts 2016

Dear Shareholder,I am pleased to introduce the Directors’ Remuneration Report (the Report) for the year ended 31 December 2016, which has been prepared by the Remuneration Committee (the Committee) and approved by the Board.
2016 has been another strong year for the Admiral Group, though key metrics were materially impacted by the Ogden discount rate change. Earnings per share in the year were 78.7 pence (2015: 107.3 pence) and Return on Equity was 37% (2015: 49%). Total dividends for the financial year (including the proposed final dividend of 51.5 pence per share) will be 114.4 pence per share.
The Remuneration Committee
A Statement to Shareholders from the Chairman of the Remuneration Committee
“2016 has been another strong year for the Admiral Group”
One of the two Executive Directors, CEO David Stevens is a founding Director and receives remuneration that only comprises salary and modest benefits. The Committee continues to hold the view that this is appropriate, as his significant shareholding provides a sufficient alignment of his interest with those of other shareholders. In order to provide full transparency of pay arrangements for the other Executive Director, CFO Geraint Jones, this Report includes single figure and comparative data for him as well as for our CEO, as the pay arrangements for the CFO are more reflective of those for (non-founder) executives.
During the year, the Committee held a strategy session in which the Committee considered all aspects of the Group’s current remuneration arrangements together with a consideration of trends in UK corporate governance and the most recent AGM season. The Group’s remuneration consultants also provided a comprehensive update on remuneration trends at sector comparators and across the broader UK market. Following this meeting, the Committee concluded that the Group’s Remuneration Policy continued to remain appropriate and that it supported the view, held by the Board, that wide share ownership drives outstanding performance and promotes the long term success of the business whilst remaining in alignment with shareholder interests.
Much of the focus of the Committee’s work in the second half of 2017 will be preparatory work including consultation with shareholders and key stakeholders as the Group prepares to put its Remuneration Policy before shareholders at the AGM in 2018.
The Committee considered the following matters during the year ended 31 December 2016:
• Reviewing the salary arrangements and fee proposals for the Executive Directors, the Chairman and senior management;
• Reviewing the appropriateness of the performance conditions for the Discretionary Free Share Scheme (DFSS) and Free Share Incentive Plan (SIP) awards;
• Reviewing the Company’s performance against the performance conditions applicable to the DFSS and SIP awards and where appropriate authorising the vesting of awards;
• Reviewing and authorising the grant of awards under both the DFSS and SIP;
• Reviewing the Committee’s Terms of Reference and recommending amendments to the Board for approval;
• Considering and approving the Group’s Material Risk Takers in accordance with the requirements of Solvency II regime;
• Reviewing the impact of the Living Wage on the Group’s current remuneration structure;
• Reviewing the new Gender Pay reporting requirements.
Annette Court Chairman of the Remuneration Committee 7 March 2017
64 Admiral Group plc · Annual Report and Accounts 2016
Corporate Governance: The Remuneration Committee

Directors’ Remuneration Report
Compliance statementThis Remuneration Report has been prepared according to the requirements of the Companies Act 2006 (the Act), Regulation 11 and Schedule 8 of the Large and Medium-Sized Companies and Groups (Accounts and Reports) (Amendment) Regulations 2013 and other relevant requirements of the FCA Listing Rules. In addition, the Board has applied the principles of good corporate governance set out in the UK Corporate Governance Code (the Code) and has considered the guidelines issued by its leading shareholders and bodies such as the Investment Association and the Pensions and Lifetime Savings Association. Unless otherwise stated, information contained within this Remuneration report is unaudited.
The Directors’ Remuneration Policy was approved by shareholders at the Annual General Meeting (AGM) on 29 April 2015, and took effect from that date. This section presents a summary of the approved policy, including the policy table and notes, pay-for-performance charts, the recruitment policy, and Non-Executive Director appointments.
The sections presented below are as disclosed in the prior year save a number of non-significant changes, as follows:
• References to financial years have been updated where appropriate;
• Pay-for-performance scenario charts have been updated to reflect latest salaries;
• Current Non-Executive Director appointment expiry dates have been updated; and
• References to Henry Engelhardt in the policy report have been removed, as he stepped down from the Board in May 2016.
Key principles of Admiral’s remuneration arrangementsThe Group is committed to the primary objective of maximising shareholder value over time and ensuring that there is a strong link between performance and reward. This is reflected in the Group’s stated Remuneration Policy of paying competitive, performance-linked and shareholder-aligned remuneration packages comprising basic salaries coupled with participation in performance-based share schemes to generate competitive total reward packages for superior performance. The Board is satisfied that the adoption of this policy continues to meet the objectives of attracting and retaining executives of the highest quality across the Group.
The Committee reviews the framework and remuneration packages of the Executive Directors and the most senior managers and recognises the need to ensure that the Remuneration Policy is firmly linked to the Group’s strategy, including its risk management approach. In setting the policy and making remuneration decisions, the Committee takes into account pay and conditions elsewhere in the Group. The main principles underlying the Remuneration Policy are:
• Competitive – the Group aims to combine salaries with attractive performance-related incentives which provide the potential for competitive total reward packages for the achievement of superior performance. Base salaries reflect the role, job size and responsibility together with individual performance and effectiveness. Prevailing market and economic conditions and developments in governance are also considered, as are general salary levels throughout the organisation. In considering total remuneration for the Executive Directors, the Committee takes into account remuneration in companies of a similar size in the Financial Services sector;
• Performance-linked – a significant part of the Executive Directors’ (excluding the founding Director) and senior managers’ reward remains performance-linked and shareholder-aligned; and
• Transparent – all aspects of the remuneration structure are clear to employees and openly communicated.
Financial Statements Additional InformationCorporate GovernanceStrategic Report Introduction
65Admiral Group plc · Annual Report and Accounts 2016
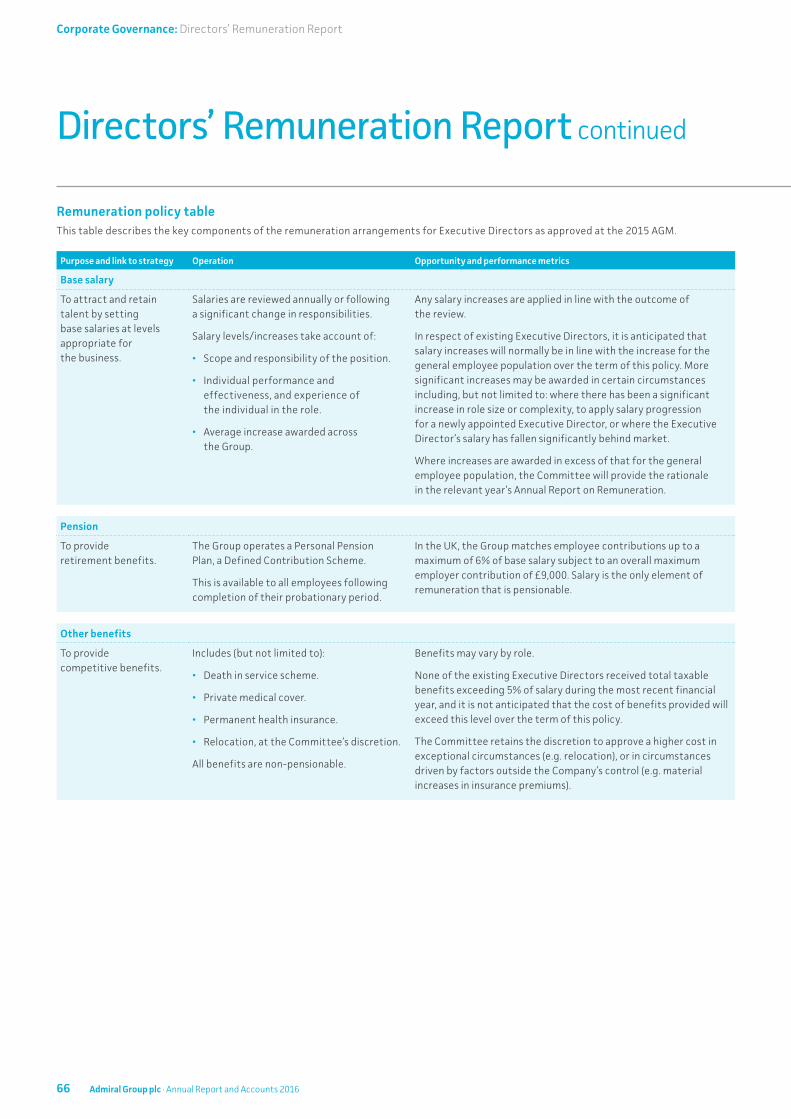
Remuneration policy tableThis table describes the key components of the remuneration arrangements for Executive Directors as approved at the 2015 AGM.
Purpose and link to strategy Operation Opportunity and performance metrics
Base salary
To attract and retain talent by setting base salaries at levels appropriate for the business.
Salaries are reviewed annually or following a significant change in responsibilities.
Salary levels/increases take account of:
• Scope and responsibility of the position.
• Individual performance and effectiveness, and experience of the individual in the role.
• Average increase awarded across the Group.
Any salary increases are applied in line with the outcome of the review.
In respect of existing Executive Directors, it is anticipated that salary increases will normally be in line with the increase for the general employee population over the term of this policy. More significant increases may be awarded in certain circumstances including, but not limited to: where there has been a significant increase in role size or complexity, to apply salary progression for a newly appointed Executive Director, or where the Executive Director’s salary has fallen significantly behind market.
Where increases are awarded in excess of that for the general employee population, the Committee will provide the rationale in the relevant year’s Annual Report on Remuneration.
Pension
To provide retirement benefits.
The Group operates a Personal Pension Plan, a Defined Contribution Scheme.
This is available to all employees following completion of their probationary period.
In the UK, the Group matches employee contributions up to a maximum of 6% of base salary subject to an overall maximum employer contribution of £9,000. Salary is the only element of remuneration that is pensionable.
Other benefits
To provide competitive benefits.
Includes (but not limited to):
• Death in service scheme.
• Private medical cover.
• Permanent health insurance.
• Relocation, at the Committee’s discretion.
All benefits are non-pensionable.
Benefits may vary by role.
None of the existing Executive Directors received total taxable benefits exceeding 5% of salary during the most recent financial year, and it is not anticipated that the cost of benefits provided will exceed this level over the term of this policy.
The Committee retains the discretion to approve a higher cost in exceptional circumstances (e.g. relocation), or in circumstances driven by factors outside the Company’s control (e.g. material increases in insurance premiums).
Directors’ Remuneration Report continued
66 Admiral Group plc · Annual Report and Accounts 2016
Corporate Governance: Directors’ Remuneration Report
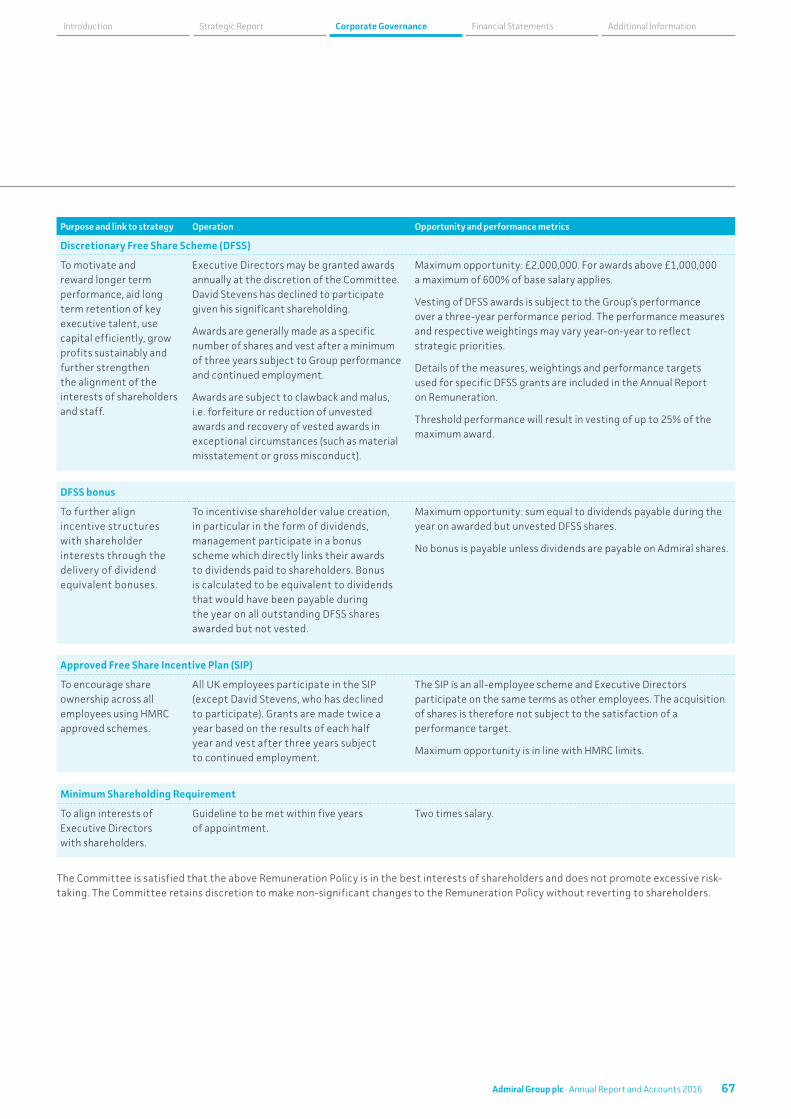
Purpose and link to strategy Operation Opportunity and performance metrics
Discretionary Free Share Scheme (DFSS)
To motivate and reward longer term performance, aid long term retention of key executive talent, use capital efficiently, grow profits sustainably and further strengthen the alignment of the interests of shareholders and staff.
Executive Directors may be granted awards annually at the discretion of the Committee. David Stevens has declined to participate given his significant shareholding.
Awards are generally made as a specific number of shares and vest after a minimum of three years subject to Group performance and continued employment.
Awards are subject to clawback and malus, i.e. forfeiture or reduction of unvested awards and recovery of vested awards in exceptional circumstances (such as material misstatement or gross misconduct).
Maximum opportunity: £2,000,000. For awards above £1,000,000 a maximum of 600% of base salary applies.
Vesting of DFSS awards is subject to the Group’s performance over a three-year performance period. The performance measures and respective weightings may vary year-on-year to reflect strategic priorities.
Details of the measures, weightings and performance targets used for specific DFSS grants are included in the Annual Report on Remuneration.
Threshold performance will result in vesting of up to 25% of the maximum award.
DFSS bonus
To further align incentive structures with shareholder interests through the delivery of dividend equivalent bonuses.
To incentivise shareholder value creation, in particular in the form of dividends, management participate in a bonus scheme which directly links their awards to dividends paid to shareholders. Bonus is calculated to be equivalent to dividends that would have been payable during the year on all outstanding DFSS shares awarded but not vested.
Maximum opportunity: sum equal to dividends payable during the year on awarded but unvested DFSS shares.
No bonus is payable unless dividends are payable on Admiral shares.
Approved Free Share Incentive Plan (SIP)
To encourage share ownership across all employees using HMRC approved schemes.
All UK employees participate in the SIP (except David Stevens, who has declined to participate). Grants are made twice a year based on the results of each half year and vest after three years subject to continued employment.
The SIP is an all-employee scheme and Executive Directors participate on the same terms as other employees. The acquisition of shares is therefore not subject to the satisfaction of a performance target.
Maximum opportunity is in line with HMRC limits.
Minimum Shareholding Requirement
To align interests of Executive Directors with shareholders.
Guideline to be met within five years of appointment.
Two times salary.
The Committee is satisfied that the above Remuneration Policy is in the best interests of shareholders and does not promote excessive risk-taking. The Committee retains discretion to make non-significant changes to the Remuneration Policy without reverting to shareholders.
Financial Statements Additional InformationCorporate GovernanceStrategic Report Introduction
67Admiral Group plc · Annual Report and Accounts 2016

Notes to the remuneration policy tablePayments from existing awardsExecutive Directors are eligible to receive payment from any award made prior to the approval and implementation of the Remuneration Policy. This includes all outstanding awards under the DFSS, made prior to the approval of the 2015 DFSS, and awards of DFSS shares that vest 50% on performance and 50% on continued employment made to the CFO prior to his appointment to the Board.
Remuneration arrangements for David Stevens (founding Director)David Stevens is a founding Director, and he and the Committee continue to hold the view that his significant shareholding provides sufficient alignment of his interest in the performance of the Group with the interests of other shareholders. In light of this, David Stevens’ remuneration package consists only of a below market rate salary, benefits such as private medical cover, permanent health insurance and death in service cover, and matching pension contributions from the Company under the Group’s Personal Pension Plan. David Stevens has not participated, nor is it intended that he participates, in any Group share schemes.
Non-Executive DirectorsThe Company has entered into letters of appointment with its Non-Executive Directors (NEDs). Summary details of terms and notice periods are included below.
NED Term Commencement date Notice period
Alastair Lyons1 Nine months 26 days 1 July 2016 Three months
Owen Clarke 3 years 19 August 2015 One month
Annette Court 3 years 21 March 2015 One month
Colin Holmes 3 years 3 December 2016 One month
Penny James 3 years 1 January 2015 One month
Jean Park 3 years 17 January 2014 One month
Justine Roberts 3 years 17 June 2016 One month
Manning Rountree 3 years 16 June 2015 One month
1. On 25 January 2017, Alastair Lyons gave the Company the required three months written notice that he will be retiring as Chairman and Non-Executive Director of the Company at the Company’s Annual General Meeting on 26 April 2017
The NEDs are not eligible to participate in the DFSS or DFSS bonus schemes and do not receive any pension contributions.
Pay-for-performance: scenario analysisThe following charts provide an estimate of the potential future reward opportunities for the Executive Directors, and the potential split between the different elements of pay under three different performance scenarios: ‘Minimum’, ‘On-target’ and ‘Maximum’. As described above, Admiral’s DFSS bonus is directly aligned with dividends received by our shareholders. As such, there is no performance range defined for this element of pay; the figures shown in the chart below for the CFO’s DFSS bonus include the value of the actual DFSS bonus paid in 2016 as an illustration of the value he might receive. Under all scenarios, potential reward opportunities are based on expected awards for 2017 (in accordance with Admiral’s Remuneration Policy), applied to salaries as at 1 January 2017.
Minimum MinimumMaximum
£1,400,000
£1,000,000
Multi-year variable (DFSS)Single-year variable (DFSS bonus)Salary, pension and benefits
£1,200,000
£800,000
£400,000
£600,000
£200,000
£0Maximum
18%
13%
69%
41%
28%
31%
59%
41%100%100%
£398k £398k £429k
£619k
£1,382k
£398k
100%
On-target
CEO CFO
On-target
The value of DFSS awards vesting is calculated based on the average share price in the last three months of 2016 (£19.06) and the number of DFSS shares awarded in 2016.
Directors’ Remuneration Report continued
68 Admiral Group plc · Annual Report and Accounts 2016
Corporate Governance: Directors’ Remuneration Report

The charts on the previous page exclude the effect of any Company share price movement. For this reason, were the CFO’s DFSS shares to vest in full, his actual total remuneration may exceed the £ value shown in the chart above.
Component ‘Minimum’ ‘On-target’ ‘Maximum’
Base salary Annual base salary for 2017
Pension £9,000 annual contribution for CFO and CEO
Benefits Taxable value of annual benefits provided
DFSS 0% vesting 20% average vesting 100% vesting
DFSS bonus Based on DFSS bonus paid in 2016
Approach to remuneration relating to new Executive Director appointmentsExternal appointmentIn the case of appointing a new Executive Director, the Committee may make use of any of the existing components of remuneration, as follows:
Component Approach Maximum annual grant value
Base salary The base salary will be determined by the Committee with reference to the scope and responsibility of the position as well as internal relativities and their current remuneration.
Pension New appointees will be eligible to participate in the Personal Pension Plan with Group contributions in line with the existing policy.
Benefits New appointees will be eligible to receive benefits which may include (but are not limited to) death in service scheme, private medical cover, and permanent health insurance.
SIP New appointees will be eligible to participate in the SIP.
DFSS New appointees will be granted awards under the DFSS on the same terms as other Executives, as described in the policy table.
£2,000,000. Awards over £1,000,000 are subject to a maximum of 600% of base salary.
DFSS bonus New appointees will be granted awards under the DFSS bonus scheme on the same terms as other Executive Directors, as described in the policy table.
Linked to Admiral dividend.
The Committee may also make an award in respect of a new Executive Director appointment to ‘buy out’ incentive arrangements forfeited on leaving a previous employer. In doing so, the Committee will consider relevant factors including any performance conditions attached to the forfeited awards and the likelihood of those conditions being met to ensure that the value of the buy-out award is no greater than the fair value of the awards it replaces. The Committee may also avail itself of Listing Rule 9.4.2 R if appropriate in respect of buy-out incentive arrangements.
Financial Statements Additional InformationCorporate GovernanceStrategic Report Introduction
69Admiral Group plc · Annual Report and Accounts 2016

Annual report on remunerationThis section of the report provides details of how Admiral’s Remuneration Policy was implemented in 2016 and the remuneration arrangements proposed for 2017.
Remuneration Committee membership in 2016The Board sets the Group’s Remuneration Policy and, through the authority delegated to it by the Board, the Committee is responsible for making recommendations to the Board on the structure and implementation of the Remuneration Policy across the Group with consideration to the prevailing economic climate within the economies in which the Group operates. Its remit includes recommending the remuneration of the Group Board Chairman, the Executive Directors and the Company Secretary; reviewing the remuneration of senior management; and reviewing the composition of and awards made under the performance-related incentive schemes.
At the end of 2016 the Committee consisted of Owen Clarke and Jean Park under the Chairmanship of Annette Court. Owen Clarke joined the Remuneration Committee with effect from 28 April 2016. Margaret Johnson was a member of the Committee until the date of her retirement from the Board, being 28 April 2016. The Committee met five times during the year.
The Group Chairman, CEO, CFO and Chief Risk Officer are invited to meetings where the Committee considers it appropriate to obtain their advice on Group strategy and performance and Senior Executive pay strategy. The members of the Committee do not have any personal financial interests (other than shareholdings), or any conflicts, that relate to the business of the Committee. The Committee members do not have any day-to-day involvement in the running of the Group.
Advisor to the CommitteeDuring the year, in order to enable the Committee to reach informed decisions on Executive remuneration, advice on market data and trends was obtained from independent consultants, Kepler Associates, a brand of Mercer (which is part of the MMC group of companies). Kepler reports directly to the Committee Chair, and is a signatory to and abides by the Code of Conduct for Remuneration Consultants (which can be found at www.remunerationconsultantsgroup.com). Other than advice on remuneration, no other services were provided by Kepler (or any other part of the MMC group of companies) to the Company. The fees paid to Kepler in respect of work carried out in 2016 (based on time and materials) totalled £36,090, excluding expenses and VAT.
The Committee undertakes due diligence periodically to ensure that Kepler remains independent of the Company and that the advice provided is impartial and objective. The Committee is satisfied that the advice provided by Kepler is independent.
The Company Secretary also circulates market survey results as appropriate.
Summary of shareholder voting at the 2016 AGMThe table below shows the result of the advisory vote on the 2015 Annual Report on Remuneration at the 2016 AGM.
For Against Total votes cast Abstentions
2015 Annual Report on Remuneration
Total number of votes 177,611,364 2,919,568 180,530,932 1,428,364
% of votes cast 98.4% 1.6% 0.8%
The current Remuneration Policy was approved by shareholders with 95.5% vote in favour at the 2015 AGM.
The 2015 DFSS was approved by shareholders at the 2015 AGM with a 96.9% vote in favour and the amended rules of the 2015 DFSS were approved by shareholders at the 2016 AGM with a 97.2% vote in favour.
Directors’ Remuneration Report continued
70 Admiral Group plc · Annual Report and Accounts 2016
Corporate Governance: Directors’ Remuneration Report
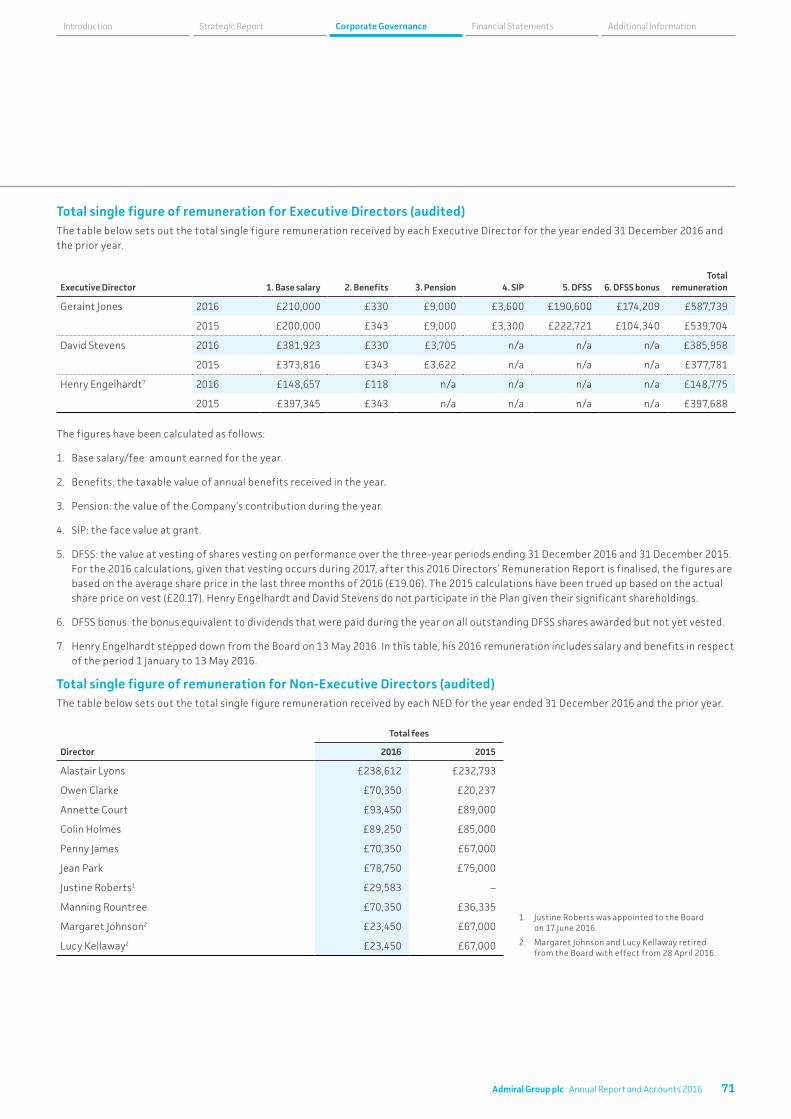
Total single figure of remuneration for Executive Directors (audited)The table below sets out the total single figure remuneration received by each Executive Director for the year ended 31 December 2016 and the prior year.
Executive Director 1. Base salary 2. Benefits 3. Pension 4. SIP 5. DFSS 6. DFSS bonusTotal
remuneration
Geraint Jones 2016 £210,000 £330 £9,000 £3,600 £190,600 £174,209 £587,739
2015 £200,000 £343 £9,000 £3,300 £222,721 £104,340 £539,704
David Stevens 2016 £381,923 £330 £3,705 n/a n/a n/a £385,958
2015 £373,816 £343 £3,622 n/a n/a n/a £377,781
Henry Engelhardt7 2016 £148,657 £118 n/a n/a n/a n/a £148,775
2015 £397,345 £343 n/a n/a n/a n/a £397,688
The figures have been calculated as follows:
1. Base salary/fee: amount earned for the year.
2. Benefits: the taxable value of annual benefits received in the year.
3. Pension: the value of the Company’s contribution during the year.
4. SIP: the face value at grant.
5. DFSS: the value at vesting of shares vesting on performance over the three-year periods ending 31 December 2016 and 31 December 2015. For the 2016 calculations, given that vesting occurs during 2017, after this 2016 Directors’ Remuneration Report is finalised, the figures are based on the average share price in the last three months of 2016 (£19.06). The 2015 calculations have been trued up based on the actual share price on vest (£20.17). Henry Engelhardt and David Stevens do not participate in the Plan given their significant shareholdings.
6. DFSS bonus: the bonus equivalent to dividends that were paid during the year on all outstanding DFSS shares awarded but not yet vested.
7. Henry Engelhardt stepped down from the Board on 13 May 2016. In this table, his 2016 remuneration includes salary and benefits in respect of the period 1 January to 13 May 2016.
Total single figure of remuneration for Non-Executive Directors (audited)The table below sets out the total single figure remuneration received by each NED for the year ended 31 December 2016 and the prior year.
Director
Total fees
2016 2015
Alastair Lyons £238,612 £232,793
Owen Clarke £70,350 £20,237
Annette Court £93,450 £89,000
Colin Holmes £89,250 £85,000
Penny James £70,350 £67,000
Jean Park £78,750 £75,000
Justine Roberts1 £29,583 –
Manning Rountree £70,350 £36,335
Margaret Johnson2 £23,450 £67,000
Lucy Kellaway2 £23,450 £67,000
1. Justine Roberts was appointed to the Board on 17 June 2016.
2. Margaret Johnson and Lucy Kellaway retired from the Board with effect from 28 April 2016.
Financial Statements Additional InformationCorporate GovernanceStrategic Report Introduction
71Admiral Group plc · Annual Report and Accounts 2016
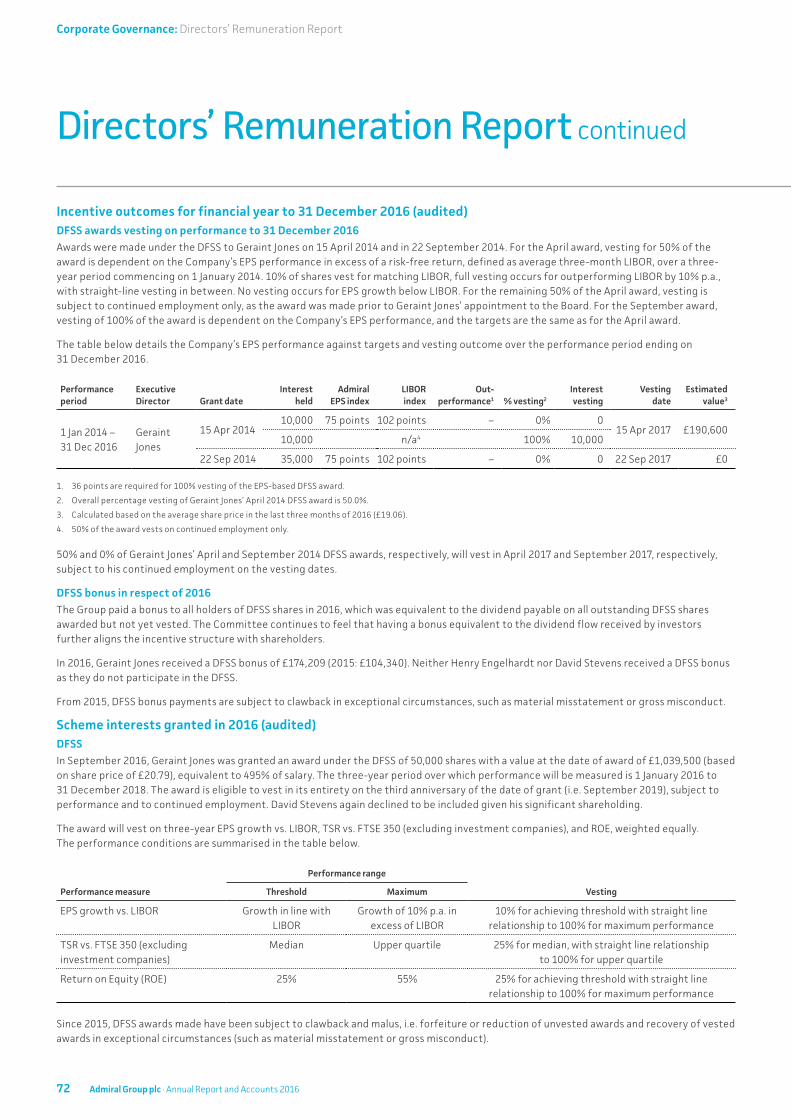
Incentive outcomes for financial year to 31 December 2016 (audited)DFSS awards vesting on performance to 31 December 2016Awards were made under the DFSS to Geraint Jones on 15 April 2014 and in 22 September 2014. For the April award, vesting for 50% of the award is dependent on the Company’s EPS performance in excess of a risk-free return, defined as average three-month LIBOR, over a three-year period commencing on 1 January 2014. 10% of shares vest for matching LIBOR, full vesting occurs for outperforming LIBOR by 10% p.a., with straight-line vesting in between. No vesting occurs for EPS growth below LIBOR. For the remaining 50% of the April award, vesting is subject to continued employment only, as the award was made prior to Geraint Jones’ appointment to the Board. For the September award, vesting of 100% of the award is dependent on the Company’s EPS performance, and the targets are the same as for the April award.
The table below details the Company’s EPS performance against targets and vesting outcome over the performance period ending on 31 December 2016.
Performance period
Executive Director Grant date
Interest held
Admiral EPS index
LIBOR index
Out-performance1 % vesting2
Interest vesting
Vesting date
Estimated value3
1 Jan 2014 – 31 Dec 2016
Geraint Jones
15 Apr 201410,000 75 points 102 points – 0% 0
15 Apr 2017 £190,60010,000 n/a4 100% 10,000
22 Sep 2014 35,000 75 points 102 points – 0% 0 22 Sep 2017 £0
1. 36 points are required for 100% vesting of the EPS-based DFSS award.
2. Overall percentage vesting of Geraint Jones’ April 2014 DFSS award is 50.0%.
3. Calculated based on the average share price in the last three months of 2016 (£19.06).
4. 50% of the award vests on continued employment only.
50% and 0% of Geraint Jones’ April and September 2014 DFSS awards, respectively, will vest in April 2017 and September 2017, respectively, subject to his continued employment on the vesting dates.
DFSS bonus in respect of 2016The Group paid a bonus to all holders of DFSS shares in 2016, which was equivalent to the dividend payable on all outstanding DFSS shares awarded but not yet vested. The Committee continues to feel that having a bonus equivalent to the dividend flow received by investors further aligns the incentive structure with shareholders.
In 2016, Geraint Jones received a DFSS bonus of £174,209 (2015: £104,340). Neither Henry Engelhardt nor David Stevens received a DFSS bonus as they do not participate in the DFSS.
From 2015, DFSS bonus payments are subject to clawback in exceptional circumstances, such as material misstatement or gross misconduct.
Scheme interests granted in 2016 (audited)DFSSIn September 2016, Geraint Jones was granted an award under the DFSS of 50,000 shares with a value at the date of award of £1,039,500 (based on share price of £20.79), equivalent to 495% of salary. The three-year period over which performance will be measured is 1 January 2016 to 31 December 2018. The award is eligible to vest in its entirety on the third anniversary of the date of grant (i.e. September 2019), subject to performance and to continued employment. David Stevens again declined to be included given his significant shareholding.
The award will vest on three-year EPS growth vs. LIBOR, TSR vs. FTSE 350 (excluding investment companies), and ROE, weighted equally. The performance conditions are summarised in the table below.
Performance measure
Performance range
VestingThreshold Maximum
EPS growth vs. LIBOR Growth in line with LIBOR
Growth of 10% p.a. in excess of LIBOR
10% for achieving threshold with straight line relationship to 100% for maximum performance
TSR vs. FTSE 350 (excluding investment companies)
Median Upper quartile 25% for median, with straight line relationship to 100% for upper quartile
Return on Equity (ROE) 25% 55% 25% for achieving threshold with straight line relationship to 100% for maximum performance
Since 2015, DFSS awards made have been subject to clawback and malus, i.e. forfeiture or reduction of unvested awards and recovery of vested awards in exceptional circumstances (such as material misstatement or gross misconduct).
Directors’ Remuneration Report continued
72 Admiral Group plc · Annual Report and Accounts 2016
Corporate Governance: Directors’ Remuneration Report

SIPIn March and September 2016, Geraint Jones was granted awards under the SIP of 92 shares in March 2016, with a face value of £1,791, and 87 shares in September 2016, with a face value of £1,784. The shares will vest on 11 March 2019 and 2 September 2019 respectively subject to continued employment only. David Stevens again declined to be included given his significant shareholding.
Exit payments (audited) Henry Engelhardt stepped down from the Board as CEO on 13 May 2016. He received salary and benefits in line with the approved policy up to his termination date. He has not received any exit payments. In addition, the Group did not contribute to any pension arrangements on behalf of Henry Engelhardt, and he did not participate in any of the Group’s incentive schemes.
Henry Engelhardt continues to be employed by the Group, though has not been an Executive Director since stepping down from the Group Board on 13 May 2016.
Payments to past Directors (audited)As disclosed in last year’s report, based on performance to 31 December 2015, 19,855 DFSS shares vested to Kevin Chidwick on 10 October 2016. The total value at vest was £405,638 based on share price on vest of £20.43. Please refer to the 2015 Directors’ Remuneration Report for full details of actual performance against targets for this award.
Implementation of remuneration policy for 2017Executive DirectorsSalary, Pension and Benefits
Remuneration for the Executive Directors in 2017 will be determined in line with the latest policy. The Committee approved the following base salaries for the Executive Directors in 2016:
Director Latest salary 2016 salary % change Effective date
Geraint Jones £245,000 £210,000 17% 1 January 2017
David Stevens £388,236 £378,767 2% 1 September 2016
As stated in previous reports, Geraint Jones was appointed to the Board on a relatively low salary and the Committee expects to make salary increases in the first few years of his appointment that are above general inflation to reflect his demonstrated development in the CFO role and the performance of the business. The Committee will determine the levels of future increases taking into account both his individual and Company performance, and with reference to market pay levels. Geraint’s current salary of £245,000 continues to be in the lower quartile for FTSE 100 companies of a similar size.
Geraint Jones will continue to participate in the Group Personal Pension Plan, where employee contributions are matched up to a maximum 6% of base salary with maximum employer contribution of £9,000. David Stevens will also continue to participate in the plan, on the same basis as in 2015. Both Executive Directors will continue to receive benefits in line with the policy.
DFSS
In advance of each DFSS cycle, the Committee reviews the appropriateness of the performance measures and corresponding targets. Vesting of the 2017 award will be linked to the same three performance measures set for the 2016 awards, i.e. three-year EPS growth vs. LIBOR, TSR vs. FTSE 350 (excluding investment companies), and ROE, weighted equally. The Committee intends to make DFSS awards in October 2017 and it is anticipated that targets will be the same as those for awards in 2016, as summarised in the table below. The Committee will determine the precise targets closer to the time of making the awards, later in the year, and will disclose them in the 2017 Annual Report on Remuneration.
Performance measure
Performance range
VestingThreshold Maximum
EPS growth vs. LIBOR Growth in line with LIBOR
Growth of 10% p.a. in excess of LIBOR
10% for achieving threshold with straight line relationship to 100% for maximum performance
TSR vs. FTSE 350 (excluding investment companies)
Median Upper quartile 25% for median, with straight line relationship to 100% for upper quartile
Return on Equity (ROE) 25% 55% 25% for achieving threshold with straight line relationship to 100% for maximum performance
Financial Statements Additional InformationCorporate GovernanceStrategic Report Introduction
73Admiral Group plc · Annual Report and Accounts 2016
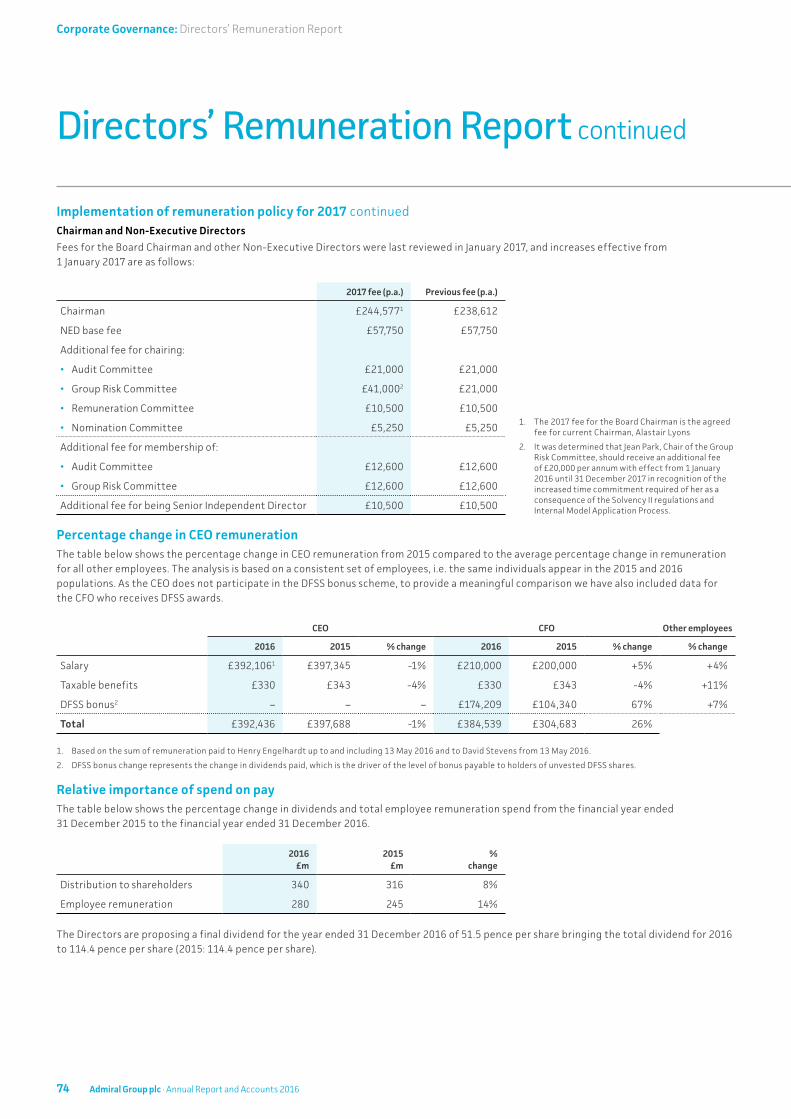
Implementation of remuneration policy for 2017 continuedChairman and Non-Executive Directors
Fees for the Board Chairman and other Non-Executive Directors were last reviewed in January 2017, and increases effective from 1 January 2017 are as follows:
2017 fee (p.a.) Previous fee (p.a.)
Chairman £244,5771 £238,612
NED base fee £57,750 £57,750
Additional fee for chairing:
• Audit Committee £21,000 £21,000
• Group Risk Committee £41,0002 £21,000
• Remuneration Committee £10,500 £10,500
• Nomination Committee £5,250 £5,250
Additional fee for membership of:
• Audit Committee £12,600 £12,600
• Group Risk Committee £12,600 £12,600
Additional fee for being Senior Independent Director £10,500 £10,500
Percentage change in CEO remunerationThe table below shows the percentage change in CEO remuneration from 2015 compared to the average percentage change in remuneration for all other employees. The analysis is based on a consistent set of employees, i.e. the same individuals appear in the 2015 and 2016 populations. As the CEO does not participate in the DFSS bonus scheme, to provide a meaningful comparison we have also included data for the CFO who receives DFSS awards.
CEO CFO Other employees
2016 2015 % change 2016 2015 % change % change
Salary £392,1061 £397,345 -1% £210,000 £200,000 +5% +4%
Taxable benefits £330 £343 -4% £330 £343 -4% +11%
DFSS bonus2 – – – £174,209 £104,340 67% +7%
Total £392,436 £397,688 -1% £384,539 £304,683 26%
1. Based on the sum of remuneration paid to Henry Engelhardt up to and including 13 May 2016 and to David Stevens from 13 May 2016.
2. DFSS bonus change represents the change in dividends paid, which is the driver of the level of bonus payable to holders of unvested DFSS shares.
Relative importance of spend on payThe table below shows the percentage change in dividends and total employee remuneration spend from the financial year ended 31 December 2015 to the financial year ended 31 December 2016.
2016 £m
2015 £m
% change
Distribution to shareholders 340 316 8%
Employee remuneration 280 245 14%
The Directors are proposing a final dividend for the year ended 31 December 2016 of 51.5 pence per share bringing the total dividend for 2016 to 114.4 pence per share (2015: 114.4 pence per share).
1. The 2017 fee for the Board Chairman is the agreed fee for current Chairman, Alastair Lyons
2. It was determined that Jean Park, Chair of the Group Risk Committee, should receive an additional fee of £20,000 per annum with effect from 1 January 2016 until 31 December 2017 in recognition of the increased time commitment required of her as a consequence of the Solvency II regulations and Internal Model Application Process.
Directors’ Remuneration Report continued
74 Admiral Group plc · Annual Report and Accounts 2016
Corporate Governance: Directors’ Remuneration Report

Pay for performance The following graph sets out a comparison of Total Shareholder Return (TSR) for Admiral Group plc shares with that of the FTSE 100 and 350 indices, of which the Company is a constituent, over the eight-year period to 31 December 2016. The Directors consider these to be the most appropriate indices against which the Company should be compared. TSR is defined as the percentage change over the period, assuming reinvestment of income.
8-Year TSR performance: Admiral vs. FTSE 100 and FTSE 350 indicesGrowth in the value of a hypothetical £100 holding over the 8 years to 31 December 2016
CEO 2009 2010 2011 2012 2013 2014 2015 2016
Incumbent Henry Engelhardt
Henry Engelhardt
Henry Engelhardt
Henry Engelhardt
Henry Engelhardt
Henry Engelhardt
Henry Engelhardt
Henry Engelhardt1
David Stevens2
CEO single figure of remuneration £328,027 £343,106 £358,199 £373,759 £387,546 £393,260 £397,688 £148,775 £246,023
DFSS vesting outcome (% of maximum) n/a n/a n/a n/a n/a n/a n/a n/a n/a
CFO 2009 2010 2011 2012 2013 2014 2015 2016
Incumbent Kevin Chidwick
Kevin Chidwick
Kevin Chidwick
Kevin Chidwick
Kevin Chidwick
Kevin Chidwick3
Geraint Jones4
Geraint Jones
Geraint Jones
CFO single figure of remuneration £632,312 £1,269,535 £1,048,130 £1,431,218 £1,444,4435 £1,204,1645 £363,551 £539,7046 £587,739
DFSS vesting outcome (% of maximum) 98% 100% 100% 100% 100% 70% 85% 69% 50% and 0%7
1. Henry Engelhard stepped down from the Board on 13 May 2016. His 2016 remuneration includes salary and benefits in respect of his service as CEO.
2. David Stevens was appointed as the CEO on 13 May 2016. His 2016 remuneration includes salary, pension and benefits in respect of his service as CEO.
3. Kevin Chidwick left the Board on 13 August 2014 to focus on his new role as CEO of Elephant Auto. His 2014 remuneration includes salary, pension and benefits in respect of his service as CFO, his full year DFSS and his full year DFSS bonus.
4. Geraint Jones was appointed to the Board as CFO on 13 August 2014. His 2014 remuneration includes salary, pension and benefits in respect of his service as CFO, his full year DFSS and his full year DFSS bonus.
5. These figures include reimbursement of £177,104 and £165,000 in 2014 and 2013, respectively, for expenses incurred in respect of the previous CFO’s relocation.
6. This figure has been trued up since the 2015 report for the value of the 2013 DFSS based on the actual share price on vest (£20.17).
7. 50% and 0% of Geraint Jones’ April and September 2014 DFSS awards, respectively, will vest in April 2017 and September 2017, respectively, subject to his continued employment on the vesting dates.
There are no annual bonus outcomes to report in the table as the Admiral DFSS Bonus is not structured as a traditional annual bonus scheme and consequently a vesting outcome (as a percentage of max) is meaningless.
31 Dec 08 31 Dec 1631 Dec 1531 Dec 1431 Dec 1331 Dec 1231 Dec 11
Admiral FTSE 100 FTSE 350
31 Dec 1031 Dec 09
0
350
150
250
50
300
100
200
Financial Statements Additional InformationCorporate GovernanceStrategic Report Introduction
75Admiral Group plc · Annual Report and Accounts 2016

DilutionThe Company currently uses newly issued shares to fund the DFSS. The Company has controls in place to ensure that shares awarded under the incentive schemes operated by the Company within any rolling ten-year period do not exceed 10% of the number of ordinary shares in the capital of the Company in issue at the time of each award. As at the end of 2016, the ten-year rolling dilution level was 8.0%. The Company would consider using a mixture of newly issued shares and market purchase shares to fund the DFSS in the future.
Interests held by Directors (audited)Executive Directors have agreed to (acquire and) retain a beneficial shareholding equal to at least 200% of base salary, which can be built up over a period of five years from the date of appointment.
As at 31 December 2016, the Directors held the following interests:
Director
Shares held
Shareholding requirement (% of salary)
Current shareholding
(% of salary/fee)Requirement
met?Beneficially
owned outright
Subject to continued
employment only
Subject to performance
conditions
Geraint Jones 50,7931 10,0002 100,000 200% >200% Yes
David Stevens 9,492,950 n/a n/a 200% >200% Yes
Alastair Lyons 282,152
Owen Clarke 142,852
Annette Court –
Colin Holmes 23,500
Penny James –
Jean Park 2,000
Justine Roberts3 –
Manning Rountree –
1. Total includes SIP shares both matured and awarded.
2. Total reflects 10,000 shares from the April 2014 DFSS award (performance test has been applied to the relevant portion, and award is due to vest in April 2017 subject to continued employment) and 0 shares from the September 2014 DFSS (performance test has been applied, and award is due to mature in September 2017).
3. Justine Roberts was appointed to the Board on 17 June 2016.
There have been no changes to Directors’ shareholdings since 31 December 2016.
None of the Directors had an interest in the shares of any subsidiary undertaking of the Company or in any significant contracts of the Group.
Directors’ Remuneration Report continued
76 Admiral Group plc · Annual Report and Accounts 2016
Corporate Governance: Directors’ Remuneration Report

Chief Financial Officer Geraint Jones’ interests in shares under the DFSS and SIP (audited)
TypeAt start of year
Awarded during year
Vested/ matured
during yearAt end
of year
Price at award
(£)
Value at award date
(£)
Value at 31 Dec 2016 or
maturity (£)
Date of award
Final vesting/maturity date
DFSS 16,000 – 11,040 – £12.09 £193,440 £222,6771,2 10/10/2013 10/10/2016
DFSS 20,000 – – 20,000 £13.74 £274,800 £363,600 15/04/2014 15/04/2017
DFSS 35,000 – – 35,000 £12.27 £429,520 £636,300 22/09/2014 22/09/2017
DFSS 50,000 – – 50,000 £14.87 £743,500 £909,000 29/09/2015 29/09/2018
DFSS – 50,000 – 50,000 £20.79 £1,039,500 £909,000 26/09/2016 26/09/2019
SIP 112 – 112 – £13.48 £1,510 £2,036 15/03/2013 15/03/2016
SIP 116 – 116 – £12.83 £1,488 £2,108 02/09/2013 02/09/2016
SIP 100 – – 100 £15.06 £1,506 £1,818 14/03/2014 14/03/2017
SIP 114 – – 114 £13.06 £1,489 £2,072 05/09/2014 05/09/2017
SIP 101 – – 101 £14.88 £1,503 £1,836 13/03/2015 13/03/2018
SIP 118 – – 118 £15.21 £1,795 £2,145 24/08/2015 24/08/2018
SIP – 92 – 92 £19.47 £1,791 £1,673 11/03/2016 11/03/2019
SIP – 87 – 87 £20.51 £1,784 £1,582 02/09/2016 02/09/2019
1. Value at maturity.
2. The vesting percentage for performance-related awards made in 2013 and vesting in 2016 was 38%. As awards made to Geraint Jones in 2013 were 50% performance-related and 50% non-performance-related, the blended vesting percentage was 69%. This resulted in the lapsing of 4,960 shares from the 16,000 shares awarded in October 2013. The value at maturity only relates to shares that vested.
Details of former CFO Kevin Chidwick’s interests in shares under the DFSS and SIP awarded to him in respect of his service as an Executive Director can be found in the 2014 report.
The closing price of Admiral shares on 31 December 2016 was £18.18 per share.
By order of the Board,
Annette CourtChairman of the Remuneration Committee 7 March 2017
Financial Statements Additional InformationCorporate GovernanceStrategic Report Introduction
77Admiral Group plc · Annual Report and Accounts 2016

Directors’ Report
The Directors present their Annual Report and the audited financial statements for the year ended 31 December 2016.
Statutory disclosuresGroup results and dividendsThe profit for the year, after tax but before dividends, amounted to £214.1 million (2015: £291.8 million).
The Directors declared and paid dividends of £349.8 million during 2016 (2015: £274.6 million) – refer to note 11b for further details.
The Directors have proposed a final dividend of £144 million (51.5 pence per share) payable on 2 June 2017.
Employee policies Detailed information on the Group’s employment practices is set out in the Strategic Report and on the corporate website. The Group purchases appropriate liability insurance for all staff and Directors.
Diversity, ethics and human rightsAdmiral Group respects and values the individuality and diversity of every employee. The Group’s Equality, Diversity and Dignity at Work policy ensures that every employee is treated equally and fairly and that all employees are aware of their obligations. The Group is fully committed to the health and safety and the human rights of its employees regardless of their background. In addition, the Group maintains a number of employee codes of conduct regarding appropriate ethical standards in the workplace.
The Group’s principles of respect for human rights, diversity, health and safety and workplace ethical standards not only apply to staff directly employed by Admiral, but also to staff employed by the Group’s outsourced partner in Bangalore, India. To meet this commitment, Admiral Group maintains regular contact with its outsourcer’s management team and the Group’s senior managers visit the outsourcer on a regular basis, whilst the Group also provides training and development to ensure that the team uphold these principles. In addition, Admiral Group has appointed a manager based permanently at the outsourced operation, who is responsible for ensuring that the Group’s principles are adhered to by the outsourced partner, and that the wellbeing of outsourced staff is monitored.
Gender diversityThe table below provides a breakdown of the gender of Company Directors and employees at the end of the financial year:
Male Female
Company Directors*1 6 4
Other senior managers*2 38 15
All employees 4,372 4,625
Notes
*1 Company Directors consists of the Board of Directors, as detailed on pages 46 and 47.
*2 Other senior managers is as defined in the Companies Act 2006 (Strategic Report and Directors’ Report) and includes persons responsible for planning, directing or controlling the activities of the Company, or a strategically significant part of the Company, other than Company Directors. Any other Directors of undertakings included in the consolidated accounts that are not considered strategically significant have not been included.
Disabled employeesAdmiral Group gives full and fair consideration to applications for employment made by those with disabilities, having regard to their particular aptitudes and abilities. The Group was recently accredited the Two Ticks symbol by Jobcentre Plus for meeting five key standards of conduct regarding the recruitment, training, retention and career development of disabled employees.
The Group will support any employee who is disabled or has a life threatening illness and help them to contribute to the Group as long as their health allows.
Managers in the Group are sensitive to health concerns and special needs and will not knowingly allow any employee with a disabling or life threatening illness to suffer from discrimination at work. The Group provides staff with access to the EAP Care First confidential helpline which offers advice and support on a range of health issues.
CommunicationThere are a wide range of communication tools used by the Group to communicate to employees which assists in the understanding of business goals and objectives including; the staff portal (Atlas), internal newsletters, videos, team briefings, suggestion schemes, staff forums, updates on the staff share scheme and the annual Staff General Meeting (SGM). In the 2016
annual staff survey, 84% of staff were happy with the amount of information they receive about the company (2015: 85%).
The transparency of our communication philosophy extends to senior managers and Directors, who sit amongst their teams which encourages a dialogue between staff of all levels of seniority across all areas of our business. Furthermore, our Chief Executive Officer operates an ‘open door’ policy so if any member of our staff wants to ask him a question, they can email him directly through our ‘Ask David’ intranet initiative. Our senior managers and Directors also participate in regular online chats with staff.
Contractual arrangementsThe Group considers its co-insurance and reinsurance contracts, as described in the Strategic Report, to be essential to the running of the Group’s business. No other contractual arrangements are considered to be essential.
Financial instrumentsThe objectives and policies for managing risks in relation to financial instruments held by the Group are set out in note 6 to the financial statements.
Directors and their interestsThe present Directors of the Company are shown on pages 46 and 47 of this Report, whilst Directors’ interests in the share capital of the Company are set out in the Remuneration Report on page 76.
Greenhouse gas emissions The annual level of greenhouse gas emissions, resulting from activities for which the Group is responsible, in 2016 was 4,424 CO2e (2015: 3,691 CO2e), equivalent to 0.53 tonnes (2015: 0.55 tonnes) per employee*1. In accordance with GHG Protocol Scope 2 guidance released 20 January 2015, Admiral is exempt from reporting greenhouse gas emissions from electricity supply to the three largest UK offices which meets the GHG Protocol Corporate Standard. Note that the election to apply the exemptions available in the GHG Protocol Corporate Standard was not taken in the 2015 Annual Report and so the comparative figures have been updated from the previous disclosure made.
*1 Average employee number excludes employees from three offices for which data could not be collected.
78 Admiral Group plc · Annual Report and Accounts 2016
Corporate Governance: Directors’ Remuneration Report

The data has been prepared with reference to the WRI/WBCSD Greenhouse Gas Protocol: A Corporate Accounting and Reporting Standard (Revised Edition) and in accordance with the guidance for corporate reporting issued by the Department for Environment, Food and Rural Affairs (DEFRA).
There are no material exclusions from this data. Exclusions include figures for air conditioning from all sites because the information is not available from the managing agents of the Group’s multiple office locations.
Detailed information on the Group’s environmental performance and the methodology for the measurement of greenhouse gas emissions is available on the corporate website, www.admiralgroup.co.uk.
Going concernUnder Provision C.1.3 of the 2014 UK Corporate Governance Code, the Board is required to report on whether the business is a going concern. In considering this requirement, the Directors have taken into account the following:
• The Group’s projections for the next 12 months and beyond, in particular the profit forecasts, regulatory capital surpluses and levels and sources of liquidity.
• The risks included on the Group’s risk register that could impact on the Group’s financial position and performance, levels of liquidity and solvency over the next 12 months.
• The risks on the Group’s risk register that could be a threat to the Group’s business model and capital adequacy.
The Group’s business activities, together with the factors likely to affect its future development, performance and position are set out in the Strategic Report. The Strategic Report also includes the Group’s principal risks and uncertainties. In addition, the governance report includes the Directors’ statement on the viability of the Group over a three year period.
Following consideration of the above, the Directors have reasonable expectation that the Group has adequate resources to continue in operation for the foreseeable future, a period of not less than 12 months from the date of this report, and that it is therefore appropriate to adopt the going concern basis in preparing the financial statements.
Share Capital, AGM and related mattersMajor ShareholdersOther than as stated below, as far as the Company is aware, there are no persons with significant direct or indirect holdings in the Company. Information provided to the Company pursuant to the Financial Conduct Authority’s (FCA) Disclosure and Transparency Rules (DTRs) is published on a Regulatory Information Service and on the Company’s website.
At 31 January 2017, the Company had received notifications in accordance with the FCA’s DTRs of the following notifiable interests in the voting rights in the Company’s issued share capital:
Number of shares %
Munich Re 28,843,212 10.1%
BlackRock Inc 13,806,859 4.9%
The interests of Directors and Officers and their connected persons in the issued share capital of the Company are given in the Remuneration Report.
Additional information for shareholdersWhere not provided previously in this Directors’ Report, the following provides the additional information required for shareholders as a result of the implementation of the Takeovers Directive into UK law.
At 31 December 2016, the Company’s issued share capital comprised a single class of shares referred to as ordinary shares. Details of the share capital and shares issued during the year can be found in note 11d.
On a poll, every member present in person or by proxy and entitled to vote shall have one vote for every ordinary share held. The notice of the general meeting specifies deadlines for exercising voting rights either by proxy notice or present in person or by proxy in relation to resolutions to be passed at general meeting. All proxy votes are counted and the numbers for, against or withheld in relation to each resolution are announced at the Annual General Meeting and published on the Company’s website after the meeting.
There are no restrictions on the transfer of ordinary shares in the company other than:
• Certain restrictions may from time to time be imposed by laws and regulations (for example, insider trading laws).
• Pursuant to the Listing Rules of the FCA whereby certain employees of the Company require the approval of the Company to deal in the Company’s securities.
The Company has not purchased any of its own shares during the period.
There are no agreements between the Company and its Directors or employees providing for compensation for loss of office or employment (whether through resignation, purported redundancy or otherwise) that occurs because of a takeover bid.
There are a number of agreements that alter or terminate upon a change of control of the Company following a takeover bid, such as commercial contracts. None are considered to be significant in terms of their impact on the business of the Group as a whole except for the long term co-insurance agreement in place with Great Lakes Insurance SE. Details relating to this agreement are contained in the Strategic Report.
Financial Statements Additional InformationCorporate GovernanceStrategic Report Introduction
79Admiral Group plc · Annual Report and Accounts 2016
Directors’ Report continued
Power to issue sharesAt the last Annual General Meeting, held on 28 April 2016, authority was given to the Directors to allot unissued relevant securities in the Company up to a maximum of £93,049, equivalent to one third of the issued share capital as at 18 March 2016. This authority expires on the date of the Annual General Meeting to be held on 26 April 2017 and the Directors will seek to renew this authority for the following year.
A further special resolution passed at that meeting granted authority to the Directors to allot equity securities in the Company (up to a maximum of 5% of the issued share capital of the Company) for cash, without regard to the pre-emption provisions of the Companies Act 2006. This authority also expires on the date of the Annual General Meeting to be held on 26 April 2017 and the Directors will seek to renew this authority for the following year.
In line with the new principles published by the Pre-Emption Group in March 2015, and their template resolutions published in May 2016, allowing a company the ability to seek authority over a further 5% of the issued ordinary share capital on a non-pre-emptive basis subject to certain conditions, it is the intention of the Company, at the AGM on 26 April 2017, to seek this additional authority by special resolution and will confirm in the Notice of AGM that such additional shares are only issued in connection with a specified acquisition or capital investment.
Appointments of DirectorsThe Company’s Articles of Association (the Articles) give the Directors power to appoint and replace Directors. Under the Terms of Reference of the Nomination Committee, any appointment must be recommended by the Nomination Committee for approval by the Board of Directors. The Articles also require Directors to retire and submit themselves for election at the first Annual General Meeting following appointment and all Directors who held office at the time of the two preceding Annual General Meetings to submit themselves for re-election.
However, in accordance with the requirement under the UK Corporate Governance Code (the Code) for annual election of Directors, all Directors will submit themselves for re-election at the Group’s Annual General Meeting on 26 April 2017.
Articles of AssociationThe Articles may only be amended by special resolution of the shareholders.
Power of the DirectorsThe Directors are responsible for managing the business of the Company and may exercise all powers of the Company subject to the provisions of relevant statutes, to any directions given by special resolution and to the Company’s Memorandum and Articles. The Articles, for example, contain specific provisions and restrictions concerning the Company’s power to borrow money. Powers relating to the issuing of new shares are also included in the Articles and such authorities are renewed by shareholders at the Annual General Meeting each year.
Directors’ indemnities and insuranceDirectors and Officers insurance cover is in place for all Directors to provide cover against certain acts or omissions on behalf of the Company. A Deed Poll of Indemnity was executed in October 2015, indemnifying each of the Directors, and Company Secretary, in relation to certain losses and liabilities that they might incur in the course of acting as Directors of the Company. The Deed Poll of Indemnity is categorised as qualifying third party indemnity provisions as defined by section 234 of the Companies Act 2006 and remains in force for all past and present Directors of the Company.
The Board is of the view that it is in the best interests of the Group to attract and retain the services of the most able and experienced directors by offering competitive terms of engagement, including the granting of such indemnities. Neither the Deed Poll of Indemnity nor insurance cover would provide any coverage in the event that a Director is proved to have acted fraudulently or dishonestly.
Annual General Meeting (AGM)It is proposed that the next AGM be held at City Hall, Cardiff on Wednesday 26 April 2017 at 2.00pm, notice of which will be sent to shareholders with the Annual Report.
Reporting, accountability and auditUK Corporate Governance CodeAdmiral is subject to the UK Corporate Governance Code (the Code), published by the Financial Reporting Council (FRC) in September 2014 and available on their website, www.frc.org.uk. The Company’s Annual Report and Accounts, taken as a whole, addresses the requirements of the 2014 Code.
During the year to 31 December 2016, the Company has in all respects complied with the provisions of the 2014 Code.
The Directors confirm that the Annual Report and Accounts, taken as a whole, is fair, balanced and understandable and provides the information necessary for shareholders to assess the Company’s position and performance, business model and strategy.
Directors’ responsibilities The directors are responsible for preparing the Annual Report and the Group and parent company financial statements in accordance with applicable law and regulations.
Company law requires the directors to prepare Group and parent company financial statements for each financial year. Under that law they are required to prepare the Group financial statements in accordance with IFRSs as adopted by the EU and applicable law and have elected to prepare the parent company financial statements in accordance with UK Accounting Standards, including FRS 101 Reduced Disclosure Framework.
80 Admiral Group plc · Annual Report and Accounts 2016
Corporate Governance: Directors’ Remuneration Report

Under company law the directors must not approve the financial statements unless they are satisfied that they give a true and fair view of the state of affairs of the Group and parent company and of their profit or loss for that period. In preparing each of the Group and parent company financial statements, the directors are required to:
• select suitable accounting policies and then apply them consistently;
• make judgements and estimates that are reasonable and prudent;
• for the Group financial statements, state whether they have been prepared in accordance with IFRSs as adopted by the EU;
• for the parent company financial statements, state whether applicable UK Accounting Standards, including FRS 101 Reduced Disclosure Framework, have been followed, subject to any material departures disclosed and explained in the parent company financial statements.
The directors are responsible for keeping adequate accounting records that are sufficient to show and explain the parent company’s transactions and disclose with reasonable accuracy at any time the financial position of the parent company and enable them to ensure that its financial statements comply with the Companies Act 2006. They have general responsibility for taking such steps as are reasonably open to them to safeguard the assets of the Group and to prevent and detect fraud and other irregularities.
Under applicable law and regulations, the directors are also responsible for preparing a Strategic Report, Directors’ Report, Directors’ Remuneration Report and Corporate Governance Statement that complies with that law and those regulations.
The directors are responsible for the maintenance and integrity of the corporate and financial information included on the company’s website. Legislation in the UK governing the preparation and dissemination of financial statements may differ from legislation in other jurisdictions.
Responsibility statementThe Directors confirm that to the best of their knowledge:
• the financial statements, prepared in accordance with the applicable set of accounting standards, give a true and fair view of the assets, liabilities, financial position and profit or loss of the company and the undertakings included in the consolidation taken as a whole; and
• the Strategic Report includes a fair review of the development and performance of the business and the position of the issuer and the undertakings included in the consolidation taken as a whole, together with a description of the principal risks and uncertainties that they face.
Disclosure of information to auditorsThe Directors who held office at the date of approval of this Directors’ Report confirm that, so far as they are each aware, there is no relevant audit information of which the Company’s auditor is unaware; and each Director has taken all the steps that they ought to have taken as a Director to make themselves aware of any relevant audit information and to establish that the Company’s auditor is aware of that information.
Change of auditorAt the Annual General Meeting on 28 April 2016, shareholders approved the appointment of Deloitte LLP as auditor to the Company and its subsidiaries. Deloitte LLP have indicated a willingness to continue in office and resolutions to reappoint it and to authorise the Directors to fix its remuneration will be proposed at the Annual General Meeting.
By Order of the Board,
Mark Waters Geraint JonesCompany Secretary Chief Financial
Officer7 March 2017 7 March 2017
Financial Statements Additional InformationCorporate GovernanceStrategic Report Introduction
81Admiral Group plc · Annual Report and Accounts 2016

Opinion on financial statements of Admiral Group plc
In our opinion:
• the financial statements give a true and fair view of the state of the group’s and of the parent company’s affairs as at 31 December 2016 and of the group’s and the parent company’s profit for the year then ended;
• the group financial statements have been properly prepared in accordance with International Financial Reporting Standards (IFRSs) as adopted by the European Union;
• the parent company financial statements have been properly prepared in accordance with United Kingdom Generally Accepted Accounting Practice, including FRS 101 “Reduced Disclosure Framework”; and
• the financial statements have been prepared in accordance with the requirements of the Companies Act 2006 and, as regards the group financial statements, Article 4 of the IAS Regulation.
The financial statements that we have audited comprise:
• the Consolidated and Parent Company Income Statements;
• the Consolidated and Parent Company Statements of Comprehensive Income;
• the Consolidated and Parent Company Statements of Financial Position;
• the Consolidated Cash Flow Statement;
• the Consolidated and Parent Company Statements of Changes in Equity;
• the related notes 1 to 12 to the Group financial statements; and
• the related notes 1 to 6 to the Parent Company financial statements.
The financial reporting framework that has been applied in the preparation of the group financial statements is applicable law and IFRSs as adopted by the European Union. The financial reporting framework that has been applied in the preparation of the parent company financial statements is applicable law and United Kingdom Accounting Standards (United Kingdom Generally Accepted Accounting Practice), including FRS 101 “Reduced Disclosure Framework”.
Summary of our audit approach
Key risks Materiality
The key risks that we identified in the current year were:
• Valuation of gross insurance claims reserves
• Calculation of profit commission income
The materiality that we used in the current year was £14 million which was determined on the basis of 5% of pre-tax profit.
Scoping
We have identified five reporting components which we consider are of individual financial significance to the group’s reported results and these components were subjected to audits for group reporting purposes.
Additionally, we have completed specific audit procedures in respect of two further components which, although not financially significant, did present specific audit risks which needed to be addressed.
The components within the scope of our audit procedures account for 94% of the group’s pre-tax profits and losses, 87% of revenue and 95% of the group’s net assets.
Going concern & the directors’ assessment of the principal risks that would threaten the solvency or liquidity of the groupAs required by the Listing Rules we have reviewed the directors’ statement regarding the appropriateness of the going concern basis of accounting contained within note 2 to the financial statements and the directors’ statement on the longer-term viability of the group contained within the governance report on page 61.
We are required to state whether we have anything material to add or draw attention to in relation to:
• the directors’ confirmation on page 40 that they have carried out a robust assessment of the principal risks facing the group, including those that would threaten its business model, future performance, solvency or liquidity;
• the disclosures on pages 40 to 43 that describe those risks and explain how they are being managed or mitigated;
• the directors’ statement in note 2 to the financial statements about whether they considered it appropriate to adopt the going concern basis of accounting in preparing them and their identification of any material uncertainties to the group’s ability to continue to do so over a period of at least twelve months from the date of approval of the financial statements; and
• the directors’ explanation on page 61 as to how they have assessed the prospects of the group, over what period they have done so and why they consider that period to be appropriate, and their statement as to whether they have a reasonable expectation that the group will be able to continue in operation and meet its liabilities as they fall due over the period of their assessment, including any related disclosures drawing attention to any necessary qualifications or assumptions.
We confirm that we have nothing material to add or draw attention to in respect of these matters.
We agreed with the directors’ adoption of the going concern basis of accounting and we did not identify any such material uncertainties. However, because not all future events or conditions can be predicted, this statement is not a guarantee as to the group’s ability to continue as a going concern.
82 Admiral Group plc · Annual Report and Accounts 2016
Independent Auditor’s Report to the Members of Admiral Group plc
Financial Statements: Independent Auditor’s Report
IndependenceWe are required to comply with the Financial Reporting Council’s Ethical Standards for Auditors and confirm that we are independent of the group and we have fulfilled our other ethical responsibilities in accordance with those standards.
We confirm that we are independent of the group and we have fulfilled our other ethical responsibilities in accordance with those standards. We also confirm we have not provided any of the prohibited non-audit services referred to in those standards.
Our assessment of risks of material misstatementThe assessed risks of material misstatement described below are those that had the greatest effect on our audit strategy, the allocation of resources in the audit and directing the efforts of the engagement team. The key risks identified this year are in line with those identified by the previous auditor in 2015.
Valuation of gross insurance claims reserves
Risk description The group’s gross insurance claims reserves total £2,031 million (2015: £1,725 million). The judgements which are made by management in determining the valuation of incurred but not reported (“IBNR”) claims reserves are by far the most significant, in terms of their impact on the Group’s financial position. Setting these claims reserves is an inherently subjective exercise and small changes in underlying assumptions may have a material impact on the overall year end result reported.
We have identified a key risk of misstatement in respect of management’s selection of assumptions and estimates underpinning the incurred but not reported (“IBNR”) claims reserves, specifically around periodic payment orders (“PPOs”) and the ultimate severity of large bodily injury claims arising in the UK Car Insurance business. These particular claims result in higher individual claims reserves and are more judgmental in terms of the development of the ultimate losses which will be incurred – due to the longer-term nature of the Group’s exposure – than the lower value attritional losses which are more common in the normal course of business.
Following the conclusion of the government’s consultation on the Ogden discount rate used by courts to calculate the value of lump sum claims to be paid for long-term damages, management needed also to consider the interaction of this change with the assumed propensity of PPO settlements. The timing of the announced rate change from 2.5% to minus 0.75%, on 27 February 2017, meant that there was a high degree of uncertainty associated with projecting the ultimate impact of this change; given that no subsequent experience has yet emerged.
Refer to page 56 in the audit committee report where this is included as a significant issue, note 5d and note 3 in the financial statements which refer to this matter.
How the scope of our audit responded to the risk
We have assessed the design and implementation and tested the operating effectiveness of the key controls which management performs in relation to insurance reserving. This included testing controls over the data provided to the group’s external actuarial expert, the internal challenge of that expert’s work, and the appropriate governance oversight in determining the key assumptions for both the actuarial best estimates and the additional margin applied above the best estimate reserve.
We tested the completeness and accuracy of the underlying claims and exposure data used in the actuarial calculations by performing reconciliations of the relevant data back to audited financial information.
We completed procedures to assess the competence and objectivity of management’s external actuarial expert and involved our own Deloitte actuarial experts to review and provide challenge on the methodology applied and the key assumptions and judgements taken in determining the gross insurance reserves noted above as significant risks.
Our challenge focussed on benchmarking the claims severity assumptions adopted by the group against our wider industry experience to assess suitability, evaluating the reserve releases and development trends from previous accident years, to verify the robustness of the reserving policy adopted, and understanding the year-on-year consistency in determining the reserve margins.
Finally, we have reviewed the specific adjustments made to refine the actuarial models for the change in Ogden discount rate and considered the related changes in PPO propensity assumptions.
Financial Statements Additional InformationCorporate GovernanceStrategic Report Introduction
83Admiral Group plc · Annual Report and Accounts 2016

Calculation of profit commission income
Risk description We have identified a risk in revenue recognition in respect of the profit commission class of income. This revenue line contributed £54.3m to group profit before tax in the year (2015: £85.4m) and is recorded on the basis of management’s year end calculations, which are subject to the same underlying estimation as the insurance claims reserves. There is, therefore, a greater risk associated with this class of transactions than more automated revenue streams which are recorded at source through a large number of individually insignificant transactions.
Amongst the most significant inputs to the calculations are the loss ratios resulting from the gross insurance reserves booked in the financial statements, which is discussed as a separate risk, above. This is because the setting of reserves will affect the claims incurred in a given underwriting year, thus driving the loss ratios which determine the amount of profit commission to be recognised in the year.
Refer to page 57 in the audit committee report where this is included as a significant issue, note 5c and note 3 in the financial statements which refer to this matter.
How the scope of our audit responded to the risk
In addition to the procedures outlined above in respect of the valuation of insurance reserves, we reviewed the profit commission calculation in detail, and compared the calculation logic and the inputs included by management to the terms of the relevant co-insurance contracts in force at the balance sheet date. On the basis of this understanding of the contractual terms, we independently formed an expectation for the recorded income using audited loss ratios and expenses data and compared this to that actually recorded by management.
Following the announcement of the new Ogden rate, we reassessed the profit commission calculation to test the loss ratios being used in the final calculations had been adjusted for the impact of the Ogden rate change.
We have also assessed the design and implementation and tested the operating effectiveness of the internal review controls performed by management, which are designed to identify any errors in the inputs or mechanical workings of the calculations.
Finally, we vouched the settlement of profit commissions during the year to cash receipts on bank statements and used this to reconcile the income recorded to the movement in the balance sheet position associated with these arrangements.
These matters were addressed in the context of our audit of the financial statements as a whole, and in forming our opinion thereon, and we do not provide a separate opinion on these matters.
84 Admiral Group plc · Annual Report and Accounts 2016
Independent Auditor’s Report continuedto the Members of Admiral Group plc
Financial Statements: Independent Auditor’s Report

Our application of materiality
We define materiality as the magnitude of misstatement in the financial statements that makes it probable that the economic decisions of a reasonably knowledgeable person would be changed or influenced. We use materiality both in planning the scope of our audit work and in evaluating the results of our work.
Based on our professional judgement, we determined materiality for the financial statements as a whole as follows:
Group materiality £14 million (2015: £16 million was used by the previous auditors).
Basis for determining materiality
5% of pre-tax profit.
In 2015, the previous auditors set materiality at 4% of pre-tax profit.
Rationale for the benchmark applied
We consider profit before taxation to be the critical benchmark of the performance of the group and consider this measure to be suitable having compared to other benchmarks: our materiality equates to 1% of gross earned premium and 2% of equity.
We determine performance materiality at a level lower than materiality to reduce the probability that, in aggregate, uncorrected and undetected misstatements exceed the materiality for the financial statements as a whole. Group performance materiality was set at 70% of Group materiality for the 2016 audit.
We agreed with the Audit Committee that we would report to the Committee all audit differences in excess of £0.7m (2015: £0.8m was used by the previous auditors), as well as differences below that threshold that, in our view, warranted reporting on qualitative grounds. We also report to the Audit Committee on disclosure matters that we identified when assessing the overall presentation of the financial statements.PBT
Group Materiality £14m
Group Materiality
Audit Committee Reporting Threshold £0.7m
Component Materiality Range £660k –£11.8m
PBT £278m
Financial Statements Additional InformationCorporate GovernanceStrategic Report Introduction
85Admiral Group plc · Annual Report and Accounts 2016

An overview of the scope of our audit
The financially significant components of the group which were identified in our audit planning are Admiral Insurance (Gibraltar) Limited, Admiral Insurance Company Limited, EUI Limited, Inspop.com Limited and the Admiral Group plc parent entity itself. In 2015, the previous auditor also identified five significant reporting components. Each of these components was subjected to a full-scope audit for group reporting purposes, completed to individual component materiality levels which ranged from £660,000 to £11.8m (the previous auditor disclosed the following range in 2015: £480,000 to £14m), dependent upon the relative significance of each individual component.
Additionally, we have completed specific audit procedures, designed to address specific audit risks, for the Elephant Insurance Company and Inspop USA LLC components of the group, each of which is a subsidiary company incorporated in the USA. Accordingly, we engaged a local component auditor, the Deloitte member firm in the USA, to perform these specified audit procedures on our behalf. We directed and supervised the work of the component auditor, including through visits to the component and component auditor and remote communication and review of their work.
For the remaining components not subject to audit or specified audit procedures, we performed analysis at an aggregated group level to re-assess our evaluation that there were no significant risks of material misstatement presented by any of these components. There are several non-significant components including branch operations in Europe; the branches in Spain and Italy were visited this year by members of the group engagement team and, to enhance our risk assessment and understanding of the group in our first year as group auditor, we assessed the design and implementation of key controls in key business cycles in these and the French branches.
The components within the scope of our audit procedures account for 94% of the group’s pre-tax profits and losses, 87% of revenue and 95% of the group’s net assets.
Full audit scope
82% 83% 89%
5%
6%
11%5%
6%
13%
Full audit scopeWithin audit scope
Specified audit procedures Specified audit proceduresSpecified audit procedures
Review at group level Review at group level Review at group level
Revenue Net AssetsProfits
and losses before tax
Opinion on other matters prescribed by the Companies Act 2006
In our opinion, based on the work undertaken in the course of the audit:
• the part of the Directors’ Remuneration Report to be audited has been properly prepared in accordance with the Companies Act 2006;
• the information given in the Strategic Report and the Directors’ Report for the financial year for which the financial statements are prepared is consistent with the financial statements; and
• the Strategic Report and the Directors’ Report have been prepared in accordance with applicable legal requirements.
In the light of the knowledge and understanding of the company and its environment obtained in the course of the audit, we have not identified any material misstatements in the Strategic Report and the Directors’ Report.
86 Admiral Group plc · Annual Report and Accounts 2016
Independent Auditor’s Report continuedto the Members of Admiral Group plc
Financial Statements: Independent Auditor’s Report

Matters on which we are required to report by exception
Adequacy of explanations received and accounting records
Under the Companies Act 2006 we are required to report to you if, in our opinion:
• we have not received all the information and explanations we require for our audit; or
• adequate accounting records have not been kept by the parent company, or returns adequate for our audit have not been received from branches not visited by us; or
• the parent company financial statements are not in agreement with the accounting records and returns.
We have nothing to report in respect of these matters.
Directors’ remuneration
Under the Companies Act 2006 we are also required to report if in our opinion certain disclosures of directors’ remuneration have not been made or the part of the Directors’ Remuneration Report to be audited is not in agreement with the accounting records and returns.
We have nothing to report arising from these matters.
Corporate Governance Statement
Under the Listing Rules we are also required to review part of the Corporate Governance Statement relating to the company’s compliance with certain provisions of the UK Corporate Governance Code.
We have nothing to report arising from our review.
Our duty to read other information in the Annual Report
Under International Standards on Auditing (UK and Ireland), we are required to report to you if, in our opinion, information in the annual report is:
• materially inconsistent with the information in the audited financial statements; or
• apparently materially incorrect based on, or materially inconsistent with, our knowledge of the group acquired in the course of performing our audit; or
• otherwise misleading.
In particular, we are required to consider whether we have identified any inconsistencies between our knowledge acquired during the audit and the directors’ statement that they consider the annual report is fair, balanced and understandable and whether the annual report appropriately discloses those matters that we communicated to the audit committee which we consider should have been disclosed.
We confirm that we have not identified any such inconsistencies or misleading statements.
Respective responsibilities of directors and auditor
As explained more fully in the Directors’ Responsibilities Statement, the directors are responsible for the preparation of the financial statements and for being satisfied that they give a true and fair view. Our responsibility is to audit and express an opinion on the financial statements in accordance with applicable law and International Standards on Auditing (UK and Ireland). We also comply with International Standard on Quality Control 1 (UK and Ireland). Our audit methodology and tools aim to ensure that our quality control procedures are effective, understood and applied. Our quality controls and systems include our dedicated professional standards review team and independent partner reviews.
This report is made solely to the company’s members, as a body, in accordance with Chapter 3 of Part 16 of the Companies Act 2006. Our audit work has been undertaken so that we might state to the company’s members those matters we are required to state to them in an auditor’s report and for no other purpose. To the fullest extent permitted by law, we do not accept or assume responsibility to anyone other than the company and the company’s members as a body, for our audit work, for this report, or for the opinions we have formed.
Scope of the audit of the financial statements
An audit involves obtaining evidence about the amounts and disclosures in the financial statements sufficient to give reasonable assurance that the financial statements are free from material misstatement, whether caused by fraud or error. This includes an assessment of: whether the accounting policies are appropriate to the group’s and the parent company’s circumstances and have been consistently applied and adequately disclosed; the reasonableness of significant accounting estimates made by the directors; and the overall presentation of the financial statements. In addition, we read all the financial and non-financial information in the annual report to identify material inconsistencies with the audited financial statements and to identify any information that is apparently materially incorrect based on, or materially inconsistent with, the knowledge acquired by us in the course of performing the audit. If we become aware of any apparent material misstatements or inconsistencies we consider the implications for our report.
Mark McQueen ACA (Senior statutory auditor)for and on behalf of Deloitte LLP Chartered Accountants and Statutory Auditor London, United Kingdom 7 March 2017
Financial Statements Additional InformationCorporate GovernanceStrategic Report Introduction
87Admiral Group plc · Annual Report and Accounts 2016
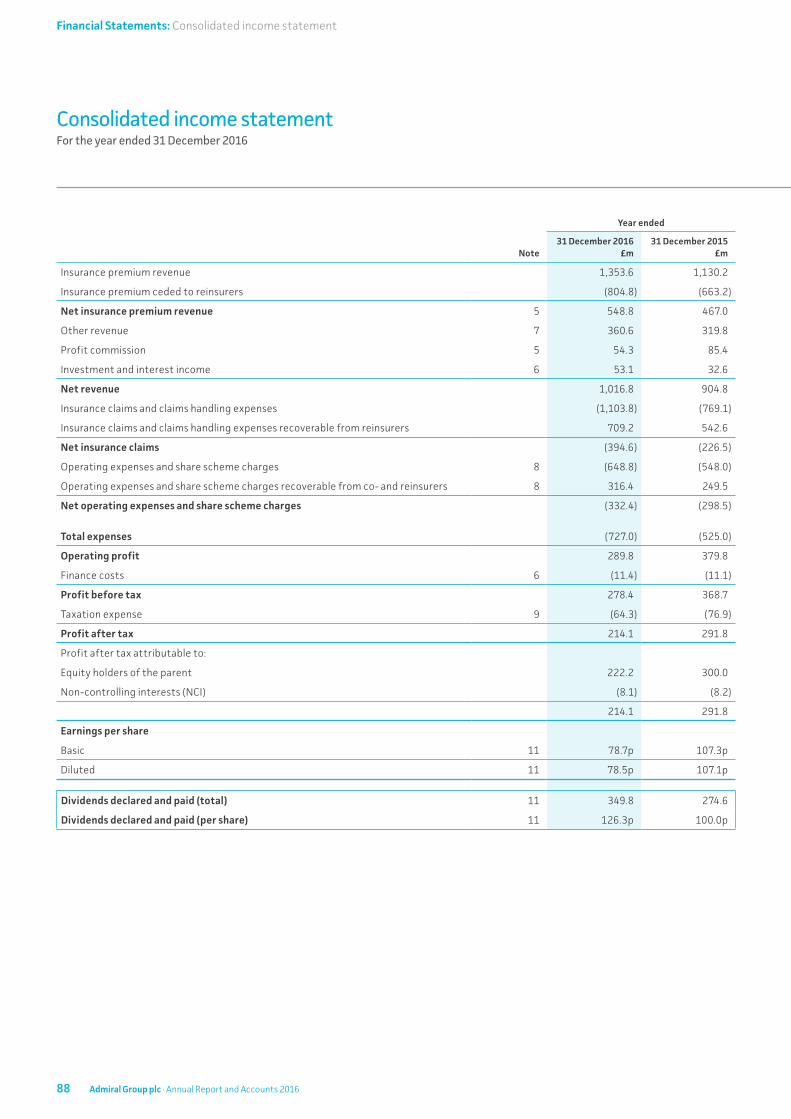
Note
Year ended
31 December 2016 £m
31 December 2015 £m
Insurance premium revenue 1,353.6 1,130.2
Insurance premium ceded to reinsurers (804.8) (663.2)
Net insurance premium revenue 5 548.8 467.0
Other revenue 7 360.6 319.8
Profit commission 5 54.3 85.4
Investment and interest income 6 53.1 32.6
Net revenue 1,016.8 904.8
Insurance claims and claims handling expenses (1,103.8) (769.1)
Insurance claims and claims handling expenses recoverable from reinsurers 709.2 542.6
Net insurance claims (394.6) (226.5)
Operating expenses and share scheme charges 8 (648.8) (548.0)
Operating expenses and share scheme charges recoverable from co- and reinsurers 8 316.4 249.5
Net operating expenses and share scheme charges (332.4) (298.5)
Total expenses (727.0) (525.0)
Operating profit 289.8 379.8
Finance costs 6 (11.4) (11.1)
Profit before tax 278.4 368.7
Taxation expense 9 (64.3) (76.9)
Profit after tax 214.1 291.8
Profit after tax attributable to:
Equity holders of the parent 222.2 300.0
Non-controlling interests (NCI) (8.1) (8.2)
214.1 291.8
Earnings per share
Basic 11 78.7p 107.3p
Diluted 11 78.5p 107.1p
Dividends declared and paid (total) 11 349.8 274.6
Dividends declared and paid (per share) 11 126.3p 100.0p
Consolidated income statementFor the year ended 31 December 2016
88 Admiral Group plc · Annual Report and Accounts 2016
Financial Statements: Consolidated income statement

Year ended
31 December 2016 £m
31 December 2015 £m
Profit for the period 214.1 291.8
Other comprehensive income
Items that are or may be reclassified to profit or loss
Movements in fair value reserve 30.3 (12.6)
Deferred tax charge in relation to movement in fair value reserve (0.5) –
Exchange differences on translation of foreign operations 21.2 2.6
Other comprehensive income for the period, net of income tax 51.0 (10.0)
Total comprehensive income for the period 265.1 281.8
Total comprehensive income for the period attributable to:
Equity holders of the parent 271.3 289.5
Non-controlling interests (6.2) (7.7)
265.1 281.8
Consolidated statement of comprehensive income For the year ended 31 December 2016
Financial Statements Additional InformationCorporate GovernanceStrategic Report Introduction
89Admiral Group plc · Annual Report and Accounts 2016

Note
As at
31 December 2016 £m
31 December 2015 £m
ASSETS
Property and equipment 10 32.0 34.9
Intangible assets 10 162.3 142.3
Deferred income tax 9 8.4 20.6
Reinsurance assets 5 1,126.4 878.7
Insurance and other receivables 6, 10 784.9 537.1
Financial investments 6 2,420.2 2,323.5
Cash and cash equivalents 6 326.6 265.3
Total assets 4,860.8 4,202.4
EQUITY
Share capital 11 0.3 0.3
Share premium account 13.1 13.1
Other reserves 51.8 2.7
Retained earnings 505.7 599.6
Total equity attributable to equity holders of the parent 570.9 615.7
Non-controlling interests 10.8 17.2
Total equity 581.7 632.9
LIABILITIES
Insurance contracts 5 2,749.5 2,295.0
Subordinated and other financial liabilities 6 224.0 223.9
Trade and other payables 6, 10 1,292.2 1,015.0
Current tax liabilities 13.4 35.6
Total liabilities 4,279.1 3,569.5
Total equity and total liabilities 4,860.8 4,202.4
The accompanying notes form part of these financial statements.
These financial statements were approved by the Board of Directors on 7 March 2017 and were signed on its behalf by:
Geraint JonesChief Financial Officer Admiral Group plc
Company Number: 03849958
Consolidated statement of financial position As at 31 December 2016
90 Admiral Group plc · Annual Report and Accounts 2016
Financial Statements: Consolidated statement of financial position

Note
Year ended
31 December 2016 £m
Restated*1 31 December 2015
£m
Profit after tax 214.1 291.8
Adjustments for non-cash items:
– Depreciation 10.5 8.2
– Amortisation of software 12.6 6.1
– Other gains and losses – 3.2
– Share scheme charges 8 33.2 29.5
– Investment and interest income 6 (53.1) (32.6)
– Finance costs 6 11.4 11.1
– Taxation expense 9 64.3 76.9
Change in gross insurance contract liabilities 454.5 197.6
Change in reinsurance assets (247.7) (48.9)
Change in insurance and other receivables (254.6) (103.5)
Change in trade and other payables, including tax and social security 279.9 47.8
Cash flows from operating activities, before movements in investments 525.1 487.2
Purchases of financial instruments (646.6) (1,011.7)
Proceeds on disposal/maturity of financial instruments 616.9 890.6
Interest and investment income received 11.6 8.6
Cash flows from operating activities, net of movements in investments 507.0 374.7
Taxation payments (76.4) (63.8)
Taxation receipts 1.8 –
Net cash flow from operating activities 432.4 310.9
Cash flows from investing activities:
Purchases of property, equipment and software (31.6) (47.8)
Net cash used in investing activities (31.6) (47.8)
Cash flows from financing activities:
Non-controlling interest capital contribution (0.2) 10.7
Proceeds on issue of financial liabilities – 20.0
Finance costs paid (11.3) (11.0)
Repayment of finance lease liabilities (3.4) (1.4)
Equity dividends paid 11 (349.8) (274.6)
Net cash used in financing activities (364.7) (256.3)
Net increase in cash and cash equivalents 36.1 6.8
Cash and cash equivalents at 1 January 265.3 255.9
Effects of changes in foreign exchange rates 25.2 2.6
Cash and cash equivalents at end of period 6 326.6 265.3
*1 Refer to note 2 for details.
Consolidated cash flow statement For the year ended 31 December 2016
Financial Statements Additional InformationCorporate GovernanceStrategic Report Introduction
91Admiral Group plc · Annual Report and Accounts 2016

Attributable to the owners of the Company
Non-controlling
interests £m
Total equity
£m
Share capital
£m
Share premium
account £m
Fair value reserve
£m
Foreign exchange
reserve £m
Retained profit and
loss £m
Total £m
At 1 January 2015 0.3 13.1 10.9 2.3 540.6 567.2 13.7 580.9
Profit/(loss) for the period – – – – 300.0 300.0 (8.2) 291.8
Other comprehensive income
Movements in fair value reserve – – (12.6) – – (12.6) – (12.6)
Currency translation differences – – – 2.1 – 2.1 0.5 2.6
Total comprehensive income for the period – – (12.6) 2.1 300.0 289.5 (7.7) 281.8
Transactions with equity holders
Dividends – – – – (274.6) (274.6) – (274.6)
Share scheme credit – – – – 29.5 29.5 – 29.5
Deferred tax credit on share scheme credit – – – – 4.7 4.7 – 4.7
Contributions by NCIs – – – – (0.1) (0.1) 10.7 10.6
Changes in ownership interests without a change in control
– – – – (0.5) (0.5) 0.5 –
Total transactions with equity holders – – – – (241.0) (241.0) 11.2 (229.8)
As at 31 December 2015 0.3 13.1 (1.7) 4.4 599.6 615.7 17.2 632.9
At 1 January 2016 0.3 13.1 (1.7) 4.4 599.6 615.7 17.2 632.9
Profit/(loss) for the period – – – – 222.2 222.2 (8.1) 214.1
Other comprehensive income
Movements in fair value reserve – – 30.3 – – 30.3 – 30.3
Deferred tax charge in relation to movement in fair value reserve
– – (0.5) – – (0.5) – (0.5)
Currency translation differences – – – 19.3 – 19.3 1.9 21.2
Total comprehensive income for the period – – 29.8 19.3 222.2 271.3 (6.2) 265.1
Transactions with equity holders
Dividends – – – – (349.8) (349.8) – (349.8)
Share scheme credit – – – – 33.2 33.2 – 33.2
Deferred tax credit on share scheme credit – – – – 0.5 0.5 – 0.5
Contributions by NCIs – – – – – – (0.2) (0.2)
Changes in ownership interests without a change in control
– – – – – – – –
Total transactions with equity holders – – – – (316.1) (316.1) (0.2) (316.3)
As at 31 December 2016 0.3 13.1 28.1 23.7 505.7 570.9 10.8 581.7
Consolidated statement of changes in equityFor the year ended 31 December 2016
92 Admiral Group plc · Annual Report and Accounts 2016
Financial Statements: Consolidated statement of changes in equity

1. General informationAdmiral Group plc is a company incorporated in England and Wales. Its registered office is at Tŷ Admiral, David Street, Cardiff, CF10 2EH and its shares are listed on the London Stock Exchange.
The consolidated financial statements have been prepared and approved by the Directors in accordance with International Financial Reporting Standards (IFRS) as adopted by the European Union (EU). The Company has elected to prepare its Parent Company financial statements in accordance with Financial Reporting Standard 101 Reduced Disclosure Framework (FRS 101).
Adoption of new and revised standardsThe Group has adopted the following IFRS and interpretations during the year, which have been issued and endorsed by the EU:
• Amendments to IFRS 10, IFRS 12 and IAS 28: Investment Entities – Applying the Consolidation Exemption
The application of these amendments has not had a material impact on the Group’s results, financial position and cash flows.
In 2016, the following standards, both with an effective date of 1 January 2018, were endorsed by the EU:
• IFRS 9 Financial Instruments; and
• IFRS 15 Revenue from Contracts with Customers
IFRS 9 – Financial Instruments
In 2014, the IASB issued the full, final version of IFRS 9. This version supersedes all previous versions. The standard has an effective date of 1 January 2018 although earlier application is permitted. The standard includes requirements relating to the recognition, measurement, impairment, de-recognition of assets along with general hedge accounting.
In late 2016, the IASB confirmed that the effective date for IFRS 17 ‘Insurance Contracts’ will be 1 January 2021, with the full standard expected to be issued during the first half of 2017. The 2021 effective date means that the timescale is in line with that specified in an amendment to IFRS 4, the existing Insurance Contracts standard, which permits the deferral of the adoption of IFRS 9 for up to three years from the 1 January 2018 effective date. The Group expects to take advantage of this deferral approach and delay its adoption of IFRS 9 until 1 January 2021 to align with the effective date of IFRS 17.
Following the issuance of the full and final version of IFRS 17, the Group plans to perform a detailed impact assessment of the implementation of IFRS 17 and IFRS 9 on its results, financial position and cash-flows during 2017.
IFRS 15 – Revenue from Contracts with Customers
IFRS 15 was issued during 2014 and applies to annual reporting periods beginning on or after 1 January 2018. The standard introduces a simple, five step principles-based model to be applied to the accounting of all contracts with customers.
Revenue from insurance contracts and financial instruments is outside the scope of the IFRS 15. The Group’s detailed assessment of the impact of the standard on its results, financial position and cash-flows is currently in progress. The primary focus of this work is the other revenue generated by a portfolio of products that supplement the core car and household insurance policies and revenue generated by the Group’s price comparison businesses. Management’s preliminary assessment of the impact of this standard is that it is not expected to have a material impact on the Group’s financial statements.
Standards yet to be endorsed by the EUThere are a number of standards, amendments to standards and interpretations that were issued by 31 December 2016 but have either yet to be endorsed by the EU, or were endorsed shortly after the year end. The following IFRSs have been issued but have not been applied by the Group in these financial statements:
• IFRS 16 Leases;
• IFRS 14 Regulatory Deferral Accounts;
• Amendments to IFRS 2, 4, 10 and 12 and IAS 7, 12, and 40;
• Annual improvements to IFRS standard 2014-2016 cycle;
• IFRIC interpretation 22.
IFRS 16 – Leases
IFRS 16 Leases was issued in early 2016. The standard specifies how firms will recognise, measure, present and disclose leases. It presents a single lessee accounting model and requires that assets and liabilities relating to leases of greater than 12 months are recognised in the Consolidated Statement of Financial Position. The standard will apply to reporting periods beginning on or after 1 January 2019.
The Group is currently assessing the impact of IFRS 16 on its results, financial position and cash flows, along with any impacts of the other standards and amendments which have yet to be endorsed.
2. Basis of preparationThe accounts have been prepared on a going concern basis. In considering this requirement, the Directors have taken into account the following:
• The Group’s projections for the next 12 months and beyond, in particular the profit forecasts, regulatory capital surpluses and levels and sources of liquidity.
• The risks included on the Group’s risk register that could impact on the Group’s financial performance, levels of liquidity and solvency over the next 12 months.
• The risks on the Group’s risk register that could be a threat to the Group’s business model and capital adequacy.
The Group’s business activities, together with the factors likely to affect its future development, performance and position are set out in the Strategic Report. The Strategic Report also includes the Group’s principal risks and uncertainties. In addition, the Governance report includes the Directors’ statement on the viability of the Group over a three year period.
Notes to the Financial StatementsFor the year ended 31 December 2016
Financial Statements Additional InformationCorporate GovernanceStrategic Report Introduction
93Admiral Group plc · Annual Report and Accounts 2016

Notes to the Financial Statements continuedFor the year ended 31 December 2016
2. Basis of preparation continuedFollowing consideration of the above, the Directors have reasonable expectation that the Group has adequate resources to continue in operation for the foreseeable future, a period not less than 12 months from the date of this report, and that it is therefore appropriate to adopt the going concern basis in preparing the financial statements.
Further information regarding the Company’s business activities, together with the factors likely to affect its future development, performance and position, is set out in the Strategic Report. Further information regarding the financial position of the Company, its cash flows, liquidity position and borrowing facilities are also described in the Strategic Report. In addition, notes 6 and 11 to the financial statements include the Company’s objectives, policies and processes for managing its capital; its financial risk management objectives; details of its financial instruments; and its exposures to credit risk and liquidity risk.
The accounting policies set out in the notes to the financial statements have, unless otherwise stated, been applied consistently to all periods presented in these Group financial statements.
The financial statements are prepared on the historical cost basis, except for the revaluation of financial assets classified as fair value through profit or loss or as available for sale. The Group and Company financial statements are presented in pounds sterling, rounded to the nearest £0.1 million.
Subsidiaries are entities controlled by the Group. The Group controls an entity when it is exposed to, or has rights to, variable returns from its involvement with the entity and has the ability to affect those returns through its power over the entity. In assessing control, the Group takes into consideration potential voting rights that are currently exercisable. The acquisition date is the date on which control is transferred to the acquirer. The financial statements of subsidiaries are included in the consolidated financial statements from the date that control commences until the date that control ceases. Losses applicable to the non-controlling interests in a subsidiary are allocated to the non-controlling interests even if doing so causes the non-controlling interests to have a deficit balance.
The preparation of financial statements in conformity with adopted IFRS requires management to make judgements, estimates and assumptions that affect the application of policies and reported amounts of assets and liabilities, income and expenses. The estimates and associated assumptions are based on historical experience and various other factors that are believed to be reasonable under the circumstances, the results of which form the basis of making the judgements about carrying values of assets and liabilities that are not readily apparent from other sources.
The estimates and underlying assumptions are reviewed on an ongoing basis. Revisions to accounting estimates are recognised in the year in which the estimate is reviewed. To the extent that a change in an accounting estimate gives rise to changes in assets and liabilities, it is recognised by adjusting the carrying amount of the related asset or liability in the period of the change.
Re-presentation of comparative information Comparative amounts within the consolidated cash flow statement relating to investments have been re-presented. Net cash flows into investments have been analysed into purchases of financial instruments and proceeds from financial instruments. Additionally, investment return and interest income on financial investments are now captured within the adjustments to profit after tax for non-cash items. There is no impact on total cash and cash equivalents or on net cash flow from operating activities for any period.
3. Critical accounting judgements and estimatesJudgementsIn applying the Group’s accounting policies as described in the notes to the financial statements, management has primarily applied judgement in the following area:
• Classification of the Group’s contracts with reinsurers as reinsurance contracts:
A contract is required to transfer significant insurance risk in order to be classified as such. Management reviews all terms and conditions of each such contract, and if necessary obtains the opinion of an independent expert at the negotiation stage in order to be able to make this judgement. All reinsurance contracts (both excess of loss and quota share contracts) held by the Group have been assessed and it has been concluded that all contracts transfer significant insurance risk and have therefore been classified and accounted for as reinsurance contracts within these financial statements.
In addition there are two further significant accounting estimates within the financial statements that also require management to apply judgement:
• Calculation of insurance claims reserves:
The Group’s reserving methodology requires management to set insurance claims reserves for the purpose of the financial statements, within a range of potential outcomes above the projected best estimate outcome, to allow for unforeseen adverse claims development. Management applies judgement in determining where, within this range of potential outcomes, the insurance claims reserves should sit. Refer to the section on estimation techniques below for further detail on the calculation of the projected best estimate outcome.
• Recognition of deferred tax assets relating to unused tax losses:
Management applies judgement in determining the probability of future taxable profits of an entity against which to utilise accumulated losses in determining the recognition of deferred tax assets. In applying this judgement, management makes an assessment of the reliability of approved business plan projections using both qualitative and quantitative factors including the age and status of the business, the Group’s previous experience in similar markets, historic performance against business plans and the application of a number of stress and sensitivity tests to the projections.
Financial Statements: Notes to the Financial Statements
94 Admiral Group plc · Annual Report and Accounts 2016
Estimation techniques used in calculation of claims provisions and profit commissionEstimation techniques are used in the calculation of the provisions for claims outstanding, which represent a projection of the ultimate cost of settling claims that have occurred prior to the balance sheet date and remain unsettled at the balance sheet date.
The key area where these techniques are used relates to the ultimate cost of reported claims. A secondary area relates to the emergence of claims that occurred prior to the balance sheet date, but had not been reported at that date.
The estimates of the ultimate cost of reported claims are based on the setting of claim provisions on a case-by-case basis, for all but the simplest of claims.
The sum of these provisions is compared with projected ultimate costs using a variety of different projection techniques (including incurred and paid chain ladder and an average cost of claim approach) to allow an actuarial assessment of their potential outcome. They include allowance for unreported claims.
The most significant sensitivity in the use of the projection techniques arises from any future step change in claims costs, which would cause future claim cost inflation to deviate from historic trends. This is most likely to arise from a change in the regulatory or judicial regime that leads to an increase in awards or legal costs for bodily injury claims that is significantly above or below the historical trend.
The Group’s independent actuarial advisors project best estimate claims reserves using a variety of recognised actuarial techniques.
As noted above, the Group’s reserving policy requires management to reserve within a range of potential outcomes above the projected best estimate outcome, to allow for unforeseen adverse claims development.
For further detail on objectives, policies and procedures for managing insurance risk, refer to note 5 of the financial statements.
Future changes in claims reserves also impact profit commission income, as the measurement of this income is dependent on the loss ratio booked in the financial statements, and cash receivable is dependent on actuarial projections of ultimate loss ratios.
4. Group consolidation and operating segments4a. Accounting policies(i) Group consolidation
The consolidated financial statements comprise the results and balances of the Company and its subsidiaries (together referred to as the Group) for the year ended 31 December 2016 and comparative figures for the year ended 31 December 2015. The financial statements of the Company’s subsidiaries are consolidated in the Group financial statements. The Company controls 100% of the voting share capital of all its principal subsidiaries, except Admiral Law Limited, BDE Law Limited, Inspop USA LLC, the indirect holding in comparenow.com Insurance Agency LLC, Rastreator.com Limited,
the indirect holding in Comparaseguros Correduría de Seguros, S.L., Sociedad Unipersonal, Preminen Price Comparison Holdings Limited, the indirect holding in Preminen Dragon Price Comparison Limited and the indirect holding in Long Yu Science and Technology (Beijing) Co. Limited.
The Parent Company financial statements present information about the Company as a separate entity and not about its Group. In accordance with IAS 24, transactions or balances between Group companies that have been eliminated on consolidation are not reported as related party transactions in the consolidated financial statements.
(ii) Foreign currency translation
Items included in the financial statements of each of the Group’s entities are measured using the currency of the primary economic environment in which the entity operates (‘the functional currency’). The consolidated financial statements are presented in pounds sterling, rounded to the nearest £0.1 million, which is the Group’s presentation currency.
Foreign currency transactions are translated into the functional currency using the exchange rates prevailing at the dates of the transactions. Foreign exchange gains and losses resulting from the settlement of such transactions and from the translation at year end exchange rates of monetary assets and liabilities denominated in foreign currencies are recognised in the income statement.
Non-monetary items measured at cost are translated at their historic rate and non-monetary items held at fair value are translated using the foreign exchange rate on the date that the fair value was established.
The financial statements of foreign operations whose functional currency is not pounds sterling are translated into the Group presentation currency (sterling) as follows:
• Assets and liabilities for each balance sheet presented are translated at the closing rate at the date of that balance sheet.
• Income and expenses for each income statement are translated at average exchange rates (unless this average is not a reasonable approximation of the cumulative effect of the rates prevailing on the transaction dates, in which case income and expenses are translated at the date of the transaction).
• All resulting exchange differences are recognised in other comprehensive income and in a separate component of equity except to the extent that the translation differences are attributable to non-controlling interests.
On disposal of a foreign operation, the cumulative amount recognised in equity relating to that particular operation is recognised in the income statement.
Financial Statements Additional InformationCorporate GovernanceStrategic Report Introduction
95Admiral Group plc · Annual Report and Accounts 2016
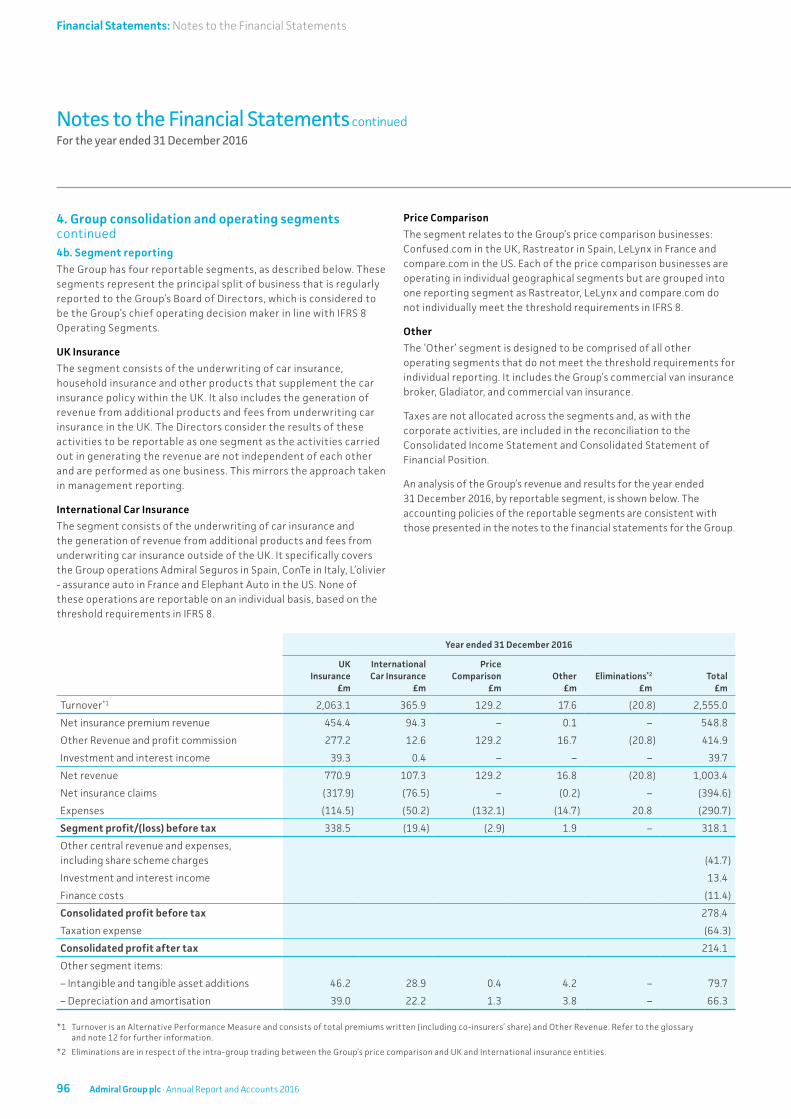
Notes to the Financial Statements continuedFor the year ended 31 December 2016
4. Group consolidation and operating segments continued4b. Segment reportingThe Group has four reportable segments, as described below. These segments represent the principal split of business that is regularly reported to the Group’s Board of Directors, which is considered to be the Group’s chief operating decision maker in line with IFRS 8 Operating Segments.
UK Insurance
The segment consists of the underwriting of car insurance, household insurance and other products that supplement the car insurance policy within the UK. It also includes the generation of revenue from additional products and fees from underwriting car insurance in the UK. The Directors consider the results of these activities to be reportable as one segment as the activities carried out in generating the revenue are not independent of each other and are performed as one business. This mirrors the approach taken in management reporting.
International Car Insurance
The segment consists of the underwriting of car insurance and the generation of revenue from additional products and fees from underwriting car insurance outside of the UK. It specifically covers the Group operations Admiral Seguros in Spain, ConTe in Italy, L’olivier - assurance auto in France and Elephant Auto in the US. None of these operations are reportable on an individual basis, based on the threshold requirements in IFRS 8.
Price Comparison
The segment relates to the Group’s price comparison businesses: Confused.com in the UK, Rastreator in Spain, LeLynx in France and compare.com in the US. Each of the price comparison businesses are operating in individual geographical segments but are grouped into one reporting segment as Rastreator, LeLynx and compare.com do not individually meet the threshold requirements in IFRS 8.
Other
The ‘Other’ segment is designed to be comprised of all other operating segments that do not meet the threshold requirements for individual reporting. It includes the Group’s commercial van insurance broker, Gladiator, and commercial van insurance.
Taxes are not allocated across the segments and, as with the corporate activities, are included in the reconciliation to the Consolidated Income Statement and Consolidated Statement of Financial Position.
An analysis of the Group’s revenue and results for the year ended 31 December 2016, by reportable segment, is shown below. The accounting policies of the reportable segments are consistent with those presented in the notes to the financial statements for the Group.
Year ended 31 December 2016
UK Insurance
£m
International Car Insurance
£m
Price Comparison
£mOther
£mEliminations*2
£mTotal
£m
Turnover*1 2,063.1 365.9 129.2 17.6 (20.8) 2,555.0
Net insurance premium revenue 454.4 94.3 – 0.1 – 548.8
Other Revenue and profit commission 277.2 12.6 129.2 16.7 (20.8) 414.9
Investment and interest income 39.3 0.4 – – – 39.7
Net revenue 770.9 107.3 129.2 16.8 (20.8) 1,003.4
Net insurance claims (317.9) (76.5) – (0.2) – (394.6)
Expenses (114.5) (50.2) (132.1) (14.7) 20.8 (290.7)
Segment profit/(loss) before tax 338.5 (19.4) (2.9) 1.9 – 318.1
Other central revenue and expenses, including share scheme charges (41.7)
Investment and interest income 13.4
Finance costs (11.4)
Consolidated profit before tax 278.4
Taxation expense (64.3)
Consolidated profit after tax 214.1
Other segment items:
– Intangible and tangible asset additions 46.2 28.9 0.4 4.2 – 79.7
– Depreciation and amortisation 39.0 22.2 1.3 3.8 – 66.3
*1 Turnover is an Alternative Performance Measure and consists of total premiums written (including co-insurers’ share) and Other Revenue. Refer to the glossary and note 12 for further information.
*2 Eliminations are in respect of the intra-group trading between the Group’s price comparison and UK and International insurance entities.
Financial Statements: Notes to the Financial Statements
96 Admiral Group plc · Annual Report and Accounts 2016
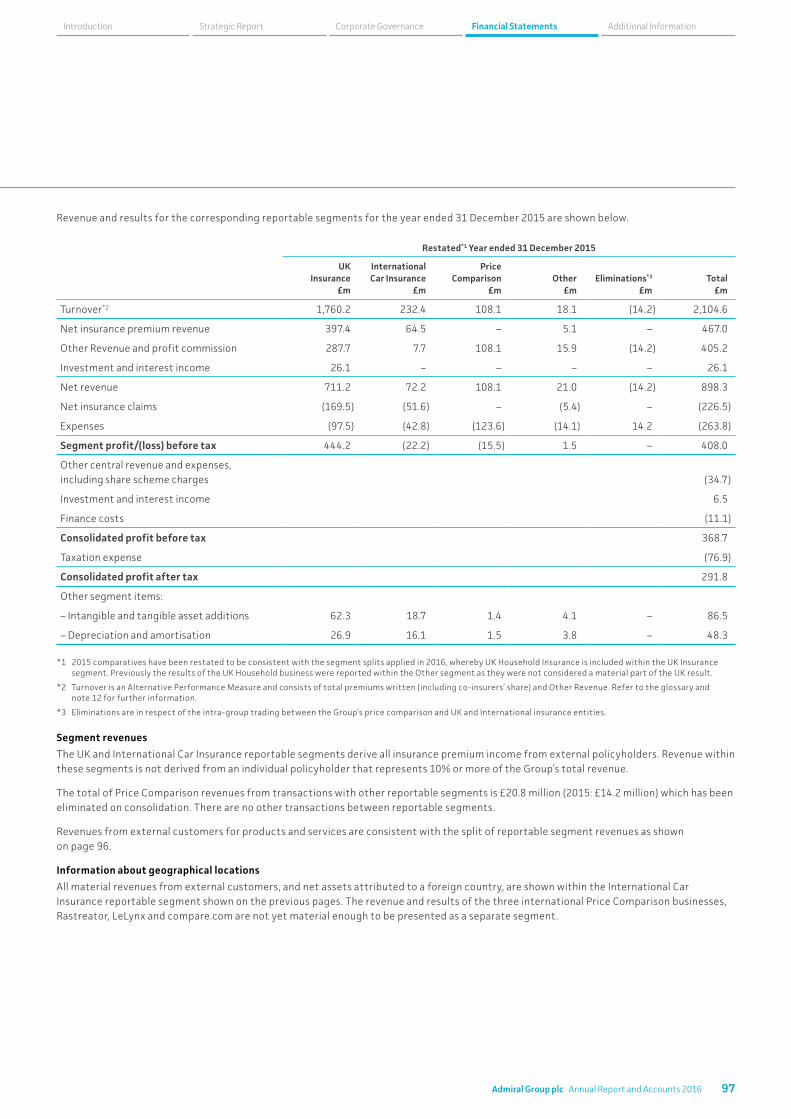
Revenue and results for the corresponding reportable segments for the year ended 31 December 2015 are shown below.
Restated*1 Year ended 31 December 2015
UK Insurance
£m
International Car Insurance
£m
Price Comparison
£mOther
£mEliminations*3
£mTotal
£m
Turnover*2 1,760.2 232.4 108.1 18.1 (14.2) 2,104.6
Net insurance premium revenue 397.4 64.5 – 5.1 – 467.0
Other Revenue and profit commission 287.7 7.7 108.1 15.9 (14.2) 405.2
Investment and interest income 26.1 – – – – 26.1
Net revenue 711.2 72.2 108.1 21.0 (14.2) 898.3
Net insurance claims (169.5) (51.6) – (5.4) – (226.5)
Expenses (97.5) (42.8) (123.6) (14.1) 14.2 (263.8)
Segment profit/(loss) before tax 444.2 (22.2) (15.5) 1.5 – 408.0
Other central revenue and expenses, including share scheme charges (34.7)
Investment and interest income 6.5
Finance costs (11.1)
Consolidated profit before tax 368.7
Taxation expense (76.9)
Consolidated profit after tax 291.8
Other segment items:
– Intangible and tangible asset additions 62.3 18.7 1.4 4.1 – 86.5
– Depreciation and amortisation 26.9 16.1 1.5 3.8 – 48.3
*1 2015 comparatives have been restated to be consistent with the segment splits applied in 2016, whereby UK Household Insurance is included within the UK Insurance segment. Previously the results of the UK Household business were reported within the Other segment as they were not considered a material part of the UK result.
*2 Turnover is an Alternative Performance Measure and consists of total premiums written (including co-insurers’ share) and Other Revenue. Refer to the glossary and note 12 for further information.
*3 Eliminations are in respect of the intra-group trading between the Group’s price comparison and UK and International insurance entities.
Segment revenues
The UK and International Car Insurance reportable segments derive all insurance premium income from external policyholders. Revenue within these segments is not derived from an individual policyholder that represents 10% or more of the Group’s total revenue.
The total of Price Comparison revenues from transactions with other reportable segments is £20.8 million (2015: £14.2 million) which has been eliminated on consolidation. There are no other transactions between reportable segments.
Revenues from external customers for products and services are consistent with the split of reportable segment revenues as shown on page 96.
Information about geographical locations
All material revenues from external customers, and net assets attributed to a foreign country, are shown within the International Car Insurance reportable segment shown on the previous pages. The revenue and results of the three international Price Comparison businesses, Rastreator, LeLynx and compare.com are not yet material enough to be presented as a separate segment.
Financial Statements Additional InformationCorporate GovernanceStrategic Report Introduction
97Admiral Group plc · Annual Report and Accounts 2016

Notes to the Financial Statements continuedFor the year ended 31 December 2016
4. Group consolidation and operating segments continued4b. Segment reporting continuedSegment assets and liabilities
The identifiable segment assets and liabilities at 31 December 2016 are as follows:
As at 31 December 2016
UK Insurance
£m
International Car Insurance
£m
Price Comparison
£mOther
£mEliminations
£mTotal
£m
Property and equipment 26.8 4.0 1.2 – – 32.0
Intangible assets 73.8 23.0 1.8 63.7 – 162.3
Reinsurance assets 881.4 244.7 – 0.3 – 1,126.4
Insurance and other receivables 890.3 132.8 14.8 (185.6) (67.4) 784.9
Financial investments 2,145.0 45.6 12.2 – – 2,202.8
Cash and cash equivalents 178.0 100.6 33.0 8.0 – 319.6
Reportable segment assets 4,195.3 550.7 63.0 (113.6) (67.4) 4,628.0
Insurance contract liabilities 2,359.9 385.4 – 4.2 – 2,749.5
Trade and other payables 1,147.7 122.1 11.3 11.1 – 1,292.2
Reportable segment liabilities 3,507.6 507.5 11.3 15.3 – 4,041.7
Reportable segment net assets 687.7 43.2 51.7 (128.9) (67.4) 586.3
Unallocated assets and liabilities (4.6)
Consolidated net assets 581.7
Unallocated assets and liabilities consist of other central assets and liabilities, plus deferred and current corporation tax balances. These assets and liabilities are not regularly reviewed by the Board of Directors in the reportable segment format.
There is an asymmetrical allocation of assets and income to the reportable segments, in that the interest earned on cash and cash equivalent assets deployed in the UK Insurance, Price Comparison and International Car Insurance segments is not allocated in arriving at segment profits. This is consistent with regular reporting to the Board of Directors.
Eliminations represent inter-segment funding and balances included in insurance and other receivables.
The segment assets and liabilities at 31 December 2015 are as follows:
Restated*1 As at 31 December 2015
UK Insurance
£m
International Car Insurance
£m
Price Comparison
£mOther
£mEliminations
£mTotal
£m
Property and equipment 30.6 3.0 1.3 – – 34.9
Intangible assets 62.1 14.2 2.3 63.7 – 142.3
Reinsurance assets 719.4 159.0 – 0.3 – 878.7
Insurance and other receivables 576.6 41.5 19.2 (25.4) (74.8) 537.1
Financial investments 2,042.4 43.2 – – – 2,085.6
Cash and cash equivalents 93.8 94.3 59.5 11.8 – 259.4
Reportable segment assets 3,524.9 355.2 82.3 50.4 (74.8) 3,938.0
Insurance contract liabilities 2,031.6 257.3 – 6.1 – 2,295.0
Trade and other payables 939.5 55.5 9.1 10.9 – 1,015.0
Reportable segment liabilities 2,971.1 312.8 9.1 17.0 – 3,310.0
Reportable segment net assets 553.8 42.4 73.2 33.4 (74.8) 628.0
Unallocated assets and liabilities 4.9
Consolidated net assets 632.9
*1 2015 comparatives have been restated to be consistent with the segment splits applied in 2016, whereby UK Household Insurance is included within the UK Insurance segment. Previously the results of the UK Household business were reported within the Other segment as they were not considered a material part of the UK result.
Financial Statements: Notes to the Financial Statements
98 Admiral Group plc · Annual Report and Accounts 2016

5. Premium, claims and profit commissions 5a. Accounting policies(i) Revenue – premiums
Premiums relating to insurance contracts are recognised as revenue, net of insurance premium tax, proportionally over the period of cover. Premiums with an inception date after the end of the period are held in the statement of financial position as deferred revenue. Outstanding collections from policyholders are recognised within policyholder receivables.
(ii) Revenue – profit commission
Under some of the co-insurance and reinsurance contracts under which premiums are shared or ceded, profit commission may be earned on a particular year of account, which is usually subject to performance criteria such as loss ratios and expense ratios. The commission is dependent on the ultimate outcome of any year, with revenue being recognised when loss and expense ratios used in the preparation of the financial statements move below a contractual threshold. Profit commission receivable from reinsurance contracts is accounted for in line with IFRS 4, whereas profit commission receivable from co-insurance contracts is in line with IAS 18.
(iii) Insurance contracts and reinsurance assets
Premiums
The proportion of premium receivable on in-force policies relating to unexpired risks is reported in insurance contract liabilities and reinsurance assets as the unearned premium provision – gross and reinsurers’ share respectively.
Claims
Claims and claims handling expenses are charged as incurred, based on the estimated direct and indirect costs of settling all liabilities arising on events occurring up to the balance sheet date.
The provision for claims outstanding comprises provisions for the estimated cost of settling all claims incurred but unpaid at the balance sheet date, whether reported or not. Anticipated reinsurance recoveries are disclosed separately as assets.
Whilst the Directors consider that the gross provisions for claims and the related reinsurance recoveries are fairly stated on the basis of the information currently available to them, the ultimate liability will vary as a result of subsequent information and events and may result in significant adjustments to the amounts provided.
Adjustments to the amounts of claims provisions established in prior years are reflected in the income statement for the period in which the adjustments are made and disclosed separately if material. The methods used, and the estimates made, are reviewed regularly.
Provision for unexpired risks is made where necessary for the estimated amount required over and above unearned premiums (net of deferred acquisition costs) to meet future claims and related expenses.
Co-insurance
The Group has entered into certain co-insurance contracts under which insurance risks are shared on a proportional basis, with the co-insurer taking a specific percentage of premium written and being responsible for the same proportion of each claim. The co-insurer therefore takes direct insurance risk from the policyholder and is subsequently directly responsible to the claimant for its proportion of the claim. As the contractual liability is several and not joint, neither the premiums nor claims relating to the co-insurance are included in the income statement. Under the terms of these agreements the co-insurers reimburse the Group for the same proportionate share of the costs of acquiring and administering the business.
Reinsurance assets
Contracts entered into by the Group with reinsurers under which the Group is compensated for losses on the insurance contracts issued by the Group are classified as reinsurance contracts. A contract is only accounted for as a reinsurance contract where there is significant insurance risk transfer between the insured and the insurer.
Reinsurance assets are comprised of balances due from reinsurance companies for ceded insurance liabilities. Amounts recoverable from reinsurers are estimated in a consistent manner with the outstanding claims provisions or settled claims associated with the reinsured policies and in accordance with the relevant reinsurance contract.
The Group assesses its reinsurance assets for impairment on a regular basis, and in detail every six months. If there is objective evidence that the asset is impaired, then the carrying value will be written down to its recoverable amount.
On the commutation of reinsurance contracts, the reinsurer is discharged from all obligations relating to the contract. Reinsurance assets and liabilities relating to the commuted contracts are settled in the period in which the commutation agreement is signed.
.
Financial Statements Additional InformationCorporate GovernanceStrategic Report Introduction
99Admiral Group plc · Annual Report and Accounts 2016

Notes to the Financial Statements continuedFor the year ended 31 December 2016
5. Premium, claims and profit commissions continued5b. Net insurance premium revenue
31 December 2016 £m
31 December 2015 £m
Total motor insurance premiums written before co-insurance 2,193.9 1,805.2
Gross premiums written after co-insurance 1,482.0 1,199.9
Outwards reinsurance premiums (883.6) (709.8)
Net insurance premiums written 598.4 490.1
Change in gross unearned premium provision (128.4) (69.7)
Change in reinsurers’ share of unearned premium provision 78.8 46.6
Net insurance premium revenue 548.8 467.0
The Group’s share of its insurance business was underwritten by Admiral Insurance (Gibraltar) Limited, Admiral Insurance Company Limited and Elephant Insurance Company. All contracts are short term in duration, lasting for 10 or 12 months.
5c. Profit commission
31 December 2016 £m
31 December 2015 £m
Underwriting year (UK car only)
2011 and prior 16.7 31.4
2012 9.6 36.9
2013 26.4 16.9
2014 – –
2015 – –
2016 – –
Total UK Car profit commission*1 52.7 85.2
Underwriting year (UK Household only)
2014 and prior – –
2015 0.7 0.2
2016 0.9 –
Total UK Household profit commission*1 1.6 0.2
Total profit commission 54.3 85.4
*1 Profit commission for the UK Car business relates solely to co-insurance arrangements and profit commission for the UK Household business relates solely to reinsurance arrangements.
5d. Reinsurance assets and insurance contract liabilities (i) Objectives, policies and procedures for the management of insurance risk
The Group’s primary business is the issuance of insurance contracts that transfer risk from policyholders to the Group and its co-insurance partners.
Insurance risk involves uncertainty over the occurrence, amount or timing of claims arising on insurance contracts issued. It is primarily comprised of Reserve risk; the risk that the value of insurance liabilities established is insufficient to cover the ultimate cost of claims incurred at the balance sheet date, and Premium risk; the risk that the claims experience on business written but not earned is higher than allowed for in the premiums charged to policyholders.
The Board of Directors is responsible for the management of insurance risk, although as mentioned in note 6, it has delegated the detailed oversight of risk management to the Group Risk Committee.
Financial Statements: Notes to the Financial Statements
100 Admiral Group plc · Annual Report and Accounts 2016

The Group also has a Reserving Committee which comprises senior managers within the finance, claims, pricing and actuarial functions. The Reserving Committee primarily recommends the approach for UK Car Insurance reserving but also reviews the systems and controls in place to support accurate reserving and material reserving issues such as Periodic Payment Order (PPO) and claims inflation, which represent the key uncertainties in the amount or timing of claims settlements.
The Board implements certain policies in order to mitigate and control the level of insurance risk accepted by the Group. These include pricing policies and claims management and administration processes, in addition to reserving policies and co- and reinsurance arrangements as detailed below.
Reserve Risk
Reserving risk is mitigated through a series of processes and controls. The key processes are as follows:
• Regular management and internal actuarial review of individual and aggregate case claim reserves, including regular reporting of management information and exception reporting of significant movements;
• Regular management and internal actuarial review of large claims, including claims settled or potentially settled by PPOs for which the uncertainty is increased by factors such as the lifetime of the claimant and movements in the indexation for the cost of future care of the claimant;
• Bi-annual external actuarial review of best estimate claims reserves using a variety of recognised actuarial techniques;
• Internal actuarial analysis of reserve uncertainty through qualitative analysis, scenario testing and a range of stochastic reserving techniques;
• Ad hoc external reviews of reserving related processes and assumptions;
• Use of a reserving methodology which informs management’s reserving decisions for the purposes of the Group’s financial statements. As described in note 3, critical accounting judgements and estimates, the methodology determines that reserves should be set within a range above projected best estimate outcomes to allow for unforeseen adverse claims development.
As noted in the Strategic Report, the Group shares a significant amount of the motor insurance business generated with external underwriters. In 2016, 40% of the UK car insurance risk was shared under a co-insurance contract, under which the primary risk is borne by the co-insurer. A further 35% of the UK risk was ceded under quota share reinsurance contracts. Co-insurance and reinsurance contracts are also used in the International Car Insurance businesses. Further detail can be found in the Strategic Report.
As well as these proportional arrangements, an excess of loss reinsurance programme is also purchased to protect the Group against very large individual claims and catastrophe losses.
Premium Risk
As noted above, the Group defines Premium risk as the risk that claims cost on business written but not yet earned is higher than allowed for in the premiums charged to policyholders. This also includes catastrophe risk; the risk of incurring significant losses as a result of the occurrence of manmade catastrophe or natural weather events.
Key processes and controls operating to mitigate premium risk are as follows:
• Experienced and focused senior management and teams in relevant business areas including pricing and claims management;
• A data-driven and analytical approach to regular monitoring of claims and underwriting performance;
• Capability to identify and resolve underperformance promptly through changes to key performance drivers, in particular pricing.
In addition, as mentioned above, an excess of loss reinsurance programme is also purchased to protect the Group against very large individual claims and catastrophe losses.
Other elements of insurance risk include reinsurance risk; the risk of placement of ineffective reinsurance arrangements, or the economic risk of reduced availability of co-insurance and reinsurance arrangements in future periods.
The Group mitigates these risks by ensuring that it has a diverse range of financially secure reinsurance partners, including a long term relationship with Munich Re and a number of other high profile reinsurers.
Concentration of insurance risk
The Directors do not believe there are significant concentrations of insurance risk. This is because, although the Group has historically written only one significant line of UK insurance business, the risks are spread across a large number of people and a wide regional base. The introduction of the international car insurance businesses in recent years and the launch of UK household business in 2012 will further contribute to the diversification of the Group’s insurance risk as these businesses grow.
Financial Statements Additional InformationCorporate GovernanceStrategic Report Introduction
101Admiral Group plc · Annual Report and Accounts 2016

Notes to the Financial Statements continuedFor the year ended 31 December 2016
5. Premium, claims and profit commissions continued5d. Reinsurance assets and insurance contract liabilities continued(ii) Event after the reporting period – Ogden discount rate change
On 27 February 2017, the Lord Chancellor announced a change in the Ogden discount rate, which is used in the calculation of personal injury claims compensation in the UK. The change reduced the discount rate from 2.5% to minus 0.75%. This change has been reflected in the gross and reinsurers' share of insurance liabilities reported in these financial statements. Refer to the following section for sensitivities in this key assumption.
(iii) Sensitivity of recognised amounts to changes in assumptions
Ogden discount rate
As noted above, the gross and reinsurers share of insurance liabilities in these financial statements are prepared on the basis of an Ogden discount rate of minus 0.75%. On 27 February 2017, the Lord Chancellor also announced a consultation that considers options for reform in the setting of this rate, resulting in potential for further changes in the rate.
The sensitivity of a change in this assumption by 75 basis points (both an increase and decrease) is shown in the table below. The impact is presented is the total impact of the change on the Group’s pre-tax profit on an ultimate basis. It should be noted that not all of the ultimate impact would necessarily be recognised immediately.
2016Gross
£m
2016Net£m
Impact of increase in assumed Ogden discount rate of 75 basis points (to 0%) 125.7 68.7
Impact of decrease in assumed Ogden discount rate of 75 basis points (to minus 1.5%) (198.1) (102.1)
The net impacts are stated net of co-insurance and reinsurance and include the impact on net insurance claims along with the associated profit commission movements that result from the change in the Ogden rate.
Underwriting year loss ratios – UK Car Insurance
In addition to the sensitivity above, the following table sets out the impact on equity and post-tax profit or loss at 31 December 2016 that would result from a 1% movement (both increase and decrease) in the UK Car insurance loss ratios used for each underwriting year for which material amounts remain outstanding.
Underwriting year
2013 2014 2015 2016
Booked loss ratio 70% 84% 87% 88%
Impact of 1% change (£m) 11.4 6.8 3.0 1.8
As above, the impact is stated net of reinsurance and includes the change in net insurance claims along with the associated profit commission movements that result from changes in loss ratios. The figures are stated net of tax at the current rate.
Financial Statements: Notes to the Financial Statements
102 Admiral Group plc · Annual Report and Accounts 2016

(iv) Analysis of recognised amounts
31 December 2016 £m
31 December 2015 £m
Gross
Claims outstanding*1 2,030.8 1,725.0
Unearned premium provision 718.7 570.0
Total gross insurance liabilities 2,749.5 2,295.0
Recoverable from reinsurers
Claims outstanding 701.6 544.8
Unearned premium provision 424.8 333.9
Total reinsurers’ share of insurance liabilities 1,126.4 878.7
Net
Claims outstanding 1,329.2 1,180.2
Unearned premium provision 293.9 236.1
Total insurance liabilities – net 1,623.1 1,416.3
*1 Gross claims outstanding at 31 December 2016 is presented before the deduction of salvage and subrogation recoveries totalling £37.7 million.
The maturity profile of gross insurance liabilities at the end of 2016 is as follows:
< 1 year £m
1–3 years £m
> 3 years £m
Claims outstanding 754.4 700.1 576.3
Unearned premium provision 718.7 – –
Total gross insurance liabilities 1,473.1 700.1 576.3
The maturity profile of gross insurance liabilities at the end of 2015 was as follows:
Restated*1
< 1 year £m
1–3 years £m
> 3 years £m
Claims outstanding 503.5 492.0 729.5
Unearned premium provision 570.0 – –
Total gross insurance liabilities 1,073.5 492.0 729.5
*1 Maturity profile for 2015 has been restated to recognise the maturity of the unearned premium provision within 1 year. The analysis presented previously presented the maturity of claims liabilities expected to arise from the provision.
Financial Statements Additional InformationCorporate GovernanceStrategic Report Introduction
103Admiral Group plc · Annual Report and Accounts 2016

Notes to the Financial Statements continuedFor the year ended 31 December 2016
5. Premium, claims and profit commissions continued5d. Reinsurance assets and insurance contract liabilities continued(v) Analysis of claims incurred
The following tables illustrate the development of gross and net UK Insurance and International Insurance claims incurred for the past ten financial periods, including the impact of re-estimation of claims provisions at the end of each financial year. The first table shows actual gross claims incurred and the second shows actual net claims incurred. Figures are presented on an underwriting year basis.
Analysis of claims incurred (gross amounts)
Financial year ended 31 December
2007 £m
2008 £m
2009 £m
2010 £m
2011 £m
2012 £m
2013 £m
2014 £m
2015 £m
2016 £m
Total £m
Underwriting year (UK Insurance)
2007 and prior (158.5) (33.2) 32.0 5.0 8.5 (0.5) (0.6) 0.0 (2.9) (2.7)
2008 – (146.4) (94.5) 16.8 4.6 (1.5) (0.6) 1.2 0.0 (0.5) (220.9)
2009 – – (176.8) (121.7) (6.0) (3.6) 6.2 7.3 0.0 3.2 (291.4)
2010 – – – (260.4) (257.2) 9.8 36.7 19.5 13.5 4.1 (434.0)
2011 – – – – (444.3) (329.7) 43.3 51.4 47.9 (0.9) (632.3)
2012 – – – – – (463.7) (334.7) 49.8 69.2 8.6 (670.8)
2013 – – – – – – (431.1) (325.5) 53.6 44.4 (658.6)
2014 – – – – – – – (438.2) (347.1) 25.6 (759.7)
2015 – – – – – – – – (428.4) (411.2) (839.6)
2016 – – – – – – – – – (529.4) (529.4)
UK Insurance gross claims incurred
(158.5) (179.6) (239.3) (360.3) (694.4) (789.2) (680.8) (634.5) (594.2) (858.8)
Underwriting year (International Insurance)
2007 and prior (7.9) (12.4) 0.3 0.1 (0.1) (0.1) (0.1) 0.0 0.0 0.0
2008 – (11.1) (12.7) (0.4) (0.6) (0.4) (0.2) 0.2 0.1 0.1 (25.0)
2009 – – (10.8) (13.9) (3.1) (3.9) 0.1 1.4 0.2 0.0 (30.0)
2010 – – – (17.6) (26.1) (7.1) 0.1 3.5 1.0 0.5 (45.7)
2011 – – – – (35.7) (42.7) 1.2 5.7 1.7 4.0 (65.8)
2012 – – – – – (58.0) (53.7) 0.7 4.0 6.0 (101.0)
2013 – – – – – – (68.2) (57.8) 4.2 7.7 (114.1)
2014 – – – – – – – (85.2) (65.5) 4.4 (146.3)
2015 – – – – – – – – (92.6) (101.6) (194.2)
2016 – – – – – – – – – (138.9) (138.9)
International Insurance gross claims incurred
(7.9) (23.5) (23.2) (31.8) (65.6) (112.2) (120.8) (131.5) (146.9) (217.8)
Other gross claims incurred 0.0 (2.9) (10.5) (7.6) 0.0 (1.7) (2.2) (7.1) (5.4) (0.1)
Claims handling costs (6.2) (7.8) (10.1) (17.0) (25.9) (26.0) (22.9) (21.4) (22.6) (27.1)
Total gross claims incurred (172.6) (213.8) (283.1) (416.7) (785.9) (929.1) (826.7) (794.5) (769.1) (1,103.8)
Financial Statements: Notes to the Financial Statements
104 Admiral Group plc · Annual Report and Accounts 2016

Analysis of claims incurred (net amounts)
Financial year ended 31 December
2007 £m
2008 £m
2009 £m
2010 £m
2011 £m
2012 £m
2013 £m
2014 £m
2015 £m
2016 £m
Total £m
Underwriting year (UK Insurance)
2007 and prior (93.5) (10.9) 22.2 2.9 8.9 (0.5) (0.6) 0.0 (2.9) (1.2)
2008 – (89.5) (57.7) 10.2 4.6 (1.5) (0.6) 1.2 0.0 1.6 (131.7)
2009 – – (96.9) (67.0) (4.8) (3.6) 6.2 7.3 0.0 4.8 (154.0)
2010 – – – (130.2) (128.6) 8.4 36.7 19.5 13.5 8.8 (171.9)
2011 – – – – (203.7) (151.1) 39.7 51.4 47.9 8.4 (207.4)
2012 – – – – – (196.0) (139.3) 49.8 69.2 19.4 (196.9)
2013 – – – – – – (184.4) (135.0) 38.4 49.3 (231.5)
2014 – – – – – – – (187.0) (144.1) (16.4) (347.7)
2015 – – – – – – – – (182.1) (162.0) (344.1)
2016 – – – – – – – – – (219.4) (219.4)
UK Insurance net claims incurred
(93.5) (100.4) (132.4) (184.1) (323.6) (344.3) (242.3) (192.8) (160.1) (306.7)
Underwriting year (International Insurance)
2007 and prior (2.8) (4.3) 0.0 0.0 (0.1) 0.0 0.0 0.0 0.0 0.0
2008 – (3.9) (4.8) (0.1) (0.2) (0.2) (0.1) 0.1 0.0 0.0 (9.2)
2009 – – (4.4) (5.6) (1.6) (2.0) 0.0 0.7 0.1 0.0 (12.8)
2010 – – – (7.1) (11.5) (3.5) 0.0 1.7 0.5 0.2 (19.7)
2011 – – – – (14.9) (18.7) 0.4 2.9 0.8 2.0 (27.5)
2012 – – – – – (24.2) (22.8) (0.8) 2.0 2.2 (43.6)
2013 – – – – – – (26.6) (23.5) 1.7 4.8 (43.6)
2014 – – – – – – – (31.6) (23.3) 1.8 (53.1)
2015 – – – – – – – – (33.4) (39.6) (73.0)
2016 – – – – – – – – – (47.9) (47.9)
International Insurance net claims incurred
(2.8) (8.2) (9.2) (12.8) (28.3) (48.6) (49.1) (50.5) (51.6) (76.5)
Other net claims incurred 0.0 (1.3) (4.4) (3.1) 0.0 (0.8) (2.1) (6.9) (5.4) (0.2)
Claims handling costs (3.5) (4.7) (5.7) (8.5) (11.9) (10.8) (9.5) (8.9) (9.4) (11.2)
Total net claims incurred (99.8) (114.6) (151.7) (208.5) (363.8) (404.5) (303.0) (259.1) (226.5) (394.6)
The table below shows the development of UK Car Insurance loss ratios for the past five financial periods, presented on an underwriting year basis.
UK Car Insurance loss ratio development
Financial year ended 31 December
2012 2013 2014 2015 2016
Underwriting year (UK car only)
2012 84% 78% 73% 66% 64%
2013 – 85% 82% 76% 70%
2014 – – 92% 89% 84%
2015 – – – 87% 87%
2016 – – – – 88%
Financial Statements Additional InformationCorporate GovernanceStrategic Report Introduction
105Admiral Group plc · Annual Report and Accounts 2016

Notes to the Financial Statements continuedFor the year ended 31 December 2016
5. Premium, claims and profit commissions continued5d. Reinsurance assets and insurance contract liabilities continued(vi) Analysis of claims reserve releases
The following table analyses the impact of movements in prior year claims provisions on a gross and net basis. Figures are presented on an underwriting year basis.
Gross
Financial year ended 31 December
2012 £m
2013 £m
2014 £m
2015 £m
2016 £m
Underwriting year (UK Insurance)
2012 and prior 36.2 115.8 129.7 128.3 41.7
2013 – – 18.4 53.4 49.3
2014 – – – 16.0 42.8
2015 – – – – 1.9
Total gross release (UK Insurance) 36.2 115.8 148.1 197.7 135.7
Total gross release (International Insurance) – – 12.6 14.0 21.0
Total gross release 36.2 115.8 160.7 211.7 156.7
Net
Financial year ended 31 December
2012 £m
2013 £m
2014 £m
2015 £m
2016 £m
Underwriting year (UK Insurance)
2012 and prior 17.6 94.2 129.7 128.3 41.7
2013 – – 7.7 38.4 49.3
2014 – – – 6.7 (16.4)
2015 – – – – 0.8
Total net release (UK Insurance) 17.6 94.2 137.4 173.4 75.4
Total net release (International Insurance) – – 6.3 6.5 9.9
Total net release 17.6 94.2 143.7 179.9 85.3
Analysis of net releases on UK Insurance:
– Net releases on Admiral net share 16.3 53.3 66.8 84.6 58.3
– Releases on commuted quota share reinsurance contracts 1.3 40.9 70.6 88.8 17.1
Total net release as above 17.6 94.2 137.4 173.4 75.4
Admiral typically commutes quota share reinsurance contracts in its UK Car Insurance business 24 or 36 months following the start of the underwriting year. After commutation, any changes in claims costs on the commuted proportion of the business are reflected within claims costs and are separately analysed here. Releases on commuted quota share contracts are analysed by underwriting year as follows:
Financial year ended 31 December
2012 £m
2013 £m
2014 £m
2015 £m
2016 £m
Underwriting year
2012 and prior 1.3 40.9 70.6 72.5 22.6
2013 – – – 16.3 28.8
2014 – – – – (34.3)
2015 – – – – –
Total releases on commuted quota share reinsurance contracts 1.3 40.9 70.6 88.8 17.1
Included within releases on commuted quota share contracts are accruals for additional reserves arising from the commutation of 2014 year UK motor quota share contracts. Refer to the business review earlier in this report for further detail.
Profit commission is analysed in note 5c.
Financial Statements: Notes to the Financial Statements
106 Admiral Group plc · Annual Report and Accounts 2016
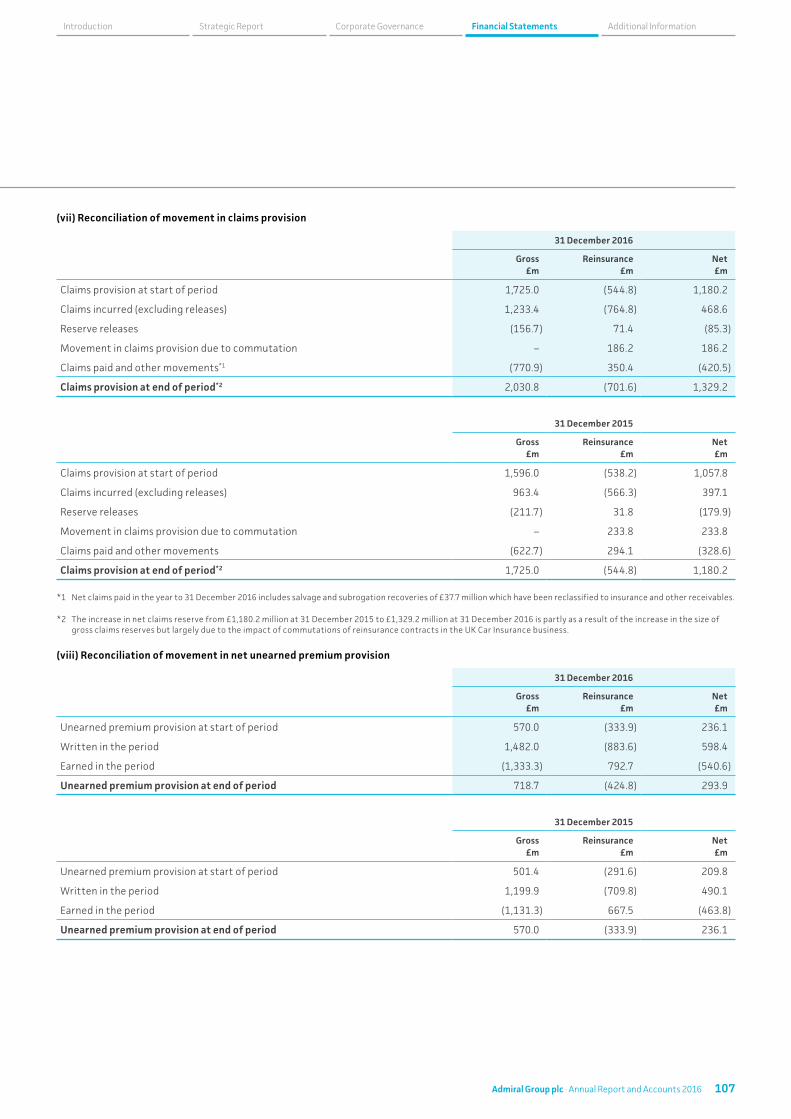
(vii) Reconciliation of movement in claims provision
31 December 2016
Gross £m
Reinsurance £m
Net £m
Claims provision at start of period 1,725.0 (544.8) 1,180.2
Claims incurred (excluding releases) 1,233.4 (764.8) 468.6
Reserve releases (156.7) 71.4 (85.3)
Movement in claims provision due to commutation – 186.2 186.2
Claims paid and other movements*1 (770.9) 350.4 (420.5)
Claims provision at end of period*2 2,030.8 (701.6) 1,329.2
31 December 2015
Gross £m
Reinsurance £m
Net £m
Claims provision at start of period 1,596.0 (538.2) 1,057.8
Claims incurred (excluding releases) 963.4 (566.3) 397.1
Reserve releases (211.7) 31.8 (179.9)
Movement in claims provision due to commutation – 233.8 233.8
Claims paid and other movements (622.7) 294.1 (328.6)
Claims provision at end of period*2 1,725.0 (544.8) 1,180.2
*1 Net claims paid in the year to 31 December 2016 includes salvage and subrogation recoveries of £37.7 million which have been reclassified to insurance and other receivables.
*2 The increase in net claims reserve from £1,180.2 million at 31 December 2015 to £1,329.2 million at 31 December 2016 is partly as a result of the increase in the size of gross claims reserves but largely due to the impact of commutations of reinsurance contracts in the UK Car Insurance business.
(viii) Reconciliation of movement in net unearned premium provision
31 December 2016
Gross £m
Reinsurance £m
Net £m
Unearned premium provision at start of period 570.0 (333.9) 236.1
Written in the period 1,482.0 (883.6) 598.4
Earned in the period (1,333.3) 792.7 (540.6)
Unearned premium provision at end of period 718.7 (424.8) 293.9
31 December 2015
Gross £m
Reinsurance £m
Net £m
Unearned premium provision at start of period 501.4 (291.6) 209.8
Written in the period 1,199.9 (709.8) 490.1
Earned in the period (1,131.3) 667.5 (463.8)
Unearned premium provision at end of period 570.0 (333.9) 236.1
Financial Statements Additional InformationCorporate GovernanceStrategic Report Introduction
107Admiral Group plc · Annual Report and Accounts 2016

Notes to the Financial Statements continuedFor the year ended 31 December 2016
6. Investments6a. Accounting policies(i) Investment income and finance costs
Investment income from financial assets comprises distributions as well as net realised and unrealised gains on financial assets classified as ‘fair value through profit or loss’ (FVTPL), interest income and net realised gains from assets classified as ‘available for sale’ (AFS), and interest income on holdings in term deposits and gilts.
Finance costs from financial liabilities comprise interest expense on subordinated notes, calculated on the effective interest rate method. The effective interest rate method calculates the amortised cost of a financial asset or liability (or group of financial assets or financial liabilities) and allocates the interest income or expense over the expected life of the asset or liability.
(ii) Financial assets – investments and receivables
Initial recognition
Financial assets within the scope of IAS 39 are classified as financial assets at FVTPL, AFS assets, loans and receivables or held to maturity investments.
At initial recognition assets are recognised at fair value and classified according to the purpose for which they were acquired.
The Group’s investments in money market liquidity funds are designated as FVTPL at inception.
This designation is permitted under IAS 39, as the investments in money market funds are managed as a group of assets and internal performance evaluation of this group is conducted on a fair value basis.
The Group’s holdings in Fixed Income and Asset Backed Securities are classified as AFS investments, which is consistent with the intention for which they were purchased.
The Group’s deposits with credit institutions and gilts are classified as held to maturity investments, which is consistent with the intention for which they were purchased.
Transaction costs associated with the purchase of all financial assets are expensed within the income statement as incurred.
Subsequent measurement
Financial assets at FVTPL are stated at fair value, with any resultant realised or unrealised gain or loss recognised through the income statement.
AFS fixed income and asset backed securities are stated at fair value. Unrealised changes in the fair value of these assets are recognised in Other Comprehensive Income (OCI). Interest income on debt securities is recognised within profit or loss using the effective interest rate method.
Deposits and gilts with fixed maturities, classified as held to maturity investments are measured at amortised cost using the effective interest method. Movements in the amortised cost are recognised through the income statement, as are any impairment losses.
Loans and receivables are stated at their amortised cost less impairment using the effective interest method. Impairment losses are recognised through the income statement.
Impairment of financial assets
The Group assesses at each balance sheet date whether any financial assets or groups of financial assets held at fair value or amortised cost are impaired. Financial assets are impaired where there is evidence that one or more events occurring after the initial recognition of the asset, may lead to a reduction in the estimated future cash flows arising from the asset.
Objective evidence of impairment may include default on cash flows due from the asset and reported financial difficulty of the issuer or counterparty.
Identified impairments of financial assets are recognised in the income statement, except in the case of assets classified as AFS where unrealised gains have been recognised through OCI. In this instance, impairments of the asset are first set against the unrealised gain in OCI with any excess being recognised in the income statement.
Financial Statements: Notes to the Financial Statements
108 Admiral Group plc · Annual Report and Accounts 2016

De-recognition of financial assets
A financial asset is derecognised when the rights to receive cash flows from that asset have expired, or when the Group transfers the asset and all the attached substantial risks and rewards relating to the asset to a third party.
Cash and cash equivalents
Cash and cash equivalents includes cash in hand, deposits held at call with banks and other short term deposits with original maturities of three months or less. All cash and cash equivalents are measured at amortised cost.
(iii) Financial liabilities
Initial recognition
The Group’s financial liabilities comprise subordinated notes and other financial liabilities initially recognised at fair value received, net of transaction costs incurred.
Subsequent measurement
Subsequent measurement is at amortised cost using the effective interest method. Movements in the amortised cost are recognised through the income statement.
De-recognition of financial liabilities
A financial liability is derecognised when the obligation under that liability is discharged, cancelled or expires.
(iv) Fair value measurement of assets held at amortised cost
The fair value of gilts and subordinated notes held at amortised cost is calculated with reference to quoted market valuations. See note 6d for a comparison of fair value and carrying value at the statement of financial position date.
The Group’s deposits are held with well rated institutions; as such the fair value approximates to the book value of the investment based on the interest rates of the instruments, credit risk movements and durations of the assets. The amortised cost carrying amount of receivables is a reasonable approximation of fair value.
6b. Investment and interest income
31 December 2016 £m
31 December 2015 £m
Investment income
Investment return on assets classified as FVTPL 2.9 2.2
Gains on forward contracts 6.5 –
Interest income on AFS debt securities 23.4 19.2
Interest income on term deposits with credit institutions 4.7 4.7
Interest income on held to maturity gilt assets*1 6.2 6.1
43.7 32.2
Unwind of discount on gilts (0.8) (0.8)
Release of accrual for reinsurers’ share of investment returns 9.2 –
52.1 31.4
Interest receivable on cash and cash equivalents*1 1.0 1.2
Total investment and interest income 53.1 32.6
*1 Interest received during the year was £11.6 million (2015: £8.6 million).
6c. Finance costs
31 December 2016 £m
31 December 2015 £m
Interest payable*1 11.4 11.1
Total finance costs 11.4 11.1
*1 Interest paid during the year was £11.3 million (2015: £11.0 million).
Finance costs represent interest payable on the £200 million subordinated notes and other financial liabilities.
Financial Statements Additional InformationCorporate GovernanceStrategic Report Introduction
109Admiral Group plc · Annual Report and Accounts 2016

Notes to the Financial Statements continuedFor the year ended 31 December 2016
6. Investments continued6d. Financial assets and liabilitiesThe Group’s financial instruments can be analysed as follows:
31 December 2016 £m
31 December 2015 £m
Investments held at fair value through profit or loss
Money market funds 776.3 627.7
Derivative financial instruments 4.7 –
781.0 627.7
Investments classified as available for sale
Available for sale debt securities 1,271.8 1,230.0
1,271.8 1,230.0
Investments classified as held to maturity
Term deposits with credit institutions 170.0 267.6
Gilts 197.4 198.2
367.4 465.8
Total financial investments 2,420.2 2,323.5
Insurance and financial assets
Insurance receivables 606.6 437.0
Trade and other receivables 178.3 100.1
Cash and cash equivalents 326.6 265.3
Total financial assets 3,531.7 3,125.9
Financial liabilities
Subordinated notes 204.0 203.9
Other borrowings 20.0 20.0
Trade and other payables 1,292.2 1,015.0
Total financial liabilities 1,516.2 1,238.9
Financial liabilities are inclusive of £200 million subordinated notes issued on 25 July 2014 at a fixed rate of 5.5% with a redemption date of 25 July 2024.
The notes are unsecured subordinated obligations of the Group and rank pari passu without any preference among themselves. In the event of a winding-up or bankruptcy, they are to be repaid only after the claims of all other creditors have been met.
There have been no defaults on any of the notes during the year. The Group has the option to defer interest payments on the notes but to date has not exercised this right. The aggregate fair value of subordinated dated notes at the balance sheet date is disclosed in the table below.
The Group holds a revolving credit facility of £100 million which expires in July 2018. As at 31 December 2016, £20 million was drawn under this agreement and is included as other borrowings in the table above.
Financial Statements: Notes to the Financial Statements
110 Admiral Group plc · Annual Report and Accounts 2016

Fair value measurement
The measurement of investments at the end of the period, for investments held at fair value and short term debt securities held at fair value, is based on active quoted market values (level one).
The measurement of AFS debt securities at the end of the period is also based on active quoted market values (level one).
The deposits are held with well rated institutions; as such the approximate fair value is the book value of the investment as impairment of the capital is not expected. There is no quoted market for these holdings and as such a level two valuation is used. The book value of term deposits is £170.0 million (2015: £267.6 million).
The amortised cost carrying amount of receivables is a reasonable approximation of fair value. The fair values of gilts and subordinated notes (both level one valuations) together with their carrying values shown in the Consolidated Statement of Financial Position are as follows:
31 December 2016 31 December 2015
Carrying amount £m
Fair value £m
Carrying amount £m
Fair value £m
Financial assets
Gilts 197.4 225.4 198.2 211.7
Financial liabilities
Subordinated notes 204.0 212.9 203.9 202.4
The maturity profile of financial assets and liabilities at 31 December 2016 is as follows:
On demand £m
< 1 year £m
Between 1 and 2 years
£m> 2 years
£m
Financial investments
Investments held at fair value 776.3 4.7 – –
Term deposits with credit institutions – 60.0 40.0 70.0
Available for sale debt securities 2.5 324.4 224.4 720.5
Gilts – 0.9 – 196.5
Total financial investments 778.8 390.0 264.4 987.0
Insurance receivables – 606.6 – –
Trade and other receivables – 178.3 – –
Cash and cash equivalents 326.6 – – –
Total financial assets 1,105.4 1,174.9 264.4 987.0
Financial liabilities
Subordinated notes – 4.8 – 199.2
Other borrowings – 20.0 – –
Trade and other payables – 1,292.2 – –
Total financial liabilities – 1,317.0 – 199.2
Financial Statements Additional InformationCorporate GovernanceStrategic Report Introduction
111Admiral Group plc · Annual Report and Accounts 2016
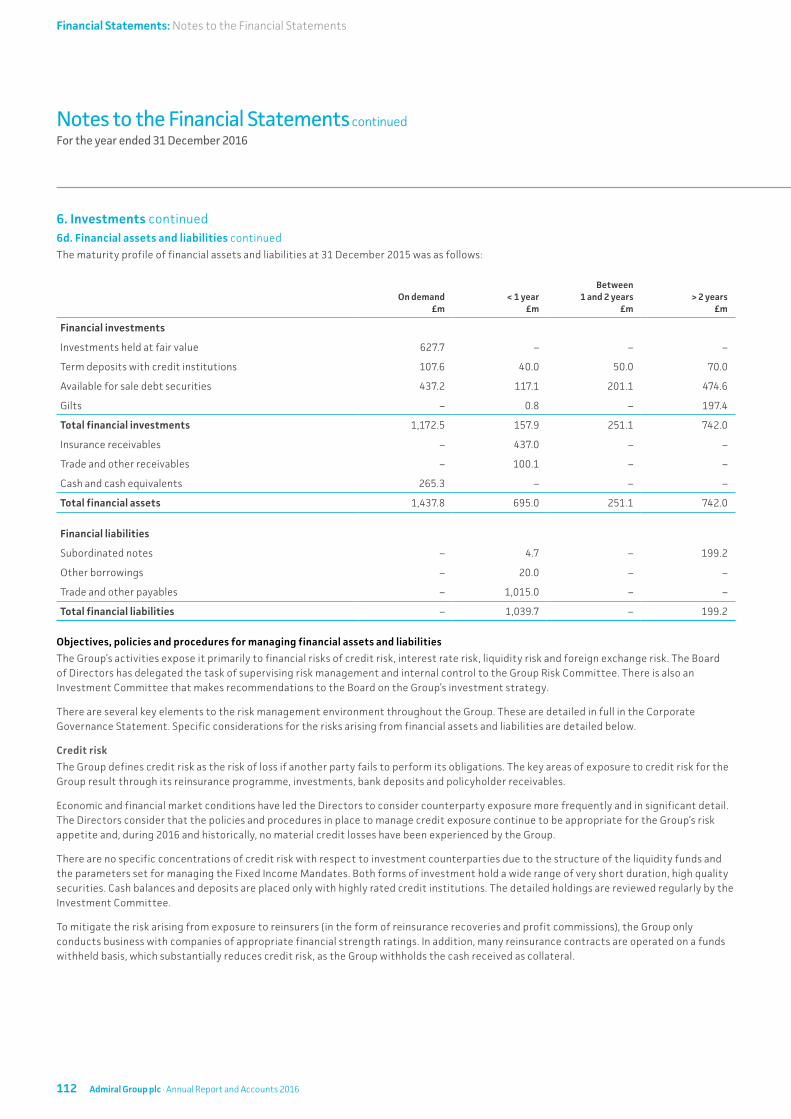
Notes to the Financial Statements continuedFor the year ended 31 December 2016
6. Investments continued6d. Financial assets and liabilities continuedThe maturity profile of financial assets and liabilities at 31 December 2015 was as follows:
On demand £m
< 1 year £m
Between 1 and 2 years
£m> 2 years
£m
Financial investments
Investments held at fair value 627.7 – – –
Term deposits with credit institutions 107.6 40.0 50.0 70.0
Available for sale debt securities 437.2 117.1 201.1 474.6
Gilts – 0.8 – 197.4
Total financial investments 1,172.5 157.9 251.1 742.0
Insurance receivables – 437.0 – –
Trade and other receivables – 100.1 – –
Cash and cash equivalents 265.3 – – –
Total financial assets 1,437.8 695.0 251.1 742.0
Financial liabilities
Subordinated notes – 4.7 – 199.2
Other borrowings – 20.0 – –
Trade and other payables – 1,015.0 – –
Total financial liabilities – 1,039.7 – 199.2
Objectives, policies and procedures for managing financial assets and liabilities
The Group’s activities expose it primarily to financial risks of credit risk, interest rate risk, liquidity risk and foreign exchange risk. The Board of Directors has delegated the task of supervising risk management and internal control to the Group Risk Committee. There is also an Investment Committee that makes recommendations to the Board on the Group’s investment strategy.
There are several key elements to the risk management environment throughout the Group. These are detailed in full in the Corporate Governance Statement. Specific considerations for the risks arising from financial assets and liabilities are detailed below.
Credit risk
The Group defines credit risk as the risk of loss if another party fails to perform its obligations. The key areas of exposure to credit risk for the Group result through its reinsurance programme, investments, bank deposits and policyholder receivables.
Economic and financial market conditions have led the Directors to consider counterparty exposure more frequently and in significant detail. The Directors consider that the policies and procedures in place to manage credit exposure continue to be appropriate for the Group’s risk appetite and, during 2016 and historically, no material credit losses have been experienced by the Group.
There are no specific concentrations of credit risk with respect to investment counterparties due to the structure of the liquidity funds and the parameters set for managing the Fixed Income Mandates. Both forms of investment hold a wide range of very short duration, high quality securities. Cash balances and deposits are placed only with highly rated credit institutions. The detailed holdings are reviewed regularly by the Investment Committee.
To mitigate the risk arising from exposure to reinsurers (in the form of reinsurance recoveries and profit commissions), the Group only conducts business with companies of appropriate financial strength ratings. In addition, many reinsurance contracts are operated on a funds withheld basis, which substantially reduces credit risk, as the Group withholds the cash received as collateral.
Financial Statements: Notes to the Financial Statements
112 Admiral Group plc · Annual Report and Accounts 2016

The other principal form of credit risk is in respect of amounts due from policyholders, largely due to the potential for default by instalment payers. The impact of this is mitigated by the large customer base and low average level of balance recoverable. There is also mitigation by the operation of numerous high- and low-level controls in this area, including payment on policy acceptance as opposed to inception and automated cancellation procedures for policies in default.
The Group’s maximum exposure to credit risk at 31 December 2016 is £3,263.0 million (2015: £2,913.3 million), being the carrying value of financial investments and cash, and the excess of reinsurance assets over amounts owed to reinsurers under funds withheld arrangements. The Group does not use credit derivatives or similar instruments to mitigate exposure. The amount of bad debt expense relating to policyholder debt charged to the income statement in 2016 and 2015 is insignificant.
There were no significant financial assets that were past due at the close of either 2016 or 2015.
The Group’s credit risk exposure to assets with external ratings is as follows:
Rating31 December 2016
£m31 December 2015
£m
Financial institutions – Credit institutions AAA 269.3 247.8
Financial institutions – Credit institutions AA 733.8 679.4
Financial institutions – Credit institutions A 1,305.6 1,230.3
Financial institutions – Credit institutions BBB and below 236.0 234.0
UK Government gilts AA 197.4 198.2
Reinsurers AA 277.1 266.8
Reinsurers A 29.1 9.2
Interest rate risk
The Group considers interest rate risk to be the risk that unfavourable movements in interest rates could adversely impact on the capital values of financial assets and liabilities.
As noted above, the Group invests the following asset types:
• Money market liquidity funds and cash plus liquidity funds, which in turn invest in a mixture of short dated fixed and variable rate securities, such as cash deposits, certificates of deposits, floating rate notes and other commercial paper.
• Term deposits with well rated institutions are short in duration (one to five years). These are classified as term and valued at amortised cost. Therefore neither the carrying value of the asset, nor the interest return will be impacted by fluctuations in interest rates.
• Available for sale debt securities. These securities are held within two segregated mandates. The guidelines of the investments retain a similar credit quality of the money market funds (all holdings are investment grade). The duration of the securities is relatively short and similar to the duration of the on book claims liabilities (the average duration is three years).
• UK Government gilts. These are classified as term and valued at amortised cost. Therefore neither the capital value of the gilts, nor the interest return, will be impacted by fluctuations in interest rates.
The Group also holds a financial liability in the form of £200 million of subordinated notes with a ten year maturity and fixed rate coupon of 5.5%. This liability is valued at amortised cost and therefore neither the carrying value of the deposits, nor the interest payable, will be impacted by fluctuations in interest rates.
No sensitivity analysis to interest rates has been presented on the grounds of materiality.
Financial Statements Additional InformationCorporate GovernanceStrategic Report Introduction
113Admiral Group plc · Annual Report and Accounts 2016

Notes to the Financial Statements continuedFor the year ended 31 December 2016
6. Investments continued6d. Financial assets and liabilities continuedLiquidity risk
Liquidity risk is defined as the risk that the Group does not have sufficient, available financial resources to enable it to meet its obligations as they fall due, or can only secure them at excessive cost.
The Group is strongly cash-generative due to the large proportion of revenue arising from non-underwriting activity. Further, as noted above, a significant portion of insurance funds are invested in money market liquidity funds with same day liquidity, meaning that a large proportion of the Group cash and investments is immediately available.
A breakdown of the Group’s other financial liabilities, trade payables and other payables is shown in note 10.
The subordinated notes have a ten year maturity whereas all trade and other payables will mature within three to six months of the balance sheet date. (Refer to the maturity profile at the start of this note for further detail.)
In practice, the Group’s Directors expect actual cash flows to be consistent with this maturity profile except for amounts owed to co-insurers and reinsurers. Of the total amounts owed to co-insurers and reinsurers of £938.0 million (2015: £764.7 million), £610.1 million (2015: £554.3 million) is held under funds withheld arrangements and therefore not expected to be settled within 12 months.
A maturity analysis for insurance contract liabilities is included in note 5. The maturity profile for financial assets is included at the start of this note.
The Group’s Directors believe that the cash flows arising from these assets will be consistent with this profile. Liquidity risk is not, therefore, considered to be significant.
Foreign exchange risk
Foreign exchange risk arises from unfavourable movements in foreign exchange rates that could adversely impact the valuation of overseas assets and liabilities.
The Group is exposed to foreign exchange risk through its operations overseas. Although the relative size of the international operations means that the risks are relatively small, increasingly volatile foreign exchange rates could result in larger potential gains or losses. Assets held to fund insurance liabilities are held in the currency of the liabilities; however, surplus assets held as regulatory capital in foreign currencies remain exposed.
The Group’s exposure to net assets and profits in currencies other than the reporting currency is immaterial other than for US dollars. The Group’s exposure to net assets held in dollars at the balance sheet date was £70.5 million (2015: £87.3 million).
The loss before tax derived from business carried out in the US was £39.1 million (2015: £45.9 million). If the Sterling rates with US dollars had strengthened/weakened by 10%, the Group’s profit before tax for the year would increase/decrease by £3.6 million (2015: £4.2 million).
Fair value
For cash at bank and cash deposits and other receivables, the fair value approximates to the book value due to their short maturity. For assets held at fair value through profit and loss, their value equates to level one (quoted prices in active markets) of the fair value hierarchy.
For gilts and subordinated notes, the fair value is calculated with reference to the quoted market valuation. This is compared to carrying value earlier in this note.
6e. Cash and cash equivalents
31 December 2016 £m
31 December 2015 £m
Cash at bank and in hand 326.4 265.3
Short term deposits 0.2 –
Total cash and cash equivalents 326.6 265.3
Cash and cash equivalents includes cash in hand, deposits held at call with banks, and other short term term deposits with original maturities of three months or less.
Financial Statements: Notes to the Financial Statements
114 Admiral Group plc · Annual Report and Accounts 2016

7. Other Revenue7a. Accounting policy(i) Contribution from additional products and fees and Other Revenue
Contribution from additional products and fees and Other Revenue includes revenue earned on the sale of products supplementing the core motor insurance policy, administration and other charges paid by the policyholder, referral fees, revenue from policies paid by instalments and vehicle commission charges paid by co- and reinsurers. Revenue is credited to the income statement over the period matching the Group’s obligations to provide services. Where the Group has no remaining contractual obligations, the revenue is recognised immediately. An allowance is made for expected cancellations where the customer may be entitled to a refund of amounts charged.
Commission from price comparison activities and broking commission earned by Gladiator is credited to revenue on the sale of the underlying insurance policy.
7b. Contribution from additional products and fees and Other Revenue
31 December 2016 £m
31 December 2015 £m
Contribution from additional products and fees 199.0 182.4
Price comparison revenue*1 108.4 93.9
Other revenue 53.2 43.5
Total Other Revenue 360.6 319.8
*1 Price comparison revenue excludes £20.8 million (2015: £14.2 million) of income from other Group companies.
Refer to the Strategic Report for further detail on the sources of revenue.
8. Expenses8a. Accounting policies(i) Acquisition costs and operating expenses
Acquisition costs incurred in obtaining new and renewal business are charged to the income statement over the period in which those premiums are earned. All other operating expenses are charged to the income statement in the period that they are incurred.
(ii) Employee benefits
Pensions
The Group contributes to defined contribution personal pension plans for its employees. The contributions payable to these schemes are charged in the accounting period to which they relate.
Employee share schemes
The Group operates a number of equity and cash settled compensation schemes for its employees. The fair value of the employee services received in exchange for the grant of free shares under the equity settled schemes is recognised as an expense, with a corresponding increase in equity. For cash settled schemes, the fair value of services received are also recognised as an expense, with a corresponding increase in liability.
For equity settled schemes, the total charge expensed over the vesting period is determined by reference to the fair value of the free shares granted as determined at the grant date (excluding the impact of non-market vesting conditions). Non-market conditions such as profitability targets as well as staff attrition rates are included in assumptions over the number of free shares to vest under the applicable scheme.
For cash settled schemes, the total charge expensed over the vesting period is determined by reference to the closing Admiral Group share price at the end of the period. Prior to the vesting of each scheme, the closing share price at the end of the reporting period is used as an approximation for the closing share price at the end of the vesting period. As with equity settled schemes, non-market vesting conditions also impact on the total charge expensed over the vesting period.
At each balance sheet date, the Group revises its assumptions on the number of shares to be granted with the impact of any change in the assumptions recognised through income.
Refer to note 8f for further details on share schemes.
Financial Statements Additional InformationCorporate GovernanceStrategic Report Introduction
115Admiral Group plc · Annual Report and Accounts 2016

Notes to the Financial Statements continuedFor the year ended 31 December 2016
8. Expenses continued8a. Accounting policies continued(iii) Leases
Operating leases
Leases which do not transfer to the Group substantially all the risks and benefits incidental to ownership of the leased items are classified as operating leases. The Group has entered into a number of non-cancellable operating lease arrangements for properties and other assets. The leases have varying terms, escalation values and renewal rights.
Operating lease payments, including the effects of any lease incentives, are recognised as an expense in the income statement on a straight-line basis over the lease term. Contingent rentals are recognised as an expense in the period in which they are incurred.
8b. Operating expenses and share scheme charges
31 December 2016
Gross £m
Recoverable from co- and reinsurers
£mNet £m
Acquisition of insurance contracts*1 98.0 (75.4) 22.6
Administration and other marketing costs (insurance contracts) 293.9 (222.6) 71.3
Insurance contract expenses 391.9 (298.0) 93.9
Administration and other marketing costs (other) 206.6 – 206.6
Share scheme charges 50.3 (18.4) 31.9
Total expenses and share scheme charges 648.8 (316.4) 332.4
31 December 2015
Gross £m
Recoverable from co- and reinsurers
£mNet £m
Acquisition of insurance contracts*1 77.5 (57.8) 19.7
Administration and other marketing costs (insurance contracts) 238.5 (175.1) 63.4
Insurance contract expenses 316.0 (232.9) 83.1
Administration and other marketing costs (other) 188.2 – 188.2
Share scheme charges 43.8 (16.6) 27.2
Total expenses and share scheme charges 548.0 (249.5) 298.5
*1 Acquisition of insurance contracts expense excludes £20.8 million (2015: £14.2 million) of aggregator fees from other Group companies.
The £71.3 million (2015: £63.4 million) administration and marketing costs allocated to insurance contracts is principally made up of salary costs.
Analysis of other administration and other marketing costs:
31 December 2016 £m
31 December 2015 £m
Expenses relating to additional products and fees 49.9 43.0
Price comparison operating expenses 132.1 123.6
Other expenses 24.6 21.6
Total 206.6 188.2
Refer to note 12 for a reconciliation between insurance contract expenses and the reported expense ratio.
Financial Statements: Notes to the Financial Statements
116 Admiral Group plc · Annual Report and Accounts 2016

8c. Staff costs and other expenses
31 December 2016 31 December 2015
Total £m
Net £m
Total £m
Net £m
Salaries 203.7 79.4 179.6 67.6
Social security charges 18.8 7.6 16.2 6.9
Pension costs 6.8 2.3 5.6 2.0
Share scheme charges (see note 8f) 50.3 31.9 43.8 27.2
Total staff expenses 279.6 121.2 245.2 103.7
Depreciation charge:
– Owned assets 8.6 3.3 7.9 2.1
– Leased assets 1.9 0.5 0.3 0.1
Amortisation charge:
– Software 12.6 4.1 6.1 3.1
– Deferred acquisition costs – 43.2 – 34.0
Operating lease rentals:
– Buildings 13.3 4.2 14.0 4.5
Auditor’s remuneration (including VAT):
– Fees payable for the audit of the Company’s annual accounts – – – –
– Fees payable for the audit of the Company’s subsidiary accounts 0.2 0.2 0.4 0.3
– Fees payable for audit related assurance services pursuant to legislation or regulation 0.2 0.1 – –
– Fees payable for other services*1 – – 0.4 0.1
Analysis of fees paid to the auditor for other services:
– Tax compliance services – – 0.1 –
– Tax advisory services – – 0.1 –
– Other services – – 0.2 0.1
Total as above – – 0.4 0.1
*1 Fees payable to the auditor for other services in year ended 31 December 2015 were paid to the previous auditor, KPMG LLP.
Total and net expenses are before and after co- and reinsurance arrangements respectively.
Refer to the Corporate Governance Report for details of the Audit Committee’s policy on fees paid to the Company’s auditor for non-audit services. The ratio of non-audit fees to audit fees in 2016 was 82% (2015: 88%).
The amortisation of software and deferred acquisition cost assets is charged to expenses in the income statement.
Financial Statements Additional InformationCorporate GovernanceStrategic Report Introduction
117Admiral Group plc · Annual Report and Accounts 2016

Notes to the Financial Statements continuedFor the year ended 31 December 2016
8. Expenses continued8d. Staff numbers (including Directors)
Average for the year
2016 Number
2015 Number
Direct customer contact staff 5,993 5,868
Support staff 2,605 1,989
Total 8,598 7,857
8e. Directors’ remuneration(i) Directors’ remuneration
31 December 2016 £m
31 December 2015 £m
Directors’ emoluments 1.6 1.7
Amounts receivable under SIP and DFSS share schemes 0.4 0.3
Company contributions to money purchase pension plans – –
Total 2.0 2.0
(ii) Number of Directors
2016 Number
2015 Number
Retirement benefits are accruing to the following number of Directors under:
– Money purchase schemes 2 2
– Defined benefit schemes – –
8f. Staff share schemesAnalysis of share scheme costs (per the Consolidated Income Statement):
31 December 2016 £m
31 December 2015 £m
SIP charge (i) 9.9 8.7
DFSS charge (ii) 22.0 18.5
Total share scheme charges 31.9 27.2
The share scheme charges reported above are net of the co- and reinsurers' share of the cost and therefore differ from the gross charge reported in note 8c (2016: £50.3 million; 2015: £43.8 million) and the gross credit to reserves reported in the Consolidated Statement of Changes in Equity (2016: £33.2 million; 2015: £29.5 million).
The Consolidated Cash Flow Statement also shows the gross charge in the reconciliation between ‘profit after tax’ and ‘cash flows from operating activities’. The co-insurance share of the charge is included in the change in trade and other payables line.
Financial Statements: Notes to the Financial Statements
118 Admiral Group plc · Annual Report and Accounts 2016
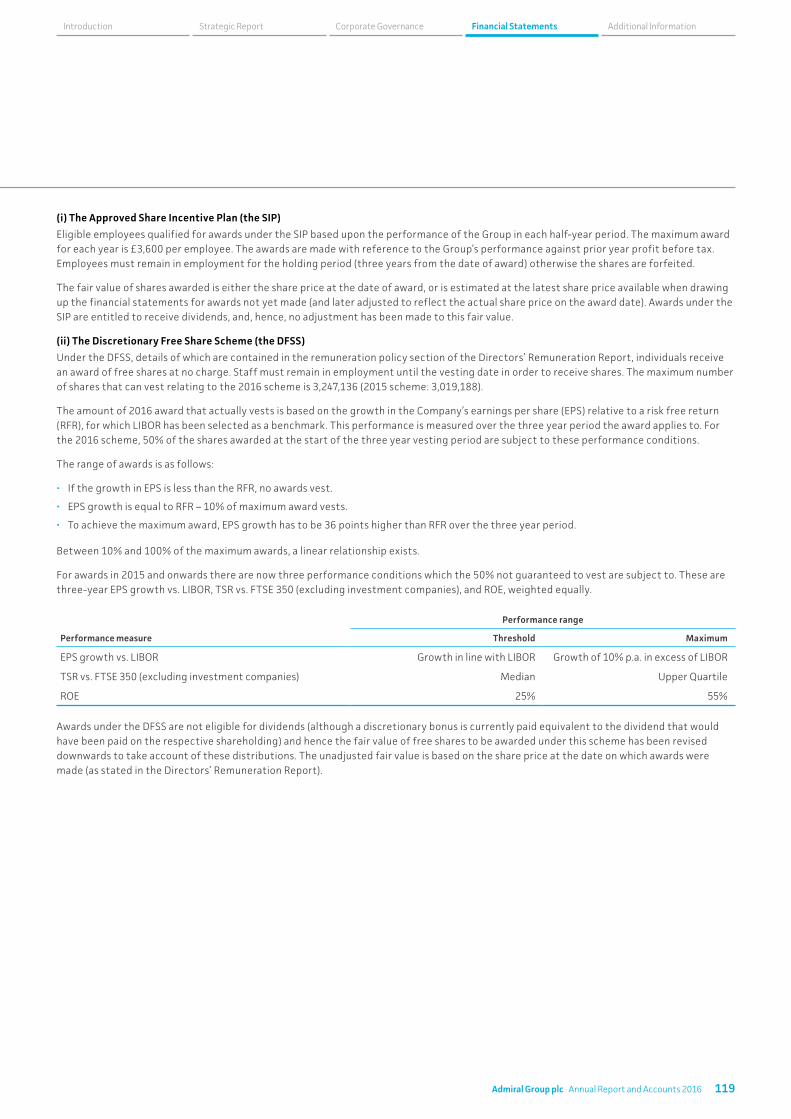
(i) The Approved Share Incentive Plan (the SIP)
Eligible employees qualified for awards under the SIP based upon the performance of the Group in each half-year period. The maximum award for each year is £3,600 per employee. The awards are made with reference to the Group’s performance against prior year profit before tax. Employees must remain in employment for the holding period (three years from the date of award) otherwise the shares are forfeited.
The fair value of shares awarded is either the share price at the date of award, or is estimated at the latest share price available when drawing up the financial statements for awards not yet made (and later adjusted to reflect the actual share price on the award date). Awards under the SIP are entitled to receive dividends, and, hence, no adjustment has been made to this fair value.
(ii) The Discretionary Free Share Scheme (the DFSS)
Under the DFSS, details of which are contained in the remuneration policy section of the Directors’ Remuneration Report, individuals receive an award of free shares at no charge. Staff must remain in employment until the vesting date in order to receive shares. The maximum number of shares that can vest relating to the 2016 scheme is 3,247,136 (2015 scheme: 3,019,188).
The amount of 2016 award that actually vests is based on the growth in the Company’s earnings per share (EPS) relative to a risk free return (RFR), for which LIBOR has been selected as a benchmark. This performance is measured over the three year period the award applies to. For the 2016 scheme, 50% of the shares awarded at the start of the three year vesting period are subject to these performance conditions.
The range of awards is as follows:
• If the growth in EPS is less than the RFR, no awards vest.
• EPS growth is equal to RFR – 10% of maximum award vests.
• To achieve the maximum award, EPS growth has to be 36 points higher than RFR over the three year period.
Between 10% and 100% of the maximum awards, a linear relationship exists.
For awards in 2015 and onwards there are now three performance conditions which the 50% not guaranteed to vest are subject to. These are three-year EPS growth vs. LIBOR, TSR vs. FTSE 350 (excluding investment companies), and ROE, weighted equally.
Performance measure
Performance range
Threshold Maximum
EPS growth vs. LIBOR Growth in line with LIBOR Growth of 10% p.a. in excess of LIBOR
TSR vs. FTSE 350 (excluding investment companies) Median Upper Quartile
ROE 25% 55%
Awards under the DFSS are not eligible for dividends (although a discretionary bonus is currently paid equivalent to the dividend that would have been paid on the respective shareholding) and hence the fair value of free shares to be awarded under this scheme has been revised downwards to take account of these distributions. The unadjusted fair value is based on the share price at the date on which awards were made (as stated in the Directors’ Remuneration Report).
Financial Statements Additional InformationCorporate GovernanceStrategic Report Introduction
119Admiral Group plc · Annual Report and Accounts 2016

Notes to the Financial Statements continuedFor the year ended 31 December 2016
8. Expenses continued8f. Staff share schemes continuedNumber of free share awards committed at 31 December 2016
Awards outstanding*1 Vesting date
SIP H213 scheme 514,500 March 2017
SIP H114 scheme 575,016 September 2017
SIP H214 scheme 536,613 March 2018
SIP H115 scheme 636,612 August 2018
SIP H215 scheme 523,877 March 2019
SIP H116 scheme 501,785 September 2019
DFSS 2014 scheme 1st award 203,292 March 2017
DFSS 2014 scheme 2nd award 2,481,806 September 2017
DFSS 2015 scheme 1st award 190,275 March 2018
DFSS 2015 scheme 2nd award 2,828,913 September 2018
DFSS 2016 scheme 1st award 199,346 March 2019
DFSS 2016 scheme 2nd award 3,047,790 September 2019
Total awards committed 12,239,825
*1 Being the maximum number of awards expected to be made before accounting for expected staff attrition
During the year ended 31 December 2016, awards under the SIP H212 and H113 schemes and the DFSS 2013 scheme vested. The total number of awards vesting for each scheme is as follows.
Number of free share awards vesting during the year ended 31 December 2016
Original awards Awards vested
SIP H212 scheme 533,792 417,312
SIP H113 scheme 603,432 455,648
DFSS 2013 scheme 1st award 173,348 108,227
DFSS 2013 scheme 2nd award 2,175,665 1,432,540
The weighted average market share price at the date of exercise for shares exercised during the year was £20.09 (2015: £15.42).
9. Taxation9a. Accounting policyIncome tax on the profit or loss for the periods presented comprises current and deferred tax.
(i) Current tax
Current tax is the expected tax payable on the taxable income for the period, using tax rates that have been enacted or substantively enacted by the balance sheet date, and includes any adjustment to tax payable in respect of previous periods.
Current tax related to items recognised in other comprehensive income is also recognised in other comprehensive income and not in the income statement.
Financial Statements: Notes to the Financial Statements
120 Admiral Group plc · Annual Report and Accounts 2016

(ii) Deferred tax
Deferred tax is provided in full using the balance sheet liability method, providing for temporary differences arising between the carrying amount of assets and liabilities for accounting purposes and the amounts used for taxation purposes. It is calculated at the tax rates that have been enacted or substantially enacted by the balance sheet date and that are expected to apply in the period when the liability is settled or the asset is realised.
The principal temporary differences arise from carried forward losses, depreciation of property and equipment and share scheme charges. The resulting deferred tax is charged or credited in the income statement, except in relation to share scheme charges where the amount of tax benefit credited to the income statement is limited to an equivalent credit calculated on the accounting charge. Any excess is recognised directly in equity.
Deferred tax assets relating to carried forward losses are recognised only to the extent that it is probable that future taxable profits will be available against which the assets can be utilised. The probability of the availability of future taxable profits is determined by a combination of the classification of the status of the businesses holding cumulative tax losses and the business plan profit projections for that business, subject to appropriate stress testing.
9b. Taxation
31 December 2016 £m
31 December 2015 £m
Current tax
Corporation tax on profits for the year 53.2 70.9
(Over) provision relating to prior periods (1.0) (1.0)
Current tax charge 52.2 69.9
Deferred tax
Current period deferred taxation movement 7.2 7.5
Under/(Over) provision relating to prior periods 4.9 (0.5)
Total tax charge per Consolidated Income Statement 64.3 76.9
Factors affecting the total tax charge are:
31 December 2016 £m
31 December 2015 £m
Profit before tax 278.4 368.7
Corporation tax thereon at effective UK corporation tax rate of 20.0% (2015: 20.25%) 55.7 74.7
Expenses and provisions not deductible for tax purposes 0.8 1.4
Non-taxable income (7.2) (4.8)
Impact of change in UK tax rate on deferred tax balances – 0.3
Adjustments relating to prior periods 3.2 (1.5)
Impact of different overseas tax rates (7.0) (12.9)
Unrecognised deferred tax 18.9 19.7
Other differences (0.1) –
Total tax charge for the period as above 64.3 76.9
Financial Statements Additional InformationCorporate GovernanceStrategic Report Introduction
121Admiral Group plc · Annual Report and Accounts 2016
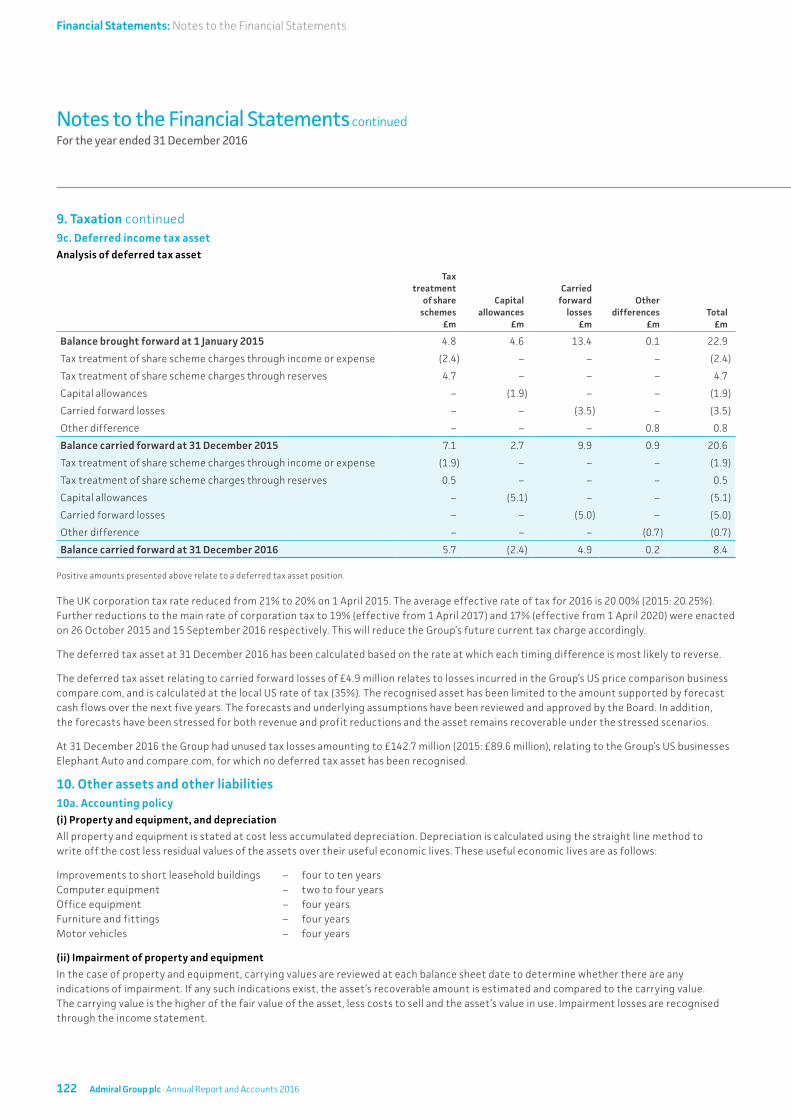
Notes to the Financial Statements continuedFor the year ended 31 December 2016
9. Taxation continued9c. Deferred income tax assetAnalysis of deferred tax asset
Tax treatment
of share schemes
£m
Capital allowances
£m
Carried forward
losses £m
Other differences
£mTotal
£m
Balance brought forward at 1 January 2015 4.8 4.6 13.4 0.1 22.9
Tax treatment of share scheme charges through income or expense (2.4) – – – (2.4)
Tax treatment of share scheme charges through reserves 4.7 – – – 4.7
Capital allowances – (1.9) – – (1.9)
Carried forward losses – – (3.5) – (3.5)
Other difference – – – 0.8 0.8
Balance carried forward at 31 December 2015 7.1 2.7 9.9 0.9 20.6
Tax treatment of share scheme charges through income or expense (1.9) – – – (1.9)
Tax treatment of share scheme charges through reserves 0.5 – – – 0.5
Capital allowances – (5.1) – – (5.1)
Carried forward losses – – (5.0) – (5.0)
Other difference – – – (0.7) (0.7)
Balance carried forward at 31 December 2016 5.7 (2.4) 4.9 0.2 8.4
Positive amounts presented above relate to a deferred tax asset position.
The UK corporation tax rate reduced from 21% to 20% on 1 April 2015. The average effective rate of tax for 2016 is 20.00% (2015: 20.25%). Further reductions to the main rate of corporation tax to 19% (effective from 1 April 2017) and 17% (effective from 1 April 2020) were enacted on 26 October 2015 and 15 September 2016 respectively. This will reduce the Group’s future current tax charge accordingly.
The deferred tax asset at 31 December 2016 has been calculated based on the rate at which each timing difference is most likely to reverse.
The deferred tax asset relating to carried forward losses of £4.9 million relates to losses incurred in the Group’s US price comparison business compare.com, and is calculated at the local US rate of tax (35%). The recognised asset has been limited to the amount supported by forecast cash flows over the next five years. The forecasts and underlying assumptions have been reviewed and approved by the Board. In addition, the forecasts have been stressed for both revenue and profit reductions and the asset remains recoverable under the stressed scenarios.
At 31 December 2016 the Group had unused tax losses amounting to £142.7 million (2015: £89.6 million), relating to the Group’s US businesses Elephant Auto and compare.com, for which no deferred tax asset has been recognised.
10. Other assets and other liabilities10a. Accounting policy(i) Property and equipment, and depreciation
All property and equipment is stated at cost less accumulated depreciation. Depreciation is calculated using the straight line method to write off the cost less residual values of the assets over their useful economic lives. These useful economic lives are as follows:
Improvements to short leasehold buildings – four to ten years Computer equipment – two to four years Office equipment – four years Furniture and fittings – four years Motor vehicles – four years
(ii) Impairment of property and equipment
In the case of property and equipment, carrying values are reviewed at each balance sheet date to determine whether there are any indications of impairment. If any such indications exist, the asset’s recoverable amount is estimated and compared to the carrying value. The carrying value is the higher of the fair value of the asset, less costs to sell and the asset’s value in use. Impairment losses are recognised through the income statement.
Financial Statements: Notes to the Financial Statements
122 Admiral Group plc · Annual Report and Accounts 2016

(iii) Leased assets
The rental costs relating to assets held under operating leases are charged to the income statement on a straight line basis over the life of the lease.
Leases under the terms of which the Group assumes substantially all of the risks and rewards of ownership are classed as finance leases. Assets acquired under finance leases are included in property and equipment at fair value on acquisition and are depreciated in the same manner as equivalent owned assets. Finance lease and hire purchase obligations are included in creditors and the finance costs are spread over the periods of the agreements based on the net amount outstanding.
(iv) Intangible assets
Goodwill
All business combinations are accounted for using the acquisition method. Goodwill has been recognised in acquisitions of subsidiaries, and represents the difference between the cost of the acquisition and the fair value of the net identifiable assets acquired.
The classification and accounting treatment of acquisitions occurring before 1 January 2004 have not been reconsidered in preparing the Group’s opening IFRS balance sheet at 1 January 2004 due to the exemption available in IFRS 1 (First time adoption). In respect of acquisitions prior to 1 January 2004, goodwill is included at the transition date on the basis of its deemed cost, which represents the amount recorded under UK GAAP, which was tested for impairment at the transition date. On transition, amortisation of goodwill has ceased as required by IAS 38.
Goodwill is stated at cost less any accumulated impairment losses. Goodwill is allocated to cash generating units (CGUs) according to business segment and is reviewed annually for impairment.
The goodwill held on the balance sheet at 31 December 2016 is allocated solely to the UK Insurance segment.
Impairment of goodwill
The annual impairment review involves comparing the carrying amount to the estimated recoverable amount (by allocating the goodwill to CGUs) and recognising an impairment loss if the recoverable amount is lower. Impairment losses are recognised through the income statement and are not subsequently reversed.
The recoverable amount is the greater of the fair value of the asset less costs to sell and the value in use of the CGU.
The value in use calculations use cash flow projections based on financial budgets approved by management covering a three year period. Cash flows beyond this period are considered, but not included in the calculation. The discount rate applied to the cash flow projections in the value in use calculations is 6.5% (2015: 5.9%), based on the Group’s weighted average cost of capital, which is in line with the market (source: Bloomberg).
The key assumptions used in the value in use calculations are those regarding growth rates and expected changes in pricing and expenses incurred during the period. Management estimates growth rates and changes in pricing based on past practices and expected future changes in the market.
The headroom above the goodwill carrying value is very significant, and there is no foreseeable event that would eliminate this margin.
Deferred acquisition costs
Acquisition costs comprise all direct and indirect costs arising from the conclusion of insurance contracts. Deferred acquisition costs represent the proportion of acquisition costs incurred that correspond to the unearned premiums provision at the balance sheet date. This balance is held as an intangible asset. It is amortised over the term of the contract as premium is earned.
Software
Purchased software is recognised as an intangible asset and amortised over its expected useful life (generally the licence term). Internally generated software is recognised as an intangible asset, with directly attributable costs incurred in the development stage capitalised. The internally generated software assets are amortised over the expected useful life of the systems and amortisation commences when the software is available for use.
The carrying value of software is reviewed every six months for evidence of impairment, with the value being written down if any impairment exists. Impairment may be reversed if conditions subsequently improve.
(v) Provisions, Contingent Liabilities and Contingent Assets
Provisions are recognised when a legal or constructive obligation arises as a result of an event that occurred before the balance sheet date, when a cash-outflow relating to this obligation is probable and when the amount can be estimated reliably.
Where an obligation exists, but the likelihood of a cash out-flow or the amount is uncertain, or where there is a possible obligation arising from a past event that is contingent on a future event, a contingent liability is disclosed.
Contingent assets are possible assets that arise from past events, whose existence will be confirmed only by the occurrence or non-occurrence of future events. Where it is probable that a cash-inflow will arise from a contingent asset, this is disclosed.
Financial Statements Additional InformationCorporate GovernanceStrategic Report Introduction
123Admiral Group plc · Annual Report and Accounts 2016

Notes to the Financial Statements continuedFor the year ended 31 December 2016
10. Other assets and other liabilities continued10b. Property and equipment
Improvements to short
leasehold buildings
£m
Computer equipment
£m
Office equipment
£m
Furniture and fittings
£mTotal
£m
Cost
At 1 January 2015 24.9 39.5 14.0 7.8 86.2
Additions 0.8 8.8 1.2 0.4 11.2
Disposals – (0.5) – – (0.5)
At 31 December 2015 25.7 47.8 15.2 8.2 96.9
Depreciation
At 1 January 2015 7.6 29.7 11.6 5.0 53.9
Charge for the year 2.4 3.8 1.0 1.0 8.2
Disposals – (0.1) – – (0.1)
At 31 December 2015 10.0 33.4 12.6 6.0 62.0
Net book amount
At 1 January 2015 17.3 9.8 2.4 2.8 32.3
Net book amount
At 31 December 2015 15.7 14.4 2.6 2.2 34.9
Cost
At 1 January 2016 25.7 47.8 15.2 8.2 96.9
Additions 1.3 3.4 1.1 0.8 6.6
Disposals – – (0.2) – (0.2)
Foreign exchange movement 0.6 0.9 0.9 0.4 2.8
At 31 December 2016 27.6 52.1 17.0 9.4 106.1
Depreciation
At 1 January 2016 10.0 33.4 12.6 6.0 62.0
Charge for the year 2.0 6.5 1.0 1.0 10.5
Disposals – – (0.1) – (0.1)
Foreign exchange movement 0.4 0.6 0.6 0.1 1.7
At 31 December 2016 12.4 40.5 14.1 7.1 74.1
Net book amount
At 31 December 2016 15.2 11.6 2.9 2.3 32.0
The net book value of assets held under finance leases is as follows:
31 December 2016 £m
31 December 2015 £m
Computer equipment 4.4 5.7
Financial Statements: Notes to the Financial Statements
124 Admiral Group plc · Annual Report and Accounts 2016
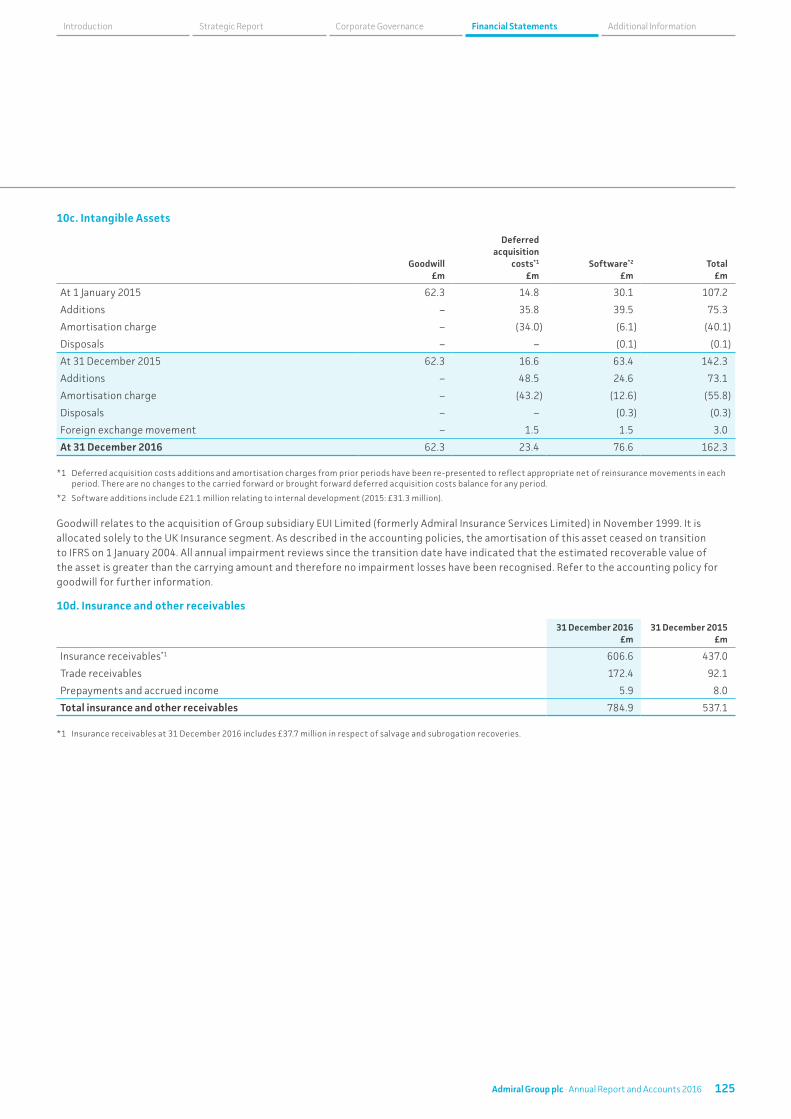
10c. Intangible Assets
Goodwill £m
Deferred acquisition
costs*1 £m
Software*2
£mTotal
£m
At 1 January 2015 62.3 14.8 30.1 107.2
Additions – 35.8 39.5 75.3
Amortisation charge – (34.0) (6.1) (40.1)
Disposals – – (0.1) (0.1)
At 31 December 2015 62.3 16.6 63.4 142.3
Additions – 48.5 24.6 73.1
Amortisation charge – (43.2) (12.6) (55.8)
Disposals – – (0.3) (0.3)
Foreign exchange movement – 1.5 1.5 3.0
At 31 December 2016 62.3 23.4 76.6 162.3
*1 Deferred acquisition costs additions and amortisation charges from prior periods have been re-presented to reflect appropriate net of reinsurance movements in each period. There are no changes to the carried forward or brought forward deferred acquisition costs balance for any period.
*2 Software additions include £21.1 million relating to internal development (2015: £31.3 million).
Goodwill relates to the acquisition of Group subsidiary EUI Limited (formerly Admiral Insurance Services Limited) in November 1999. It is allocated solely to the UK Insurance segment. As described in the accounting policies, the amortisation of this asset ceased on transition to IFRS on 1 January 2004. All annual impairment reviews since the transition date have indicated that the estimated recoverable value of the asset is greater than the carrying amount and therefore no impairment losses have been recognised. Refer to the accounting policy for goodwill for further information.
10d. Insurance and other receivables
31 December 2016 £m
31 December 2015 £m
Insurance receivables*1 606.6 437.0
Trade receivables 172.4 92.1
Prepayments and accrued income 5.9 8.0
Total insurance and other receivables 784.9 537.1
*1 Insurance receivables at 31 December 2016 includes £37.7 million in respect of salvage and subrogation recoveries.
Financial Statements Additional InformationCorporate GovernanceStrategic Report Introduction
125Admiral Group plc · Annual Report and Accounts 2016
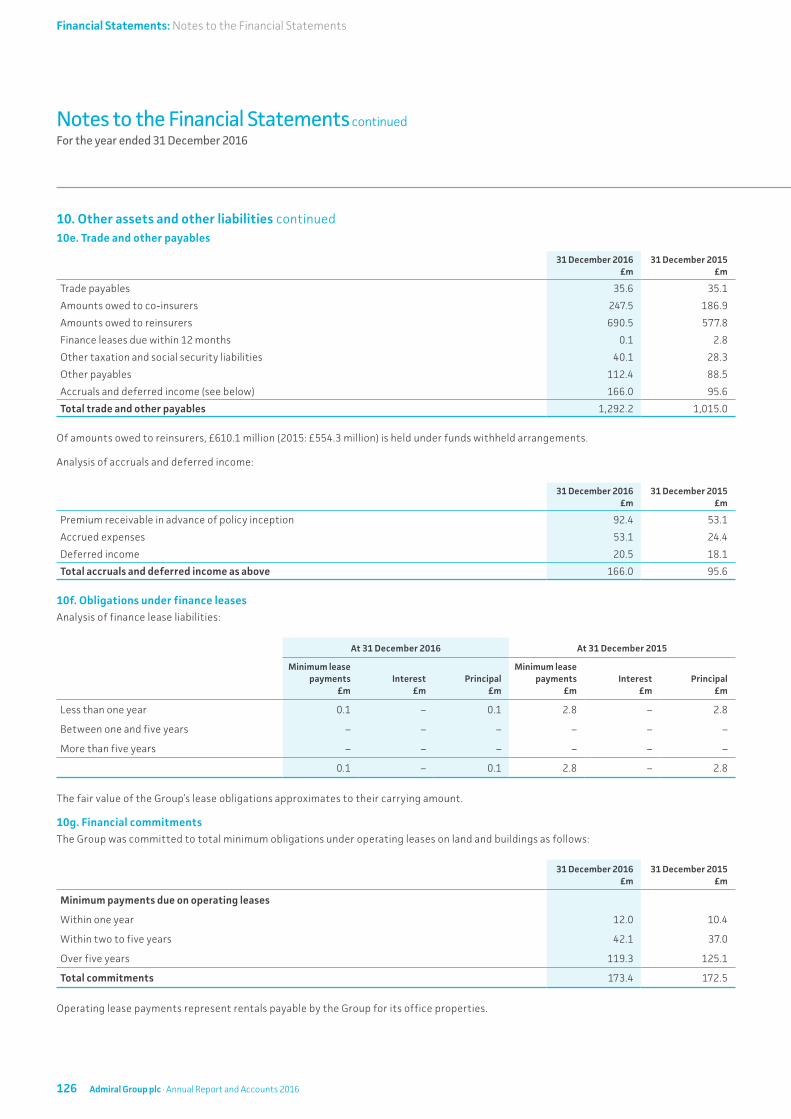
Notes to the Financial Statements continuedFor the year ended 31 December 2016
10. Other assets and other liabilities continued10e. Trade and other payables
31 December 2016 £m
31 December 2015 £m
Trade payables 35.6 35.1
Amounts owed to co-insurers 247.5 186.9
Amounts owed to reinsurers 690.5 577.8
Finance leases due within 12 months 0.1 2.8
Other taxation and social security liabilities 40.1 28.3
Other payables 112.4 88.5
Accruals and deferred income (see below) 166.0 95.6
Total trade and other payables 1,292.2 1,015.0
Of amounts owed to reinsurers, £610.1 million (2015: £554.3 million) is held under funds withheld arrangements.
Analysis of accruals and deferred income:
31 December 2016 £m
31 December 2015 £m
Premium receivable in advance of policy inception 92.4 53.1
Accrued expenses 53.1 24.4
Deferred income 20.5 18.1
Total accruals and deferred income as above 166.0 95.6
10f. Obligations under finance leasesAnalysis of finance lease liabilities:
At 31 December 2016 At 31 December 2015
Minimum lease payments
£mInterest
£mPrincipal
£m
Minimum lease payments
£mInterest
£mPrincipal
£m
Less than one year 0.1 – 0.1 2.8 – 2.8
Between one and five years – – – – – –
More than five years – – – – – –
0.1 – 0.1 2.8 – 2.8
The fair value of the Group’s lease obligations approximates to their carrying amount.
10g. Financial commitments The Group was committed to total minimum obligations under operating leases on land and buildings as follows:
31 December 2016 £m
31 December 2015 £m
Minimum payments due on operating leases
Within one year 12.0 10.4
Within two to five years 42.1 37.0
Over five years 119.3 125.1
Total commitments 173.4 172.5
Operating lease payments represent rentals payable by the Group for its office properties.
Financial Statements: Notes to the Financial Statements
126 Admiral Group plc · Annual Report and Accounts 2016

11. Share capital11a. Accounting policies(i) Share capital
Shares are classified as equity when there is no obligation to transfer cash or other assets.
(ii) Dividends
Dividends are recorded in the period in which they are declared and paid.
11b. DividendsDividends were declared and paid as follows:
31 December 2016 £m
31 December 2015 £m
March 2015 (49.0 pence per share, paid May 2015) – 134.4
August 2015 (51.0 pence per share, paid October 2015) – 140.2
March 2016 (63.4 pence per share, paid June 2016) 175.4 –
August 2016 (62.9 pence per share, paid October 2016) 174.4 –
Total dividends 349.8 274.6
The dividends declared in March represent the final dividends paid in respect of the 2014 and 2015 financial years. The dividends declared in August are interim distributions in respect of 2015 and 2016.
A final dividend of 51.5 pence per share (£144 million) has been proposed in respect of the 2016 financial year. Refer to the Strategic Report for further detail.
11c. Earnings per share
31 December 2016 £m
31 December 2015 £m
Profit for the financial year after taxation attributable to equity shareholders 222.2 300.0
Weighted average number of shares – basic 282,419,324 279,627,738
Unadjusted earnings per share – basic 78.7p 107.3p
Weighted average number of shares – diluted 283,033,681 280,018,741
Unadjusted earnings per share – diluted 78.5p 107.1p
The difference between the basic and diluted number of shares at the end of 2016 (being 614,357; 2015: 391,003) relates to awards committed, but not yet issued under the Group’s share schemes. Refer to note 8 for further detail.
Financial Statements Additional InformationCorporate GovernanceStrategic Report Introduction
127Admiral Group plc · Annual Report and Accounts 2016

Notes to the Financial Statements continuedFor the year ended 31 December 2016
11. Share capital continued11d. Share capital
31 December 2016 £m
31 December 2015 £m
Authorised
500,000,000 ordinary shares of 0.1 pence 0.5 0.5
Issued, called up and fully paid
284,352,270 ordinary shares of 0.1 pence 0.3 –
281,587,953 ordinary shares of 0.1 pence – 0.3
0.3 0.3
During 2016 2,764,317 (2015: 2,898,211) new ordinary shares of 0.1 pence were issued to the trusts administering the Group’s share schemes.
764,317 (2015: 948,211) of these were issued to the Admiral Group Share Incentive Plan Trust for the purposes of this share scheme to give a closing number at 31 December 2016 of 8,944,922 (31 December 2015: 8,180,605). These shares are entitled to receive dividends.
2,000,000 (2015: 1,950,000) were issued to the Admiral Group Employee Benefit Trust for the purposes of the Discretionary Free Share Scheme to give a closing number at 31 December 2016 of 16,811,948 (31 December 2015: 14,811,948). The Trustees have waived the right to dividend payments, other than to the extent of 0.001 pence per share, unless and to the extent otherwise directed by the Company from time to time.
The number of shares in issue at flotation was 258,595,400. There is one class of share with no unusual restrictions.
11e. Objectives, policies and procedures for managing capitalThe Group manages its capital to ensure that all entities within the Group are able to continue as going concerns and also to ensure that regulated entities meet regulatory requirements with an appropriate margin. Excess capital above these levels within subsidiaries is paid up to the Group holding company in the form of dividends on a regular basis.
The Group’s dividend policy is to make distributions after taking into account capital that is required to be held a) for regulatory purposes; b) to fund expansion activities; and c) as a further buffer against unforeseen events. This policy gives the Directors flexibility in managing the Group’s capital.
The Group’s regulatory capital requirements are discussed in the Group Financial Review within the Strategic Report.
Financial Statements: Notes to the Financial Statements
128 Admiral Group plc · Annual Report and Accounts 2016
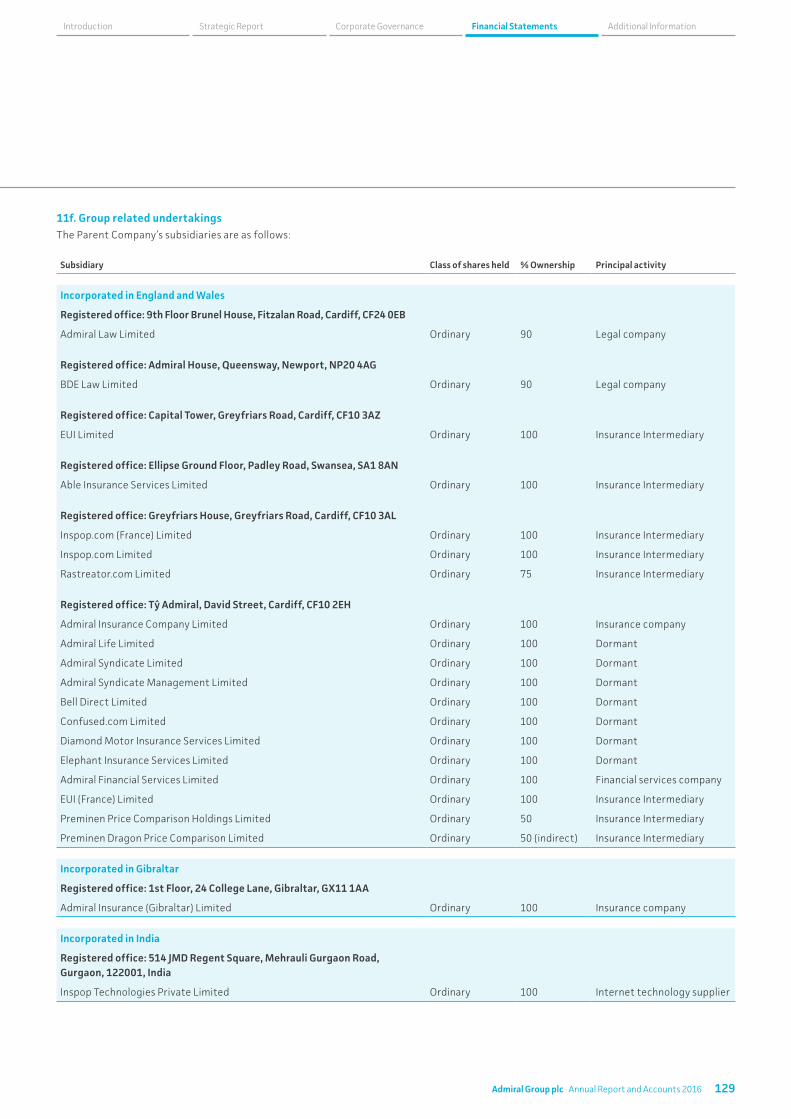
11f. Group related undertakingsThe Parent Company’s subsidiaries are as follows:
Subsidiary Class of shares held % Ownership Principal activity
Incorporated in England and Wales
Registered office: 9th Floor Brunel House, Fitzalan Road, Cardiff, CF24 0EB
Admiral Law Limited Ordinary 90 Legal company
Registered office: Admiral House, Queensway, Newport, NP20 4AG
BDE Law Limited Ordinary 90 Legal company
Registered office: Capital Tower, Greyfriars Road, Cardiff, CF10 3AZ
EUI Limited Ordinary 100 Insurance Intermediary
Registered office: Ellipse Ground Floor, Padley Road, Swansea, SA1 8AN
Able Insurance Services Limited Ordinary 100 Insurance Intermediary
Registered office: Greyfriars House, Greyfriars Road, Cardiff, CF10 3AL
Inspop.com (France) Limited Ordinary 100 Insurance Intermediary
Inspop.com Limited Ordinary 100 Insurance Intermediary
Rastreator.com Limited Ordinary 75 Insurance Intermediary
Registered office: Tŷ Admiral, David Street, Cardiff, CF10 2EH
Admiral Insurance Company Limited Ordinary 100 Insurance company
Admiral Life Limited Ordinary 100 Dormant
Admiral Syndicate Limited Ordinary 100 Dormant
Admiral Syndicate Management Limited Ordinary 100 Dormant
Bell Direct Limited Ordinary 100 Dormant
Confused.com Limited Ordinary 100 Dormant
Diamond Motor Insurance Services Limited Ordinary 100 Dormant
Elephant Insurance Services Limited Ordinary 100 Dormant
Admiral Financial Services Limited Ordinary 100 Financial services company
EUI (France) Limited Ordinary 100 Insurance Intermediary
Preminen Price Comparison Holdings Limited Ordinary 50 Insurance Intermediary
Preminen Dragon Price Comparison Limited Ordinary 50 (indirect) Insurance Intermediary
Incorporated in Gibraltar
Registered office: 1st Floor, 24 College Lane, Gibraltar, GX11 1AA
Admiral Insurance (Gibraltar) Limited Ordinary 100 Insurance company
Incorporated in India
Registered office: 514 JMD Regent Square, Mehrauli Gurgaon Road, Gurgaon, 122001, India
Inspop Technologies Private Limited Ordinary 100 Internet technology supplier
Financial Statements Additional InformationCorporate GovernanceStrategic Report Introduction
129Admiral Group plc · Annual Report and Accounts 2016

Notes to the Financial Statements continuedFor the year ended 31 December 2016
11. Share capital continued11f. Group related undertakings continued
Subsidiary Class of shares held % Ownership Principal activity
Incorporated in Spain
Registered office: Paseo Castellana 163 4 Izq, 28046 Madrid
Comparaseguros Correduría de Seguros, S.L., Sociedad Unipersonal Ordinary 75 (indirect) Insurance Intermediary
Incorporated in the United States of America
Registered office: Deep Run 1; Suite 400, 9950 Mayland Drive, Henrico, VA 23233
Elephant Insurance Company Ordinary 100 Insurance company
Elephant Insurance Services LLC Ordinary 100 Insurance Intermediary
Registered office: 140 East Shore Drive, Suite 300, Glen Allen, VA 23059
comparenow.com Insurance Agency LLC Ordinary 71.1 (indirect) Insurance Intermediary
Inspop USA LLC Ordinary 71.1 Insurance Intermediary
Incorporated in China
Registered office: Room 1806, Block 16 Jianwai SOHO, No. 39 East 3rd Ring Road, Chaoyang District, Beijing
Long Yu Science and Technology (Beijing) CO., Limited Ordinary 20.5 (indirect) Insurance Intermediary
For further information on how the Group conducts its business across the UK, Europe and the US, refer to the Strategic Report.
11g. Related party transactionsDetails relating to the remuneration and shareholdings of key management personnel are set out in the Directors’ Remuneration Report. Key management personnel are able to obtain discounted motor insurance at the same rates as all other Group staff, typically at a reduction of 15%.
The Board considers that only the Executive Directors of Admiral Group plc are key management personnel. Aggregate compensation for the Executive Directors is disclosed in the Directors’ Remuneration Report.
Financial Statements: Notes to the Financial Statements
130 Admiral Group plc · Annual Report and Accounts 2016

12. ReconciliationsThe following tables reconcile significant key performance indicators and non-GAAP measures included in the Strategic Report to items included in the financial statements.
12a. Reconciliation of turnover to reported gross premiums written and Other Revenue as per the financial statements
31 December 2016 £m
31 December 2015 £m
Gross premiums written after co-insurance per note 5b of financial statements 1,482.0 1,199.9
Premiums underwritten through co-insurance arrangements 711.9 605.3
Total premiums written before co-insurance arrangements 2,193.9 1,805.2
Other Revenue per note 7b of financial statements 360.6 319.8
2,554.5 2,125.0
UK vehicle commission*1 (20.9) (31.8)
Other*2 21.4 11.4
Turnover as per note 4b of financial statements 2,555.0 2,104.6
Intra-group income elimination*3 20.8 14.2
Total turnover 2,575.8 2,118.8
*1 During 2012 Admiral ceased earning Other Revenue from the sale of non-optional legal protection policies. At the same point, the Group began charging its panel of co- and reinsurers a vehicle commission. The substance of these changes meant that the total premiums written increased by the amount of revenue that was previously earned from the sale of non-optional legal protection policies. The vehicle commission included within Other Revenue is therefore eliminated from the turnover measure to avoid double counting.
*2 Other reconciling items represent co-insurer and reinsurer shares of Other Revenue in the Group’s International Car Insurance businesses.
*3 Intra-group income elimination relates to price comparison income earned in the Group from other Group companies.
12b. Reconciliation of claims incurred to reported loss ratios, excluding releases on commuted reinsurance
31 December 2016 31 December 2015
UK Car £m
International Car £m
Group £m
UK Car £m
International Car£m
Group £m
Net insurance claims 290.1 76.5 394.5 150.5 51.6 226.5
Net claims handling expenses (11.0) – (11.2) (9.4) – (9.4)
Reinsurer cap impact – (6.4) (6.4) – (2.9) (2.9)
Reserve releases on commuted reinsurance 17.1 – 17.1 88.8 – 88.8
Other adjustment*1 – (1.0) (1.0) – (0.6) (0.6)
Adjusted net claims 296.2 69.1 393.0 229.9 48.1 302.4
Net insurance premium revenue 404.3 94.3 548.8 358.6 64.5 467.0
Other adjustment*1 – (3.0) (3.0) – (2.2) (2.2)
Adjusted net insurance premium revenue 404.3 91.3 545.8 358.6 62.3 464.8
Reported loss ratio 73.3% 75.7% 72.0% 64.1% 77.2% 65.1%
*1 Other adjustments relate to additional products underwritten in the Group’s international car insurance businesses. The contribution from these products is reported as ancillary income and as such the amounts are excluded for the purpose of calculation of loss and expense ratios.
Financial Statements Additional InformationCorporate GovernanceStrategic Report Introduction
131Admiral Group plc · Annual Report and Accounts 2016

12. Reconciliations continued12c. Reconciliation of expenses related to insurance contracts to reported expense ratios
31 December 2016 31 December 2015
UK Car £m
International Car£m
Group £m
UK Car £m
International Car£m
Group £m
Net insurance expenses 46.2 41.1 94.0 41.5 37.0 83.1
Net claims handling expenses 11.0 – 11.2 9.4 – 9.4
Reinsurer cap impact – (1.5) (1.5) – (9.8) (9.8)
Intra-group expenses elimination*1 13.7 7.1 20.8 9.5 4.7 14.2
Other adjustment*2 – (2.0) (2.0) – (1.6) (1.6)
Adjusted net expenses 70.9 44.7 122.5 60.4 30.3 95.3
Net insurance premium revenue 404.3 94.3 548.8 358.6 64.5 467.0
Other adjustment*2 – (3.0) (3.0) – (2.2) (2.2)
Adjusted net insurance premium revenue 404.3 91.3 545.8 358.6 62.3 464.8
Reported expense ratio 17.5% 49.0% 22.4% 16.9% 48.6% 20.5%
*1 The intra-group expenses elimination amount relates to aggregator fees charged by the Group’s price comparison entities to other Group companies.
*2 Other adjustments relate to additional products underwritten in the Group’s international car insurance businesses. The contribution from these products is reported as ancillary income and as such the amounts are excluded for the purpose of calculation of loss and expense ratios.
12d. Reconciliation of statutory profit before tax to Group's share of profit before tax
31 December 2016 £m
31 December 2015 £m
Statutory profit before tax per the Consolidated Income Statement 278.4 368.7
Non-controlling interest share of profit before tax 5.9 8.1
Group’s share of profit before tax (Post Ogden) 284.3 376.8
Impact of reduction in UK Ogden discount rate 105.4 –
Group’s share of profit before tax (Pre Ogden) 389.7 376.8
Notes to the Financial Statements continuedFor the year ended 31 December 2016
132 Admiral Group plc · Annual Report and Accounts 2016
Financial Statements: Notes to the Financial Statements
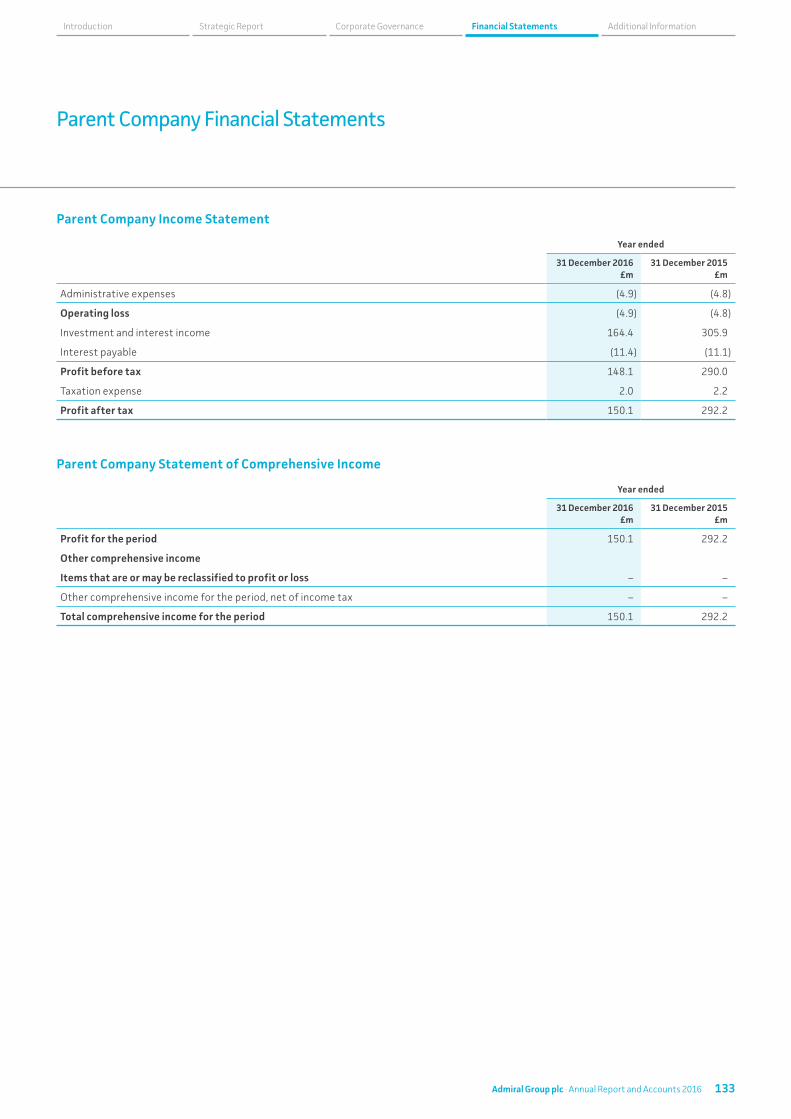
Parent Company Financial Statements
Parent Company Income Statement
Year ended
31 December 2016 £m
31 December 2015 £m
Administrative expenses (4.9) (4.8)
Operating loss (4.9) (4.8)
Investment and interest income 164.4 305.9
Interest payable (11.4) (11.1)
Profit before tax 148.1 290.0
Taxation expense 2.0 2.2
Profit after tax 150.1 292.2
Parent Company Statement of Comprehensive Income
Year ended
31 December 2016 £m
31 December 2015£m
Profit for the period 150.1 292.2
Other comprehensive income
Items that are or may be reclassified to profit or loss – –
Other comprehensive income for the period, net of income tax – –
Total comprehensive income for the period 150.1 292.2
Financial Statements Additional InformationCorporate GovernanceStrategic Report Introduction
133Admiral Group plc · Annual Report and Accounts 2016

Parent Company Statement of Financial Position
Note
As at
31 December 2016 £m
31 December 2015 £m
ASSETS
Shares in group undertakings 2 308.3 293.5
Intangible assets 1.2 1.2
Financial investments 3 217.4 234.4
Corporation tax asset 2.1 2.0
Trade and other receivables 0.2 –
Cash and cash equivalents 3 6.9 5.9
Total assets 536.1 537.0
EQUITY
Share capital 5 0.3 0.3
Share premium account 13.1 13.1
Retained earnings 89.5 255.9
Total equity 102.9 269.3
LIABILITIES
Subordinated and other financial liabilities 3 224.0 223.9
Trade and other payables 4 209.2 43.8
Total liabilities 433.2 267.7
Total equity and total liabilities 536.1 537.0
The accompanying notes form part of these financial statements.
These financial statements were approved by the Board of Directors on 7 March 2017 and were signed on its behalf by:
Geraint JonesChief Financial Officer Admiral Group plc
Company Number: 03849958
Parent Company Financial Statements continued
134 Admiral Group plc · Annual Report and Accounts 2016
Financial Statements: Parent Company Financial Statements

Parent Company Statement of Changes in Equity
Share capital £m
Share premium account
£m
Retained profit and loss
£mTotal equity
£m
At 1 January 2015 0.3 13.1 209.1 222.5
Profit for the period – – 292.2 292.2
Other comprehensive income – – – –
Total comprehensive income for the period – – 292.2 292.2
Transactions with equity holders
Dividends – – (274.6) (274.6)
Issues of share capital – – – –
Share scheme charges – – 29.2 29.2
Total transactions with equity holders – – (245.4) (245.4)
As at 31 December 2015 0.3 13.1 255.9 269.3
At 1 January 2016 0.3 13.1 255.9 269.3
Profit for the period – – 150.1 150.1
Other comprehensive income – – – –
Total comprehensive income for the period – – 150.1 150.1
Transactions with equity holders
Dividends – – (349.8) (349.8)
Issues of share capital – – – –
Share scheme credit – – 33.2 33.2
Deferred tax on share scheme credit – – 0.1 0.1
Total transactions with equity holders – – (316.5) (316.5)
As at 31 December 2016 0.3 13.1 89.5 102.9
Financial Statements Additional InformationCorporate GovernanceStrategic Report Introduction
135Admiral Group plc · Annual Report and Accounts 2016

1. Accounting policies1.1 Basis of preparationThese financial statements were prepared in accordance with Financial Reporting Standard 101 Reduced Disclosure Framework (FRS 101). The amendments to FRS 101 (2015/16 Cycle) issued in June 2016 and effective immediately have been applied. The financial statements are prepared on the historical cost basis except for the revaluation of financial assets classified as fair value through profit or loss.
In preparing these financial statements, the Company applies the recognition, measurement and disclosure requirements of International Financial Reporting Standards as adopted by the EU (“Adopted IFRSs”), but makes amendments where necessary in order to comply with Companies Act 2006 and has set out below where advantage of the FRS 101 disclosure exemptions has been taken.
1.2 Disclosure exemptions applied under FRS 101The Company has taken advantage of the following disclosure exemptions under FRS 101:
• FRS 101.8 (d): the requirement of IFRS 7 Financial Instruments: Disclosure to make disclosures about financial instruments
• FRS 101.8 (f): the requirement in paragraph 38 of IAS 1 Presentation of Financial Statements to present comparative information in respect of:
– paragraph 118(3) of IAS 38 Intangible Assets
• FRS 101.8 (g): the requirements of paragraphs 10(d), 10(f), 16, 38A, 38B, 38C, 38D, 40A, 40B, 40C, 40D and 111 of IAS 1 Presentation of Financial Statements to produce a cash flow statement, a third balance sheet and to make an explicit and unreserved statement of compliance with IFRSs
• FRS 101.8 (h): the requirements of IAS 7 Statements of Cash Flows to produce a cash flow statement
• FRS 101.8 (i): the requirements of paragraphs 30 and 31 of IAS 8 Accounting Policies, Changes in Accounting Estimates and Errors to include a list of new IFRSs that have been issued but that have yet to be applied
• FRS 101.8 (k): the requirements in IAS 24 Related Party Disclosures to disclose related party transactions entered into between two or more members of a group, provided that any subsidiary which is a party to transaction is wholly owned by such a member
The accounting policies set out below have, unless otherwise stated, been applied consistently to all periods presented in these financial statements.
1.3 Going concernThe financial statements have been prepared on a going concern basis. In considering the appropriateness of this assumption, the Board have reviewed the Company's projections for the next twelve months and beyond, including cash flow forecasts and regulatory capital surpluses.
The Directors have a reasonable expectation that the Company has adequate resources to continue in operational existence for the foreseeable future. Thus they continue to adopt the going concern basis in preparing the annual financial statements.
1.4 Critical accounting judgements In applying the Group’s accounting policies as described below management has primarily applied judgement in the impairment testing of the Company’s investment in group undertakings. Management has applied judgement in determining whether the carrying value of the investment, or asset may be supported by the recoverable amount calculation based on the ‘value in use’ of the asset (the net present value of future cash-flows arising from the asset).
In calculating the net present value of future cash-flows, management has made assumptions over the timing and amount of underlying profit projections of the relevant undertakings, long term growth rates in those projections and the discount rate applied to those projections that is appropriate to reflect the market’s view of the risk of the relevant investment.
Notes to Parent Company Financial StatementsFor the year ended 31 December 2016
136 Admiral Group plc · Annual Report and Accounts 2016
Financial Statements: Notes to the Parent Company Financial Statements

1.5 Shares in Group UndertakingsShares in Group undertakings are valued at cost less any provision for impairment in value.
The requirements of IAS 36 are applied to determine whether it is necessary to recognise any impairment loss with respect to the Company’s investments in subsidiaries. When necessary, the entire carrying amount of the investment is tested for impairment in accordance with IAS 36 Impairment of Assets as a single asset by comparing its recoverable amount (higher of value in use and fair value less costs of disposal) with its carrying amount. Any impairment loss recognised forms part of the carrying amount of the investment. Any reversal of that impairment loss is recognised in accordance with IAS 36 to the extent that the recoverable amount of the investment subsequently increases.
1.6 Employee share schemes
The Company operates a number of share schemes for its employees. For equity settled schemes commencing 1 January 2004 and after, the fair value of the employee services received in exchange for the grant of free shares under the schemes is recognised as an increase in equity in the Company.
1.7 TaxationThe charge for taxation is based on the profit for the year and takes into account taxation deferred because of timing differences between the treatment of certain items for taxation and accounting purposes.
Deferred tax assets are recognised to the extent that they are regarded as recoverable. They are regarded as recoverable to the extent that, on the basis of all available evidence, it can be regarded as more likely than not that there will be sufficient taxable profits from which the future reversal of the underlying timing differences can be deducted.
1.8 Financial assets and liabilitiesAll investments held at fair value at the end of the period are invested in AAA-rated money market liquidity funds. The measurement of these investments is based on active quoted market values (level 1).
Investments classified as held to maturity are comprised of UK government gilts, and are held in the Statement of Financial Position at amortised cost.
Cash and cash equivalents include cash in hand and deposits held at call with banks. All cash and cash equivalents are measured at amortised cost.
The Company’s financial liabilities comprise subordinated notes which are held at amortised cost using the effective interest method and a credit facility held at amortised cost.
2. Shares in Group undertakings
£m
Investments in subsidiary undertakings:
At 1 January 2015 243.1
Additions 50.4
At 31 December 2015 293.5
Additions 14.8
At 31 December 2016 308.3
A full list of the Company’s subsidiaries is disclosed in note 11 of the consolidated financial statements.
Financial Statements Additional InformationCorporate GovernanceStrategic Report Introduction
137Admiral Group plc · Annual Report and Accounts 2016

3. Financial assets and liabilitiesThe Company’s financial instruments can be analysed as follows:
31 December 2016 £m
31 December 2015 £m
Investments held at fair value through profit or loss
Money market funds – 16.1
– 16.1
Investments classified as held to maturity
Term deposits with credit institutions 20.0 20.1
Gilts 197.4 198.2
217.4 218.3
Total financial investments 217.4 234.4
Trade and other receivables 0.2 –
Cash and cash equivalents 6.9 5.9
Total financial assets 224.5 240.3
Financial liabilities
Subordinated notes 204.0 203.9
Other borrowings 20.0 20.0
Trade and other payables 209.2 43.8
Total financial liabilities 433.2 267.7
The amortised cost carrying amount of receivables is a reasonable approximation of fair value. The fair values of gilts and subordinated notes (both level one valuations) together with their carrying values shown in the Statement of Financial Position are as follows:
31 December 2016 31 December 2015
Carrying amount £m
Fair value £m
Carrying amount £m
Fair value £m
Financial assets
Gilts 197.4 225.4 198.2 211.7
Financial liabilities
Subordinated notes 204.0 212.9 203.9 202.4
4. Trade and other payables
31 December 2016 £m
31 December 2015 £m
Trade and other payables 0.2 2.1
Amounts owed to subsidiary undertakings 209.0 41.7
Total trade and other payables 209.2 43.8
Notes to Parent Company Financial Statements continuedFor the year ended 31 December 2016
138 Admiral Group plc · Annual Report and Accounts 2016
Financial Statements: Notes to the Parent Company Financial Statements

5. Share capital
31 December 2016 £m
31 December 2015 £m
Authorised
500,000,000 ordinary shares of 0.1 pence 0.5 0.5
Issued, called up and fully paid
284,352,270 ordinary shares of 0.1 pence 0.3 –
281,587,953 ordinary shares of 0.1 pence – 0.3
0.3 0.3
Dividends were declared and paid as follows:
31 December 2016 £m
31 December 2015 £m
March 2015 (49.0 pence per share, paid May 2015) – 134.4
August 2015 (51.0 pence per share, paid October 2015) – 140.2
March 2016 (63.4 pence per share, paid June 2016) 175.4 –
August 2016 (62.9 pence per share, paid October 2016) 174.4 –
Total dividends 349.8 274.6
The dividends declared in March represent the final dividends paid in respect of the 2014 and 2015 financial years. The dividends declared in August are interim distributions in respect of 2015 and 2016.
A final dividend of 51.5 pence per share (£144 million) has been proposed in respect of the 2016 financial year. Refer to the Strategic Report for further detail.
6. Continued application of Financial Reporting Standard (FRS) 101 – Reduced Disclosure FrameworkFollowing the first time application of FRS 101 Reduced Disclosure Framework in 2015, the Board considers that it is in the best interests of the Group for Admiral Group plc to continue to apply the FRS 101 Reduced Disclosure Framework in future periods. A shareholder or shareholders holding in aggregate 5% or more of the total allotted shares in Admiral Group plc may serve objections to the use of the disclosure exemptions on Admiral Group plc, in writing, to its registered office (Tŷ Admiral, David Street, Cardiff CF10 2EH) no later than 30 June 2017.
Financial Statements Additional InformationCorporate GovernanceStrategic Report Introduction
139Admiral Group plc · Annual Report and Accounts 2016

Basis of preparationThe figures below are as stated in the Group financial statements preceding this financial summary and issued previously. Only selected lines from the income statement and balance sheet have been included.
Income statement
2016 £m
2015 £m
2014 £m
2013 £m
2012 £m
Total premiums 2,193.9 1,805.2 1,675.6 1,737.6 1,897.2
Net insurance premium revenue 548.8 467.0 464.9 483.0 498.9
Other Revenue 360.6 319.8 332.5 327.8 361.1
Profit commission 54.3 85.4 71.8 99.3 108.4
Investment and interest income 53.1 32.6 15.4 14.3 15.9
Net revenue 1,016.8 904.8 884.6 924.4 984.3
Net insurance claims (394.6) (226.5) (259.1) (303.0) (404.5)
Net expenses (332.4) (298.5) (270.2) (251.2) (235.2)
Operating profit 289.8 379.8 355.3 370.2 344.6
Finance costs (11.4) (11.1) (4.6) – –
Profit before tax 278.4 368.7 350.7 370.2 344.6
Balance sheet
2016 £m
2015 £m
2014 £m
2013 £m
2012 £m
Property and equipment 32.0 34.9 32.3 12.4 16.5
Intangible assets 162.3 142.3 107.2 92.8 92.5
Deferred income tax 8.4 20.6 22.9 17.0 15.2
Reinsurance assets 1,126.4 878.7 829.8 821.2 803.0
Insurance and other receivables 784.9 537.1 435.3 445.6 458.8
Financial investments 2,420.2 2,323.5 2,194.1 1,896.9 1,601.6
Cash and cash equivalents 326.6 265.3 255.9 187.9 216.6
Total assets 4,860.8 4,202.4 3,877.5 3,473.8 3,204.2
Equity 581.7 632.9 580.9 524.1 460.7
Insurance contracts 2,749.5 2,295.0 2,097.4 1,901.3 1,696.9
Subordinated and other financial liabilities 224.0 223.9 203.8 – –
Trade and other payables 1,292.2 1,015.0 965.8 1,013.7 1,006.5
Current tax liabilities 13.4 35.6 29.6 34.7 40.1
Total equity and total liabilities 4,860.8 4,202.4 3,877.5 3,473.8 3,204.2
Consolidated Financial Summary
140 Admiral Group plc · Annual Report and Accounts 2016
Additional Information: Consolidated Financial Summary
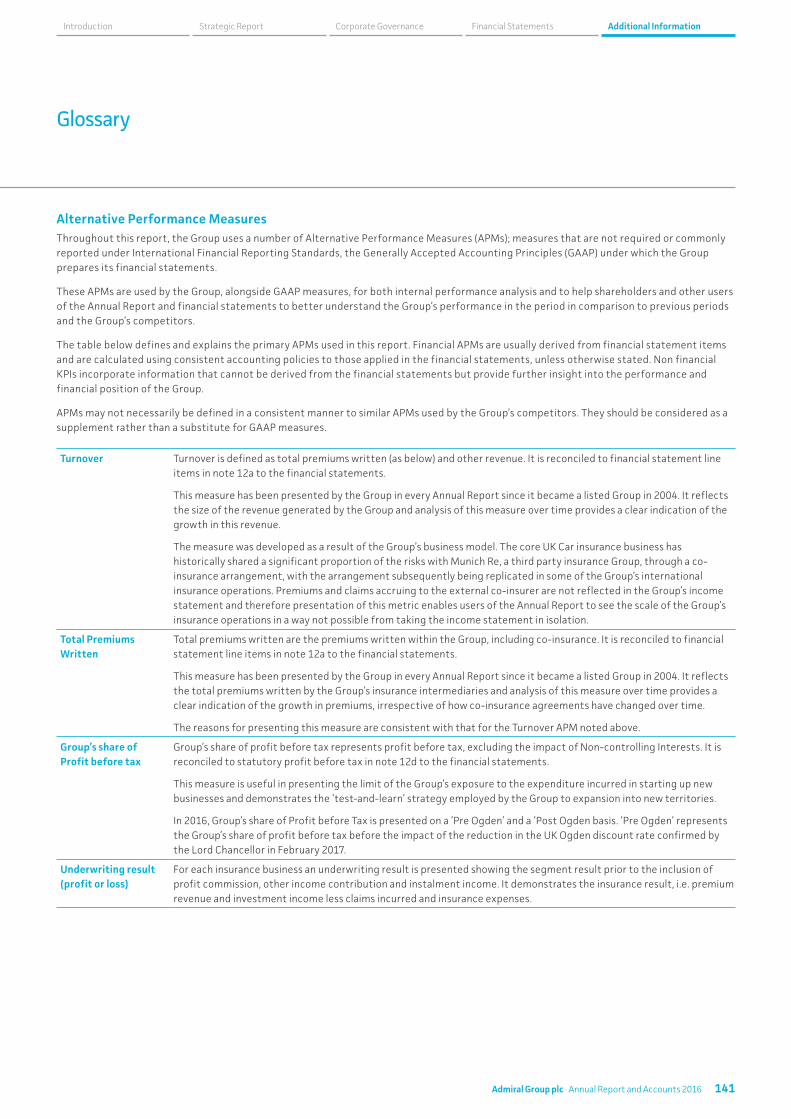
Alternative Performance MeasuresThroughout this report, the Group uses a number of Alternative Performance Measures (APMs); measures that are not required or commonly reported under International Financial Reporting Standards, the Generally Accepted Accounting Principles (GAAP) under which the Group prepares its financial statements.
These APMs are used by the Group, alongside GAAP measures, for both internal performance analysis and to help shareholders and other users of the Annual Report and financial statements to better understand the Group’s performance in the period in comparison to previous periods and the Group’s competitors.
The table below defines and explains the primary APMs used in this report. Financial APMs are usually derived from financial statement items and are calculated using consistent accounting policies to those applied in the financial statements, unless otherwise stated. Non financial KPIs incorporate information that cannot be derived from the financial statements but provide further insight into the performance and financial position of the Group.
APMs may not necessarily be defined in a consistent manner to similar APMs used by the Group’s competitors. They should be considered as a supplement rather than a substitute for GAAP measures.
Turnover Turnover is defined as total premiums written (as below) and other revenue. It is reconciled to financial statement line items in note 12a to the financial statements.
This measure has been presented by the Group in every Annual Report since it became a listed Group in 2004. It reflects the size of the revenue generated by the Group and analysis of this measure over time provides a clear indication of the growth in this revenue.
The measure was developed as a result of the Group’s business model. The core UK Car insurance business has historically shared a significant proportion of the risks with Munich Re, a third party insurance Group, through a co-insurance arrangement, with the arrangement subsequently being replicated in some of the Group’s international insurance operations. Premiums and claims accruing to the external co-insurer are not reflected in the Group’s income statement and therefore presentation of this metric enables users of the Annual Report to see the scale of the Group’s insurance operations in a way not possible from taking the income statement in isolation.
Total Premiums Written
Total premiums written are the premiums written within the Group, including co-insurance. It is reconciled to financial statement line items in note 12a to the financial statements.
This measure has been presented by the Group in every Annual Report since it became a listed Group in 2004. It reflects the total premiums written by the Group’s insurance intermediaries and analysis of this measure over time provides a clear indication of the growth in premiums, irrespective of how co-insurance agreements have changed over time.
The reasons for presenting this measure are consistent with that for the Turnover APM noted above.
Group’s share of Profit before tax
Group’s share of profit before tax represents profit before tax, excluding the impact of Non-controlling Interests. It is reconciled to statutory profit before tax in note 12d to the financial statements.
This measure is useful in presenting the limit of the Group’s exposure to the expenditure incurred in starting up new businesses and demonstrates the ‘test-and-learn’ strategy employed by the Group to expansion into new territories.
In 2016, Group’s share of Profit before Tax is presented on a ‘Pre Ogden’ and a ‘Post Ogden basis. ‘Pre Ogden’ represents the Group’s share of profit before tax before the impact of the reduction in the UK Ogden discount rate confirmed by the Lord Chancellor in February 2017.
Underwriting result (profit or loss)
For each insurance business an underwriting result is presented showing the segment result prior to the inclusion of profit commission, other income contribution and instalment income. It demonstrates the insurance result, i.e. premium revenue and investment income less claims incurred and insurance expenses.
Glossary
Financial Statements Additional InformationCorporate GovernanceStrategic Report Introduction
141Admiral Group plc · Annual Report and Accounts 2016

Glossary continued
Alternative Performance Measures continued
Loss Ratio Reported loss ratios are expressed as a percentage of claims incurred divided by net earned premiums.
There are a number of instances within the Annual Report where adjustments are made to this calculation in order to more clearly present the underlying performance of the Group and operating segments within the Group. The calculations of these are presented within note 12b to the accounts and explanation is as follows.
UK reported motor loss ratio: Within the UK insurance segment we separately present motor ratios, i.e. excluding the underwriting of other products that supplement the car insurance policy. The motor ratio is adjusted to i) exclude the impact of reserve releases on commuted reinsurance contracts and ii) exclude claims handling costs that are reported within claims costs in the income statement.
International insurance loss ratio: As for the UK motor loss ratio, the international insurance loss ratios presented exclude the underwriting of other products that supplement the car insurance policy. The motor ratio is adjusted to exclude the claims element of the impact of reinsurer caps as inclusion of the impact of the capping of reinsurer claims costs would distort the underlying performance of the business.
Group loss ratios: Group loss ratios are reported on a consistent basis as the UK and international ratios noted above. Adjustments are made to i) exclude the impact of reserve releases on commuted reinsurance contracts, ii) exclude claims handling costs that are reported within claims costs in the income statement and iii) exclude the claims element of the impact of international reinsurer caps.
Expense Ratio Reported expense ratios are expressed as a percentage of net operating expenses divided by net earned premiums.
There are a number of instances within the Annual Report where adjustments are made to this calculation in order to more clearly present the underlying performance of the Group and operating segments within the Group. The calculations of these are presented within note 12c to the accounts and explanation is as follows.
UK reported motor expense ratio: Within the UK insurance segment we separately present motor ratios, i.e. excluding the underwriting of other products that supplement the car insurance policy. The motor ratio is adjusted to i) include claims handling costs that are reported within claims costs in the income statement and ii) include intra-group aggregator fees charged by the UK price comparison business to the UK insurance business.
International insurance expense ratio: As for the UK motor loss ratio, the international insurance expense ratios presented exclude the underwriting of other products that supplement the car insurance policy. The motor ratio is adjusted to i) exclude the expense element of the impact of reinsurer caps as inclusion of the impact of the capping of reinsurer expenses would distort the underlying performance of the business and ii) include intra-group aggregator fees charged by the overseas price comparison businesses to the international insurance businesses.
Group expense ratios: Group expense ratios are reported on a consistent basis as the UK and international ratios noted above. Adjustments are made to i) include claims handling costs that are reported within claims costs in the income statement, ii) include intra-group aggregator fees charged by the Group’s price comparison businesses to the Group’s insurance businesses and iii) exclude the expense element of the impact of international reinsurer caps.
Combined Ratio Reported combined ratios are the sum of the loss and expense ratios as defined above. Explanation of these figures is noted above and reconciliation of the calculations are provided in notes 12b and 12c.
Return on Equity Return on equity is calculated as profit before tax for the period attributable to equity holders of the Group divided by the average total equity attributable to equity holders of the Group in the year. This average is determined by dividing the opening and closing positions for the year by two.
The relevant figures for this calculation can be found within the Consolidated Statement of Changes in Equity.
Group Customers Group customer numbers are the total number of car, household and van policyholders within the Group.
This measure has been presented by the Group in every Annual Report since it became a listed Group in 2004. It reflects the size of the Group’s customer base and analysis of this measure over time provides a clear indication of the growth. It is also a useful indicator of the growing significance to the Group of the different lines of business and geographic regions.
Effective Tax Rate Effective tax rate is defined as the approximate tax rate derived from dividing the Group’s profit before tax by the tax charge going through the income statement. It is a measure historically presented by the Group and enables users to see how the tax cost incurred by the Group compares over time and to current corporation tax rates.
142 Admiral Group plc · Annual Report and Accounts 2016
Additional Information: Glossary

Additional TerminologyThere are many other terms used in this report that are specific to the Group or the markets in which it operates. These are defined as follows:
Accident year The year in which an accident occurs, also referred to as the earned basis.
Actuarial best estimate
The probability-weighted average of all future claims and cost scenarios calculated using historical data, actuarial methods and judgement.
ASHE ‘Annual Survey of Hours and Earnings’ – a statistical index that is typically used for calculating inflation of annual payment amounts under Periodic Payment Order (PPO) claims settlements.
Claims reserves A monetary amount set aside for the future payment of incurred claims that have not yet been settled, thus representing a balance sheet liability.
Co-insurance An arrangement in which two or more insurance companies agree to underwrite insurance business on a specified portfolio in specified proportions. Each co-insurer is directly liable to the policyholder for their proportional share.
Commutation An agreement between a ceding insurer and the reinsurer that provides for the valuation, payment, and complete discharge of all obligations between the parties under a particular reinsurance contract.
Insurance market cycle
The tendency for the insurance market to swing between highs and lows of profitability over time, with the potential to influence premium rates (also known as the “underwriting cycle”).
Net claims The cost of claims incurred in the period, less any claims costs recovered under reinsurance contracts. It includes both claims payments and movements in claims reserves.
Net insurance premium revenue
Also referred to as net earned premium. The element of premium, less reinsurance premium, earned in the period.
Ogden discount rate The discount rate used in calculation of personal injury claims settlements. The rate is set by the Lord Chancellor, the most recent rate of minus 0.75% being announced on 27 February 2017.
Periodic Payment Order (PPO)
A compensation award as part of a claims settlement that involves making a series of annual payments to a claimant over their remaining life to cover the costs of the care they will require.
Premium A series of payments are made by the policyholder, typically monthly or annually, for part of or all of the duration of the contract. Written premium refers to the total amount the policyholder has contracted for, whereas earned premium refers to the recognition of this premium over the life of the contract.
Profit commission A clause found in some reinsurance and coinsurance agreements that provides for profit sharing.
Reinsurance Contractual arrangements whereby the Group transfers part or all of the insurance risk accepted to another insurer. This can be on a quota share basis (a percentage share of premiums, claims and expenses) or an excess of loss basis (full reinsurance for claims over an agreed value).
Ultimate loss ratio The projected ratio for a particular accident year or underwriting year, often used in the calculation of underwriting profit and profit commission.
Underwriting year The year in which the policy was incepted.
Underwriting year basis
Also referred to as the written basis. Claims incurred are allocated to the calendar year in which the policy was underwritten. Underwriting year basis results relate to the 2015 underwriting year, are calculated on the whole account (including co-insurance and reinsurance shares) and include all premiums, claims, expenses incurred and other revenue (for example instalment income and commission income relating to the sale of products that are ancillary to the main insurance policy) relating to policies incepting in the relevant underwriting year.
Written/Earned basis A policy can be written in one calendar year but earned over a subsequent calendar year.
Financial Statements Additional InformationCorporate GovernanceStrategic Report Introduction
143Admiral Group plc · Annual Report and Accounts 2016

Directors and advisors
DirectorsAlastair Lyons, CBE
Chairman
David Stevens, CBE
Chief Executive Officer
Geraint Jones
Chief Financial Officer
Owen Clarke
Non-Executive Director
Annette Court
Non-Executive Director
Colin Holmes
Non-Executive Director
Penny James
Non-Executive Director
Jean Park
Non-Executive Director
Justine Roberts, CBE
Non-Executive Director
Manning Rountree
Non-Executive Director
Company SecretaryMark Waters
Tŷ Admiral David Street Cardiff CF10 2EH
AuditorDeloitte LLP
2 New Street Square London EC4A 3BZ
Actuarial advisor Lane Clark & Peacock LLP
95 Wigmore Street London W1U 1DQ
BankersLloyds Bank plc
City Office Bailey Drive Gillingham Business Park Kent ME8 0LS
Registrar Capita Asset Services
The Registry 34 Beckenham Road Beckenham Kent BR3 4TU
Joint corporate brokers Bank of America Merrill Lynch
2 King Edward Street London EC1A 1HQ
UBS Investment Bank
5 Broadgate London EC2M 2QS
SolicitorsClifford Chance LLP
10 Upper Bank Street London E14 5JJ
144 Admiral Group plc · Annual Report and Accounts 2016
Additional Information: Directors and advisors

Price Comparison
Confused.com www.confused.com
Household Insurance
Admiral household insurance www.admiral.com/home-insurance
Law companies
Admiral Law www.admirallaw.co.uk BDE Law www.diamondlaw.co.uk
Loans
Admiral Loans www.admiral.com/loans
Van Insurance
Gladiator www.gladiator.co.uk
Corporate websiteThe Group’s corporate website is at www.admiralgroup.co.uk. A range of information about the Admiral Group is presented, including the Group’s history, financial reports and press releases, corporate responsibility and governance.
The website also includes the contact details for investor relations.
Financial calendar Final 2016 dividend
11 May 2017 – Ex dividend date 12 May 2017 – Record date 2 June 2017 – Payment date
Annual General Meeting
26 April 2017
Interim results
16 August 2017
The Group does not produce printed copies of interim results for shareholders unless requested.
The interim results will be available on the corporate website from 16 August 2017.
Registered officeTŷ Admiral David Street Cardiff CF10 2EH
UKCar Insurance
Admiral www.admiral.com elephant.co.uk www.elephant.co.uk Diamond www.diamond.co.uk Bell www.bell.co.uk
SpainCar Insurance
Balumba www.balumba.es Qualitas Auto www.qualitasauto.com
Price Comparison
Rastreator www.rastreator.com Seguros.es www.seguros.es
ItalyCar Insurance
ConTe www.conte.it
Admiral Group businesses
USACar Insurance
Elephant Auto www.elephant.com
Price Comparison
compare.com www.compare.com
FranceCar Insurance
L'olivier - assurance auto www.lolivier.fr
Price Comparison
LeLynx www.lelynx.fr
Financial Statements Additional InformationCorporate GovernanceStrategic Report Introduction
145Admiral Group plc · Annual Report and Accounts 2016

Registered office
Tŷ Admiral
David Street
Cardiff CF10 2EH
www.admiralgroup.co.uk
Annual Report and Accounts 2016
Adm
iral Group plc
Annual R
eport and Accounts 2016