ADM-Aeolus Airborne Campaigns - DLR · PDF fileADM-Aeolus Airborne Campaigns ......
26
Institut für Physik der Atmosphäre ADM-Aeolus Airborne Campaigns Oliver Reitebuch 1 , Andreas Dörnbrack 1 , Christian Lemmerz 1 , Zhigang Li 3 , Uwe Marksteiner 1 , Engelbert Nagel 1 , Ines Nikolaus 2 , Ulrike Paffrath 1 , Stephan Rahm 1 , Benjamin Witschas 1 1 DLR Oberpfaffenhofen, 2 Physics Solutions, 3 Ocean University Qingdao
Transcript of ADM-Aeolus Airborne Campaigns - DLR · PDF fileADM-Aeolus Airborne Campaigns ......
Institut für Physik der Atmosphäre
ADM-Aeolus Airborne Campaigns
Oliver Reitebuch1, Andreas Dörnbrack1, Christian Lemmerz1,Zhigang Li3, Uwe Marksteiner1, Engelbert Nagel1, Ines Nikolaus2,
Ulrike Paffrath1, Stephan Rahm1, Benjamin Witschas1
1DLR Oberpfaffenhofen, 2Physics Solutions, 3Ocean University Qingdao
Institut für Physik der Atmosphäre 33rd Lidar Working Group, Destin (FL), 2-4 Feb 2010
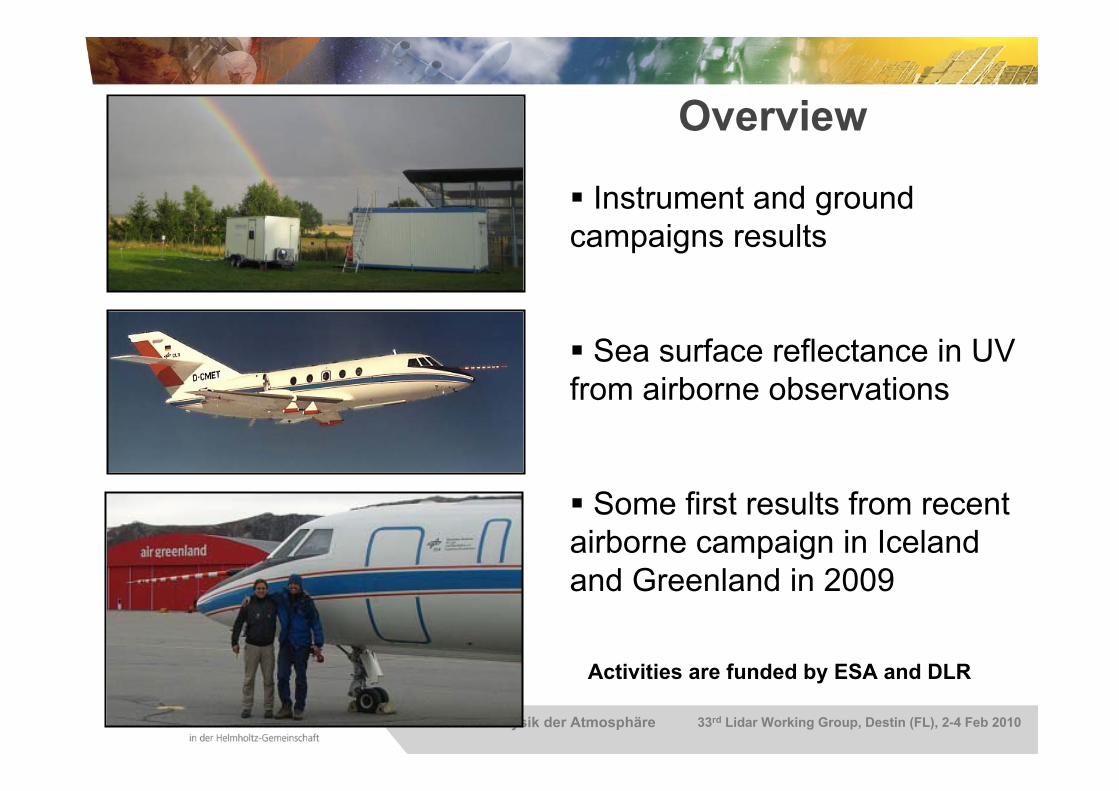
Overview
Instrument and groundcampaigns results
Sea surface reflectance in UV from airborne observations
Some first results from recentairborne campaign in Icelandand Greenland in 2009
Activities are funded by ESA and DLR
Institut für Physik der Atmosphäre 33rd Lidar Working Group, Destin (FL), 2-4 Feb 2010
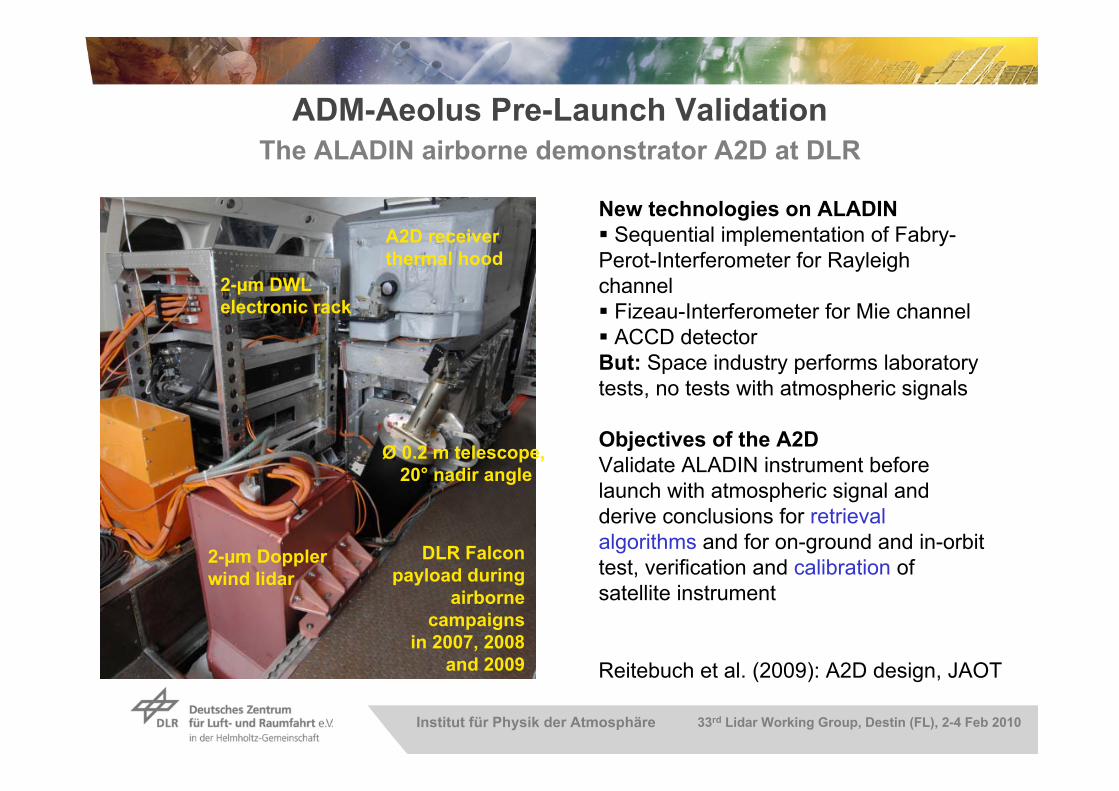
ADM-Aeolus Pre-Launch ValidationThe ALADIN airborne demonstrator A2D at DLR
2-µm Dopplerwind lidar
A2D receiverthermal hood
Ø 0.2 m telescope, 20° nadir angle
2-µm DWL electronic rack
New technologies on ALADIN Sequential implementation of Fabry-Perot-Interferometer for Rayleigh channel Fizeau-Interferometer for Mie channel ACCD detectorBut: Space industry performs laboratory tests, no tests with atmospheric signals
Objectives of the A2D Validate ALADIN instrument before launch with atmospheric signal and derive conclusions for retrieval algorithms and for on-ground and in-orbit test, verification and calibration of satellite instrument
DLR Falcon payload during
airborne campaigns
in 2007, 2008 and 2009 Reitebuch et al. (2009): A2D design, JAOT
Institut für Physik der Atmosphäre 33rd Lidar Working Group, Destin (FL), 2-4 Feb 2010
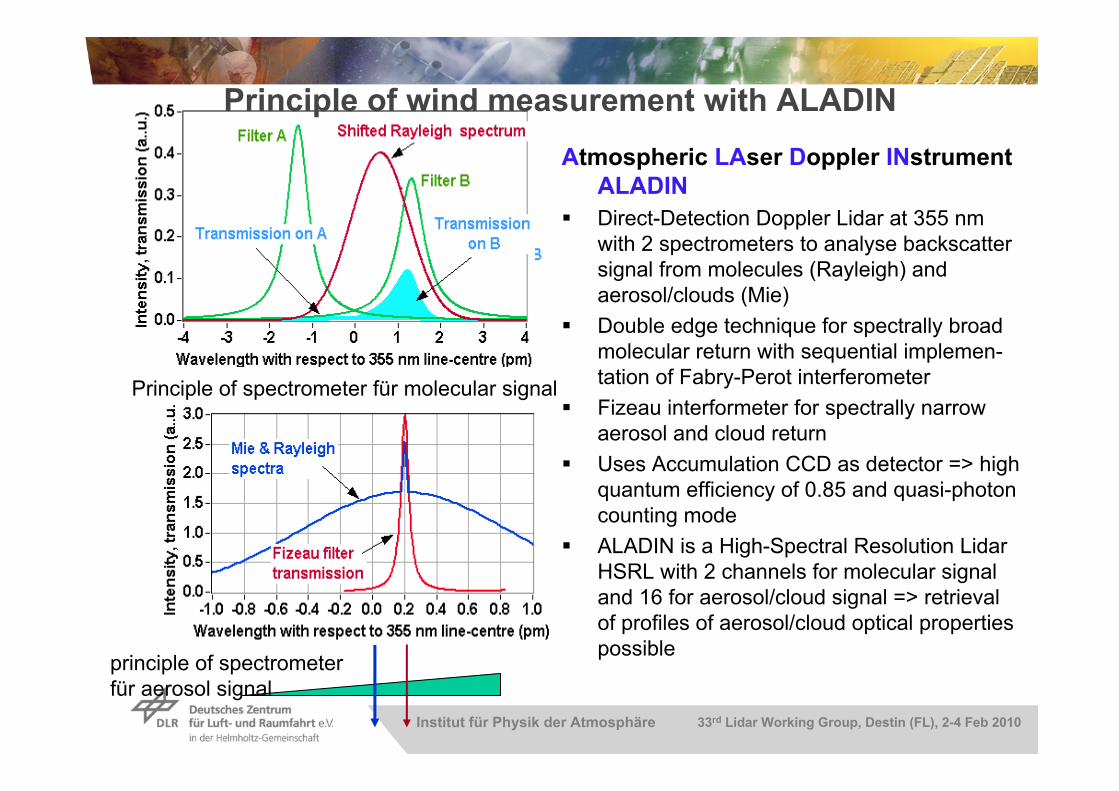
Atmospheric LAser Doppler INstrumentALADIN
Direct-Detection Doppler Lidar at 355 nm with 2 spectrometers to analyse backscatter signal from molecules (Rayleigh) and aerosol/clouds (Mie)
Double edge technique for spectrally broad molecular return with sequential implemen-tation of Fabry-Perot interferometer
Fizeau interformeter for spectrally narrow aerosol and cloud return
Uses Accumulation CCD as detector => high quantum efficiency of 0.85 and quasi-photon counting mode
ALADIN is a High-Spectral Resolution Lidar HSRL with 2 channels for molecular signal and 16 for aerosol/cloud signal => retrieval of profiles of aerosol/cloud optical properties possible
Principle of spectrometer für molecular signal
principle of spectrometer für aerosol signal
Principle of wind measurement with ALADIN
Institut für Physik der Atmosphäre 33rd Lidar Working Group, Destin (FL), 2-4 Feb 2010
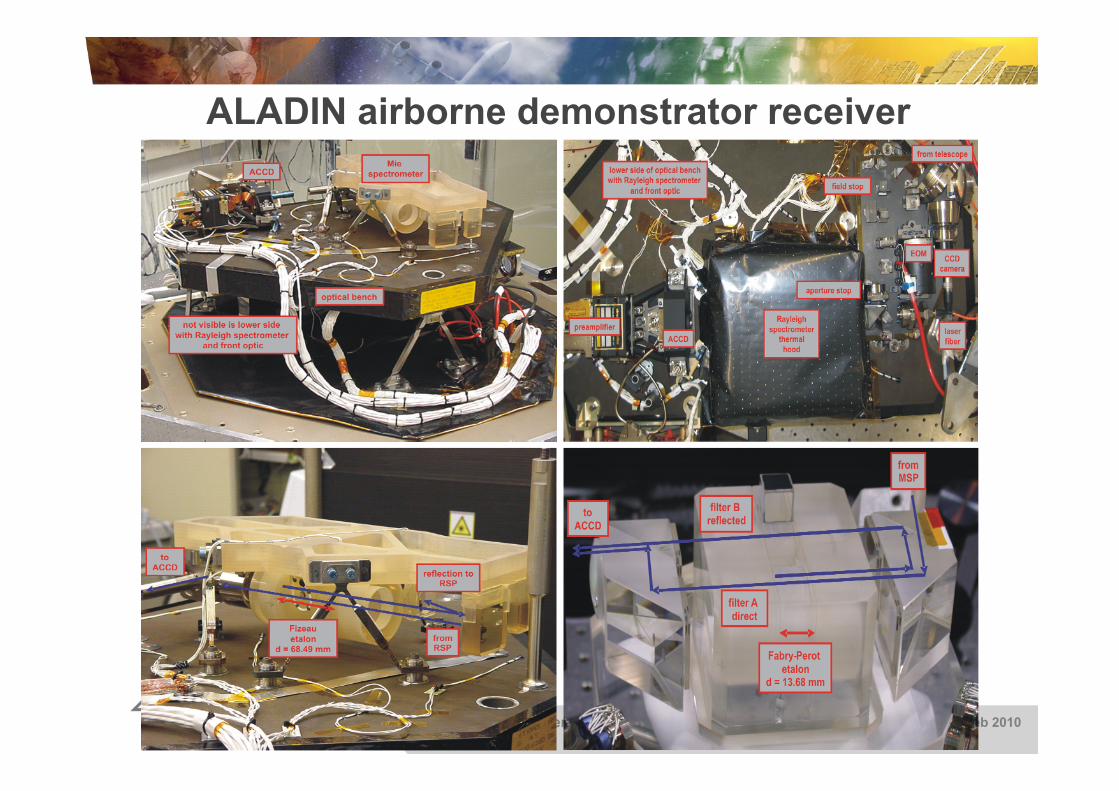
ALADIN airborne demonstrator receiver
Institut für Physik der Atmosphäre 33rd Lidar Working Group, Destin (FL), 2-4 Feb 2010
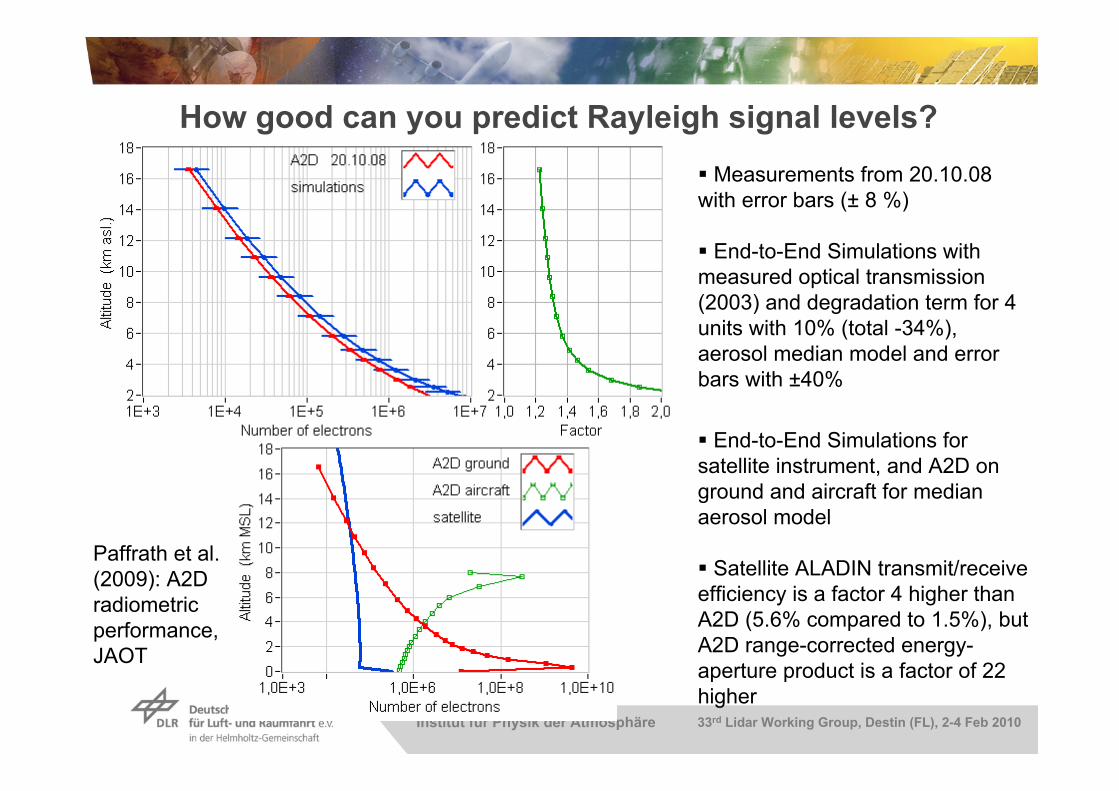
How good can you predict Rayleigh signal levels? Measurements from 20.10.08 with error bars (± 8 %)
End-to-End Simulations with measured optical transmission (2003) and degradation term for 4 units with 10% (total -34%), aerosol median model and error bars with ±40%
End-to-End Simulations for satellite instrument, and A2D on ground and aircraft for median aerosol model
Satellite ALADIN transmit/receive efficiency is a factor 4 higher than A2D (5.6% compared to 1.5%), but A2D range-corrected energy-aperture product is a factor of 22 higher
Paffrath et al. (2009): A2D radiometric performance, JAOT
Institut für Physik der Atmosphäre 33rd Lidar Working Group, Destin (FL), 2-4 Feb 2010
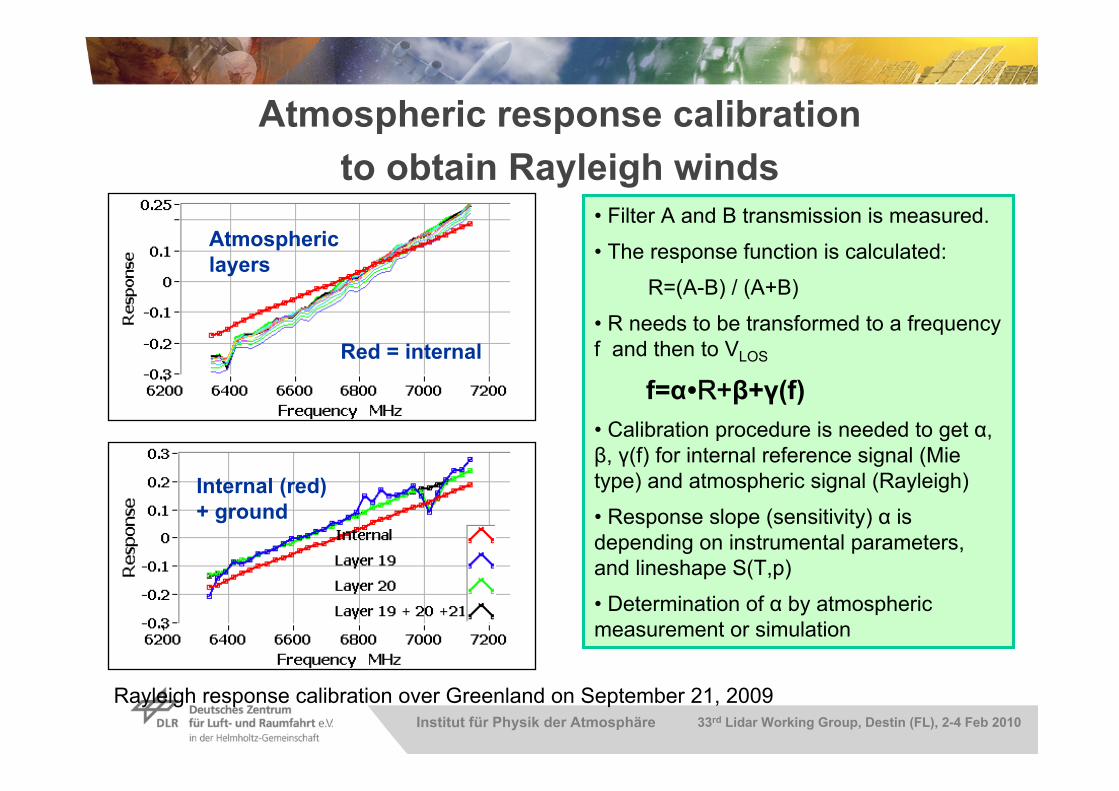
Internal (red) + ground
Red = internal
Rayleigh response calibration over Greenland on September 21, 2009
Atmosphericlayers
• Filter A and B transmission is measured.
• The response function is calculated:
R=(A-B) / (A+B)
• R needs to be transformed to a frequency f and then to VLOS
f=α∙R+β+γ(f)• Calibration procedure is needed to get α, β, γ(f) for internal reference signal (Mietype) and atmospheric signal (Rayleigh)
• Response slope (sensitivity) α isdepending on instrumental parameters, and lineshape S(T,p)
• Determination of α by atmosphericmeasurement or simulation
Atmospheric response calibration to obtain Rayleigh winds
Institut für Physik der Atmosphäre 33rd Lidar Working Group, Destin (FL), 2-4 Feb 2010
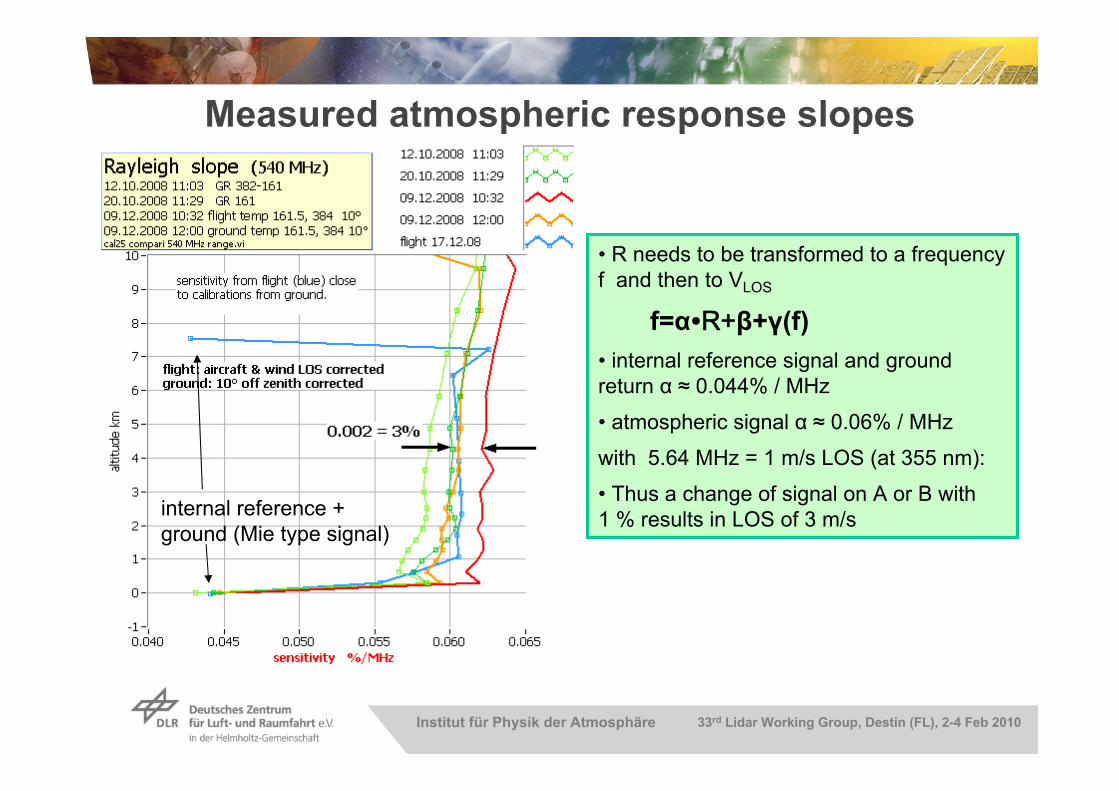
Measured atmospheric response slopes
• R needs to be transformed to a frequency f and then to VLOS
f=α∙R+β+γ(f)• internal reference signal and ground return α ≈ 0.044% / MHz
• atmospheric signal α ≈ 0.06% / MHz
with 5.64 MHz = 1 m/s LOS (at 355 nm):
• Thus a change of signal on A or B with 1 % results in LOS of 3 m/sinternal reference +
ground (Mie type signal)
Institut für Physik der Atmosphäre 33rd Lidar Working Group, Destin (FL), 2-4 Feb 2010
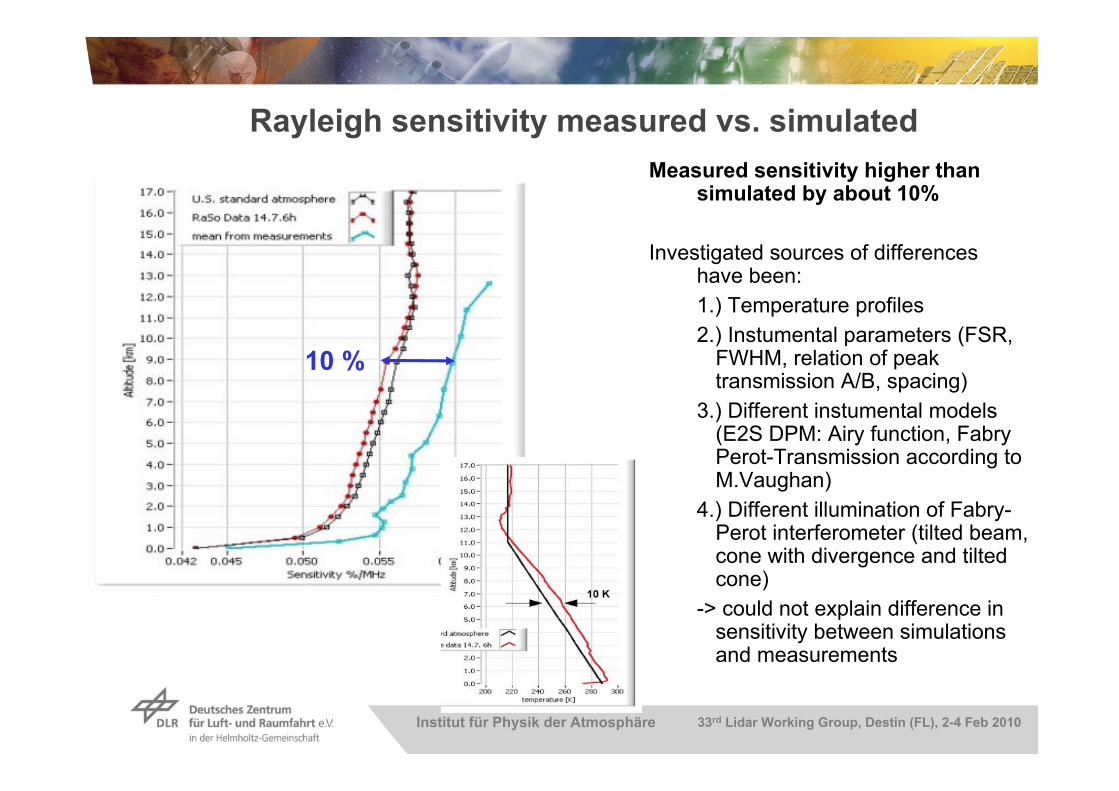
Measured sensitivity higher than simulated by about 10%
Investigated sources of differences have been:1.) Temperature profiles2.) Instumental parameters (FSR,
FWHM, relation of peaktransmission A/B, spacing)
3.) Different instumental models(E2S DPM: Airy function, FabryPerot-Transmission according to M.Vaughan)
4.) Different illumination of Fabry-Perot interferometer (tilted beam, cone with divergence and tiltedcone)
-> could not explain difference in sensitivity between simulationsand measurements
Rayleigh sensitivity measured vs. simulated
10 %
Institut für Physik der Atmosphäre 33rd Lidar Working Group, Destin (FL), 2-4 Feb 2010
844,740 844,745 844,750 844,755 844,760 844,765-20
-15
-10
-5
0
5
10
15
20
25
30844,740 844,745 844,750 844,755 844,760 844,765
0
2
4
6
8
10
12
14
rela
tive
devi
atio
n [%
]
absolute frequency [THz]
- residual plot
Measured Airy-fit
inte
nsity
[a.u
.]
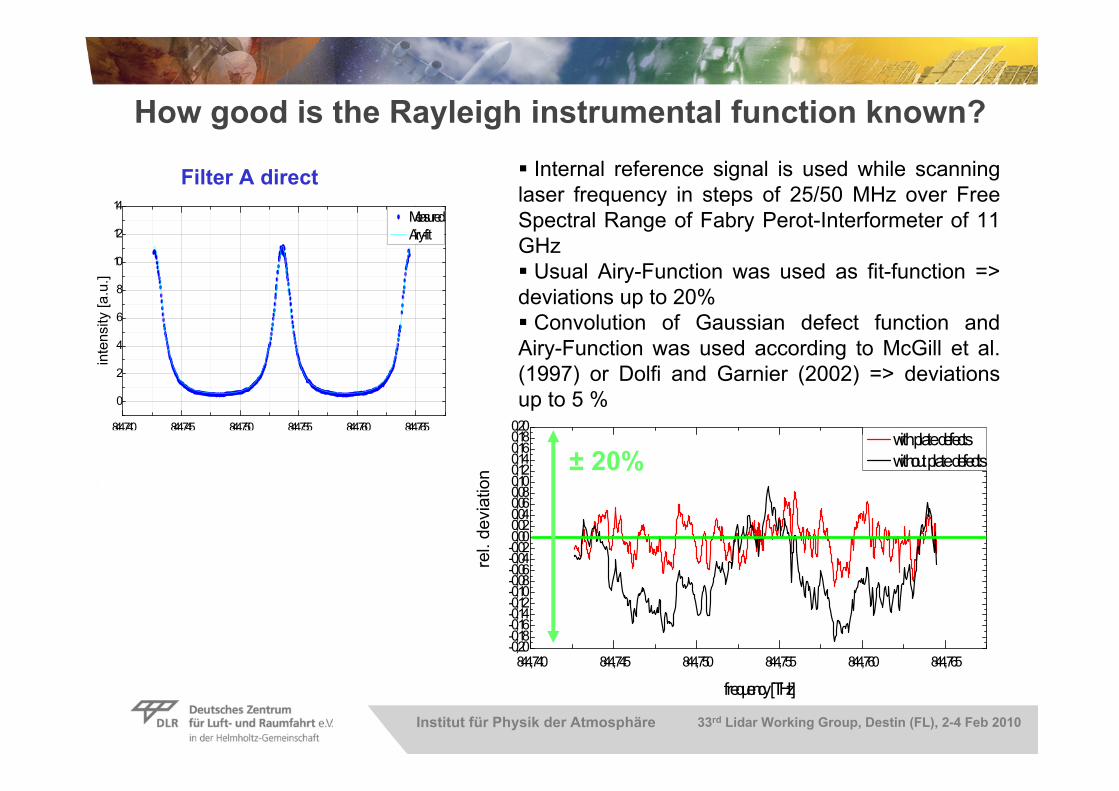
Internal reference signal is used while scanning laser frequency in steps of 25/50 MHz over Free Spectral Range of Fabry Perot-Interformeter of 11 GHz Usual Airy-Function was used as fit-function => deviations up to 20% Convolution of Gaussian defect function and Airy-Function was used according to McGill et al. (1997) or Dolfi and Garnier (2002) => deviations up to 5 %
How good is the Rayleigh instrumental function known?
Filter A direct
844,740 844,745 844,750 844,755 844,760 844,765-0,20-0,18-0,16-0,14-0,12-0,10-0,08-0,06-0,04-0,020,000,020,040,060,080,100,120,140,160,180,20
rel.
devi
atio
n
frequency [THz]
with plate defects without plate defedts± 20%
Institut für Physik der Atmosphäre 33rd Lidar Working Group, Destin (FL), 2-4 Feb 2010
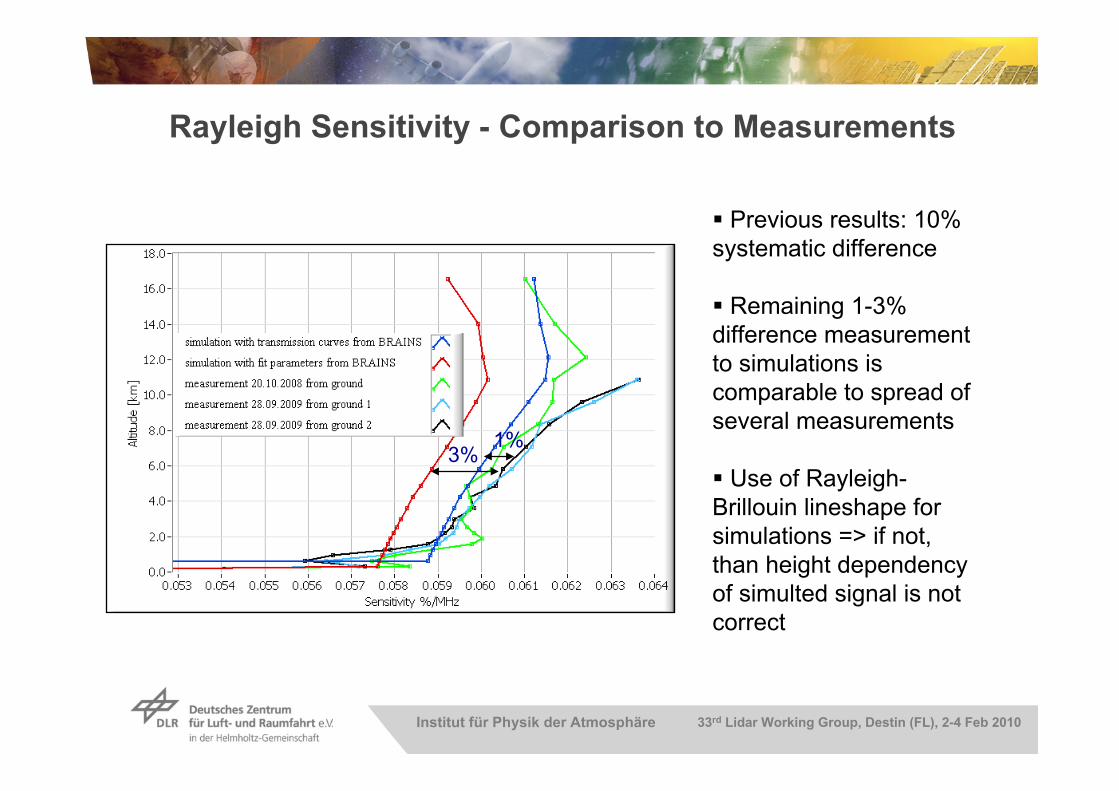
Previous results: 10% systematic difference
Remaining 1-3% difference measurement to simulations is comparable to spread of several measurements
Use of Rayleigh-Brillouin lineshape for simulations => if not, than height dependency of simulted signal is not correct
3%1%
Rayleigh Sensitivity - Comparison to Measurements
Institut für Physik der Atmosphäre 33rd Lidar Working Group, Destin (FL), 2-4 Feb 2010
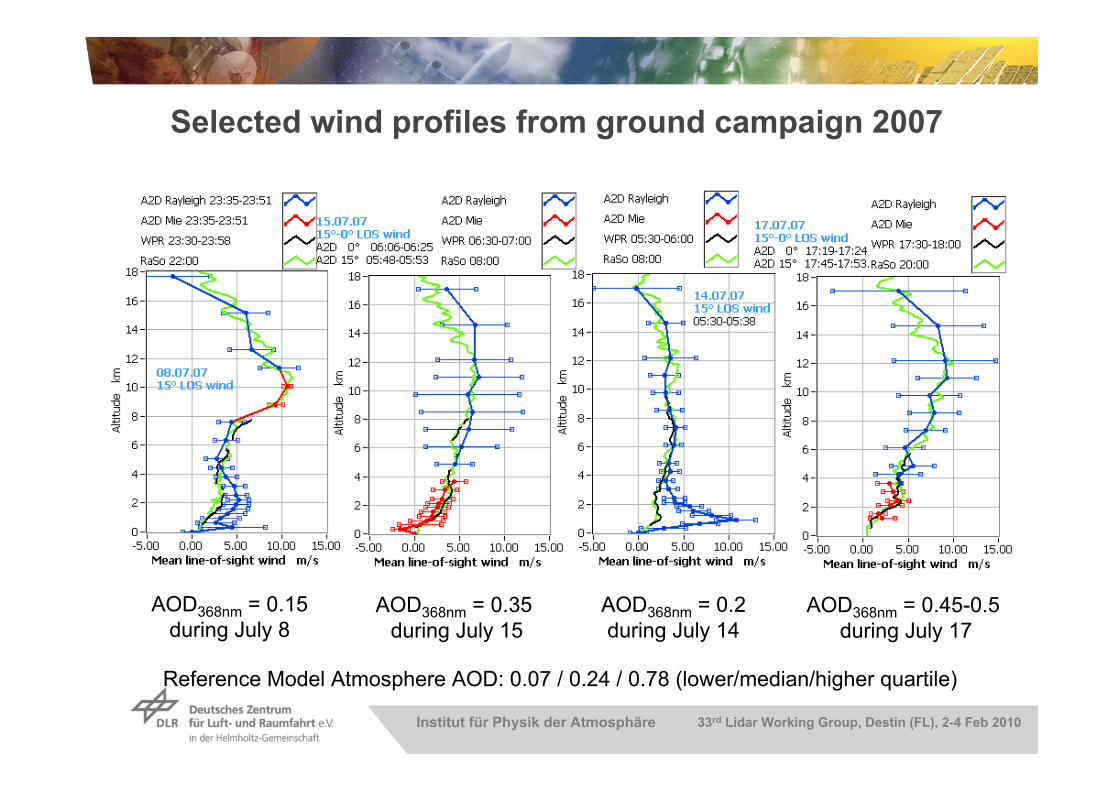
Selected wind profiles from ground campaign 2007
AOD368nm = 0.15 during July 8
AOD368nm = 0.2 during July 14
AOD368nm = 0.35 during July 15
AOD368nm = 0.45-0.5 during July 17
Reference Model Atmosphere AOD: 0.07 / 0.24 / 0.78 (lower/median/higher quartile)
Institut für Physik der Atmosphäre 33rd Lidar Working Group, Destin (FL), 2-4 Feb 2010
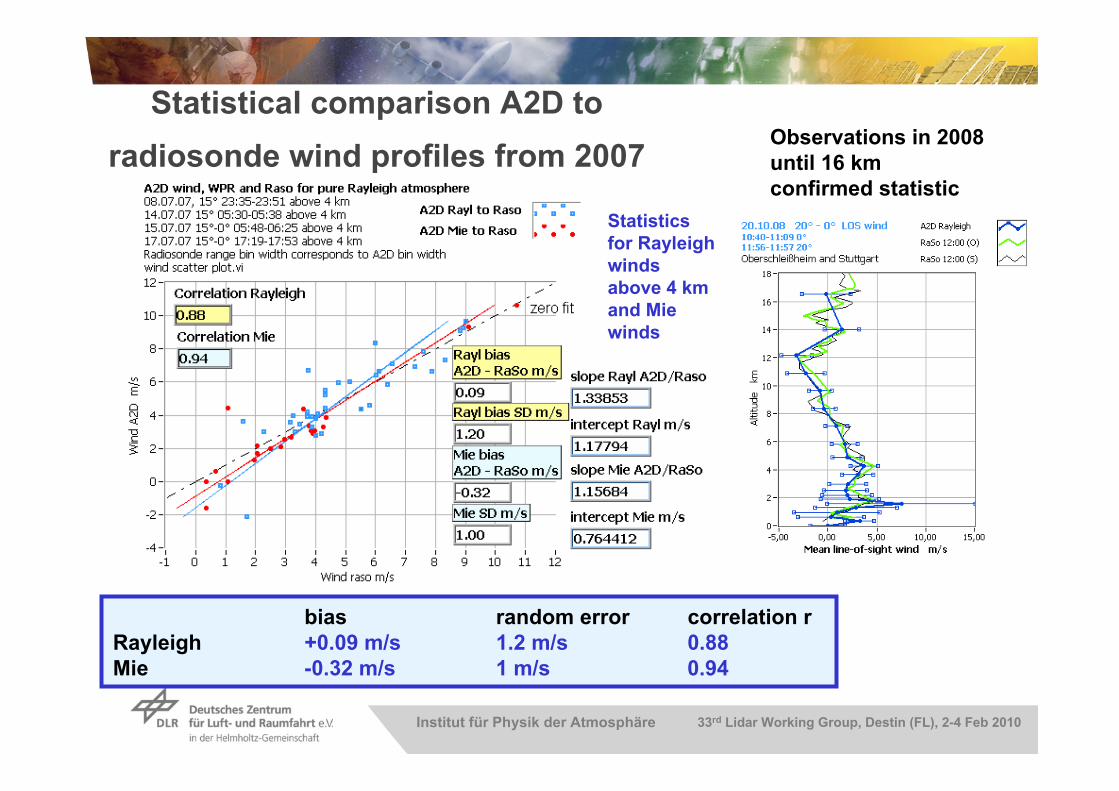
Statistical comparison A2D to radiosonde wind profiles from 2007
bias random error correlation rRayleigh +0.09 m/s 1.2 m/s 0.88Mie -0.32 m/s 1 m/s 0.94
Statistics for Rayleigh winds above 4 km and Mie winds
Observations in 2008until 16 kmconfirmed statistic
Institut für Physik der Atmosphäre 33rd Lidar Working Group, Destin (FL), 2-4 Feb 2010
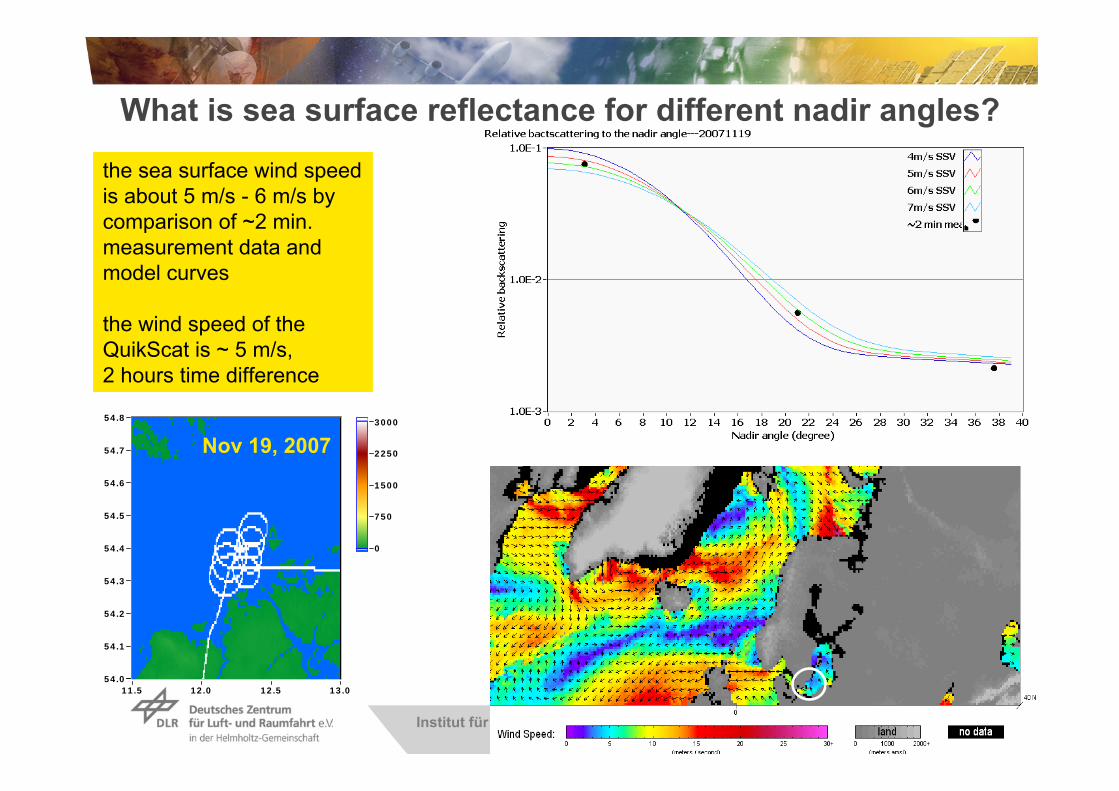
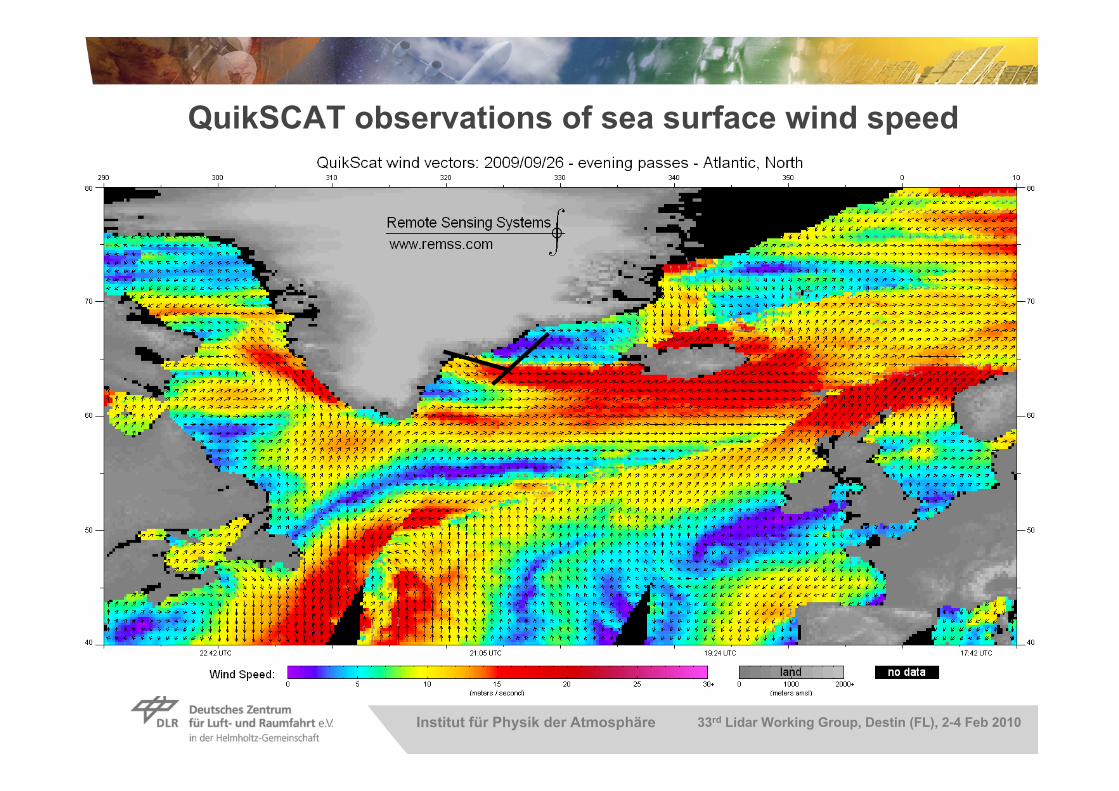
the sea surface wind speed is about 5 m/s - 6 m/s by comparison of ~2 min. measurement data and model curves
the wind speed of the QuikScat is ~ 5 m/s, 2 hours time difference
3000
0
750
1500
2250
54.8
54.0
54.1
54.2
54.3
54.4
54.5
54.6
54.7
13.011.5 12.0 12.5
What is sea surface reflectance for different nadir angles?
Nov 19, 2007
Institut für Physik der Atmosphäre 33rd Lidar Working Group, Destin (FL), 2-4 Feb 2010
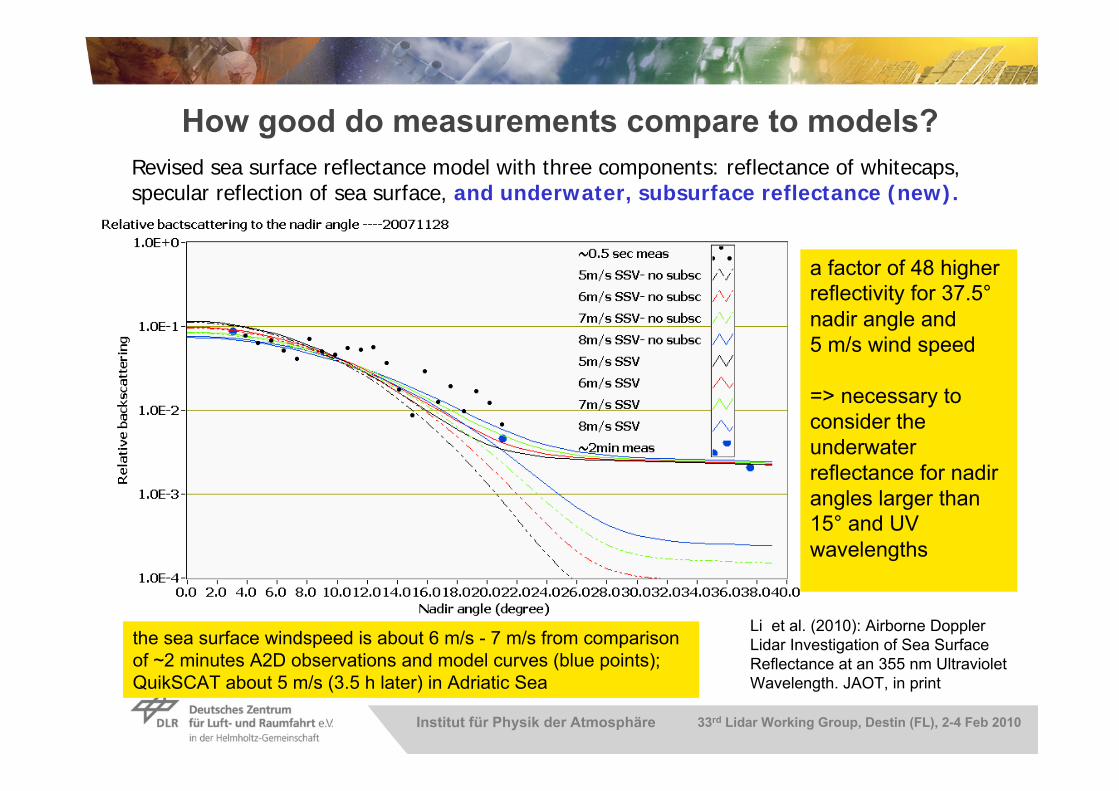
the sea surface windspeed is about 6 m/s - 7 m/s from comparison of ~2 minutes A2D observations and model curves (blue points); QuikSCAT about 5 m/s (3.5 h later) in Adriatic Sea
How good do measurements compare to models?Revised sea surface reflectance model with three components: reflectance of whitecaps, specular reflection of sea surface, and underwater, subsurface reflectance (new).
a factor of 48 higher reflectivity for 37.5°nadir angle and 5 m/s wind speed
=> necessary to consider the underwater reflectance for nadir angles larger than 15° and UV wavelengths
Li et al. (2010): Airborne DopplerLidar Investigation of Sea Surface Reflectance at an 355 nm Ultraviolet Wavelength. JAOT, in print
Institut für Physik der Atmosphäre 33rd Lidar Working Group, Destin (FL), 2-4 Feb 2010
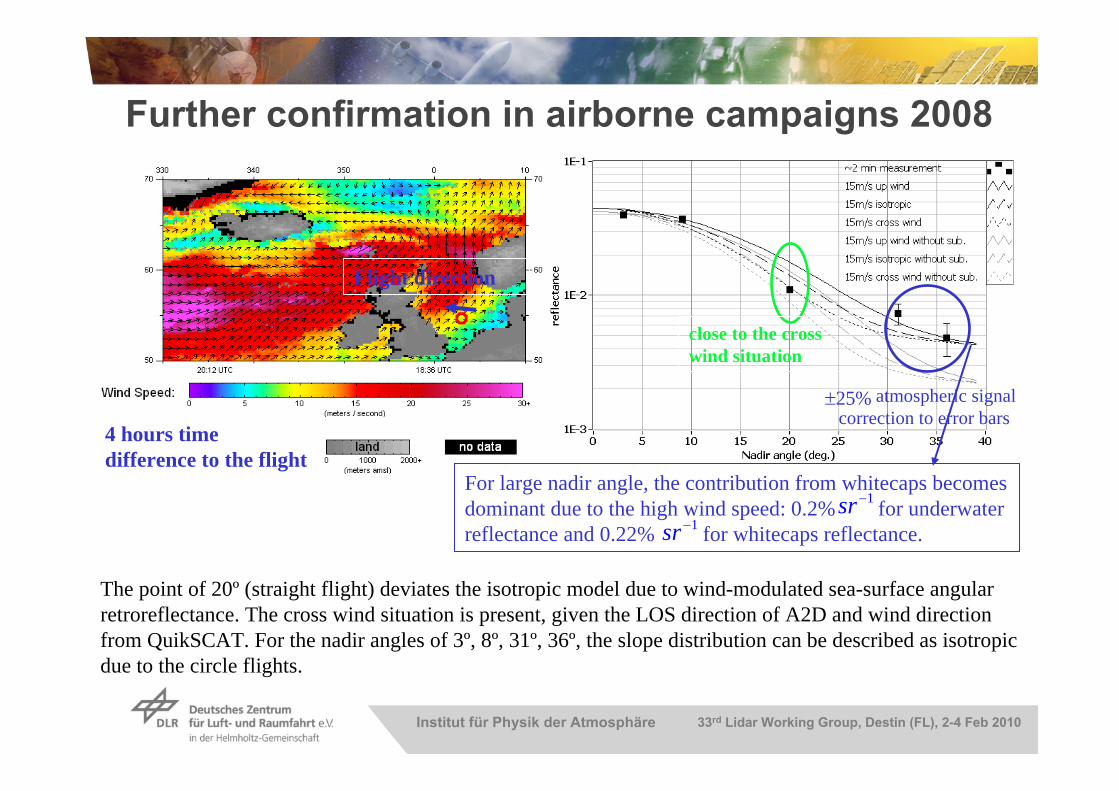
25%
The point of 20º (straight flight) deviates the isotropic model due to wind-modulated sea-surface angular retroreflectance. The cross wind situation is present, given the LOS direction of A2D and wind direction from QuikSCAT. For the nadir angles of 3º, 8º, 31º, 36º, the slope distribution can be described as isotropic due to the circle flights.
close to the cross wind situation
atmospheric signal correction to error bars
Flight direction
4 hours time difference to the flight
For large nadir angle, the contribution from whitecaps becomesdominant due to the high wind speed: 0.2% for underwaterreflectance and 0.22% for whitecaps reflectance.
1sr
Further confirmation in airborne campaigns 2008
1sr
Institut für Physik der Atmosphäre 33rd Lidar Working Group, Destin (FL), 2-4 Feb 2010
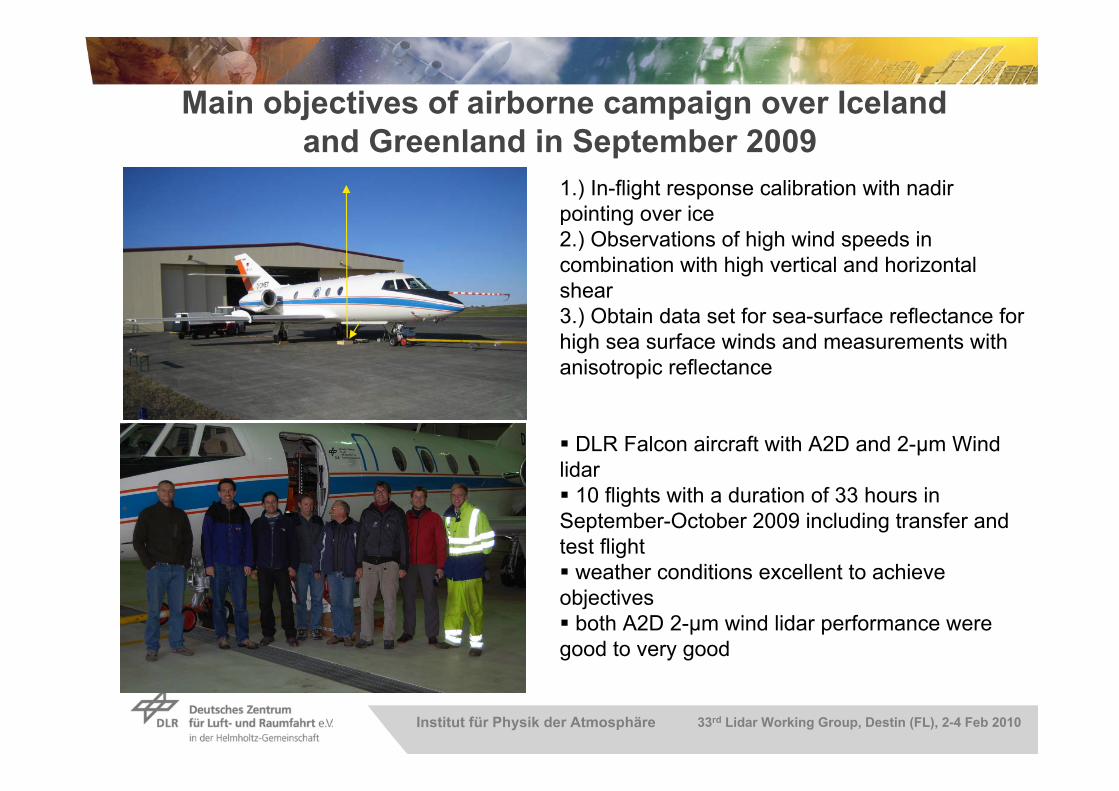
Main objectives of airborne campaign over Iceland and Greenland in September 2009
1.) In-flight response calibration with nadir pointing over ice2.) Observations of high wind speeds in combination with high vertical and horizontal shear3.) Obtain data set for sea-surface reflectance for high sea surface winds and measurements with anisotropic reflectance
DLR Falcon aircraft with A2D and 2-µm Wind lidar 10 flights with a duration of 33 hours in September-October 2009 including transfer and test flight weather conditions excellent to achieve objectives both A2D 2-µm wind lidar performance were good to very good
Institut für Physik der Atmosphäre 33rd Lidar Working Group, Destin (FL), 2-4 Feb 2010
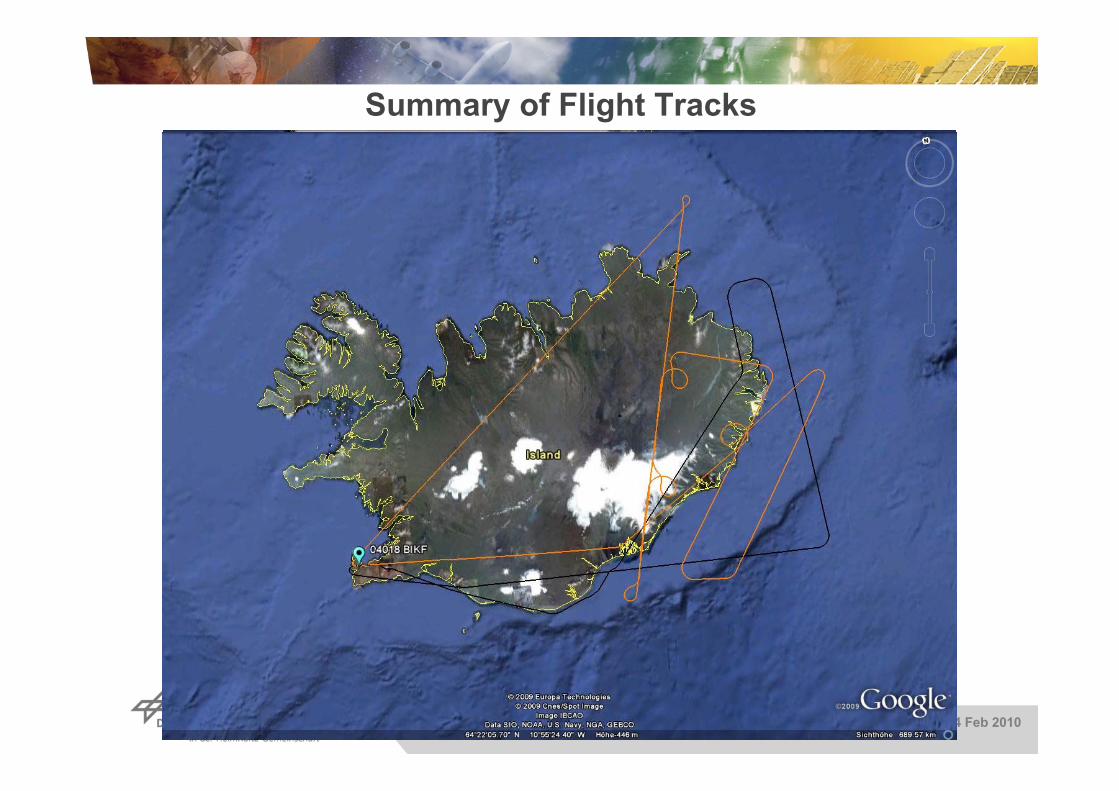
Summary of Flight Tracks
Institut für Physik der Atmosphäre 33rd Lidar Working Group, Destin (FL), 2-4 Feb 2010
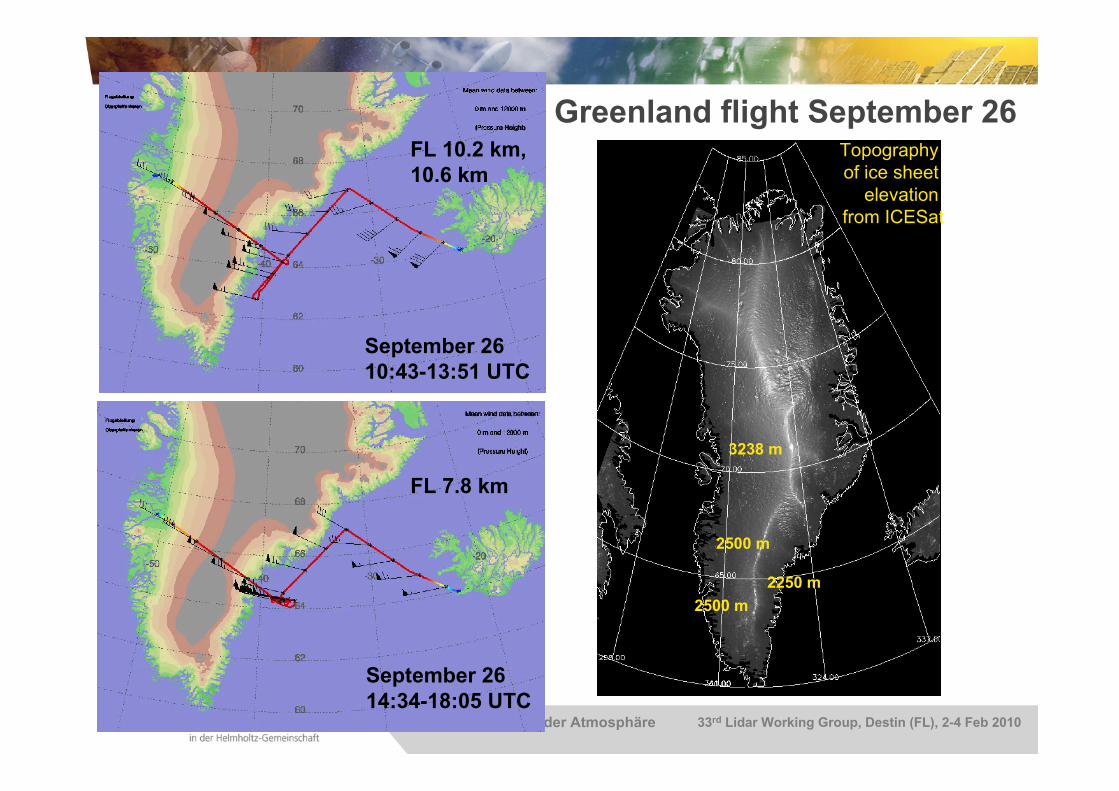
September 2614:34-18:05 UTC
Greenland flight September 26
September 2610:43-13:51 UTC
FL 10.2 km, 10.6 km
FL 7.8 km
Topography of ice sheet
elevation from ICESat
3238 m
2500 m2250 m
2500 m
Institut für Physik der Atmosphäre 33rd Lidar Working Group, Destin (FL), 2-4 Feb 2010
Institut für Physik der Atmosphäre 33rd Lidar Working Group, Destin (FL), 2-4 Feb 2010
QuikSCAT observations of sea surface wind speed
Institut für Physik der Atmosphäre 33rd Lidar Working Group, Destin (FL), 2-4 Feb 2010
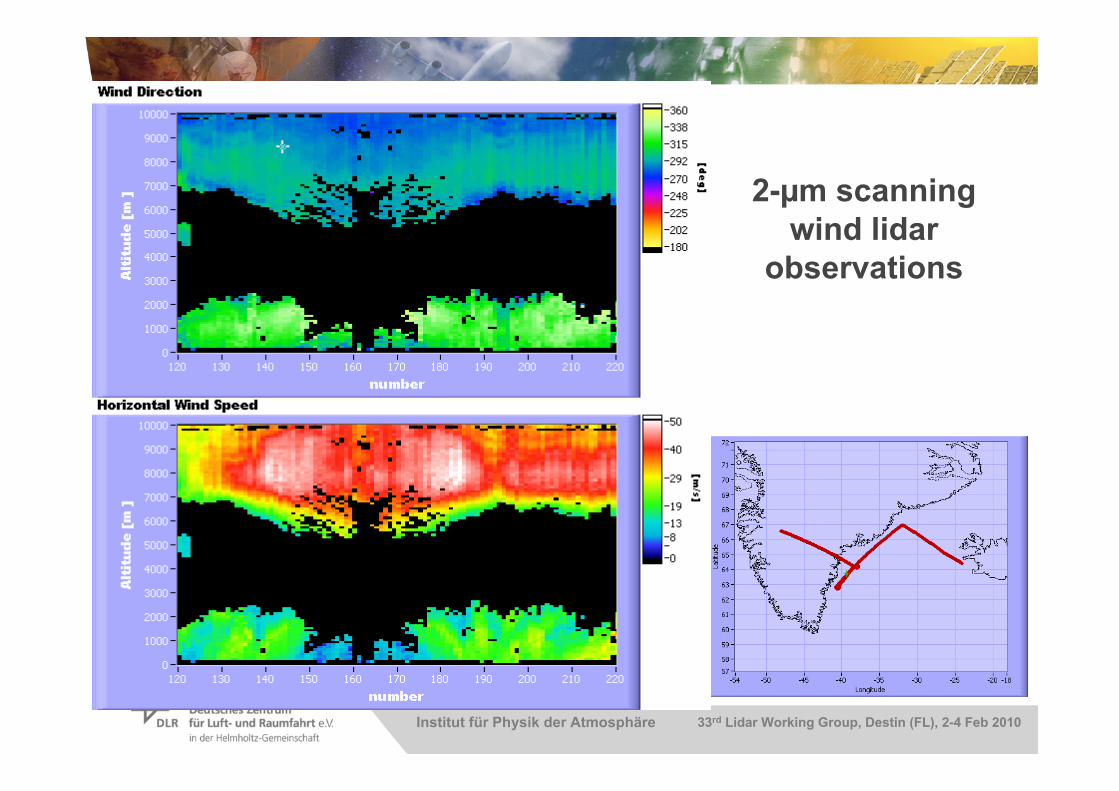
2-µm scanningwind lidar
observations
Institut für Physik der Atmosphäre 33rd Lidar Working Group, Destin (FL), 2-4 Feb 2010
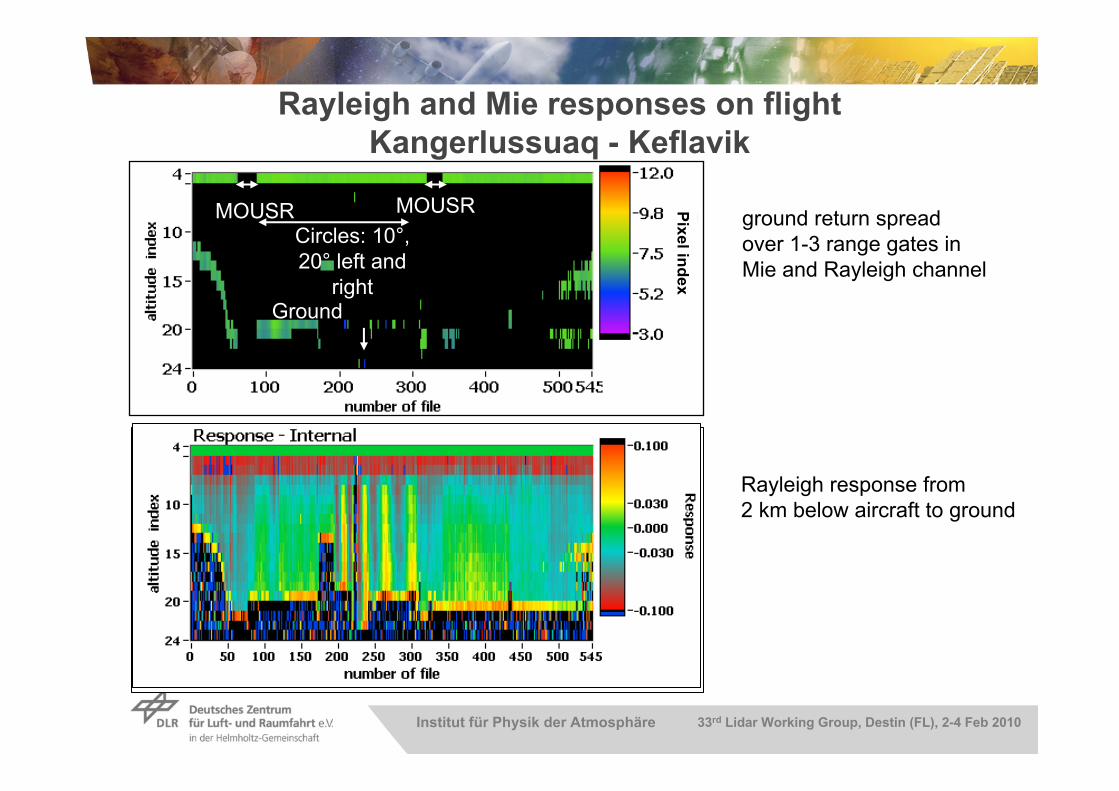
Ground
MOUSRMOUSRCircles: 10°, 20° left and
right
Rayleigh and Mie responses on flight Kangerlussuaq - Keflavik
Pixel index
ground return spreadover 1-3 range gates in Mie and Rayleigh channel
Rayleigh response from2 km below aircraft to ground
Institut für Physik der Atmosphäre 33rd Lidar Working Group, Destin (FL), 2-4 Feb 2010
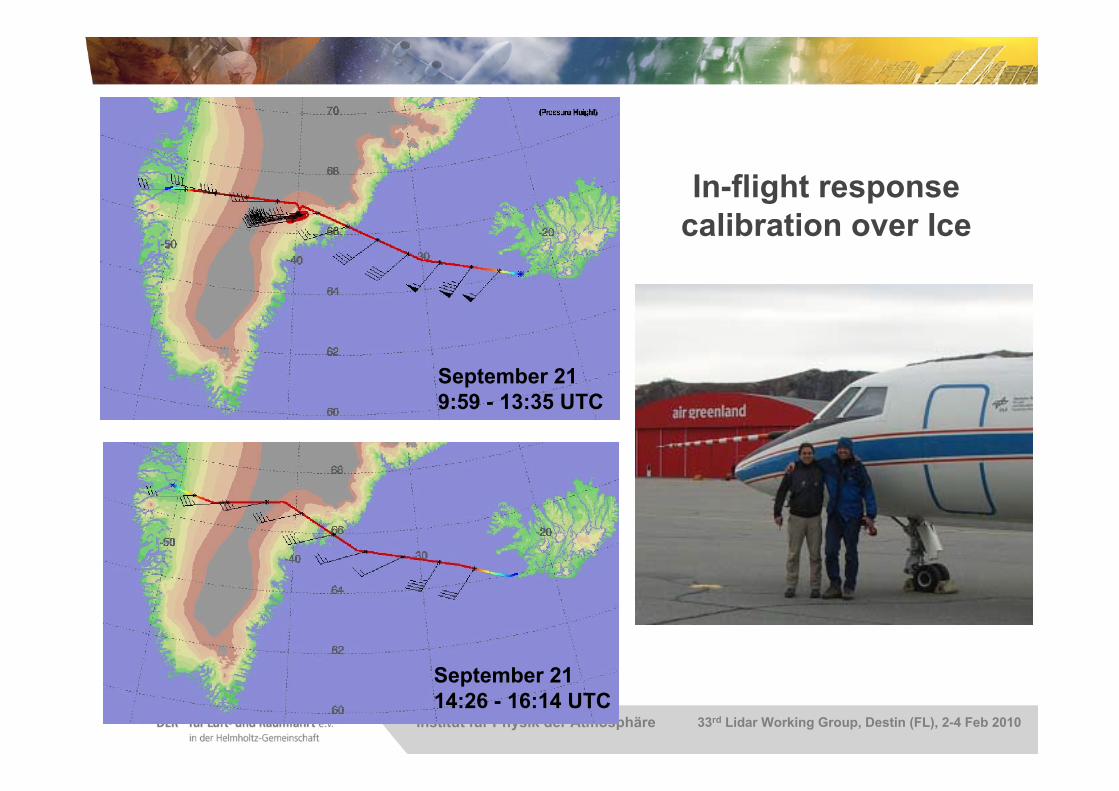
In-flight responsecalibration over Ice
September 219:59 - 13:35 UTC
September 2114:26 - 16:14 UTC
Institut für Physik der Atmosphäre 33rd Lidar Working Group, Destin (FL), 2-4 Feb 2010
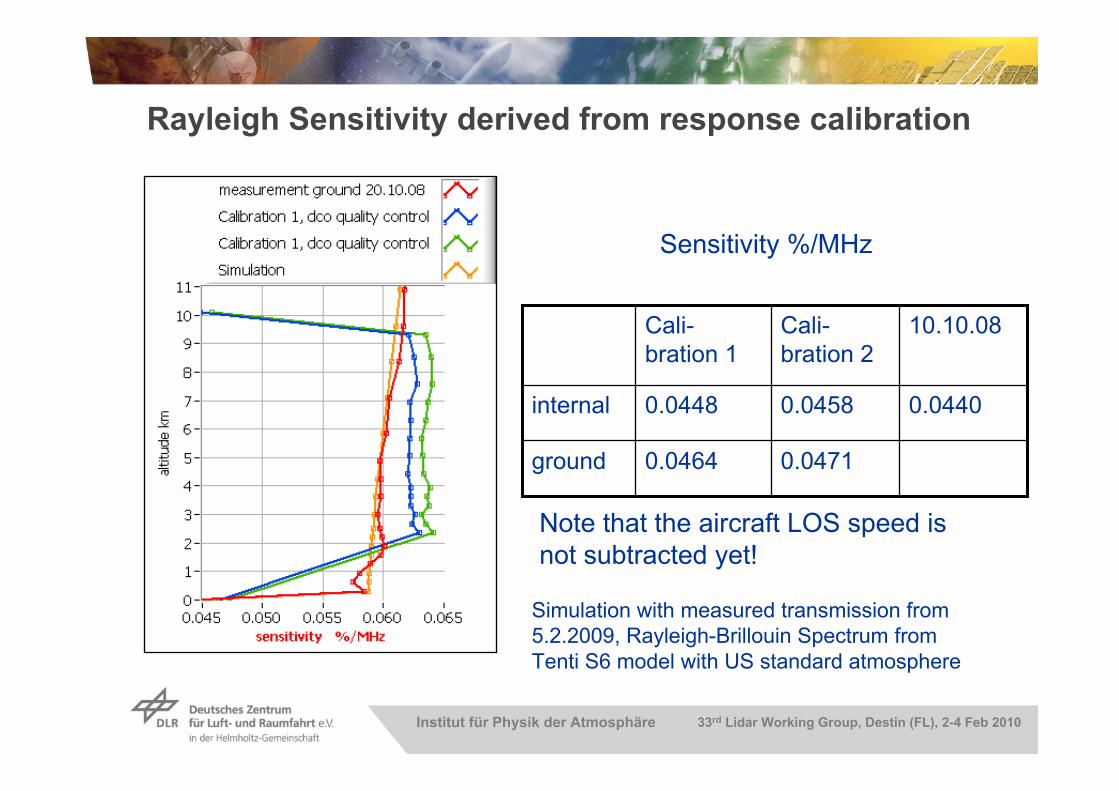
ground
internal
0.04710.0464
0.04400.04580.0448
10.10.08Cali-bration 2
Cali-bration 1
Sensitivity %/MHz
Simulation with measured transmission from5.2.2009, Rayleigh-Brillouin Spectrum fromTenti S6 model with US standard atmosphere
Note that the aircraft LOS speed isnot subtracted yet!
Rayleigh Sensitivity derived from response calibration
Institut für Physik der Atmosphäre 33rd Lidar Working Group, Destin (FL), 2-4 Feb 2010
Summary and Conclusion The principle of wind measurements with ALADIN was validated with ground campaigns leading to random errors around 1.0-1.5 m/s
Rayleigh receiver radiometric performance within factor of 1.5-2 of expected signal levels
Range gate overlap of ACCD affects ground return detection, and systematic errors on ground and cloud signals => several range gates have to be added
Revised model for Rayleigh instrumental function including defects developed and Rayleigh calibration studied=> agreement of simulated to measured response slope is better than 3%, which is similar to spread of measured slopes
Sea surface reflectance models for UV and off-nadir angels larger 15° should include subsurface reflectance: dominating part for low wind speeds
First airborne response calibration over Greenland icesheet performed as foreseen for satellite instrument
To Do: Analysis of extensive dataset from Iceland campaign 2009 with high vertical/horizontal shear, katabatic winds, high sea surface winds of about 20 m/s, complex broken cloud scenes, and ground return over ice, land, sea