
Adjusting miscoding of Indian race on state death ...
46
University of New Mexico UNM Digital Repository Native Health Database Full Text Health Sciences Center Archives and Special Collections 1977 Adjusting miscoding of Indian race on state death certificates. Unknown Follow this and additional works at: hps://digitalrepository.unm.edu/nhd is Article is brought to you for free and open access by the Health Sciences Center Archives and Special Collections at UNM Digital Repository. It has been accepted for inclusion in Native Health Database Full Text by an authorized administrator of UNM Digital Repository. For more information, please contact [email protected]. Recommended Citation Evaluation of medical care provided to Alaska Natives, Volumes 1, 2, and 3. Indian Health Service, Staff Office of Planning, Evaluation and Research, Rockville, MD 20857 (E-55). 1977
Transcript of Adjusting miscoding of Indian race on state death ...

University of New MexicoUNM Digital Repository
Native Health Database Full Text Health Sciences Center Archives and SpecialCollections
1977
Adjusting miscoding of Indian race on state deathcertificates.Unknown
Follow this and additional works at: https://digitalrepository.unm.edu/nhd
This Article is brought to you for free and open access by the Health Sciences Center Archives and Special Collections at UNM Digital Repository. Ithas been accepted for inclusion in Native Health Database Full Text by an authorized administrator of UNM Digital Repository. For more information,please contact [email protected].
Recommended CitationEvaluation of medical care provided to Alaska Natives, Volumes 1, 2, and 3. Indian Health Service, Staff Office of Planning, Evaluationand Research, Rockville, MD 20857 (E-55). 1977

q ?-0) f3:::: L I1 o~ 0,
Evaluation of Medical Care
Provided to Alaskan Natives Volume 3
Summary Report
A Report by the Alaska Natioe Health Board
February 1975 - April 1977
EVALUATION OF MEDICAL CARE PROVIDED TO ALASKA NATIVES
Volume 3
SUMMARY REPORT
Prenatal Care, Infant Care, Streptococcal Disease and Rheumatic Fever Prophylaxis, Lacerations, Hypertension,Urinary Tract Infection, Iron Deficiency Anemia and
the Continuity of Health Care
This report was prepared by:
Alaska Native Health Board Health Care Evaluation Projects
Box 4-1808 Anchorage, Alaska 99509
Edward F. Helmick, M.P.H., Director William Thomas McClure, M.A., Associate Director
CONSULTANT:
Paul A. Nutting, M.D. Medical Care Research Officer
Office of Research and Development Indian Health Service Tucson, Arizona 85206
February 1975 - April 1977
This project was carried out under contract 243-75-0358 Issued by HSMA, Alaska Area Native Health Service.
TABLE OF CONTENTS
INTRODUCTION .
SUMMARY OF METHODOLOGY 3
PRENATAL CARE 4
INFANT CARE 11
STREPTOCOCCAL DISEASE AND RHEUMATIC FEVER PROPHyLAXIS 16
LACERATIONS OF SCALP AND EXTREMITy 20
HYPERTENS ION ,; 22
IRON DEFICIENCY ANEMIA 24
URINARY TRACT INFECTION 26
THE CONTINUITY OF HEALTH CARE 27
CONCL US ION 35
REFERENCES ·38
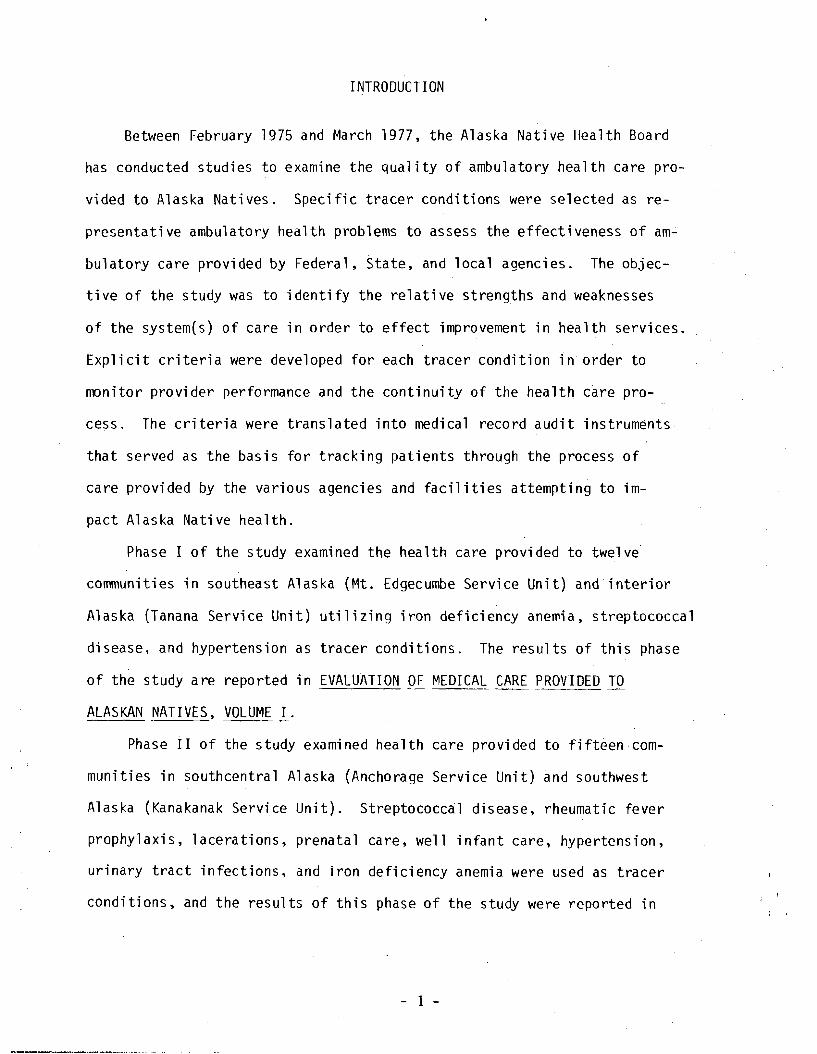
INTRODUCTION
Between February 1975 and March 1977, the Alaska Native Health Board
has conducted studies to examine the quality of ambulatory health care pro
vided to Alaska Natives. Specific tracer conditions were selected as re
presentative ambulatory health problems to assess the effectiveness of am~
bulatory care provided by Federal, State, and local agencies. The objec
tive of the study was to identify the relative strengths and weaknesses
of the system{s) of care in order to effect improvement in health services.
Explicit criteria were developed for each tracer condition in order to
monitor provider performance and the continuity of the health care pro
cess. The criteria were translated into medical record audit instruments
that served as the basis for tracking patients through the process of
care provided by the various agencies and facilities attempting to im
pact Alaska Native health.
Phase I of the study examined the health care provided to twelve
communities in southeast Alaska (Mt. Edgecumbe Service Unit) and interior
Alaska (Tanana Service Unit) utilizing iron deficiency anemia, streptococcal
disease, and hypertension as tracer conditions. The results of this phase
of the study are reported in EVALUATION OF MEDICAL CARE PROVIDED TO
ALASKAN NATIVES, VOLUME 1.
Phase II of the study examined health care provided to fifteen com
munities in southcentral Alaska (Anchorage Service Unit) and southwest
Alaska (Kanakanak Service Unit). Streptococcal disease, rheumatic fever
prophylaxis, lacerations, prenatal care, well infant care, hypertension,
urinary tract infections, and iron deficiency anemia were used as tracer
conditions, and the results of this phase of the study were reported in
- 1

EVALUATION OF MEDICAL CARE PROVIDED TO ALASKA NATIVES, VOLUME !l.
This document, prepared as Volume III of the study, summarizes both
phases of the study. The results are described briefly and organized by
tracer condition. It is hoped that a summary document will be useful to
the clinician and health program manager with a particular interest in
one or more of the tracer conditions. For brevity, the description of
the methodology and the extensive data tables have been omitted from the
report. Therefore, the interested reader is strongly urged to review
Volumes I and II and particularly to study the data tables for himself,
rather than relying solely on the interpretations presented here. It
should also be noted that Volume II presents comparative data obtained
from other IHS servi ce units and from the pri va te practi ce sector, and
this material has been omitted from the Volume III sUmlilary.
°1 .
- 2
SUMMARY OF METHODOLOGY
A set of health problems called tracer conditions was selected to be
representati ve of the ambul atory care workload. These were sel ected to
include elements of prevention, screening, diagnosis, treatment', and
follow-up. Criteria, which are the bench marks of effectiveness, are
translated into audit questions called indicators which are the actual
measures of effectiveness of health care.
The indicators are of three types. The population-based indicators
are patient oriented and track individuals through the problem solving
process to determine the distribution, continuity, and end results of
care. They express a percent of the total community which has received
a particular health service. This class of indicators characterizes the
extent to which the health care system is meeting the needs of its total
patient population.
Health status indicators are also population based and express the
percent of patients for whom a change in health status has been documen
ted. One should be cautioned against equating health status indicators
with measures of incidence or prevalence since the latter requires a ran
dom sampling of the population. Health status indicators, on the other
hand, often reflect a change in health status of selected patient groups,
e.g., only those who were followed-up.
Finally, provider-based indicators focus on health worker performance,
rather than system performance as a whole. They express a percent of con
tacts between patients and the health care system in which particular
health services were received. This class .of indicator characterizes the
adequacy of health services provided when patients utilize the health care
sys tem.
- 3

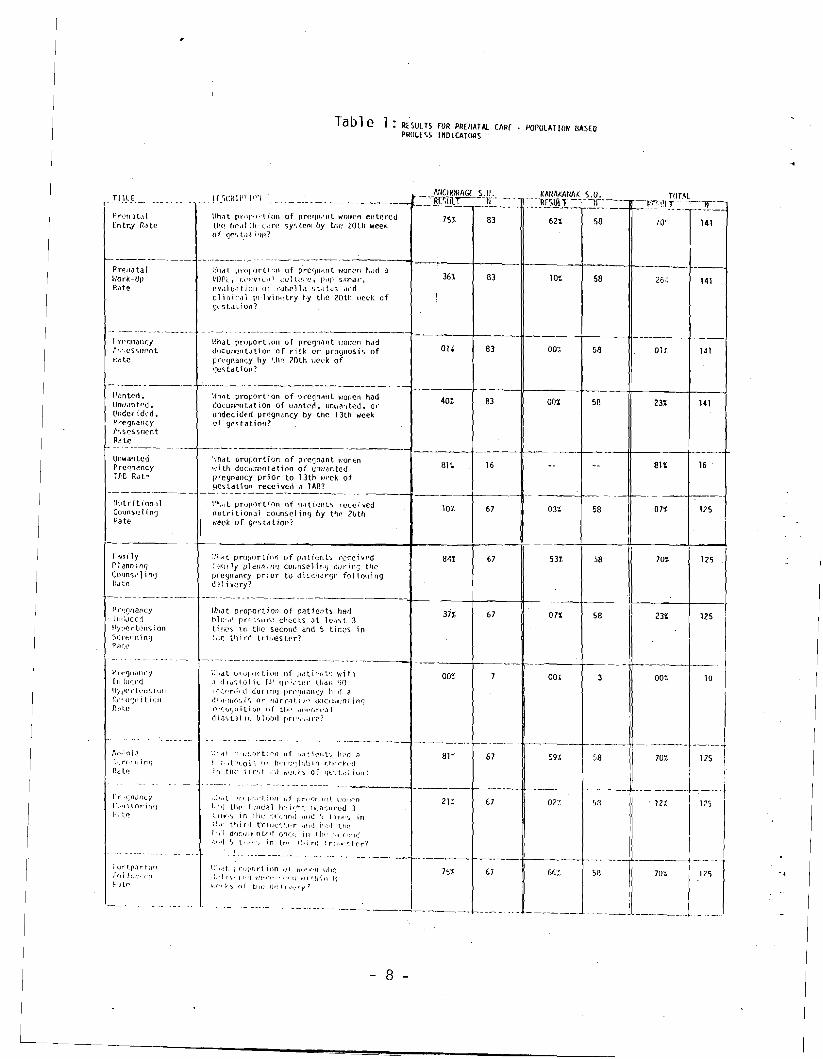
PRENATAL CARE
Tables 1-3 show the results for prenatal care in the Kanakanak and
Anchorage Service Units. The prenatal entry rate measured that pro
portion of pregnant women who made their first prenatal visits by the 20th
week of gestation. If this criterion is changed to include all prenatal
visits made by the 30th week, a significant increase is noted as shown in the
table below. This is an important point to consider since the link between
appropriate use of medical services and desirable outcomes has been es
tablished in the area of prenatal care by the elegant study of Kessner
and associates. l In reviewing the outcomes of over 140,000 births in
New York City in 1968, Kessner was able to establish the importance of
prenatal care to the successful outcome of pregnancy. The appropriate
use of prenatal services was shown to dramatically decrease the risk of
infant mortality within all ethnic and socioeconomic classes.
As with the prenatal entry rate, increases are observed by altering
the criteria for other selected indicators. It is noteworthy that the
prenatal work-up rate (VORL, cervical culture, Pap smear, and clinical
pelvimetry) does not appreciably improve by expanding the time interval
to the 30th week. This is due to the low frequency at which a cervical
culture is done as part of the prenatal work-up. For those patients re
ceiving primary care at the Alaska Native Medical Center, where a full
contingent of medical and support services are available, the prenatal
work-up rate was 58% by the 20th week.
- 4

PRENATAL CARE POPULATION BASED PROCESS INDICATORS
TITLE - - -_._--------------
Prenatal [ntry Hdte By 20th Week
--_. --_._--_._----Prenata 1 Entry Rate by 30th week
DESCR I PTION .
What proportion of pregnant women entered the hea lth care sys tem by the 20th week of gestation?
._---~_.~-----
What proportion of pregnant women entered the health care system by the 30th week of gestation?
NI
83
83
ANCHORAGE S. U•
75~
87~
tiN
S8
-~
58
KANAKANAK
62~
82~
S. U. -~
liN
141
141
TOTAL
70t,
--.
851
Prenatal Work-Up Rate by 20th week
What proportion of pregnant WOmen had a VORL. cervical cul ture. pap smear. evaluation of rubella status and clinical pelvimetry by the 20th week of gestitatioo? 83 36% 58 101 141 261
Prenatal Work-Up Rate by 30th week
-Pregnancy Induced Hypertens ion Screening Rate
\----- Pregnancy Induced Hypertens ion Screening Rate
What proportion of pregnant women had a VORL. cervical culture. pap smear, evaluation of, rubella status and clinical pelvimetry by the 30th week of gestation?
What proportion of patients had blood pressure checks at least 3 times in the second trimester and 5 times in the third trimester?
What proportion of patients had blood pressure checks at 1eas t 2 ti mes in second trimester and 3 times in third trimester?
83
67
67
45%
-
371
601
58
58
58
121
071
241
141
125
125
31~.
--f--._-'
23~
43~
Among the population-based process indicators for prenatal care, two
stand out as being quite low. The pregnancy assessment rate measures the
proportion of pregnant women for whom the provider has made a statement of
risk or prognosis by the 20th gestational week. The total result for both
Alaska Service Units was only 1%. Of perhaps greater significance is the
very low rate ~f apparent recognition of pregnancy-induced hypertension:
the recognition rate is 0%. This rate was calculated as the percent of
patients with a diastolic blood pressure greater than 90 mm. Hg. who re
ceived any assessment suggesting recognition of the elevated blood pres
sure reading. Table 1 indicates that for residents of the two Service
Units, only 23% of pregnant women were adequately screened for pregnancy
induced hypertension (a population-based indicator). Contrasted to that,
- 5
-------
--------
---------------- --- --------
Table 3 reflects that the pregnancy-induced hypertension (PIH) screening
rate as a provider-based indicator is 93%. In essence. increased provider
recognition of patients overdue for PIH screening would not appreciably im
prove health care. Accessibility and patient compliance appear to be the
main barriers to adequate screening for PIH.
The health status indicators associated with prenatal care (Table 2)
are remarkable in several instances. The pregnancy-induced hypertension
(PIH) rate is somewhat lower in Alaska than in the non-Alaska site. How
ever. in light of the low result for lIabnormal blood pressure recognition
rate" (Table 3). it is possible that some mild cases of PIH are being
overlooked.
Although based on relatively small samples. the "TAB family plan
ning rate" in Alaska is significantly better than that observed in the
private sector (p< .05).
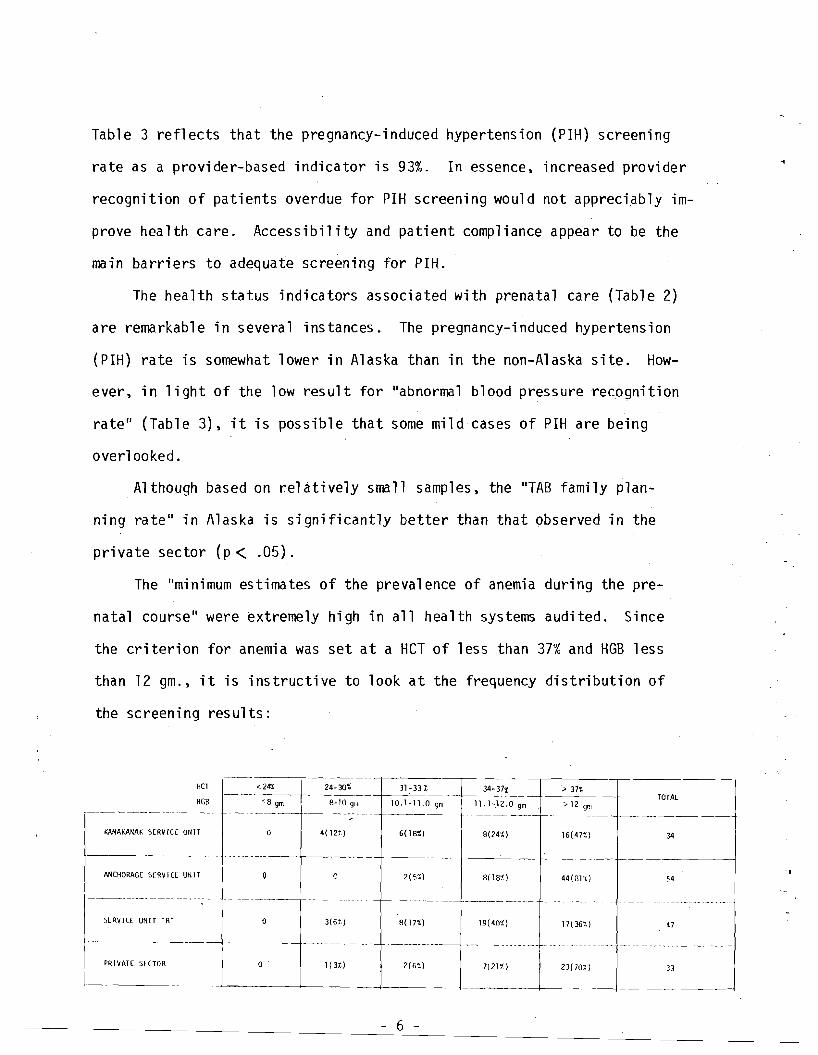
The "minimum estimates of the prevalence of anemia dur-ing the pre
natal course" were extremely high in all health systems audited. Since
the criterion for anemia was set at a HeT of less than 37% and HGB less
than 12 gm .• it is instructive to look at the frequency distribution of
the screening results:
HCT _~ <:~ ~_-30_%__--t_3_1,--3_3%__ 34-37% __>_3_7~%_--j-TOTAL
HGB 8-10 q[.l 10.1-11.0 qm 1l.1-.12.0 gm >12 9m<8 gm --------.--._- ----------j--- ----j---------- ---f------------
KANA KANAK SERVICE UNIT o 4( 121.) 8(24%) 16(47%) 34
---------------- ---------+---
ANCHORAGE SE RV I C[ UN IT c 2( 5%) 8(181.) 44 (3l't.) 54
--------._------. ---------- ._ -'------------
SlRV ICE UNIT "8" o 3(61,) 8(17%) 19(401.) 171361.) 47
-----------. ------._.-.
PRIVATE SEnOR o 1(31) 2(61) 712lt) 2)(lO~) 33
-,
6
--
As can be seen in the Kanakanak Service Unit. almost a third of this
study population were in the 8 and 11 gm. HGB range. The high prevalence
of anemia in the Kanakanak Service Unit has also been cited in a recent
study by the Center for Disease Control. 2 The Anchorage Service Unit
anemia occurrence can best be described as borderline. All hematocrit
and hemoglobin levels recorded in this study were performed by laboratory
technicians using standard laboratory procedures.
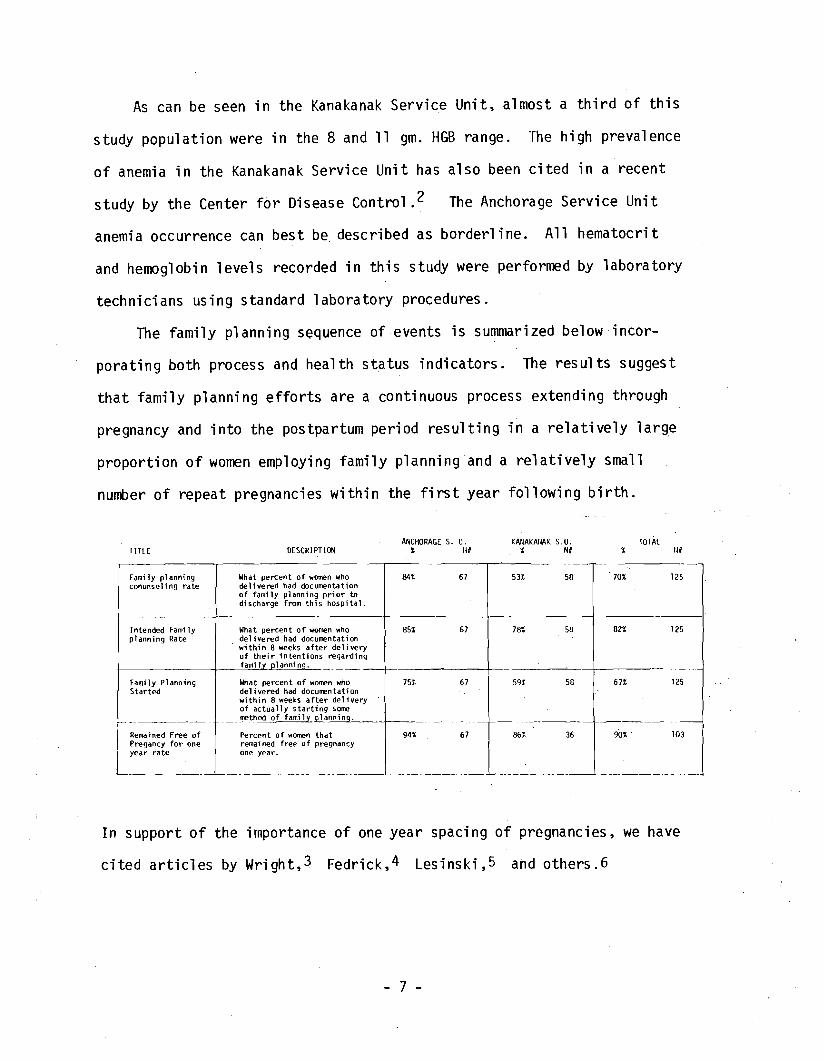
The family planning sequence of events is summarized belowincor
porating both process and health status indicators. The results suggest
that family planning efforts are a continuous process extending through
pregnancy and into the postpartum period resulting in a relatively large
proportion of women employing family planning and a relatively small
number of repeat pregnancies within the first year following birth.
ANCHORAGE s. u. KAiIAKAllAK s. u. TOTAL TITLE DESCRIPTION % fl# % N# % tl#
Family planning What percent of women who conunseling rate delivered had documentation
of family planning prior to discharge from this hospital.
Intended Family What percent of women who planning Rate delivered had documentation
within 8 weeks after delivery of their intentions regarding familv olanning.
Fami ly Planning Started
f -
What percent of women who delivered had documentation within 8 weeks after del ivery of actually starting SOme method of familv olannino.
Remained Free of Percent of women that Pregancy for one remained free of pregnancy year rate one year.
'-
84% 67
85% 67
75% 67
94% 67
70% 12553% 58
82% 12578% 58
67% 12559% 58
-90% . 103861. 36
'------
In support of the importance of one year spacing of pregnancies. we have
cited articles by Wright. 3 Fedrick. 4 Lesinski. 5 and others.6
- 7
- -
--
---
---------
- -- - --------
------------
--- -- --------
TIll E r~ - .
Pn'fl,lllll [ntr.y R,lle
PrellJtal Hark-Up R\Jte
I'n'qllanr;y r<,·;t's<;m~nt
Pt. te
I\.I'~nted • Un~lill\ ~t:'d. l'ndc{ I dt'd. Pregnanc.y I'~sessr,l('nt
R'te
Ul1wanted PrC9.,~ncy
Ire Rate
Illitrition,)l COtJn~l~l1n(J Rate
r·f\mi ly r I ann i n~
COlm')l~ 1i n'J I(cltc
Pr':onancy . l Ilr~Jc(:1
IlYl,ertl~l\c; ion S(n·:~n)n(j
PtH.C'
1"rt'f)Il,II1Cy
[ 1I'!w:.cd 'IYjlCrkll~,i(;1l
r::,"'u';rtfl ilJf\
fltl!,C'
r I' .1;n,JI1Cj
t"'Il) tori n(J f}"~e
i url.p,lrt;IQ i"rd lc :- li(l
j.!,j lp
Tab1e 1 RESULTS TOR PR£tIATAL CARr· POPULATION BASED PHOUS5 lrlDlCATORS
III/cilORAGl S.II_!L'iCiU I' I 1'''1 _ -=~-~1C-=-.JC
~rh.lt prlll'q·-, ion of pref]Il.~"t W(Jlllcn entered 75'~ 83
l.il(~ IH',11 l!l'c,:re Sy'ilCftl lJy tile 20lh week. of qc', t.r.lt "l/I-I
-------·0 -- _0---------------1 ---,.---I----II------f-------lt----- \,Ihat ~lt·(1I'()rli;;" of prcqndnt HOlT('n h(ld a VOrl.. (,'I'vled) CUltlll"C, p,lp sm:~dt·, 36% 83 10% 58 141 evulu·llj()Jl 01 r·ubC'll.l st.:It.U'.l ilnd clllllc:cll 1!l-lvll1,~~try ~,y tlie 20111 \'Ieck of 8..... sll1lion?
-- ------- ---.------ ------t------ r-.-----t---------,ft----- \'!hJt prulJortioll of prC:fjllilnt \':Ol~n had au 83 oo~ 58 01r 141 Jl}CUll ..~ritdtion of risk or progl\osis of :, prl..'(jnJn(:y hy 1.h~ 20th \Jcck of lJe~tatioTl?
------.------------------ - - -------j--- ------II-------t--~+---+_-~ ~'Ih/lt proportion of pregndllt vlQn.en had doculiif:ntation of \·/ilnterl. un\·J3nte.d. or
401 83 001 58 23% 141 undecided pregnancy by the 13th week of g('station?
-------~----------------I----+------ - t-------- -.+---+---+---t !.!hat proportion of pl"e']:ldnt \"Jonlen wi til docu::1Gntction of Uill':dntcd 81~ 16 81t 16
pregnancy prior La 13Lh "eek of tlcstation received a lAB?
r---'-------------------------t------t----il- \~h'"lt pr,Jp'wtinn of p,1ticnt') received
107. 67 03~ 07~ 12558nutrltionJl counseling by thi" 20th l'.'eek of gestatiop?
:O'.~<l.t pro;Jortin(, uf p.lti~Tlt') rec('lvf'd 841 67 531 58 70~ 12S r,Jr:Jlly pldllnlf}'J counselir,lj ouril':j tile pregnancy prior to dischcr~w fono'.ling d,~ 1i very?
---. -----------------------r----+-----Ji---~--+--'--IJhJt proportion of patient!» he" 37% 67 07% 58 23% 125!:Ilu!JI\ pr>"-'~<)ur<.?- checks Jt lc;).-.t 3 t i [':i(''';. in the second and 5 t i fliCS in ~)lC third tdwester?
-----------------.----------i ----_-+ j\-- ---+ ij- _
~;hdt ptOI_II(tioll of jJ<1til'flt':: \'Iith oo~ 00'1 oat 10,1 dio'ltl)lii.. r,ll ljt";"t.c,· than 'JO 1("(I~rdl r.l durillq pn'l.lnan(y !i,'r! il
rlid"JIf(",it; fir rl<1rr,lt.lv" <JoCtll,.-:nl,infj nO(_(J'lll i t i (jn (I r till' di'I'On,'J 1 diil"iJI it h1oo<1 pn",',lJre?
---- ---- \--- ---- ----- \--------tt---~---
;;l"r J"l;;)()rtirn of fj,lti('Ilt.-., h;'d l) 67 591. 58
J 70% 125 i'~'i',t,t(l(oito 'I' h'II;';hJI:in ()w,ch.'d
in Ul( 11r",t c'\1 "il.'I::'-,') of ql::',t{~l..i(lIl?
-------- --- ------ -- ----- ----- --- ----- ------t-------- ----+------- ,f---~-l--,-.f "')),,t Pf " j",,·t.il)/1 I~f IJn~I?r1,H~'- 21'::", 67 027. ~n 1 '12::: 125\.':)If-n
I!",j U\(' fund.)l hi~if'~Jl. rlo":i1":.ured 3 :.iHI'') in Ull~ 'J'crln,j 'illd 'i til:""; .In
1:Jd' third t"rlflil:'", I.," ,- 'J!ld il,_!'! U1~ I !Ji'( dOCIJ:I"nt(l! Gn(f: in 1.11" ',IJ'J11C I ,:l.rl lJ til",r, in tlJI' I.llil'd ~ril;",~_tf:r?
..
-------------- ..---.------~---- --------f-------I!---~--+- ----, -------+---\::I,~t iq'l;l,ortion pi ~I(j!·.r°n \Jill) 151, 67 66':' sn 70X, 112~ .,,;.,1 j ..., II"! 'rHOI',o "·'·n \·!I Uilil P
"" ~, 'd tin' d" I, ""_~Y_' --------- J__ _ . -----J_
- 8
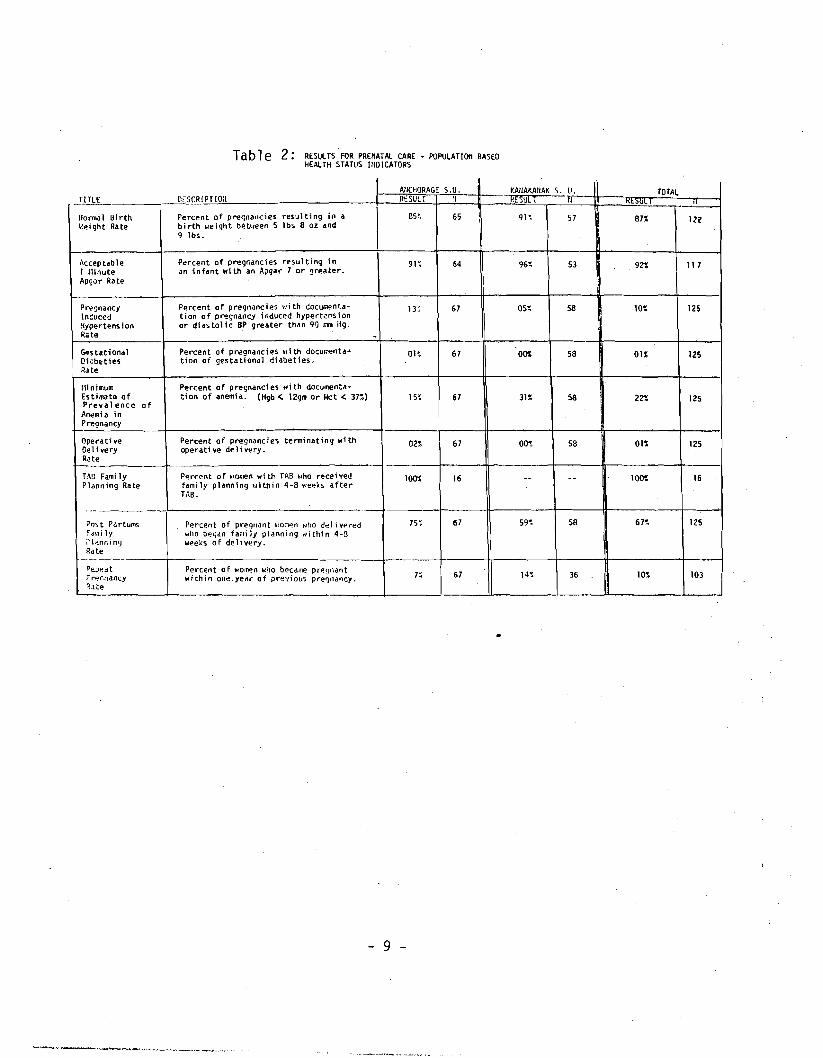
Table 2: RESULTS FOR PRENATAl CARE - POPULATIOIl BASEO HEAlTH STATUS HIOICATORS
_TJlb.L AllCHORAGE S.U. f-AIIAKAlIAK S. U. TOTAL
C;:SCRIPTlOIl RESULT ~l • ,UL I Kt>UL fl
1I0rn.. l Birth Percent of pre<;nallcies resulting in a 85" 65 I 91~ 57 87% III f:ei ght Rate bi rth "eight between 5 lbs 8 oz and
9 lbs.
"ccep tab Ie Percent of pregr.ancies resulting in 91~ 64 96~ 53 921; 11 7 1 r·linute an infant with an Apgar 7 or greater. AP90r Rate
Prt!ljnancy Percent of pregnancies \.,.] th Goculi'ent:.a n; 67 05~ 58 101: 125 ln~uccd ti on 0 f pregnancy ; nduced hypert"ns i On Hypertens ton or di as to11 c BP greater than 90 "'" ii9· Rate -c..stational Percent of pr~gnancies ~Ii th documP.nta~ OH 67 OOS 58 01% 125 Qi'beties tion of gestationu] diabeties. Rute
mnlmu.. Percent of prec;nanci es wi th documenta-E" timate of ticn of anemia. (Hgb < 12gm or Met < 37::') 15~ 67 3n 58 I 221; 125 Prevalence! of Anemia in IPre9nancy
Operati ve Percent of pre-gnanc'ies terminating with 02::' 67 00<: 58 01::' 1250,11 very operative delivery. R.te
TAn Fami ly Percent of .,omen wi th TAB ~lho rt=!ceived 100::' 16 - - 100"' 16 Planning Rate fami ly planning uithin 4-8 t'leeks after
TAB.
._ -Post P"rtums Percent of pregl\<lnt ~.. on~n ~,ho dt:!livPl""ed 75~ 67 59~ 58 67~ 125 :d,.,i 1y who beyun fami Iy planning "ithin 4-3 ;"Jlan"i,ng weeks of delivery. Rute
--1------~E:.;Jedt Percent 0 f wo~n who becdwe pr~lJndnt
7~ 67 14~ 36 10~ 103FI""~r;nancy within one.yell ... of pre'fiollS pl""el') l1 d ll cy.
I~,lte
- 9
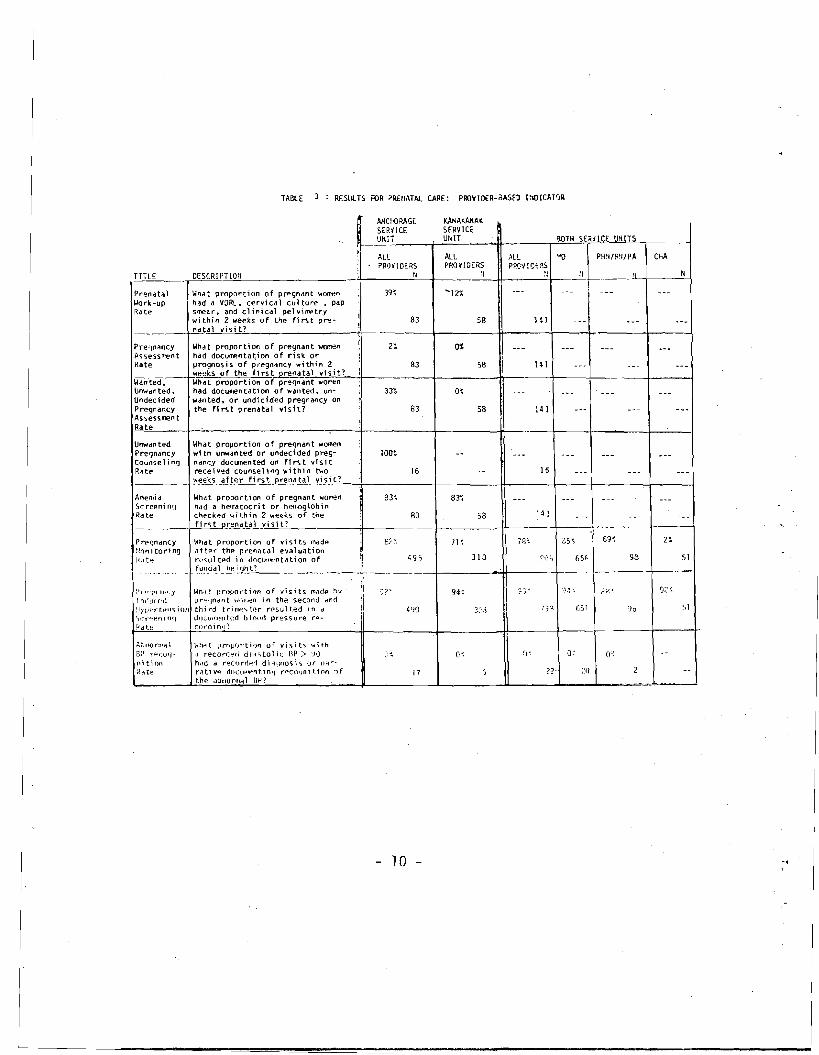
TABLE Rf:SlILTS FOR PRE/lATA!. CARE: PROVIO€R-3ASfO I1IOICAT'JR
AHCf{)RAGE KANAKAHA( SERV I CE SERVICr: UItIT UNlT ilOlH SEilHCE'...1!>UN!.!I.!.lS~~ __
All '1J PH~I/R'I/PA ChA ?ROYIDERS ALL ~ll
PROVIDERS PROVICHS TITLE OESCRI PTlOti N:I :111
What proportion of pregnant wa<ren Work-up Prenata 1
had a VORL. cervical cuI ture pap smear. and clinical pelvirr-etry within 2 weeks of the first pre
Rate 83 14158
_____-\..!n"'a.tal visit?
What proportion of pregnant WD'lenPre~ndncy o't had doculfP.ntation of risk 01"".n.ssesslt'ent prognosis of p'regn<tncy within 2Rate 58
.~~~_-l..!weeks 0 f the fi rs t prenat.-:aC;I~Y1::·s,::,i:::t~?_+ 83 + --4!--
HI--l ...L !- -1
Wanted. What proportion of preqndnt WOl'T"€n Unwdrlted. had dOCUllIentdt;on of wdnted, un-Undecided wanted. or und1cided pregnancy on Pregnancy the fi rst prenatal visit? 83 58 HI Asses~lt'ent
Rate
U",,"nted What proportion of pregnant ,,,,,lien Pregnancy wi th unwan ted or undeci ded preg 100'; COunse 1i"9 nancy dOClJ1lent~ on f1 rs t vi sit Rate receiv~d counseling within two 15
~~ks after fi rs t pre na.-"t"'a-'-l_y"i-"sc:.i _t,-'-?_-+ -I * -+- I- --1-----1 16
Anemid Whdt proportion of pregnant women 83~ 83~ Sc reeni 01] had a hemdtocri t or hemoglobin Ra te checked \oj i th in 2 w~~l<s of the R3 58 ______+-'f'-'i-'r-"-'"t-Joe__'·r.-'e""'na_~.L_y~i2'~i_=_t'_? --------.;;f-------!--------4t----~-l----+__.-- ---
2t !-!l1nitod n !J ..'tft~,.. the pr-eniltal evitluiltion
: iLlt~ t'('",ul ted in docutfl~ntation of
Prpqndncy l~hat proportion of vi"iits flldde
+-,_9_,__+- 3_1_J......."I+- '_'j."_+--_6'j;, l-~_9_8_~_-s-'4_f-,!~l_d.~l~_~~~_t?
q :'n-"'j'Tl.lId.y l~h.1t rlros;ortion of visits m~d@ h'l·
l nduu:u pp:"jndnt ...ltw~n in the second dnrt :1/~)prtpll<;; ion thj,.d t,.j,,~~t.p.r n~s.ult.ed in oj ;1 36 "1 S(r"":~11 i nq JocUlI~el1ted blonri pressure ,.~
fJdte co,.din,(!
'~;-Jf\O(1l1il \ Whrlt l)rnpfJT'tion of visit"i \.it.h a~l rpcoq oJ reco,.df.::'d dl,1'itol ic RP> :JoJ ll;tlOfl hdd d ,.~cort1~d dl~ljnoC;l'i or n'1r~
R(\te r"tiv~ dO(U1I~nt.inIJ r p Coqlllt:lfln ,f 17 the dbnonHdl iW?
10 - -.
--------- ----
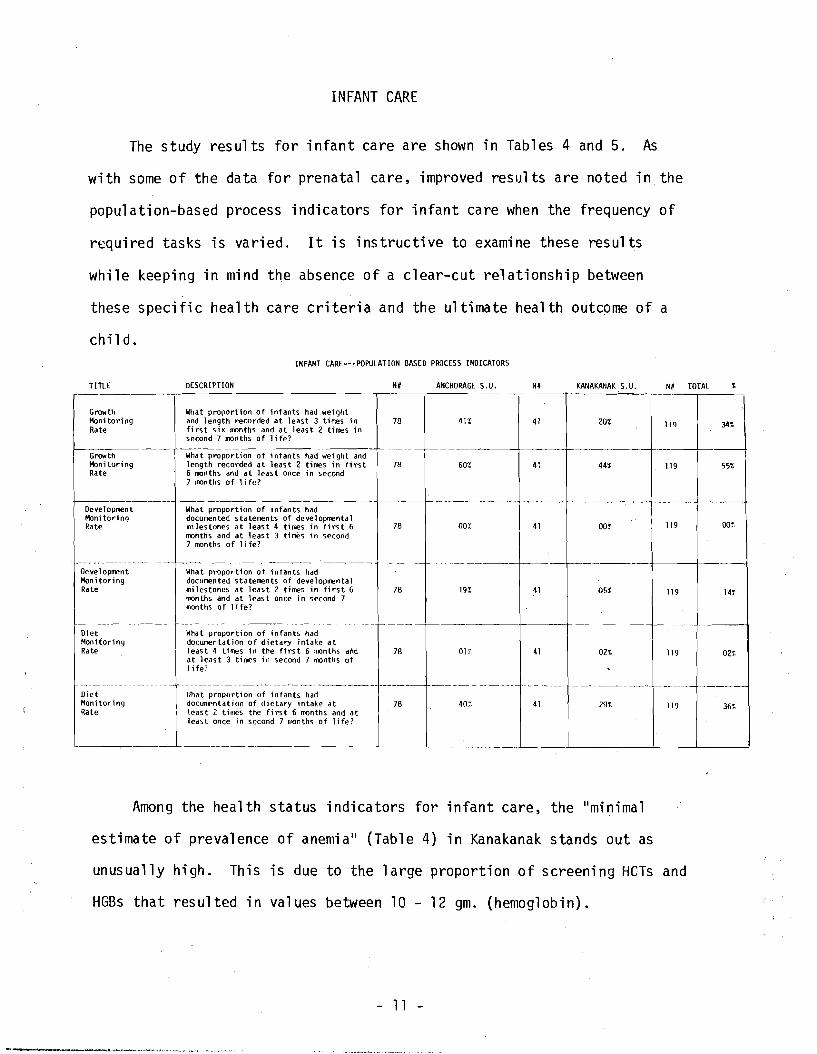
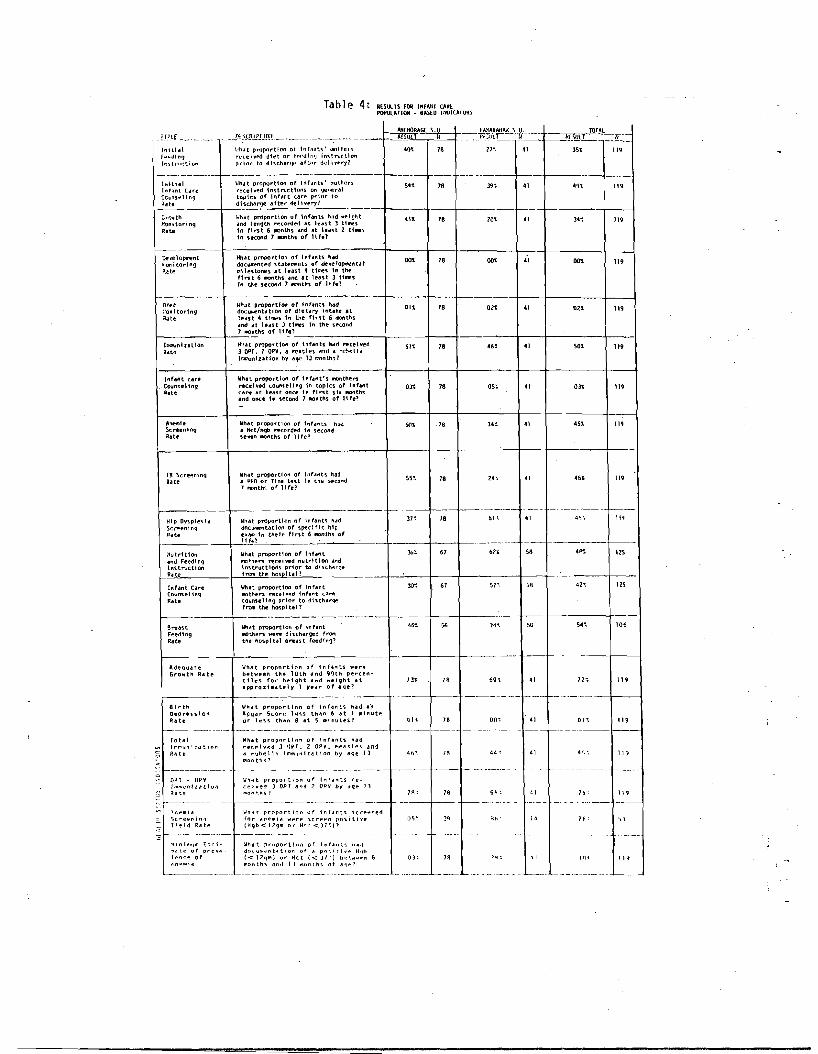
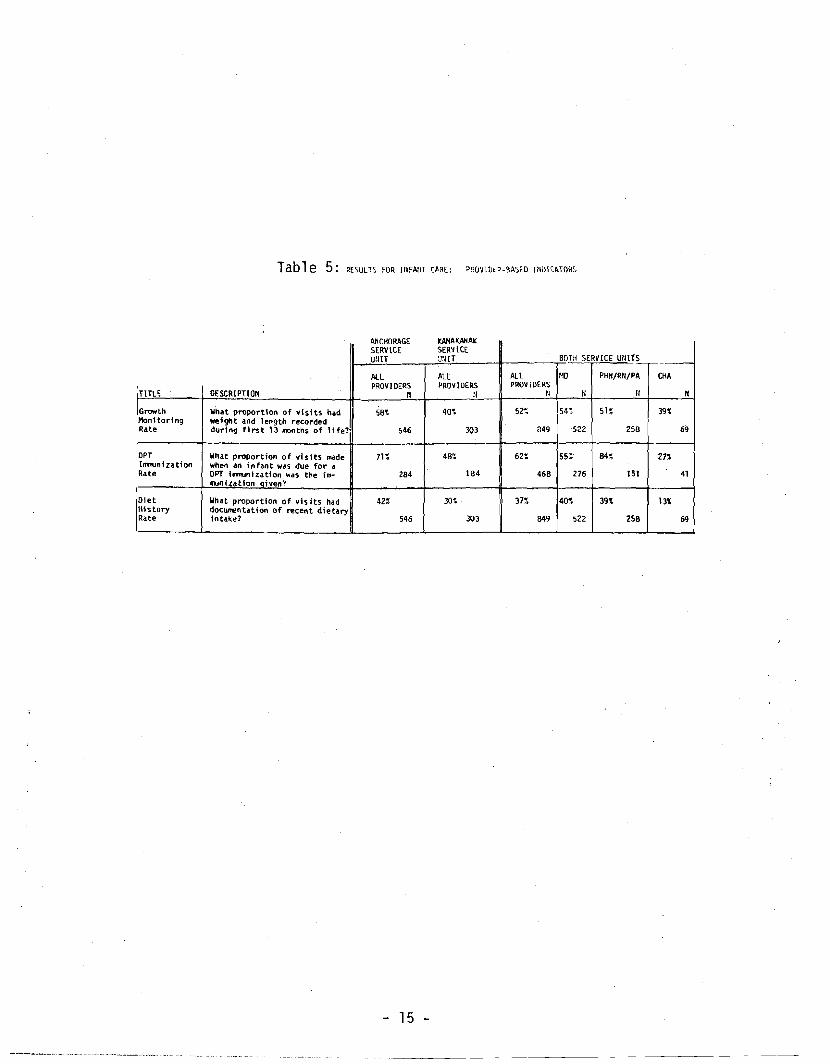
INFANT CARE
The study results for infant care are shown in Tables 4 and 5. As
with some of the data for prenatal care, improved results are noted in the
population-based process indicators for infant care when the frequency of
required tasks is varied. It is instructive to examine these results
while keeping in mind the absence of a clear-cut relationship between
these specific health care criteria and the ultimate health outcome of a
child. INFANT CI\RE---POPULI\TION BIISED PROCESS INDICI\TORS
Growth Monitoring Rate
Growth Monitor; "g Rate
r--------' Development HonHoring Rate
-"-_._------ -~ _._._-Oe ve 1opmen t Monitoring Rate
1- ,
Diet Monitoring Rate
----_ ... _--- -- --- --Diet Monitoring Rate
-
TITLE DESCRIPTION
What proportion of infants had wei ght and length recorded at least 3 ti.l':es in first six months and at 1eas t 2 times in second 7 months of 1ife?
What proportion of infants h.ad wei ght and length recorded at least 2 times in fi rst 6 months and at least once in second 7 months of life?
~-------------,
What proportion of infants had documented statements of developmental milestones at leas t 4 times in fi rs t 6 months and at 1eas t 3 times in second 7 ronths of life?
.~-,-What proportion of infants had documented statements of developmental mi les tones at least 2 times in fi rs t 6 months and at leas t once j n second 7 months of 1ife?
-What proportion of infants had docUmentation of dietary intake at least 4 times in the first 6 months aM at least 3 fimes in second 7 months of 1ife'
- --- ------_._----- -----~-----_._----lIhat proportion of infants had documentation of dietary intake at least 2 tillles the first 6 months and at least once in' second 7 "'Onths of life?
I\NCHORAGE S. U. I~# KAHI\KANI\K S. U.
78 41% 41 20% =J~~J -
78 60% 41 44% 119 55',
, f---
OO!,11978 00% OOC;;41
~'- -- .-'
78 19% 41 05% 119 14r
78 01% 41 02% 119 02%
. __.-._--- _._--- f--' -----.--.--"78 40':' 41 29% 119 36%
,- -
Among the health status indicators for infant care, the II minima1
estimate of prevalence of anemia ll (Table 4) in Kanakanak stands out as
unusually high. This is due to the large proportion of screening HeTs and
HGBs that resulted in values between 10 - 12 gm. (hemoglobin).
- 11
I
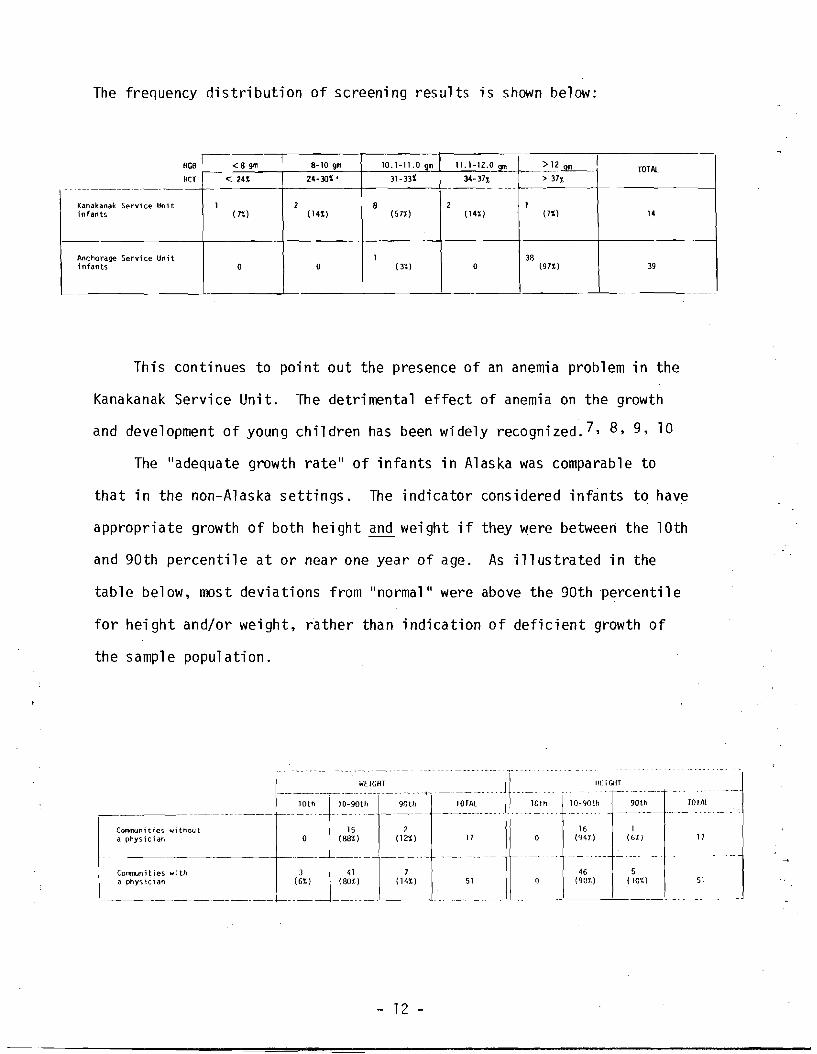
The frequency distribution of screening results is shown below:
HGB
HCT - -_.-
Kanakanak Service Unit infants
Anchorage Service Unit infants
I8-10 gm 10.1-11.0 gm 11.1-12.0 Ql11< B gm > 12 Qm TOTAl 31- 33%24-30% ' 34- 37% > 37%<241
2 11 2 8 (7%) 14( 14%) (57%) ( 14%)(7%)
1 3B ( 3%) 197i) 39000
This continues to point out the presence of an anemia problem in the
Kanakanak Service Unit. The detrimental effect of anemia on the growth
and development of young children has been widely recognized. 7, 8, 9, 10
The "adequate growth rate" of infants in Alaska was comparable to
that in the non-Alaska settings. The indicator considered infants to have
appropriate growth of both height and weight if they were between the 10th
and 90th percentile at or near one year of age. As illustrated in the
table below, most deviations from II normal II were above the 90th percentile
for height and/or weight, rather than indication of deficient growth of
the sample population.
III.lGIH , " -,'",' -, -,. , .. -_.
lD-90th 90th TOIN - -------~ ----_ ...._~
16 (941.)
1 (6'1.) 17
~------ .. --- .... - --------f .... ---.
46 (90'1.)
5 (101.) 51
Comrnun it i es 101'1 thou t a physician
15 2 o (88%) (12%)
3 41 7 (6%) (BO%) (14%)
17
___~
COJm)un; ties wi th a physician 51
...~--_._------~.-+-----+---,._---
- 12
The "total irrmunization rates ll and the IlDPT-OPV ilTlllunization rates"
(Table 5) indicate that children are being relatively well irrmunized.
These rates compare very favorably to the non-Alaska population and with
other similar studies. 11
The natural ilTl11unity fostered by human milk as well as the contri
butions of breast milk to the physical and emotional well-being are well
documented. 12 , 13, 14 It is with this in mind that we examined the
breast feeding rates at the time of discharge from the hospital. The
rates in Alaska are high when compared with IHS facilities in the
southwest United States.
- 13
------------------------ ----
---
Tab 1e 4: ."",TS fOR I.".' CAIll PQfIUlATlOO - BASED WOICATORS
TOTAL ~_r,i:;or~-4--- --M"1~~LA~S-~~~~ ---- --.r.Rtr-- :-;=::!!_ _Ll_lg .__
\!hdt propnrtion of Inr,lllts' IIlOIIIP.I·" 21':', f .... tllnl) lnil.hl '0' 78 35' '"fl:'lII~i~d diet 0" rf'"JIrI'J iMtnJct.lon "
prlo .. to l'llschar~~ "ft('r rl.~1i ... pry?Instruction
t--------------------j----t--+-------- --Whett proportton of Infdnt'S' ll".Qth~r"liIltHial 5" 78 39; "9'l.rt"(.eived tnstructlon'S On ~Iler"l
CGlJnsel ing tnhnl C.are " '" topiC'S of 1nfetnt Cdr~ prior tn .:l:~te ~~-.-"l"__.f-I.-'-.-ol-',_.ry-·,__-------_t_---+--+_-----_jf_---+ + __--1 :;MJ'oIth Iiholit prrtport1on of 'nhnts h,.d well;ht 18 20' )4~ ~onltoring and letlgth ~carded olit leut J UIIleS
in first 6 mnths and at ledst Z tiMeS '" " "' "te In ncond 7 IO'ths of It fel
\-Ihat proportion of Infants h~
~'ol'd torinlj Ve'i't'lo()W'ent llO'l 78 00' II.dOClJI"#.nted 'Statel:lellts of devclopollent,,1 " t111estones at least" times In theP.~te
ft"t Ii ft)nths and at least 3 thllt'S tn tile second 7 lllOflth, of life?
Uh.lt proportion of Infants h"dOlf't 01. 78 02' 02' ".docullent"tlon of dletetry lnt"ke at:'onltodng " led!t " tll11i1!:s tn the first 6 n'Ol'Iths "'to .Inet cit I~.s t ) t'IIIiI!:S In tht' u~(.olld
1-- -t_7_""._"_lh_5_ of I if~Ol'__. -,I__~_-+--_1--
What proportioft of tnf"nts twl'l ~celvedh'aunha11on 78 .46'! 41 SO. II.5"3 OPT. 2 OPV, o! ""il~les #lnd a rl~tw!'I"Rdt~ l:':Qlnlutlon by oliljC 1) r;'(lnth'i?
What proportion of tnfant's IlOnthe,., ._ Counseling
(n14M care ,,,r"Kehed couns~Hng In topics of Inf..nt 031 78 OS, 03' care at least Ona in first sh IlOnthslIl,t~ " .nd once tn '5I!cond 7 "Onths of It fe?
~.,~1a What p"OPortl0n of infants hillJ SOt 78 34:: 41 m'5'Scr~entng 011 Hct/Hgb ~cnrded tn second,... '5eV'ln ..nth'S of 11 fc'?
Wh"t proportion of lohnh hadT8 Sc reeni n9 55' 18 ?4 ~ 41 '5' "' , PPO or Tine te'\t in th~ spcand
7 h:lnth'i of life'? Rate
1-- - -------- 1---In: 18 61< 4':I~Wh"t prrtvortlon of Infant'i hddHlp OY'!iple'il. "."dnc~ntdtlOll of 'Specl ftc hillSc~entnq
~.a~ 'n theIr flnt 6 IlOnth'!i of 11 f!-?
R.te -~--------- c----
67 61.1 58 125Whllt proportion of Infant 36';'lutdt10n ''''' !lilt_hers n!ceivoed nutdt10n and Instructionand Feedi nq
'nHruct10n'li prtor to di'lich" .. ']e f\"'Olll the hosplUl?....
sr· 125 (oun'!i~l inq
30' 61 42~Whet proportion of tnf"nt[nrant Care '"IIIOth~rs recely-d lnt."t ca,.". cO\inul1ng prior to dtscholir~
fr"'Onl the hospital'? Rate
56 74". 50 5",Wholt proporttOl'l of Infantgrea'St ••• '0. "OU\en wen! disch"r~o::l f~
Rdte Feedt ng
the hospttal O""'!it feedfnq?
What propnrtlon of Inf ..... ts ",er@ Growth Ra te ofIdeQOoli te
b@tween the 10th "nd !Jl)th pe ..centt1~s for h~tght oInd ",@ight at In ,. 69", 41 11. approxiMately 1 )'ur of .Iqe?
---- -----.----+----1 8lrth Wh.lt proportlnn of InfllntS had lI'n
~:~:e'!i'510n :~y~:'S~c~~:n':'i:tt~"~I~u~~s~lllnutp. I)lt 78 on~ ·41 DI~ 119
f----------- -----.----~--------r---- -- ------------ -----------Totoll What proportion of Infant'\ had 11'",",un1;:.l~lon reCf'lv~d J lJVr. 2 DP'L I"l,./I'il,.... ;Jn1 R/lte iI rubf:'11~ 11l1mljfdllll;on by aqe I] 467. H 44'- 41 I\~,'. '19
ilion th s?
----------- --------------------..- --e- ------- -- ------ OPT ~ OP'l Who'lt proportion of tntolnts re/mlf,</nlld(:lon ceiyed J DPf ""d 2 OPV by ,Hie I) ~h toe mo" t.hs? 18 61i ~ 15". II?., ~ n<'111 i a Wh"t proportioo of infAnt~ 'icrpt!ned ')c .. eenin.1 fnr "1'1~mio'l Wi're ~cn.",n po~itiye u'i .... f';b' ,. ?6 ~ C, )
T' ~ 1d ;l:a t~ (Hqb<129m or Hrt.<)7~l?
r------- ---------------- ----,----- -~1' n i m.,"1 £ s t i . Wholit. prlJportlon or Il'1f4'l::~ h41t ~dt@' of prev" do<:u!,...·nt"tion of Il po'.iri" .. H'lb I ~"c@ 0 f «llqlll) or ioict «3/') b~·.w .. ~n 6 0)', , I lIH I I.
0'1 n","''1 month'i .ln,l lJ ...onth .. of a'lfO? __
J '. ~ ~ ~ .. . .. L--. __ --~ -,.~ ---
Tab1e 5: RESULTS FOR ltIFAIiT CME: P~VIDt'-~ASm 11IDICATORS
TliLE OESCRIPTIOH
Growth What proportion of visits had Monitoring weight and length rKorded Rate during first 13 ..",ths of life?'
OPT What proport ion 0 f vis i ts ""'de Inm.onlzation when an infant was due for a Rate OPT hlnunlzatlon was the im
...nizatlon Diven?
Diet What proportion of vis Its had History documentation of ",cent dietaryRate Intake?
I
AflCHORAGE SERVICE WIlT
AlL PROVIDERS
II
58~
546
71%
284
42%
546
KANAKANAI(
SERVICE ~:HT
ALL PROVIDERS
:1
40~
303
4~
184
30~
303
ALL PROVIDERS
II
52~
849
62:
466
37~
649
BOTH SERVICE UNITS
MD PHH/RH/PA
IIII
54~ 51~
258522
84~S5:'
276 151
40~ 39:
522 258
CHA
II
39~
69
27:
41
l3~
69
15
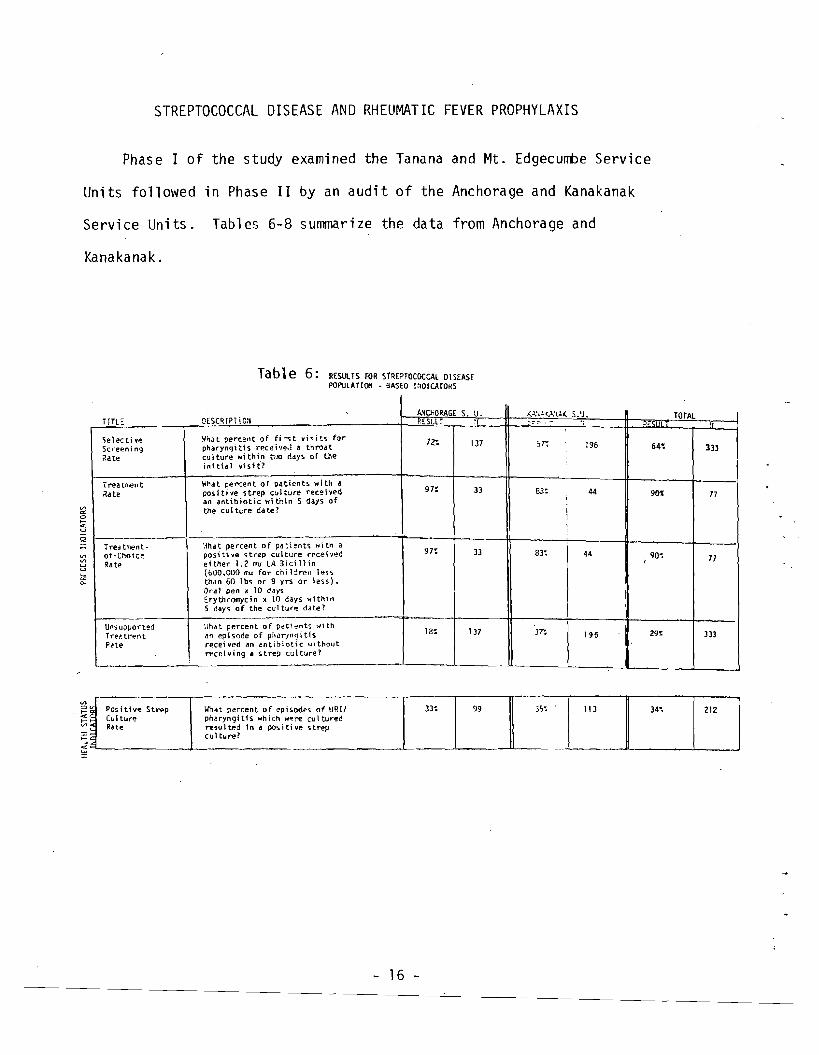
STREPTOCOCCAL DISEASE AND RHEUMATIC FEVER PROPHYLAXIS
Phase I of the study examined the Tanana and Mt. Edgecumbe Service
Units followed in Phase II by an audit of the Anchorage and Kanakanak
Servi ce Units. Tables 6-8 summarize the data from Anchorage and
Kanakanak.
Tab1e 6: RESULTS fOR StREPTOCOCCAl OISEASE POPULATion - 9A5EO lrlOlCATORS
TITLE CESCR[?TiC:I
'iel~ctiv'!
Sc.'eening Rate
I rea trr€n t Rate
Treci t~nt-of-Chotc~
Rate
Unsupport~d
Trf.'?tr.~nt
PHe
~hJt percel1t of fi ;-o;t vi'S i ts for pharynqitis rece i '/~,J a throat culture within t'..jQ days of the 1n1 tid 1 vis It?
Hhat percent of patients wi th a positj'le strep culture r~c.~i ved an antibiotic wl thin 5 days of the cui ture date?'"a:
3o
Q ~iha.t percent of pa~ients wit" a positive strep culture recei'/l:!d etther 1.2 f'lU LA 3icil1in [600.000 ",u for chi l.jrell 1~5'i
than 60 1bs or 9 yrs or less), Oral pen x 10 days Erythromycin x 10 days with;I1 5 days of the cui tUI"il! ddte?
llhat percent of p~tient!i ""ith an episode of phar:tngi tis receiyed an t'ntib~otic lol1thout recetY'"g a stre? culture? ,
ANCIiORAGE s. U. RESlL :1
7?". 137
",J.,".1().,'(,1( S.'J. :";:",:,",., -
57'; 196 64~
TOTAL
333
97:
97:
18~
33
33
137
8"
83:
37':
I
i I I
:
I I I
44
44
U6
901
90~,
29~
77
77
333
PosittvO! Strep 212 (\II tur~ pharyngitis which W~!"e cut tur'!!d 99\lhat percent of episode> O._fU_RI/_r33~l ~35:_--t'_1_'3_I 34~ 1 ] Rate resulted in a posit;ye st~v
;: cuI t\lre?
5.......-------..l---------~ '-------'--- x
- 16
------
---
----
---
---
Tab 1e 7: RESULTS FOR RHEUMATIC FEVER PROPHYLAXIS - POPULATION BASEO INDICATORS·
TITLE , Prophylaxis Rate
-----~---
Orug of Choi ce Rate
Cohort Prophylt.xis Coverage Rate
Prophylaxis Coverage Rate
A;ICHORAGE AND KANAKAHAK SERVICE UNITS
OESCRIPTIOIl I RESULT T N
83% 43~jhat proportion of patients were \treated prophylactically during the study period? II
76% LA Bicillin 0'- (if allergic to penicillil1) eithcl- Erythromycin 250 '"9 BID or Sulfadiazine 1 gram g.d.?
\Ihat proportion of pCltients rece; ved
-oB%
year du'ring which the study cohort was covered prophylactically?
\/hat is the mean percent of the study
\Ihat Is the mean percent of the study year during which those individuals rece; vi ng prophy 1ax; s were covered prophyl act i cally?
43
43
29% 36
",~uteg; Rheumatic Fever i Recu rrence Ra te
Ilhat percent of patients suffered a recurrence of ARF during the study time frame (1 year)?
02% 43
• BECAUSE OF THE SMALL SIMPLE SIZE RESULTS FROM BOTH THE ANCHORAGE AND . KANAKANAK SERVICE UNITS WERE COMBINED.
Tab 1e 8: RESULTS FOR STRE?TOCOCOL OISE~SE RP.EU,"AT IC FEVER PROPtiL~.<IS:
PROVIDER - BASED I~OIC~rORS
~MCHJRAGE S.U.
All ROV IDE'lS
TITLE___ '}o S!JU PTlOr,.
S@lecttve Sc~jn9
Rate
T~.~nt
Rat@
Trear;;r~nt
Of ~NJice
Rate
._--_..,,",supporltd "<!~ ~W
I'roplIllal'i~ k_1 ~~
--~
\l1t'lat percent of fl rst vhits for 72~
pMryngitls M!cei ved a throa t cu 1ture with t n bolo days of th~ . 137 in; t; al vhit?
. WhH percent of patients with Ii 97~
positiv~ strep eul ture recel ved an antibiotic ..... ithin 5 days of 35 tne cul ture riate?
Whdt percent of patients with a pO'iitive st~p cul ture rece; 'i''!!d
e; ther 1.2 mu LA aicillin 17~
(600,000 mu for chi ldr~n les!. than 50 lbs or 9 yrs or less). 35 Oral pen < '10 days Eryth~11'1Y':~n x 1a days wi thin 5 days of :.;:e
~.ul~r:.~ate? '''' ,,~."' ., "","" .". l,~an eDiiod~ of URI/~h",ryngitis
reccoived an dntt~iotic wlth- 137 out r-eceivinq d strev_ c:JltlJ~1.....- ____._
litlat percent of vi'iitis ~y -- post ~RF patients nOt cover'" I propnyldcticdlly. ("cos-ulted 1n - -0) ren~{\' of proph'llaxli?
KAlIAKA/lAK S.U.
~LLALL PRO'II Of'SPPOVIOERS
II - I---._,..:.r 64~51~
3D196
90~83~
47 ~2
90~83'
J 7 :?
37 '. 29-":
196 333
~--------- 2 7~
::2
ArlO
T~rAL
liO
II
88~
99
78<
78'
~-
c'
29~
2<J
2B
~9
BOTH S.U's.
PH" I
e3~
92~
92:
~ ,
PA
___1 '
2B
20
20
?:J
--,----_ ..
CHA
49\
91~
9l'~
43~
---~--
21"':175 ~
65 r.
I _--1_----.
II
206
34
34
.~
205
..
17
19

The yield of positive pharyngeal cultures for strep (Table 6) is rela
tively high ranging from 32% to 36%, and when compared to the southwestern
United States, this strep infection rate is considerably higher. Although
these percentages should not be confused with a true incidence, it nonethe
less suggests that streptococcal pharyngitis deserves continued emphasis.
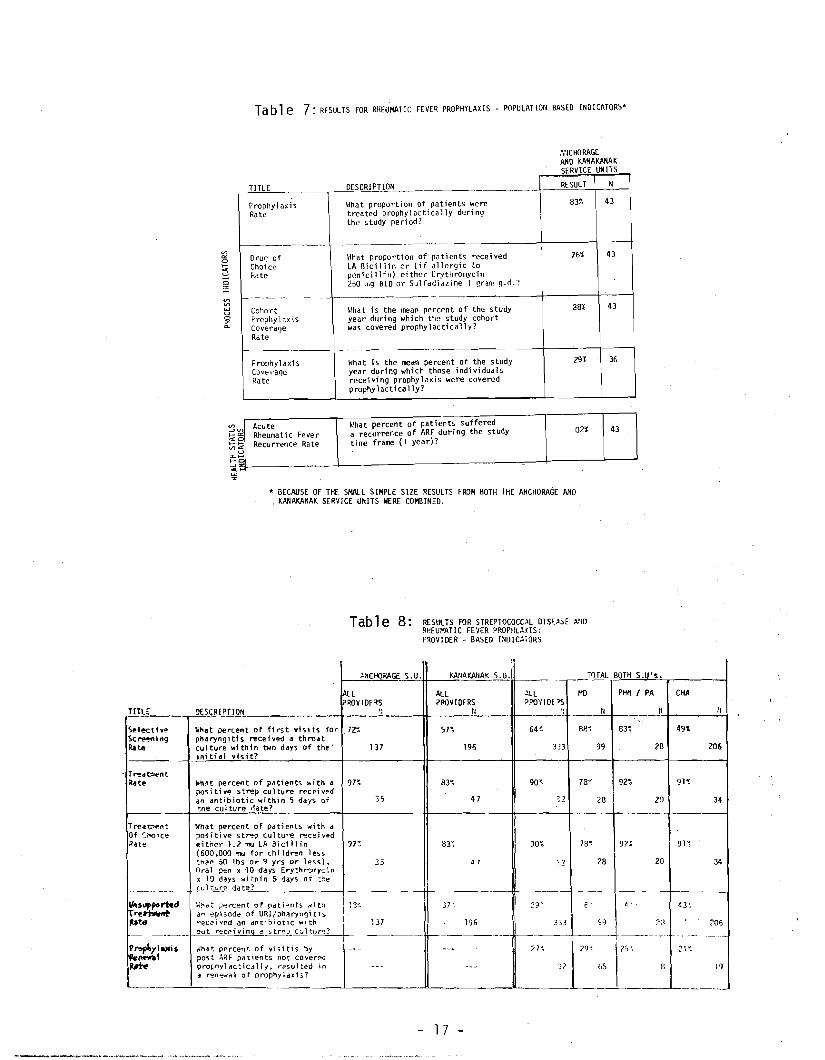
Examination of both population-based and provider-based indicators can
be of significant benefit in improving the quality of health services. For
example, Table 7 indicates that the rheumatic fever patient requiring peni
cillin prophylaxis was covered prophylactically only 29% of the time, although
this relatively low figure may be due in part to the patient's failure to
return to a provider. However, Table 8 shows the prophylaxis renewal rate
for all providers to be only 27%. By this we mean that when a patient who
is overdue for prophylaxis contacts a provider of health care, his prophy
laxis with penicillin is given only 27% of the time. A cursory analysis
suggests that if all the opportunities to renew prophylaxis had been ex
ploited (e.g., prophylaxis renewal rate of 100%), the prophylaxis coverage
rate might have been increased from 29% to as much as 44%. In other words,
although accessibility and patient compliance may be relative barriers to
adequate rheumatic fever prophylaxis, a significant improvement could re
sult from additional recognition on the part of the providers of those in
dividuals overdue for prophylaxis.
On January 1, 1976, the Alaska Area Native Health Service Office of
Program Development implemented a computerized surveillance system to track
rheumatic fever patients. One of the functions of the system was to in
crease the prophylaxis coverage by identifying those patients overdue for
prophylaxis. Since the time frame of this study included the six months
preceding and the six months following implementation of the system, it is
- 18
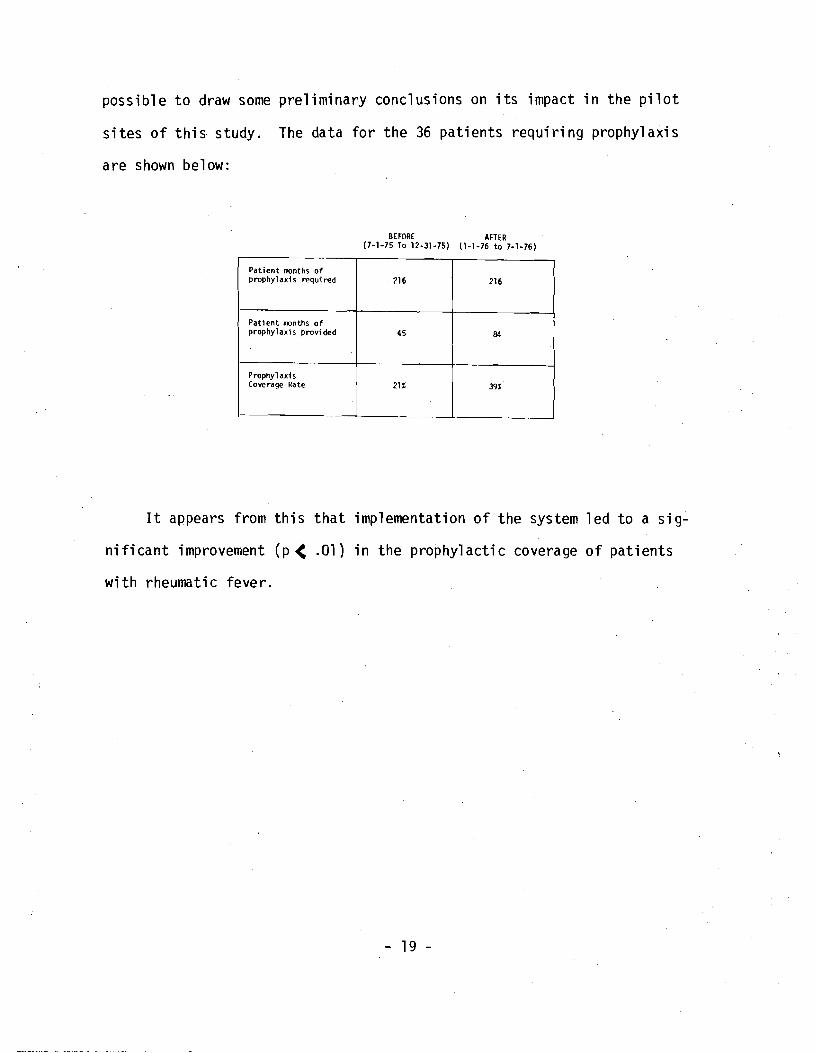
possible to draw some preliminary conclusions on its impact in the pilot
sites of this study. The data for the 36 patients requiring prophylaxis
are shown below:
BEFORE AFTER (7-1-75 To 12-31-75) \1-1-76 to 7-1-76)
Patient months of prophylaxi s regu; red 216 216
Patient months of prophyl axi s prov; ded 45 84
Prophylaxis Coverage Rate 21% 39%
It appears from this that implementation of the system led to a sig
nificant improvement (p < .01) in the prophylactic coverage of patients
with rheumatic fever.
- 19

LACERATIONS OF SCALP AND EXTREMITY
Results for lacerations in the Anchorage and Kanakanak Service Units
are shown in Tables 9 and 10. The population-based wound description
rate is made up of three elements: 1) the time since the laceration; 2)
the cause of the laceration; and 3) the description of the wound. Exami
nation of the data reveals that failure to document the time since the
laceration was the major factor in lowering the overall wound description
rate as shown in the following table. Since justification of the treat
ment plan may be dependent upon the time since the injury occurred, docu
mentation of the time span would appear to be an important element of
charting for medica1/1egill reasons.
ANCIIORAGE s. U. KAtlAKAtlAK s. u. TOTAL TITlE DESCRIPTION tl# % tl# %
TifTf> S1 lice -~ii~:~~~~:~~ii~~gd-~~i~~;:~i~-~~~u~y.----- ---------- --------I---]~ --~.
laceration 100 341". 95 261 195 301"
- ------------------ ------ --------- ------+---+--Documentation of the cauo;e of the laceration (blunt, traUfl\3. glass,
Cause of laceration
d09 bite. etc.) 76%94% 56% 195100 95
- ~-\------------f------------------.+------.--~-----
701: wound
100 114%OOCUIrentation of the wound appearance 95 56% 195oescription of (clean. deep. jagged. etc.)
f---------r-..-------------------4-----+----+----Percent of scalp or extremity
rate Wound description
1acerati on encounters documenti n9 1) the time since the laceration. 281,100 341, 231" 195 2) cause of the laceration and 3) descr1ption of the wound.
L... -'-- -L- L _ __ L--._ .---'---~--
As can be concluded from this data, less than one third of the pro
viders are documenting the time since the lacerations occurred.
The observed wound infection rate (Table 9) was relatively low and
was comparable to that observed in other health care settings.

Tab1e 9: RESUlTS RlR LACERATIONS - POPll\.ATIOK aASEO PROCESS lKOICATORS
.. on
l:!'" u C z
TITLE O£SCRI?TICK ANCHORAGE RESULT
S. U. :1
KArIAKAHAK RtSUL
S.U. n
TOTAL P."U '1
llound Oe,crlptfon
. Rate
Percent of scalp or extremity laceration encounters documen::ed: 1) The tir.e since the 1~cerat1on,
2) Cause of the laceration, and 3) Oe,cription of the ",ound.
34: 100 23: 95 28': 195
Oocur.entiJt i on of Extent of lnj... ry Rate
Percent of scalp or extrem.ity JacerJ.tions ,-Ii th docur."entcd C041s1deration of bone, nerve and vasculdr involver.ent.
39\ 100 18\ 95 291: 195
Tet;!nus ?ro;:lylaxis Ceverage Rate
Percent of scalp or extremity l~cerations which had current tetanus ir.t!lUni za tion or where gi ven tetanus protecti on.
56% 100 31: 95 441: 195
Revisit Rate Percent of pat1ents with sutured scalp or extre"; ty laceraticn by any health proviGer for any reason within 5-15 days of laceration encounter.
66~ 72 87:; 23 71~ 95
follcr,i-up Rate
Percent of patients wfth sutured scalp or extrep.ity lacerations "lith docur.'ent~tion of ",ouod heallnq 5-15 days after laceration encoul"l te'...
58': 72 74: 23 62\ 95
'" '" 0
:5;; !:
Ob,e rvo><! Wound Iniectlon Rate
Percent of scalp or extremity laceration enCOUnl2ri wlt'n docur,entation of wound infection wi thi n 2 ~eks ~
05>. 100 05: 95 OS~ 100
Tabl e 10: RESULTS fOR lACERATIOKS: PMOVIOER-aAS,D J:IOICAlORS
ANCtIORAGE YA~AKANAK
SERVICe UNIT
SlR~[ct
ulm 80Tl! SlRVICE I ~ITc
iI TtE OESCRIPTION
/ilL P.ROV JOERS
N
ALL PROVrDEilS
'j
ALI. PROV IDE RS
;:
flO
II
PHtl • PA
K
CHA
N
I/ound ~e,criptlon
~ate
Percent of scalp or extreMity laceration ~ncounter by provider type (NO. PHN. CIIA, RII, PAJ that documen ted: 1) T1me since laceration.• 2) Cause of lacerat1 on. and 3) Oescd pt10n of wound.
34t
100
23~
95
28;
193
42~
96
23~
26
81
73
~--
Doc"""ntatlon Of Extent of Injury Rate
By p rovl d~r type (,ame de,cription as population based 1ndicatori).
39\
100
Ill";
95
29~,
195
44'
96
271
26
4t
7)
-Tetanus ProphylaxiS Ren...al Rate
Percent of patients who were for tetanus irTInUnization received tetanus toxoid.
due 43\
77 "
I
16:
76
n,
153
38~
77
50~
16
laC::
60
Follow-up ~.te
8y provider type. percent of patients "ith sutured scalp or e,(tremity lacerations who revisited pro_ider 5-15 days after laceration wHh documentation of wound healinq.
88~
47
) 85~
20
8n
67
89~
58
83t
6
67~
3
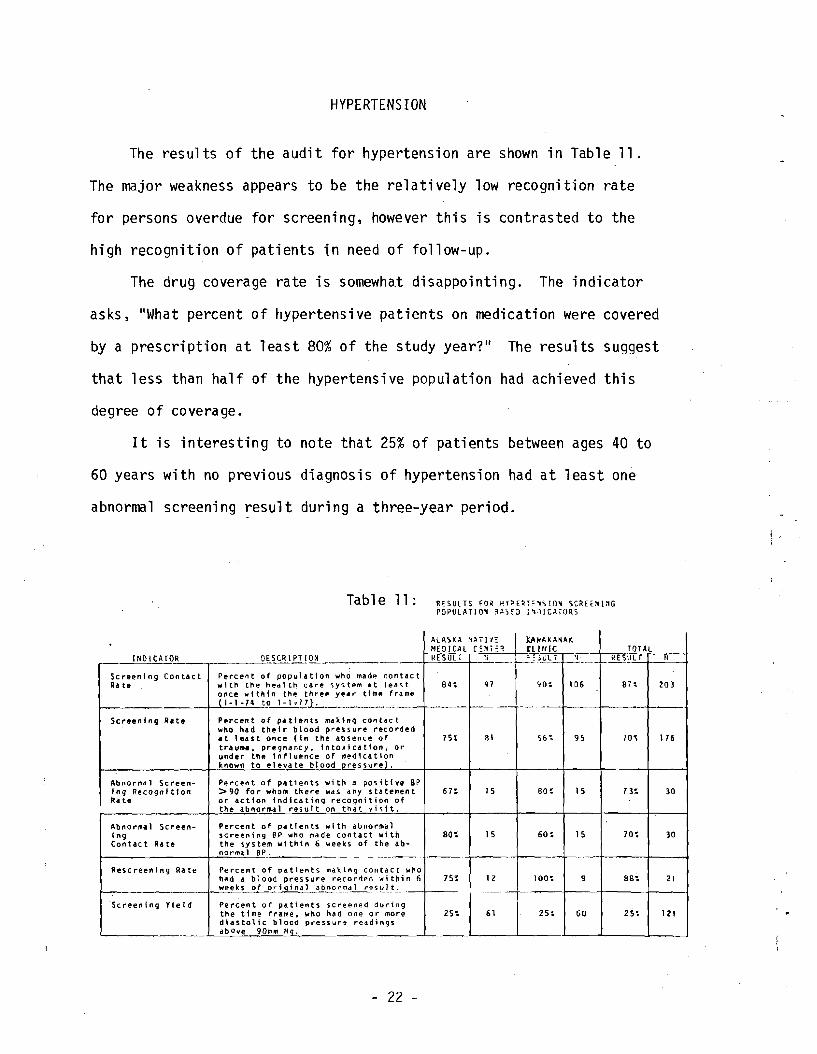
HYPERTENSION
The results of the audit for hypertension are shown in Table 11.
The major weakness appears to be the relatively low recognition rate
for persons overdue for screening, however this is contrasted to the
high recognition of patients in need of follow-up.
The drug coverage rate is somewhat disappointing. The indicator
asks, "What percent of hypertensive patients on medication were covered
by a prescription at least 80% of the study year?" The results suggest
that less than half of the hypertensive population had achieved this
degree of covera ge.
It is interesting to note that 25% of patients between ages 40 to
60 years with no previous diagnosis of hypertension had at least one
abnormal screening result during a three-year period.
Ra te
In9 Rate
1n9
INO I CAfOR
Screening Con toe t
Screening Rite
Abnormlll Screen-Recognition
Abnormal Screen ...
Contact RIa
Rescreen1ng Rate
·Screening Yield
Table 11: RESULTS FO~ ~laE~'!~SIO~ SCREE~l~G
POPUlATIOM 3~SrO :'JIC~rORS
OESCR 1PHON
Percen t of population who madp. w t th the heal th car"e system at (nce within the three year time
1-1 -74 to 1-1.17L
Pprc~n t of pa ttents ma k I nq con tac t whO had the I r blood pressure It lea s t once (1 n the absence of tra uma. pre9nancy. 1nto.xicatton, under the influence of medication known to elevate blood Dre55urel ..
Pe rCf!n t of patients with a positIve >90 fo r whom th ere was any or action IndIcating recognition the abnormal res uIt on that 'I i 5 it.
Percent of patients with dbnorma 1 screening BP who m<lJlde contact with the system within 6 weeki of the norma 1 BP.
Percent of patients rnaking contact had 4 blood pressure re.corded weeks of original abnorma 1 rl?~ul t.
Percent of patients screened the time frame t who na d one or diastolIc blood pressure readings abOve 90m" Hq.
AlAS~~ ~~Tl'I;: JY~AK~~AK ~~OIC~l r:~ER ClII/IC_, TOTAL
RE-;-UL I ~; -i})J;.\,l. 2 ____~Jl!2Yll- _._1_
contact
I 20]lelll'i.t S4~ Q1 ~O~ 10& S1\ (ra me
recorded 81 5&~7St 95 116
or 70'
SP s ta temen t 61: 15 80: 15 13: 30
of
80'; 15 60: 15 70: 30 ab-
who within 6 751 1Z 100~ 9 8S: 21
during more 61251 25~ 2S~ 12160
- 22

---------
--
I
Table 12: PROCESS INDICATORS FOR HYPERTENSION
r11lL DESCRIPTION --_.~-, ---
~creening 64, 5%What percent of at risk patients had 74 Rate thei r blood pressure checked during
the st.udy period? Ii
Recogni tion of On 64 I 23% Overdue Screening
Follow-up of 92 48% those Screened Positive
I
Mi ssed 80% Di agnos is
Work up In what percent of new cases Compl iance of hypertension was a parti
cular test ordered as a part of the initial diagnostic work up. (Test must be ordered
3 months from date of di agnos is.
B/P both arms 44 ,34%
UA 44 75%
Urine Cul ture 44 36%
BUN or Creat. 44 43%
FBS 44 13%
Weight 44 70%
EKG 44 30%
Chest X-ray 44 34%
Potass i um 44 38%
Fundascopic Exam 44 55% ---,
Drug What percent of the hypertensive 26 42% Coverage population was "adequately covered"
by perscriptions for antihypertens i ve drugs. ("Adequate coverage" = covered by perscriptions at least 280 days per year.)
- --,
Recogni tion On what percent of vi s1 ts when a 245133 100% Of Need For patient came in "overdue for Follow-up hypertension follow-up did the
prav; der document hypertens i on as a purpose of vi sit. (Overdue = out of medication more than 5 days or roore than 4 months since 'last B/P check.)
- - -- .. -- - . -- - - -------------- -------~ -- -~----- ---- -_._-~--~--~--
MTN#TANANAN#
wha t percent of encounters in 74 which patients came in lI overdue" for B/P screening do they actually get thei r B/P checked (Overdue = No B/P in past year.)
What percent of, those "screened 158 positive" were rechecked within 2 months. Cri teria for "screened pas; tive ll
:
Age B/P 10-20 )135/80 11m Hg 20-40 >140/90 "'" Hg
:> 40 )150/95 "'" Hg
On what percent of encounters in 6 19 which a diagnosis is "indicated". does the provider actually enter a hypertension related diagnosis? (a diagnosis is indicated if a previously undiagnosed patient has had 3 consecuti ve B/Ps
95 "'" Hg diastolic)
84
84
84
84
84
84
84
84
84
84
80
EDGECUMBE
55~
I
19% i I !
I
,
56%
84%
48%
70%
14%
63%
39%
85%
44%
44%
39%
48%
38%
84%
N#
138
TOTALS ,
571, I !
20%
50%
83%
43%
72r,
22%
56%
30%
80%
39%
41%
39%
50%
40%
86%
I I
I
<---___I
138
250
25
128
28
128
128
128
128
128
128
128
128
106
278
23

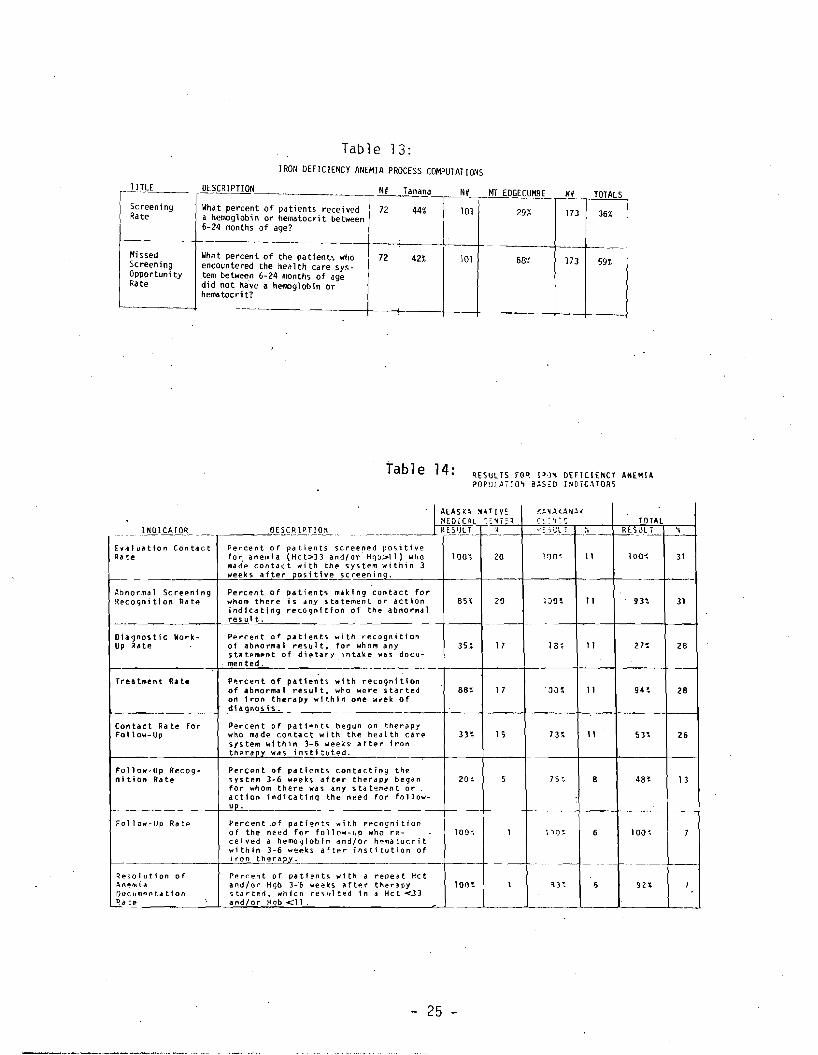
IRON DEFICIENCY ANEMIA
Results for screening for iron deficiency anemia in infants and
preschoolers are shown in Table 13 for the Tanana and Mt. Edgecumbe
Service Units. Results for the management of patients screened positive
are shown for the Anchorage and Kanakanak Service Units in Table 14.
The latter data is broken down into indicators that examine contact
rates and recognition rates in addition to rates of performance of the
various clinical elements.
In general, it appears that the Kanakanak Service Unit performs
slightly better than Anchorage, largely due to increased recognition
rate in the former.
\~
, I,
- 24
-----
----
----
TITLE
r- Screening Rate
Missed Screening Opportuni ty Rate
Table 13: IRON DEFICIENCY ANEMIA PROCESS COMPUTATIONS
DESCRIPTION Tanana NH MT EDGECUMBE NU TOTALS
What percent of patients received a hemoglobin or hematocrit between 6-24 months of age?
72 44%
What percent of the patients who encountered the health care systern between 6-24 months of age did not have a hem:>globin Or hematocrit?
72 42%
101 29% 173 36%
101 68',~, 173 59%
Table 14: ~E5ULTS FO~ 1~1~ DEFICIENCY AHEMI~
papUL~7,O~ B~SoD INDiC~TORI
INDICATO.R
£w"Juation Contact Ra !:e
-Abno-rma 1 Screening Recognition Ra te
DiagnostiC Work-Up ~ate
Treatment Rate
Contact Ra te for Follow-Up
Follow-Up Recognition Rate
Follow-Up Rate
~@o'iolut;on of '\n~",id
Oocumpnt.tion ,~a':e
O~l.~l!.lJ2!!.-
Percent of patients screened positive fa r anemia (Hct::>]] and/or Hgb>ll) who mad'e contact wi th the system '.111 thin 3 weeks after positive screeninQ.
Percent, of patients mttk1ng contact for whom there is any s ta temen t or action i nd 1ca ti ng reco9nf tion of the abnormal resu1 t.
Percent o~ patients with recagnt tion of abnormal re~ul t. for who'" any s til: tement of dietary in tak e was dacumen ted.
P'!rcent of patients with r~cognition
of abnorma 1 resul t. who were started on 1 ron the ra py wfthin one week of dlaqnosis.
Percen t of patiaontlO begun on therapy wllo made contact with the hea I th care system wi th i n 3-6 wee:Cs· after iron therapy was insti tuted.
Percent of patients contactinQ the system 3· 6 weeks after therapy bega n for whom there wa s .ny stat~;nent or action indicating the need for follow-up.
Perc en t of patients with recognition of the need for fall OW-liP who recei"ed a hemo')lohin .nd/or h'::"~d toc"; t within 3-6 w~f!'ks after institution of iron th~
Percent of patient," with • repe~t Hct and/or Hgb 3-6 weeKS t\ft~r thenpy 'jjtdrted~ whiCh re"ult~d 1n • Hc t <.3)
and/or Hqb <11.
K~~~(ANA(-IALAS KA ~.~ rr 'I,MEDICAL -:~El TOTALC!..: 'I: t:
_______. ..___J..R.l~.tJ.I,2...- i~ r---i=-~ );J_~_l- c--!!-ES..u.L.!......-~- ~-
110~ IOO~11 3120100"
-
7JO~ 1120 31BS' 93'
27:35 ~ 17 lB~ 11 28
·,ai)~88~ 17 11 9H 28
33~ 15 73~ 11 53~ 26
7,<20~ 5 4B~8 13
-
I 1')O~100~ 100~6 7
.1---.
1 ~HIOO~ 92\5 7
25
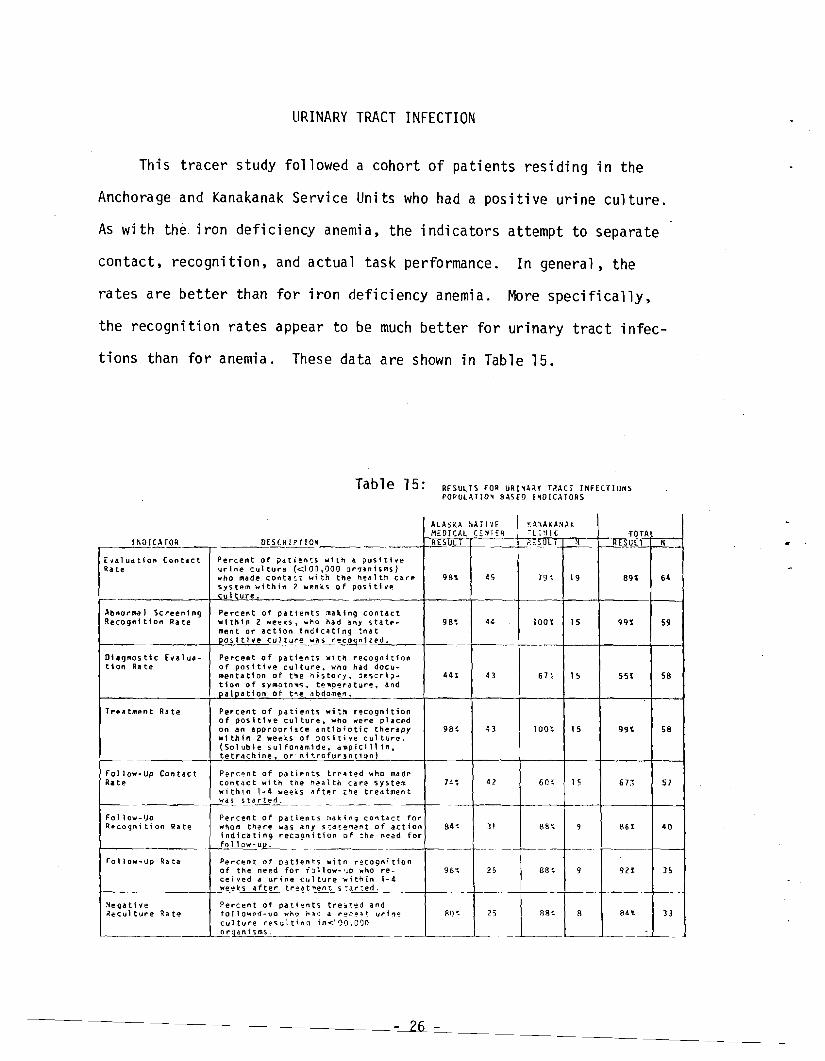
URINARY TRACT INFECTION
This tracer study followed a cohort of patients residing in the
Anchorage and Kanakanak Service Units who had a positive urine culture.
As with the iron deficiency anemia, the indicators attempt to separate
contact, recognition, and actual task performance. In general, the
rates are better than for iron deficiency anemia. More specifically,
the recognition rates appear to be much better for urinary tract infec
tions than for anemia. These data are shown in Table 15.
Table 15: RESULTS FOR URl'A~Y T?-ACT INFECTIONS POPULATIO~ BASED I~DICATORS
Ra te
tlon
Ra te
f--
INOICATOR
E"laluation Contact
Abftorma I Sc reen I n9 Recognition Rate
01lgnos tic Eval Ud-R. te
Tr~atJftent Rate
Follow-Up Contact
Follow-IJo q~coqnitio" Ra te
Follow-Up Ra te
-
~e9ati.e ~eculture Ra t~
DESCRIPTIOH
Percent of pat1!'n'.::s with • posttt ... e urine cultu,.@ «100,000 or~lni~ms}
who m4d~ conta':t wi th the hell 1 th system within 2 weeks of pos Ithe cuiture.
Percent of patients :.aklng contact "ith I n 2 weeks, wno had any state .. ment or action indicating :nd t Doslti.e culture was recoqnized.
Percent of patients with recognition of positive culture. ... no had documenta tl on of tne il i s to,.y. descrl~-
tion of sYalotO"lS .. terl'!J'.!,.a ture. and palDatlon of tne abdomel'1.
Percent of pa ti ents wi tl1 recognition of posltl.e culture. who were placed on an aporopriate antibiotic theropy "i th; n 2 "eeks Of positive cu1ttJl"'e. (So 1 ub 1e 5 ul fonami de I c.lapiCi 11 in I
tetrdchine or' nt troful"'!Inti0rU-
Percent of patients trea ted who made Contact wit" tne health cal"'~ system within 1-4 weeils d. fte I'" tred tmen t wOS stdrted.
~"e
Percent of patients :lid k. i n 9 CO" to! c t wnom t"~ re w.. dny S!dt'!''Tll!"t of indicatin 9 recll9 ni t1on of :he need follow-up.
Percent of pdtie"!5 wito l"'ec090i t10n of the need for To 11 ow- '-'0 who re-ceiV'ed a urine cul tUl"'e ·./ithin 1-4 weeks after tr~at'Tle(lt s~.:lr:ed.
Per-cent of patients tre~ted and fo1low~.j-\lo who "",-:I d I"'~O~~t ur1n~
cul tu,.e ,.esult in 9 ;n<.11)1).000 orodnisms.
~A~AONAK
MEDICAL C~~T:R
ALASKA NATI'IE ell 11 I C
RESULT ?~SULI N
98\ ~5care 19~ 19
4~98~ lOOt 15
4H 43 67~ 15
9B~ 43 100~ 15
4274 ~ 60~ 15
fo r llction 84< 31 88~ 9
for
88~ 9
88<8~< 25 B'~:r
'TOTAL H UL
891
99~
SSt
99t
67~
861
92~
84t
N
64
59
58
58
57
40
35
--f-
33
- 26
THE CONTINUITY OF HEALTH CARE
In order for the results of the study to be viewed in the proper
context, some examination of the health system's performance across
tracer conditions is necessary. In this context the study assesses
the performance of the system of health care in terms of continuity of
the clinical elements of primary prevention, screening, diagnostic
evaluation. treatment. and follow-up.
Hypertension, iron deficiency anemia, and urinary tract infections
were added to the list of tracers specifically to examine the continuity
of health care in greater detail. In general. a required health task
is performed only when three basic steps occur. First, there must be
contact between the patient and the provider of health services. The
need for the health service must be recognized. and finally, the component
health care tasks must be perforrred.
Conventional wisdom would suggest that making contact with the
health care system for required services (first step)is the responsi
bility of th~ patient. The recognition function is the shared responsi
bility of the patient (who may state. "I'm here for IT\Y follow-up visit.").
and the provider who reviews the patient's record. Finally, the perfor
mance of the health care task is largely the responsibility of the provider.
The indicators for these tracers were defined in an effort to examine
each step of this process independently. Through these indicators, we
can examine the contribution to health care of both the patient and the
provider and make an assessment of the continuity of the health care
process.
- 27
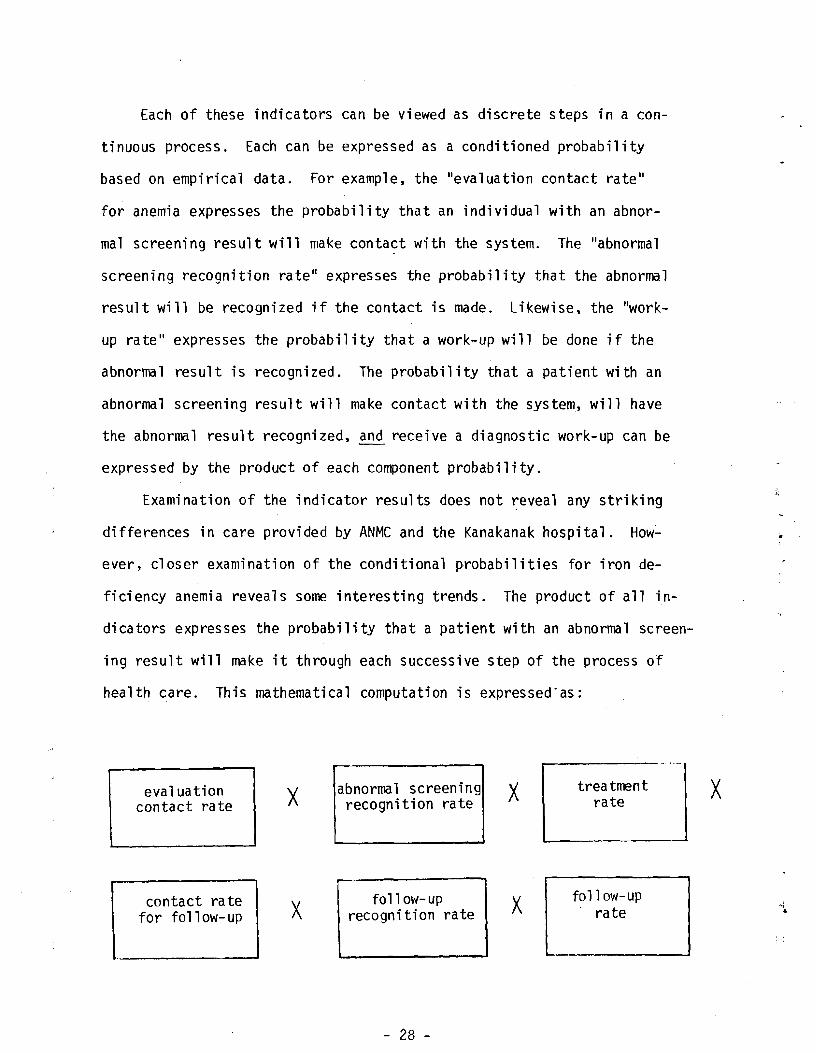
Each of these indicators can be viewed as discrete steps in a con-
ti nuous process. Each can be expressed as a conditioned probabil ity
based on empirical data. For example, the "evaluation contact rate ll
for anemia expresses the probability that an individual with an abnor
mal screening result will make conta~t with the system. The lIabnormal
screeni ng recogni tion rate" expresses the probabi 1ity that the abnormal
result will be recognized if the contact is made. Likewise, the IIwork
up rate" expresses the probability that a work-up will be done if the
abnormal result is recognized. The probability that a patient with an
abnormal screening result will make contact with the system, will have
the abnormal result recognized, and receive a diagnostic work-up can be
expressed by the product of each component probability.
Examination of the indicator results does not reveal any striking
differences in care provided by ANMC and the Kanakanak hospital. How
ever, closer examination of the conditional probabilities for iron de
ficiency anemia reveals some interesting trends. The product of all in
dicators expresses the probability that a patient with an abnormal screen
ing result will make it through each successive step of the process of
health care. This mathematical computation is expressed"as:
x treatmentabnormal screeningevaluation x raterecognition ratecontact rate
follow-upfoll ow-upcontact ra te x ratex recognition ratefor follow-up
- 28
x
and results in:
ANMC: 1.0 x .85 x .88 x .33 x .20 x 1.0 = 0.05
Kanakanak: 1.0 x 1.0 x 1.0 x .73 x .75 x 1.0 = 0.55
Thus the probabi 1i ty that a pati ent wi th an abnonna1 screen; n9 resu1 t
will receive all sUbsequent health services is ten times higher in
Kanakanak than at the ANMC.
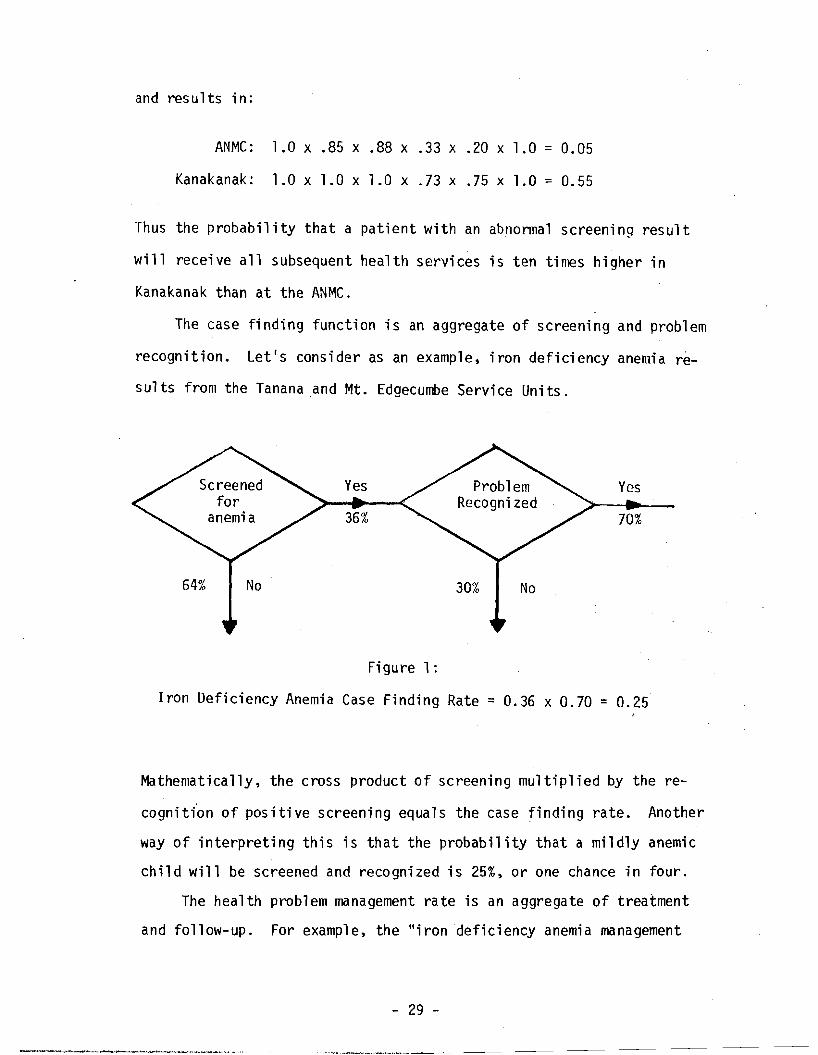
The case finding function is an aggregate of screening and problem
recognition. Let IS cons ide ras an example, i ron deficiency anemia re
sults from the Tanana and Mt. Edgecumbe Service Units.
Yes Yes
36% 70%
Figure 1:
Iron Deficiency Anemia Case Finding Rate = 0.36 x 0.70 = 0.25
Mathematically, the cross product of screening multiplied by the re
cognit{on of positive screening equals the case finding rate. Another
way of interpreting this is that the probability that a mildly anemic
child will be screened and recognized is 25%, or one chance in four.
The health problem management rate is an aggregate of treatment
and follow-up. For exampl e, the "i rondef;ciency anemi a management
- 29
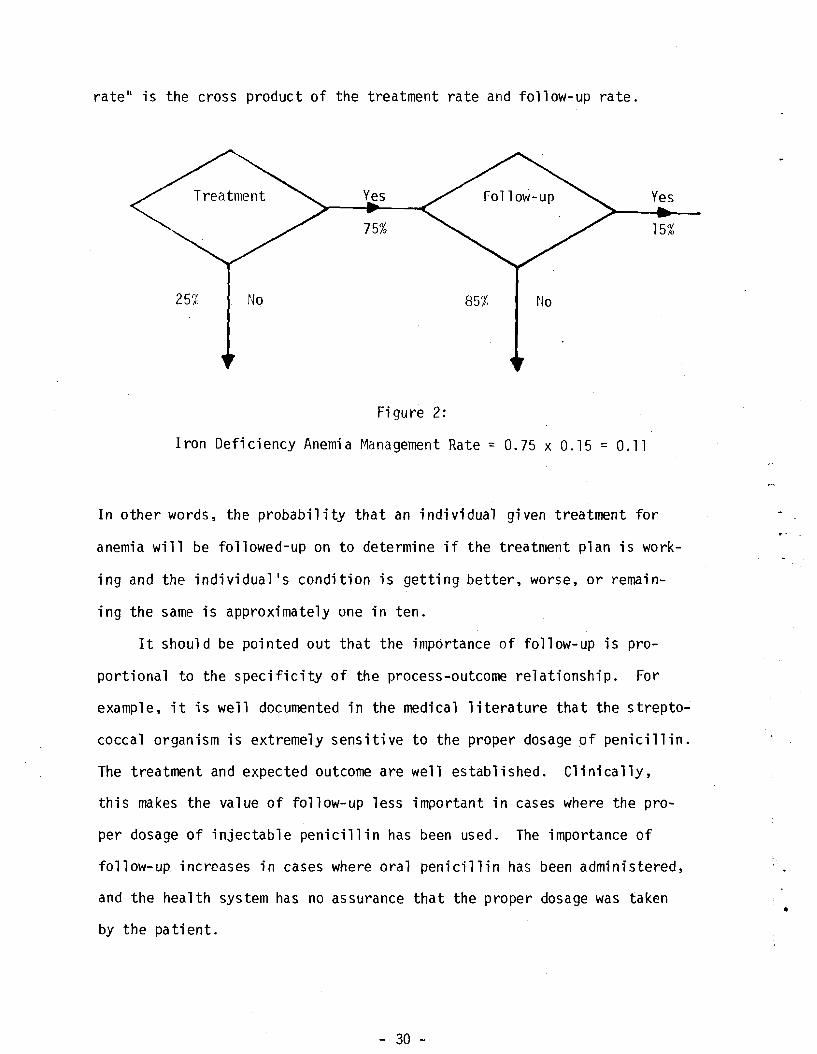
rate" is the cross product of the treatment rate and follow-up rate.
Yes Yes
75% 15%
25% No 85% No
Figure 2:
Iron Deficiency Anemia r~anagement Rate == 0.75 x 0.15 = 0.11
In other words. the probability that an individual given treatment for
anemia will be followed-up on to determine if the treatment plan is work
ing and the individual's condition is getting better. worse. or remain
ing the same is approximately one in ten.
It should be pointed out that the importance of follow-up is pro
portional to the specificity of the process-outcome relationship. For
example. it is well documented in the medical literature that the strepto~
coccal organism is extremely sensitive to the proper dosage pf penicillin.
The treatment and expected outcome are well established. Clinically.
this makes the value of follow-up less important in cases where the pro
per dosage of injectable penicillin has been used. The importance of
follow-up increases in cases where oral penicillin has been administered,
and the health system has no assurance that the proper dosage was taken •
by the pa ti ent.
- 30
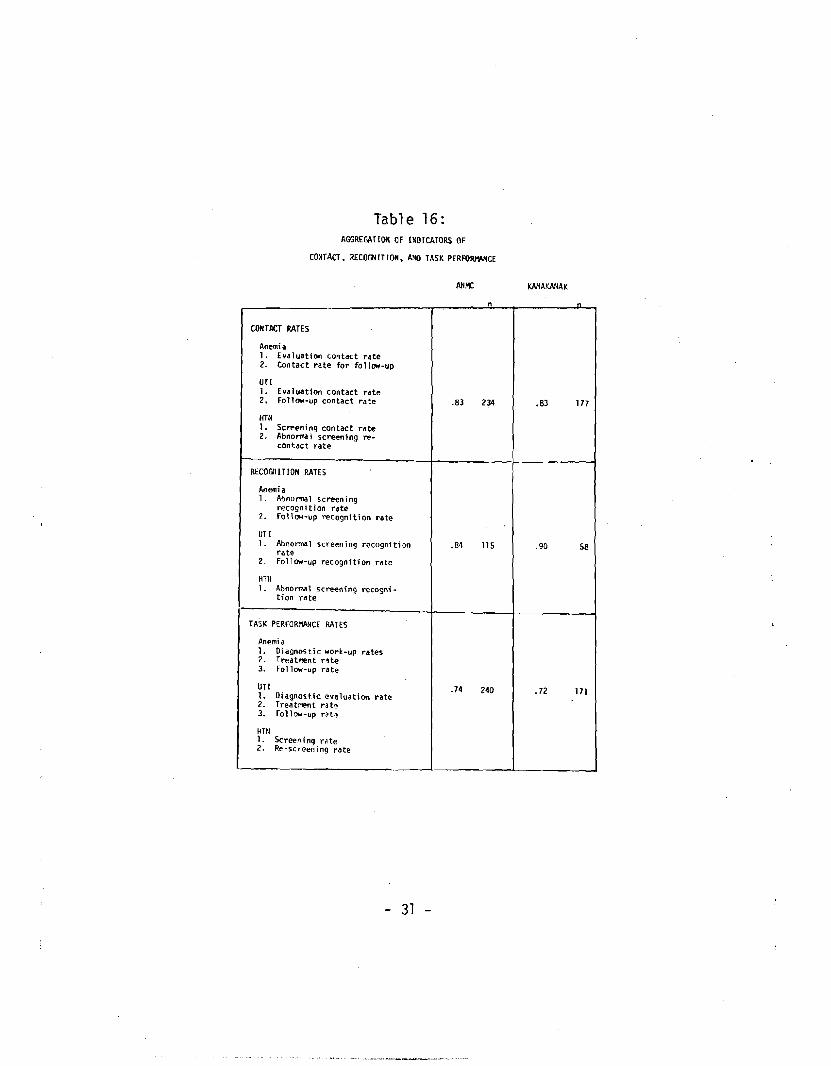
Tab1 e 16: AGGREGAHOIl OF INOICATORS OF
CONTACT, RECOGN IT ION, A~IO TASK PERFORlWtCE
KAIlAKAIlAK
12.
UTI ].
2.
HTN 12.
1
2.
UTI 1
2.
HTtI 1.
1. 2. 3.
UTI 1. 2. 3.
HTtI l. 2.
CONTACT RATES
Anemia EV<11uatioo contact rate Contact rate for follow-up
Evaluation contact rate Follow-up contact rate
Screening contact rate Abnornla 1 screening recontact rate
RECOGrIlTIOH RATES
Anemia Abnonnal screening recogn it ion rate Follow-up recognition rate
Abnol"T!'lal screening recognftion rate Follow-up recognition rate
I\bnorm.al screening recognition rate
TASK PERfORMANCE RATES
Anemi a Diagnostic work-up rates Treatment r~te Follow-up rate
OiagnoHic evaluation rate Treatment rat~ Follow-up rot,
Screen i ng ra te Re-screeni ng rdte
31
n
.83 234
.84 115
.74 240
n
.83 177
.90 58
.72 171

The "drug coverage rate" of 40% for hypertension is by itself a
reflection of the management function. Thus, it indicates that almost
half of those who are diagnosed and begin treatment for elevated blood
pressure are covered by prescriptions and necessary visits to IOOnitor
their condition 280 days per year.
We can explore the contribution of contact, recognition, and task
performance by mathematically aggregating the appropriate indicators
as shown in Table 16. It is interesting to note that the probabilities
of a patient making contact with the health care system is slightly
higher than the probabilities of task performance. This finding sug
gests that discontinuities in health care are not entirely due to
failures in patient compliance with a revisit schedule. Further, it is
interesting to note that the recognition rates at the Kanakanak clinic
are slightly higher than those at ANMC. This may be due in part to the
larger and more complex system of health care at ANMC as an adjunct to
its higher level of sophistication and specialization.
It is obvious from the results of this evaluation that the health
care delivery system has a number of strengths which shouid be applauded.
It is also obvious that certain weaknesses exist and the effectiveness
of the various providers could be improved. If one or more of the ele
ments of the process of care are improved, the resultant improvement in
"cl inical success ll may be dramatic. Consider iron deficiency anemia re
sults from Tanana and Mt. Edgecumbe as an example.
- 32
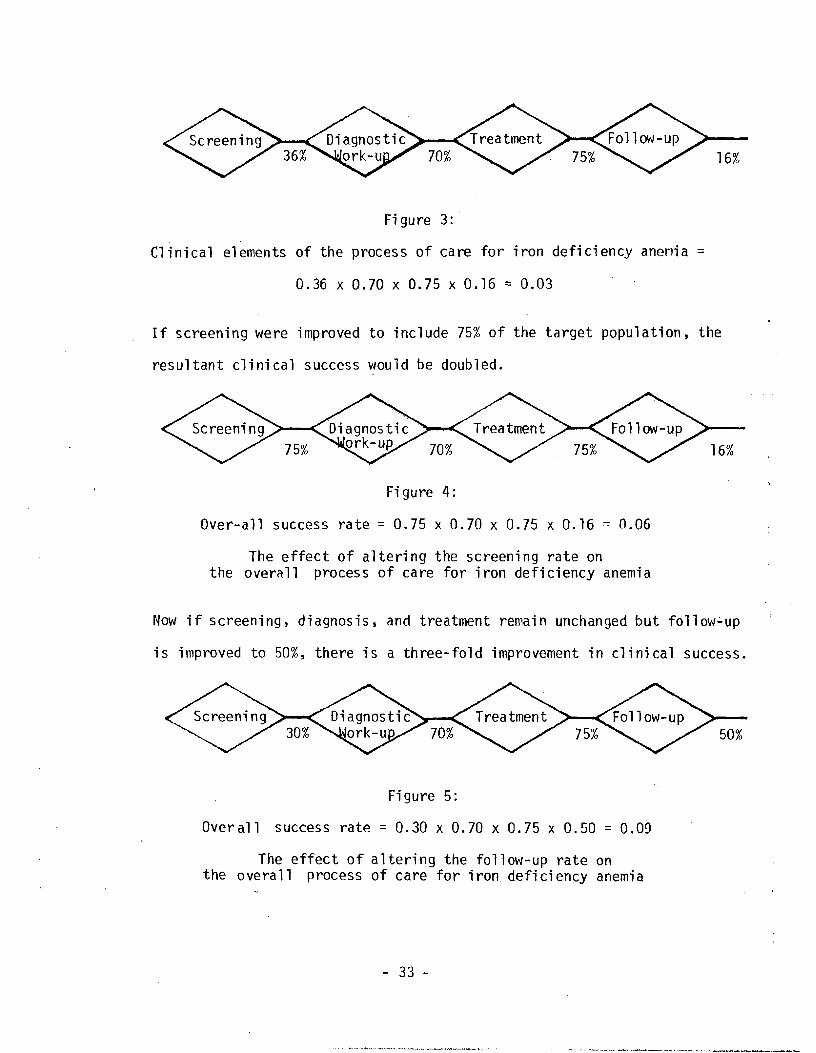
16%
Fi gure 3:
Clinical elements of the process of care for iron deficiency anemia =
0.36 x 0.70 x 0.75 x 0.16 = 0.03
If screening were improved to include 75% of the target population, the
resultant clinical success would be doubled.
16%
Fi gure 4:
Over-all success rate = 0.75 x 0.70 x 0.75 x 0.16 0.06
The effect of altering the screening rate on the overall proces s of ca re for iron defi ci ency anemi a
Now if screening, diagnosis, and treatment remain unchanged but follow~up
is improved to 50%, there is a three-fold improvement in clinical success.
50%
Figure 5:
Overall success rate = 0.30 x 0.70 x 0.75 x 0.50 0.09
The effect of altering the follow-up rate on the overall process of care for iron deficiency anemia
- 33
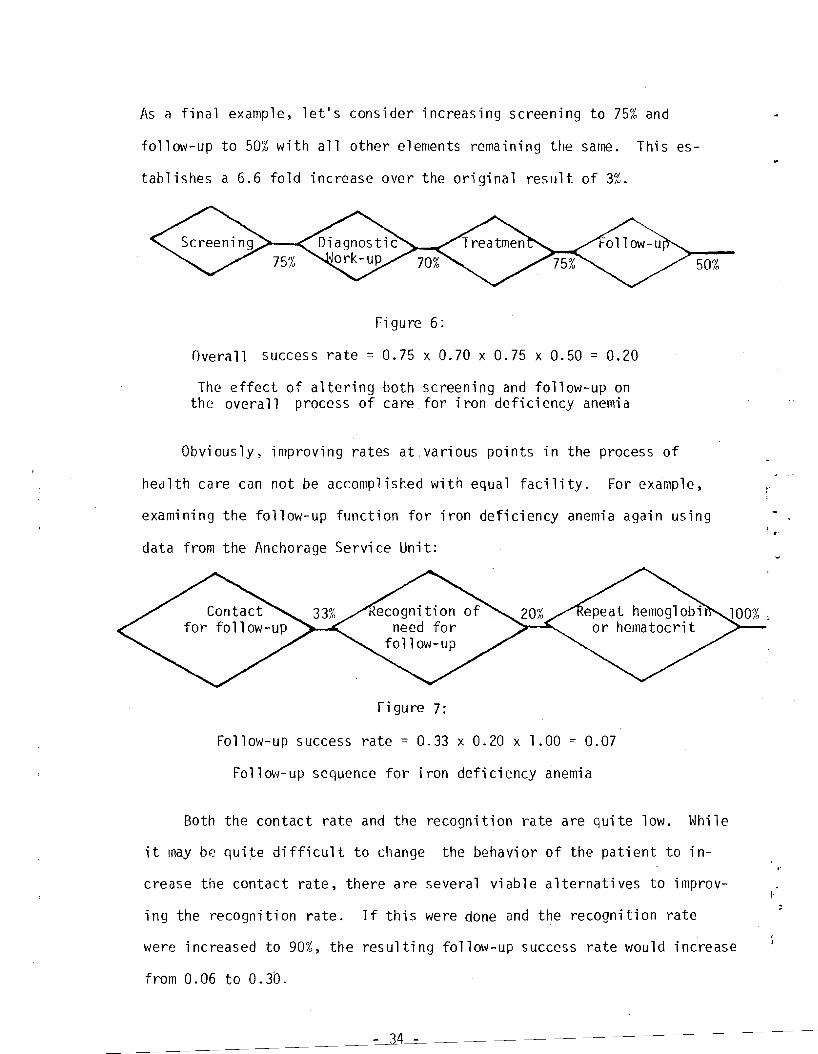
As a final example, let's consider increasing screening to 75% and
follow-up to 50% with all other elements remaining the same. This es
tablishes a 6.6 fold increase over the original result of 3%.
50%
Figure 6:
Overall success rate = 0.75 x 0.70 x 0.75 x 0.50 = 0.20
The effect of altering both screening and follow-up on the overall process of care for iron deficiency anemia
Obviously, improving rates at,various points in the process of
health care can not be accomplished with equal facility. For example,
examining the follow-up function for iron deficiency anemia again using i •
data from the Anchorage Service Unit:
Figure 7:
Follow-up success rate = 0.33 x 0.20 x 1.00 = 0.07
Follow-up sequence for iron deficiency anemia
Both the contact rate and the recognition rate are quite low. While
it may be qui~e difficult to change the behavior of the patient to in
crease the contact rate, there are several viable alternatives to improv
ing the recognition rate. If this were done and the recognition rate
were increased to 90%, the resulting follow-up success rate would increase
from 0.06 to 0.30.
- 34
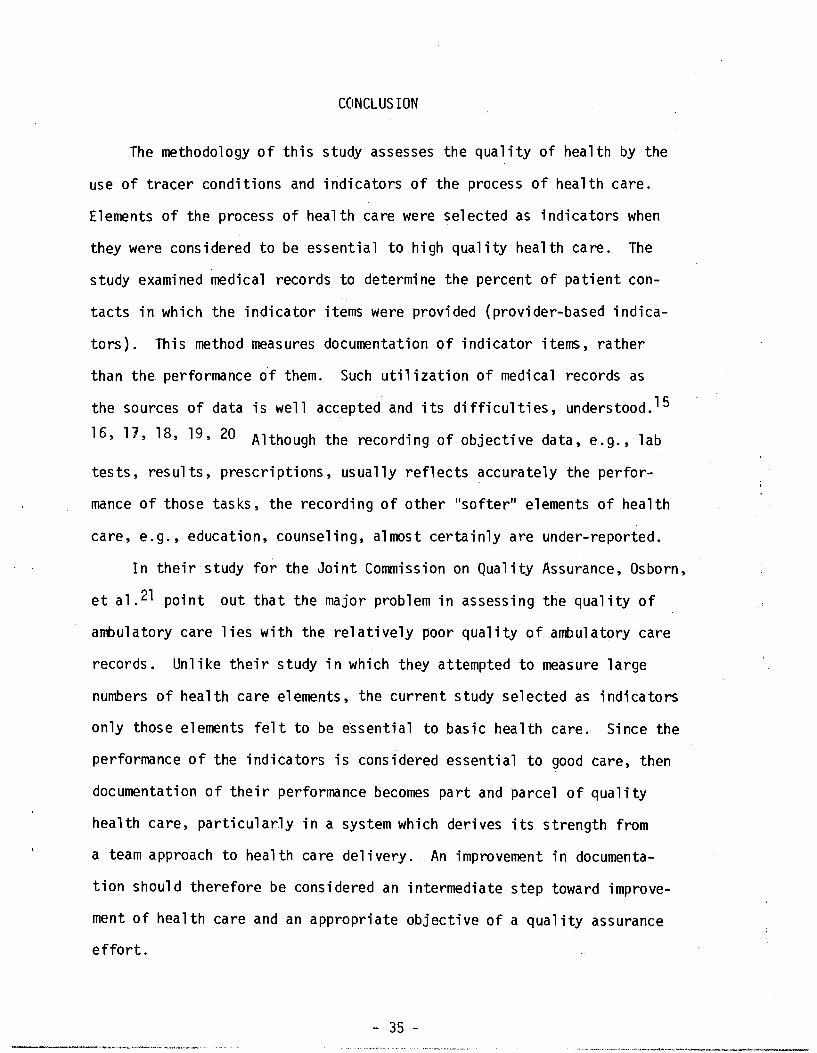
CONCLUSION
The methodology of this study assesses the quality of health by the
use of tracer conditions and indicators of the process of health care.
Elements of the process of health care were selected as indicators when
they were considered to be essential to high quality health care. The
study examined medical records to determine the percent of patient con
tacts in which the indicator items were provided (provider-based indica
tors). This method measures documentation of indicator items, rather
than the performance of them. Such utilization of medical records as
the sources of data is well accepted and its difficulties, understood. 15
16,17,18,19,20 Although the recording of objective data, e.g., lab
tests, resul ts, prescriptions, usually reflects accurately the perfor
rnance of those tasks, the recording of other "softer" elements of health
care, e.g., education, counseling, almost certainly are under-reported.
In their study for the Joint Commission on Quality Assurance, Osborn,
et al. 21 point out that the major problem in assessing the quality of
ambulatory care lies with the relatively poor quality of ambulatory care
records. Unlike their study in which they attempted to measure large
numbers of health care elements, the current study selected as indicators
only those elements felt to be essential to basic health care. Since the
performance of the indicators is considered essential to good care, then
documentation Qf their performance becomes part and parcel of quality
health care, particularly in a system which derives its strength from
a team approach to health care delivery. An improvement in documenta
tion should therefore be considered an intermediate step toward improve
ment of health care and an appropriate objective of a quality assurance
effort.
- 35

Although the study results suggest that the Alaska Native Health
Service provides health care of a quality comparable to that of other
PHS Service Units and the private sector, the primary purpose of the
study was to identify areas of relative weakness, which could be im
proved. This represents the first part of a quality assurance process
that is schematizecl below.
I Program Planning
Modification
Program Operati on
I·
Assessing Health Program Performance
Formul ati ng Adaptive Processes
Identifying Defi ci enci es In Health Programs
Against expl icit criteria for program operation, an assessment of
program performance is made, areas of relative deficiency in program opera- t
tion are identified, and alternatives for strengthening deficiencies (adap
tive processes) are formulated. These are merged with other priorities
- 36

in program planning and phased into program operation. Obviously such a
process requires the input and involvement of health providers, health
systems administrators, health planners, and health researchers.
This report represents our assessment of selected parameters of
health system performance. The degree to which subsequent steps of the
quality assurance process are conducted will determine the ultimate
value of this report and the extent to which it contributes to improved
health care to the Alaska Native. It is toward that goal that the Health
Care Evaluation Project staff submit this report.
- 37
REFERENCES
1. Kessner, David et al.· "Infant Death: An analysis of Maternal Risk and Health Care", NIH National Academy of Science, Washington, D.C., 1973.
2. Margolis, Harold; MYers, Kathleen; Bender, Thomas and Smoke, Gale. liThe Prevalence of Anemia in Eskimo Children: A Pilot Study in Seven Villages of Southwestern Alaska, unpublished report, Alaska Activities, Bureau of Epidemiology, Center for Disease Control.
3. Wright, Nicholas. "Family Planning and Infant Mortality Rate Decline in the United States", American Journal of Epidemiology 101 :182, 1975.
4. Fedrick, Jean and Adelstein, Phi1"ippa. "Inf1uences of Pregnancy Spacing on Outcome of Pregnancy", British Medical Journal 4:753, 1973.
5. Lesinski, John. "Family Size: Its Influence on Family's Health, Economic Status and Social Welfare", Obstetrical and Gynecological Survey, Volume 31, No.5, 1976.
6. Lobi, Michele; Welcher, Doris, and Mellits, David E. "Maternal Age and Intellectual Functioning of Offspring", John Hopkins Medical Journal 128:347, 1971.
7. 62nd Ross Conference on Pediatric Research, "Anemia, Hypochronic, in Infancy and Chi1dhood", Arlington Heights, Ill., 1970.
8. Davies, C.T. "The Physiological Effects of Iron Deficiency Anemia and Malnutrition on Exercise Performance in East African School Children", Acta Paediatrica Belgica, 28 supp1: 253-6, 1974.
9. Popov;a, K. "Study of the Influence of Tissue Iron Deficiency on the Learning Performance of Students", Medicyiski Pregled, (Novi Sad) 26:101-4, 1973.
10. Webb, T.E. et a1. "Iron Deficiency Anemia and Scholastic Achievement in Young Adolescents", Journal Pediatrics 82:827-30, May 1973.
11. McDaniels, D.B., Patton, E.W., Mather, J.A.: Immunization Activities of Private-Practice Physicians: A Record Audit, Pediatrics 56:504-507.
12. Oates, R.K. "Infant Feeding Practices", British Medical Journal 2:762-4, 1973.
- 38

13. Mellander. O. and Uah1quiest. B. "Breast Feeding and Artificial Feeding". Acta Paediatrica 2, Supp1. (1958). 101.
14. Berg. Alan. "The Nutrition Factor: Its Role in National Development". Brooking Institution. Washington, D.C .• 1973.
15. Makover, H.B. The Quality of Medical Care. Methodology of Survey of the Medical Groups Associated with the Health Insurance Plan of New York. Am. J. Pub. Health 41 :824-832. 1951.
16. Rosenfeld. l.S. Quality of Medical Care in Hospitals. Am. J. Pub. Health 47:856-65. 1957.
17. Morehead. M.A .• Donaldson. R.• Serava11i. M.R. Comparison Between OEO Neighborhood Health Centers and Other Health Care Providers. Am. J. Pub. Health 61:1294-1306.1971.·
18. Kelmon. H.R .• Cameroon. E.• Herr, C., Perry, W., Sword, K. Monitoring Patient Care. Medical Care 7:1-13. 1969.
19. Fessel. W.J., von Brunt, E.E. Assessing Quality of Care from the Medical Record. New England Journal of Medicine 286:134-38. 1972 .
20. Morehead, M.A. Evaluating Quality of Medical Care in the Neighborhood Health Center Program of the Office of Environmental Opportunity. Medical Care 8:118-31, 1970. .
21. Osborne. C.E .• Thompson. H., Criteria for Evaluation of Ambulatory Child Health Care by Chart Audit: Development and Testing of a
. Methodology, Pediatrics 56 (4) V Supplement. Part II, 1975.
- 39
~o 0 ~t..4AJ,v vJ r:. 1# Fe . .~, .... ' --- cr-=jo/834
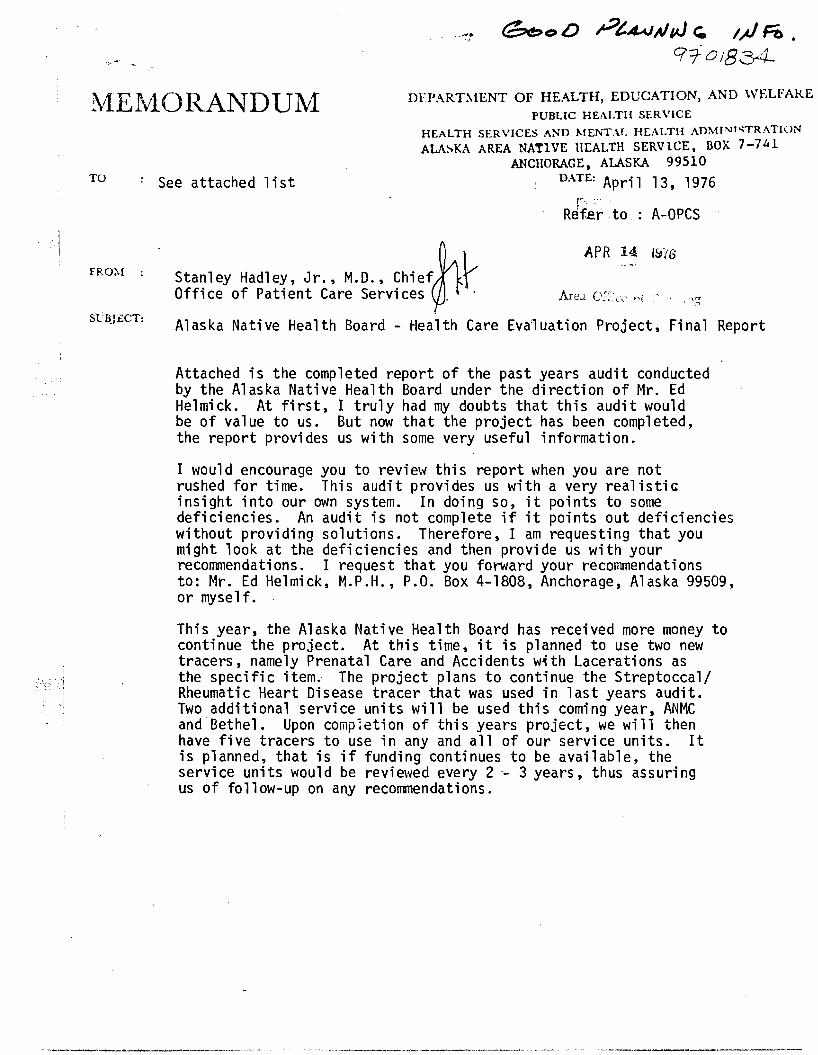
DFPART~IENT OF HEALTH, EDUCATION, AND WELFARE IvlEivl0RANDUM PUBLIC HEr\LTIl SERVICE
HEALTH SERVICES AND MENT,\L HEALTH AD!\HNr"TRATlON
ALA~KA AREA NATIVE HEALTH SERVICE, BOX 7-7"1 ANCHORAGE, ALASKA 99510
TO See attached list DATE: April 13, 1976 r, '
R~f,erto : A-OPCS I
I APR 14 i~n6
FRo:.r Stanley Hadley, Jr., M.D., Chief ~~ Office of Patient Care Services ~. f .
Sl'BJ.t:CT: Alaska Native Health Board - Health Care Evaluation Project, Final Report
Attached is the completed report of the past years audit conducted by the Alaska Native Health Board under the direction of Mr. Ed Helmick. At first, I truly had my doubts that this audit would be of value to us. But now that the project has been completed, the report provides us with some very useful information.
I would encourage you to review this report when you are not rushed for time. This audit prOVides us with a very realistic insight into our own system. In doing so, it points to some deficiencies. An audit is not complete if it points out deficiencies without providing solutions. Therefore, I am requesting that youmight look at the deficiencies and then prOVide us with your recommendations. I request that you forward your recommendations to: Mr. Ed Helmick, M.P.H., P.O. Box 4-1808, Anchorage, Alaska 99509, or mysel f.
This year, the Alaska Native Health Board has received more money to continue the project. At this time, it is planned to use two new tracers, namely Prenatal Care and Accidents w1th Lacerations as the specific item. The project plans to continue the Streptoccal/Rheumatic Heart Disease tracer that was used in last years audit. Two additional service units will be used this coming year, ANMC and Bethel. Upon comp;etion of this years project, we will then have five tracers to use in any and all of our service units. It is planned, that is if funding continues to be available, the service units would be reviewed every 2 '- 3 years, thus assuring us of follow-up on any recommendations.
Distribution:
Area Office: Mr. Gerald Ivey - AD Dr. Charles Neilson - ADD ~lr. Robert Singyke - A--EO Mr. Albert Kahklen - AOCHD Mr. James Sozoff - A-CHAP Mrs. Loretta Throop, PHN - A-CHAP Dr: Joseph Whitaker - Director, CHAP Dr. Walter Johnson, CHAP, Clinical Director Dr. Kenneth Fleshman, A-MCH Mr. Steve Alexander, A-HE Ms. Betty Hill, A-HR Pat Venne - ANC-LIB Dr. Stanley Hadley, A-OPCS Mr. George Mumm - A-OP Dr. Martha Wilson, A-OPRD Ms. Phyllis Wolfe, A-PHN Mr. Lucien Poussard, A-SSA Mr. Ted Viera, A-OSD
ANC Service Unit Dr. Robert Fortuine, ANC-DIR Dr. John Muth, ANC-MDR Ms. Mary Ann Sutton, ANC-MRC Dr. Stephen Bailey, AND-MED Dr. Gloria Park, ANC-OPS Dr. Kenneth Peterson, ANC-PED
Barrow Service Unit: Mr. Richard Zitzow, SUD
"
Dr. Robert Burges, CD ,
Bethel Service Unit Mr. Frank Estes, SUD Mr. Paul Gregory, Human Relations Spec. Dr. George Brenneman, CD Dr. George Barker, MO Dr. Douglas Cowgill, MO Dr. Quintin Fisher, Community Health Director Dr. Milton Lum, MO Roger Ranch, PA Dr. Raymond Shields, MO

Distribution. Cont1d
Kanakanak Service Unit Mr. Lloyd Hermansen. SUD Dr. Don O·Connell. CD Mr. John Meyers, Social Worker
Kotzebue Service Unit Mr. Eugene Kaye, SUD Dr. Donnon Christensen. CD
Mt. Edgecumbe Service Unit Mt. Edgecumbe
Mr. Arthur Willman, SUD Dr. Donald Funk, CD Mr. Hugh Moffatt, Hospital Director Dr. Lee Schmidt, Community Health Services Mr. Frank Brusatto, Social Worker Mr. Frank 0 Williams, Community Relations Dr. Robert Carlson. MO Dr. Susan Carlson, MO Dr. Michae 1 Silver, MO
Juneau Dr. John Brotten. CD Mr. William Diebels, Social Worker
Ketchikan Mr. John Thomas, Director Dr. David Wisner. CD Dr. Patricia Otto, MO Dr. John Stratton, MO Dr. Thomas Conley, MO
Tanana Service Unit Fai rbanks
Mr. Joel Bostrom. SUD Dr. William James, CD
Tanana Jeanie Elia, Administrative Secretary Dr. James Britton, CD Dr. Tim Morrison. MO Dr. Michael Geitz, MO


![Lack of Miscoding Properties of 7-(2 …cancerres.aacrjournals.org/content/canres/45/6/2440.full.pdf[CANCER RESEARCH 45, 2440-2444, June 1985] Lack of Miscoding Properties of 7-(2-Oxoethyl)guanine,](https://static.fdocuments.net/doc/165x107/5b3375957f8b9a81728d46a5/lack-of-miscoding-properties-of-7-2-cancer-research-45-2440-2444-june-1985-lack.jpg)