Adhesion of Volcanic Ash Particles under Controlled ... 10.1002/adem.201500371 Adhesion of Volcanic...
11
DOI: 10.1002/adem.201500371 Adhesion of Volcanic Ash Particles under Controlled Conditions and Implications for Their Deposition in Gas Turbines** By Catalina Taltavull, James Dean and Trevor William Clyne* A particular (representative) type of ash has been used in this study, having a particle size range of 10–70 mm. Experimental particle adhesion rate data are considered in conjunction with CFD modeling of particle velocities and temperatures. This ash becomes soft above 700 C and it has been confirmed that a sharp increase is observed in the likelihood of adhesion as particle temperatures move into this range. Particle size is important and those in the approximate range 10–30 mm are most likely to adhere. This corresponds fairly closely with the size range that is most likely to enter a combustion chamber and turbine. 1. Introduction It is increasingly clear that gas turbines, particularly aero- engines, are susceptible to damage caused by ingested particulate, such as sand, fly ash, and volcanic ash, often referred to generically as calcia–magnesia–alumina–silica (CMAS). Such particles may melt, or at least soften, in flight, making it more likely that, if they strike solid surfaces within the turbine, they will adhere to them on impact. Ongoing increases in turbine entry temperature clearly raise the danger of this happening and there is particular concern about volcanic ash, [1–6] which often has a relatively low softening temperature. [4,7,8] Adhesion of such particulate can lead (at relatively high levels) to disruption of gas flow through the engine, ranging from the blockage of cooling channels [9,10] to complete inhibition of air passage and combustion. At lower levels, short- or medium-term damage can be caused to protective ceramic coatings, with a particular danger of promoting spallation. [11–18] These effects are potentially of major concern, but they all depend on the likelihood of particle adhesion, with the sensitivity to this factor being much greater than that to the particulate burden of the ingested air. This can be seen by recognizing that, even at the particle concentration currently classed as “safe” by the CAA (2 mg m 3 ), the ingestion rate for a large turbofan engine at full power is more than 1 g s 1 . Since, even in a large engine, 1 g of adhered particulate (100 million particles of radius 10 mm) is likely to cause extensive damage, it is very clear that the critical factor here is the proportion of ingested particles that adhere to solid surfaces inside the engine. The particle temperature on impact is clearly a key parameter, although the substrate temperature, roughness, and motion can also be important. Lower deposition rates are observed on cooler [19] and smoother [20] surfaces. It has also been noted [4,21] that deposition rates are much higher on static surfaces, such as platforms and guide vanes, than on rotating components, such as blades. It is also evident that, in addition to thermal effects, momentum-related factors influence the likelihood of particle impact on solid surfaces (stationary or moving). As with its thermal history, the size of the particle plays a key role. The factors dictating whether a particle carried in a fluid will strike an obstacle located in the stream, or pass around it, are well-established and are encapsulated [4,22–24] in [*] Dr. C. Taltavull, Dr. J. Dean, Prof. T. W. Clyne Department of Materials Science and Metallurgy, Cambridge University, 27 Charles Babbage Road, Cambridge CB3 0FS, UK E-mail: [email protected] [**] This work forms part of a research programme funded by EPSRC (EP/K027530/1). In conjunction with this project, a consortium of partners has been set up under the PROVIDA (“PROtection against Volcanic ash Induced Damage in Aero- engines”) banner and information about its operation is available at http://www.ccg.msm.cam.ac.uk/initiatives/provida. The invaluable assistance of Kevin Roberts (Materials Depart- ment in Cambridge) with operation of the plasma spray facility is gratefully acknowledged. The authors are also grateful to Dr. Margaret Hartley, of the University of Manchester, for kindly collecting the Laki ash (and several other types) during field trips to Iceland, which were funded by EasyJet. In compliance with current EPSRC requirements, input data for the modeling described in this paper, including meshing and boundary condition specifications, are available at the following URL: www.ccg.msm.cam.ac.uk/publications/resources. These files can be downloaded and used in COMSOL Multiphysics packages. Data supplied are for a representative case. DOI: 10.1002/adem.201500371 © 2015 WILEY-VCH Verlag GmbH & Co. KGaA, Weinheim wileyonlinelibrary.com 1 ADVANCED ENGINEERING MATERIALS 2015, FULL PAPER
Transcript of Adhesion of Volcanic Ash Particles under Controlled ... 10.1002/adem.201500371 Adhesion of Volcanic...
FU
DOI: 10.1002/adem.201500371LLPAPER
Adhesion of Volcanic Ash Particles under ControlledConditions and Implications for Their Depositionin Gas Turbines**
By Catalina Taltavull, James Dean and Trevor William Clyne*
A particular (representative) type of ash has been used in this study, having a particle size range of�10–70mm. Experimental particle adhesion rate data are considered in conjunction with CFDmodeling of particle velocities and temperatures. This ash becomes soft above �700 �C and it has beenconfirmed that a sharp increase is observed in the likelihood of adhesion as particle temperatures moveinto this range. Particle size is important and those in the approximate range 10–30mm are most likelyto adhere. This corresponds fairly closely with the size range that is most likely to enter a combustionchamber and turbine.
1. Introduction about volcanic ash,[1–6] which often has a relatively low
It is increasingly clear that gas turbines, particularly aero-engines, are susceptible to damage caused by ingestedparticulate, such as sand, fly ash, and volcanic ash, oftenreferred to generically as calcia–magnesia–alumina–silica(CMAS). Such particles may melt, or at least soften, in flight,making it more likely that, if they strike solid surfaces withinthe turbine, they will adhere to them on impact. Ongoingincreases in turbine entry temperature clearly raise thedanger of this happening and there is particular concern
[*] Dr. C. Taltavull, Dr. J. Dean, Prof. T. W. ClyneDepartment of Materials Science and Metallurgy, CambridgeUniversity, 27 Charles Babbage Road, Cambridge CB3 0FS, UKE-mail: [email protected]
[**] This work forms part of a research programme funded byEPSRC (EP/K027530/1). In conjunction with this project, aconsortium of partners has been set up under the PROVIDA(“PROtection against Volcanic ash Induced Damage in Aero-engines”) banner and information about its operation isavailable at http://www.ccg.msm.cam.ac.uk/initiatives/provida.The invaluable assistance of Kevin Roberts (Materials Depart-ment in Cambridge) with operation of the plasma spray facilityis gratefully acknowledged. The authors are also grateful toDr. Margaret Hartley, of the University of Manchester, forkindly collecting the Laki ash (and several other types) duringfield trips to Iceland, which were funded by EasyJet. Incompliance with current EPSRC requirements, input data forthe modeling described in this paper, including meshing andboundary condition specifications, are available at the followingURL: www.ccg.msm.cam.ac.uk/publications/resources. Thesefiles can be downloaded and used in COMSOL Multiphysicspackages. Data supplied are for a representative case.
DOI: 10.1002/adem.201500371 © 2015 WILEY-VCH VerlaADVANCED ENGINEERING MATERIALS 2015,
softening temperature.[4,7,8]
Adhesion of such particulate can lead (at relatively highlevels) to disruption of gas flow through the engine, rangingfrom the blockage of cooling channels[9,10] to completeinhibition of air passage and combustion. At lower levels,short- or medium-term damage can be caused to protectiveceramic coatings, with a particular danger of promotingspallation.[11–18] These effects are potentially of major concern,but they all depend on the likelihood of particle adhesion,with the sensitivity to this factor being much greater thanthat to the particulate burden of the ingested air. This can beseen by recognizing that, even at the particle concentrationcurrently classed as “safe” by the CAA (2mgm�3), theingestion rate for a large turbofan engine at full power is morethan 1 g s�1. Since, even in a large engine, 1 g of adheredparticulate (�100 million particles of radius 10mm) is likely tocause extensive damage, it is very clear that the critical factorhere is the proportion of ingested particles that adhere to solidsurfaces inside the engine.
The particle temperature on impact is clearly a keyparameter, although the substrate temperature, roughness,and motion can also be important. Lower deposition rates areobservedoncooler[19] andsmoother[20] surfaces. Ithas alsobeennoted[4,21] that deposition rates are much higher on staticsurfaces, such as platforms and guide vanes, than on rotatingcomponents, suchasblades. It is also evident that, inaddition tothermal effects, momentum-related factors influence thelikelihood of particle impact on solid surfaces (stationary ormoving). As with its thermal history, the size of the particleplays a key role. The factors dictatingwhether a particle carriedin a fluid will strike an obstacle located in the stream, or passaround it, are well-established and are encapsulated[4,22–24] in
g GmbH & Co. KGaA, Weinheim wileyonlinelibrary.com 1
C. Taltavull et al./Adhesion of Volcanic Ash Particles. . .
FULLPAPER
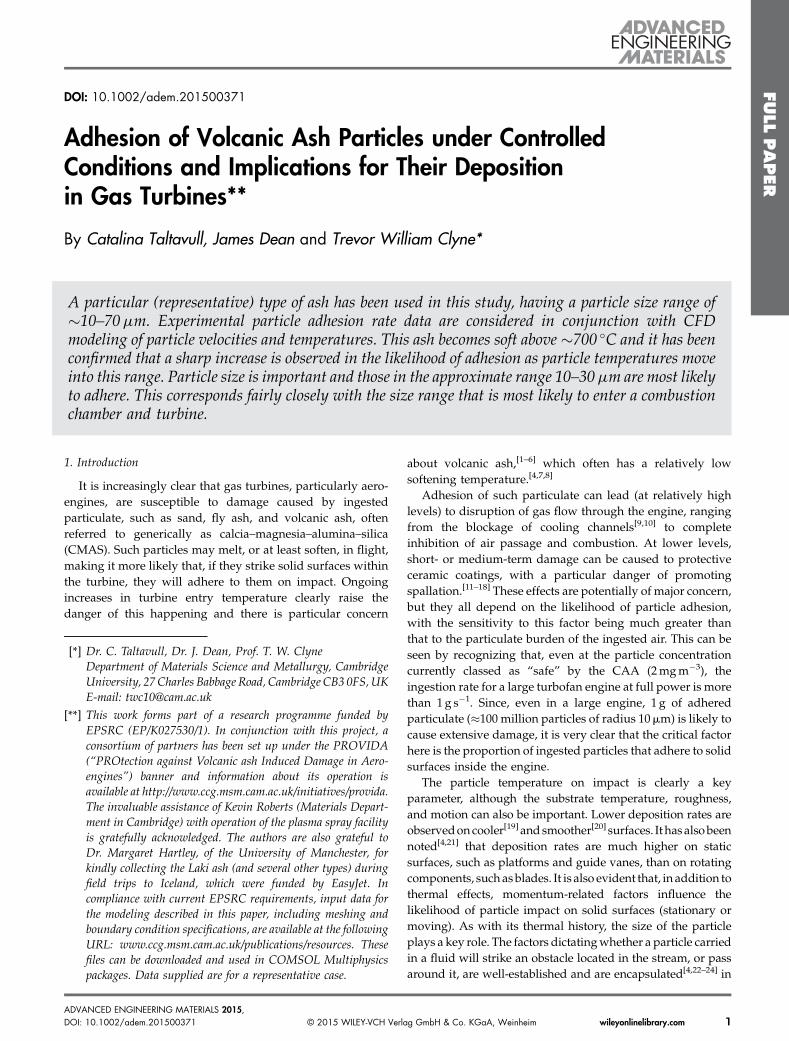
the Stokes number, which is the ratio of the characteristic timefor velocity change to that for passing the obstacle. Themagnitude of the Stokes number is plotted in Figure 1, as afunction of particle diameter, with the other parameters givenvalues broadly appropriate for the passage of ash particlesthrougha turbine.WhenStk>> 1, impact is expected,while forStk << 1 the particle will be carried around the obstacle withthefluid stream. It can be seen in the plot that particles less thanabout 2–3mm in diameter are expected to miss (stationary)obstacles,while those larger thanabout5–7mmwill strike them.For intermediate sizes, the situation is less clear-cut andfactors such as the exact shapes of particle and obstacle may berelevant. Systematic experimental data are required in this area.
In view of both thermal and momentum-related effects,[19]
there is considerable interest in the size distribution ofparticles ingested with the air intake (of an aero-engine). Themaximum size of particles ingested into a jet engine has been
Fig. 1. (a) Schematic showing how the magnitude of the Stokes number controls particleflight paths in a fluid and (b) influence of particle size on the Stokes number, for values ofthe other parameters appropriate to passage of VA through a turbine.
2 http://www.aem-journal.com © 2015 WILEY-VCH Verlag GmbH
reported[25,26] to be about 100mm. It is, however, worth notingthat the size distribution of particles entering the air intakemay differ significantly from that of particles entering theturbine, as a consequence of relatively large particles beingboth centrifuged into the bypass air flow and fragmentedby impact with compressor blades. There appears to be verylittle published information[27] about these effects, for anytype of gas turbine, although Weaver et al.[28] do refer to theirsamples (having average sizes ranging from 5 to 15mm) asbeing “. . . . consistent with distributions measured at the exitof high compressors for large turbofan engines.” In general, itseems likely that particles larger than about 30mm indiameter do not commonly enter the combustion chamberor reach the turbine. Much of the interest therefore centers onthe size range from a few microns to a few tens of microns,since particles below this range rarely strike solid surfaces,while larger ones rarely enter the turbine.
The current study involves injection of a particular type ofash, containing particles in this size range of interest, into aset-up designed to simulate passage through a combustionchamber and subsequent projection toward a solid surface,inclined at pre-selected angles to the overall flow direction.The deposition rate is measured, as a function of the thermaland velocity fields of the gas stream, with a view to obtaininginsights into the key features of a volcanic ash particle thatdictate whether it is likely to adhere to a solid surface onimpact.
2. Experimental Section
2.1. Powder CharacterizationThe volcanic ash (VA) was extracted near the Laki vent in
Southern Iceland. (The Laki explosions, in 1783–1784, areamong the largest in historical times and are estimated to havecreated about a hundred times as much ash as the eruptions ofEyjafjallajökull in 2010.) The as-received ash was ground in arotarymill andthenpassed throughasievewitha spacingof theorder of 40mm. The chemical composition, obtained from EDXdata, is shown in Table 1. It can be seen that the ash contains anumber of elements at significant levels, and is particularly richin Si and Fe. The phase constitution of this VAwas investigatedvia X-ray diffraction. The spectrum, published previously,[4]
shows four crystalline phases, all at relatively low levels, with aprominent broad peak at�20–30� (2u), signifying a substantialproportion (�80%) of amorphous phase.
The glass transition temperature and “melting point” of theVA were obtained with the set-up shown in the insert inFigure 2, using a Netzsch 402C dilatometer. (This has beenfound to be more accurate and reliable than the commonlyused DSC procedure, although that gave similar results in thecurrent case.) A cold isostatic press was used to fabricate a“green” cylindrical pellet of VA, about 5mm in diameter and1.5mm in length. This specimen was placed in an aluminacrucible and an alumina push rod applied a constant load of0.3N to the specimen, which was heated at 5 �Cmin�1.Initially, the powder compact expands on heating, but then a
& Co. KGaA, Weinheim DOI: 10.1002/adem.201500371ADVANCED ENGINEERING MATERIALS 2015,
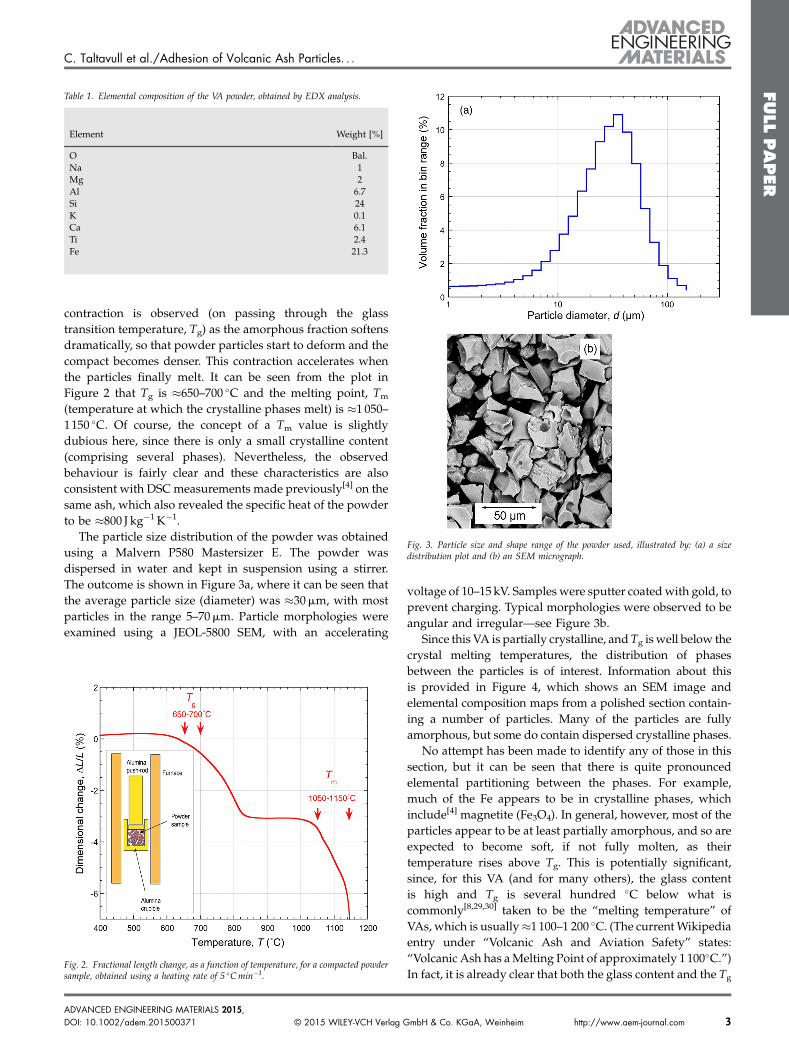
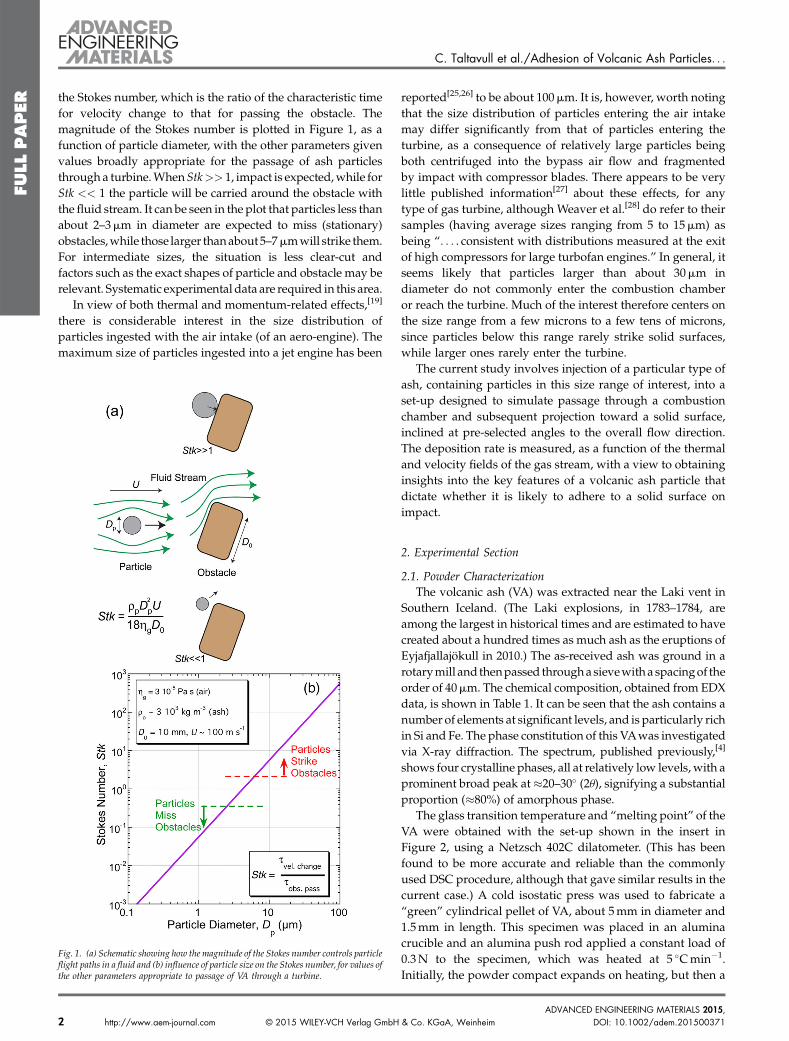
Fig. 3. Particle size and shape range of the powder used, illustrated by: (a) a sizedistribution plot and (b) an SEM micrograph.
Table 1. Elemental composition of the VA powder, obtained by EDX analysis.
Element Weight [%]
O Bal.Na 1Mg 2Al 6.7Si 24K 0.1Ca 6.1Ti 2.4Fe 21.3
C. Taltavull et al./Adhesion of Volcanic Ash Particles. . .
FULLPAPER
contraction is observed (on passing through the glasstransition temperature, Tg) as the amorphous fraction softensdramatically, so that powder particles start to deform and thecompact becomes denser. This contraction accelerates whenthe particles finally melt. It can be seen from the plot inFigure 2 that Tg is �650–700 �C and the melting point, Tm
(temperature at which the crystalline phases melt) is �1 050–1150 �C. Of course, the concept of a Tm value is slightlydubious here, since there is only a small crystalline content(comprising several phases). Nevertheless, the observedbehaviour is fairly clear and these characteristics are alsoconsistent with DSCmeasurements made previously[4] on thesame ash, which also revealed the specific heat of the powderto be �800 J kg�1 K�1.
The particle size distribution of the powder was obtainedusing a Malvern P580 Mastersizer E. The powder wasdispersed in water and kept in suspension using a stirrer.The outcome is shown in Figure 3a, where it can be seen thatthe average particle size (diameter) was �30mm, with mostparticles in the range 5–70mm. Particle morphologies wereexamined using a JEOL-5800 SEM, with an accelerating
Fig. 2. Fractional length change, as a function of temperature, for a compacted powdersample, obtained using a heating rate of 5 �Cmin�1.
DOI: 10.1002/adem.201500371 © 2015 WILEY-VCH Verlag GADVANCED ENGINEERING MATERIALS 2015,
voltage of 10–15 kV. Samples were sputter coatedwith gold, toprevent charging. Typical morphologies were observed to beangular and irregular—see Figure 3b.
Since this VA is partially crystalline, andTg iswell below thecrystal melting temperatures, the distribution of phasesbetween the particles is of interest. Information about thisis provided in Figure 4, which shows an SEM image andelemental composition maps from a polished section contain-ing a number of particles. Many of the particles are fullyamorphous, but some do contain dispersed crystalline phases.
No attempt has been made to identify any of those in thissection, but it can be seen that there is quite pronouncedelemental partitioning between the phases. For example,much of the Fe appears to be in crystalline phases, whichinclude[4] magnetite (Fe3O4). In general, however, most of theparticles appear to be at least partially amorphous, and so areexpected to become soft, if not fully molten, as theirtemperature rises above Tg. This is potentially significant,since, for this VA (and for many others), the glass contentis high and Tg is several hundred �C below what iscommonly[8,29,30] taken to be the “melting temperature” ofVAs, which is usually�1100–1 200 �C. (The currentWikipediaentry under “Volcanic Ash and Aviation Safety” states:“Volcanic Ash has aMelting Point of approximately 1100�C.”)In fact, it is already clear that both the glass content and the Tg
mbH & Co. KGaA, Weinheim http://www.aem-journal.com 3
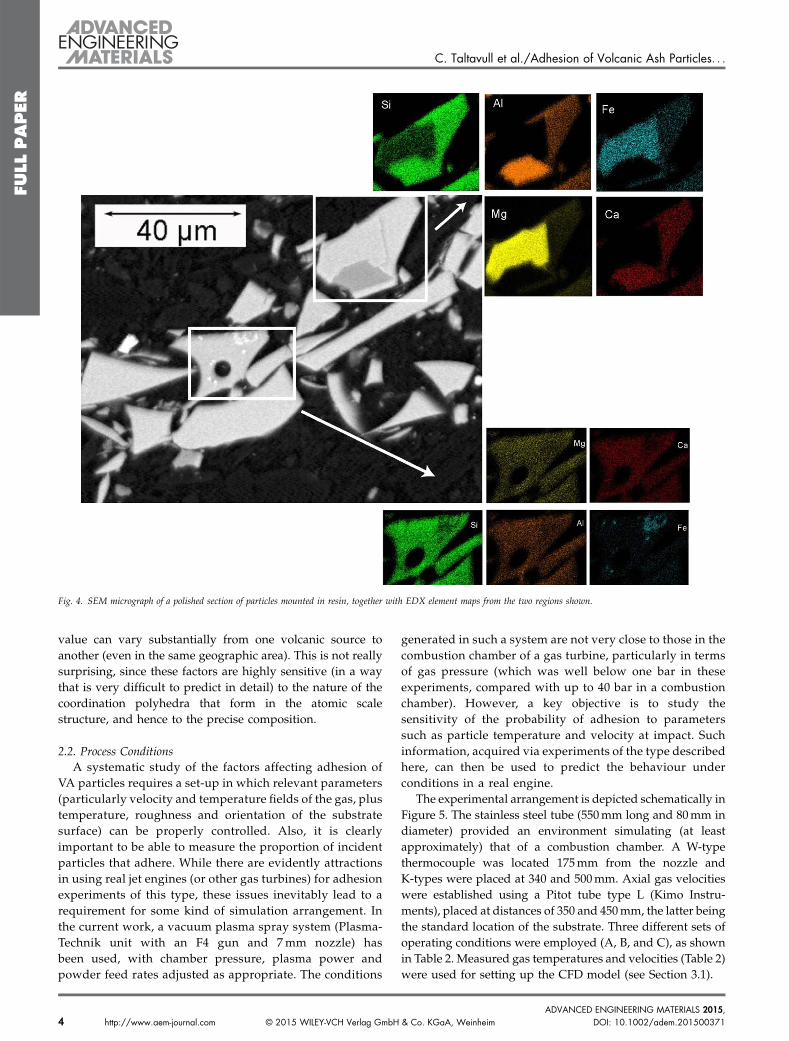
Fig. 4. SEM micrograph of a polished section of particles mounted in resin, together with EDX element maps from the two regions shown.
C. Taltavull et al./Adhesion of Volcanic Ash Particles. . .
FULLPAPER
value can vary substantially from one volcanic source toanother (even in the same geographic area). This is not reallysurprising, since these factors are highly sensitive (in a waythat is very difficult to predict in detail) to the nature of thecoordination polyhedra that form in the atomic scalestructure, and hence to the precise composition.
2.2. Process ConditionsA systematic study of the factors affecting adhesion of
VA particles requires a set-up in which relevant parameters(particularly velocity and temperature fields of the gas, plustemperature, roughness and orientation of the substratesurface) can be properly controlled. Also, it is clearlyimportant to be able to measure the proportion of incidentparticles that adhere. While there are evidently attractionsin using real jet engines (or other gas turbines) for adhesionexperiments of this type, these issues inevitably lead to arequirement for some kind of simulation arrangement. Inthe current work, a vacuum plasma spray system (Plasma-Technik unit with an F4 gun and 7mm nozzle) hasbeen used, with chamber pressure, plasma power andpowder feed rates adjusted as appropriate. The conditions
4 http://www.aem-journal.com © 2015 WILEY-VCH Verlag GmbH
generated in such a system are not very close to those in thecombustion chamber of a gas turbine, particularly in termsof gas pressure (which was well below one bar in theseexperiments, compared with up to 40 bar in a combustionchamber). However, a key objective is to study thesensitivity of the probability of adhesion to parameterssuch as particle temperature and velocity at impact. Suchinformation, acquired via experiments of the type describedhere, can then be used to predict the behaviour underconditions in a real engine.
The experimental arrangement is depicted schematically inFigure 5. The stainless steel tube (550mm long and 80mm indiameter) provided an environment simulating (at leastapproximately) that of a combustion chamber. A W-typethermocouple was located 175mm from the nozzle andK-types were placed at 340 and 500mm. Axial gas velocitieswere established using a Pitot tube type L (Kimo Instru-ments), placed at distances of 350 and 450mm, the latter beingthe standard location of the substrate. Three different sets ofoperating conditions were employed (A, B, and C), as shownin Table 2. Measured gas temperatures and velocities (Table 2)were used for setting up the CFD model (see Section 3.1).
& Co. KGaA, Weinheim DOI: 10.1002/adem.201500371ADVANCED ENGINEERING MATERIALS 2015,
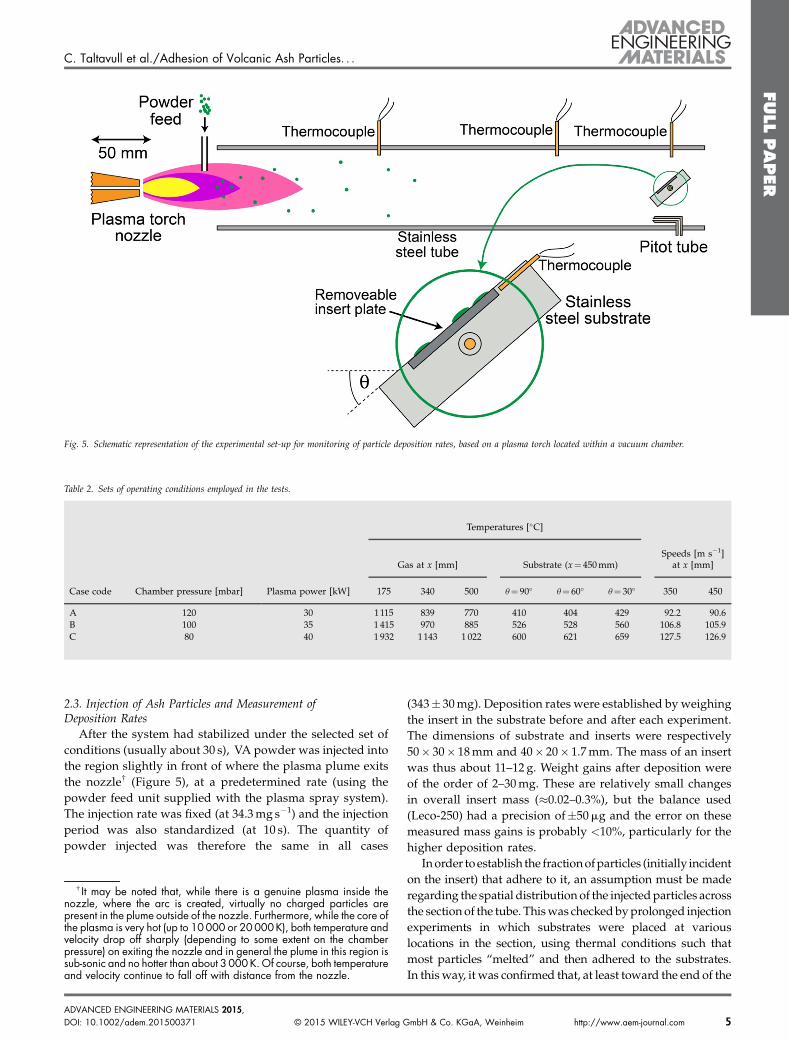
Fig. 5. Schematic representation of the experimental set-up for monitoring of particle deposition rates, based on a plasma torch located within a vacuum chamber.
Table 2. Sets of operating conditions employed in the tests.
Temperatures [�C]
Gas at x [mm] Substrate (x¼ 450mm)Speeds [m s�1]
at x [mm]
Case code Chamber pressure [mbar] Plasma power [kW] 175 340 500 u¼ 90� u¼ 60� u¼ 30� 350 450
A 120 30 1115 839 770 410 404 429 92.2 90.6B 100 35 1 415 970 885 526 528 560 106.8 105.9C 80 40 1 932 1143 1 022 600 621 659 127.5 126.9
C. Taltavull et al./Adhesion of Volcanic Ash Particles. . .
FULLPAPER
2.3. Injection of Ash Particles and Measurement ofDeposition Rates
After the system had stabilized under the selected set ofconditions (usually about 30 s), VA powder was injected intothe region slightly in front of where the plasma plume exitsthe nozzle† (Figure 5), at a predetermined rate (using thepowder feed unit supplied with the plasma spray system).The injection rate was fixed (at 34.3mg s�1) and the injectionperiod was also standardized (at 10 s). The quantity ofpowder injected was therefore the same in all cases
† It may be noted that, while there is a genuine plasma inside thenozzle, where the arc is created, virtually no charged particles arepresent in the plume outside of the nozzle. Furthermore, while the core ofthe plasma is very hot (up to 10000 or 20000K), both temperature andvelocity drop off sharply (depending to some extent on the chamberpressure) on exiting the nozzle and in general the plume in this region issub-sonic and no hotter than about 3000K.Of course, both temperatureand velocity continue to fall off with distance from the nozzle.
DOI: 10.1002/adem.201500371 © 2015 WILEY-VCH Verlag GADVANCED ENGINEERING MATERIALS 2015,
(343� 30mg). Deposition rates were established by weighingthe insert in the substrate before and after each experiment.The dimensions of substrate and inserts were respectively50� 30� 18mm and 40� 20� 1.7mm. The mass of an insertwas thus about 11–12 g. Weight gains after deposition wereof the order of 2–30mg. These are relatively small changesin overall insert mass (�0.02–0.3%), but the balance used(Leco-250) had a precision of�50mg and the error on thesemeasured mass gains is probably <10%, particularly for thehigher deposition rates.
Inorder toestablish the fractionofparticles (initially incidenton the insert) that adhere to it, an assumption must be maderegarding the spatial distributionof the injectedparticles acrossthe sectionof the tube. Thiswas checkedbyprolonged injectionexperiments in which substrates were placed at variouslocations in the section, using thermal conditions such thatmost particles “melted” and then adhered to the substrates.In thisway, it was confirmed that, at least toward the end of the
mbH & Co. KGaA, Weinheim http://www.aem-journal.com 5
C. Taltavull et al./Adhesion of Volcanic Ash Particles. . .
FULLPAPER
tube, the injected particles had become uniformly distributedthroughout the sectional area. Thismeant that a fraction f of theinjectedparticleswere beingprojected toward the insert as theyapproached the substrate, given by
f ¼ LbsinupR2 ð1Þ
where L and b are the in-plane dimensions of the insert andR is the inner radius of the tube. Since L was 40mm, b was20mm, and R was 40mm, with u values of 90�, 60�, and 30�,corresponding f values were 15.9, 13.8, and 7.96%. For all ofthe cases presented here, the inserts were uncoated(stainless steel), ground to 1 200 grit finish. The weightdata obtained, for the three different sets of thermalconditions (A, B, and C), and for three different values ofthe substrate inclination angle, u, are presented in Table 3.The values in the column headed “projected at insert” arethe products of the injected mass of particulate (343mg inall cases) and the values of f for the substrate orientationangles concerned.
3. CFD Modeling of Particle Acceleration, Heating,and Impact
3.1. Model Formulation and Boundary ConditionsCFD simulations were carried out using the COMSOL
Multiphysics package. Experimentally measured thermalfields (for Cases A, B, and C) were imposed on the gas(argon), using analytical functions. Temperature dependencesof gas viscosity, thermal conductivity, and specific heat weretaken into account. Gas density was dependent on both
Table 3. Weight gain data.
Mass [mg]
Substrate inclination Insert
Case code u [�] f [%] Initial Final
A 90 15.9 12 131.5 12 137.390 15.9 12 028.4 12 035.160 13.8 11 307.3 11 311.060 13.8 12 113.4 12 116.530 7.96 12 067.3 12 068.730 7.96 12 111.9 12 112.9
B 90 15.9 12 141.3 12 153.190 15.9 12 069.7 12 080.760 13.8 11 340.7 11 349.060 13.8 12 106.7 12 116.530 7.96 11 384.5 11 388.030 7.96 12 055.4 12 058.5
C 90 15.9 12 049.5 12 072.090 15.9 12 089.6 12 118.560 13.8 11 360.9 11 381.260 13.8 12 083.1 12 096.130 7.96 12 057.5 12 065.330 7.96 12 104.0 12 107.7
6 http://www.aem-journal.com © 2015 WILEY-VCH Verlag GmbH
temperature and pressure. The initial pressure was set to thevalues in Table 2.
The turbulence model employed was the Reynolds-Averaged Navier Stokes (RANS) type, using the k–e turbu-lence model, and wall functions were used to model theregion close to the walls, where there are large gradients inflow parameters. An inlet velocity boundary condition wasspecified at the entrance to the tube. This velocity was alterediteratively until the predicted velocity field agreed closelywith experimental data. A pressure outlet boundary conditionwas specified at the tube exit, consistent with the overallpressure in the chamber (which was being dynamicallymaintained by the pumping system). These chamber pressurevalues, for Cases A, B, and C, are shown in Table 2.
Flow field simulations were coupled with the imposedthermal field, using the COMSOL conjugate heat transfermulti-physics interface. This coupling was one-way, such thatthe flow characteristics were affected by the temperature field,but there was no interaction in the reverse direction. Once asolution had been obtained for the flow field, a particle tracinginterface was added to the model. Single (spherical) particles(of varying size) were injected at the inlet to the tube (along itscenterline), with an initial velocity of 1m s�1 and an initialtemperature of 20 �C.
Central to thedynamicsof particles influids are values of thedrag coefficient. Particle shape (see Figure 3b) was taken intoaccount, since this can strongly influence drag coefficients inhigh Reynolds number flows.[31] (The value of Re in theseexperiments was of the order of 104.) The shape effect wascharacterized in terms of the deviation from that of a perfectsphere by measuring the particle “sphericity,”which is simplyrelated to the ratio of volume and surface area. A fewmg of VA
Gain Projected at insert Fraction deposited W [%]
5.8 54.5 10.66.7 54.5 12.33.7 47.3 7.83.1 47.3 6.61.4 27.3 5.11.0 27.3 3.711.8 54.5 21.611.0 54.5 20.28.3 47.3 17.69.8 47.3 20.73.5 27.3 12.83.1 27.3 11.3
22.5 54.5 41.228.9 54.5 53.020.3 47.3 42.913.0 47.3 27.57.8 27.3 28.53.7 27.3 13.5
& Co. KGaA, Weinheim DOI: 10.1002/adem.201500371ADVANCED ENGINEERING MATERIALS 2015,
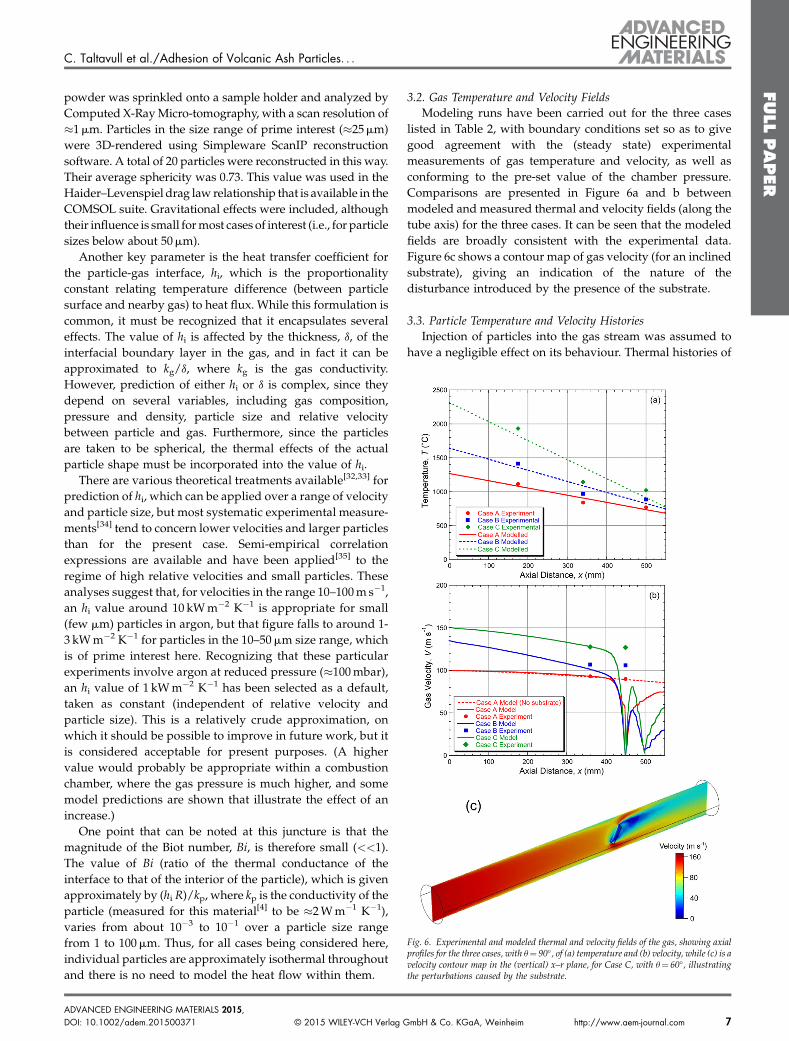
Fig. 6. Experimental and modeled thermal and velocity fields of the gas, showing axialprofiles for the three cases, with u¼ 90�, of (a) temperature and (b) velocity, while (c) is avelocity contour map in the (vertical) x–r plane, for Case C, with u¼ 60�, illustratingthe perturbations caused by the substrate.
C. Taltavull et al./Adhesion of Volcanic Ash Particles. . .
FULLPAPER
powder was sprinkled onto a sample holder and analyzed byComputed X-RayMicro-tomography, with a scan resolution of�1mm. Particles in the size range of prime interest (�25mm)were 3D-rendered using Simpleware ScanIP reconstructionsoftware. A total of 20 particles were reconstructed in this way.Their average sphericity was 0.73. This value was used in theHaider–Levenspiel drag law relationship that is available in theCOMSOL suite. Gravitational effects were included, althoughtheir influence is small formost cases of interest (i.e., for particlesizes below about 50mm).
Another key parameter is the heat transfer coefficient forthe particle-gas interface, hi, which is the proportionalityconstant relating temperature difference (between particlesurface and nearby gas) to heat flux. While this formulation iscommon, it must be recognized that it encapsulates severaleffects. The value of hi is affected by the thickness, d, of theinterfacial boundary layer in the gas, and in fact it can beapproximated to kg/d, where kg is the gas conductivity.However, prediction of either hi or d is complex, since theydepend on several variables, including gas composition,pressure and density, particle size and relative velocitybetween particle and gas. Furthermore, since the particlesare taken to be spherical, the thermal effects of the actualparticle shape must be incorporated into the value of hi.
There are various theoretical treatments available[32,33] forprediction of hi, which can be applied over a range of velocityand particle size, but most systematic experimental measure-ments[34] tend to concern lower velocities and larger particlesthan for the present case. Semi-empirical correlationexpressions are available and have been applied[35] to theregime of high relative velocities and small particles. Theseanalyses suggest that, for velocities in the range 10–100m s�1,an hi value around 10 kWm�2 K�1 is appropriate for small(few mm) particles in argon, but that figure falls to around 1-3 kWm�2 K�1 for particles in the 10–50mm size range, whichis of prime interest here. Recognizing that these particularexperiments involve argon at reduced pressure (�100mbar),an hi value of 1 kWm�2 K�1 has been selected as a default,taken as constant (independent of relative velocity andparticle size). This is a relatively crude approximation, onwhich it should be possible to improve in future work, but itis considered acceptable for present purposes. (A highervalue would probably be appropriate within a combustionchamber, where the gas pressure is much higher, and somemodel predictions are shown that illustrate the effect of anincrease.)
One point that can be noted at this juncture is that themagnitude of the Biot number, Bi, is therefore small (<<1).The value of Bi (ratio of the thermal conductance of theinterface to that of the interior of the particle), which is givenapproximately by (hi R)/kp, where kp is the conductivity of theparticle (measured for this material[4] to be �2Wm�1 K�1),varies from about 10�3 to 10�1 over a particle size rangefrom 1 to 100mm. Thus, for all cases being considered here,individual particles are approximately isothermal throughoutand there is no need to model the heat flow within them.
DOI: 10.1002/adem.201500371 © 2015 WILEY-VCH Verlag GADVANCED ENGINEERING MATERIALS 2015,
3.2. Gas Temperature and Velocity FieldsModeling runs have been carried out for the three cases
listed in Table 2, with boundary conditions set so as to givegood agreement with the (steady state) experimentalmeasurements of gas temperature and velocity, as well asconforming to the pre-set value of the chamber pressure.Comparisons are presented in Figure 6a and b betweenmodeled and measured thermal and velocity fields (along thetube axis) for the three cases. It can be seen that the modeledfields are broadly consistent with the experimental data.Figure 6c shows a contour map of gas velocity (for an inclinedsubstrate), giving an indication of the nature of thedisturbance introduced by the presence of the substrate.
3.3. Particle Temperature and Velocity HistoriesInjection of particles into the gas stream was assumed to
have a negligible effect on its behaviour. Thermal histories of
mbH & Co. KGaA, Weinheim http://www.aem-journal.com 7
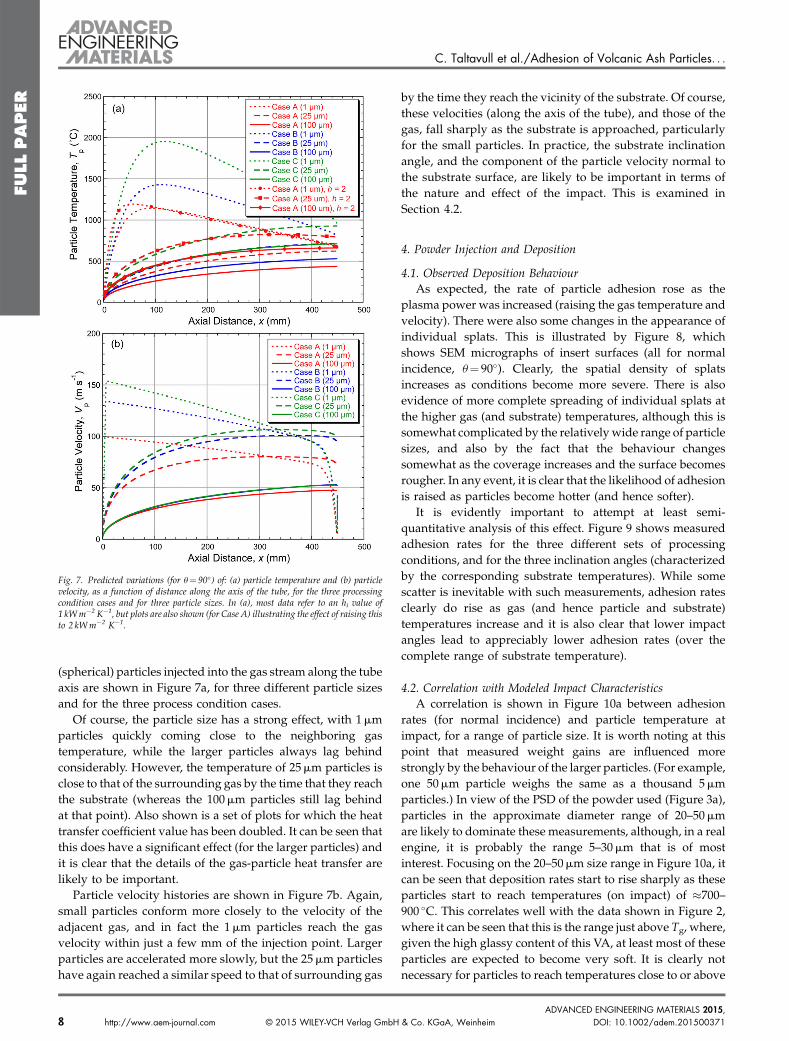
Fig. 7. Predicted variations (for u¼ 90�) of: (a) particle temperature and (b) particlevelocity, as a function of distance along the axis of the tube, for the three processingcondition cases and for three particle sizes. In (a), most data refer to an hi value of1 kWm�2 K�1, but plots are also shown (for Case A) illustrating the effect of raising thisto 2 kWm�2 K�1.
C. Taltavull et al./Adhesion of Volcanic Ash Particles. . .
FULLPAPER
(spherical) particles injected into the gas stream along the tubeaxis are shown in Figure 7a, for three different particle sizesand for the three process condition cases.
Of course, the particle size has a strong effect, with 1mmparticles quickly coming close to the neighboring gastemperature, while the larger particles always lag behindconsiderably. However, the temperature of 25mm particles isclose to that of the surrounding gas by the time that they reachthe substrate (whereas the 100mm particles still lag behindat that point). Also shown is a set of plots for which the heattransfer coefficient value has been doubled. It can be seen thatthis does have a significant effect (for the larger particles) andit is clear that the details of the gas-particle heat transfer arelikely to be important.
Particle velocity histories are shown in Figure 7b. Again,small particles conform more closely to the velocity of theadjacent gas, and in fact the 1mm particles reach the gasvelocity within just a few mm of the injection point. Largerparticles are accelerated more slowly, but the 25mm particleshave again reached a similar speed to that of surrounding gas
8 http://www.aem-journal.com © 2015 WILEY-VCH Verlag GmbH
by the time they reach the vicinity of the substrate. Of course,these velocities (along the axis of the tube), and those of thegas, fall sharply as the substrate is approached, particularlyfor the small particles. In practice, the substrate inclinationangle, and the component of the particle velocity normal tothe substrate surface, are likely to be important in terms ofthe nature and effect of the impact. This is examined inSection 4.2.
4. Powder Injection and Deposition
4.1. Observed Deposition BehaviourAs expected, the rate of particle adhesion rose as the
plasma power was increased (raising the gas temperature andvelocity). There were also some changes in the appearance ofindividual splats. This is illustrated by Figure 8, whichshows SEM micrographs of insert surfaces (all for normalincidence, u¼ 90�). Clearly, the spatial density of splatsincreases as conditions become more severe. There is alsoevidence of more complete spreading of individual splats atthe higher gas (and substrate) temperatures, although this issomewhat complicated by the relativelywide range of particlesizes, and also by the fact that the behaviour changessomewhat as the coverage increases and the surface becomesrougher. In any event, it is clear that the likelihood of adhesionis raised as particles become hotter (and hence softer).
It is evidently important to attempt at least semi-quantitative analysis of this effect. Figure 9 shows measuredadhesion rates for the three different sets of processingconditions, and for the three inclination angles (characterizedby the corresponding substrate temperatures). While somescatter is inevitable with such measurements, adhesion ratesclearly do rise as gas (and hence particle and substrate)temperatures increase and it is also clear that lower impactangles lead to appreciably lower adhesion rates (over thecomplete range of substrate temperature).
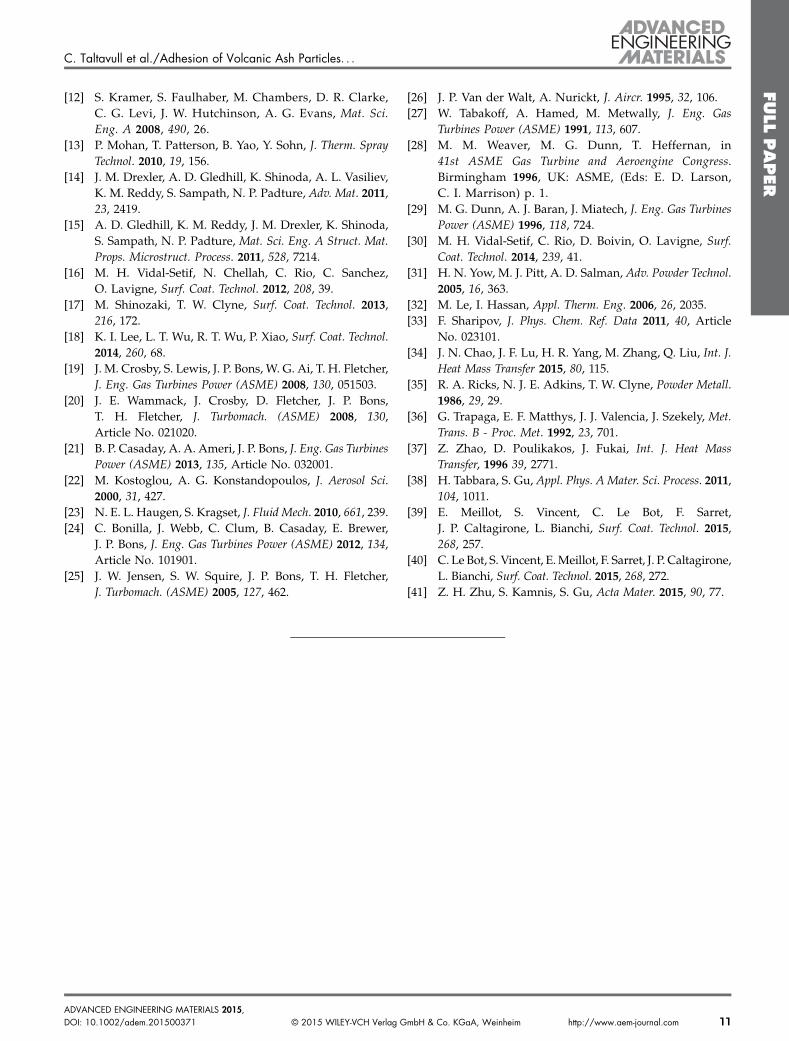
4.2. Correlation with Modeled Impact CharacteristicsA correlation is shown in Figure 10a between adhesion
rates (for normal incidence) and particle temperature atimpact, for a range of particle size. It is worth noting at thispoint that measured weight gains are influenced morestrongly by the behaviour of the larger particles. (For example,one 50mm particle weighs the same as a thousand 5mmparticles.) In view of the PSD of the powder used (Figure 3a),particles in the approximate diameter range of 20–50mmare likely to dominate these measurements, although, in a realengine, it is probably the range 5–30mm that is of mostinterest. Focusing on the 20–50mm size range in Figure 10a, itcan be seen that deposition rates start to rise sharply as theseparticles start to reach temperatures (on impact) of �700–900 �C. This correlates well with the data shown in Figure 2,where it can be seen that this is the range just above Tg, where,given the high glassy content of this VA, at least most of theseparticles are expected to become very soft. It is clearly notnecessary for particles to reach temperatures close to or above
& Co. KGaA, Weinheim DOI: 10.1002/adem.201500371ADVANCED ENGINEERING MATERIALS 2015,
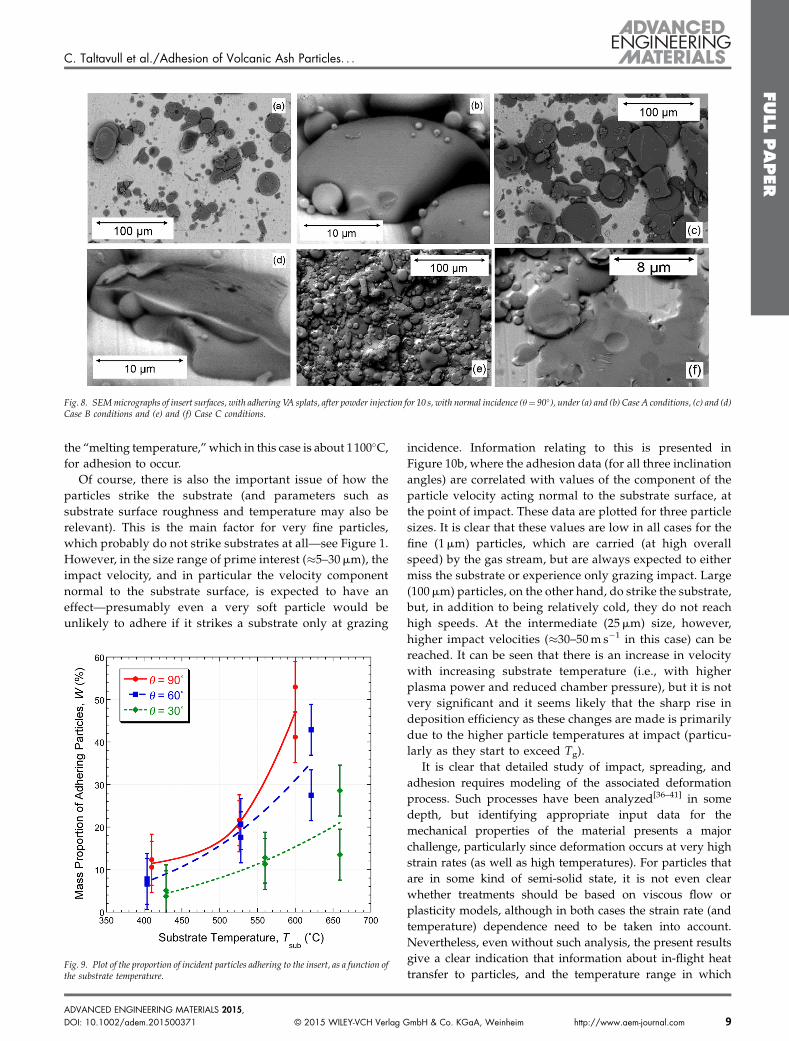
Fig. 8. SEMmicrographs of insert surfaces, with adhering VA splats, after powder injection for 10 s, with normal incidence (u¼ 90�), under (a) and (b) Case A conditions, (c) and (d)Case B conditions and (e) and (f) Case C conditions.
C. Taltavull et al./Adhesion of Volcanic Ash Particles. . .
FULLPAPER
the “melting temperature,”which in this case is about 1100�C,for adhesion to occur.
Of course, there is also the important issue of how theparticles strike the substrate (and parameters such assubstrate surface roughness and temperature may also berelevant). This is the main factor for very fine particles,which probably do not strike substrates at all—see Figure 1.However, in the size range of prime interest (�5–30mm), theimpact velocity, and in particular the velocity componentnormal to the substrate surface, is expected to have aneffect—presumably even a very soft particle would beunlikely to adhere if it strikes a substrate only at grazing
Fig. 9. Plot of the proportion of incident particles adhering to the insert, as a function ofthe substrate temperature.
DOI: 10.1002/adem.201500371 © 2015 WILEY-VCH Verlag GADVANCED ENGINEERING MATERIALS 2015,
incidence. Information relating to this is presented inFigure 10b, where the adhesion data (for all three inclinationangles) are correlated with values of the component of theparticle velocity acting normal to the substrate surface, atthe point of impact. These data are plotted for three particlesizes. It is clear that these values are low in all cases for thefine (1mm) particles, which are carried (at high overallspeed) by the gas stream, but are always expected to eithermiss the substrate or experience only grazing impact. Large(100mm) particles, on the other hand, do strike the substrate,but, in addition to being relatively cold, they do not reachhigh speeds. At the intermediate (25mm) size, however,higher impact velocities (�30–50m s�1 in this case) can bereached. It can be seen that there is an increase in velocitywith increasing substrate temperature (i.e., with higherplasma power and reduced chamber pressure), but it is notvery significant and it seems likely that the sharp rise indeposition efficiency as these changes are made is primarilydue to the higher particle temperatures at impact (particu-larly as they start to exceed Tg).
It is clear that detailed study of impact, spreading, andadhesion requires modeling of the associated deformationprocess. Such processes have been analyzed[36–41] in somedepth, but identifying appropriate input data for themechanical properties of the material presents a majorchallenge, particularly since deformation occurs at very highstrain rates (as well as high temperatures). For particles thatare in some kind of semi-solid state, it is not even clearwhether treatments should be based on viscous flow orplasticity models, although in both cases the strain rate (andtemperature) dependence need to be taken into account.Nevertheless, even without such analysis, the present resultsgive a clear indication that information about in-flight heattransfer to particles, and the temperature range in which
mbH & Co. KGaA, Weinheim http://www.aem-journal.com 9
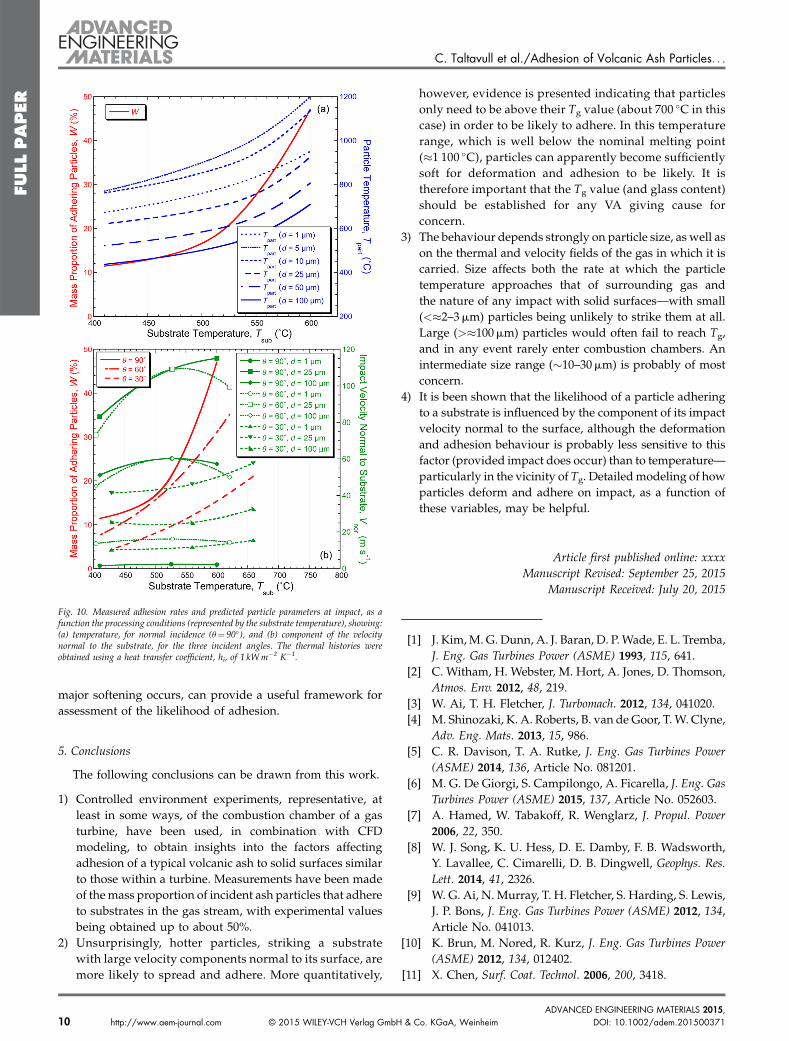
Fig. 10. Measured adhesion rates and predicted particle parameters at impact, as afunction the processing conditions (represented by the substrate temperature), showing:(a) temperature, for normal incidence (u¼ 90�), and (b) component of the velocitynormal to the substrate, for the three incident angles. The thermal histories wereobtained using a heat transfer coefficient, hi, of 1 kWm�2 K�1.
C. Taltavull et al./Adhesion of Volcanic Ash Particles. . .
FULLPAPER
major softening occurs, can provide a useful framework forassessment of the likelihood of adhesion.
5. Conclusions
The following conclusions can be drawn from this work.
1)
10
Controlled environment experiments, representative, atleast in some ways, of the combustion chamber of a gasturbine, have been used, in combination with CFDmodeling, to obtain insights into the factors affectingadhesion of a typical volcanic ash to solid surfaces similarto those within a turbine. Measurements have been madeof themass proportion of incident ash particles that adhereto substrates in the gas stream, with experimental valuesbeing obtained up to about 50%.
2)
Unsurprisingly, hotter particles, striking a substratewith large velocity components normal to its surface, aremore likely to spread and adhere. More quantitatively,http://www.aem-journal.com © 2015 WILEY-VCH Verlag GmbH & C
however, evidence is presented indicating that particlesonly need to be above their Tg value (about 700 �C in thiscase) in order to be likely to adhere. In this temperaturerange, which is well below the nominal melting point(�1 100 �C), particles can apparently become sufficientlysoft for deformation and adhesion to be likely. It istherefore important that the Tg value (and glass content)should be established for any VA giving cause forconcern.
3)
The behaviour depends strongly on particle size, as well ason the thermal and velocity fields of the gas in which it iscarried. Size affects both the rate at which the particletemperature approaches that of surrounding gas andthe nature of any impact with solid surfaces—with small(<�2–3mm) particles being unlikely to strike them at all.Large (>�100mm) particles would often fail to reach Tg,and in any event rarely enter combustion chambers. Anintermediate size range (�10–30mm) is probably of mostconcern.4)
It is been shown that the likelihood of a particle adheringto a substrate is influenced by the component of its impactvelocity normal to the surface, although the deformationand adhesion behaviour is probably less sensitive to thisfactor (provided impact does occur) than to temperature—particularly in the vicinity of Tg. Detailedmodeling of howparticles deform and adhere on impact, as a function ofthese variables, may be helpful.Article first published online: xxxxManuscript Revised: September 25, 2015
Manuscript Received: July 20, 2015
[1] J. Kim,M. G. Dunn, A. J. Baran, D. P.Wade, E. L. Tremba,J. Eng. Gas Turbines Power (ASME) 1993, 115, 641.
[2] C. Witham, H. Webster, M. Hort, A. Jones, D. Thomson,Atmos. Env. 2012, 48, 219.
[3] W. Ai, T. H. Fletcher, J. Turbomach. 2012, 134, 041020.[4] M. Shinozaki, K. A. Roberts, B. van de Goor, T.W. Clyne,
Adv. Eng. Mats. 2013, 15, 986.[5] C. R. Davison, T. A. Rutke, J. Eng. Gas Turbines Power
(ASME) 2014, 136, Article No. 081201.[6] M. G. De Giorgi, S. Campilongo, A. Ficarella, J. Eng. Gas
Turbines Power (ASME) 2015, 137, Article No. 052603.[7] A. Hamed, W. Tabakoff, R. Wenglarz, J. Propul. Power
2006, 22, 350.[8] W. J. Song, K. U. Hess, D. E. Damby, F. B. Wadsworth,
Y. Lavallee, C. Cimarelli, D. B. Dingwell, Geophys. Res.Lett. 2014, 41, 2326.
[9] W. G. Ai, N. Murray, T. H. Fletcher, S. Harding, S. Lewis,J. P. Bons, J. Eng. Gas Turbines Power (ASME) 2012, 134,Article No. 041013.
[10] K. Brun, M. Nored, R. Kurz, J. Eng. Gas Turbines Power(ASME) 2012, 134, 012402.
[11] X. Chen, Surf. Coat. Technol. 2006, 200, 3418.
o. KGaA, Weinheim DOI: 10.1002/adem.201500371ADVANCED ENGINEERING MATERIALS 2015,
C. Taltavull et al./Adhesion of Volcanic Ash Particles. . .
FULLPAPER
[12] S. Kramer, S. Faulhaber, M. Chambers, D. R. Clarke,C. G. Levi, J. W. Hutchinson, A. G. Evans, Mat. Sci.Eng. A 2008, 490, 26.
[13] P. Mohan, T. Patterson, B. Yao, Y. Sohn, J. Therm. SprayTechnol. 2010, 19, 156.
[14] J. M. Drexler, A. D. Gledhill, K. Shinoda, A. L. Vasiliev,K. M. Reddy, S. Sampath, N. P. Padture, Adv. Mat. 2011,23, 2419.
[15] A. D. Gledhill, K. M. Reddy, J. M. Drexler, K. Shinoda,S. Sampath, N. P. Padture, Mat. Sci. Eng. A Struct. Mat.Props. Microstruct. Process. 2011, 528, 7214.
[16] M. H. Vidal-Setif, N. Chellah, C. Rio, C. Sanchez,O. Lavigne, Surf. Coat. Technol. 2012, 208, 39.
[17] M. Shinozaki, T. W. Clyne, Surf. Coat. Technol. 2013,216, 172.
[18] K. I. Lee, L. T. Wu, R. T. Wu, P. Xiao, Surf. Coat. Technol.2014, 260, 68.
[19] J. M. Crosby, S. Lewis, J. P. Bons, W. G. Ai, T. H. Fletcher,J. Eng. Gas Turbines Power (ASME) 2008, 130, 051503.
[20] J. E. Wammack, J. Crosby, D. Fletcher, J. P. Bons,T. H. Fletcher, J. Turbomach. (ASME) 2008, 130,Article No. 021020.
[21] B. P. Casaday, A. A. Ameri, J. P. Bons, J. Eng. Gas TurbinesPower (ASME) 2013, 135, Article No. 032001.
[22] M. Kostoglou, A. G. Konstandopoulos, J. Aerosol Sci.2000, 31, 427.
[23] N. E. L. Haugen, S. Kragset, J. Fluid Mech. 2010, 661, 239.[24] C. Bonilla, J. Webb, C. Clum, B. Casaday, E. Brewer,
J. P. Bons, J. Eng. Gas Turbines Power (ASME) 2012, 134,Article No. 101901.
[25] J. W. Jensen, S. W. Squire, J. P. Bons, T. H. Fletcher,J. Turbomach. (ASME) 2005, 127, 462.
DOI: 10.1002/adem.201500371 © 2015 WILEY-VCH Verlag GADVANCED ENGINEERING MATERIALS 2015,
[26] J. P. Van der Walt, A. Nurickt, J. Aircr. 1995, 32, 106.[27] W. Tabakoff, A. Hamed, M. Metwally, J. Eng. Gas
Turbines Power (ASME) 1991, 113, 607.[28] M. M. Weaver, M. G. Dunn, T. Heffernan, in
41st ASME Gas Turbine and Aeroengine Congress.Birmingham 1996, UK: ASME, (Eds: E. D. Larson,C. I. Marrison) p. 1.
[29] M. G. Dunn, A. J. Baran, J. Miatech, J. Eng. Gas TurbinesPower (ASME) 1996, 118, 724.
[30] M. H. Vidal-Setif, C. Rio, D. Boivin, O. Lavigne, Surf.Coat. Technol. 2014, 239, 41.
[31] H. N. Yow, M. J. Pitt, A. D. Salman, Adv. Powder Technol.2005, 16, 363.
[32] M. Le, I. Hassan, Appl. Therm. Eng. 2006, 26, 2035.[33] F. Sharipov, J. Phys. Chem. Ref. Data 2011, 40, Article
No. 023101.[34] J. N. Chao, J. F. Lu, H. R. Yang, M. Zhang, Q. Liu, Int. J.
Heat Mass Transfer 2015, 80, 115.[35] R. A. Ricks, N. J. E. Adkins, T. W. Clyne, Powder Metall.
1986, 29, 29.[36] G. Trapaga, E. F. Matthys, J. J. Valencia, J. Szekely, Met.
Trans. B - Proc. Met. 1992, 23, 701.[37] Z. Zhao, D. Poulikakos, J. Fukai, Int. J. Heat Mass
Transfer, 1996 39, 2771.[38] H. Tabbara, S. Gu, Appl. Phys. A Mater. Sci. Process. 2011,
104, 1011.[39] E. Meillot, S. Vincent, C. Le Bot, F. Sarret,
J. P. Caltagirone, L. Bianchi, Surf. Coat. Technol. 2015,268, 257.
[40] C. Le Bot, S. Vincent, E.Meillot, F. Sarret, J. P. Caltagirone,L. Bianchi, Surf. Coat. Technol. 2015, 268, 272.
[41] Z. H. Zhu, S. Kamnis, S. Gu, Acta Mater. 2015, 90, 77.
mbH & Co. KGaA, Weinheim http://www.aem-journal.com 11