Adhesion and Separation of Nanoparticles on Polymer ...
16
Adhesion and Separation of Nanoparticles on Polymer-Grafted Porous Substrates Kolattukudy P. Santo, † Aleksey Vishnyakov, † Yefim Brun, ‡ and Alexander V. Neimark* ,† † Department of Chemical and Biochemical Engineering, Rutgers University, Piscataway, New Jersey 08854, United States ‡ DuPont Central Research & Development, Wilmington, Delaware 19803, United States * S Supporting Information ABSTRACT: This work explores interactions of functionalized nanoparticles (NP) with polymer brushes (PB) in a binary mixture of good and poor solvents. NP−PB systems are used in multiple applications, and we are particularly interested in the problem of chromatographic separation of NPs on polymer-grafted porous columns. This process involves NP flow through the pore channels with walls covered by PBs. NP−PB adhesion is governed by adsorption of polymer chains to NP surface and entropic repulsion caused by the polymer chain confinement between NP and the channel wall. Both factors depend on the solvent composition, variation of which causes contraction or expansion of PB. Using dissipative particle dynamics simulations in conjunction with the ghost tweezers free energy calculation technique, we examine the free energy landscapes of functionalized NPs within PB-grafted channels depending on the solvent composition at different PB grafting densities and polymer−solvent affinities. The free energy landscape determines the probability of NP location at a given distance to the surface, positions of equilibrium adhesion states, and the Henry constant that characterizes adsorption equilibrium and NP partitioning between the stationary phase of PB and mobile phase of flowing solvent. We analyze NP transport through a polymer-grafted channel and calculate the mean velocity and retention time of NP depending on the NP size and solvent composition. We find that, with the increase of the bad (poor) solvent fraction and respective PB contraction, NP separation exhibits a transition from the hydrodynamic size exclusion regime with larger NPs having shorter retention time to the adsorption regime with smaller NPs having shorter retention time. The observed reversal of the sequence of elution is reminiscent of the critical condition in polymer chromatography at which the retention time is molecular weight independent. This finding suggests the possibility of the existence of an analogous special regime in nanoparticle chromatography at which NPs with like surface properties elute together regardless of their size. The latter has important practical implications: NPs can be separated by surface chemistry rather than by their size employing the gradient mode of elution with controlled variation of solvent composition. 1. INTRODUCTION Nanoparticles (NPs) are being used extensively in modern-day technologies in versatile roles, including various applications in diagnostics and therapeutics 1,2 as carriers for drug delivery, in imaging as contrast agents, 3 biosensing, 4,5 electrodes of supercapacitors, 6 light emitting diodes (LEDs), 7, 8 solar cells, 9, 10 and nanoelectronic devices. 11 Many of these applications involve interaction of nanoparticles with polymers or polymer brushes (PBs) grafted to solid substrates. PBs doped by NPs are used in the fabrication of nanocomposites, sensors and biomedical devices, 12 colloidal stabilization, lubrication, 13 and manipulation of nanoobjects on surfaces. 14 Emerging applications of PB-grafted substrates in NP separation and purification 15 attract special attention to NP− PB interactions. Traditionally, techniques for NP separation stem from those employed for characterization and separation of polymers, including size exclusion chromatography (SEC), 16 hydro- dynamic chromatography (HDC), 17 field flow fractionation (FFF), 18,19 and size selective precipitation 20 (SSP). These techniques are designed to separate NPs mainly according to their size and shape. However, many applications require NP separation by surface chemistry (that may be manifested, for example, by the degree of hydrophobicity or surface heterogeneity), especially when NPs are modified by specific functional groups (“ligands”). 21−23 In polymer chromatogra- phy, separation by chemistry, e.g., chemical composition or microstructure of polymer chains, is achieved at the so-called critical point of adsorption (CPA). 38 At CPA, the repulsive entropic effect of polymer chain confinement in the pores of solids substrate is compensated by the attractive enthalpic (adsorption) interaction. 24 The balance of entropic and enthalpic factors results in molecular weight-independent elution of polymers. The corresponding separation regime, Received: August 17, 2017 Revised: September 14, 2017 Published: September 15, 2017 Article pubs.acs.org/Langmuir © 2017 American Chemical Society 1481 DOI: 10.1021/acs.langmuir.7b02914 Langmuir 2018, 34, 1481−1496
Transcript of Adhesion and Separation of Nanoparticles on Polymer ...

Adhesion and Separation of Nanoparticles on Polymer-GraftedPorous SubstratesKolattukudy P. Santo,† Aleksey Vishnyakov,† Yefim Brun,‡ and Alexander V. Neimark*,†
†Department of Chemical and Biochemical Engineering, Rutgers University, Piscataway, New Jersey 08854, United States‡DuPont Central Research & Development, Wilmington, Delaware 19803, United States
*S Supporting Information
ABSTRACT: This work explores interactions of functionalizednanoparticles (NP) with polymer brushes (PB) in a binary mixtureof good and poor solvents. NP−PB systems are used in multipleapplications, and we are particularly interested in the problem ofchromatographic separation of NPs on polymer-grafted porouscolumns. This process involves NP flow through the pore channelswith walls covered by PBs. NP−PB adhesion is governed byadsorption of polymer chains to NP surface and entropic repulsioncaused by the polymer chain confinement between NP and thechannel wall. Both factors depend on the solvent composition,variation of which causes contraction or expansion of PB. Usingdissipative particle dynamics simulations in conjunction with theghost tweezers free energy calculation technique, we examine the free energy landscapes of functionalized NPs within PB-graftedchannels depending on the solvent composition at different PB grafting densities and polymer−solvent affinities. The free energylandscape determines the probability of NP location at a given distance to the surface, positions of equilibrium adhesion states,and the Henry constant that characterizes adsorption equilibrium and NP partitioning between the stationary phase of PB andmobile phase of flowing solvent. We analyze NP transport through a polymer-grafted channel and calculate the mean velocity andretention time of NP depending on the NP size and solvent composition. We find that, with the increase of the bad (poor)solvent fraction and respective PB contraction, NP separation exhibits a transition from the hydrodynamic size exclusion regimewith larger NPs having shorter retention time to the adsorption regime with smaller NPs having shorter retention time. Theobserved reversal of the sequence of elution is reminiscent of the critical condition in polymer chromatography at which theretention time is molecular weight independent. This finding suggests the possibility of the existence of an analogous specialregime in nanoparticle chromatography at which NPs with like surface properties elute together regardless of their size. The latterhas important practical implications: NPs can be separated by surface chemistry rather than by their size employing the gradientmode of elution with controlled variation of solvent composition.
1. INTRODUCTION
Nanoparticles (NPs) are being used extensively in modern-daytechnologies in versatile roles, including various applications indiagnostics and therapeutics1,2 as carriers for drug delivery, inimaging as contrast agents,3 biosensing,4,5 electrodes ofsupercapacitors,6 light emitting diodes (LEDs),7,8 solarcells,9,10 and nanoelectronic devices.11 Many of theseapplications involve interaction of nanoparticles with polymersor polymer brushes (PBs) grafted to solid substrates. PBsdoped by NPs are used in the fabrication of nanocomposites,sensors and biomedical devices,12 colloidal stabilization,lubrication,13 and manipulation of nanoobjects on surfaces.14
Emerging applications of PB-grafted substrates in NPseparation and purification15 attract special attention to NP−PB interactions.Traditionally, techniques for NP separation stem from those
employed for characterization and separation of polymers,including size exclusion chromatography (SEC),16 hydro-dynamic chromatography (HDC),17 field flow fractionation
(FFF),18,19 and size selective precipitation20 (SSP). Thesetechniques are designed to separate NPs mainly according totheir size and shape. However, many applications require NPseparation by surface chemistry (that may be manifested, forexample, by the degree of hydrophobicity or surfaceheterogeneity), especially when NPs are modified by specificfunctional groups (“ligands”).21−23 In polymer chromatogra-phy, separation by chemistry, e.g., chemical composition ormicrostructure of polymer chains, is achieved at the so-calledcritical point of adsorption (CPA).38 At CPA, the repulsiveentropic effect of polymer chain confinement in the pores ofsolids substrate is compensated by the attractive enthalpic(adsorption) interaction.24 The balance of entropic andenthalpic factors results in molecular weight-independentelution of polymers. The corresponding separation regime,
Received: August 17, 2017Revised: September 14, 2017Published: September 15, 2017
Article
pubs.acs.org/Langmuir
© 2017 American Chemical Society 1481 DOI: 10.1021/acs.langmuir.7b02914Langmuir 2018, 34, 1481−1496

often called liquid chromatography at critical conditions(LCCC), has been applied to separate polymers of differentarchitectures,24 such as diblock and triblock copolymers, starpolymers, and combs at the isocratic and gradient elutionmodes.25−27 CPA can be achieved by varying the solventcomposition, which controls the solvent quality.28 In a goodsolvent, attractive polymer−substrate interactions are sup-pressed and steric interactions dominate, favoring separationby hydrodynamic size (size exclusion chromatography) wherelarge molecules elute faster than their smaller counterparts. Asimilar order of elution occurs in hydrodynamic chromatog-raphy in capillary channels or packed columns.17 In the otherlimiting case of strong adsorption achieved with a poorersolvent, elution occurs in the reverse order with largermolecules retained longer. CPA is achieved at an intermediatecomposition when retention becomes independent of themolecular weight. Recently, we demonstrated that the criticalconditions of polymer adsorption exist in the chromatographiccolumns packed with nonporous particles in which theseparation occurs in the interstitial volume between particles(flow through channels).29,30
The present work studies the interactions between NPs andPBs in a binary solvent by means of dissipative particledynamics (DPD) simulations. We explore the dependence ofthe free energy landscape of NPs in the vicinity of PBs on theparticle size and solvent composition and predict NP transportand retention in PB-grafted pore channels. Our motivation is todetermine whether the reversal of the elution order and CPA,found in polymer chromatography upon varying the solventcomposition, can also be achieved in NP chromatography, thusleading to size-independent NP elution. Although thisparticular task has (to the best of our knowledge) never beentackled in the literature, the NP−PB interactions in generalhave been actively explored both experimentally and theoret-ically.Of our particular interest are theoretical studies of the free
energy of NP adhesion and sorption by PB and its influence onNP mobility. NP−polymer interactions are complex andinvolve multiple scales that require theoretical approaches31,32
and computer simulations33−44 on a coarse-grained supra-molecular level. Theoretically, NP−polymer interactions wereexplored using self-consistent field theory (SCFT),31,33,35−37,39
Brownian dynamics (BD),40 and dissipative particle dynamics(DPD)38 simulations. Milchev et al.45 compared theinteractions of NPs with PBs and polymeric solutions. Theynoted that free energy of NP rises steeply as NP penetratesdeeper into an expanded PB, which could not be explainedsolely by the dependence of polymer density on the distance tothe substrate.46,47 Halperin et al.31 explored the dependence ofthe disjoining pressure between NP and PB on solvent qualityusing SCFT. The reduction of the solvent quality, which leadsto the eventual collapse of PB, reduces the associated freeenergy barrier and favors NP penetration and absorption withinPB. Merlitz et al. in their MD study48 observed that chainpolydispersity reduces the free energy of NP immersion intoPB. Zhang et al.40 considered the effect of attraction betweenNP and polymer using BD simulations. For larger NPs, the freeenergy has a minimum with respect to NP location, thusindicating a preferential depth of NP immersion into PB. Ourgroup49 explored NP interactions with PBs using DPD andfocused at the interplay between attractive forces caused bypolymer adsorption at the NP surface and NP attraction to thesubstrate and entropic repulsive forces at varying grafting
density, NP size, and solvent composition. We described twobasic mechanisms of NP−PB interactions, NP adhesion at thePB exterior and NP immersion into PB with adhesion tosubstrate, and calculated the free energies of these adhesionstates and the energy barriers between them. Somewhat similarobservations were made by Hua et al.50 who modeled thedistribution of NPs of different sizes in the vicinity of asemiflexible PB-grafted support. Under certain conditions, NPconcentration indicated the existence of a potential well nearthe brush support. CGMD simulation of Nasrabad et al.51
considered NP influence on PB structure. The authors modeledPBs grafted onto planar surfaces and in cylindrical pores. Strongadsorption of polymer chains onto NPs caused PB collapse. Ata low grafting density, a strongly nonuniform PB outerboundary was observed with polymer chains clustered aroundthe NPs that were located close to the surface. Thisphenomenon is qualitatively similar to the behavior of lowdensity PBs in bad solvent. PB became more uniform when thepolymer grafting density and NP concentration increased. Caoet al.52 modeled NP diffusion within a cylindrical channel withPB-grafted walls using DPD framework with Lennard-Jonesquasiparticles. The authors varied the grafting density and theattraction between NPs and tethered chains and observed atransition from static NPs trapped by the chains to fasttransport of NPs in the channel center.In recent works from our group, we investigated the PB
conformational transition and NP adhesion to PB in a binarysolvent at varying solvent composition49,53 using DPDsimulations. The original ghost tweezers (GT) method wasemployed to calculate the free energy landscape of NP−PBinteractions and analyze the equilibrium adhesion states and theenergy barriers separating these states. The DPD model and theGT method proposed in refs 49 and 53 constitute themethodological foundation of this work.The rest of the paper is structured as follows. Section 2
describes the methodological framework of our study: details ofDPD simulations, parametrization of the coarse-grained modelof polymer, solvent and nanoparticles, methodology ofcalculations of the free energy landscape of NPs near PBs bythe ghost tweezers method, calculation of Henry constant ofNP adhesion to PB in slitlike channels with PB-covered walls,and modeling of NP transport through PB-grafted slit-shapedchannels. In section 3, we present the simulation results anddiscuss the dependence of NP−PB interactions on the NP sizeand solvent composition, variation of the Henry constant, andthe retention time with the reduction in the solvent qualityduring NP flow through PB-grafted channels and demonstrateand quantify the observed transition from the size-exclusion tothe adsorption regime of NP separation, which is accompaniedby the reversal of the sequence of NP elution. Conclusions aresummarized in section 4.
2. MODELS AND METHODS2.1. Dissipative Particle Dynamics Simulations. In this work,
we employed standard DPD implementation: molecules are dissectedinto soft quasiparticles (beads) each of which represents a group ofatoms together. The beads interact with effective potentials para-metrized to reproduce targeted structural and thermodynamicmacroscopic properties of the material. The beads move accordingto Newton’s equations of motion while acted upon by a force,
∑= + + +≠
( )f F F F Fii j
ij ij ij ij(C) (B) (D) (R)
(1)
Langmuir Article
DOI: 10.1021/acs.langmuir.7b02914Langmuir 2018, 34, 1481−1496
1482
where f i is the total force on the ith particle resulting from interactionswith its neighbors. f i sums up the short-range conservative repulsionforces Fij
(C), bond forces Fij(B), drag forces Fij
(D), and random forces Fij(R).
Fij(C) is the force arising from a harmonic repulsive potential between
overlapping beads: = − ( )aF r1ij ijr
R ij(C) ij
cfor rij ≤ Rc and zero beyond
the effective bead diameter RC. rij = |ri − rj|, and aij is known as theconservative repulsion parameter. Beads connected by bonds interactvia harmonic bond forces Fij
(B) = KB(rij − re)rij, where KB is the effectivebond rigidity and re is the equilibrium bond length. The drag andrandom forces are implemented to maintain the Langevin thermo-stat54,55
γ σ θ= − = w r w rF r v r F r( )( . ) ; ( )ij ij ij ij ij ij ij ij ij(D) (D) (R) (R)
(2)
where γ is the friction coefficient, σ2 = 2γkT, and vij = vi − vj is therelative velocity between ith and jth beads. The weight functions w(D)
and w(R) are related as w(D) = (w(R))2 with = −( )w r( ) 1ijr
R(R) ij
cfor rij
≤ Rc and zero for rij > Rc. θij is a random variable with Gaussianstatistics.In this work, we use the conventional implementation of DPD: all
beads have the same effective diameter Rc and the same intra-component repulsion parameter aII. The DPD model was para-metrized in our previous works49,53 and effectively mimicspolyisoprene natural rubber (PINR) PB in benzene (good solvent)−acetone (bad solvent) binary solution. The bead size Rc is set to 0.71nm. The bead density ρb equals 3Rc
−3 and aII = 42kBT/Rc to effectivelyreproduce the overall compressibility of the system under consid-eration.53,56 DPD simulations were performed in reduced units with Rcas the unit of length and kBT as the unit of energy using LAMMPS57
software. Configuration snapshots were created using the VisualMolecular Dynamics (VMD) program.58
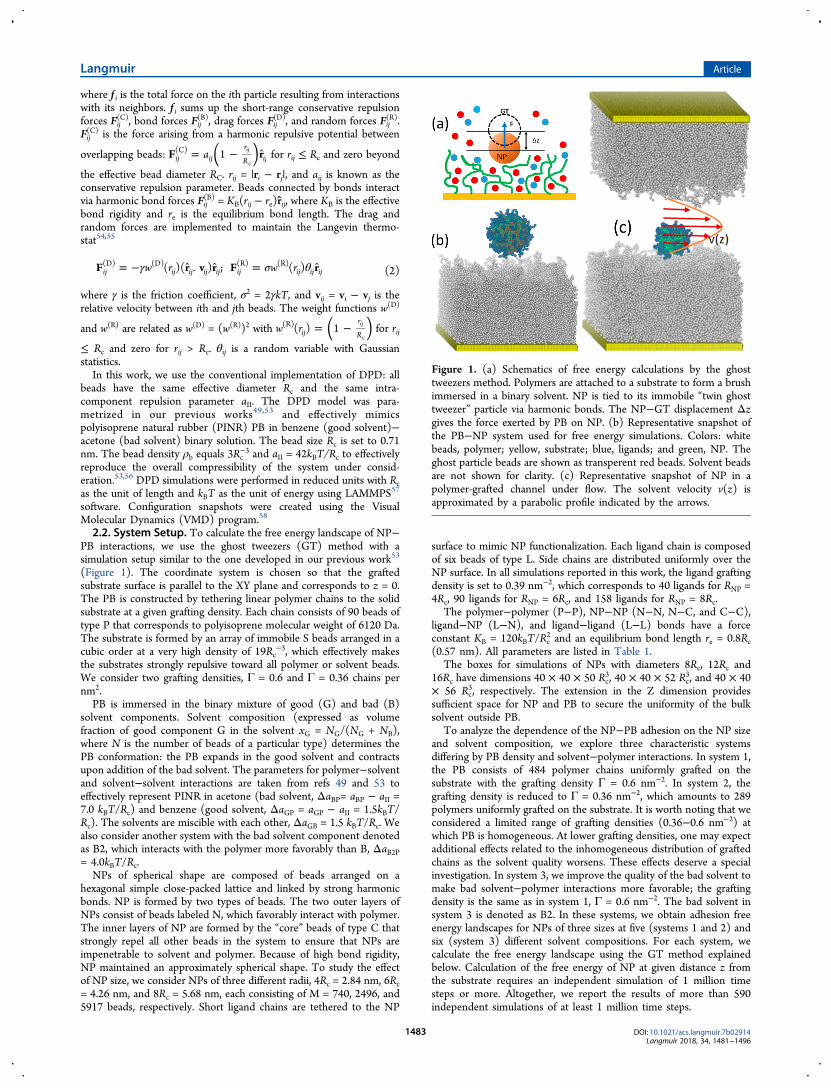
2.2. System Setup. To calculate the free energy landscape of NP−PB interactions, we use the ghost tweezers (GT) method with asimulation setup similar to the one developed in our previous work53
(Figure 1). The coordinate system is chosen so that the graftedsubstrate surface is parallel to the XY plane and corresponds to z = 0.The PB is constructed by tethering linear polymer chains to the solidsubstrate at a given grafting density. Each chain consists of 90 beads oftype P that corresponds to polyisoprene molecular weight of 6120 Da.The substrate is formed by an array of immobile S beads arranged in acubic order at a very high density of 19Rc
−3, which effectively makesthe substrates strongly repulsive toward all polymer or solvent beads.We consider two grafting densities, Γ = 0.6 and Γ = 0.36 chains pernm2.PB is immersed in the binary mixture of good (G) and bad (B)
solvent components. Solvent composition (expressed as volumefraction of good component G in the solvent xG = NG/(NG + NB),where N is the number of beads of a particular type) determines thePB conformation: the PB expands in the good solvent and contractsupon addition of the bad solvent. The parameters for polymer−solventand solvent−solvent interactions are taken from refs 49 and 53 toeffectively represent PINR in acetone (bad solvent, ΔaBP= aBP − aII =7.0 kBT/Rc) and benzene (good solvent, ΔaGP = aGP − aII = 1.5kBT/Rc). The solvents are miscible with each other, ΔaGB = 1.5 kBT/Rc. Wealso consider another system with the bad solvent component denotedas B2, which interacts with the polymer more favorably than B, ΔaB2P= 4.0kBT/Rc.NPs of spherical shape are composed of beads arranged on a
hexagonal simple close-packed lattice and linked by strong harmonicbonds. NP is formed by two types of beads. The two outer layers ofNPs consist of beads labeled N, which favorably interact with polymer.The inner layers of NP are formed by the “core” beads of type C thatstrongly repel all other beads in the system to ensure that NPs areimpenetrable to solvent and polymer. Because of high bond rigidity,NP maintained an approximately spherical shape. To study the effectof NP size, we consider NPs of three different radii, 4Rc = 2.84 nm, 6Rc= 4.26 nm, and 8Rc = 5.68 nm, each consisting of M = 740, 2496, and5917 beads, respectively. Short ligand chains are tethered to the NP
surface to mimic NP functionalization. Each ligand chain is composedof six beads of type L. Side chains are distributed uniformly over theNP surface. In all simulations reported in this work, the ligand graftingdensity is set to 0.39 nm−2, which corresponds to 40 ligands for RNP =4Rc, 90 ligands for RNP = 6Rc, and 158 ligands for RNP = 8Rc.
The polymer−polymer (P−P), NP−NP (N−N, N−C, and C−C),ligand−NP (L−N), and ligand−ligand (L−L) bonds have a forceconstant KB = 120kBT/Rc
2 and an equilibrium bond length re = 0.8Rc(0.57 nm). All parameters are listed in Table 1.
The boxes for simulations of NPs with diameters 8Rc, 12Rc and16Rc have dimensions 40 × 40 × 50 Rc
3, 40 × 40 × 52 Rc3, and 40 × 40
× 56 Rc3, respectively. The extension in the Z dimension provides
sufficient space for NP and PB to secure the uniformity of the bulksolvent outside PB.
To analyze the dependence of the NP−PB adhesion on the NP sizeand solvent composition, we explore three characteristic systemsdiffering by PB density and solvent−polymer interactions. In system 1,the PB consists of 484 polymer chains uniformly grafted on thesubstrate with the grafting density Γ = 0.6 nm−2. In system 2, thegrafting density is reduced to Γ = 0.36 nm−2, which amounts to 289polymers uniformly grafted on the substrate. It is worth noting that weconsidered a limited range of grafting densities (0.36−0.6 nm−2) atwhich PB is homogeneous. At lower grafting densities, one may expectadditional effects related to the inhomogeneous distribution of graftedchains as the solvent quality worsens. These effects deserve a specialinvestigation. In system 3, we improve the quality of the bad solvent tomake bad solvent−polymer interactions more favorable; the graftingdensity is the same as in system 1, Γ = 0.6 nm−2. The bad solvent insystem 3 is denoted as B2. In these systems, we obtain adhesion freeenergy landscapes for NPs of three sizes at five (systems 1 and 2) andsix (system 3) different solvent compositions. For each system, wecalculate the free energy landscape using the GT method explainedbelow. Calculation of the free energy of NP at given distance z fromthe substrate requires an independent simulation of 1 million timesteps or more. Altogether, we report the results of more than 590independent simulations of at least 1 million time steps.
Figure 1. (a) Schematics of free energy calculations by the ghosttweezers method. Polymers are attached to a substrate to form a brushimmersed in a binary solvent. NP is tied to its immobile “twin ghosttweezer” particle via harmonic bonds. The NP−GT displacement Δzgives the force exerted by PB on NP. (b) Representative snapshot ofthe PB−NP system used for free energy simulations. Colors: whitebeads, polymer; yellow, substrate; blue, ligands; and green, NP. Theghost particle beads are shown as transperent red beads. Solvent beadsare not shown for clarity. (c) Representative snapshot of NP in apolymer-grafted channel under flow. The solvent velocity v(z) isapproximated by a parabolic profile indicated by the arrows.
Langmuir Article
DOI: 10.1021/acs.langmuir.7b02914Langmuir 2018, 34, 1481−1496
1483

2.3. Calculation of NP−PB Interaction Free Energy by theGhost Tweezers Method. To measure the free energy ofinteractions between NP and PB, we apply the ghost tweezers (GT)method,53 which in silico mimics lab experiments with opticaltweezers.59 The GT method is implemented by introducing a ghostparticle that is an “identical twin” of the real NP (Figure 1a). Theghost twin (GT) particle is composed of beads of type A and of thesame number of beads as the real NP kept in the undisturbedhexagonal order. GT is pinned at given position RGT; it is immobileand does not interact with any system components except for the NP.The NP is bound to GT by M harmonic springs of rigidity kGTconnecting each respective pair of real and GT particle beads (i = 1, ...,M). Effectively, the NP is tethered to the given point RGT by aneffective force exerted by the GT, FGT = ∑i = 0
M kGT(Ri − RGT,i), whereRi is the fluctuating position of the ith bead of NP and RGT,i is the fixedposition of its counterpart bead of the GT particle. This forcecounterbalances the sum of the forces between NP and polymer andsolvent beads at the given NP position. Provided the systemequilibration in the course of DPD simulation with the GT placedat RGT, we calculate the average distance z between the NP center ofmass and substrate surface and the average GT force, FGT = ⟨FGT⟩,which due to the lateral uniformity of the system may have only onenonzero normal component that depends on the deviation, Δz = z −zGT, of the NP position z from the GT position zGT, FGT = KGT(z −zGT). Here, KGT = MkGT is the cumulative spring constant of theeffective harmonic force acting between the real and ghost NPs. kGT ischosen to optimize the efficiency of calculations. At the beginning of asimulation, the GT is pinned to a certain location z0 far enough fromPB to ensure a negligible NP−PB interaction so that at equilibrium,NP fluctuates around z0, Δz = 0 within the accuracy of the simulationand, respectively, the measured GT force, FGT = 0. Then, the GT ismoved along the Z-axis in small increments toward the substrate. Ateach GT position zGT, the system is equilibrated allowing for theeffective force acting between the NP and PB to be counterbalancedby the GT force, which is determined as a function of the NP position,FGT(z), from the average deviation of the NP center of mass from thetether point as described above. FGT(z) > 0 corresponds to an effectiverepulsion between PB and NP, whereas FGT(z) < 0 corresponds toeffective attraction. At the equilibrium positions, FGT(z) = 0. With thesimulation length we afforded in this work, an average error for theforce data points is approximately 0.5kT/Rc, which is sufficient todetermine the free energy landscapes that display different qualitativebehaviors with reasonable accuracy.The change in the Helmholtz free energy, A(z), is determined as the
work done by the GT in the course of quasi-equilibrium pulling of NPfrom the bulk solvent (position z0) to position z at the substrate,
∫=A z F z z( ) ( ) dz
z
GT0 (3)
The NP location z0 far from the substrate serves as a reference pointwhere A = 0.
The free energy landscape, A(z), allows one to estimate theequilibrium distribution of NP near the substrate, determine the excessGibbs adsorption of NPs, and calculate the Henry constant thatquantifies the adhesion equilibrium. Let us consider a slitlike pore ofhalf-width w with walls grafted with PB. The probability density P(z)of the NP location can be calculated as
∫=
−
−P z
e
e z( )
d
A z k T
w A z k T
( )/
0
2 ( )/
B
B(4)
The partition coefficient K of the nanoparticle between the polymerbrush and the bulk solvent can be obtained using the Gibbs excessadsorption theory and by calculating the Henry constant, as detailed inthe previous works.29,30,60 The Henry constant KH is defined from theexcess adsorption of NPs per unit pore surface area, which representsthe difference between the total amount of NPs in the channel Ntot andthe amount of NPs in a reference volume of bulk fluid with the givenconcentration of NPs denoted as cB. This concentration is consideredas low so that interactions between NPs are ignored. Because ourultimate goal is to understand the specifics of NP separation in porechannels with PB-grafted pore walls, it is reasonable to define thereference bulk volume as the volume available for the solvent flow. Asshown below, the solvent flow does not penetrate into the PB, and thevelocity profile is approximately parabolic (Figure 1c), which would beobserved in a channel with solid walls of half-width wH = w − wPB. Wedefine wH as the hydrodynamic width of the PB-grafted channel andwPB as the hydrodynamic thickness of the PB. The reference bulkvolume for the definition of excess adsorption Nex represents thevolume of the mobile phase outside of the PB
∫= − = −−N N c w c e z c w12
dw
A z k Tex tot B H B
0
( )/B H
B
(5)
Here, Nex is the total amount of NPs per unit substrate surface area.Accordingly, the Henry constant is given by
∫
∫
= = − −
= + −
−
−
KNc
e z w w
w e z
d ( )
( 1) d
wA z k T
wA z k T
Hex
B 0
( )/PB
PB0
( )/
B
B
(6)
As the reference technique, we consider the hydrodynamicchromatography employed for size exclusion separation of polymers
Table 1. Parameters for Short-Range Repulsion and Harmonic Bond Potentialsa
repulsion parameters aIJ, kBT/Rc
I \ J C N L A P G B/B2 S
C 42.0 60.0 60. 0.0 60.0 60.0 60.0 60.0N 42.0 42.0 0.0 38.5 43.5 43.5 42.0L 42.0 0.0 42.0 43.5 49.0/46.0 42.0A 0.0 0.0 0.0 0.0 0.0P 42.0 43.5 49.0/46.0 42.0G 42.0 43.5 42.0B/B2 42.0 42.0S 42.0
harmonic bond parameters
type KB (kBT/Rc2) re/Rc type KB (kBT/Rc
2) re/Rc
P−P 120 0.8 C−C 120 0.8L−L 120 0.8 GT 0.01 0
aThe repulsion parameter aij (in units kBT/Rc) between the beads and the bond parameters, the force constants KB, and the equilibrium bond lengthre used in the simulations. Bead types are denoted as C, core beads; N, NP surface beads; L, ligand beads; A, ghost particle beads; P, polymer beads;G, good solvent; B, bad solvent 1; B2, bad solvent 2; S, substrate.
Langmuir Article
DOI: 10.1021/acs.langmuir.7b02914Langmuir 2018, 34, 1481−1496
1484

and NPs alike.17,61,62 In HDC, the separation is achieved by theparticle size due to the inhomogeneity of the solvent flow in the porechannels with solid walls. It is worth noting that in this case the Henryconstant defined by eq 6 in the absence of PB (wPB = 0) is negativeand equal to the NP radius RNP, KH = −RNP, which reflects NPdepletion (negative excess adsorption) at the solid surface (A(z) = ∞at z < RNP), which is characteristic for HDC.2.4. Modeling NP Transport. To model NP transport through a
chromatographic channel, we simulate the solvent flow through aslitlike channel with PB-grafted walls. The system is periodic in thelateral directions. We consider 16 systems, which differ by the solventcomposition and PB grafting density corresponding to systems 1−3.The simulation boxes in solvent flow modeling have the size of 40 ×40 × 70 Rc
3 (28.4 × 28.4 × 49.7 nm3). Selected simulations of NP floware performed in a larger simulation box of size 40 × 40 × 90 Rc
3 (28.4× 28.4 × 63.9 nm3). We first equilibrate the systems at a given solventcomposition and then apply a constant force in the X direction on thesolvent particles and run the simulation until steady flow is reached.The velocity profile vs(z) of the solvent across the channel is obtainedby averaging the solvent particle velocities over a long time (100000steps). For all systems considered, the velocity of solvent particlesinside PB is zero, whereas in the channel outside PB, the velocityprofile tends to be parabolic similar to the Poiseuille flow in channelswith solid walls, see Figure 1c. This observation allows us to introducethe hydrodynamic thickness wPB of PB as the cutoff of the parabolicapproximation assuming that solvent velocity is zero at z < wPB and
which follows the Poiseuille law, = − −−( )v z v( ) 1 w z
w wsPA
m( )
( )
2
PB2 , at wPB
≤ z ≤ w. vm is the maximum velocity of the flow in the channel centerchosen from the condition of equality of the total solvent flux to thatgiven by the parabolic approximation. This means that the solvent flowin a PB-grafted channel is similar to the Poiseuille flow in a solid wallchannel of half-width w − wPB. Thus, defined hydrodynamic PBthickness depends on the solvent composition and decreases as thegood solvent fraction xG decreases, causing PB contraction. Thehydrodynamic thickness of the brush wPB is found to be independentof the applied driving force and, respectively, of the maximum velocityvm. As such, the hydrodynamic thickness of PB does not depend(within the accuracy of our simulations) on the channel width, whichallows us to predict the flow velocity profile in the channels of differentwidths based on the wPB value determined in the simulation box of thechosen size.To compare different systems, the solvent flux across the channel,
the mean solvent velocity, has to be kept constant. To secure thiscondition, the solvent velocity vs(z) is normalized by the mean solventvelocity,
∫∫
ρ
ρ⟨ ⟩ =v
z v z z
z z
( ) ( ) d
( ) d
ws sw
ss
0
0 (7)
Eq 7 accounts for an inhomogeneous distribution of the solvent in thechannel due to its depletion within PB and the fact that solvent locatedwithin PB is effectively immobile at z < wPB. Note that the meanretention time of the solvent is the reciprocal of ⟨vs⟩.The normalized velocity profile vn(z) = vs(z)/⟨vs⟩ is found to be
independent of the applied force. In the parabolic approximation, themean velocity is given by
∫
∫
ρ
ρχ⟨ ⟩ =
−=
−−( )
vv z z
z zv
( ) 1 d
( ) d
ws
w zw w
wsPA
m 0( )
( )
0 sm
2
PB2
(8)
χ = ⟨vsPA⟩/vm, the mean solvent velocity normalized by the maximum
solvent velocity, defined by eq 8. The normalized velocity profile in theparabolic approximation is then
χ= − −−
≤ ≤−⎛⎝⎜
⎞⎠⎟v z
w zw w
w z w( ) 1( )
( )atn
PA 12
PB2 PB
(9)
and zero for other values of z. The solvent density is constant outsidethe brush, ρs(z) = ρb (ρb = 3Rc
−3), whereas inside the brush, ρs(z) = ρb− ρPB(z), where ρPB(z) is the PB density.
In estimating the mean NP velocity, we followed the assump-tion61,63,64 accepted in the conventional HDC with solid wall channelsthat the velocity of particles positioned at distance z from the wallequals the solvent velocity at this distance. The mean velocity of NPsis determined by the distribution of solvent velocity across the channel.The fluid velocity in HDC, vn
HDC(z) is assumed to be Poiseuillian andis given by eq 9 with wPB = 0 and χ = 2/3. Provided that the particlecenter cannot be closer to the wall than its radius RNP, the meanparticle velocity reduced to the mean solvent velocity equals
∫ δ δ⟨ ⟩ =−
= + −vw R
v z z1
( ) d 113R
w
pHDC
NPnHDC 2
NP (10)
where δ = RNP/w. The reciprocal of ⟨vpHDC⟩ represents the ratio of the
particle retention time τpHDC to the solvent retention time τs
ττ δ δ
δ=+ −
≈ −11
1s
pHDC
13
2(11)
The latter approximate equality holds at δ ≪ 1.In the case of NP flow in a PB-grafted channel, we assume that NP
velocity is equal to the solvent velocity given by eq 9 at wPB + RNP ≤ z≤ w and equals 0 at z < wPB + RNP, i.e., when NP is partially orcompletely immersed into PB, it is assumed to be immobile. Becausethe probability of NP location at distance z is proportional to theBoltzmann factor e−A(z)/kBT, the mean NP velocity (reduced to themean solvent velocity) is calculated as
∫
∫⟨ ⟩ = +
−
−ve v z z
z
( ) d
e dw R
w A z k T
w A z k Tp
( )/n
0( )/
PB NP
B
B(12)
The ratio of the particle retention time τp to the solvent retention timeτs is calculated as
ττ
=⟨ ⟩v
1p
s p (13)
In the case of poor adsorption of NPs to PB, one may expect that eq13 converts to the HDC eq 11 with δ = RNP/(w − wPB).
The parabolic approximation (eq 9) with the hydrodynamicthickness wPB of PB determined from the solvent flow simulation inone channel of a particular width allows one to estimate the mean NPvelocity and, respectively, the retention time for the channels of anywidth. This is particularly useful considering the fact that simulationsof NP flow through channels suffer from serious computationaldifficulties. First, the real flow velocities in chromatographic columnsare very low compared to the thermal velocities of particles in DPDsimulations. Thus, the force applied to create such a flow is extremelyweak, and it is hardly possible to obtain necessary statistics on NPdiffusion across the channel cross-section even in a reasonably longsimulation. Second, simulations of large channels are computationallyunfeasible. In fact, we have shown with selected simulations of NP flowthat the assumption that the NP velocity can be approximated by thesolvent velocity in the absence of NP does not cause any significanterror (see Supporting Information (SI), section 1). It is worth notingthat the parabolic approximation for NP velocity is a simplified model;it does not consider the effects of possible partial NP penetration intoPB, which would introduce additional frictional forces to NP flow. Italso ignores the NP rotational motion that is pronounced especially atthe edge of PB.
3. RESULTS AND DISCUSSION3.1. Free Energy of NP Adhesion to the Polymer
Brush. We study the dependence of the adhesion free energyon the solvent quality by varying the good solvent fraction xGfrom 0.99 to lower values up to 0.6. At xG = 0.99, PB is fully
Langmuir Article
DOI: 10.1021/acs.langmuir.7b02914Langmuir 2018, 34, 1481−1496
1485

expanded; as solvent quality worsens, PB gradually transformsto a collapsed state. This is shown in Figure 2, which displays
density profiles obtained in different simulation systems: as xGdecreases, the brush becomes denser and its effective widthdecreases. For example, in system 1, PB at xG = 0.8 is effectively∼15% thinner and, respectively, denser than PB at xG = 0.99.Solvent composition strongly affects the interaction betweenthe brush and NP. Figure 3 displays the dependence of the
effective NP−PB force and the free energy landscape asfunctions of the NP coordinate (distance of NP center fromsubstrate surface) for system 1 (G-B solvent mixture, Γ = 0.6nm−2). At xG = 0.99, we observe no adhesion of NP regardlessof its size: the effective force is zero in the channel centerbeyond PB and becomes repulsive as NP gets closer to PB(Figure 4a). Repulsion increases steeply as NP is immersed intoPB as it was observed in previously published works.50,53 Assolvent quality is reduced (xG decreases), and an enthalpicattraction between NP and PB emerges because interaction ofNP surface (or ligands) with polymer is more favorable thanwith the bad solvent component. In the region of attraction, theforce is negative; GT prevents NP from penetrating into PB.The position of zero force corresponds to the adhesionequilibrium: at smaller distances, entropic repulsion overpowersthe attractive forces, which prevents the NP from furtherimmersion into the PB. Already at xG = 0.92, system 1 exhibitsslightly attractive force (negative values) at the PB surface, butrepulsion increases steeply as the NP is submerged into PB.Attraction becomes progressively more pronounced as the badsolvent fraction increases (xG decreases) and PB contracts. Thelocation of the minimum of the force is also shifted closer tosubstrate, which results not only from the enthalpic attractionitself but also from the decrease in the brush thickness (Figure2).The lower panels in Figure 3 display the dependence of the
Helmholtz free energy calculated by integrating the measuredforce using eq 3 on the position of the NP center of mass. Forintegration, simulated force data points are smoothened usingmoving averages (solid lines of the force profiles). At xG = 0.99,free energy landscapes are monotonic and do not indicate anyparticular equilibrium state (because NP−PB interactions arerepulsive). This behavior is reminiscent of that in HDC. As thebad solvent fraction increases, free energy landscapes exhibitwell-defined minima that correspond to the adhesion
Figure 2. PB density (monomers per unit volume) profiles at differentgood solvent fractions in the simulations. Red symbols corresponds tosystem 1 simulations with polymer grafting density 0.6 nm−2 at xG =0.99 (circles), 0.90 (asterisks), and 0.80 (squares). Green symbolsrepresents densities in system 2 with grafting density 0.36 nm−2, wherecircles correspond to xG = 0.99, asterisks to 0.89, and squares to 0.80.Blue symbols corresponds to system 3 with bad solvent 2 and graftingdensity 0.6 nm−2. Here, densities at xG = 0.99 (circles), 0.72(asterisks), and 0.60 (squares) are shown.
Figure 3. Force (upper panel) and free energy (lower panel) profiles (right y-axis) in system 1 at different good solvent fractions xG ranging from0.80 to 0.99 for different NP diameters 8Rc (blue), 12Rc (green), and 16Rc (red). z-coordinate corresponds to the position of the NP center of mass.Points show the actual values of the effective force obtained with the GT method, and the curves display the smoothed data (moving average). Freeenergy curves are obtained by integrating the smoothed data. Note the different scales of the right y-axis chosen to show the magnitude of therespective values of force and energy. Regions of negative force correspond to the NP−PB attraction, and zero force values indicate free energyminima corresponding to the equilibrium adhesion positions. Polymer grafting density is 0.6 nm−2. Black squares show the local density profiles ofPB beads (left y-axis).
Langmuir Article
DOI: 10.1021/acs.langmuir.7b02914Langmuir 2018, 34, 1481−1496
1486

equilibrium with NP partially immersed into PB. Thecorresponding snapshots are shown in Figure 4a. The locationof equilibrium and the corresponding equilibrium adhesionenergy depends on the NP size in a nontrivial fashion. Whenthe good solvent fraction is high, that is, when PB is fullyexpanded, repulsion is stronger for larger NP: the larger theNP, the more pronounced is the restriction on the conforma-tional freedom of the polymer chains. When the good solventfraction is low and PB is denser, the adsorption interactionsprevail and larger NPs have larger adsorption energy due tolarger NP surface area on which polymer segments can beadsorbed. Thus, there is a crossover upon the solvent qualityvariation in the adsorption free energy dependence on the NPsize, which is demonstrated by the free energy profiles (Figure3). At sufficiently high good solvent fraction, attraction is morepronounced for smaller NPs: for example, at xG = 0.92 and0.90, smaller particles have wider regions of attraction where
adsorption interactions prevail due to increased NP penetrationinto PB because of their smaller size. As xG decreases (xG = 0.87and 0.80), the adsorption energy increases with the NP size.The intermediate solvent compositions of xG= 0.9−0.92correspond to a region of transition from the entropy-dominated to the enthalpy-dominated NP−PB interaction, orfrom the size exclusion mode to the adsorption mode of NPseparation. As discussed in the Introduction, a similar behavioris typical for adsorption of polymers, where there exists acompensation point known as the critical point of adsorption(CPA), where the enthalpic attraction is counterbalanced bythe entropic repulsion regardless the polymer size. Forpolymers, CPA is characterized by the size independence ofthe Henry constant and retention time. We could not identifysuch a point for NP adhesion; however, the observed transitionfrom repulsive to adsorption regimes occurs in a narrow rangeof solvent compositions for all of the systems studied.
Figure 4. Characteristic equilibrium positions of NPs in size exclusion (upper panels) and adsorption (lower panels) regimes: Systems (a) 1, (b) 2,and (c) 3. The NP diameter is 16Rc. Colors: yellow, substrate; pink, polymer; green, NP; and blue, ligands.
Figure 5. Force (upper panel) and free energy (lower panel) profiles of the NPs in system 2 at different good solvent fractions. z is distance from thesubstrate surface expresed in Rc. The polymer grafting density of the brush is 0.36 nm−2. Colors: black, brush density; blue, green, and red are datawith NPs with diameters of 8Rc, 12Rc, and 16Rc, respectively. The representation scheme is the same as in Figure 3.
Langmuir Article
DOI: 10.1021/acs.langmuir.7b02914Langmuir 2018, 34, 1481−1496
1487

Figure 5 shows the effective forces and free energylandscapes for system 2, which is similar to system 1 exceptfor a lower grafting density (Γ = 0.36 nm−2). The PB in system2 is effectively ∼4Rc (∼21%) thinner than in system 1 (Figure2). Reduced PB density leads to less efficient entropicrepulsion, and therefore, the interval of z values correspondingto attractive NP−PB interaction widens. This causes signifi-cantly stronger adhesion: free energy minima at lower xG insystem 2 are much lower than those in system 1 at the samecompositions. However, the transition from size-exclusion toadsorption modes occurs in the same range of compositions asin system 1 at xG = 0.89−0.92. Essentially, the crossoverbehavior is similar to that of system 1. Figure 4b showssnapshots of the equilibrium positions of the NP of diameter6Rc with different solvent compositions.In system 3, the polymer grafting density is the same as in
system 1 (Γ = 0.6 nm−2), but the bad component interacts withpolymers more favorably (aP,B2 = 46.0kBT/Rc instead of49.0kBT/Rc in systems 1 and 2). The resulting force and freeenergy profiles in system 3 are shown in Figure 6. Thesnapshots of NP equilibrium states in size exclusion and
adsorption modes are given in Figure 4c. A better interactionbetween bad solvent and polymer radically weakens theenthalpic attraction between NP and PB because the latterresults from the contrast between NP−PB and solvent−PBinteractions. In system 3, we observe the same crossoverbetween the size exclusion mode, where repulsion is strongerfor larger NPs, and the adsorption mode with the oppositetrend of stronger attraction for larger NPs. However, because ofthe generally weaker attractive forces in system 3, the crossoverregion shifts to lower xG values compared to systems 1 and 2; insystem 3, it occurs at xG ≈ 0.72 (Figure 6). Overall, weconclude that the transition between the size exclusion andadsorption modes is observed for all systems studied, and theconditions at which the crossover occurs depend on the PBdensity and specifics of solvent−polymer interactions.Adhesion of NP to PB results from the preferential
interaction of the polymer with NP over the bad solvent. Badsolvent is excluded not only from the exterior of PB but alsofrom the gap between PB and NP that causes deeperpenetration of NP into PB and increased effective NP−PBattraction. The strength of NP−PB attraction therefore
Figure 6. Force (upper panel) and free energy (lower panel) profiles of NPs in system 3. Polymer grafting density is 0.6 nm−2, which is the same asin system 1, but the bad solvent component is B2, which interacts more favorably with the polymer than the one in system 1. Color andrepresentation schemes are the same as those in Figure 3.
Figure 7. (a) Snapshot of NP (RNP = 6Rc) at the closest proximity (z = WPB + RNP) to PB in the size-exclusion regime at xG = 0.99. The bad solventfraction is negligible, and NP is repelled from the brush. (b) Snapshot of adsorbed NP on PB of density 0.6 nm−2 at xG = 0.80. Colors: yellow, badsolvent beads; green, NP; blue, ligands; transparent pink beads, polymer beads. Bad solvent is excluded from PB, causing its contraction andenhancing NP−PB interactions. (c) Solvent (red, bad solvent; green, good solvent) and PB (black) density profiles at xG = 0.80 (squares) and xG =0.99 (circles).
Langmuir Article
DOI: 10.1021/acs.langmuir.7b02914Langmuir 2018, 34, 1481−1496
1488

depends on the strength of repulsion between polymer and badsolvent. Panels a and b in Figure 7 show snapshots of NP−PBconfigurations at xG = 0.99 and 0.80 for PB of density 0.6 nm−2.Visual comparison of these two snapshots shows the specifics ofNP−PB adhesion in binary solvents. In the absence of badsolvent (Figure 7a), PB prefers to be surrounded by goodsolvent, effectively repelling NP. Addition of bad solvent(Figure 7b), causes PB contraction and solvent exclusionbetween NP and PB that enhances NP penetration into PB.The differences in the polymer and solvent density profilesshown in Figure 7c quantify the change in the composition ofthe PB interface upon the addition of bad solvent.3.2. Solvent Flow in the Polymer-Grafted Channel.
Chromatographic separation of NPs depends not only on theadhesion interactions but also on the specifics of the solventflow through polymer-grafted channels that are also controlledby the solvent quality. Figure 8 presents the results ofsimulation of solvent flow through slitlike channels betweenPB-grafted walls as shown in Figure 1c. We consider the samePB−binary solvent systems 1−3 as in the free energycalculations. The simulation boxes are open and periodic inthe XY plane. A constant force of 0.002kBT/Rc is applied toeach solvent particle in the X direction, and the simulation forseveral hundred thousand steps is performed until a steady flowis reached with minor fluctuations of velocities around theaveraged velocity profile vs(z). Panels a−c in Figure 8 show theprofiles of the solvent velocity along with PB and solventdensities across the channel cross-section at different solventcompositions. The computed solvent velocity vs(z) shown bydashed lines depends on the magnitude of the applied force.The normalized velocity, vn(z), reduced to the mean solventvelocity (shown by the solid lines) does not depend on themagnitude of the applied force (eq 7), as shown in the SI(section 2). The use of the normalized velocities is practical forcomparison of the role of solvent composition on the fluid flowin the chromatographic columns at a given volumetric flow rate.The normalization of vn(z) implies that the mean reducedvelocity ⟨vn(z)⟩ = 1, ensuring the same volumetric flux atdifferent solvent compositions. It is worth noting that PBconformation at a given solvent composition and respective PBdensity profile are not affected by the flow (see SI section 2);this feature was also shown experimentally.65,66 At the sametime, the fluid velocity is sensitive to the change of the solvent
composition because the latter affects the brush extension and,respectively, the hydrodynamic width of the channel.Figure 8a presents the solvent velocity profiles at good
solvent fractions 0.99, 0.92, 0.90, 0.87, and 0.80 in system 1with PB density Γ = 0.6 nm−2. The channel width, which is thedistance between the substrate surfaces in the Z direction is66.75Rc (47.4 nm). The profiles show that the solvent velocityis zero inside PB, but within the space between the brushes, thesolvent velocity profiles tend to be parabolic as in a Poiseuille’sflow between solid walls. The density distributions of thesolvent and the polymer are correlated with the velocities in theouter region of the brush, where the velocity profile changesfrom zero to the parabolic type. As shown in Figure 8, thesolvent density ρs(z) = ρb = 3Rc
−3 in the bulk region (outsidethe brush), whereas inside the brush, ρs(z)= ρb − ρPB(z). Thus,there is a considerable amount of solvent inside PB, and thissolvent is practically immobile.In HDC channels without PB, eq 8 integrates to 2/3vm (see
section 2.3), and thus, the normalized velocities vn(z) have apeak of 3/2. The presence of PB decreases the mean velocitybecause a part of the solvent that is inside PB has zero velocity.Integrating eq 8, taking into account that the solvent density isconstant in the bulk (z > wPB) and is approximately given by ρb− ⟨ρPB⟩ in the interior of the brush, we obtain
ρρ ρ ρ
⟨ ⟩≈−
− ⟨ ⟩ + −v
v w w
w w w
2/3 ( )
( ) ( )sPA b m PB
b PB PB PB b (14)
from which we get back to eq 8 when ⟨ρPB⟩ = ρb (means nopenetration of the solvent into the brush) and also when wPB =0. When ⟨ρPB⟩ ≪ ρb, ⟨vs
PA⟩ approaches the limiting value 2/3vm(w − wPB)/w.Thus, as the mean velocity is smaller in the presence of PB,
vn(z) becomes larger than 3/2. The mean solvent velocity ofthe PB-grated channel is determined approximately by therelative hydrodynamic width ((w − wPB)/w = wH/w) of thechannel that determines the fraction of the solvent that flows.In Figure 8a, the normalized velocities become as high as closeto 3 for the narrowest channel. Figure 8b presents the densityand velocity distributions in a channel with PB of density 0.36nm−2 for different solvent compositions. The hydrodynamicwidth of the channel in this case is increased for all xG becauseof the low grafting density. The magnitude of the solventvelocities also increases because of the lower PB density causing
Figure 8. Solvent velocity and density profiles across PB-grafted channel of width 66.75Rc at different good solvent fractions xG in systems (a) 1, (b)2, and (c) 3. Computed solvent velocity vs(z) (dashed lines), normalized solvent velocity vn(z) (solid lines), PB density (circles), and binary solventdensity (crosses) are shown. Red, green, blue, cyan, and magenta colors represent xG= 0.80, 0.87, 0.90, 0.92, and 0.99, respectively, in (a and b) and0.60, 0.70, 0.72, 0.80, and 0.99, respectively, in (c).
Langmuir Article
DOI: 10.1021/acs.langmuir.7b02914Langmuir 2018, 34, 1481−1496
1489

less resistance to the flow and the increased volume fraction ofthe solvent. On the other hand, vn(z) is lowered because of thelarger hydrodynamic width of the channel. The use of a lessrepelling bad solvent B2 also causes changes in the velocitydistributions (Figure 8c). In this case, systems 1 and 3 at xG =0.99 are nearly the same because the bad solvent fraction isnegligible, and as a result, the velocity and density profiles aresimilar. However, as xG decreases, the change of the PBconformation and the flow velocity are more moderate than insystem 1.The hydrodynamic width of PB, wPB, is found by fitting vs(z)
obtained from the simulations with parabolic approximationvsPA(z) at a given mean velocity
∫ ∫=v z z v z z( ) d ( ) dw
w w
sPA
0s
PB (15)
wPB can be iteratively found by solving eq 14 (see section 3 inthe SI for details). The values of wPB obtained for varioussystems are shown in Table 2.
The hydrodynamic thickness wPB is the appropriatedefinition of the effective PB thickness when our purpose isto describe the flow through PB-grafted channels. It is worthnoting that the hydrodynamic PB thickness is different from theeffective geometrical thickness wG defined by approximating thePB density profile with the rectangular one assuming a uniformequilibrium PB density at z < wG, see section 3 of the SI fordetails.Figure 9a compares vs(z) and vn(z) obtained from the
simulations with the corresponding parabolic approximations atxG = 0.80. Both solvent (circles) and normalized velocities(squares) showed very good agreement with their respectiveparabolic approximations for all systems (solid lines). Figure 9bpresents the predicted velocity distributions using parabolicapproximations for channels of different widths ranging fromthe width of the simulated channel w0 = 33.4Rc to 500Rccontaining PB (system 1) at xG = 0.99. The solvent densityρs(z) in the channels wider than w0 was assumed equal to thecomputed solvent density in the channel of width w0 at z < w0and set equal to the bulk density ρb at w0 < z < w. The solventdensities in Figure 9b are shown by dashed lines. Thenormalized velocities vn
PA(z) are shown in Figure 9b by solidlines. Because they are constructed to provide the reduced fluxequal to 1, the maximum normalized velocity in the channelcenter becomes smaller as the channel size increases. At w =500Rc, the maximum value of vs
PA(z) = 1.54, close to the value
of 3/2 that would be observed in the channels with solid wallswithout PB.
3.3. Henry Constant of NP Adhesion. We quantify NP−PB adhesion by the Henry constant calculated according to eq6 from the free energy landscapes determined in thesimulations with the GT method. The Henry constant iscalculated by eq 6 as the excess of adsorption per unit substratesurface area using the reference bulk volume based on the PBhydrodynamic thickness wPB defined from the Poiseuilleapproximation of the solvent flow at a given solventcomposition. The calculated Henry constant KH as a functionof the good solvent fraction xG is presented in Figure 10.In the repulsive size exclusion regime, when the good solvent
fraction is sufficiently high, the free energy is either positive or
close to zero and the integrand in eq 10, ≤−e 1A z kT( )/ . As aresult, KH is negative. In a limiting case of very dense brush andpurely repulsive interactions, KH ≈ −RNP, as in the HDC case,because the distances z < wPB + RNP from the substrate areeffectively inaccessible to NP. In HDC,61 this size exclusionleads to shorter elution times for larger NPs: they are locatedcloser to the channel center and move faster within thePoiseuille flow. Thus, we call the repulsive region of the NP−PB interaction at high good solvent fractions as thehydrodynamic, or size exclusion, mode, where KH is negativeand decreases as the NP size increases.As the NP free energy profiles at lower good solvent fractions
have regions of attraction with negative energy values, the
Table 2. Hydrodynamic PB Thickness (wPB) at DifferentGood Solvent Fractions for Systems 1−3
wPB (Rc)
xG system 1 system 2 system 3
0.99 21.1 16.5 21.20.92 19.8 15.00.90 19.20.89 14.40.87 18.8 14.20.80 17.5 12.9 20.10.72 19.50.70 19.40.65 19.00.60 18.3
Figure 9. (a) Comparison of parabolic approximation (solid lines)with simulation results (circles, squares). Red, green, and bluerepresent solvent velocities vs(z) for xG = 80 in systems 1−3,respectively. Black, cyan, and magenta are the correspondingnormalized profiles vn(z). (b) Normalized velocity profiles (solidlines) at xG = 0.99 in system 1 in channels of different widths wobtained using the parabolic approximation. Black, w = 33.4Rc; red, w= 50Rc; green, w = 100Rc; blue, w = 200Rc; magenta, w = 500Rc. Thehydrodynamic thickness 21.12Rc is used. The solvent densities (dasheslines), which are taken to be constant in the bulk, are also shown.
Langmuir Article
DOI: 10.1021/acs.langmuir.7b02914Langmuir 2018, 34, 1481−1496
1490
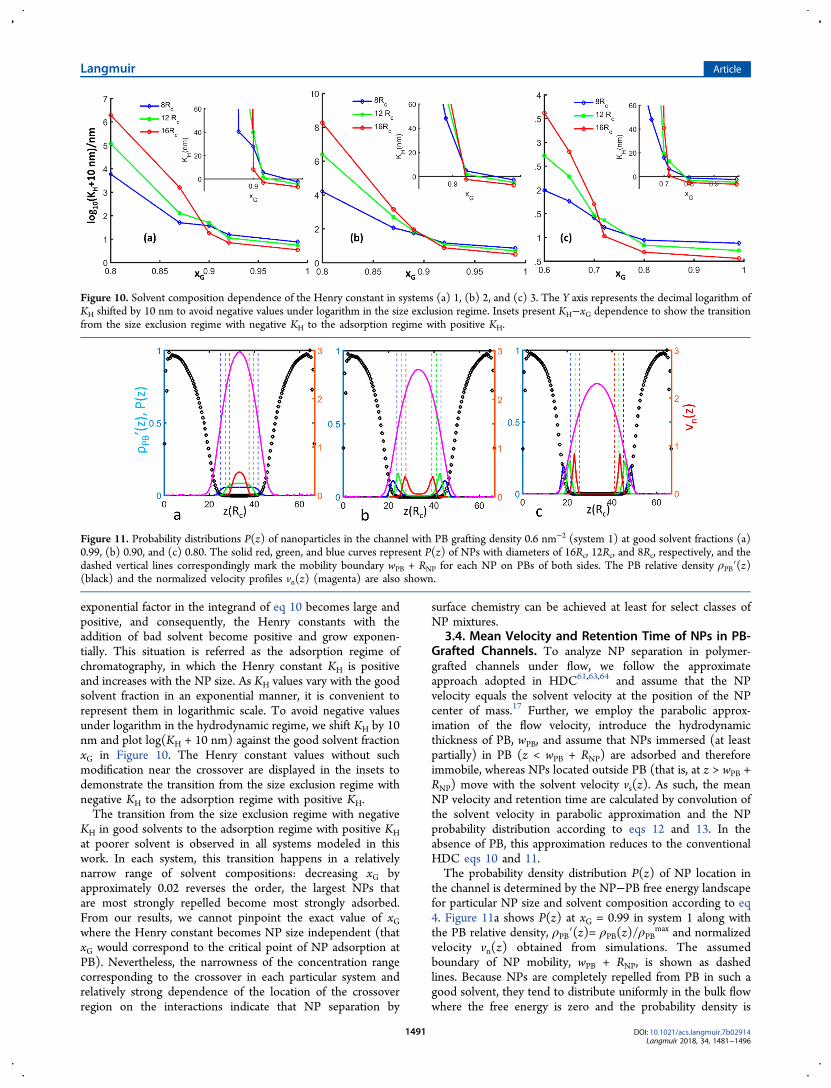
exponential factor in the integrand of eq 10 becomes large andpositive, and consequently, the Henry constants with theaddition of bad solvent become positive and grow exponen-tially. This situation is referred as the adsorption regime ofchromatography, in which the Henry constant KH is positiveand increases with the NP size. As KH values vary with the goodsolvent fraction in an exponential manner, it is convenient torepresent them in logarithmic scale. To avoid negative valuesunder logarithm in the hydrodynamic regime, we shift KH by 10nm and plot log(KH + 10 nm) against the good solvent fractionxG in Figure 10. The Henry constant values without suchmodification near the crossover are displayed in the insets todemonstrate the transition from the size exclusion regime withnegative KH to the adsorption regime with positive KH.The transition from the size exclusion regime with negative
KH in good solvents to the adsorption regime with positive KHat poorer solvent is observed in all systems modeled in thiswork. In each system, this transition happens in a relativelynarrow range of solvent compositions: decreasing xG byapproximately 0.02 reverses the order, the largest NPs thatare most strongly repelled become most strongly adsorbed.From our results, we cannot pinpoint the exact value of xGwhere the Henry constant becomes NP size independent (thatxG would correspond to the critical point of NP adsorption atPB). Nevertheless, the narrowness of the concentration rangecorresponding to the crossover in each particular system andrelatively strong dependence of the location of the crossoverregion on the interactions indicate that NP separation by
surface chemistry can be achieved at least for select classes ofNP mixtures.
3.4. Mean Velocity and Retention Time of NPs in PB-Grafted Channels. To analyze NP separation in polymer-grafted channels under flow, we follow the approximateapproach adopted in HDC61,63,64 and assume that the NPvelocity equals the solvent velocity at the position of the NPcenter of mass.17 Further, we employ the parabolic approx-imation of the flow velocity, introduce the hydrodynamicthickness of PB, wPB, and assume that NPs immersed (at leastpartially) in PB (z < wPB + RNP) are adsorbed and thereforeimmobile, whereas NPs located outside PB (that is, at z > wPB +RNP) move with the solvent velocity vs(z). As such, the meanNP velocity and retention time are calculated by convolution ofthe solvent velocity in parabolic approximation and the NPprobability distribution according to eqs 12 and 13. In theabsence of PB, this approximation reduces to the conventionalHDC eqs 10 and 11.The probability density distribution P(z) of NP location in
the channel is determined by the NP−PB free energy landscapefor particular NP size and solvent composition according to eq4. Figure 11a shows P(z) at xG = 0.99 in system 1 along withthe PB relative density, ρPB′(z)= ρPB(z)/ρPB
max and normalizedvelocity vn(z) obtained from simulations. The assumedboundary of NP mobility, wPB + RNP, is shown as dashedlines. Because NPs are completely repelled from PB in such agood solvent, they tend to distribute uniformly in the bulk flowwhere the free energy is zero and the probability density is
Figure 10. Solvent composition dependence of the Henry constant in systems (a) 1, (b) 2, and (c) 3. The Y axis represents the decimal logarithm ofKH shifted by 10 nm to avoid negative values under logarithm in the size exclusion regime. Insets present KH−xG dependence to show the transitionfrom the size exclusion regime with negative KH to the adsorption regime with positive KH.
Figure 11. Probability distributions P(z) of nanoparticles in the channel with PB grafting density 0.6 nm−2 (system 1) at good solvent fractions (a)0.99, (b) 0.90, and (c) 0.80. The solid red, green, and blue curves represent P(z) of NPs with diameters of 16Rc, 12Rc, and 8Rc, respectively, and thedashed vertical lines correspondingly mark the mobility boundary wPB + RNP for each NP on PBs of both sides. The PB relative density ρPB′(z)(black) and the normalized velocity profiles vn(z) (magenta) are also shown.
Langmuir Article
DOI: 10.1021/acs.langmuir.7b02914Langmuir 2018, 34, 1481−1496
1491

constant over z. It is clear from the plot that the NP probabilitydensity at z < wPB + RNP is nearly zero, whereas at z > wPB +RNP, it is constant. The hydrodynamic width of PB, wPB servesas a wall preventing penetration of NPs beyond z = wPB + RNP.In addition, the size exclusion constrains the larger particletoward the channel center, where it moves faster with thePoiseuille-type flow, whereas the smaller particles sample awider space and wider range of velocities and, therefore, moveslower on average. This picture is similar to that in HDC.Figure 11b shows probability distributions for NP location at xG= 0.90. Here, adsorption causes penetration of NPs in theinterior of PB beyond the mobility boundary. However, thechances of finding the NP in the solvent bulk are still nonzeroas the NP adsorption is weak. The overall velocity of NP in thiscase is determined by the fraction of NPs retained within PBwhere the NP velocity is zero. At xG = 0.80, as shown in Figure11c, the NP probability density is concentrated within PB at z <wPB + RNP. Under these conditions, NPs are mainly retained inPB in the adsorbed state with a small probability to desorb. Inthis adsorption mode, the probability of desorption isdetermined by the depth of the adsorption well and decreaseswith the increase in NP size. Respectively, the mean velocity ofNP decreases with their size.Figure 12a depicts the mean NP velocity ⟨vp⟩ calculated
using eq 9 as a function of the solvent composition in systems(I) 1, (II) 2, and (III) 3. ⟨vp⟩ is calculated using the parabolicapproximation assuming a channel haft-width, w = 70.43Rc,which is equivalent to a real channel width of 100 nm. In eachcase, ⟨vp⟩ decreases with the bad solvent fraction as theadsorption interactions gradually strengthen and attract NPstoward the PB interior. This effectively makes the probability ofNP location in the mobile bulk fluid lower and therefore
restricts its mobility. In all three systems, the dependence of⟨vp⟩ on the NP size undergoes a transition from size exclusionto adsorption modes. At higher xG, the mean velocities arelarger for larger NPs due to the size exclusion of the NPs fromthe effectively repulsive PB as shown in Figure 11. At low xG,the NP probability density is determined by the adsorptionenergy, the larger particles with larger free energy of adsorptionhave a smaller probability to be located in the mobile solventbulk at any given moment. Thus, the mean velocities aresmaller for larger particles. When the adsorption is very strong,the NP velocity is nearly zero (Figure 12a I and II) but stilldecreases with the NP size. At the intermediate values of xG, theadsorption is weak, and the size dependence of ⟨vp⟩ arises fromboth size exclusion and adsorption effects, which approximatelycounter balance each other. Figure 12b shows the logarithmicvalues of NP retention times reduced by the solvent retentiontimes (τp/τs), which is the reciprocal of ⟨vp⟩ (eq 13). In allcases, the retention times in the adsorption regime indicate thatNPs are retained longer than the solvent (τp /τs > 1), whereasin the size exclusion regime, the solvent is retained longer (τp/τs< 1). In the transition regime, τp/τs ≈ 1 as shown in the insetsin Figure 12b, the solvent and NPs elute within anapproximately equal amount of time.The size exclusion mode of NP separation in the PB-grafted
channel realized at high fractions of good solvent is similar tothe conventional HDC with solid walls without PB. Asmentioned in section 2.3, one may expect that NP meanvelocity in the size exclusion mode approaches ⟨vp
HDC⟩ given byeq 10 with δ = RNP/(w − wPB). In Figure 12a, the ⟨vp⟩ valuesfor different NPs at xG = 0.99 in system 1 are 1.323, 1.387, and1.450 for NPs of radius 4Rc, 6Rc, and 8Rc, respectively. Usingthe values wPB = 21.1Rc and w = 70.4Rc, and using δ = RNP/(w
Figure 12. Transition from the size exclusion to adsorption regimes upon the decrease of solvent quality in systems (I) 1, (II) 2, and (III) 3. Thechannel half-width w = 70.43Rc = 50 nm. (a) Mean nanoparticle velocity ⟨vp⟩. (b) NP retention times reduced to solvent retention times τp/τs.. τp/τs< 1 in the size exclusion regime; τp/τs > 1 in the adsorption regime, and τp/τs ≈ 1 in the transition regime.
Langmuir Article
DOI: 10.1021/acs.langmuir.7b02914Langmuir 2018, 34, 1481−1496
1492
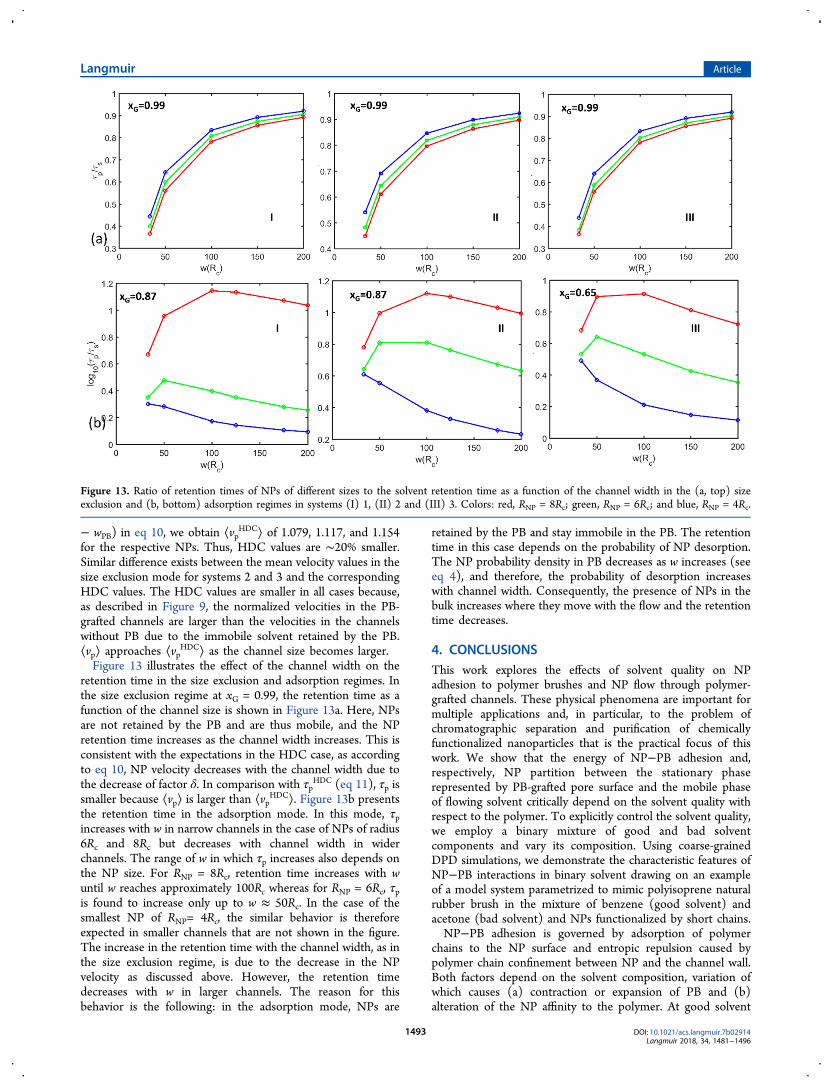
− wPB) in eq 10, we obtain ⟨vpHDC⟩ of 1.079, 1.117, and 1.154
for the respective NPs. Thus, HDC values are ∼20% smaller.Similar difference exists between the mean velocity values in thesize exclusion mode for systems 2 and 3 and the correspondingHDC values. The HDC values are smaller in all cases because,as described in Figure 9, the normalized velocities in the PB-grafted channels are larger than the velocities in the channelswithout PB due to the immobile solvent retained by the PB.⟨vp⟩ approaches ⟨vp
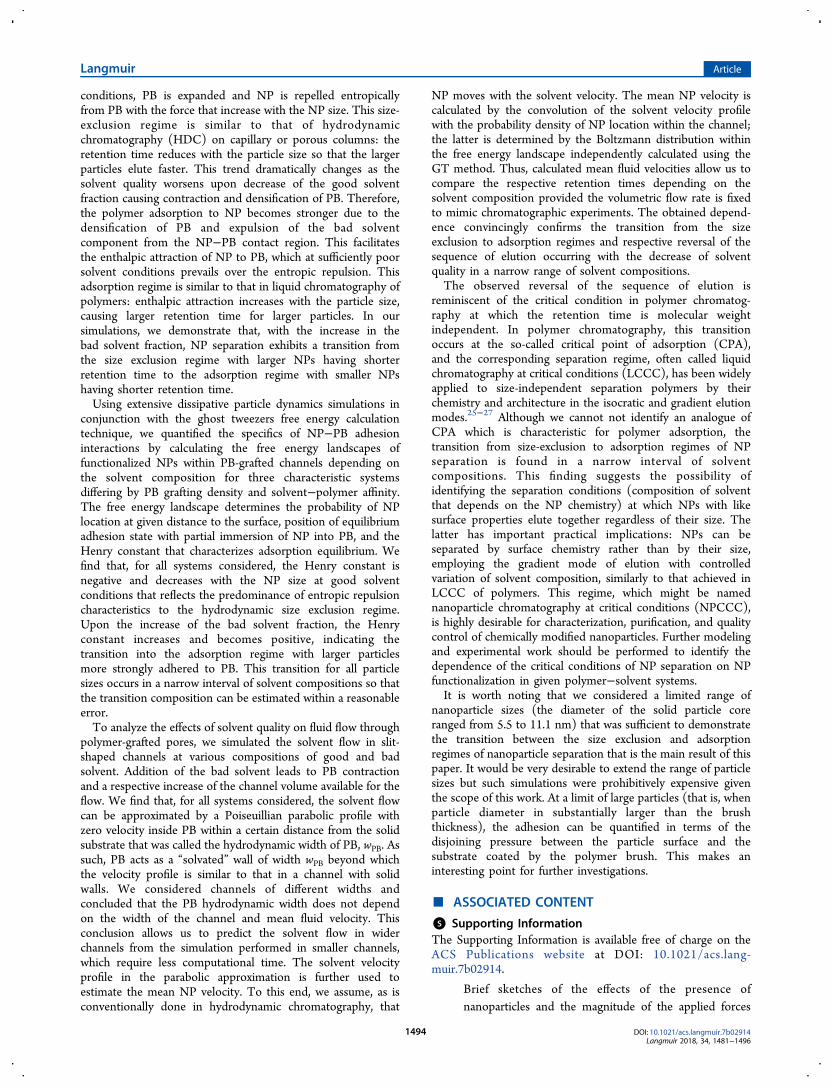
HDC⟩ as the channel size becomes larger.Figure 13 illustrates the effect of the channel width on the
retention time in the size exclusion and adsorption regimes. Inthe size exclusion regime at xG = 0.99, the retention time as afunction of the channel size is shown in Figure 13a. Here, NPsare not retained by the PB and are thus mobile, and the NPretention time increases as the channel width increases. This isconsistent with the expectations in the HDC case, as accordingto eq 10, NP velocity decreases with the channel width due tothe decrease of factor δ. In comparison with τp
HDC (eq 11), τp issmaller because ⟨vp⟩ is larger than ⟨vp
HDC⟩. Figure 13b presentsthe retention time in the adsorption mode. In this mode, τpincreases with w in narrow channels in the case of NPs of radius6Rc and 8Rc but decreases with channel width in widerchannels. The range of w in which τp increases also depends onthe NP size. For RNP = 8Rc, retention time increases with wuntil w reaches approximately 100Rc whereas for RNP = 6Rc, τpis found to increase only up to w ≈ 50Rc. In the case of thesmallest NP of RNP= 4Rc, the similar behavior is thereforeexpected in smaller channels that are not shown in the figure.The increase in the retention time with the channel width, as inthe size exclusion regime, is due to the decrease in the NPvelocity as discussed above. However, the retention timedecreases with w in larger channels. The reason for thisbehavior is the following: in the adsorption mode, NPs are
retained by the PB and stay immobile in the PB. The retentiontime in this case depends on the probability of NP desorption.The NP probability density in PB decreases as w increases (seeeq 4), and therefore, the probability of desorption increaseswith channel width. Consequently, the presence of NPs in thebulk increases where they move with the flow and the retentiontime decreases.
4. CONCLUSIONSThis work explores the effects of solvent quality on NPadhesion to polymer brushes and NP flow through polymer-grafted channels. These physical phenomena are important formultiple applications and, in particular, to the problem ofchromatographic separation and purification of chemicallyfunctionalized nanoparticles that is the practical focus of thiswork. We show that the energy of NP−PB adhesion and,respectively, NP partition between the stationary phaserepresented by PB-grafted pore surface and the mobile phaseof flowing solvent critically depend on the solvent quality withrespect to the polymer. To explicitly control the solvent quality,we employ a binary mixture of good and bad solventcomponents and vary its composition. Using coarse-grainedDPD simulations, we demonstrate the characteristic features ofNP−PB interactions in binary solvent drawing on an exampleof a model system parametrized to mimic polyisoprene naturalrubber brush in the mixture of benzene (good solvent) andacetone (bad solvent) and NPs functionalized by short chains.NP−PB adhesion is governed by adsorption of polymer
chains to the NP surface and entropic repulsion caused bypolymer chain confinement between NP and the channel wall.Both factors depend on the solvent composition, variation ofwhich causes (a) contraction or expansion of PB and (b)alteration of the NP affinity to the polymer. At good solvent
Figure 13. Ratio of retention times of NPs of different sizes to the solvent retention time as a function of the channel width in the (a, top) sizeexclusion and (b, bottom) adsorption regimes in systems (I) 1, (II) 2 and (III) 3. Colors: red, RNP = 8Rc; green, RNP = 6Rc; and blue, RNP = 4Rc.
Langmuir Article
DOI: 10.1021/acs.langmuir.7b02914Langmuir 2018, 34, 1481−1496
1493
conditions, PB is expanded and NP is repelled entropicallyfrom PB with the force that increase with the NP size. This size-exclusion regime is similar to that of hydrodynamicchromatography (HDC) on capillary or porous columns: theretention time reduces with the particle size so that the largerparticles elute faster. This trend dramatically changes as thesolvent quality worsens upon decrease of the good solventfraction causing contraction and densification of PB. Therefore,the polymer adsorption to NP becomes stronger due to thedensification of PB and expulsion of the bad solventcomponent from the NP−PB contact region. This facilitatesthe enthalpic attraction of NP to PB, which at sufficiently poorsolvent conditions prevails over the entropic repulsion. Thisadsorption regime is similar to that in liquid chromatography ofpolymers: enthalpic attraction increases with the particle size,causing larger retention time for larger particles. In oursimulations, we demonstrate that, with the increase in thebad solvent fraction, NP separation exhibits a transition fromthe size exclusion regime with larger NPs having shorterretention time to the adsorption regime with smaller NPshaving shorter retention time.Using extensive dissipative particle dynamics simulations in
conjunction with the ghost tweezers free energy calculationtechnique, we quantified the specifics of NP−PB adhesioninteractions by calculating the free energy landscapes offunctionalized NPs within PB-grafted channels depending onthe solvent composition for three characteristic systemsdiffering by PB grafting density and solvent−polymer affinity.The free energy landscape determines the probability of NPlocation at given distance to the surface, position of equilibriumadhesion state with partial immersion of NP into PB, and theHenry constant that characterizes adsorption equilibrium. Wefind that, for all systems considered, the Henry constant isnegative and decreases with the NP size at good solventconditions that reflects the predominance of entropic repulsioncharacteristics to the hydrodynamic size exclusion regime.Upon the increase of the bad solvent fraction, the Henryconstant increases and becomes positive, indicating thetransition into the adsorption regime with larger particlesmore strongly adhered to PB. This transition for all particlesizes occurs in a narrow interval of solvent compositions so thatthe transition composition can be estimated within a reasonableerror.To analyze the effects of solvent quality on fluid flow through
polymer-grafted pores, we simulated the solvent flow in slit-shaped channels at various compositions of good and badsolvent. Addition of the bad solvent leads to PB contractionand a respective increase of the channel volume available for theflow. We find that, for all systems considered, the solvent flowcan be approximated by a Poiseuillian parabolic profile withzero velocity inside PB within a certain distance from the solidsubstrate that was called the hydrodynamic width of PB, wPB. Assuch, PB acts as a “solvated” wall of width wPB beyond whichthe velocity profile is similar to that in a channel with solidwalls. We considered channels of different widths andconcluded that the PB hydrodynamic width does not dependon the width of the channel and mean fluid velocity. Thisconclusion allows us to predict the solvent flow in widerchannels from the simulation performed in smaller channels,which require less computational time. The solvent velocityprofile in the parabolic approximation is further used toestimate the mean NP velocity. To this end, we assume, as isconventionally done in hydrodynamic chromatography, that
NP moves with the solvent velocity. The mean NP velocity iscalculated by the convolution of the solvent velocity profilewith the probability density of NP location within the channel;the latter is determined by the Boltzmann distribution withinthe free energy landscape independently calculated using theGT method. Thus, calculated mean fluid velocities allow us tocompare the respective retention times depending on thesolvent composition provided the volumetric flow rate is fixedto mimic chromatographic experiments. The obtained depend-ence convincingly confirms the transition from the sizeexclusion to adsorption regimes and respective reversal of thesequence of elution occurring with the decrease of solventquality in a narrow range of solvent compositions.The observed reversal of the sequence of elution is
reminiscent of the critical condition in polymer chromatog-raphy at which the retention time is molecular weightindependent. In polymer chromatography, this transitionoccurs at the so-called critical point of adsorption (CPA),and the corresponding separation regime, often called liquidchromatography at critical conditions (LCCC), has been widelyapplied to size-independent separation polymers by theirchemistry and architecture in the isocratic and gradient elutionmodes.25−27 Although we cannot not identify an analogue ofCPA which is characteristic for polymer adsorption, thetransition from size-exclusion to adsorption regimes of NPseparation is found in a narrow interval of solventcompositions. This finding suggests the possibility ofidentifying the separation conditions (composition of solventthat depends on the NP chemistry) at which NPs with likesurface properties elute together regardless of their size. Thelatter has important practical implications: NPs can beseparated by surface chemistry rather than by their size,employing the gradient mode of elution with controlledvariation of solvent composition, similarly to that achieved inLCCC of polymers. This regime, which might be namednanoparticle chromatography at critical conditions (NPCCC),is highly desirable for characterization, purification, and qualitycontrol of chemically modified nanoparticles. Further modelingand experimental work should be performed to identify thedependence of the critical conditions of NP separation on NPfunctionalization in given polymer−solvent systems.It is worth noting that we considered a limited range of
nanoparticle sizes (the diameter of the solid particle coreranged from 5.5 to 11.1 nm) that was sufficient to demonstratethe transition between the size exclusion and adsorptionregimes of nanoparticle separation that is the main result of thispaper. It would be very desirable to extend the range of particlesizes but such simulations were prohibitively expensive giventhe scope of this work. At a limit of large particles (that is, whenparticle diameter in substantially larger than the brushthickness), the adhesion can be quantified in terms of thedisjoining pressure between the particle surface and thesubstrate coated by the polymer brush. This makes aninteresting point for further investigations.
■ ASSOCIATED CONTENT
*S Supporting InformationThe Supporting Information is available free of charge on theACS Publications website at DOI: 10.1021/acs.lang-muir.7b02914.
Brief sketches of the effects of the presence ofnanoparticles and the magnitude of the applied forces
Langmuir Article
DOI: 10.1021/acs.langmuir.7b02914Langmuir 2018, 34, 1481−1496
1494

on the solvent velocity profiles, iteration procedure forestimating the hydrodynamic PB thickness, anddefinition and numerical values of the geometricalthickness of PBs (PDF)
■ AUTHOR INFORMATION
Corresponding Author*E-mail: [email protected].
ORCIDAlexander V. Neimark: 0000-0001-6817-737XNotesThe authors declare no competing financial interest.
■ ACKNOWLEDGMENTS
This work was funded by the National Science FoundationCBET grant “GOALI: Theoretical Foundations of InteractionNanoparticle Chromatography”, No. 510993, and usedcomputational resources of Extreme Science and EngineeringDiscovery Environment (XSEDE) supported by the NationalScience Foundation Grant ACI-1548562.
■ REFERENCES(1) Peer, D.; Karp, J. M.; Hong, S.; Farokhzad, O. C.; Margalit, R.;Langer, R. Nanocarriers as an emerging platform for cancer therapy.Nat. Nanotechnol. 2007, 2 (12), 751−760.(2) Roy, I.; Ohulchanskyy, T. Y.; Pudavar, H. E.; Bergey, E. J.;Oseroff, A. R.; Morgan, J.; Dougherty, T. J.; Prasad, P. N. Ceramic-Based Nanoparticles Entrapping Water-Insoluble PhotosensitizingAnticancer Drugs: A Novel Drug−Carrier System for PhotodynamicTherapy. J. Am. Chem. Soc. 2003, 125 (26), 7860−7865.(3) Tanaka, K.; Chujo, Y. Design of functionalized nanoparticles forthe applications in nanobiotechnology. Adv. Powder Technol. 2014, 25(1), 101−113.(4) Anker, J. N.; Hall, W. P.; Lyandres, O.; Shah, N. C.; Zhao, J.; VanDuyne, R. P. Biosensing with plasmonic nanosensors. Nat. Mater.2008, 7 (6), 442−453.(5) Klajn, R.; Browne, K. P.; Soh, S.; Grzybowski, B. A. NanoparticlesThat “Remember” Temperature. Small 2010, 6 (13), 1385−1387.(6) Nakanishi, H.; Grzybowski, B. A. Supercapacitors Based on MetalElectrodes Prepared from Nanoparticle Mixtures at Room Temper-ature. J. Phys. Chem. Lett. 2010, 1 (9), 1428−1431.(7) Bliznyuk, V.; Ruhstaller, B.; Brock, P. J.; Scherf, U.; Carter, S. A.Self-Assembled Nanocomposite Polymer Light-Emitting Diodes withImproved Efficiency and Luminance. Adv. Mater. 1999, 11 (15),1257−1261.(8) Park, J. H.; Lim, Y. T.; Park, O. O.; Kim, J. K.; Yu, J.-W.; Kim, Y.C. Polymer/Gold Nanoparticle Nanocomposite Light-EmittingDiodes: Enhancement of Electroluminescence Stability and QuantumEfficiency of Blue-Light-Emitting Polymers. Chem. Mater. 2004, 16(4), 688−692.(9) Hasobe, T.; Imahori, H.; Kamat, P. V.; Ahn, T. K.; Kim, S. K.;Kim, D.; Fujimoto, A.; Hirakawa, T.; Fukuzumi, S. Photovoltaic CellsUsing Composite Nanoclusters of Porphyrins and Fullerenes withGold Nanoparticles. J. Am. Chem. Soc. 2005, 127 (4), 1216−1228.(10) Sun, B.; Marx, E.; Greenham, N. C. Photovoltaic Devices UsingBlends of Branched CdSe Nanoparticles and Conjugated Polymers.Nano Lett. 2003, 3 (7), 961−963.(11) Tseng, R. J.; Tsai, C.; Ma, L.; Ouyang, J.; Ozkan, C. S.; Yang, Y.Digital memory device based on tobacco mosaic virus conjugated withnanoparticles. Nat. Nanotechnol. 2006, 1 (1), 72−77.(12) Ayres, N. Polymer brushes: Applications in biomaterials andnanotechnology. Polym. Chem. 2010, 1 (6), 769−777.(13) Kreer, T. Polymer-brush lubrication: a review of recenttheoretical advances. Soft Matter 2016, 12 (15), 3479−3501.
(14) Prokhorova, S. A.; Kopyshev, A.; Ramakrishnan, A.; Zhang, H.;Ruhe, J. Can polymer brushes induce motion of nano-objects?Nanotechnology 2003, 14 (10), 1098.(15) Arita, T.; Yoshimura, T.; Adschiri, T. Size exclusionchromatography of quantum dots by utilizing nanoparticle repellingsurface of concentrated polymer brush. Nanoscale 2010, 2 (8), 1467−1473.(16) Wei, G.-T.; Liu, F.-K. Separation of nanometer gold particles bysize exclusion chromatography. J. Chromatogr. A 1999, 836 (2), 253−260.(17) Striegel, A. M.; Brewer, A. K. Hydrodynamic Chromatography.Annu. Rev. Anal. Chem. 2012, 5 (1), 15−34.(18) Malysheva, A.; Lombi, E.; Voelcker, N. H. Bridging the dividebetween human and environmental nanotoxicology. Nat. Nanotechnol.2015, 10 (10), 835−844.(19) Kowalczyk, B.; Lagzi, I.; Grzybowski, B. A. Nanoseparations:Strategies for size and/or shape-selective purification of nanoparticles.Curr. Opin. Colloid Interface Sci. 2011, 16 (2), 135−148.(20) Lee, J.-S.; Stoeva, S. I.; Mirkin, C. A. DNA-Induced Size-Selective Separation of Mixtures of Gold Nanoparticles. J. Am. Chem.Soc. 2006, 128 (27), 8899−8903.(21) Albanese, A.; Tang, P. S.; Chan, W. C. W. The Effect ofNanoparticle Size, Shape, and Surface Chemistry on BiologicalSystems. Annu. Rev. Biomed. Eng. 2012, 14 (1), 1−16.(22) Kim, S. T.; Saha, K.; Kim, C.; Rotello, V. M. The Role of SurfaceFunctionality in Determining Nanoparticle Cytotoxicity. Acc. Chem.Res. 2013, 46 (3), 681−691.(23) Paget, V.; Dekali, S.; Kortulewski, T.; Grall, R.; Gamez, C.;Blazy, K.; Aguerre-Chariol, O.; Chevillard, S.; Braun, A.; Rat, P.;Lacroix, G. Specific Uptake and Genotoxicity Induced by PolystyreneNanobeads with Distinct Surface Chemistry on Human LungEpithelial Cells and Macrophages. PLoS One 2015, 10 (4), e0123297.(24) Guttman, C. M.; Di Marzio, E. A.; Douglas, J. F. Influence ofPolymer Architecture and Polymer−Surface Interaction on the ElutionChromatography of Macromolecules through a Microporous Media.Macromolecules 1996, 29 (17), 5723−5733.(25) Brun, Y. The Mechanism of Copolymer Retention in InteractivePolymer Chromatography. I. Critical Point of Adsorption forStatistical Copolymers. J. Liq. Chromatogr. Relat. Technol. 1999, 22(20), 3027−3065.(26) Brun, Y. The Mechanism of Copolymer Retention in InteractivePolymer Chromatography. II. Gradient Separation. J. Liq. Chromatogr.Relat. Technol. 1999, 22 (20), 3067−3090.(27) Brun, Y.; Alden, P. Gradient separation of polymers at criticalpoint of adsorption. J. Chromatogr. A 2002, 966 (1−2), 25−40.(28) Marko, J. F. Polymer brush in contact with a mixture of solvents.Macromolecules 1993, 26 (2), 313−319.(29) Cimino, R. T.; Rasmussen, C. J.; Brun, Y.; Neimark, A. V.Critical conditions of polymer adsorption and chromatography onnon-porous substrates. J. Colloid Interface Sci. 2016, 474, 25−33.(30) Cimino, R. T.; Rasmussen, C. J.; Brun, Y.; Neimark, A. V.Mechanisms of chain adsorption on porous substrates and criticalconditions of polymer chromatography. J. Colloid Interface Sci. 2016,481, 181−193.(31) Halperin, A.; Kroger, M.; Zhulina, E. B. Colloid-BrushInteractions: The Effect of Solvent Quality. Macromolecules 2011, 44(9), 3622−3638.(32) Zhang, X.; Chen, Y.; Qu, L.; Yan, D. Effects of attractive colloidson the phase separation behaviors of binary polymer blends. J. Chem.Phys. 2013, 139 (7), 074902.(33) Lewis, T.; Ganesan, V. Interactions between Grafted CationicDendrimers and Anionic Bilayer Membranes. J. Phys. Chem. B 2013,117 (33), 9806−9820.(34) LoVerso, F.; Egorov, S. A.; Binder, K. Interaction BetweenPolymer Brush-Coated Spherical Nanoparticles: Effect of SolventQuality. Macromolecules 2012, 45 (21), 8892−8902.(35) Surve, M.; Pryamitsyn, V.; Ganesan, V. Polymer-bridged gels ofnanoparticles in solutions of adsorbing polymers. J. Chem. Phys. 2006,125 (6), 064903.
Langmuir Article
DOI: 10.1021/acs.langmuir.7b02914Langmuir 2018, 34, 1481−1496
1495
(36) Chen, K.; Ma, Y.-q. Interactions between Colloidal ParticlesInduced by Polymer Brushes Grafted onto the Substrate. J. Phys. Chem.B 2005, 109 (37), 17617−17622.(37) Egorov, S. A.; Binder, K. Effect of solvent quality on thedispersibility of polymer-grafted spherical nanoparticles in polymersolutions. J. Chem. Phys. 2012, 137 (9), 094901.(38) Guskova, O. A.; Pal, S.; Seidel, C. Organization of nanoparticlesat the polymer brush-solvent interface. Europhys. Lett. 2009, 88 (3),38006.(39) Kim, J. U.; Matsen, M. W. Repulsion Exerted on a SphericalParticle by a Polymer Brush. Macromolecules 2008, 41 (1), 246−252.(40) Zhang, Q.; Xiang, X. Adsorption of a spherical nanoparticle inpolymer brushes: Brownian dynamics investigation. Phys. A 2013, 392(18), 3857−3862.(41) Curk, T.; Martinez-Veracoechea, F. J.; Frenkel, D.; Dobnikar, J.Collective ordering of colloids in grafted polymer layers. Soft Matter2013, 9 (23), 5565−5571.(42) Romeis, D.; Sommer, J.-U. Conformational switching ofmodified guest chains in polymer brushes. J. Chem. Phys. 2013, 139(4), 044910.(43) Vogiatzis, G. G.; Theodorou, D. N. Structure of Polymer LayersGrafted to Nanoparticles in Silica−Polystyrene Nanocomposites.Macromolecules 2013, 46 (11), 4670−4683.(44) Murat, M.; Grest, G. S. Molecular Dynamics Simulations of theForce between a Polymer Brush and an AFM Tip. Macromolecules1996, 29 (25), 8282−8284.(45) Milchev, A.; Dimitrov, D. I.; Binder, K. Excess free energy ofnanoparticles in a polymer brush. Polymer 2008, 49 (17), 3611−3618.(46) Bonet Avalos, J.; Johner, A.; Dıez-Orrite, S. Analysis of polymeradsorption onto colloidal particles. Eur. Phys. J. E: Soft Matter Biol.Phys. 2006, 21 (4), 305−317.(47) Yang, S.; Yan, D. D.; Shi, A. C. Structure of adsorbed polymerson a colloid particle. Macromolecules 2006, 39 (12), 4168−4174.(48) Merlitz, H.; Wu, C. X.; Sommer, J. U. Inclusion Free Energy ofNanoparticles in Polymer Brushes. Macromolecules 2012, 45 (20),8494−8501.(49) Cheng, J.; Vishnyakov, A.; Neimark, A. V. MorphologicalTransformations in Polymer Brushes in Binary Mixtures: DPD Study.Langmuir 2014, 30 (43), 12932−12940.(50) Hua, Y.; Zhang, D.; Zhang, L. Compression-driven migration ofnanoparticles in semiflexible polymer brushes. Polymer 2016, 83, 67−76.(51) Nasrabad, A. E.; Jasnow, D.; Zilman, A.; Coalson, R. D. Precisecontrol of polymer coated nanopores by nanoparticle additives:Insights from computational modeling. J. Chem. Phys. 2016, 145 (6),064901.(52) Cao, Q. Q.; Zuo, C. C.; Li, L. J.; Li, Y. J.; Yang, Y. Translocationof nanoparticles through a polymer brush-modified nanochannel.Biomicrofluidics 2012, 6 (3), 10.(53) Cheng, J.; Vishnyakov, A.; Neimark, A. V. Adhesion ofnanoparticles to polymer brushes studied with the ghost tweezersmethod. J. Chem. Phys. 2015, 142 (3), 034705.(54) Espanol, P.; Warren, P. Statistical Mechanics of DissipativeParticle Dynamics. Europhys. Lett. 1995, 30 (4), 191.(55) Groot, R. D.; Warren, P. B. Dissipative particle dynamics:Bridging the gap between atomistic and mesoscopic simulation. J.Chem. Phys. 1997, 107 (11), 4423−4435.(56) Vishnyakov, A.; Talaga, D. S.; Neimark, A. V. DPD Simulationof Protein Conformations: From α-Helices to β-Structures. J. Phys.Chem. Lett. 2012, 3 (21), 3081−3087.(57) Plimpton, S. Fast Parallel Algorithms for Short-Range MolecularDynamics. J. Comput. Phys. 1995, 117 (1), 1−19.(58) Humphrey, W.; Dalke, A.; Schulten, K. VMD: Visual moleculardynamics. J. Mol. Graphics 1996, 14 (1), 33−38.(59) Matthews, J. N. A. Commercial optical traps emerge frombiophysics labs. Phys. Today 2009, 62 (2), 26−28.(60) Yang, S.; Neimark, A. V. Critical conditions of polymerchromatography: An insight from SCFT modeling. J. Chem. Phys.2013, 138 (24), 244903.
(61) DiMarzio, E. A.; Guttman, C. M. Separation by Flow.Macromolecules 1970, 3 (2), 131−146.(62) Small, H. Hydrodynamic chromatography a technique for sizeanalysis of colloidal particles. J. Colloid Interface Sci. 1974, 48 (1), 147−161.(63) Brenner, H.; Gaydos, L. J. The constrained brownian movementof spherical particles in cylindrical pores of comparable radius. J.Colloid Interface Sci. 1977, 58 (2), 312−356.(64) Prieve, D. C.; Hoysan, P. M. Role of colloidal forces inhydrodynamic chromatography. J. Colloid Interface Sci. 1978, 64 (2),201−213.(65) Baker, S. M.; Smith, G. S.; Anastassopoulos, D. L.;Toprakcioglu, C.; Vradis, A. A.; Bucknall, D. G. Structure of PolymerBrushes under Shear Flow in a Good Solvent. Macromolecules 2000, 33(4), 1120−1122.(66) Ivkov, R.; Butler, P. D.; Satija, S. K.; Fetters, L. J. Effect ofSolvent Flow on a Polymer Brush: A Neutron Reflectivity Study of theBrush Height and Chain Density Profile. Langmuir 2001, 17 (10),2999−3005.
Langmuir Article
DOI: 10.1021/acs.langmuir.7b02914Langmuir 2018, 34, 1481−1496
1496