Adequacy of Frequency Reserves for High Wind Power Generation€¦ · Adequacy of Frequency...
35
General rights Copyright and moral rights for the publications made accessible in the public portal are retained by the authors and/or other copyright owners and it is a condition of accessing publications that users recognise and abide by the legal requirements associated with these rights. Users may download and print one copy of any publication from the public portal for the purpose of private study or research. You may not further distribute the material or use it for any profit-making activity or commercial gain You may freely distribute the URL identifying the publication in the public portal If you believe that this document breaches copyright please contact us providing details, and we will remove access to the work immediately and investigate your claim. Downloaded from orbit.dtu.dk on: Jun 08, 2020 Adequacy of Frequency Reserves for High Wind Power Generation Das, Kaushik; Litong-Palima, Marisciel; Maule, Petr; Altin, Müfit; Hansen, Anca Daniela; Sørensen, Poul Ejnar; Abildgaard, Hans Published in: I E T Renewable Power Generation Link to article, DOI: 10.1049/iet-rpg.2016.0501 Publication date: 2017 Document Version Early version, also known as pre-print Link back to DTU Orbit Citation (APA): Das, K., Litong-Palima, M., Maule, P., Altin, M., Hansen, A. D., Sørensen, P. E., & Abildgaard, H. (2017). Adequacy of Frequency Reserves for High Wind Power Generation. I E T Renewable Power Generation, 11(8), 1286-1294. https://doi.org/10.1049/iet-rpg.2016.0501
Transcript of Adequacy of Frequency Reserves for High Wind Power Generation€¦ · Adequacy of Frequency...
General rights Copyright and moral rights for the publications made accessible in the public portal are retained by the authors and/or other copyright owners and it is a condition of accessing publications that users recognise and abide by the legal requirements associated with these rights.
Users may download and print one copy of any publication from the public portal for the purpose of private study or research.
You may not further distribute the material or use it for any profit-making activity or commercial gain
You may freely distribute the URL identifying the publication in the public portal If you believe that this document breaches copyright please contact us providing details, and we will remove access to the work immediately and investigate your claim.
Downloaded from orbit.dtu.dk on: Jun 08, 2020
Adequacy of Frequency Reserves for High Wind Power Generation
Das, Kaushik; Litong-Palima, Marisciel; Maule, Petr; Altin, Müfit; Hansen, Anca Daniela; Sørensen, PoulEjnar; Abildgaard, Hans
Published in:I E T Renewable Power Generation
Link to article, DOI:10.1049/iet-rpg.2016.0501
Publication date:2017
Document VersionEarly version, also known as pre-print
Link back to DTU Orbit
Citation (APA):Das, K., Litong-Palima, M., Maule, P., Altin, M., Hansen, A. D., Sørensen, P. E., & Abildgaard, H. (2017).Adequacy of Frequency Reserves for High Wind Power Generation. I E T Renewable Power Generation, 11(8),1286-1294. https://doi.org/10.1049/iet-rpg.2016.0501

Associate Editor
Comments to Author :
(1)This paper illustrates that power forecasts for different time scales as well as available
wind power in real-time are modeled for future European wind power scenarios of 2020 and
2030. The reviewer suggests that the authors provide more details on the theoretical derivation.
For example, the explanation of Figs. 5 and 7 need to be improved. The reviewer also suggests
the authors include more simulation results in the Section of System Studies. For example,
compare the performance of the proposed technique with the existing work.
(2) Reducing the power output of wind farm will certainly decrease the economic benefit of wind
farms. The corcerned discussion will be welcome.
Authors sincerely thanks the editor for the feedback. Based on the feedback following changes are
made:
1) More theoretical derivations are included. Figure 5 and 7 are simplified for better understanding
and explained in a lucid manner.
2) Performance of the algorithm is compared with one of the existing methodology in the
literature. This existing methodology is also discussed.
3) More literature that is relevant are added. One of the existing methodology is discussed in
details and performance of the algorithm is compared with this methodology.
4) This paper is concerned on volume of reserve required and not on sources of reserves. Reserves
can be provided from any kind of generation sources and not necessarily wind power plants. A
discussion is included in this regard in the paper.
Reviewer: 1
Comments to the Author
This paper illustrates that power forecasts for different time scales as well as available wind power in
real-time are modeled for future European wind power scenarios of 2020 and 2030. The reviewer
suggests that the authors provide more details on the theoretical derivation. For example, the
explanation of Figs. 5 and 7 need to be improved. The reviewer also suggests the authors include more
simulation results in the Section of System Studies. For example, compare the performance of the
proposed technique with the existing work
Authors sincerely thanks the reviewer for the review. Based on the review following changes are made:
1) More theoretical derivations are included. Figure 5 and 7 are simplified for better understanding
and explained in a lucid manner.
2) Performance of the algorithm is compared with one of the existing methodology in the
literature. This existing methodology is also discussed.
Page 1 of 34
IET Review Copy Only
IET Renewable Power GenerationThis article has been accepted for publication in a future issue of this journal, but has not been fully edited.
Content may change prior to final publication in an issue of the journal. To cite the paper please use the doi provided on the Digital Library page.

Reviewer: 2
Comments to the Author
This paper researchs the reserve capacity estimation of wind farms to handle the wind power forecast
error. The paper is well written and the topic is very meaningful. However, I have the following
comments that may help improve this manuscript.
1) Are there any literatures that discuss the wind power reserve capacity estimation? The reference
may be more complete if the corcerned literature can be added.
2) Reducing the power output of wind farm will certainly decrease the economic benefit of wind farms.
The corcerned discussion will be welcome.
Authors sincerely thanks the reviewer for the review. Based on the review following changes are made:
1) More literature that is relevant are added. One of the existing methodology is discussed in
details and performance of the algorithm is compared with this methodology.
2) This paper is concerned on volume of reserve required and not on sources of reserves. Reserves
can be provided from any kind of generation sources and not necessarily wind power plants. A
discussion is included in this regard in the paper.
Reviewer: 3
Comments to the Author
This paper presents an application of reserve estimation on frequency restoration under the background
of future wind integration in EU. However, the reviewer is not fully convinced by the academic and
practical quality of the paper. The reasons are as follows:
1. The algorithm proposed in Equ(1), Fig. 6 and Fig. 7 is nothing novel. They are based on current
industrial standards.
2. A setting of a cross-border AGC is quite complicated. The requirements on frequency deviation
are mostly relying on the transient process of frequency restoration, such as Fig. 1. However, the model
introduced in Section II is a simulation tool to represent normal wind power fluctuation based on
averaged weather forecasting. This kind of fluctuation is very hard to cause any frequency incident on an
integrated power system.
3. Therefore, in real market, the major reserve is for hourly/daily power imbalance. And, yes, there
is a chance of participating in secondary control. But the reserve quantity is relatively much small.
4. The simulation is also not clear enough. How is the EU power system look like? What is general
capacity overview of system. Why are there differences of different countries?
Authors thanks the reviewer for the review. Based on the review following discussions are made:
1) Authors can’t find any algorithm that estimates the reserve requirements for wind power
forecast errors for future European power system. The aim and novelty of this methodology has
been to estimate the adequacy of reserves for wind power imbalance based on TSO practice,
therefore, industry standards are followed.
Page 2 of 34
IET Review Copy Only
IET Renewable Power GenerationThis article has been accepted for publication in a future issue of this journal, but has not been fully edited.
Content may change prior to final publication in an issue of the journal. To cite the paper please use the doi provided on the Digital Library page.

2) In future European power systems with high penetration of wind power, there can be ramping
of high amount of power in 10-15 minutes. For example, a storm can disconnect a large wind
farm in this time. This imbalance need to be handled with operating reserves. Since, RR may be
slow enough to participate in balancing, FRR needs to be activated by AGC. If FRR is not
sufficient, FCR will be activated. FCR are designed to handle unforeseen contingencies and not
ramping imbalances from wind power generations. Therefore, FRR should be dimensioned
properly to prevent utilization of expensive FCR.
In present scenario (also in 2020 scenario as shown in the paper), this is not a problem.
However, it may be a problem in 2030 scenario. Wind fluctuations may cause using up of FRR
resulting in frequency incidents.
These discussions have been added in the paper.
3) Imbalance based on hourly forecast error has been studied in this paper. Yes, the reserve
quantity is small in present scenario. The motivation of this paper is to assess whether this small
amount of reserves will be enough for future wind power scenarios mainly for countries with
high penetration of wind power generation (eg. Denmark, Germany etc.)
4) The differences in different countries are due to difference in wind power installation and loads.
Figure 4 is modified to address this issue.
Page 3 of 34
IET Review Copy Only
IET Renewable Power GenerationThis article has been accepted for publication in a future issue of this journal, but has not been fully edited.
Content may change prior to final publication in an issue of the journal. To cite the paper please use the doi provided on the Digital Library page.
Adequacy of Frequency Reserves for High Wind Power Generation
Kaushik Das1,*, Marisciel Litong-Palima1, Petr Maule1, Mufit Altin1, Anca D Hansen1, Poul ESørensen1, Hans Abildgaard2
1Wind Energy, Technical University of Denmark, Risø, Roskilde, 4000 Denmark2Energinet.Dk, Fredericia, Denmark*[email protected]
Abstract: In this article, a new methodology is developed to assess the adequacy of frequency re-serves to handle power imbalances caused by wind power forecast errors. The goal of this method-ology is to estimate the adequate volume and speed of activation of frequency reserves required tohandle power imbalances caused due to high penetration of wind power. An algorithm is proposedand developed to estimate the power imbalances due to wind power forecast error following acti-vation of different operating reserves. Frequency containment reserve requirements for mitigatingthese power imbalances are developed through this methodology. Furthermore, the probability ofreducing this frequency containment reserve requirement is investigated through this methodol-ogy with activation of different volumes and speed of frequency restoration reserve. Wind powergeneration for 2020 and 2030 scenarios for Continental Europe network are investigated based onwhich recommendations are made for requirements of frequency reserves in these scenarios. It hasbeen observed through simulations that frequency containment reserve requirements reduce expo-nentially with increase in volume of frequency restoration reserve and remains almost unaffectedby increase activation speed of frequency restoration reserve.
1. Introduction
Wind energy will increasingly make larger contributions to electricity generation throughout theworld. It is expected that wind energy will meet 15.7% and 28.5% of European electricity con-sumption in 2020 and 2030 respectively [1]. In order to operate power systems in reliable, securedmanner and with stable frequency; generation should always be able to match demand in the sys-tem. There are many uncertainties in the system, namely uncertainties due to outages, load, gener-ation, topology, weather etc. Generally, these uncertainties are handled with the help of operatingreserves. However, if the reserves are not sufficient to contain the frequency change, the system isdriven into emergency situation activating defence plans [2, 3, 4].
There are different nomenclatures for operating reserves. In Union for the Co-ordination ofTransmission of Electricity (UCTE) operation handbook [5], different operating reserves were re-ferred to as primary reserves, secondary reserves and tertiary reserves based on the type of controlused to stabilize the frequency of the network. These reserves are referred as frequency con-tainment reserves, frequency restoration reserves and replacement reserves based on their func-tionalities in current European Commission guideline on electricity transmission system operation[6]. Whereas, operating reserves are classified as automatic active reserve (Frequency controlled
1
Page 4 of 34
IET Review Copy Only
IET Renewable Power GenerationThis article has been accepted for publication in a future issue of this journal, but has not been fully edited.
Content may change prior to final publication in an issue of the journal. To cite the paper please use the doi provided on the Digital Library page.

normal operation reserve and Frequency controlled disturbance reserve), fast active disturbancereserve, slow active disturbance reserve and reactive reserve in Nordic Grid Code [7]. Milliganet. al. [8] provides a comprehensive overview of different nomenclatures of operating reservesused in different regions. In this paper, the convention of frequency containment reserves (FCR),frequency restoration reserves (FRR) and replacement reserves (RR) are followed.
In the future European power systems, wind power generation will have higher contributionresulting in an increase in uncertainties in the system. The uncertainty in wind power generationmainly comes from wind power forecast error resulting in power imbalances. In general powerimbalances are managed and mitigated significantly by the balance responsible parties, however,fast and short term imbalances are handled by the operating frequency reserves. The accuracyof the wind forecast improves as time horizon is closer to the operation time. Therefore, thetransmission system operators(TSOs) at the control center can take better decisions to reduce theimbalance closer to the real time operation. Closer to real-time operation operators can predictimbalance prognoses with reduced forecast error based on which they can activate slow and manualRR. The remaining imbalance, if substantial, are handled by short-term FCR and FRR throughprimary and secondary controls respectively. These limited short-term reserves are replenished byRR. FCR and FRR are traditionally dimensioned in order to handle the imbalances caused due toany unforeseen contingency as well as to handle the market driven deterministic deviations andstochastic nature of the load. Short-term reserves specially FCR are designed to handle unforeseencontingencies and not ramping imbalances from wind power generations. Therefore, it is veryimportant to note that the reserves utilized to meet imbalance due to wind power generation willreduce the available reserve to handle other imbalances such as contingency as per n-1 securityconstraint. In past, many studies have been performed regarding requirements of operating reserveswith integration of wind power generation. Ela et. al. [9] and Milligan et. al. [8] providecomprehensive review of operating reserve requirements with integration of variable generations.Ela et. al. [10] and Holttinen et. al. [11] discuss about determination of requirements of operatingreserves with integration of wind power generation. Kiviluoma et. al. [12], Botterud et. al. [13],discuss impacts of wind power integration in operating reserve requirements from power systemmarket and unit commitment point of view. Menemenlis et. al. [14] show the advantages ofusing dynamic operating balancing reserve at time horizon of 1-48 hours over static reserves withintegration of wind power. Authors of this paper have discussed the possible challenges faced byfuture power systems with high wind power scenarios due to errors in wind forecast [15].
However, these methods provided in literature do not estimate the reserve requirements basedon wind power time-series. As a result the ramp up and ramp down of wind power are not con-sidered in these available methods in literature. Sorensen et. al. [16] deals with wind powerfluctuations from a wind farm in the time range between one minute and up to a couple of hours.Sorensen et. al. [16, 17] and Parsons et. al. [18] provide methods for determining the need forsystem generation reserves due to wind power fluctuations based on the ramping characteristicsof the wind farm at different power levels. However, these methods do not incorporate the deci-sions taken by the operators based on the prognose of wind power imbalance. In this paper, a newmethodology for estimation of reserves is compared with the ramp rate based reserve estimationmethod from [16]. The goal of this paper is to develop a new methodology to assess the adequacyof frequency reserves to handle power imbalances caused by wind power forecast errors for powersystems with high wind power penetration. This methodology estimates wind power imbalancesconsidering activation of FRR and RR. Following which the probabilistic risk of FCR require-ments exceeding the design FCR limits for mitigating these power imbalances are estimated. The
2
Page 5 of 34
IET Review Copy Only
IET Renewable Power GenerationThis article has been accepted for publication in a future issue of this journal, but has not been fully edited.
Content may change prior to final publication in an issue of the journal. To cite the paper please use the doi provided on the Digital Library page.

possibility of reducing this risk is further investigated for different volumes and speed of FRR acti-vation. Wind power generation for 2020 and 2030 scenarios for Continental Europe (CE) networkare investigated using this methodology based on which recommendations are provided for futurewind power scenarios in CE network.
The structure of the paper is as following: Section 2 describes different types of frequencyreserves for ENTSO-E networks. Section 3 presents the proposed methodology for estimation ofadequacy of reserves. Section 4 demonstrates the implementation of proposed methodology forCE Network for wind power scenarios of 2020 and 2030. Finally, section 5 concludes the articleand provides direction for future research.
2. Frequency Reserves
It is the responsibility of each TSO to maintain the frequency of their own control area within apredefined range as well as to honour the inter-area power transfer commitment. Therefore, when-ever there is an imbalance in generation and load in own control area, the imbalance is handledusing FRR. However, it should be noted that FRR activation can also be manual as it is in Nordicsynchronous network. Whereas in some synchronous networks like CE, FRR activation is typi-cally through automatic Load Frequency Control (LFC). Nevertheless, the general activation timerequirement for FRR activation is that it should be fast enough to restore the frequency back toits nominal value ranging from seconds to minutes. Full FRR activation is required to be donewithin 15 minutes for CE and Nordic network and 10 minutes for UK network [19]. The maxi-mum volume of FRR is limited based on agreements and decided based on maximum anticipatedload combined with statistical evaluation of the deviations in the specific control area. Thereforereplenishment of activated FRR is required in order to handle further power imbalances in thesystem. This function is achieved through RR activation. Generally, RR are activated manuallyby the operators and therefore takes 10-15 minutes for activation. Whenever there are imbalanceprognoses in the system, the operators take decisions on RR activations. Based on these decisions,RR are activated. The rational for activating RR based on prognoses is to take time delays betweendecision and real-time activation process of these reserves into account.
However, since there is a delay of few minutes before FRR is fully deployed, power imbalancesare handled instantaneously using FCR. The purpose of FCR is to contain the system frequencydeviation following a large disturbance within a pre-defined range. Generally, FCR are activatedwithin 30s after the disturbance [5] and the volume of FCR are designed based on certain referenceincident like dimensional fault. Currently, the required volume of FCR for CE network is 3000MW.
Automatic FRR are more expensive than manual FRR and RR, but cheaper than FCR. There-fore, it should always be tried to limit FCR dimension by activating more FRR and RR if required.It is important to note that traditionally all the reserves are deployed from conventional genera-tors. However, in future European power systems with large penetration of wind power plants(WPP), reserves can also be deployed from WPPs. Although, in order to provide negative reservesWPPs may need to be downregulated. Downregulation of WPP incurs financial loss since maxi-mum available power is not produced. However, the work in this paper is concerned on volume ofreserve required and not on sources of reserves.
3
Page 6 of 34
IET Review Copy Only
IET Renewable Power GenerationThis article has been accepted for publication in a future issue of this journal, but has not been fully edited.
Content may change prior to final publication in an issue of the journal. To cite the paper please use the doi provided on the Digital Library page.

3. Methodology
3.1. Existing Ramp Rate based Reserve Estimation Method [16, 18]
The definition of reserve requirements applied by Sorensen et. al. [16] are based on the definitionof regulation applied by Parson et al. [18]. In this method, reserve requirements are quantifiedbased on wind power ramping rates which is defined as the difference between the initial meanvalue of any considered period and the minimum value in the next period.
P reserven,i = Pmean
n,i − Pminn−1,i (1)
• P reserven,i : Reserve requirements for time window n for each control area i
• Pmeann,i : Mean power generation for time window n for each control area i
• Pminn−1,i: Minimum power generation for time window n for each control area i
Generally, time window n for ramp rate is chosen as 10-15 minutes. Therefore, it is expectedthat FRR will handle this kind of imbalance. FRR is dimensioned in this method so that FRR canhandle 99 percentile of imbalance P reserve
n,i for each control area as given in Equation 1. In thiswork, n is chosen as 15 minutes.
Pr[|P reservei | > Ri] < 0.01 (2)
• Ri: Recommendation for FRR for control area i in MW
Notice that FRR size Ri for each control area i will vary substantially since wind power gener-ation scenario varies largely for different control areas. In order to compare this existing methodwith proposed method in this paper maximum of the ratio of Ri to present dimension of FRR isconsidered and denoted as Kwind,ramp.
Kwind,ramp = Max[Ri
Rpresent,i
] (3)
• Kwind,ramp: Ratio of FRR dimension in future wind power scenario as compared to presentsystem based on existing ramp rate based reserve estimation method [16] in p.u.
• Rpresent: Dimensioning of FRR for control area i in MW as it is in present system
This method is conservative method. This method does not consider the details of activationof RR based on wind power forecast. Furthermore, in this method FRR are dimensioned so thatwind power imbalances are handled 99 percentile of time and FCR are not activated. While in theproposed method in next section, FRR are dimensioned to handle imbalances by FCR, FRR andRR in order to maintain the frequency with the required bandwidth. Therefore, it is expected thatKwind,ramp obtained from this existing ramp rate based reserve estimation method [16] will havehigher value as compared to the proposed method.
3.2. Proposed Reserve Estimation Method
Figure 1 depicts the flowchart of the proposed methodology. For the studies in this article, themethodology depicted in Figure 1 is modelled as according to the rules and regulations of CE
4
Page 7 of 34
IET Review Copy Only
IET Renewable Power GenerationThis article has been accepted for publication in a future issue of this journal, but has not been fully edited.
Content may change prior to final publication in an issue of the journal. To cite the paper please use the doi provided on the Digital Library page.

TSOn
TSOi
TSO1
Online
Prognoses
Hour
Ahead
Prognoses
FRPReal-Time
Available
Power -
+Imbalance
Prognoses
-
+ +
-+
-
RR Activation
and
Deployment
Imbalance with
RR + FRR
Activated RR
Generation
&
Risk
Assessment
Synchronous Network
+
+
+
SCADA
Fig. 1: Flowchart of the system model
network. Although, it should be noted that the methodology discussed is generic and can beapplied for other synchronous networks. Also in these studies, each country of CE network isassumed as a single TSO or control area.
At the beginning of the operating hour, each control area is assumed to be balanced throughhour-ahead power trading. Power trading and hence, unit commitment of all generators are basedon the hour-ahead prognoses of the wind power generation. Error in forecast decreases as it ap-proaches nearer to the operating time. Therefore, hour-ahead prognoses are generally expected tohave higher error than online prognoses. When online prognoses of wind power generation areobtained certain T minutes ahead of the operation time, imbalance prognoses are computed foreach control area as the difference between online prognoses and hour-ahead prognoses. Thesepower imbalances are handled by FCR and FRR in real-time.
3.2.1. RR activation based on imbalance prognoses: Since RR activation has certain delayin activation process, therefore operators generally need to take decisions beforehand to activateRR in order to replenish FRR. Figure 2 depicts the RR activation and deployment block from theflowchart in Figure 1. As soon as the decision to activate RR is taken, imbalance prognoses areupdated taking into consideration of this activation plan.
Total imbalance prognose is given by Equation 4.
IPrognoset+T,i = P online
t+T,i − PHAt+T,i − P
RRsignal
t+T,i (4)
• IPrognoset+T,i : Total imbalance prognose at time instant t+ T for each control area i
• P onlinet+T,i : Total online power prognose at time instant t+ T for each control area i
• PHAt+T,i: Total hour-ahead power prognose at time instant t+ T for each control area i
5
Page 8 of 34
IET Review Copy Only
IET Renewable Power GenerationThis article has been accepted for publication in a future issue of this journal, but has not been fully edited.
Content may change prior to final publication in an issue of the journal. To cite the paper please use the doi provided on the Digital Library page.

RR
Activation
Decision
RR Response Activated
RR Imbalance
Prognoses +
-
Activation Signal
Activate RR
Decision
(= imbalance
prognoses for t+T)
Threshold
-Threshold
Threshold
-Threshold
Threshold
-Threshold
Threshold
-Threshold
Threshold
-Threshold
Threshold
-Threshold
Imbalance prognoses for t+T
Imbalance prognoses for t+2T
Imbalance prognoses for t+3T
Logical AND
RR Activation Decision
RR Activation and Deployment Process
Fig. 2: RR Activation and Deployment Block
• PRRsignal
t+T,i : Total already activated RR based on the previous activation signals sent by opera-tors at time instant t+ T for each control area i
The proposed RR activation decision blocked from Figure 2 is also shown in Figure 2.It depicts that the operators need to be certain that the imbalance prognoses are not random
noises. Therefore if imbalance prognoses are found to be greater than a threshold value for next3T minutes, then RR is activated to mitigate the power imbalance. Threshold can be decided basedon experience of the operators.
Since, RR sources are activated manually and are generally slow therefore RR response isdelayed from the activation plan. RR responses are modelled with delay of T minutes followed byramping up in 2T minutes.
3.2.2. Frequency Restoration Process(FRP) during real-time operation: During real-timeoperation power imbalance is computed as the difference between real-time available wind powergenerations and hour-ahead prognoses.
Irealtimew/o Res
t,i = P realtimet,i − PHA
t,i (5)
However, since RR is already activated and deployed based on imbalance prognose, IPrognoset+T,i
as given in Equation 4. Therefore, real-time power imbalance from Equation 5 is modified toIrealtimeRRt,i as given in Equation 6.
IrealtimeRRt,i = P realtime
t,i − PHAt,i − PRRactivated
t,i (6)
• IrealtimeRRt,i : Total real-time imbalance only considering activation of RR at time instant t for
each control area i
• P realtimet,i : Total real-time available wind power generated at time instant t for each control
area i.
6
Page 9 of 34
IET Review Copy Only
IET Renewable Power GenerationThis article has been accepted for publication in a future issue of this journal, but has not been fully edited.
Content may change prior to final publication in an issue of the journal. To cite the paper please use the doi provided on the Digital Library page.

• PHAt,i : Total hour-ahead power prognose at time instant t for each control area i
• PRRactivatedt,i : Total activated and deployed RR at time instant t for each control area i
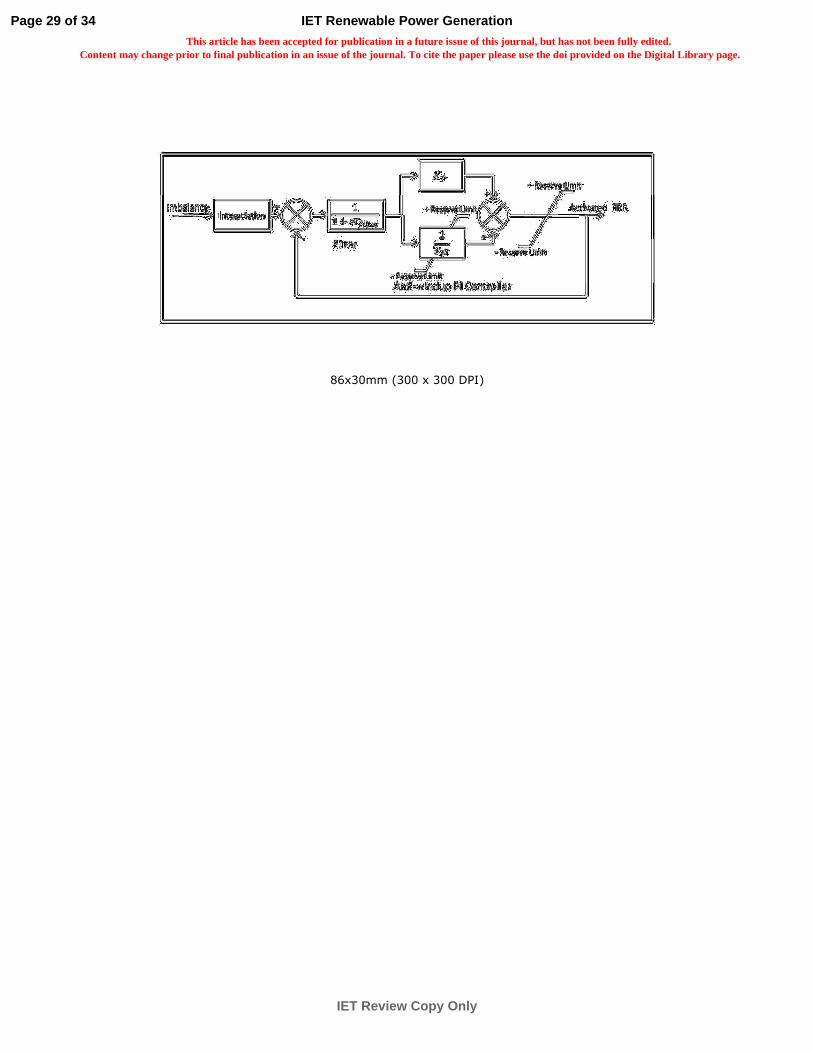
This real-time power imbalance considering RR activation and deployment needs to be handledusing FCR and FRR. FRR is assumed to be activated by automatic LFC in this methodology. LFCcontrol is modelled with an anti-windup PI controller along with measurement filter as shown inFigure 3. Filter is modelled as a first order transfer function with time constant Tfilter. Real-
Activated FRR
- Reserve Limit
Imbalance + Reserve Limit Interpolation
1
+
-
+
+
Anti-windup PI Controller
1
1 +
Filter - Reserve Limit
+ Reserve Limit
Fig. 3: Frequency Restoration Process
time imbalance input to the FRP is of T minute resolution. Since, FRP has faster response, theimbalance is interpolated to 10 seconds resolution which is input to the anti-windup PI controlleras shown in Figure 3.
Sizing of FRR: Different methodologies for dimensioning of FRR are defined in “P1–Policy1: Load-Frequency Control and Performance [C]” of UCTE operation handbook [20] based ondifferent operational needs in control areas of LFC, due to different characteristics and patternsof generation (including hydraulic, thermal and HVDC- link) and demand (including BRP andforecast qualities). The sizing of the FRR is done by deterministic and / or probabilistic approachesas following:
1. Empiric Noise Management Sizing Approach - The FRR for each control area is computedbased on [5], [20]
R =√
a Lmax + b2 − b (7)
Where,
• R: Recommendation for control Reserve in MW• Lmax: Maximum anticipated load in MW for the control area
The parameters, a and b are empirically assumed as: a = 10 MW and b = 150 MW [20]
2. Probabilistic Risk Management Sizing Approach - For the probabilistic assessment Euro-pean Commission’s guideline on electricity transmission system operation defines a minimumvalue for the sum of FRR Capacity and RR Capacity which is defined by the 99 % quantileof the LFC Block Imbalances (separate for positive and negative direction) [6].
7
Page 10 of 34
IET Review Copy Only
IET Renewable Power GenerationThis article has been accepted for publication in a future issue of this journal, but has not been fully edited.
Content may change prior to final publication in an issue of the journal. To cite the paper please use the doi provided on the Digital Library page.

3. Largest Generation Unit or Power Infeed - The sizing is done based on largest possible gen-eration incident for each control area.
4. Extra-ordinary Sizing of Reserves - Other criteria e.g. consideration of large changes inexchanges, expected load variations, adverse climatic conditions, strikes etc. might influencethe size of the reserve.
In these studies, Empiric Noise Management Deterministic Sizing Approach and ProbabilisticRisk Management Sizing Approach are used for dimensioning of FRR. Therefore, Equation 7is modified to include a multiplying factor Kwind so that the imbalance caused by wind powergeneration can be handled statistically 99% of the time by FCR.
R = Kwind (√a Lmax + b2 − b) (8)
Kwind basically signifies amount of FRR required in future as compared to present value andgiven as the ratio of future FRR dimension in p.u. to present FRR dimension taken as base value.For example, a value of 2 for Kwind means that in future FRR should be dimensioned double ascompared to present value in order to handle imbalances due to wind power forecast error.
FRR dimension as estimated based on Equation 8 is used as Reserve Limit in the flowchartshown in Figure 3.
3.2.3. Risk estimation of FCR exceeding design requirements for synchronous network:The power imbalances which occur either if the LFC is yet to be activated or if FRR is exhaustedbut RR is not yet activated are needed to be handled using FCR.
Since FCR in a synchronous network are shared among all the control areas / TSOs, thereforethe power imbalances for all the control areas in each synchronous area are added together asshown in Figure 1 and given by Equation 9.
IrealtimeFRR+RR
t =n∑
i=1
IrealtimeRRt,i − P FRRactivated
t,i (9)
• IrealtimeFRR+RR
t : Total realtime imbalance with activation of FRR and RR at time instant t forsynchronous network
• P FRRactivatedt,i : Total activated FRR at time instant t for each control area i
• n: Total number of TSOs or control areas in the concerned synchronous network
Probability density functions of the imbalance IrealtimeFRR+RR
t provide the information about therisk of power imbalance exceeding designed FCR dimension FCRsize (For example- FCR require-ment designed based on dimensional fault for CE is 3000 MW). Probabilistic risk of exceeding thedesigned FCR dimension FCRsize value of the synchronous network is given by Equation 10.
Risk = Pr[|IrealtimeFRR+RR
t | > FCRsize]
= 1− Pr[−FCRsize < IrealtimeFRR+RR
t < FCRsize] (10)
• FCRsize: Designed FCR size for concerned synchronous network
8
Page 11 of 34
IET Review Copy Only
IET Renewable Power GenerationThis article has been accepted for publication in a future issue of this journal, but has not been fully edited.
Content may change prior to final publication in an issue of the journal. To cite the paper please use the doi provided on the Digital Library page.

Equation 10 depicts that Risk is calculated as the probability of total realtime imbalance with ac-tivation of FRR and RR exceeding designed FCR dimension for concerned synchronous network.
In order to be able to handle imbalance with the available FCRsize for 99% of time, the riskestimated through Equation 10 should be less than 1% i.e 0.01. Therefore, the design criterion fordimensioning FRR for handling wind power imbalances with 1% risk is given by Equation 11.
Risk = Pr[|IrealtimeFRR+RR
t | > FCRsize]
= 1− Pr[−FCRsize < IrealtimeFRR+RR
t < FCRsize] < 0.01 (11)
Equation 11 is the design criterion for probabilistic risk estimation algorithm. It is possible us-ing proposed algorithm to estimate the volume and speed of FRR activation so that the probabilisticrisk is less than 0.01.
4. Study Case - CE Network
A set of anticipated wind power installation scenarios for ENTSO-E networks for 2020 and 2030are developed and simulated in the following based on data from different sources such as [21, 22,23]. These scenarios are validated based on EWEA report [1]. Figure 4 depicts the anticipatedinstalled onshore and offshore wind power capacity and peak load in GW for different countriesof ENTSO-E networks for 2020 and 2030. In 2020 scenario, offshore wind power capacity is 3times smaller than the onshore wind power capacity, while in 2030 scenario offshore wind powercapacity is less than 2 times of the onshore wind power capacity. Furthermore, in some countries,offshore wind power capacity becomes more dominant than onshore wind capacity in 2030.
CorWind [24], a software developed in DTU Wind Energy is used to generate hour ahead fore-cast, online prognoses and real-time available power from the wind for each of the wind powerscenarios for ENTSO-E networks. These data are simulated for each of the scenarios for 14 mete-orological years.
Following are the assumptions and considerations for probabilistic risk assessment algorithmfor CE:
• Online prognoses are obtained at the resolution of 5 minutes for next 15 minutes (T = 5).
• Each country in CE network is assumed as a control area
• Threshold for RR activation for the studies is 30 MW
• RR responses are modelled with 5 minute delay and ramping rate of 10 minutes
• Proportional gain Kp for FRP is assumed 0.2 p.u.
• Filter time constant Tfilter is assumed as 16 s.
• Generally, each TSO is responsible to handle power imbalances in its own control area, there-fore it is assumed in these studies that that there is no contribution from neighboring controlarea to mitigate power imbalances in other control areas.
• The maximum anticipated loads for each control area for 2020 and 2030 scenarios are basedon ENTSO-E adequacy forecast [25]. Based on the maximum anticipated load for each con-trol area, Reserve Limit is obtained from Equation 8. Notice that since different countrieshave different load levels, Reserve Limit are different for all the countries.
9
Page 12 of 34
IET Review Copy Only
IET Renewable Power GenerationThis article has been accepted for publication in a future issue of this journal, but has not been fully edited.
Content may change prior to final publication in an issue of the journal. To cite the paper please use the doi provided on the Digital Library page.

2020 Scenario
Fig. 4: Peak Load and Wind Power Scenario for different countries in ENTSO-E Networks
• The total volume of FRR for CE is around 12000 MW.
• FCRdimension designed for CE network is 3000 MW.
Simulations are performed for different FRR activation volumes and activation time. Studies aredone for CE synchronous network.
4.1. 2020 Scenario
Reserve requirements Kwind,ramp computed based on existing ramp rate based reserve estimationmethod [16] is found to be 2 p.u. for 2020 wind power scenario.
The probability density functions of imbalances for CE network for 2020 scenario is shownin Figure 5(a) for 2 cases- one without reserve activation, Irealtimew/o Res (Equation 5) and onewith FRR+RR activation, IrealtimeFRR+RR (Equation 9). It is observed that the probability densityfunction curve for imbalance becomes much narrower after activation of FRR and RR. This impliesthat probabilities of power imbalances decrease with activation of FRR and RR.
The tail of the probability density function curve is long even after activation of reserves. Thissignifies that there is a very low probability of extreme high power imbalances. In order to handlesuch extreme situations, a very high amount of FCR are required. This advocates for dynamic
10
Page 13 of 34
IET Review Copy Only
IET Renewable Power GenerationThis article has been accepted for publication in a future issue of this journal, but has not been fully edited.
Content may change prior to final publication in an issue of the journal. To cite the paper please use the doi provided on the Digital Library page.

-2 -1 0 1 2 3 4Imbalance in MW ×104
0
1
2
3
4
5
6
7
Pro
babi
lity
×10-3
Imbalance without FRR and RR activationImbalance with FRR and RR activation
(a)
(b)
(c)
Fig. 5: (a) Probability density functions of power imbalances with and without reserve activa-tions (b) Probability of power imbalance exceeding 3000 MW (c) Occurrence of power imbalanceexceeding 3000 MW for CE for 2020 scenario for different volumes of FRR activation
11
Page 14 of 34
IET Review Copy Only
IET Renewable Power GenerationThis article has been accepted for publication in a future issue of this journal, but has not been fully edited.
Content may change prior to final publication in an issue of the journal. To cite the paper please use the doi provided on the Digital Library page.

deployment of FCR to handle such rare scenarios.Figure 5(b) shows the probability of the imbalance exceeding FCR dimension (3000 MW) for
CE for different volumes of FRR activation in 2020 scenario. As mentioned before, Kwind is thescaling factor representing the volume of FRR dimension for considered wind power scenario ascompared to present system. Note that FCR will be activated only if either imbalance happensbefore FRR is activated or FRR is exhausted and RR is not activated yet. Therefore, differentvolume and speed of activation of FRR are studied in this paper. It is observed that probability ofimbalance exceeding 3000 MW for 2020 scenario is quite low (less than 1%). Therefore, powerimbalances can be handled more than 99% of the time using the FRR dimensioned as it is in presentcondition. However, higher the value of Kwind i.e. higher the volume of available FRR, lower isthe probability of power imbalance beyond 3000 MW.
Another important point to be considered is the amount of time power imbalance is exceedingthe standard range. Figure 5(c) shows occurrence of the power imbalance exceeding referenceincident for CE for 2020 scenario. Occurrences are much less than the required criterion of 15000min/yr [26]. Higher the value of Kwind, lower is the occurrence of power imbalance beyond 3000MW. Occurrence decreases substantially from 3350 min/yr for power imbalance without reserveactivation to 35 min/yr for reserve activation with Kwind = 3p.u. for positive power imbalanceexceeding 3000 MW.
Fig. 6: Risk of power imbalance exceeding 3000 MW for CE for 2020 scenario for different FRRactivation
The probabilistic risk for different volumes and different integration time constants of FRRactivation for negative and positive power imbalances are shown in Figure 6. Probabilistic risk isplotted against Kwind (volume of FRR) and TI (speed of activation). Remark that risk of powerimbalance exceeding 3000 MW is similar for both positive and negative imbalance. It can beobserved that risk of imbalances exceeding 3000 MW is much lower than 1%. However, TI doesnot have impact in reducing power imbalance due to wind forecast error. Kwind has significantimpact in reducing risk and risk reduces exponentially with increase in volume of FRR and remainsalmost unaffected by increase in integration time constant of FRR activation.
4.2. 2030 Scenario
Reserve requirements Kwind,ramp computed based on existing ramp rate based reserve estimationmethod [16] is found to be 5 p.u. for 2030 wind power scenario.
Figure 7(a) shows the probability of the power imbalance exceeding 3000 MW for CE for
12
Page 15 of 34
IET Review Copy Only
IET Renewable Power GenerationThis article has been accepted for publication in a future issue of this journal, but has not been fully edited.
Content may change prior to final publication in an issue of the journal. To cite the paper please use the doi provided on the Digital Library page.

(a)
(b)
Fig. 7: (a)Probability (b)Occurrence of imbalance exceeding 3000 MW for CE for 2030 scenario
different volumes of FRR activation for 2030 scenario. In contrast to 2020 scenario, probabilityof the power imbalance exceeding 3000 MW is almost 10 times higher. Power imbalance withoutreserve activation exceeding 3000 MW caused by error in wind power forecast is higher than5%. This imbalance reduces substantially with activation of FRR and RR from 5% to 0.5% whenvolume of FRR is increased by three times as that of present system i.e.Kwind = 3. If Kwind = 0.5i.e. half of the FRR is already employed to handle other kinds of power imbalances from loads,contingencies, other generations etc., then the imbalance due to wind power can be as high as 3%.With 100% of the available FRR dimensioned (i.e. Kwind = 1) as it is in present system, imbalancecomes down just below to 2%. This implies that over-dimensioning of FRR is essentially requiredto handle wind power imbalances in 2030 scenario. By dimensioning FRR double (Kwind = 2) asthat of present volume, imbalance reduces down to less than 1%. Increasing the FRR dimensionto three times (Kwind = 3), the power imbalances due to wind reduces to less than 0.5%, which isequivalent to power imbalance in 2020 scenario.
This result can be interpreted as volume of FRR plays important role in reducing the imbalances
13
Page 16 of 34
IET Review Copy Only
IET Renewable Power GenerationThis article has been accepted for publication in a future issue of this journal, but has not been fully edited.
Content may change prior to final publication in an issue of the journal. To cite the paper please use the doi provided on the Digital Library page.

due to wind power forecast error. This is expected since ramping of wind power is a phenomenonwhich takes generally around 10-15 minutes. In this time period, FRR plays the role of balancingand load following. Lower value of Kwind i.e. lower volume of FRR does not reduce the imbalancethereby demonstrating that FRP of Fig. 3 reaches the saturation limit (Reserve Limit) Anotherpoint of consideration is that the power imbalances exceeding 3000 MW should not be more than15000 min/yr. Figure 7(b) shows the occurrence of power imbalance due to wind power exceeding3000 MW for CE for 2030 scenario. Power imbalances without FRR and RR activation occur muchmore frequently than 15000 min/yr. It does not came below 15000 min/yr with half (Kwind = 0.5)of the FRR activated to handle wind power imbalances. However, with 100% of the FRR utilised tohandle power imbalances due to wind, occurrences of power imbalances become less than 15000min/yr.
Fig. 8: Risk of power imbalance exceeding 3000 MW for CE for 2030 scenario
Probabilistic risk of positive and negative power imbalances exceeding 3000 MW for differentvolumes and different speed of FRR activation are shown in Figure 8. Similar to observation of2020 scenario, the risk reduces exponentially with increase in volume of FRR and remains almostunaffected by increase in integration time constant of FRR activation for 2030 scenario. Speed ofFRR activation does not have significant improvement in reduction of imbalances implying thatspeed of FRP in present condition is sufficient to handle these imbalances. This is expected sinceramping of wind power takes around 10 to 15 minutes.
It is observed that Kwind should at least be 2 p.u. in order to bring the risk lower than 1%.Furthermore, there is substantial improvement as compared to Kwind,ramp obtained from existingmethod from literature [16]. The proposed methodology provides improved and more practicalsolution for reserve requirements.
5. Conclusion
A new methodology has been presented in this article to study the adequacy of frequency reservesfor future power systems with high penetration of wind power generation. The wind power fore-cast is developed based on current practice in the TSOs. However, if better short term forecastsare available in future, the requirements for reserves can be reduced. The studies presented in thiswork only considers imbalance caused by wind power forecasts. Imbalances caused from othersources like load, other stochastic generations like solar PV, contingencies etc. are not consideredin this work and can be considered in future works. The proposed and developed methodology
14
Page 17 of 34
IET Review Copy Only
IET Renewable Power GenerationThis article has been accepted for publication in a future issue of this journal, but has not been fully edited.
Content may change prior to final publication in an issue of the journal. To cite the paper please use the doi provided on the Digital Library page.

estimates adequacy of reserves for wind power scenarios through probabilistic risk assessment.Probabilistic risk assessment of power imbalances exceeding designed frequency containment re-serves with activation of frequency restoration and replacement reserves demonstrates that risk forwind scenarios for Continental Europe reduces exponentially with increase in volume of frequencyrestoration reserves and remains almost unaffected by increase in speed of frequency restorationreserve activation. Probability of power imbalance due to wind forecast error exceeding 3000 MWfor Continental Europe network in 2020 scenario can be low and can be handled with reservesdimensioned as it is in present system. While risk of power imbalance exceeding 3000 MW for2030 wind power scenario in Continental Europe can be high. Therefore, frequency restorationreserves for countries with high wind power penetration of 2030 scenario should have additionalvolume (at least 2 times higher than reserve volume in present scenario) in order to handle powerimbalances from wind power forecast error.
6. Acknowledgment
The research leading to these results has received funding from the European Union SeventhFramework Programme (FP7/2007-2013) under grant agreement n◦. 283012. Authors would alsolike to acknowledge their thanks to Martin Høgdahl Zamastil from Energinet.Dk for his feedbackand support.
7. References
[1] EWEA, “Pure Power,” 2011. [Online]. Available: http://www.ewea.org/fileadmin/files/library/publications/reports/Pure Power III.pdf
[2] K. Das, A. D. Hansen, and P. E. Sørensen, “Aspects of Relevance of Wind Power in PowerSystem Defense Plans,” in 12th International Workshop on Large-Scale Integration of WindPower into Power Systems as well as on Transmission Networks for Offshore Wind PowerPlants, 2013, pp. 416–421.
[3] S. De Boeck, K. Das, V. Trovato et al., “Review of defence plans in europe: Current status,strenghts and opportunities,” CIGRE Science & Engineering, vol. 5, pp. 2–11, 2016.
[4] K. Das, A. Nitsas, M. Altin, A. D. Hansen, and P. Sørensen, “Improved Load SheddingScheme considering Distributed Generation,” IEEE Transactions on Power Delivery, 2016.
[5] UCTE, “Operation Handbook,” Union for the Co-ordination of Transmission of Electricity,Tech. Rep., June 2004.
[6] EUROPEAN COMMISSION, “A guideline on electricity transmission system oper-ation,” 2016. [Online]. Available: https://www.entsoe.eu/major-projects/network-code-development/system-operation/Pages/default.aspx
[7] Nordel, “Nordic Grid Code (Nordic collection of rules),” 2007. [Online]. Avail-able: https://www.entsoe.eu/fileadmin/user upload/ library/publications/nordic/planning/070115 entsoe nordic NordicGridCode.pdf
15
Page 18 of 34
IET Review Copy Only
IET Renewable Power GenerationThis article has been accepted for publication in a future issue of this journal, but has not been fully edited.
Content may change prior to final publication in an issue of the journal. To cite the paper please use the doi provided on the Digital Library page.

[8] M. Milligan, P. Donohoo, D. Lewothers et al., “Operating Reserves and Wind Power In-tegration:An International Comparison,” in Proceedings of 9th International Workshop onLarge-Scale Integration of Wind Power into Power Systems, Oct 2010.
[9] E. Ela, M. Milligan, and B. Kirby, “Operating Reserves and Variable Generation,” NREL/TP-5500-51928, August 2011.
[10] E. Ela, B. Kirby, E. Lannoye et al., “Evolution of Operating Reserve Determination in WindPower Integration Studies,” in Proceedings of IEEE PES General Meeting, July 2010.
[11] H. Holttinen, M. Milligan, E. Ela et al., “Methodologies to Determine Operating Reservesdue to Increased Wind Power,” IEEE Transactions on Sustainable Energy, vol. 3, no. 4, pp.713–723, 2007.
[12] J. Kiviluoma, M. O’Malley, A. Tuohy et al., “Impact of wind power on the unit commitment,operating reserves, and market design,” in Proceedings of IEEE PES General Meeting, July2011, pp. 1–8.
[13] A. Botterud, Z. Zhou, J. Wang et al., “Unit commitment and operating reserves with proba-bilistic wind power forecasts,” in Proceedings of IEEE PowerTech, Trondheim, 2011.
[14] N. Menemenlis, M. Huneault, and A. Robitaille, “Computation of Dynamic Operating Bal-ancing Reserve for Wind Power Integration for the Time-Horizon 1-48 Hours,” IEEE Trans-actions on Sustainable Energy, vol. 3, no. 4, pp. 692–702, 2012.
[15] K. Das, M. Litong-Palima, P. Maule, and P. E. Sørensen, “Adequacy of Operating Reservesfor Power Systems in Future European Wind Power Scenarios,” in IEEE PES General Meet-ing, July 2015.
[16] P. Sorensen, N. A. Cutululis, A. Vigueras-Rodrıguez, L. E. Jensen, J. Hjerrild, M. H. Dono-van, and H. Madsen, “Power fluctuations from large wind farms,” IEEE Transactions onPower Systems, vol. 22, no. 3, pp. 958–965, 2007.
[17] P. Sorensen, M. Litong-Palima, A. N. Hahmann, S. Heunis, M. Ntusi, and J. C. Hansen,“Wind power variability and power system reserves,” in invited paper to be published inWindAC Africa, 2016.
[18] B. Parsons, M. Milligan, B. Zavadil et al., “Grid impacts of wind power: a summary of recentstudies in the United States,” Wind Energy, vol. 7, no. 2, pp. 87–108, 2004.
[19] ENTSO-E, “Network Code on Load Frequency Control and Reserves (LFCR).”[Online]. Available: https://www.entsoe.eu/major-projects/network-code-development/load-frequency-control-reserves/Pages/default.aspx
[20] Handbook, UCTE Operations, “P1–Policy 1: Load-Frequency Control and Performance[C],” march 2009. [Online]. Available: https://www.entsoe.eu/fileadmin/user upload/ library/publications/entsoe/Operation Handbook/Policy 1 final.pdf
[21] 4COffshore, “Global Offshore Wind Database.” [Online]. Available: http://www.4coffshore.com/windfarms/
[22] TheWindPower, “Wind Farms List.” [Online]. Available: http://www.thewindpower.net/windfarms list en.php
16
Page 19 of 34
IET Review Copy Only
IET Renewable Power GenerationThis article has been accepted for publication in a future issue of this journal, but has not been fully edited.
Content may change prior to final publication in an issue of the journal. To cite the paper please use the doi provided on the Digital Library page.

[23] N. A. Cutululis, M. Litong-Palima, L. Zeni, A. Gøttig, N. Detlefsen, and P. E. Sørensen,“Offshore wind power data: Deliverable no: 16.1,” Tech. Rep., 2012.
[24] K. Das, “Integration of renewable generation in power system defence plans,” Ph.D. disserta-tion, Technical Universuty of Denmark, 2016.
[25] ENTSO-E, “Scenario Outlook & Adequacy Forecast (SO&AF) 2014-2030.” [On-line]. Available: https://www.entsoe.eu/publications/system-development-reports/adequacy-forecasts/Pages/default.aspx
[26] ENTSO-E, “Supporting Document for the Network Code on Load-Frequency Control andReserves.” [Online]. Available: http://networkcodes.entsoe.eu/wp-content/uploads/2013/08/130628-NC LFCR-Supporting Document-Issue1.pdf
17
Page 20 of 34
IET Review Copy Only
IET Renewable Power GenerationThis article has been accepted for publication in a future issue of this journal, but has not been fully edited.
Content may change prior to final publication in an issue of the journal. To cite the paper please use the doi provided on the Digital Library page.

186x108mm (300 x 300 DPI)
Page 21 of 34
IET Review Copy Only
IET Renewable Power GenerationThis article has been accepted for publication in a future issue of this journal, but has not been fully edited.
Content may change prior to final publication in an issue of the journal. To cite the paper please use the doi provided on the Digital Library page.

117x57mm (300 x 300 DPI)
Page 22 of 34
IET Review Copy Only
IET Renewable Power GenerationThis article has been accepted for publication in a future issue of this journal, but has not been fully edited.
Content may change prior to final publication in an issue of the journal. To cite the paper please use the doi provided on the Digital Library page.

111x49mm (300 x 300 DPI)
Page 23 of 34
IET Review Copy Only
IET Renewable Power GenerationThis article has been accepted for publication in a future issue of this journal, but has not been fully edited.
Content may change prior to final publication in an issue of the journal. To cite the paper please use the doi provided on the Digital Library page.

117x57mm (300 x 300 DPI)
Page 24 of 34
IET Review Copy Only
IET Renewable Power GenerationThis article has been accepted for publication in a future issue of this journal, but has not been fully edited.
Content may change prior to final publication in an issue of the journal. To cite the paper please use the doi provided on the Digital Library page.

111x49mm (300 x 300 DPI)
Page 25 of 34
IET Review Copy Only
IET Renewable Power GenerationThis article has been accepted for publication in a future issue of this journal, but has not been fully edited.
Content may change prior to final publication in an issue of the journal. To cite the paper please use the doi provided on the Digital Library page.

92x38mm (300 x 300 DPI)
Page 26 of 34
IET Review Copy Only
IET Renewable Power GenerationThis article has been accepted for publication in a future issue of this journal, but has not been fully edited.
Content may change prior to final publication in an issue of the journal. To cite the paper please use the doi provided on the Digital Library page.

88x45mm (300 x 300 DPI)
Page 27 of 34
IET Review Copy Only
IET Renewable Power GenerationThis article has been accepted for publication in a future issue of this journal, but has not been fully edited.
Content may change prior to final publication in an issue of the journal. To cite the paper please use the doi provided on the Digital Library page.

153x116mm (300 x 300 DPI)
Page 28 of 34
IET Review Copy Only
IET Renewable Power GenerationThis article has been accepted for publication in a future issue of this journal, but has not been fully edited.
Content may change prior to final publication in an issue of the journal. To cite the paper please use the doi provided on the Digital Library page.
86x30mm (300 x 300 DPI)
Page 29 of 34
IET Review Copy Only
IET Renewable Power GenerationThis article has been accepted for publication in a future issue of this journal, but has not been fully edited.
Content may change prior to final publication in an issue of the journal. To cite the paper please use the doi provided on the Digital Library page.

234x123mm (300 x 300 DPI)
Page 30 of 34
IET Review Copy Only
IET Renewable Power GenerationThis article has been accepted for publication in a future issue of this journal, but has not been fully edited.
Content may change prior to final publication in an issue of the journal. To cite the paper please use the doi provided on the Digital Library page.

72x51mm (300 x 300 DPI)
Page 31 of 34
IET Review Copy Only
IET Renewable Power GenerationThis article has been accepted for publication in a future issue of this journal, but has not been fully edited.
Content may change prior to final publication in an issue of the journal. To cite the paper please use the doi provided on the Digital Library page.

74x53mm (300 x 300 DPI)
Page 32 of 34
IET Review Copy Only
IET Renewable Power GenerationThis article has been accepted for publication in a future issue of this journal, but has not been fully edited.
Content may change prior to final publication in an issue of the journal. To cite the paper please use the doi provided on the Digital Library page.

71x50mm (300 x 300 DPI)
Page 33 of 34
IET Review Copy Only
IET Renewable Power GenerationThis article has been accepted for publication in a future issue of this journal, but has not been fully edited.
Content may change prior to final publication in an issue of the journal. To cite the paper please use the doi provided on the Digital Library page.

73x53mm (300 x 300 DPI)
Page 34 of 34
IET Review Copy Only
IET Renewable Power GenerationThis article has been accepted for publication in a future issue of this journal, but has not been fully edited.
Content may change prior to final publication in an issue of the journal. To cite the paper please use the doi provided on the Digital Library page.