Novel Education Modules Addressing the Underrepresentation ...

I I
Addressing Underrepresentationof Gifted Minority Children Using
the Naglieri Nonverbal Ability Test (NNAT)
Jack A. NaglieriGeorge Mason University
A B S T R A C T
A persistent problem in education is the underrepre-sentation of diverse students in gifted education pro-grams. Many educators attribute the poor participationof diverse students in gifted programs to the ineffec-tiveness ofstandardized tests in capturing the ability ofthese students. Thus, a primary agenda ofschool selec-tion committees is to find more culturally sensitivemeasures. This study examined the effectiveness oftheNaglieri Nonverbal Ability Test (NNAT) in identify-ing gifted Black and Hispanic students in comparisonto White students. The sample was comprised of20,270 students in grades K-12 who were similar tothe U.S. population on several demographic variables.The distributions of NNAT standard scores werestudied separately for White, Black, and Hispanicgroups. Results indicate that similar percentages ofWhite (5.6%), Black (5.1%0/), and Hispanic (4.4%)children earned an NNAT standard score of 125 (95thpercentile rank). These findings suggest that theNNAT may be useful as part ofa procedure to identifydiverse students for gifted education services.
The underrepresentation ofminority children in classesfor the gifted has been and continues to be one of the mostimportant problems facing educators of gifted students(Ford, 1998). As of 1993, the U.S. Department ofEducation reported that Black, Hispanic, and NativeAmerican students were underrepresented by 50-70% ingifted education programs. Ford reported that, despiterecent efforts to redress this problem, the underrepresenta-tion of minority students in gifted programs has been per-sistent and, for some groups, has increased. Schoolpersonnel and researchers have sought to resolve this prob-lem by examining the ability tests used and procedures fol-lowed (de Bernard, 1985; Sternberg, 1985). Many reports
Donna Y. FordThe Ohio State University
attribute the problem to standardized tests, contending thatthese tests fail to assess the strengths and abilities of cultur-ally, ethnically, and linguistically diverse populations (e.g.,Frazier et al., 1995). Support for this assertion comes fromreports showing that Black, Hispanic, and Native Americanstudents consistently score lower than White students ontraditional standardized tests (Brody, 1992; Sattler, 1988).
Despite the fact that intelligence tests such as theWechsler Intelligence Scale for Children-Third Edition
0 01|.IIi 0~l,s a s, i i i

(Wechsler, 1991) and the Stanford-Binet IV (Thorndike,Hagen, & Sattler, 1986) yield lower scores for minority chil-dren (see Kaufman, 1994, for a discussion of the WISC-LJI),they have been widely used for gifted identification.Wasserman and Becker (2000) have provided a summary ofrecent research on the WISC-IJI (Wechsler, 1991), Stanford-Binet Intelligence Scale, Fourth Edition (Thorndike,Hagen, & Sattler), and Woodcock-Johnson Tests ofCognitive Ability (WJ-R; Woodcock &Johnson, 1989) thatused samples matched on key demographic variables. Theyfound that the average differences in favor of Whitesbetween standard scores for matched samples of Black andWhite groups were as follows: WISC-JLI = 11.0; Stanford-Binet IV = 8.1; and Woodcock-Johnson Tests of CognitiveAbility 11.7. These sizable mean score differences suggest
that fewer minority children might be identified when suchtests are used for determination of giftedness.
Other reports contend that policies and procedureshave a disparate impact on the participation of diverse stu-
dents in gifted programs, especially the common proce-
dure used by schools: teacher referral. Some researchers(e.g., Ford, 1998) have suggested that teachers oftenunder-refer diverse students for gifted education screening
and placement. An additional policy used in some schoolsystems is that students must be assessed in English, whichhas a profound impact on linguistically diverse or limitedEnglish proficient students (de Bernard, 1985).
Given the widespread concerns about testing andassessing diverse students with traditional measures, it is
important that school administrators closely examine tests
considered culturally fair. Many of these tests fall underthe label of "nonverbal tests." Nonverbal tests like theRaven's Progressive Matrices (Raven, 1947) and theNaglieri Nonverbal Ability Test (NNAT; Naglieri, 1997a)have been used to evaluate diverse populations of children.Raven's Progressive Matrices and the NNAT are com-
prised of nonverbal, geometric designs arranged in a 2 x 2or 3 x 3 matrix. These items can be considered to havecontent that is culturally reduced because they do not con-
tain items that require the child, for example, to definewords or solve oral (English) arithmetic problems. Thetests seem especially useful for identification of giftedminority children because the nonverbal content is more
appropriate for a wide variety of children Jensen, 1980;Naglieri & Prewett, 1990; Sattler, 1988).
Researchers have found that the nonverbal measures
are less influenced by limited English language skills and,therefore, are more appropriate for bilingual children(Hayes, 1999; Naglieri & Yazzie, 1983). Verbal test scores
can be adversely influenced when children have poor lan-
guage skills and live in poverty (Kaufman, 1994; Naglieri,1999). The use of nonverbal tests helps reduce problemsassociated with measuring ability through the use of lan-guage tests like vocabulary, for example. For these reasons,nonverbal tests of ability are considered appropriate for awide variety of persons, especially those with limitedEnglish language skills and academic failure (Bracken &McCallum, 1998; Zurcher, 1998).
Raven's Progressive Matrices (Raven, 1947) is theoldest and most widely used nonverbal test. This test hasbeen studied in many countries around the world and witha substantial variety of individuals. Despite its widespreaduse in the United States, the test has been consistentlycriticized for its poor psychometric qualities, including thelack of a well-constructed norm group, uneven gradientsof item difficulty, inadequate numbers of items, and theneed for better documentation of psychometric qualitiesin the test manual Jensen, 1980; Nicholson, 1989). Mostimportantly, however, the difficulty with Raven'sProgressive Matrices most relevant to this discussion isfindings of higher mean score differences between Whiteand minority children (see Mills & Tissot, 1995; Vincent,1991). The purpose of this study, therefore, was to exam-ine the question of identification of minority children asgifted using a different nonverbal test: the NNAT.
The Naglieri Nonverbal Ability Test uses the same pro-gressive matrix format as Raven's tests, but there are someimportant differences. First, the NNAT, like its original ver-sions, the Matrix Analogies Test-Short Form (MAT-SF;Naglieri, 1985a) and Matrix Analogies Test-ExpandedForm (MAT-EF; Naglieri, 1985b), was constructed usingitems that are least influenced by color-impaired vision (onlythe colors white, black, blue, and yellow are used). Secondthe NNAT is well standardized on a sample of more than89,000 students in grades K-12. Third, the psychometricproperties of the test are amply documented (Naglieri,1997b). Finally, there is a research base on the NNAT and itsearlier versions (the MAT-EF and MAT-SF) that support itsuse for diverse populations of children.
Naglieri's progressive matrices tests have a history ofyielding small differences between White and minoritygroups. Naglieri (1985b) summarized the results of twostudies involving minority children conducted using theoriginal versions of the NNAT, the MAT-SF and MAT-EF standardization sample. White (n = 336) and Black (n =
336) children matched on school, gender, and age in yearsperformed similarly (effect size = 0.17 or about 2.6 standardscore points) on the MAT-SF. Results for the MAT-EFwere similar; matched samples ofWhite (n = 55) and Black(n = 55) children earned standard scores (mean of 100, SD
-I.Ml ..
11

of 15) of 90.6 and 90.0, respectively. In other research, theMAT correlated significantly with the WechslerIntelligence Scale for Children-Revised (WISC-R;Wechsler, 1974) Performance IQ Scale (r = .43, p < .001)and Raven's Progressive Matrices (r = .64, p < .001) for asample of 114 Native American students (Naglieri, 1985b).
In addition to these initial studies conducted on thefirst editions of progressive matrices tests by Naglieri(1985a, 1985b), there has been one published study thatexamined differences between matched samples of Whitewith Black, Hispanic, and Asian American children on thesecond edition (NNAT; Naglieri, 1997a). In this study,Naglieri and Ronning (2000a) examined differencesbetween three matched samples ofWhite (n = 2,306) andBlack (n = 2,306); White (n = 1,176) and Hispanic (n =
1,176); and White (n = 466) and Asian (n = 466) childrenon the NNAT. They found only small differencesbetween the NNAT mean scores for the White and Blacksamples (d-ratio = .25 or about 4 standard score points) andminimal differences between the White and Hispanic (d-ratio = .17 or about 2.5 standard score points), as well asWhite and Asian groups (d-ratio = .02 or less than onestandard score point). Additionally, Naglieri and Ronning(2000b) found that the NNAT correlated similarly withachievement as measured by the Stanford AchievementTest (Ninth Edition) for the White and minority groups.This implies that children's performance on the NNAT ispredictive of their scores on a test of academic achieve-ment (SAT). The results also suggested that the NNATscores had utility for assessment of White and minoritychildren and that, should the NNAT be used for identifi-cation of gifted children, similar numbers of each popula-tion might be identified. The present study was conductedto examine the question of identification based upon anability score and to meet the need for more research on thesecond edition of this nonverbal test of ability.
Method
Participants
The sample included 20,270 children from theNNAT standardization sample tested during the fall of1995. These students are representative of the nationalschool population according to socioeconomic status(SES), urbanicity, and ethnicity (see Table 1). The dataprovided in Table 1 show that the characteristics of theseparate Black, Hispanic, and White groups are similar incomposition. There were comparable percentages of chil-
dren from the four regions except for West, which hadmore Black and Hispanic children. The groups differedslightly on urban, suburban, rural community settings.Most ofthe Black and White children were from suburbanand rural settings, while the Hispanic children were fairlyevenly dispersed from each setting. Socioeconomic datafor the groups showed that the White and Black sampleswere similar except that there were more Whites at themiddle SES level. The Hispanic sample had a large per-centage at the low and low middle levels of SES.
Instrument
The Naglieri Nonverbal Ability Test (Naglieri, 1997a)is a briefnonverbal measure of ability that does not requirethe child to read, write, or speak (Naglieri, 1997b). Thetest is a nonverbal measure of general ability comprised ofprogressive matrix items that utilize shapes and geometricdesigns interrelated through spatial or logical organization.All of the NNAT items require the child to examine therelationships among the parts of the matrix and determinewhich response is the correct one based only on the infor-mation provided in the matrix. The NNAT items areorganized into seven levels, each containing 38 itemsselected to be most appropriate for children at the grade orgrades for which that level is intended. Each level containsitems that overlap with adjacent higher and lower levels, aswell as unique items. Shared items were used to develop acontinuous scaled score across the entire standardizationsample. The seven levels and corresponding grades forwhich they are appropriate are as follows: A / K; B / 1; C /2; D / 3 & 4; E / 5 & 6; F / 7-9; G / 10-12.
NNAT raw scores are converted to Nonverbal AbilityIndex (NAI) standard scores set at a mean of 100 and SD of15 through an intermediate Rasch value called a scaled score.Level D ofthe NNAT was used as the base level to which allother levels were equated. The appropriate equating constantwas then added to the spring standardization Rasch item dif-ficulties of each level to produce a continuous Rasch abilityscale across all levels of the tests (for more information, seeNaglieri, 1997b). The internal reliability coefficients for theNNAT by grade range from .83 to .93 with a median inter-nal reliability across all levels of .87 (Naglieri, 1997b).
Data Analyses
The following question was addressed in this study: Arethe percentages of children who earned NNAT standardscores from 120 to 140 comparable by racial and ethnicgroups? This question is essential given the underrepresen-
0 0 Se I I 0

Ta b e 1
Demographic Characteristics of the NNAT Samples
White Black Hispanic
Variable n % n % n %
Total n 14,141 2,863 1,991
GenderMale 7,090 50.0 1,519 53.0 1,058 53.0Female 7,088 50.0 1,346 47.0 939 47.0
RegionNortheast 2,220 15.7 678 23.7 192 9.6Midwest 4,629 32.6 484 16.9 137 6.8Southeast 3,459 24.4 556 19.4 229 11.4West 3,872 27.3 1,147 40.0 1,444 72.1
UrbanicityUrban 411 3.3 302 11.0 604 31.2Suburban 5,476 44.6 1,536 56.1 827 42.8Rural 6,392 52.1 899 32.8 503 26.0
SES statusLow 2,353 19.2 568 20.8 813 42.0Low middle 2,464 20.1 716 26.2 567 29.3Middle 2,510 20.4 231 8.4 58 3.0High-middle 2,910 23.7 533 19.5 119 6.2High 2,042 16.6 689 25.2 377 19.5
tation of minority children in gifted education programs.
Frequency distributions of standard scores were computedby race or ethnic group to answer this question. Comparisonofthese frequency distributions allowed for determination ofthe percentage of each group that would meet the intellec-tual ability criteria based upon a standard score and corre-
sponding percentile cut-offpoint. In summary, the numbersand percentages of children who earned standard scores of120, as well as 125, 130, 135, and 140 or above (correspon-ding to the 91st, 95th, 98th, 99th, and 99.6th percentileranks) on the NNAT, were computed for each group.
R e s u I t s
The sample of 14,141 White children earned a mean
NNAT score of99.3 (SD = 16.7), which was similar to themean scores earned by the Black (n = 2,863; mean = 96.1;SD = 17.5) and Hispanic (n = 1,991; mean = 97.3; SD =
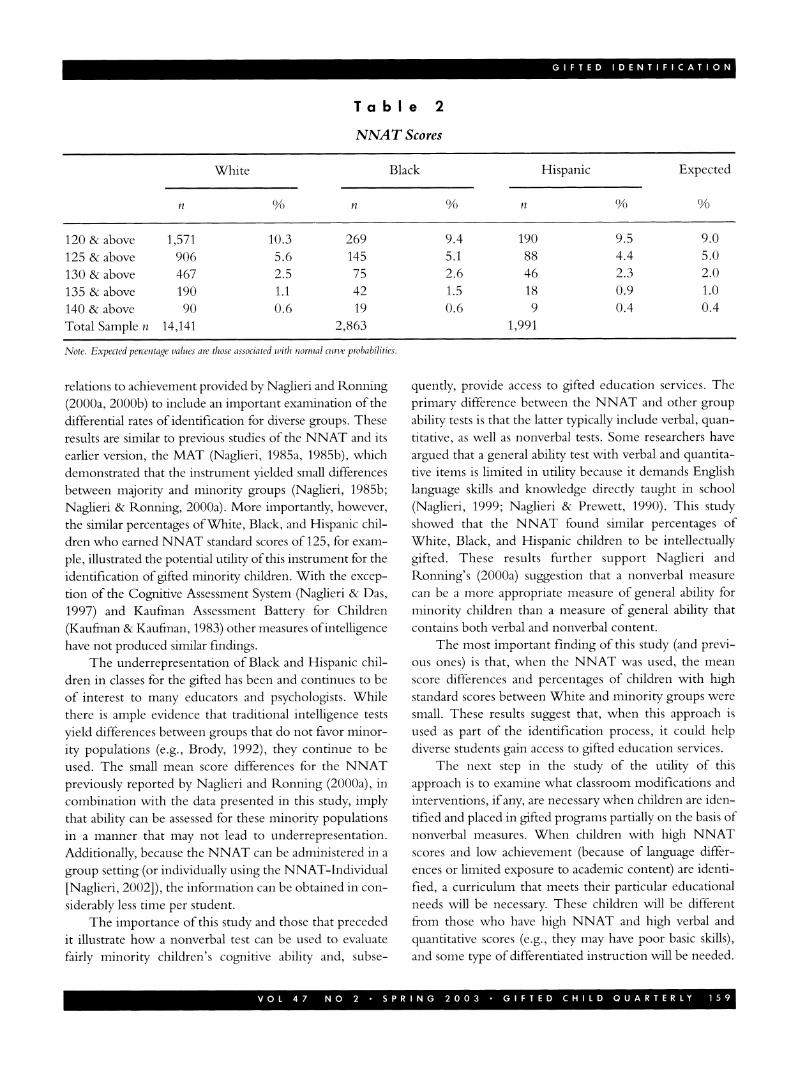
16.8) children. The percentages of children who earnedNNAT standard scores of 120 or higher, 125 or higher,
through 140 or higher are provided in Table 2. These val-ues show that there was similarity in the relative propor-
tions of students from the three groups. That is, 2.5% ofWhite, 2.6 % of Black, and 2.3% of Hispanic childrenearned NNAT standard scores at the 98th percentile (astandard score of 130). The NNAT standard score of 125(95th percentile) resulted in 5.6, 5.1, and 4.4% of theWhite, Black, and Hispanic samples, respectively. Thesedata imply that, if the NNAT were used as one of the cri-
teria in a system of identification of gifted children, simi-
lar percentages of White, Black, and Hispanic childrenwould be selected using the cut-offs of 125 or 130.
Discussion
The results of this investigation are consistent with pre-
vious research on the NNAT, which has shown that samplesof White and minority children perform similarly on thisnonverbal measure of ability. The findings, however, go
beyond the examination ofmean score differences and cor-
* 3 * .. 0O 0 0
Ta b I e 2
NNAT Scores
White Black Hispanic Expected
n % n 0o n 0%
120 & above 1,571 10.3 269 9.4 190 9.5 9.0125 & above 906 5.6 145 5.1 88 4.4 5.0130 & above 467 2.5 75 2.6 46 2.3 2.0135 & above 190 1.1 42 1.5 18 0.9 1.0140 & above 90 0.6 19 0.6 9 0.4 0.4Total Sample n 14,141 2,863 1,991
Note. Expected percentage values are those associated with normal cinve probabilities.
relations to achievement provided by Naglieri and Ronning(2000a, 2000b) to include an important examination of thedifferential rates of identification for diverse groups. Theseresults are similar to previous studies of the NNAT and its
earlier version, the MAT (Nagheri, 1985a, 1985b), whichdemonstrated that the instrument yielded small differencesbetween majority and minority groups (Naglieri, 1985b;Naglieri & Ronning, 2000a). More importantly, however,the similar percentages ofWhite, Black, and Hispanic chil-dren who earned NNAT standard scores of 125, for exam-ple, illustrated the potential utility of this instrument for theidentification of gifted minority children. With the excep-
tion of the Cognitive Assessment System (Naglieri & Das,1997) and Kaufman Assessment Battery for Children(Kaufman & Kaufman, 1983) other measures ofintelligencehave not produced similar findings.
The underrepresentation of Black and Hispanic chil-dren in classes for the gifted has been and continues to beof interest to many educators and psychologists. Whilethere is ample evidence that traditional intelligence tests
yield differences between groups that do not favor minor-
ity populations (e.g., Brody, 1992), they continue to beused. The small mean score differences for the NNATpreviously reported by Naglieri and Ronning (2000a), in
combination with the data presented in this study, implythat ability can be assessed for these minority populationsin a manner that may not lead to underrepresentation.Additionally, because the NNAT can be administered in a
group setting (or individually using the NNAT-Individual[Naglieri, 2002]), the information can be obtained in con-
siderably less time per student.The importance of this study and those that preceded
it illustrate how a nonverbal test can be used to evaluatefairly minority children's cognitive ability and, subse-
quently, provide access to gifted education services. Theprimary difference between the NNAT and other group
ability tests is that the latter typically include verbal, quan-
titative, as well as nonverbal tests. Some researchers haveargued that a general ability test with verbal and quantita-
tive items is limited in utility because it demands Englishlanguage skills and knowledge directly taught in school(Naglieri, 1999; Naglieri & Prewett, 1990). This studyshowed that the NNAT found similar percentages ofWhite, Black, and Hispanic children to be intellectuallygifted. These results further support Naglieri andRonning's (2000a) suggestion that a nonverbal measure
can be a more appropriate measure of general ability forminority children than a measure of general ability thatcontains both verbal and nonverbal content.
The most important finding of this study (and previ-
ous ones) is that, when the NNAT was used, the mean
score differences and percentages of children with highstandard scores between White and minority groups were
small. These results suggest that, when this approach is
used as part of the identification process, it could helpdiverse students gain access to gifted education services.
The next step in the study of the utility of thisapproach is to examine what classroom modifications andinterventions, if any, are necessary when children are iden-tified and placed in gifted programs partially on the basis ofnonverbal measures. When children with high NNATscores and low achievement (because of language differ-ences or limited exposure to academic content) are identi-fied, a curriculum that meets their particular educationalneeds will be necessary. These children will be differentfrom those who have high NNAT and high verbal andquantitative scores (e.g., they may have poor basic skills),and some type of differentiated instruction will be needed.
S 0 0@ I I 0

Researchers should carefully study the implications of sucha potential change in the results of identification and howto teach children who score very well on nonverbal tests ofability, but have lower levels of achievement. They shouldalso examine issues like how long it will take for these stu-dents to obtain high levels ofachievement. These and otherissues should be examined so that we can more fullyaddress the problem of underrepresentation of minoritychildren in classes for the gifted. In the mean time, we mustremember that a significant segment of our student popu-lation-culturally and linguistically diverse students havebeen consistently and significantly underrepresented in ourgifted programs; thus, new answers to this persistent prob-lem must be pursued. Nonverbal intelligence tests showpromise for increasing the opportunity for diverse studentsto participate in gifted education programs.
References
Bracken, B. A., & McCallum, R. S. (1998). Universal nonverbalintelligence test. Itasca, IL: Riverside.
Brody, N. (1992). Intelligence. San Diego: Academic Press.de Bernard. A. E. (1985). WhyJose can't get into the gifted class:
The bilingual child and standardized reading tests. RoeperReview, 8, 80-82.
Ford, D. Y. (1998). The underrepresentation of minority stu-dents in gifted education: Problems and promises in recruit-ment and retention.Journal ofSpecial Education, 32, 4-14.
Frazier, M. M., Martin, D., Garcia, J., Finley, V. S., Frank, E.,Krisel, S., et al. (1995). A new windowfor looking atgfted chil-dren. Storrs: National Research Center on the Gifted andTalented, University of Connecticut.
Hayes, S. C. (1999). Comparison of the Kaufman BriefIntelligence Test and the Matrix Analogies Test-ShortForm in an adolescent forensic population. PsychologicalAssessment, 11, 108-110.
Jensen, A. R. (1980). Bias in mental testing. New York: Free Press.Kaufman, A. S. (1994) Intelligent testing with the WISC-III. New
York: Wiley.Kaufman, A. S., & Kaufman, N. L. (1983). Kaufman assessment
battery for children. Circle Pines, MN: American GuidanceService.
Mills, CJ., & Tissot, S. L. (1995). Identifying academic potentialin students from under-represented populations: Is usingthe Ravens Progressive Matrices a good idea? Gifted ChildQuarterly, 39, 209-217.
Naglieri, J. A. (1985a). Matrix analogies test-Short form. SanAntonio, TX: The Psychological Corporation.
Naglieri, J. A. (1985b). Matrix analogies test-Expandedform. SanAntonio, TX: The Psychological Corporation.
Naglieri, J. A. (1997a). Naglieri nonverbal ability test. San Antonio,TX: The Psychological Corporation.
Naglieri, J. A. (1997b). NNAT multilevel technical manual. SanAntonio, TX: The Psychological Corporation.
Naglieri, J. A. (1999). Essentials of CAS assessment. New York:Wiley.
Naglieri, J. A., & Das, J. P. (1997). Cognitive assessment system.Itasca, IL: Riverside
Naglieri, J. A., & Prewett, P. N. (1990). Nonverbal intelligence:A selected review of instruments and their use. In R. W.Kamphaus & C. R. Reynolds (Eds.), Handbook ofpsychologi-cal and educational assessment: Volume I: Intelligence and achieve-ment (pp. 348-370). New York: Guilford Press.
Naglieri, J. A., & Ronning, M. E. (2000a). Comparison ofWhite, African-American, Hispanic, and Asian children onthe Naglieri Nonverbal Ability Test. Psychological Assessment,12, 328-334.
Naglieri, J. A., & Ronning, M. E. (2000b). The relationshipsbetween general ability using the NNAT and SAT readingachievement. Journal of Psychoeducational Assessment, 18,230-239.
Naglieri, J. A., & Yazzie, C. (1983). Comparison of the WISC-R and PPVT-R with Navajo children. Journal of ClinicalPsychology, 39, 598-600.
Nicholson, C. L. (1989). Matrix Analogies Test (MAT).Diagnostique, 15, 115-123.
Raven, J. C. (1947). Coloured progressive matrices. London: H. K.Lewis.
Sattler, J. M. (1988). Assessment of children (3rd ed). San Diego,CA: Sattler.
Sternberg, R. J. (1985). Beyond IQ: A triarchic theory ofhuman intel-ligence. New York: Cambridge University Press.
Thorndike, R. I., Hagen, E. P., & Sattler, J. M. (1986). Stanford-Binet intelligence scale: Fourth edition. Itasca, IL: Riverside.
Vincent, K. R. (1991). Black/White IQ differences: Does agemake the difference? Journal of Clinical Psychology, 47,266-270.
Wasserman, J. D., & Becker, K. A. (2000). Racial and ethnic groupmean score differences on intelligence tests. Paper presented at theannual meeting of the American Psychological Association,Washington, DC.
Wechsler, D. (1974). Wechsler intelligence scalefor children-Revised.San Antonio, TX: The Psychological Corporation.
Wechsler, D. (1991). Wechsler intelligence scalefor children-Third edi-tion. San Antonio, TX: The Psychological Corporation.
Woodcock, R. W., & Johnson, M. B. (1989). Woodcock-Johnsonrevised tests of achievement: Standard and supplemental batteries.Itasca, IL: Riverside.
Zurcher, R. (1998). Issues and trends in culture-fair assessment.Intervention in School and Clinic, 34, 103-106.
Author Note
This research was supported in part by grantR215K010121 from the U.S. Department ofEducation.
.0 m i i i i i. i 0 0I0