Addressing the Needs of Older People in World Cities Age-Friendly World Cities & Environment October...
18
Addressing the Needs of Older People in World Cities Age-Friendly World Cities & Environment October 8-9, 2010 Michael K. Gusmano, Ph.D Research Scholar The Hastings Center
-
Upload
daniel-waters -
Category
Documents
-
view
215 -
download
0
Transcript of Addressing the Needs of Older People in World Cities Age-Friendly World Cities & Environment October...
Addressing the Needs of Older People in World Cities
Age-Friendly World Cities & EnvironmentOctober 8-9, 2010
Michael K. Gusmano, Ph.DResearch Scholar
The Hastings Center

Acknowledgements
Thanks to our project team:Pui Hing Chau
Jean WooDaniel Weisz
Victor G. Rodwin
Thanks to our funders:The CADENZA Project
The University of Hong Kong,
Faculty of Social Sciences
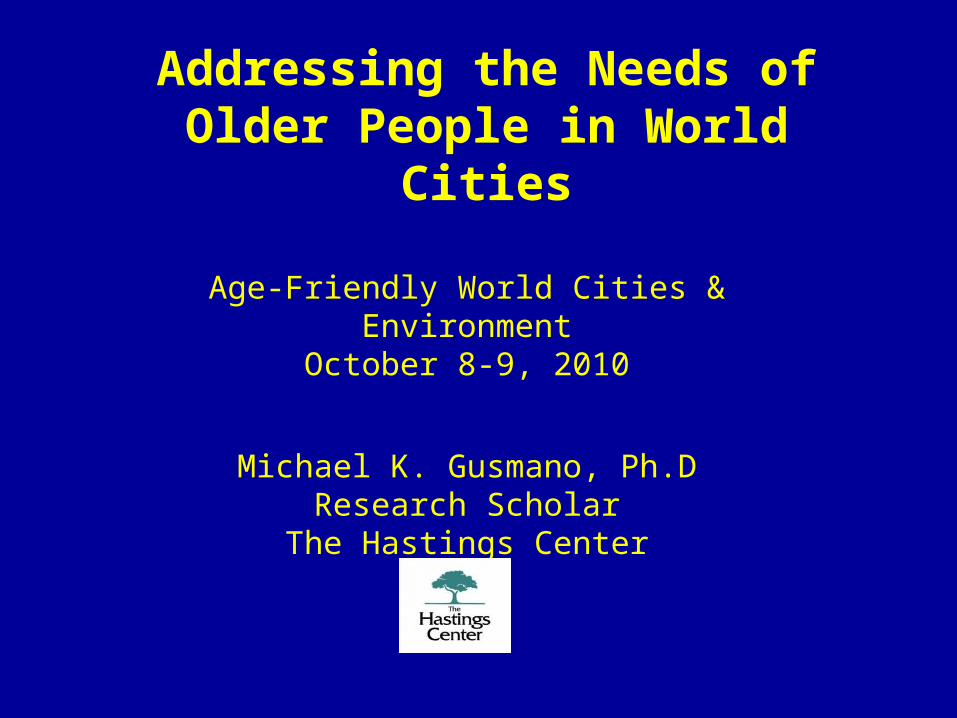
Aging in World CitiesPopulation 65+
Total Percent
Hong Kong (2008)
897,600 12.6%
Greater London (2007)
891,590 11.7%
New York City (2008)
1,037,780 12.4%
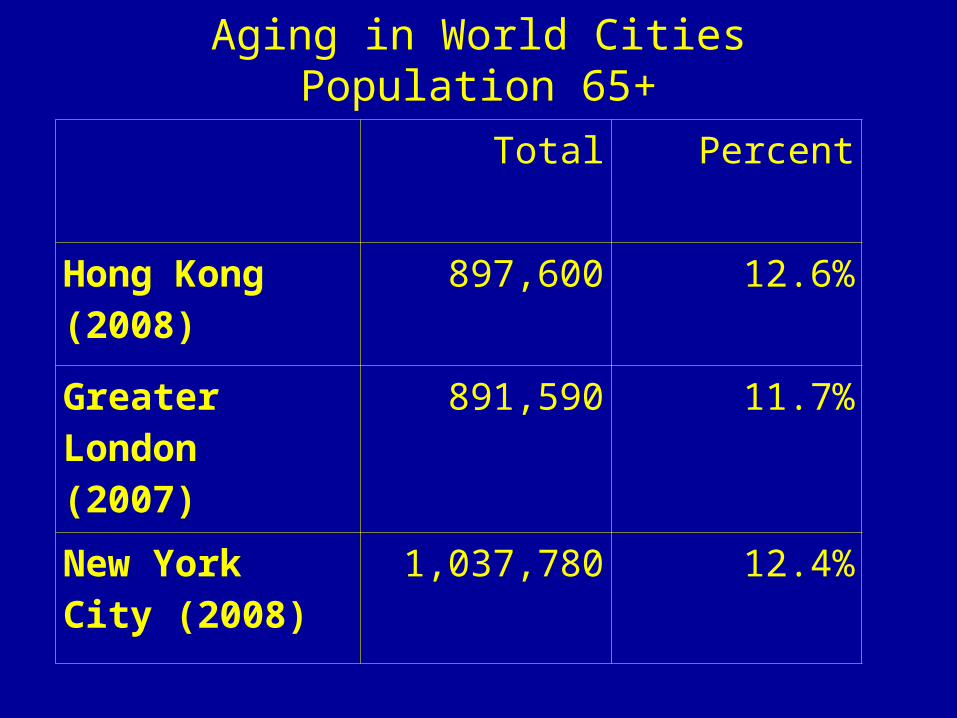
Life Expectancy at 65Males Females
Hong Kong (2008)
18.1 22.9
Greater London (2005-7)
17.8 20.7
New York City (2006)
17.9 21.1
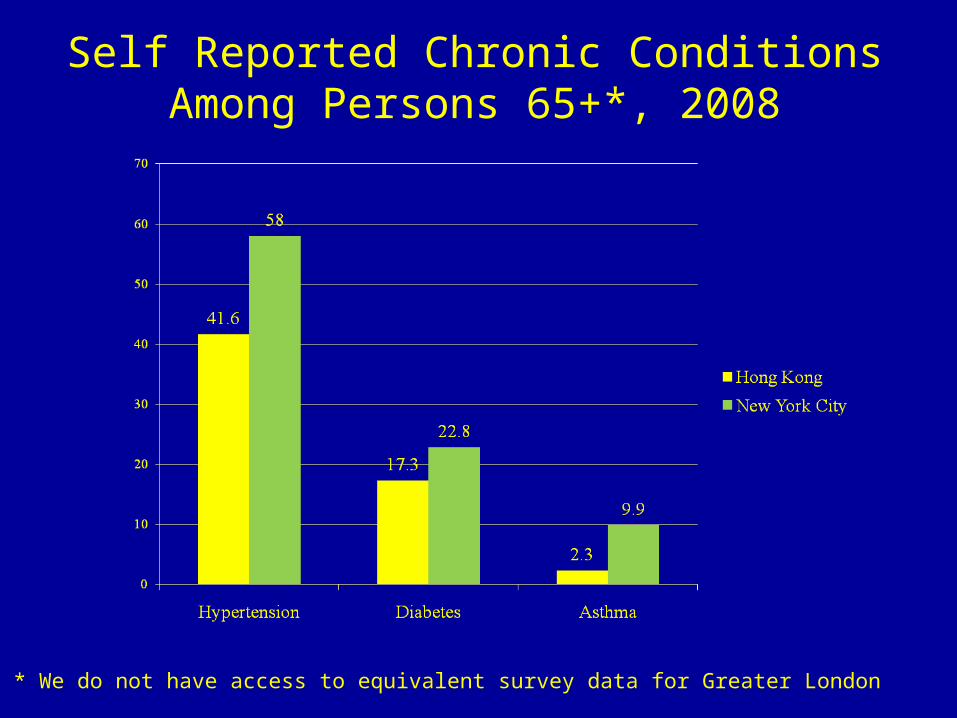
Self Reported Chronic Conditions Among Persons 65+*, 2008
* We do not have access to equivalent survey data for Greater London
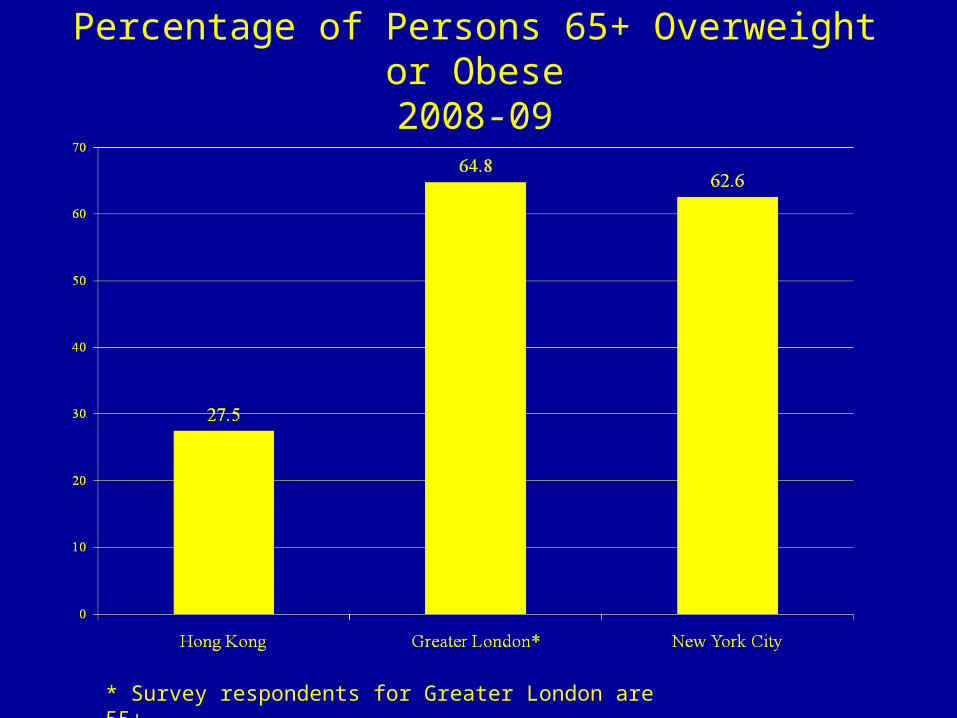
* Survey respondents for Greater London are 55+
Percentage of Persons 65+ Overweight or Obese
2008-09
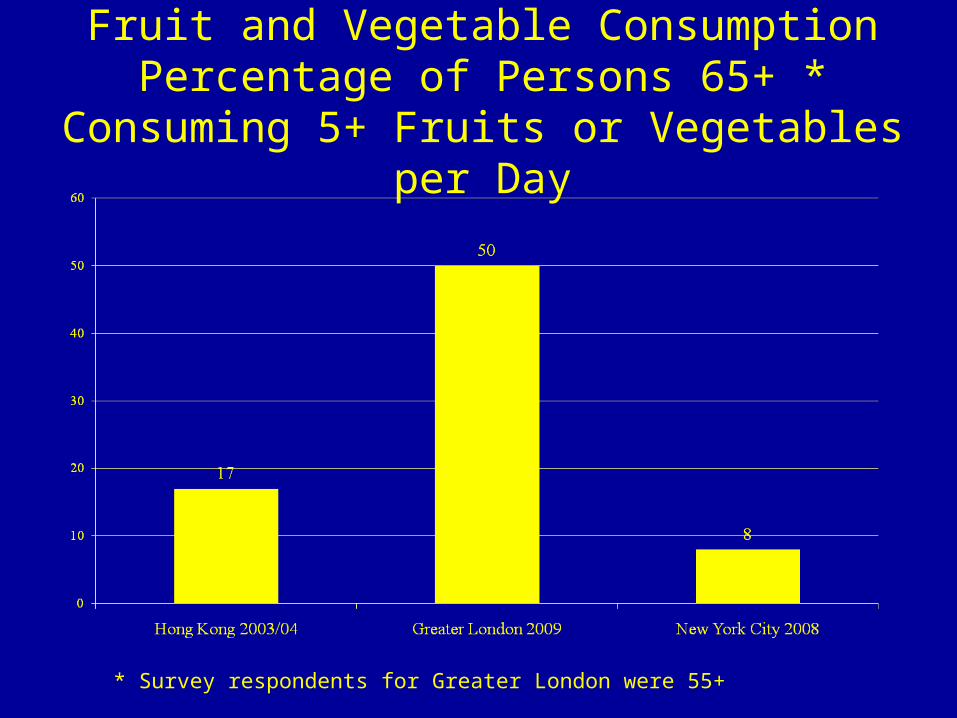
Fruit and Vegetable ConsumptionPercentage of Persons 65+ * Consuming 5+ Fruits
or Vegetables per Day
* Survey respondents for Greater London were 55+

Current SmokerPercentage of Persons 65+*
* Survey respondents are 55+ in Greater London and 60+ in Hong Kong
11.4
16.3
9
0
2
4
6
8
10
12
14
16
18
Hong Kong 2008 Greater London 2009 New York City 2008
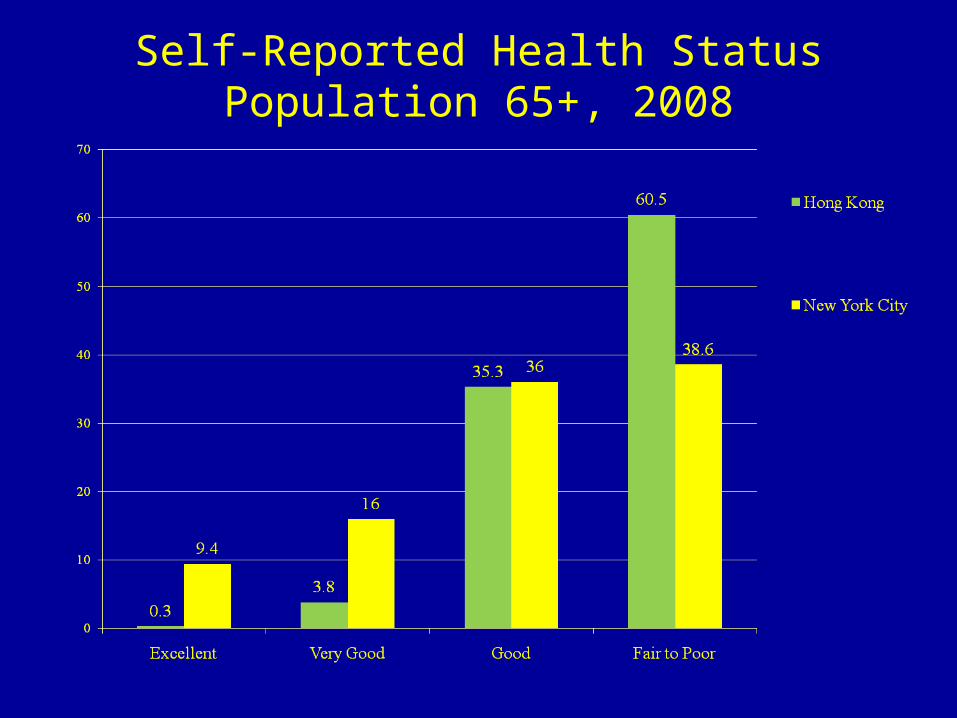
Self-Reported Health StatusPopulation 65+, 2008
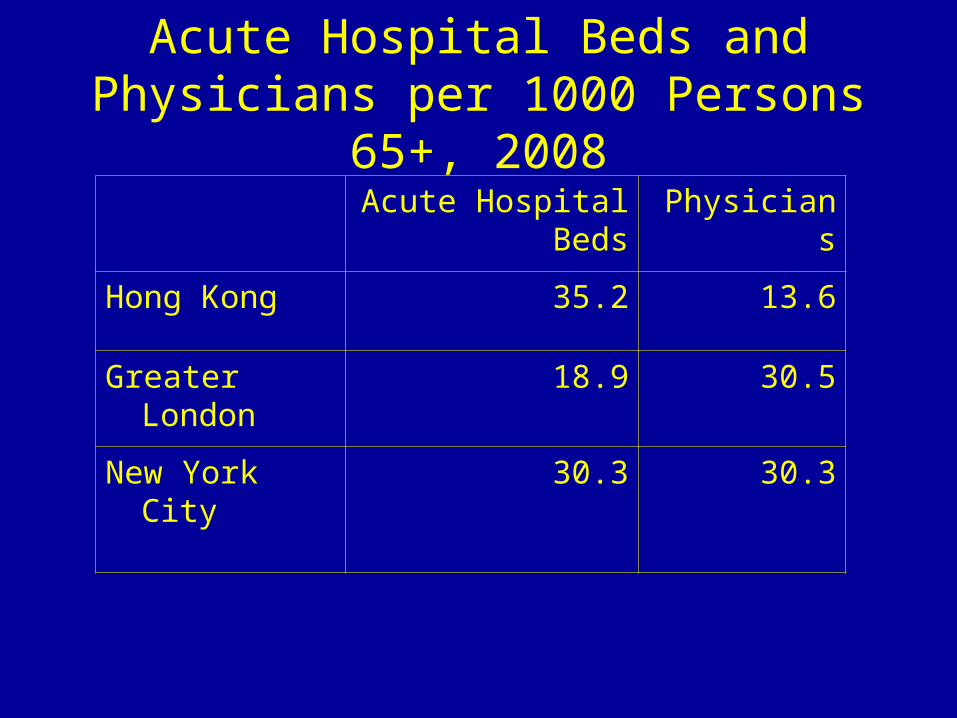
Acute Hospital Beds and Physicians per 1000 Persons
65+, 2008Acute Hospital
BedsPhysicians
Hong Kong 35.2 13.6
Greater London
18.9 30.5
New York City 30.3 30.3
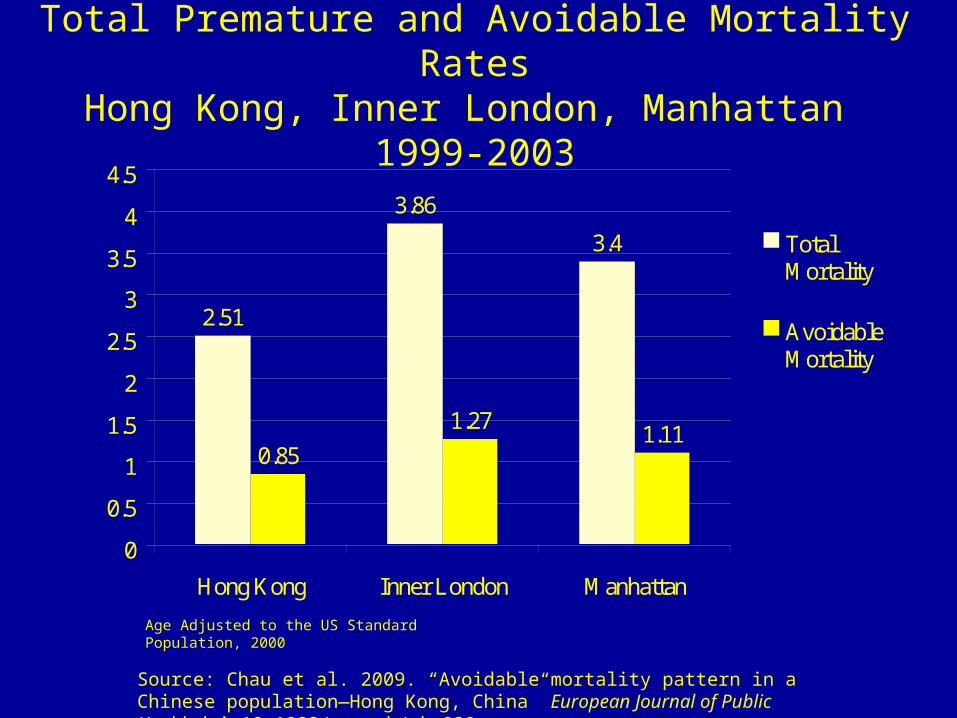
Total Premature and Avoidable Mortality RatesHong Kong, Inner London, Manhattan
1999-2003
2.51
3.86
3.4
0.85
1.271.11
0
0.5
1
1.5
2
2.5
3
3.5
4
4.5
Hong Kong Inner London Manhattan
TotalMortality
AvoidableMortality
Source: Chau et al. 2009. “Avoidable mortality pattern in a Chinese population—Hong Kong, China” European Journal of Public Health doi:10.1093/eurpub/ckq020
Age Adjusted to the US Standard Population, 2000
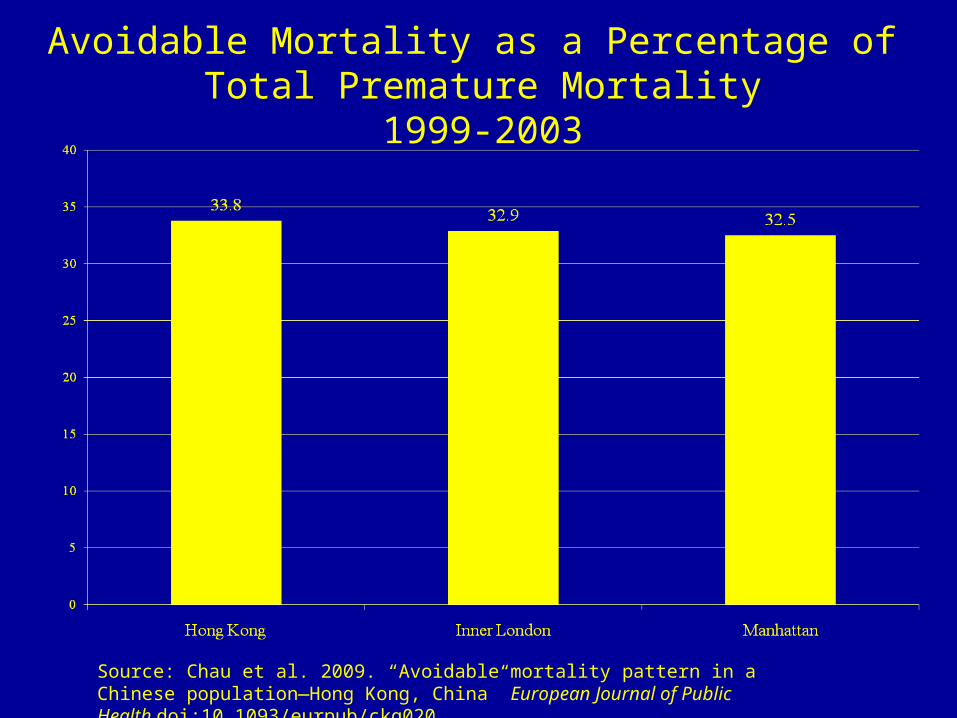
Avoidable Mortality as a Percentage of Total Premature Mortality
1999-2003
Source: Chau et al. 2009. “Avoidable mortality pattern in a Chinese population—Hong Kong, China” European Journal of Public Health doi:10.1093/eurpub/ckq020
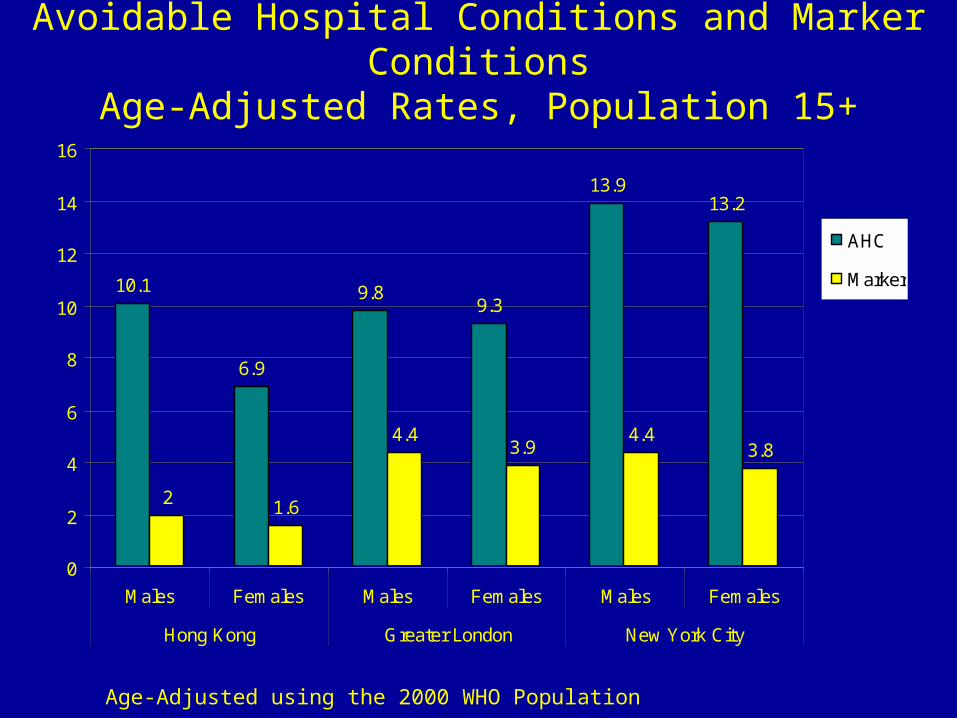
Avoidable Hospital Conditions and Marker Conditions
Age-Adjusted Rates, Population 15+
Age-Adjusted using the 2000 WHO Population
10.1
6.9
9.89.3
13.913.2
2
4.43.9
4.43.8
1.6
0
2
4
6
8
10
12
14
16
Males Females Males Females Males Females
Hong Kong Greater London New York City
AHC
Marker
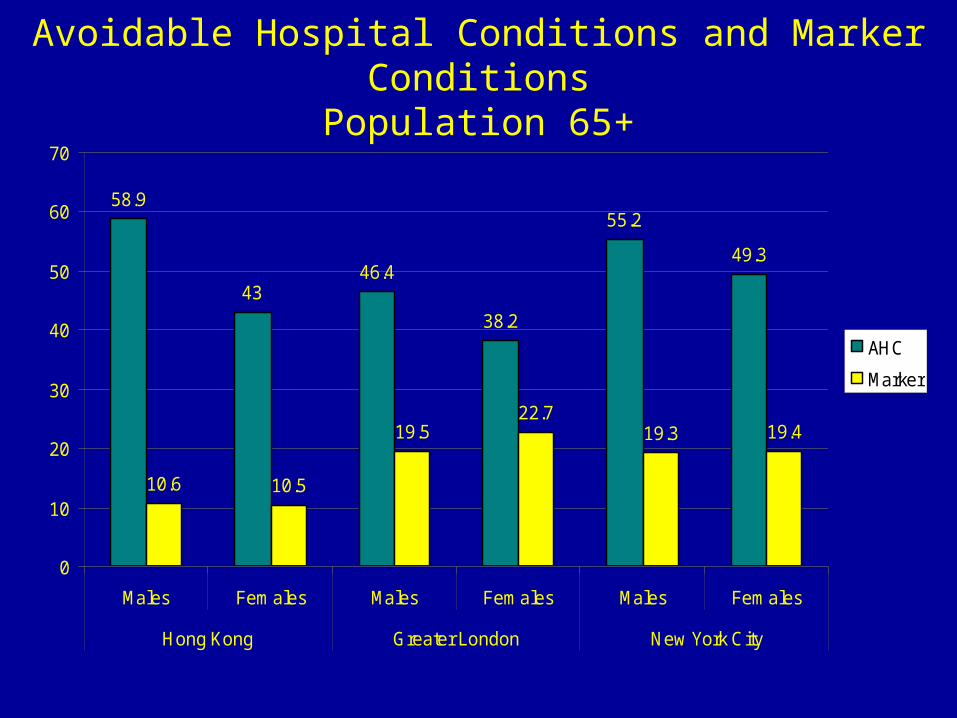
Avoidable Hospital Conditions and Marker Conditions
Population 65+
58.9
4346.4
38.2
55.2
49.3
10.6 10.5
19.522.7
19.3 19.4
0
10
20
30
40
50
60
70
Males Females Males Females Males Females
Hong Kong Greater London New York City
AHC
Marker
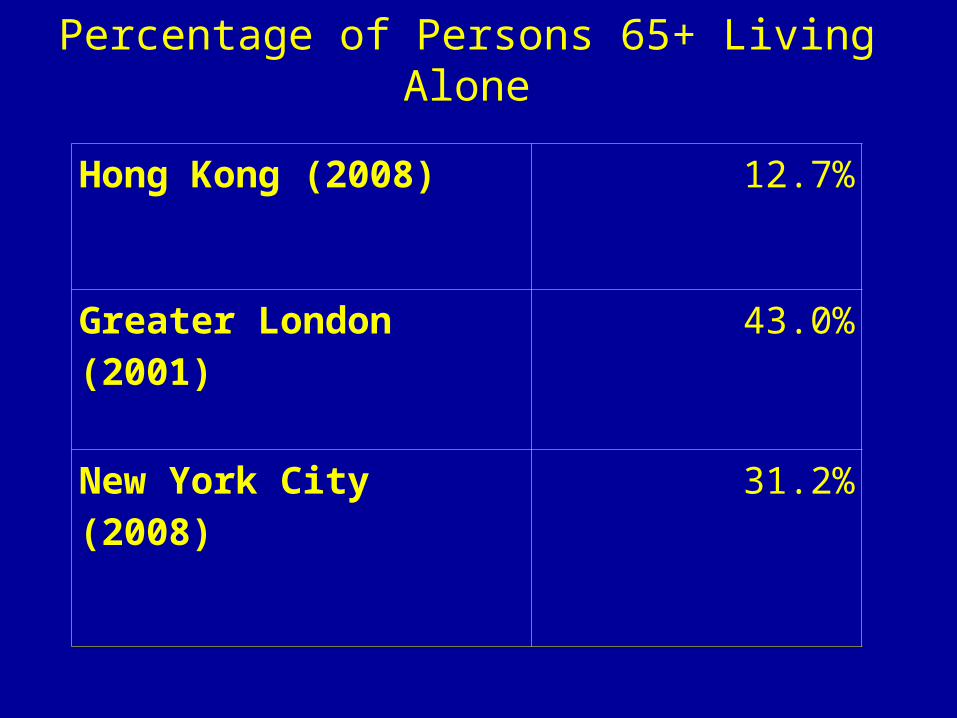
Percentage of Persons 65+ Living Alone
Hong Kong (2008) 12.7%
Greater London (2001)
43.0%
New York City (2008) 31.2%
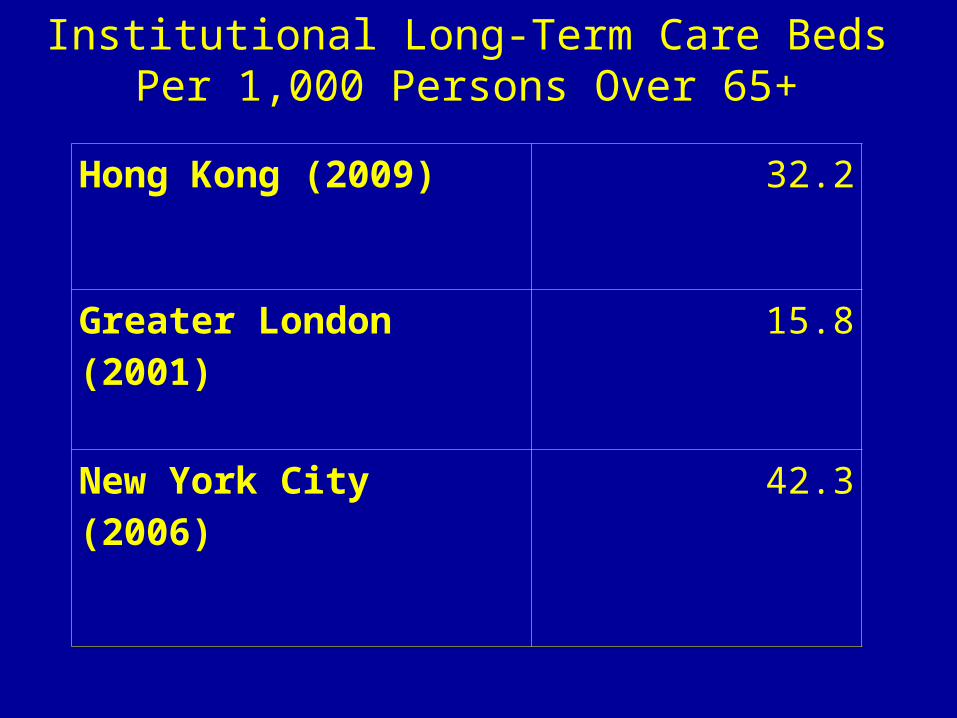
Institutional Long-Term Care Beds Per 1,000 Persons Over 65+
Hong Kong (2009) 32.2
Greater London (2001)
15.8
New York City (2006) 42.3
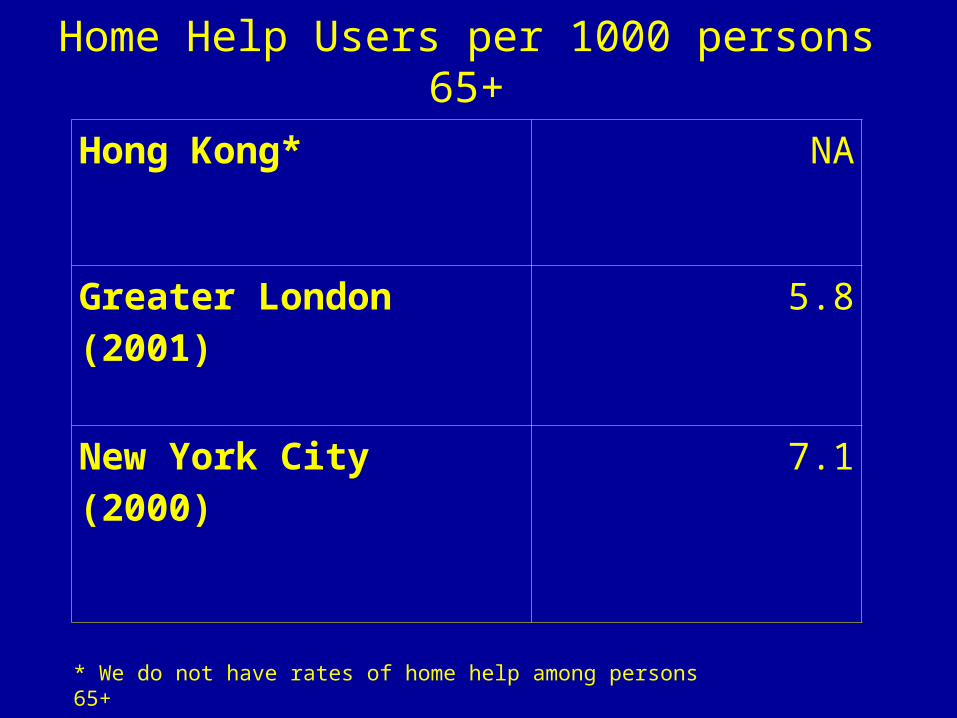
Home Help Users per 1000 persons 65+
Hong Kong* NA
Greater London (2001)
5.8
New York City (2000) 7.1
* We do not have rates of home help among persons 65+
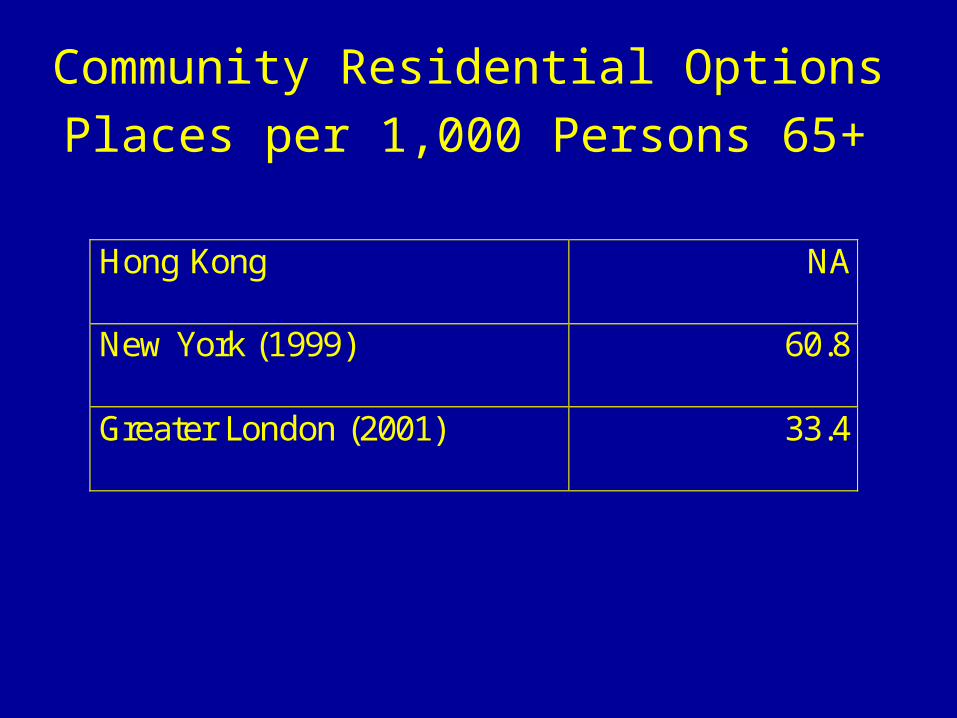
Community Residential Options Places per 1,000 Persons 65+
Hong Kong NA
New York (1999) 60.8
Greater London (2001) 33.4