Addressing New Environmental Regulations John N. Voyles, Jr. Vice President, Transmission &...
39
Addressing New Environmental Regulations John N. Voyles, Jr. Vice President, Transmission & Generation Services KIUC Annual Energy Conference, March 2014
-
Upload
brittney-lier -
Category
Documents
-
view
216 -
download
2
Transcript of Addressing New Environmental Regulations John N. Voyles, Jr. Vice President, Transmission &...

Addressing New Environmental Regulations
John N. Voyles, Jr. Vice President, Transmission & Generation Services
KIUC Annual Energy Conference, March 2014

Drivers from Recent EPA Regulations
Mercury & Air Toxics Standards
(MATS)
Cross State Air Pollution Rule (CSAPR)
National Ambient Air Quality Standards (NAAQS)
Page 2

LG&E and KULeast-Cost Compliance Plans
Page 3
Coal Capacity
Trimble County
Mill Creek
Ghent
E.W. Brown
Install additional clean coal technology at 4 largest stations

LG&E and KULeast-Cost Compliance Plans
Page 4
Coal Capacity
Trimble County
Mill Creek
Ghent
E.W. Brown
Additional control technology construction progressing

LG&E and KULeast-Cost Compliance Plans
Page 5
Coal Capacity
Retire 800 MW at 3 coal-fired stations
Cane Run Green River
Tyrone

Cane Run 7 Natural Gas Combined Cycle Construction Progressing
Page 6

EPA Regulations Still to Comewith Significant Ramifications
• Coal Combustion Residuals (CCR)
• Greenhouse Gas — New& Existing SourcePerformance Standards
• National Ambient Air QualityStandards (Ozone and PM2.5)
• Effluent Guidelines & 316 (b)
Page 7
Purchased Electricityfor Own Use
Company-OwnedVehicles
Fuel Combustion
ProductUse
Outsourced Activities
Contractor-OwnedVehicles
Waste Disposal
Employee BusinessTravel
Production ofPurchased Materials
Scope 1Direct
Scope 2Indirect
Scope 3Indirect
CO2 SF6 CH4 N2O

Coal Combustion Residual (CCR) Treatment Facilities & Dry Landfills
Page 8
• Dewatering systems• Beneficial reuse transfer
systems• Conveying systems
• Transport systems• Lined landfill• Leachate collection• Groundwater monitoring
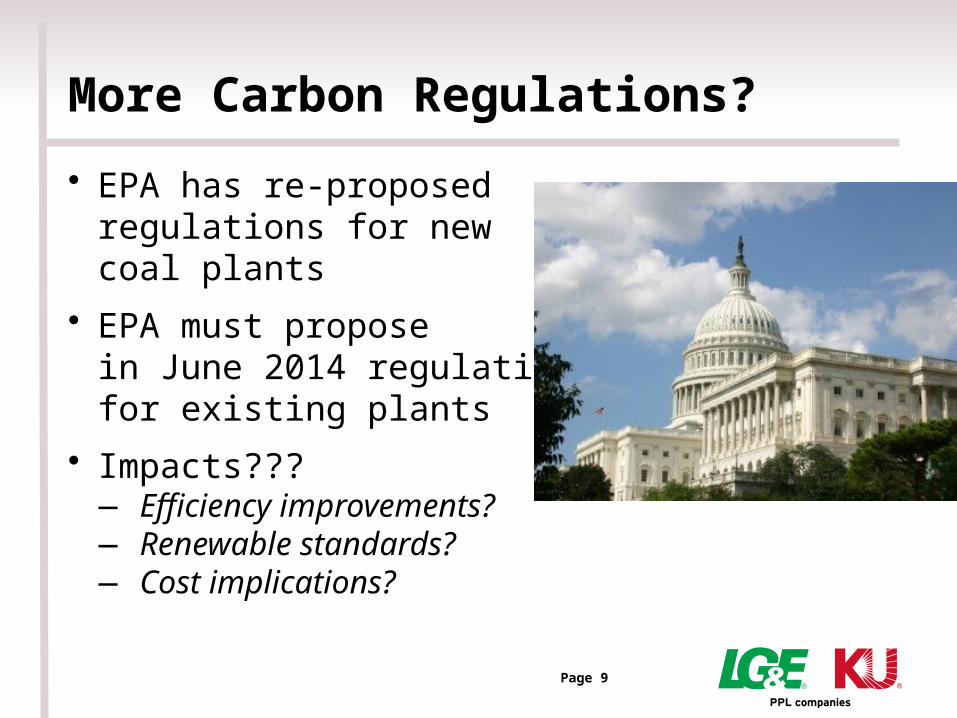
More Carbon Regulations?
• EPA has re-proposedregulations for newcoal plants
• EPA must proposein June 2014 regulations for existing plants
• Impacts???— Efficiency improvements?— Renewable standards?— Cost implications?
Page 9
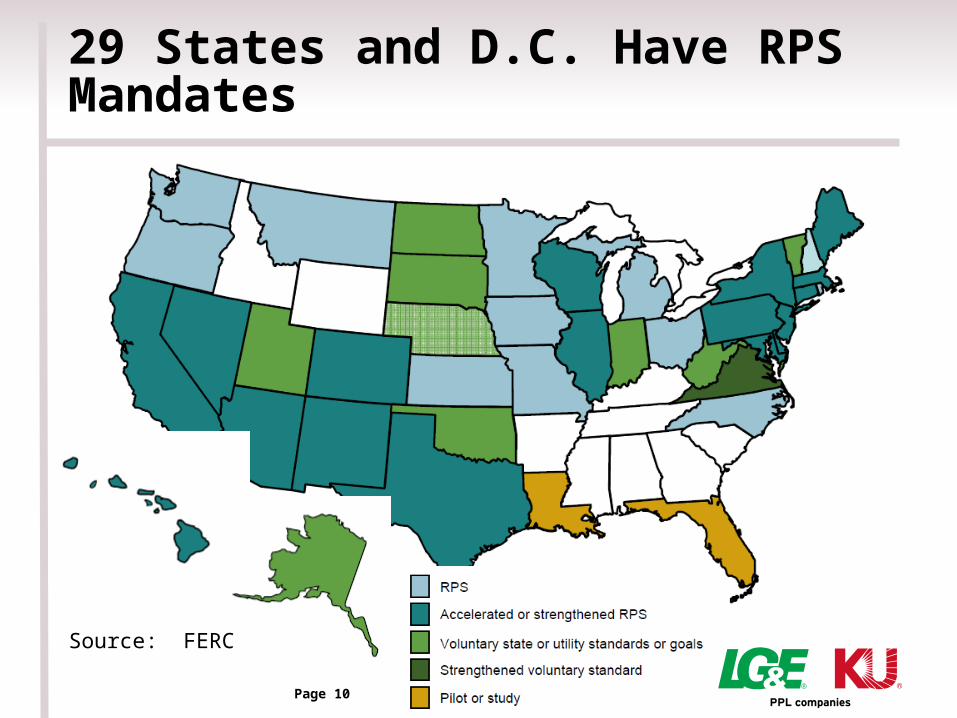
29 States and D.C. Have RPS Mandates
Page 10
Source: FERC

NAAQS — Revised Ozone Standard?
•EPA re-evaluates standards every 5 years
•2012 — The President delayed the release of the 2008 proposed ozone revision
•EPA expected to issue ozone proposal this year
•Ozone Transport Region (OTR) states petition to expand original participants
Page 11

Effluent Limitation Guidelines(Plant Waste Water Streams)
Page 12
Bottom Ash Transport
Boiler Blowdown
Fly Ash TransportWater & Ash Pond
Effluent
WFGD & WESPBlowdown
Misc. Water Usage
Coal Pile RunoffCooling Tower BlowdownMetal Cleaning Wastes

Meeting FutureCapacity Needs in a World of Uncertainty

Generation Supply is ChangingDue to Retirements
• Recent press clipping…— “MISO will fall below [reserve margin] targets during
the 2015 summer season. If resources do not come on-line, an increased likelihood of firm load shedding is possible.” (2013 Long-term Reliability Assessment; NERC).
• 37 GWs of announced retirements by 2015 in Eastern Interconnect— PJM and MISO reserve margin forecasted to decline
precipitously (PJM – from 31% today to 21% in 2018; MISO – from 18% today to 12% in 2015).
• Problems were widespread during January cold temps— TVA declared energy emergency alerts on 3 occasions
in January 2014.— PJM experienced non-firm natural gas curtailments and
20% EFOR.— SCE&G had rolling blackouts from high load and
outages.
Page 14
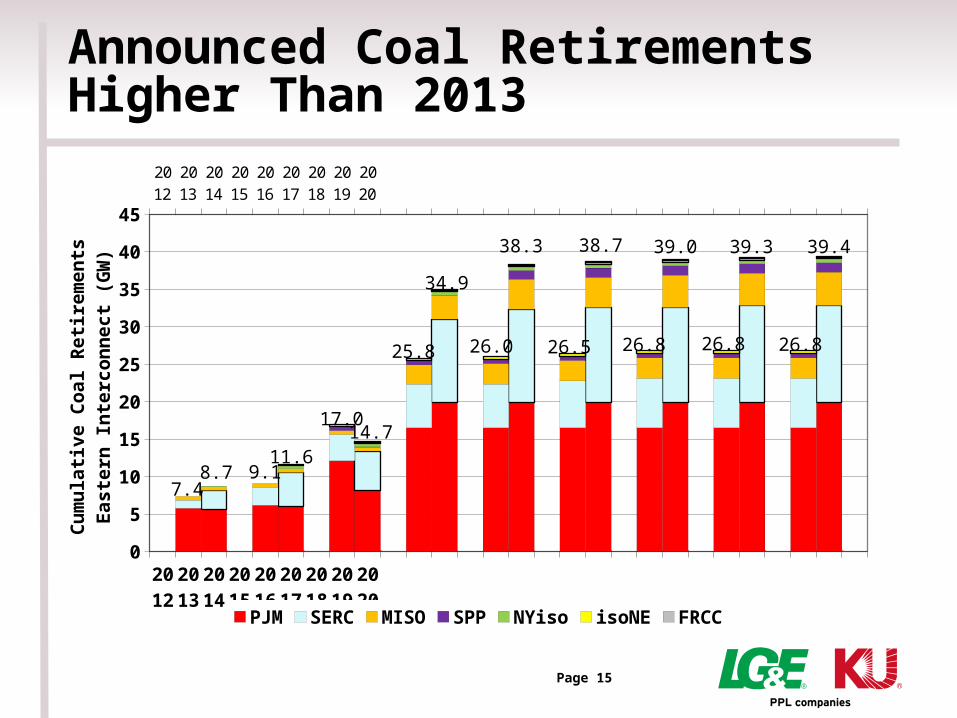
Announced Coal RetirementsHigher Than 2013
2012
2013
2014
2015
2016
2017
2018
2019
2020
2012
2013
2014
2015
2016
2017
2018
2019
2020
0
5
10
15
20
25
30
35
40
45
PJM SERC MISO SPP NYiso isoNE FRCC
Cu
mu
lati
ve C
oal
Reti
rem
en
tsEaste
rn I
nte
rcon
nect
(GW
)
8.7 9.1 11.6
17.0 14.7
25.8
7.4
34.9
26.0
38.3 38.7
26.5
39.0
26.8
39.4
26.8 26.8
39.3
Page 15

Weather Impacts Can Resultin Higher-Than-Expected Loads
January 6-7, 2014 weather• Temperatures up to 30°
F below normal with low of-4 °F
• Winds of 10-25 mph with gusts up to 33 mph
Page 16

Renewables Contribute Intermittently. . .
• Limited potential for renewable generation at peak— No solar (new winter peak set after 8 p.m.)— Strong but variable winds diminished quickly— MISO wind gen. at peak hour dropped 86% from
Jan. 6 to Jan. 7
Page 17
Load
Diminishing
Note: Wind speed does not correlate to load

System Planners Consider Key Uncertainties
• Key uncertainties for potential capacity additions— Range of natural gas prices— CO2 regulations — Range of load forecast
(peak and energy)• Using a probability for each
scenario, a plan with theexpected lowest reasonablecost is identified
• Consider a range of outcomesin combination to minimizecosts Page 18

A Range of Economic Forecastsare Considered…
Page 19
Source: IHS Global Insight
10,000
20,000
30,000
40,000
GDP
($ B
illio
ns)
Base Optimistic Pessimistic
High
Base
Low

Also a Range of Natural Gas Prices…
Page 20
- 2 4 6 8
10 12 14 16 18 20
$/M
MBtu
EIA-AEO 2013 Base EIA-AEO 2013 High EIA-AEO 2013 Low
Source: Energy Information Administration
High
Med
Low

And Potential CO2 Prices
Page 21
-
20
40
60
80
100
120
140
160
$/sh
ort to
n
Low Mid High
Source: Synapse Energy Economics
High
Med
Low

Comparative Levelized Costs of Electricity of Dispatchable Technologies — 2015
Page 22Baseload technologies

Comparative Levelized Costs of Electricity of Non-Dispatchable Technologies* — 2015
Page 23Without integration costs

Examine AlternativesAcross a Range of Scenarios
• Prefer NGCC in low-gas and carbon scenarios. Need NGCC for base load in carbon scenarios.
• NGCC is not unfavorable in any scenario.• Coal response only favorable in high gas, zero
carbon scenarios.• Simple Cycle CT not desirable in carbon scenarios.• High capital cost and limited dispatch flexibility
reduce value of wind and solar.Page 24
Gas Med Med Med Med High High High High Low Low Low LowLoad Base Base Low Low Base Base Low Low Base Base Low Low
Alternative Carbon Zero Med Zero Med Zero Med Zero Med Zero Med Zero MedNatural Gas Combined CycleCoalSimple Cycle CT Renewables
<-Better/Worse->

Green River Station
Page 25

Green River 5 — Natural Gas Combined Cycle Unit
Page 26
Similar to rendition of the Cane Run 7 NGCC

Photovoltaic (PV) Solar Resources
Page 27
PV Array in Spain
48 MW380 acres

Potential Solar Array LocationE.W. Brown Station
Page 28
LG&E and KUPV Array~10 MW
~ 100 acres

Total Capital Required Trends(2009 versus 2012)
Page 29
2009
2012
PC NGCC Nuclear Onshore Wind
CSP PV0
1,000
2,000
3,000
4,000
5,000
6,000
7,000
8,000
9,000
Tota
l C
apit
al R
equir
ed (
$/k
W)

Levelized Cost of Electricity Trends2009 versus 2012
Page 30
2009
2012
PC NGCC Nuclear Onshore Wind
CSP PV0
50
100
150
200
250
300
350
400
450
500
Levelize
d C
ost
of
Ele
ctri
city
($/M
Wh)

Portfolio in Transition: Combined Cycle Gas Will Be 15% of Capacity by 2019
Page 31

Portfolio in Transition: 25% of Energy From Two NGCC Units by 2019
Page 32
1% non-fossil

Non-Fossil Resources Increasing by 40% Since 2005 (Nameplate Capacity)
Page 33
~ 40%
* Solar capacity addition only if approved by KPSC
MW

Non-Fossil Energy Increasing 50% Since 2005(Intermittent Output Based on Resource)
Page 34
~ 50%
* Solar energy addition only if approved by KPSC
GW
h

2014–2018 Capital Investments
Page 35
No investments included for GHG regulations

Electricity Generation by Fuel,1990-2040 (Trillion kWh by Year)
Page 36
Source: http://www.eia.gov/forecasts/aeo/er/pdf/0383er(2013).pdf

Regional Rate Comparison — Industrial
Page 37
5.15¢ 6.52¢6.02¢
6.30¢
6.38¢
5.71¢
LG&E and KU — 5.64¢
5.35¢
U.S. Industrial Average per kWh is 6.60 cents
Source: Edison Electric Institute, Winter 2012, Typical Bills and Average Rates Report

Closing Thoughts
• Current and future EPA regulations continue to impact investments and energy costs.
• Supply side retirements during 2015 and 2016 will likely present transitions issues for the grid.
• Key uncertainties impact near-term and long-term alternative supply resource options.
• Renewable energy resources can be a part of a portfolio.
• LG&E and KU continue to pursue least reasonable cost options for these challenges.
Page 38of Electricity