Additive Manufacturing of Porous Titanium Structures for ...
132
Additive Manufacturing of Porous Titanium Structures for Use in Orthopaedic Implants by Ahmad Basalah A thesis presented to the University of Waterloo in fulfilment of the thesis requirement for the degree of Doctor of Philosophy in Mechanical Engineering Waterloo, Ontario, Canada, 2015 ©Ahmad Basalah 2015
Transcript of Additive Manufacturing of Porous Titanium Structures for ...

Additive Manufacturing of Porous
Titanium Structures for Use in
Orthopaedic Implants
by
Ahmad Basalah
A thesis
presented to the University of Waterloo
in fulfilment of the
thesis requirement for the degree of
Doctor of Philosophy
in
Mechanical Engineering
Waterloo, Ontario, Canada, 2015
©Ahmad Basalah 2015

ii
Author Declaration
This thesis consists of material all of which I authored or co-authored: see Statement
of Contributions included in the thesis. This is a true copy of the thesis, including
any required final revisions, as accepted by my examiners.

iii
Statement of Contributions
This thesis includes seven chapters. Each chapter starting from chapter 2 up to 6
represents a publication I authored or co-authored as follow:
- The first chapter is the introduction including the motivation and objectives of the
thesis.
-The second chapter is the first one-third of a book chapter:
Vlasea M., Basalah A., Azhari A., Kandel R. Toyserkani E. Additive manufacturing
for bone load bearing applications. Edited by: Lijie Grace Zhang, John Fisher KL,
3D Bioprinting and Nanotechnology in Tissue Engineering and Regenerative
Medicine. 1st Edition, Elsevier Inc.; 2015.
-The third chapter consists of a journal article published in the Journal of Biomedical
Materials Research Part B Applied Biomaterials:
Basalah A, Shanjani Y, Esmaeili S, Toyserkani E. Characterizations of additive
manufactured porous titanium implants. J Biomed Mater Res B Appl Biomater
2012;100:1970–9.
-The fourth chapter includes a manuscript will be submitted soon:
Basalah A, Esmaeili S, Toyserkani E. On the influence of sintering protocols and
layer thickness on the physical and mechanical properties of additive manufactured
titanium porous structures.
-The fifth chapter consists of a manuscript submitted to “International Journal of
Advanced Manufacturing Technology” without the biological study section in June
7, 2015:
Basalah A, Esmaeili S, Toyserkani E. Mechanical Properties of Additive
Manufactured Porous Titanium Bio-Structures with Oriented Macro-Scale Channels.
- The sixth chapter consists of a manuscript submitted to the Journal of Biomedical
Physics & Engineering Express in June 18, 2015:
Basalah A, Esmaeili S, Toyserkani E. A Novel Additive Manufacturing-based
Technique for Developing Bio-structures with Conformal and Encapsulated
Channels.
-Finally, chapter seven includes the conclusions and future work.

iv
Abstract This dissertation explores additive manufacturing of porous titanium structures for
possible use as scaffolds in orthopaedics. Such scaffolds should be tailored in terms
of mechanical properties and porosity to satisfy specific physical and biological
needs. In this thesis, powder metallurgy was combined with additive manufacturing
to successfully fabricate porous Ti structures.
This study describes physical, chemical, and mechanical characterizations of porous
titanium implants made by the proposed powder bed inkjet-based additive
manufacturing process to gain insight into the correlation of process parameters and
final physical and mechanical properties of the porous structure. A number of
processing parameters were investigated to control the mechanical properties and
porosity of the structure. In addition, a model was developed based on the
microstructural powder compaction to predict the porosity as a function of the
developed sinter neck among the particles during the sintering process. The
produced samples were characterized through several methods including porosity
measurement, compression test, Scanning Electron Microscopy (SEM), Energy-
dispersive X-ray spectroscopy (EDX), and shrinkage measurements.
Additionally, a new method for manufacturing Ti implants includes encapsulated
networks of macro-sized channels was introduced. Also, the influence of different
orientations and numbers of channels within the additive-manufactured structures
were investigated.
The characterization test results showed a level of porosity in the samples in the
range of 12-43%, which is within the range of cancellous and cortical bone porosity.
The compression test results showed that the porous structure’s compressive strength
is in the range of 56-1000 MPa, yield strength is in the range of 27-383 MPa, and
Young’s modulus is in the range of 0.77-11.46 GPa. This technique of

v
manufacturing porous Ti structures demonstrated a low level of shrinkage with the
shrinkage percentage ranging from 1.5-12%. Also, the experimental results
demonstrated excellent agreement with the developed model. Moreover, the novel
method of fabricating the encapsulated channel show a reduction in the shear
strength to 24-30% that is advantageous for bone implants. The results demonstrate
that the channel orientation in the structure affect the shrinkage rate in the parts with
vertically orientated channels, in which a relatively isotropic shrinkage in vertical
and horizontal directions is achieved after sintering.

vi
Acknowledgments At the beginning, I would like to say thanks be to Allah, who has guided and assisted
me to accomplish this thesis.
I would like to express my sincere gratitude to my Supervisors; Prof.Ehsan
Toyserkani and Prof. Shahrzad Esmaeili for the great support, encouragement, trust,
patience, assistance and guidance they have provided me over the past few years.
The knowledge and support that I've given from my supervisors were really
invaluable and made my life in Canada enjoyable.
I hereby acknowledge my thesis examining committee members, Prof. Hani Naguib
from University of Toronto, Prof. Fathy Ismail, Prof. Mohammad Kohandel, and
Prof. Hamid Jahed from the University of Waterloo, for their time of reviewing my
thesis.
My sincere thanks also goes to the technical team in the Department of Mechanical
and Mechatronics Engineering at University of Waterloo, electronic technologists
James Merli who’s helped us from the beginning in modifying the tube furnace to
meet the CSA requirements, Andy Barber for helping us in diagnosing the trouble
shooting in the 3D Printer, Robert Wagner for helping us in the manufacturing some
parts, Mark Griffett for his help and support in conducting the compression test,
Yuquan Ding for the microstructural observation of the samples using the (SEM),
Martha Morales for her IT support.
Thanks from the heart to the late King Abdullah for allowing me the opportunity to
pursue the doctoral degree through the King Abdullah scholarship program. I would
also like to extend my thanks to the Saudi Arabian Cultural Bureau in Ottawa, the
University of Umm Al-Qura for the financial support I’ve received from them. Also,
I would like to acknowledge the funding support received from the Natural Sciences
and Engineering Research Council of Canada (NSERC), grant # RGPIN312074
37063 and NSERC Discovery grant # 283181-09 37188.
I really appreciate the support and the coordination provided by my colleagues at the
Multi-scale Additive Manufacturing Laboratory and would like to thank, Dr. Yaser

vii
Shanjani, Dr. Hamidreza Alemohammad, Dr. Mihaela Vlasea, Elahe Jabari, Amir
Azhari, Esmat Sheydaeian, Richard Liang, Farid Behzadian, and Farzad Liravi.
Thanks are also extended to Prof. Julie Gough and Louise Carney from the
Manchester University for conducting the biological study in their site.
I also want to extend my deep and sincere gratitude to my beloved parents, Ali and
Wafa who dedicated to rise me up loving the science and learning me the doctrine of
"nothing is impossible" from which I'm inspiring the self-esteem and patience in
overcoming the obstacles. Thanks to my brothers, Saeed and Basim for taking care
of my parents and own interests up there. An extended thanks to my beloved sisters
for their support to me. I would also like to thank my family in law for their
understanding our circumstances to be away from them the past few years. My
sincere thanks go to my lovely wife Maram, who inspired me and provided constant
encouragement during the entire degree program, deep thanks for her understanding
and patience. I would like to thank my little boy, Ali, who missed out a lot of times
due to my research and hopefully I compensate him for this time in the future.
Last but not the least, I would like to thank all my friends who supported me here in
Canada and anyone prayed for me to be successful in my career.

viii
Dedication
“To my beloved people; mom, dad, wife, brothers, sisters, son, nephews, and nieces
I am very proud to dedicate this work to all of you,,,”

ix
Contents Author Declaration .............................................................................................................................. ii
Statement of Contributions ........................................................................................................... iii
Abstract ....................................................................................................................................................iv
Acknowledgments...............................................................................................................................vi
List of Figures ..................................................................................................................................... xiv
List of Tables ....................................................................................................................................... xix
Chapter 1 Introduction ...................................................................................................................... 1
1.1 Motivation ................................................................................................................................... 1
1.2 Objective ...................................................................................................................................... 3
1.3 Outline of thesis ........................................................................................................................ 4
Chapter 2 Additive Manufacturing for Bone Load Bearing Applications .................. 6
2.1 Need for bone substitutes.................................................................................................... 6
2.2 Compositional, Structural and mechanical properties of bone ........................ 7
2.2.1 Compositional Properties of Bone and Requirements for Bone
Substitutes ..................................................................................................................................... 7
2.2.2 Structural Properties of Bone and Requirements for Bone Substitutes
............................................................................................................................................................. 8
2.2.3 Mechanical Properties of Bone and Requirements for Bone
Substitutes ..................................................................................................................................... 9
2.3 Difficulties in Achieving an Ideal Bone Substitute ................................................... 9
2.4 Metallic Bone Substitutes ................................................................................................. 10
2.4.1 Metallic Materials, Limitations and Opportunities ...................................... 10
2.4.2 AM of Metals for Bone Substitutes ...................................................................... 14
2.5 Conclusions .............................................................................................................................. 19

x
Chapter 3 Characterizations of additive manufactured porous titanium implant
.................................................................................................................................................................... 21
3.1 Introduction ............................................................................................................................ 21
3.2 Methodology ........................................................................................................................... 22
3.2.1Materials ............................................................................................................................ 22
3.2.2 Manufacturing of green parts ................................................................................ 23
3.2.3 Sintering ........................................................................................................................... 25
3.3 Shrinkage Measurement ................................................................................................... 26
3.4 Porosity Measurements ..................................................................................................... 27
3.5 Mechanical Properties Measurements ....................................................................... 27
3.6 Micro-structure Characterization ................................................................................. 28
3.7 Results: ...................................................................................................................................... 28
3.7.1 Structural Observation .............................................................................................. 28
3.7.2 Shrinkage ........................................................................................................................ 30
3.7.3 Porosity ............................................................................................................................. 30
3.7.4 Compressive Strength................................................................................................ 30
3.8 Discussion ................................................................................................................................ 31
3.9 Relation between Porosity and Compressive Strength ...................................... 37
3.10 Conclusion ............................................................................................................................. 41
Chapter 4 On the influence of sintering protocols and layer thickness on the
physical and mechanical properties of additive manufactured titanium porous
structures .............................................................................................................................................. 42
4.1 Introduction ............................................................................................................................ 42
4.2 Methodology ........................................................................................................................... 45
4.2.1 Material ............................................................................................................................. 45

xi
4.2.2 Manufacturing ............................................................................................................... 45
4.2.3 Sintering ........................................................................................................................... 46
4.3 Characterization .................................................................................................................... 47
4.3.1 Porosity ............................................................................................................................. 47
4.3.2 Compression Test ........................................................................................................ 47
4.3.3 Shrinkage ......................................................................................................................... 47
4.3.4 Microscopic Characterization ................................................................................ 47
4.3.5 Statistical Analysis ....................................................................................................... 48
4.4 Results ........................................................................................................................................ 48
4.4.2 Porosity ............................................................................................................................. 48
4.4.3 Young’s Modulus .......................................................................................................... 50
4.4.4 Yield Strength ................................................................................................................ 50
4.4.5 Shrinkage ......................................................................................................................... 51
4.5 Analytical Model of the Microstructural Arrangement of Ti Particles ........ 53
4.6 Discussion ................................................................................................................................ 56
4.7 Conclusions .............................................................................................................................. 61
Chapter 5 Mechanical Properties of Additive Manufactured Porous Titanium
Bio-Structures with Oriented Macro-Scale Channels ...................................................... 62
5.1 Introduction: ..................................................................................................................... 62
5.2 Methodology: .................................................................................................................... 63
5.2.1 Manufacturing of Green Samples: .................................................................. 64
5.2.2 Sintering: .................................................................................................................... 66
5.2.3 Characterization: .................................................................................................... 67
5.2.4 Modelling: .................................................................................................................. 68
5.2.5 Biological Study: ..................................................................................................... 68

xii
5.3 Results .................................................................................................................................. 69
5.3.1 Shrinkage: .................................................................................................................. 69
5.3.2 Porosity: ..................................................................................................................... 70
5.3.3 Mechanical Properties:........................................................................................ 70
5.3.4 Biological Study: ........................................................................................................... 71
5.4 Discussion ........................................................................................................................... 72
5.5 Conclusions ........................................................................................................................ 76
Chapter 6 A Novel Additive Manufacturing-based Technique for Developing Bio-
structures with Conformal and Encapsulated Channels ................................................ 77
6.1. Introduction ........................................................................................................................... 77
6.2. Methodology .......................................................................................................................... 79
6.2.1 Materials and Fabrication ........................................................................................ 79
6.2.2 Characterization ........................................................................................................... 81
6.3. Results ....................................................................................................................................... 84
6.3.1 Adhesive Bonding Shear Strength ....................................................................... 84
6.3.2 Compressive Strength................................................................................................ 85
6.3.3 Porosity ............................................................................................................................. 85
6.3.4 Shrinkage Measurements ........................................................................................ 86
6.4. Discussion ............................................................................................................................... 86
6.5. Summary .................................................................................................................................. 91
Chapter 7 Conclusions and Future Work ............................................................................... 92
7.1 Conclusions .............................................................................................................................. 92
7.2 Recommendations and Future Work .......................................................................... 93
7.2.1 Manufacturing ............................................................................................................... 93
7.2.2 Material Processing .................................................................................................... 94

xiii
7.2.3 Modelling ......................................................................................................................... 94
7.2.4 Biological Study ............................................................................................................ 94
Appendices ........................................................................................................................................... 96
Appendix A ...................................................................................................................................... 97
Appendix B ...................................................................................................................................... 98
Appendix D ................................................................................................................................... 100
Appendix E.................................................................................................................................... 101
Appendix F .................................................................................................................................... 102
References: ........................................................................................................................................ 103

xiv
List of Figures Figure 1-1 This flow chart defines the problem, identifies the causes of the problem,
and lists the studies that have been conducted in this thesis to alleviate
this problem. ......................................................................................................5
Figure 2-1 Schematic presentation of working principle of SLS technique. .....................15
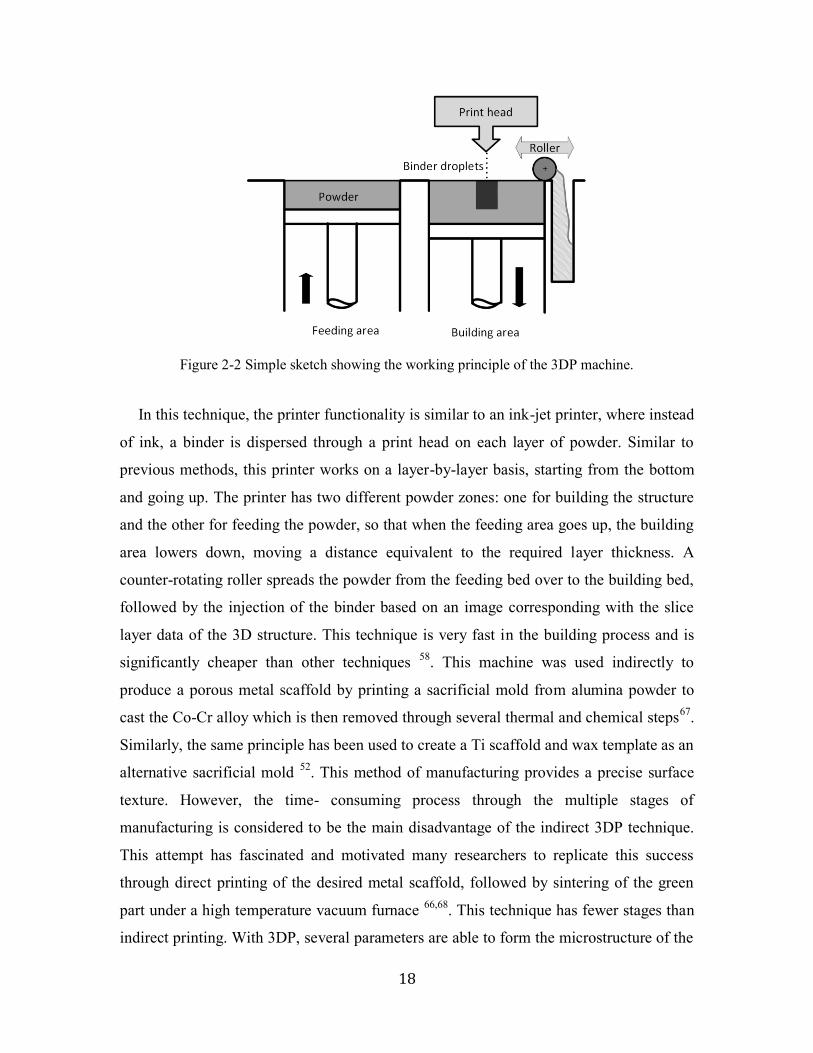
Figure 2-2 Simple sketch showing the working principle of the 3DP machine. ...............18
Figure 2-3 Compressive strength and porosity of the porous structures fabricated by
varied sizes of Ti powder. ................................................................................20
Figure 2-4 Vertical and horizontal shrinkage of Ti samples fabricated by varied sizes
of Ti powder. ....................................................................................................20
Figure 3-1 Schematic of (a) 3D printing process and (b) powder spreading and
compaction by a counter-rotating roller. Layer thickness (i.e., the gap
between roller and underlying powder layer) is chosen larger than powder
particle size. .....................................................................................................25
Figure 3-2 Sintering protocols which are followed in the sintering process. ....................26
Figure 3-3 Schematic of horizontal and vertical shrinkage directions on the sample
caused by sintering. Ti rounded bars were positioned in the sintering
furnace as their main axis was along with the gravity direction. .....................27
Figure 3-4 Fabricated Ti sample with a dimension of Ø10mm×15mm.............................28
Figure 3-5 Micrograph of the green sample printed from category A of powder
demonstrates the PVA binding Ti particles together before the burning
process of PVA. ...............................................................................................29
Figure 3-6 SEM of Ti samples fabricated from category F with fine particles
bounded with 3% PVA and sintered for 1hr at (a) 1,100 ºC, (b) 1,400 ºC. .....29
Figure 3-7 The EDX spectrum of Ti sample fabricated from category F, 3% PVA
used as a binder and sintered for 1 h at 1400 ºC; the image at right
presents the location on a sinter neck selected for EDX-characterization. ......30
Figure 3-8 Horizontal shrinkage of Ti samples composed of (a) 3% PVA and (b) 5%
PVA..................................................................................................................32

xv
Figure 3-9 Vertical shrinkage of Ti samples composed of (a) 3% PVA and (b) 5%
PVA..................................................................................................................32
Figure 3-10 Porosity of the porous structures fabricated by varied sizes of Ti powder
and sintered with different sintering conditions and composed of (a) 3%
PVA (b) 5% PVA............................................................................................33
Figure 3-11 Compressive strength of the porous structures fabricated by varied sizes
of Ti powder and sintered with different sintering conditions and
composed of (a) 3% PVA (b) 5% PVA. ..........................................................33
Figure 3-12 Variation of sinter-neck-size to particle-diameter ratio (x/a) for the
category F(<75µm). .........................................................................................34
Figure 3-13 A comparison between the porosity of green samples and sintered
samples which sintered at 1400 ºC for 3 hours using 5% PVA. ......................36
Figure 3-14 SEM images showing the crack initiated at the sinter neck of sample. .........37
Figure 3-15 Relative density of several powder categories for two sintering protocols
as a function of relative compressive strength. ................................................39
Figure 3-16 Relative density of Ti structure as a function of the relative compressive
strength. ............................................................................................................40
Figure 4-1 Four different heating profiles followed during the sintering process. ............46
Figure 4-2 SEM images of various samples sintered at different sintering
temperature and printed using two layers thickness, i.e. 62.5 and 175
represent the extreme edges of powder compaction. .......................................49
Figure 4-3 Influence of two independent variables - layer thickness and sintering
temperature - on the porosity of the structure. .................................................50
Figure 4-4 Variation in Young’s modulus due to variations in layer thickness and
sintering temperature. ......................................................................................51
Figure 4-5 Variation in yield strength due to variations in layer thickness and
sintering temperature. ......................................................................................52
Figure 4-6 Vertical shrinkage variation as a function of sintering temperature and
printing layer thickness. ...................................................................................52
Figure 4-7 Horizontal shrinkage variation as a function of sintering temperature and
printing layer thickness. ...................................................................................53

xvi
Figure 4-8 Assumed arrangement of particles at micro-scale ...........................................54
Figure 4-9 a) A cubic unit-cell which represents eight particles each contributed by
one-eighth of its volume, b) One-eighth particle represents the
participation of the particle in the unit cell after subtracting the volume of
the sinter neck from three sides. ......................................................................54
Figure 4-10 The progression of the sinter neck ratio versus sintering temperature ...........57
Figure 4-11 Correlation between the experimental porosity and modeled porosity. .........58
Figure 4-12 Sinter neck ratio as a function of the yield strength at different sintering
temperatures. ....................................................................................................59
Figure 4-13 Correlation of the yield strength and the Young’s modulus and the
governing equations for each sintering temperature. .......................................59
Figure 4-14 Influence of the compaction of powder on the anisotropy of shrinkage in
the structure for samples sintered at 1400 ºC. ..................................................60
Figure 5-1 Schematic presentation of Ti samples investigated in the current study
and classified into four categories: a) control, b) 2 vertical channels at 90º
angle, c) 2 channels with 65.3º inclination angle, and d) 2 channels
inclined by 65.3º and one horizontal channel ..................................................64
Figure 5-2 A schematic of the powder based 3D printer machine. ...................................65
Figure 5-3 Heating profile used in the sintering process. ..................................................66
Figure 5-4 Ti sample with two diagonal channels with dimensions of Ø10 mm X
H15mm. ...........................................................................................................67
Figure 5-5 Samples after meshing process : a) control, b) 2 vertical channels with 90º
angle, c) 2 channels with 65.3º inclination angle, and d) 2 channels
inclined by 65.3º and one horizontal channel. .................................................69
Figure 5-6 Vertical and horizontal shrinkage of Ti samples after the sintering
process..............................................................................................................69
Figure 5-7 Porosity of Ti samples fabricated with different channel orientations. ...........70
Figure 5-8 Compressive strength resulting from testing Ti samples under the uniaxial
compression test: reduction in the strength of the (d) category was
significant (p<0.05) when compared to the (c) category. ................................71
Figure 5-9 SEM images of the channel opening of category (b) samples. ........................73

xvii
Figure 5-10 Deformed Ti samples after the compression test: a) control, b) 2 vertical
channels with 90º angle, c) 2 channels with 65.3º inclination angle, and d)
2 channels inclined by 65.3º and one horizontal channel. ...............................74
Figure 5-11 Von Mises stress distribution within the compressed samples: a) control,
b) 2 vertical channels with 90º angle, c) 2 channels with 65.3º inclination
angle, and d) 2 channels inclined by 65.3º and one horizontal channel. .........76
Figure 6-1 Steps of building a structure using the AAM concept, starting with the
CAD model and ending with the final sintered structure. ...............................80
Figure 6-2 Heating protocol used in the sintering process: two stages for burning
PVA and one stage for sintering Ti particles. ..................................................80
Figure 6-3 Schematic representation of the shear test samples: A) control sample
printed entirely in one cycle of printing; B) AAM sample; C) control
sample printed in one printing cycle with a horizontal channel; D) AAM
sample with a horizontal channel. ....................................................................81
Figure 6-4 Shear test apparatus: A) fixture comprised of a fixed part (cylinder)
attached to the plate holds the sample and a moving part (piston), B)
schematic of the loading force on the sample that generates a shear force
at the interfacial plane. .....................................................................................82
Figure 6-5 Schematic representation of the shear test samples: a) control sample
printed entirely in one cycle of printing; B) AAM sample; C) control
sample printed in one printing cycle with a horizontal channel; D) AAM
sample with a horizontal channel. ....................................................................83
Figure 6-6 Results of shear strength tests of Ti samples in four categories: A) control
sample without a channel; B) AAM-fabricated sample without a channel;
C) control sample with a channel; D) AAM-fabricated sample with a
channel. ............................................................................................................84
Figure 6-7 Compressive strength results of Ti samples of four categories: A) control
sample without a channel; B) AAM-fabricated sample without a channel;
C) control sample with a channel; D) AAM-fabricated sample with a
channel. ............................................................................................................85

xviii
Figure 6-8 Results of porosity tests of the Ti samples for the four categories: A)
control sample without a channel; B) AAM-fabricated sample without a
channel; C) control sample with a channel; D) AAM-fabricated samples
with a channel. .................................................................................................86
Figure 6-9 Vertical and horizontal shrinkages of the Ti samples in the four
categories: A) control sample without a channel; B) AAM-fabricated
sample without a channel; C) control sample with a channel; D) AAM-
fabricated samples with a channel. ..................................................................87
Figure 6-10 SEM images of samples before (green parts) and after sintering of: A)
control sample without a channel; B) AAM-fabricated sample without a
channel............................................................................................................89
Figure 6-11 SEM images of samples before (green parts) and after sintering of: C)
control sample with a channel; D) AAM-fabricated sample with a
channel............................................................................................................90
Figure 6-12 Shape of Ti particles before and after the sintering process. .........................91

xix
List of Tables
Table 2-1 Range of Mechanical Properties for Human Cancellous and Cortical Bone
16,21. ..................................................................................................................... 8
Table 2-2 Comparison of the Mechanical Properties of Different Metals 37
. ................... 11
Table 3-1 Layer Thickness Which Used for Different Categories of Powder. ................. 24
Table 3-2 Gibson and Ashby Modified Models. .............................................................. 38
Table 4-1 Layer thicknesses used for printing and corresponding number of printed
layers and average green density for each sample. .......................................... 46
Table 5-1 Mechanical properties obtained from the stress-strain curve for a) control;
b) 2 vertical channels with 90º angle; c) 2 channels with 65.3º inclination
angle; and d) 2 channels inclined by 65.3º and one horizontal channel. .......... 71

1
Chapter 1 Introduction 1.1 Motivation
Life is all about change; lifestyle changes can significantly impact our habits, which, in
turn, can negatively or positively affect our health. Obesity can be the result of a lifestyle
change. In addition, the improvement in the quality of life that resulted from the
development in the health care system led to aging of the entire population. This aging of
population and an increase in the rate of obesity are the main causes of the increase in
degenerative arthritis (osteoarthritis)1,2
.
Over 10% of Canadians over 15 years of age suffer from osteoarthritis 3. The severity of
this joint disease varies between mild, moderate and severe, where severe osteoarthritis
requires total joint replacement surgery 1.
According to the Annual Report of the Canadian Joint Replacement Registry of 2014,
osteoarthritis accounted for 76.5% of hip replacement surgeries and 97.1% of knee
replacement surgeries4. In 2012-2013, hip replacements increased by 16.5% and knee
replacements increased by 21.5% as compared to the previous five years4.
The success of joint replacement surgery relies on an implant lasting longer than when
the patient returns for revision surgery. The revision surgery is more sophisticated than
the first implantation surgery5.
According to 2012-2013 data, the rate of Canadian citizens who required a revision after
conducting joint replacement surgery were 26.3% for hip and 22.5% for knee surgeries.

2
The most common reason for the revision surgery is an aseptic loosening or a failure in
the bonding between the host bone and the implant4. Joint replacement surgery costs the
Canadian healthcare system $963 million annually 4.
Osteoarthritis is one of the most common joint diseases. It can lead to a total joint
replacement with a proper bone implant. However, the needs for bone implants are not
limited to joint disease. There are many other reasons require bone implant to restore the
functionality of a lost or defected part of bone such as trauma, accidents and war
causalities. Consequently, the demand for bone implants is increasing. As such,
designing and manufacturing proper bone implants is important. This bone implant
should satisfy the needs of the users in terms of physical and mechanical properties that
mimic real bone properties in order to avoid a loosening of the implant.
In order to alleviate the stress shielding effects which typically lead to loosening of the
implant, the implant should be comparable to bone in terms of its mechanical and
physical properties. Thus, two main crucial factors that ensure successful bone implant
are porosity and stiffness. Proper amount of porosity ensures effective bone integration,
and comparable stiffness to bone avoids the surrounding bone resorption. Also, the
porous structure should include/mimic conformal channels which deliver the blood and
minerals to the cells in the real bone structure.
Several conventional techniques have been used to produce porous Ti structures.
Unfortunately, no single technique satisfies the objective of creating a porous structure
with controllable porosity and mechanical properties. The best solution to overcome the
above-mentioned issue and fabricate a customized implant is to use the additive
manufacturing (AM) technique. AM technique is considered a promising alternative for
precise fabrication of internal and external features of scaffold architecture.
Costly AM techniques, particularly laser or electron beam-based techniques, have been
used in the fabrication of bone scaffold on a small scale. In addition to the high cost of
these techniques, the difficulty in removing residual material is considered the primary
3
limitation which prevents these techniques from being applied on a large scale. However,
the powder bed inkjet-based technique is an economical choice to 3D print a Ti porous
structure. In comparison to its counterparts (>US $600,000), the powder bed inkjet-based
technique costs (US $40,000)6. Also, there is almost 50% savings in the operating
cost as represented in the consumable material or Ti powder, because the inkjet-
based printing technique does not require a specific powder and the commercially
pure Ti works very well. Thus, this economical factor makes this technique
superior for the fabrication of a highly complex Ti structure. This manufacturing
technique is an appropriate option to be used throughout the world, such as in
developing countries where the costly additive manufacturing technique is not
available. Also, this technique is a green technology which does not require any
intrusion of laser during processing. At present there is a shortage of information in the
literature about using the powder bed inkjet-based technique in the fabrication of titanium
bone implants. To address this gap in the literature, the following objectives will be
achieved.
1.2 Objective
The aim of this thesis is to utilize the powder based ink-jet printer in fabricating a Ti
porous bone implant for load bearing purpose. The feasibility of using this approach to
fabricate bone implant is assessed by conducting the following characterization
techniques on the produced samples:
-Mechanical properties of the fabricated scaffold are characterized by using various
methodologies such as compression test and shear test.
-Physical properties such as the porosity of the structure are characterized by using
Archimedes principle. In addition, the dimensional variation of the structure is assessed.

4
-For microstructural examination, the Scanning Electron Microscope (SEM) is used to
visually assess the microstructure. The Energy Dispersive X-ray spectroscopy (EDX) is
used to characterize the chemical composition of the structure.
Based on the result of the characterization, a development on the produced structure is
implemented by considering the following aspects.
Material Processing: The influence of several parameters are investigated including
sintering temperature, sintering duration, binder content, powder shape, powder
distribution, and powder size.
Structure: The architecture is assessed and the influence of the macro channels in the
structure with different orientations on the physical and mechanical properties is
investigated.
Manufacturing: Manufacturing parameters such as the layer thickness of printing and the
optimum layer thickness for a certain powder size are investigated and a new approach of
additive manufacturing is introduced.
1.3 Outline of thesis
This thesis consists of seven chapters. The first chapter presents the introduction and
describes the motivation for and objective of the thesis. Chapters two through six
illustrate the studies that have been conducted. The connections between these studies are
shown in Figure 1-1. The second chapter provides an overview of the literature and
background in which bone implant materials, manufacturing techniques, and bone and
implant characteristics are reviewed. In the third and fourth chapters, different material
and manufacturing processing parameters are investigated in an attempt to meet the
physical and mechanical properties of bone. The fifth chapter focuses on the creation of
macro channels in order to enhance the osseointegration process and address the
influence of these channels on the physical and mechanical properties of bone implant.
The sixth chapter introduces a novel technique of manufacturing macro channels. Finally,
chapter seven offers the conclusions of this thesis and suggests opportunities for future
work.

5
Figure 1-1 This flow chart defines the problem, identifies the causes of the problem, and lists the studies that have been conducted in this thesis to
alleviate this problem.

6
Chapter 2 Additive Manufacturing for
Bone Load Bearing Applications
2.1 Need for bone substitutes
The incentive behind fabricating constructs with a direct application in bone and joint
reconstruction surgeries lies in understanding the demand for such devices. Bone and
cartilage conditions, such as arthritis, osteoporosis, traumatic musculoskeletal injuries,
spinal injuries, and spinal deformities 7, although mostly nonlife-threatening, can become
very incapacitating, diminishing the quality of life of the affected individuals by causing
ongoing pain, discomfort, inflammation, and restrictions in range of motion 7.
Furthermore, these conditions represent a major financial burden on the healthcare
sector7,8
. The current conventional treatment for advanced joint and bone trauma is to
fully or partially replace the affected area with tissue grafts9 or with artificial prosthetics
10
to restore near-normal functions. Current state-of-the-art prosthetic implants fail to meet
structural and functional requirements that would render them as permanent remediation
solutions10
. As a result, thousands of patients undergo painful and costly subsequent
surgeries for implant replacements or readjustments. Cell-based or tissue graft solutions
have been proven to ameliorate the quality of life of patients, but are limited in terms of
size and anatomical shape of defect that can be addressed, as well as the availability of
healthy donor tissue and morbidity of the donor site9,11,12
. There is a pressing need for
more successful bone and osteochondral reconstruction approaches that take into account
biochemical, morphological, and anatomical factors. One such approach focuses on
manufacturing biocompatible and/or bioresorbable bone substitutes with complex internal
and external architecture and appropriate biochemical cues that can enhance or replace

7
the defect area, gradually mature, and seamlessly integrate with the native tissue 13
. The
bone substitute would serve as a biocompatible template that would encourage cell
migration, proliferation, and differentiation, ideally acting as a temporary bioresorbable
porous support until the bone matrix is regenerated 14
. A vast amount of work has been
done in materials research and manufacturing methodologies in this field, specifically in
constructing bone substitutes for load bearing applications; however, there is still a gap in
understanding the ideal relationship between the scaffold morphology (pore size, shape,
and interconnectivity), transient biochemical interactions, and mechanical properties 14,15
.
2.2 Compositional, Structural and mechanical properties of bone
2.2.1 Compositional Properties of Bone and Requirements for Bone Substitutes
Bone is a dynamic and complex organ, encompassing a variety of tissues such as
mineralized osseous tissue, cartilage, endosteum, periosteum, marrow, nerves, and blood
vessels16
. The main role of the bone network is in providing the necessary mechanical
support, movement, and protection, with other roles ranging from blood production, to
storage of mineral materials, pH regulation, and housing multi progenitor cells16,17
. Due
to the complex nature of the bone as biological system, in the context of fabricating bone
substitute implants, the focus is generally on understanding the biochemical and
structural makeup of the bone extracellular matrix (ECM), as well as the interaction of
the ECM with cells and the environment in which they reside17
. The bone ECM is in
essence a composite material comprised of carbonated apatite (∼69% of the ECM),
mainly hydroxyapatite (Ca10(PO4)6(OH)2) crystals, entrapped in an organic matrix
(∼22% of the ECM) of mostly type I collagen, and water (∼9 % of the ECM)17,18
. Lipids,
proteins, and osteogenic factors also reside in the ECM organic matrix18
. From a
compositional point of view, the bone substitute matrix should be at least biocompatible
with the ECM, cellular, and chemical environment, osteoconductive to encourage fast
bone ingrowth from surrounding healthy tissue19
, as well as nontoxic, nonmutagenic,
noncarcinogenic, and nonteratogenic 20
. Ideally, the material should be osteoinductive to
promote formation of new bone at the site 16,21
.

8
2.2.2 Structural Properties of Bone and Requirements for Bone Substitutes
Structurally, the bone ECM is comprised of two main zones with very different
morphological properties. Trabecular bone, also known as cancellous bone, is a highly
porous bone matrix, with interconnected porosities between 50–90% and visible
macropores in the range of 500–1000 mm 22
. Trabecular bone has a complex and
organized porous architecture, with trabeculae following the direction of mechanical
stress16
as a direct result of adaptations to mechanical loading, as postulated by Wolff’s
law 10
and the mechanostat theory 23
. Trabecular bone encloses bone marrow and is
enclosed by cortical bone. Cortical bone ECM has a compact solid-like structure, with
enclosed vascular Haversian canals, having a low porosity between 3–12%, and pores
<500 mm22
. Cortical bone has a solid structure with a series of voids, for example
Haversian canals, with a 3–12% porosity (typical apparent density values for proximal
tibial trabecular bone 0.30 ± 0.10 g/cm3). The bone ECM is constantly remodeled by the
cells that reside in it, where osteoblasts are responsible for producing and mineralizing
new bone matrix, osteocytes work on maintaining the matrix, and osteoclasts are
responsible for resorbing the matrix 22
. From a structural standpoint, in designing a bone
substitute, it is necessary to consider a gradient in porosity and mechanical properties,
from a dense external configuration matching the characteristics of cortical bone to the
highly porous region with interconnected porosity matching the characteristics of
cancellous bone 24
. This means that an ideal bone substitute must have a heterogeneous
porous structure, with varying physical and mechanical characteristics. In addition, the
implant must also be designed to have an anatomically accurate three-dimensional shape
in order to maintain a natural contact load distribution post implantation 11
.
Table 2-1 Range of Mechanical Properties for Human Cancellous and Cortical Bone 16,21
.
Bone Type Tensile Strength
(MPa)
Compressive
Strength (MPa)
Young’s Modulus
(GPa)
Cancellous bone N/A 4–12 0.01–0.5
Cortical bone 60–160 130–225 3–30

9
2.2.3 Mechanical Properties of Bone and Requirements for Bone Substitutes
The high level of porosity and pore interconnectivity that is ideal for a bone substitute
may be limited by the mechanical strength requirements for that specific implant,
especially in the case of load bearing applications. The bone substitute should provide
physical support, starting from the seeding process in vitro until the tissue is remodeled in
vivo. Furthermore, the implant must provide sufficient mechanical support to endure in
vivo stresses and load bearing cycles13
. Table 2-1 summarizes the range in mechanical
properties of human cancellous and cortical bone.
2.3 Difficulties in Achieving an Ideal Bone Substitute
Manufacturing of optimal porous bone substitutes from a biochemical, structural, and
mechanical properties point of view is highly complex due to a collection of factors.
From an architectural standpoint, the bone substitute supports biological and mechanical
functions 14
, which may be in conflict. For example, for increasing the load-bearing
property of the material, a denser material is needed, which conflicts with the
requirement of having a highly porous matrix to encourage bone ingrowth and fluid
permeability22
. What is generally defined as an optimization of scaffold properties is
likely a tuning of a single parameter with little regard to how other scaffold properties are
modified. Furthermore, characterizing, digitizing, and manufacturing the scaffold
architecture are difficult tasks. Using characterization methods to reveal pore surface,
pore volume, pore shape, interconnectivity, and volume porosity in bone tissues14
, and
furthermore translating such data into a digital format that can be interpreted into
fabrication methodologies in a continuous or discrete fashion can be a challenge.
Typically, the interconnected macroporosity should be >50 µm14,18,21,22,25,26
, with a
specific orientation to match the stress loading conditions and fluid and nutrient transport
mechanics14
. Also, what is defined as microporosity, with a diameter ranging between
0.1–10 µm 14,18,22
has shown an effect on the biological response of scaffolds, thus the
pores at this scale should be characterized and integrated in the final design. From a
structural standpoint, it is also necessary to implement a gradient in porosity and
mechanical properties, from a dense external configuration matching the characteristics

10
of cortical bone to the highly porous region with interconnected porosity matching the
characteristics of cancellous bone 15,16,24
. Manufacturing methodologies that can
incorporate the interpretation and implementation of digital data at a macro and
micropore scale are of concern.
Another issue related to manufacturing the appropriate bone substitute
architecture lies in the development of appropriate software interpreter design
strategies27–29
that can convert the desired structural porous morphology and mechanical
properties of the bone to be replaced, into appropriate voxel units that can be fabricated
using various manufacturing platforms. Such voxels may be computed mathematically
using topology optimization algorithms 27,30
or numerical simulation 29
.
From a material standpoint, difficulties arise in designing structures that can
bioresorb in vivo at an appropriate rate matching bone remodeling. In the context of
regenerative medicine, the terminology of materials with biodegradable, bioresorbable,
bioerodible, and bioabsorbable 13
properties are often used. The biodegradation pathway
will have an effect on the mechanical, structural, and biochemical properties of the
scaffold, and needs to be fully understood 14
. Some of the parameters that affect the
degradation rate are pore size, pore interconnectivity, permeability, scaffold shape, and
volume, as well as implantation location within the musculoskeletal system. Furthermore,
the long-term native tissue response to the degradation products should also be
considered 14
. To add to the difficulty of producing an ideal implant, the overall
biochemical, structural, and mechanical properties of the bone substitute should match
patient-specific needs such as age, gender, health, metabolism, implant location, and
loading conditions 14
.
2.4 Metallic Bone Substitutes
2.4.1 Metallic Materials, Limitations and Opportunities
For a long time, metals were the main material utilized for orthopedic implants. This
interest in metals resulted from the excellent physical and mechanical properties that are
intrinsic to metals. At present, the interest in nonmetallic materials has prompted the
fabrication of tissue scaffolds. These materials are mostly polymer or ceramic, and are

11
used to produce biodegradable scaffolds. Biodegradable scaffolds can be useful for young
patients, because they have high growth rates of tissue to restore the functionality of the
damaged area. However, the case is completely different for senior citizens, who have
very low tissue growth rates. When faced with a certain degradation rate of the materials,
this may cause a mismatch in terms of the mechanical properties31
. Therefore, permanent
metallic bone substitutes are more appropriate in the case of older patients. Several
metals have been used for implants, such as stainless steels (316L), Co-Cr-Mo, pure
titanium, titanium alloys, and tantalum. Each metal has advantages and disadvantages
that can either expand or limit its usage.
Stainless steel is considered one of the first metals used in the orthopedic field as
plates and screws for bone fixation in the early twentieth century32
. The most popular
stainless steel alloy used in prosthesis fixation is (316L), with moderate strength and
toughness in comparison to other metals as shown in Table 2-2. This alloy is distinguished
by good corrosion resistance in comparison to other steel alloys, since the 12% Cr in its
content forms a corrosion protective layer Cr2O3 on the surface 33
. This metal is both
widely available and economically effective in terms of processing and manufacturing
34,35. However, as the wear resistance of stainless steel is very low, its usage in hip
replacement was stopped 36
. Nowadays, stainless steel is rarely used for orthopedic
implants. Instead, stainless steel is used for temporary fixation devices such as nails,
screws, and plates due to the superiority of other metals such as Ti, Ti alloys, and Co–Cr
alloy in terms of mechanical properties and corrosion resistance 36
.
Table 2-2 Comparison of the Mechanical Properties of Different Metals 37
.
Material Bone Magnesium Co–Cr–Mo
and Alloys
Ti and
Alloys
Stainless
Steels
Density
(g cc−1)
1.8–2.1 3.1 8.3–9.2 4.4–4.5 7.9–81
Compressive
strength (MPa)
130–180 65–100 450–1896 590–1117 170–310
Elastic modulus
(GPa)
3–20 41–45 200–253 55–117 189–205
Toughness
(MPam1/2)
3–6 15–40 100 55–115 50–200

12
Another widely used metal in the orthopedic industry is Co-Cr-Mo alloy that is
characterized by a high level of mechanical strength, fatigue strength, wear resistance,
and low cost of production35,36,38
. While these advantages are considered beneficial for
some applications, this is not generally true for orthopedic implants, since this metal’s
high strength and elastic modulus has caused a stress shielding between the implant and
the bone due to the mismatch of mechanical properties. Moreover, the high level of metal
ions that are released and the nanoparticle debris which is caused by the wear, negatively
affect the biocompatibility of this metal 35,39
. Despite these drawbacks, this metal is the
most preferable in hip replacement due to its high level of wear resistance compared to
the other metals. In particular, this material is used to fabricate the femoral head and
acetabular cup which is an area of high friction36
. In addition, dentists have some interest
in this metal as a coating for some dental devices 34
.
NiTi (nitinol) is a shape memory alloy, which means it can restore its original
shape after a plastic deformation by using a heat treatment. This alloy was introduced in
1960 and is characterized by high strength, superelasticity, and good corrosion resistance
36,40,41. However, the release of the Ni ions limits its usage as an orthopedic prosthesis due
to the possibility of toxicity and the inflammation effect of the surrounding tissue. This
has led researchers to treat the surface through exposure to the oxidization process in an
attempt to create a protective layer free of Ni 36,41,42
.
Alternatively, degradable metals have captured the interest of some researchers.
One of these metals is magnesium (Mg), which is characterized by having low elastic
modulus. In addition, Mg is an osteoconductive material and it does not show any
inflammatory effect following fixation 43
. However, as Mg is a degradable material, the
dissolved particles may cause toxicity, which could limit its usage in orthopedic
applications 44
.
Titanium (Ti) was introduced in the orthopedic field in 1965 in the form of screws
and plates. This long period of usage illustrates the preference of using Ti, as supported
by long-term clinical data, which indicates this material’s good biocompatibility.
Moreover, Ti is characterized by a nano-oxide layer covering its surface that increases in
vivo osteointegration 45
. Indeed, from a biological aspect, Ti has proved its compatibility
more so than stainless steel or CoCr, as proven by the cell culturing of these metals 45
.
13
Overall, Ti is considered one of the strongest and highest corrosion-resistant metals.
Moreover, Ti is characterized by an excellent strength to weight ratio and good toughness
36,46.
Recently, it has been noted that the science community is concentrating on Ti
alloys, in particular, Ti-6Al-4V, to fabricate bone substitute scaffolds. This interest
originates from the good mechanical properties and biocompatibility of this alloy. The
presence of aluminum (Al) and vanadium (V) in this alloy improves the mechanical
properties compared to commercially pure Ti (CP Ti)36
. One of the most important
benefits of Ti and its alloy (Ti-6Al-4V) is its relatively low elastic modulus which is the
half of the Co–Cr modulus, which could assist in reducing the effect of the stress
shielding 46
. Despite the fact that Ti has a low elastic modulus in comparison to other
metals, the mismatch between bone and implant still exists 46
. Arguably, the presence of
V in this alloys is a source of concern, since V is toxic 44,47
. Further drawbacks of Ti and
its alloys include the expensive machining cost and the sophisticated heat treatment
process 36
. Nowadays, most dental implants are fabricated from CP Ti, and Ti-6Al-4V are
used in orthopedic applications36
.
In order to eliminate the effect of V in Ti6Al4V alloy, new Ti alloys have been
developed to overcome the toxicity issue, such as Ti-6Al-7Nb, Ti-5Al-2.5Fe, Ti-35Nb-
5Ta-7Zr, Ti-35Nb-5Ta-7Zr-0.4O, and Ti-15Zr-4Nb-4Ta. For instance, Ti-15Zr-4Nb-4Ta
has shown excellent mechanical properties, biocompatibility, and good corrosion
resistance. In addition, it is likely that more bone was formed than that which formed
around the Ti 6Al 4V when implanted on the bone marrow of the rat tibia 47
. Most of
these alloys are still in the development stage in order to characterize the mechanical
properties and biocompatibility for application in bone regenerative medicine 36
.
Another material, tantalum (Ta) is considered one of the best metals in the orthopedic
field due to its fairly low Young’s modulus, high corrosion resistance, and excellent
biocompatibility 48
. A recent study comparing Ta and Ti showed that Ta is superior
compared to Ti in regards to cell integration with a controllable Young’s modulus in the
range of 1.5–20 GPa by changing the porosity of the structure 49
. However, the high cost
of production and fabrication of this metal is the main obstacle limiting its usage in the
orthopedic industry along with short-term clinical data35,48
.

14
Generally, the major constraints which can govern the success of a load bearing
implant are biocompatibility, porosity, and proper mechanical properties. The highly
important mechanical properties in the designing of a load bearing implant are Young’s
modulus and compressive strength. Other mechanical properties such as bending strength
are less relevant in load bearing implant. However, certain properties such as fatigue
strength are necessary for a long lasting implant, but are not as crucial as Young’s
modulus and compressive strength, since these properties may cause short-term failure of
Implant 50
.
2.4.2 AM of Metals for Bone Substitutes
Historically, conventional techniques were used to fabricate porous metals for several
industrial applications. Once porous metal was introduced in early 1972 in the orthopedic
field 51
, scientists looked for ways to control and improve the properties of this metal
foam. Consequently, several conventional techniques emerged. However, these
techniques are not capable of precisely controlling the porosity and producing a scaffold
with a predefined microstructure. Also, these techniques cannot produce a scaffold with a
contoured external shape. In order to overcome these obstacles, additive manufacturing
(AM) techniques are considered the most promising alternative for precise fabrication of
internal and external features of scaffold architecture.
There are many AM techniques that have been used in the fabrication of metal
scaffolds, such as three-dimensional printing (3DP), electron beam melting (EBM),
selective laser melting (SLM), direct metal deposition (DMD), and selective laser
sintering (SLS) 40,52–55
. Each technique has different opportunities and limitations. Some
of these techniques rely on laser technology, and others rely on the injection of the slurry.
The costs of production through these techniques are varied according to complexity. For
example, the laser sintering methods are highly expensive due to their use of laser
technology and the capability of producing a precise microstructure. Other techniques
appropriate for fabricating a scaffold have acceptable microstructure details, such as fiber
deposition and 3DP.
SLS is an AM technique (Figure 2-1) that works by sintering very fine layers of metal
powders layer over layer using a CO2 laser beam, either directly or indirectly. In direct

15
SLS, the powder mixture is a compound of two metals: a low sintering temperature metal
and the main metal 56
. In this technique, the laser beam melts the low sintering
temperature metal and uses it to bind the main metal particles to each other. For instance,
in a study where NiTi dental implant was fabricated using DMLS, the base metal was Ti
and the binding agent was Ni 40
. The second technique is called indirect SLS, where a
preprocessing of the powder is required to coat the metal powder particles with some
polymer to work as a binding agent of the green sample. This technique requires a
postprocessing of the green sample by debinding the polymer from the green sample
followed by the sintering of the metal particles in a shielded environment at a very high
temperature. The diversity of materials produced by this manufacturing method is one of
the most important advantages of this technique 57
. The final product resolution is
moderate since heat transfers to the adjacent area and fuses extra particles to the targeted
area, which might lead to a limitation in the accuracy according to the size of particles
57,58. Economically speaking, fabrication using SLS is costly
35. Technically, SLS is
considered a lengthy manufacturing method, since it requires preprocessing of the
powder and the laser sintering process is time-consuming. In addition, the resulting
product may require a postprocessing heat treatment that usually takes hours to complete
56,58.
Figure 2-1 Schematic presentation of working principle of SLS technique.

16
Another complex technique, EBM, works based on the layering process similar to
SLS. EBM differs from SLS in its use of an electron beam rather than a laser to sinter the
powders, which is generated in a tungsten filament and is accelerated and controlled with
a magnetic field 59
. This manufacturing technique is relatively fast and the building of
samples takes place under vacuum 44
. It offers an attractive opportunity in the fabrication
of fully dense or porous parts due to several controllable parameters such as beam
current, scan rate, and sequence variations 53
. In this technique, an additive or fluxing
agent is not required to fulfill the melting process because the electron beam is powerful
enough to raise the temperature of the particles to the melting point 59
. However, there are
still some limitations in this method such as the low dimensional accuracy and surface
quality due to shrinkage. Additionally, this technique is costly, and removing the excess
material inside the structure can prove difficult 60
. Different metals have been fabricated
using EBM, such as Cp-Ti, Ti-6Al-4V, and Co/Cr for orthopedic implant and
maxillofacial surgery 44,59
.
Similarly, SLM utilizes the same mechanism of the EBM, and a wide range of
materials in powder form can be used 44
. Moreover, SLM is able to produce solid and
porous parts based on the laser energy density 54
. Also, this technique is free of binders
and fluxing agents, so there is no need for a postprocessing step 44,56,61
. Unlike EBM,
SLM uses an ytterbium fiber laser 200 W power and uses Ar or N in the building
chamber, which may increase the thermal conductivity and maintain a consistent rapid
cooling of the printed zone more than EBM 54,62
. However, high production cost, lengthy
fabrication time, and difficulty in removing the trapped powder are the major limitations
of this technique 35,44,56
. Furthermore, the vaporization phenomenon is one of the
drawbacks of this technique. This phenomenon is generated due to the high temperature
of the molten pool caused by the laser beam evaporating the particles. This leads to an
overpressure in the molten pool, which results in spewing of some molten metals out of
the pool 56
. Today, this technique is utilized in the aerospace industry, orthopedics
prostheses, and dental implants 61
.
In the same context, laser engineering net shaping (LENS) and direct metal deposition
(DMD) are both AM techniques used in manufacturing bone substitutes. These
techniques mainly depend on laser technology to fuse the metal powder. LENS systems

17
use a neodymium–yttrium–aluminum–garnet (Nd:YAG) laser, while DMD uses the CO2
laser beam. The powder feeding systems are completely different, since the powder
feeding in the DMD comes through a concentric ring at the tip of the laser nozzle, while
in the LENS the powder comes through different powder feeders to the melting zone.
Both techniques use an inert gas during the manufacturing process to avoid oxidation 55
.
With these techniques, it is possible to use a wide range of metal powders such as
stainless steel, nickel-based alloys, Ti and its alloys, tooling steel, copper alloys, alumina,
or a combination of these 57,58,63
. Thus, LENS can be useful for the repairing or re-
manufacturing process that cannot be implemented by other AM techniques 57
. LENS and
DMD work through the process of depositing the metal layer-over-layer. Both are similar
in terms of processing; however, the high cost of DMD has boosted LENS’s popularity.
The need for support structures for overhanging features is one of the limitations of the
use of these techniques in the fabrication of orthopedic prostheses58
. Another drawback is
the residual stress caused by the rapid heating and solidifying process57
.
Many studies have been conducted using two techniques: fiber deposition (FD) and
3DP. The two have been chosen mainly due to their manufacturing simplicity compared
with SLS or EBM and cost efficiency. The base material of FD is metal powder. In the
FD method, the powders are mixed with a solution to form the slurry which can be
deposited from the machine onto a substrate. The scaffold is built by the process of
layering from bottom to top. The FD technique requires postprocessing of the product by
the sintering of the produced scaffold in a very high temperature furnace. When using FD
in the fabrication of a scaffold, several parameters can influence the strength and the
porosity of the structure, such as the gap between fibers, the fiber’s lay down angle, and
the nozzle’s diameter 64,65
. The dimensional accuracy of the final product is poor
compared to other techniques such as 3DP due to the wet nature of the fiber slurry, which
leaves a high level of shrinkage after drying and sintering 66
. In fact, this technique is still
in the experimental stage. One of the simplest rapid prototyping techniques is the ink-jet-
based 3DP, as shown in Figure 2-2.
18
Figure 2-2 Simple sketch showing the working principle of the 3DP machine.
In this technique, the printer functionality is similar to an ink-jet printer, where instead
of ink, a binder is dispersed through a print head on each layer of powder. Similar to
previous methods, this printer works on a layer-by-layer basis, starting from the bottom
and going up. The printer has two different powder zones: one for building the structure
and the other for feeding the powder, so that when the feeding area goes up, the building
area lowers down, moving a distance equivalent to the required layer thickness. A
counter-rotating roller spreads the powder from the feeding bed over to the building bed,
followed by the injection of the binder based on an image corresponding with the slice
layer data of the 3D structure. This technique is very fast in the building process and is
significantly cheaper than other techniques 58
. This machine was used indirectly to
produce a porous metal scaffold by printing a sacrificial mold from alumina powder to
cast the Co-Cr alloy which is then removed through several thermal and chemical steps67
.
Similarly, the same principle has been used to create a Ti scaffold and wax template as an
alternative sacrificial mold 52
. This method of manufacturing provides a precise surface
texture. However, the time- consuming process through the multiple stages of
manufacturing is considered to be the main disadvantage of the indirect 3DP technique.
This attempt has fascinated and motivated many researchers to replicate this success
through direct printing of the desired metal scaffold, followed by sintering of the green
part under a high temperature vacuum furnace 66,68
. This technique has fewer stages than
indirect printing. With 3DP, several parameters are able to form the microstructure of the

19
desired part such as powder size, sintering temperature, and duration 66
. The layer
thickness is primarily chosen based on the particle size and cannot be thinner than the
largest particle in the powder 68
. However, the resolution is lower than the laser-based
techniques because the binder penetrates the powders adjacent to the targeted area58
.
Difficulties in removing the trapped powder from the green part are the main
disadvantage of this technique 58,66,68
.
Using the 3DP method and CP Ti as a building material, the authors’ group has been
able to develop a set of optimized processing conditions to assure control over a
microstructure and the associated mechanical and physical properties of the structure66
.
Material powder size is one of the most influential parameters on changing the strength
and density of the structure, as shown in Figure 2-3. Also, the physical appearance of the
final product is crucial in the fabrication of the orthopedic implant, since a high level of
shrinkage in the implant is undesirable, and the particle size influences the shrinkage, as
shown in Figure 2-4.
As a whole, AM techniques offer a good control over the manufacturing of the
external and internal details of metallic bone substitute scaffolds, with limitations in the
creation of complex internal interconnected macro pores 31
.
2.5 Conclusions
Metals still form the bulk of primary bone substitute materials in the orthopedic
industry. Interest in metal implants will remain strong in the future, especially for senior
patients. The fabrication of metal implants is costly, but with new developments in the
AM field, manufacturability may become easier.

20
Figure 2-3 Compressive strength and porosity of the porous structures fabricated by varied sizes
of Ti powder.
Figure 2-4 Vertical and horizontal shrinkage of Ti samples fabricated by varied sizes of Ti
powder.

21
Chapter 3 Characterizations of
additive manufactured porous
titanium implant
3.1 Introduction
Aging of the world population is exponentially increasing, partly due to
significant increase in life expectancy. Half of chronic diseases for elders over 65 years
are represented by joint diseases and osteoporotic fractures69
. The most common sites of
osteoporotic fractures include the spine, hip and forearm 69
.
Bone implants composed of bulk metals are commercially available and are used
for the repair of large bone fractures/defects. Several metals have been used for this
purpose such as stainless steels (316L), Co-Cr-Mo alloy, titanium (Ti) alloys, pure
titanium and tantalum44
. Each metal has advantages and disadvantages which can expand
or limit the usage. However, the major drawback of the bulk metals is the stress shielding
which is generated on the host bone due to a mismatch in the stiffness of bone and the
implant 70
. In spite of the fact that the creation of implants from a material with low
elastic modulus (such as Ti) reduces the stress shielding, the mismatch between bone and
implant still exists46
. An effective approach to eliminate this problem may be the use of
porous metal structures. The amount of porosity in the implant is considered as the
crucial factor promoting successful bone integration with porous structure.
Several techniques have been used to produce porous metal structures. Some of
these techniques are conventional such as gas injection into the metal melt, plasma
spraying, space-holder method, conventional sinter of metal powders, spark plasma
sintering and replication of polymeric foams 44,46,50,71–73
. Other techniques which are more
advanced and have the capability of controlling the external and internal structure. These

22
techniques are called additive manufacturing (AM) techniques such as three-dimensional
printing (3DP) 52
, electron beam melting (EBM)53
, selective laser melting (SLM)54
, direct
metal deposition (DMD)55
and selective laser sintering (SLS)40
.
Recently, AM of Ti structures via adhesive bonding 3D printing has been
investigated 74
. In this method, a Ti green part is formed through 3D printing of irregular
Ti particles followed by heat treatment and sintering to obtain high mechanical
properties. Although this primary study showed the feasibility of the fabrication process
and suitability of produced structures in terms of in vitro biological responses, no
investigation has been reported related to the effect of process parameters on the porosity
and physical quality of final porous implants.
In this work, a comprehensive study on the effect of material condition (such as
Ti powder size and amount of the PVA) and manufacturing parameters (such the
sintering temperature and time) on the physical, chemical and mechanical properties of
porous Ti structures is presented.
3.2 Methodology
3.2.1Materials
The material used in the study to fabricate porous Ti structures was commercially
pure Ti powder (CP Ti, Phelly Materials Inc., Bergenfield, NJ, USA). This powder meets
the ASTM (F67-06 Grade 2) standards and was received in spherical shaped particle
form with diameter in the range of 45-150 µm. Ti powder was sieved with mesh sizes of
200 and 140 (U.S. standard sieve series, Cole-Parmer, USA). The outcome of sieving
process were four different categories of Ti powder: (A) As received powder, 45-150 µm,
(C) Course powder, 106-150 µm, (M) Medium powder, 75-106 µm and (F) Fine powder,
45-75 µm.
In this study, polyvinyl alcohol (PVA) powder 86-89% hydrolyzed with low
molecular weight (Alfa Aesar, Ward Hill, MA, USA) was used as a binder to bind
spherical Ti particles together to fabricate rigid green parts before the sintering. PVA was
received as a course powder and needed to be ground to < 63 µm to be similar or close to

23
Ti powder size. The grinding process was followed by sieving (U.S. standard sieve series,
Sieve No. 230, Cole-Parmer, USA). The resulting powder was in the range of 63 µm.
The blending process of Ti and PVA was carried out using a jar-mill (
LABMILL 8000 JAR MILL MACHINE, Paul N Gardner Company, USA) for 4 hours
using two levels of PVA additions, that is, 3 and 5 wt %. During the screening phase, 10
wt % PVA was initially used that resulted in a very high porosity ( ~50% which was not
desired as the goal of this study was to arrive at ~30% porous structures similar to
cortical bone). Therefore, lower PVA percentage was selected for this study. To assure a
homogeneous distribution of PVA within Ti powder, the blending process should be
implemented according to a certain criterion. The method of blending must be chosen
while considering the relation between the gravitational force and the centrifugal force to
get a homogenous mixture 75
.
It was found that the optimum mixing rate would be
satisfied at 76% of critical rotation rate. The critical rotation rate occurs when the
centrifugal force equals the gravitational force according to the following equation:
mdω2
2= 𝑚𝑔 (1)
ω = 2π𝑛 (2)
where g is the gravitational acceleration (9.81 m s-2
), d refer to bottle outer diameter, ω is
the angular velocity, m is the mass of bottle and n is the number of the cycle per minute.
Transforming the linear velocity to a rotational speed and solving the above equation
results in75
;
n =32
√d (3)
Thus, for a bottle with a diameter of 63 mm (which was used in this study), the optimum
rotation speed of the jar mill (n) was adjusted to 128 rpm.
3.2.2 Manufacturing of green parts
The 3D model of a rounded bar with dimensions of Ø10.3×15.45 mm2 was
generated with the assistance of SolidWorks® Ver. 2006 (SolidWorks Corp., Concord,
MA, USA). The model was exported in stereolithography (STL) format to 3D Printing
machine.

24
The fabrication of the porous structures was conducted by a retrofitted powder-
based 3D printing machine (ZPrinter310-Plus, Z Corporation, Burlington, USA). In the
printer, the designed model was sliced by Zprint software into 2D layers. Three varied
levels of layer thickness were chosen by considering the particles sizes in each category
as listed in Table 3-1. To spread a layer of powder smoothly, the stacked-layer thickness
should be larger than the largest particle in each category as shown in Figure 3-1(b).
At the beginning, the feed piston rose up in conjunction with the build piston
which descended by the stacked-layer thickness. Then, a counter-rotating roller spread a
layer of blended powder in the same thickness of the slice that had already been specified
before the printing. Next, a print-head injected an aqueous solvent (ZbTM
58, Z
Corporation, Burlington, USA) on the powder, causing the Ti particles to bind to one
another and to the previous printed cross section. The feed and build pistons moved with
the same sequence while the above process repeated until the entire sample was printed
as shown in Figure 3-1(a). After the printing process, samples were left to dry for 1.5 h at
38ºC.
Table 3-1 Layer Thickness Which Used for Different Categories of Powder.
Powder Category Stacked-Layer Thickness(µm)
(A) 45-150 µm 175
(C)106-150 µm 175
(M) 75-106 µm 125
(F) <75µm and >45 µm 100

25
Figure 3-1 Schematic of (a) 3D printing process and (b) powder spreading and compaction by a
counter-rotating roller. Layer thickness (i.e., the gap between roller and underlying powder layer)
is chosen larger than powder particle size.
Using a brush, the samples were cleaned after drying. The cleaning was followed
by blowing compressed air to the samples to ensure that all non-adherent particles were
removed from the external surface.
3.2.3 Sintering
The sintering process was carried out in a MTI® High Temperature Tube Furnace
(GSL—1500X-50, Richmond, CA, USA). The process started with burning the PVA at
295 ºC for 3 h with a heating rate of 10ºC min-1
as seen in Figure 3-2. Then, the tube was
purged with high purity Ar gas (Grade 5) to avoid the oxidation of titanium under high
temperatures. The furnace was adjusted to hold at 500 ºC for 1 h to ensure that the
residual PVA in the samples were removed. Then, the furnace temperature was
programmed to rise up to a targeted temperature of either 1100 or 1400ºC and was held
for either 1 or 3 h. The surfaces of the sintered samples were slightly cleaned by a sand
paper. Then, samples were immersed for 5 min in the ultrasonic cleaner bath filled with
distilled water. After that, the samples were placed in an alumina crucible to dry in a
regular oven at 130ºC for 2 h.

26
Figure 3-2 Sintering protocols which are followed in the sintering process.
3.3 Shrinkage Measurement
The geometrical features measurement was conducted to identify the shrinkage
percentage on the material during the sintering process. This measurement was carried
out using electronic Vernier caliper. The height and diameter of the samples were
measured before and after the sintering process three times for each. The feature sizes
were recorded and averaged from three readings. The percentage of horizontal (H%) and
vertical (V%) shrinkage (shown in Figure 3-3) was calculated according to the following
formula:
H% =DiameterAfter sintering−DiameterBefore sintering
DiameterBefore sintering× 100 (4)
V% =HeightAfter sintering−HeightBefore sintering
HeightBefore sintering× 100 (5)
0
200
400
600
800
1000
1200
1400
1600
0 200 400 600 800
Tem
per
atu
re
C
Time (min)
1hr at 1100 °C
1hr at 1400 °C
3hr at 1100 °C
3hr at 1400 °C
Stage1 of
burning PVA
Sintering at 1400
C
Sintering at 1100
CFurnace cooling
Start purging Ar
Stage 2 of burning
PVA

27
Figure 3-3 Schematic of horizontal and vertical shrinkage directions on the sample caused by
sintering. Ti rounded bars were positioned in the sintering furnace as their main axis was along
with the gravity direction.
3.4 Porosity Measurements
The porosity measurement was carried out according to ASTM B 311& C373 using
Archimedes principle of buoyancy. The test was done by first measuring the dry weight ,
Wdry , using an electronic balance (APX-203, Denver Instrument, USA) with a precision
of 0.001g. Then, sample was immersed in the distilled water and boiled for 3 h to extract
the bubbles of air from the porous structure. Afterwards, the sample was kept in water for
12 h to ensure the removal of air from the entire structure. The sample was subsequently
placed on the net of the Universal Specific Gravity Kit (Sartorius®, Bradford, MA, USA)
which was submerged in water and weighted the sample’s submerged weight Wsub. The
sample then removed from the kit and weighted to obtain the wet weight Wwet. Finally,
the porosity of the sample was calculated from the following formula:
Porosity % =Wwet−Wdry
Wwet−WSub (6)
3.5 Mechanical Properties Measurements
Compression test was used to characterize the mechanical properties of the fabricated
samples. This test was implemented by the uniaxial test machine (Instron-4206, USA) at
room temperature. The machine was equipped with a 150 kN load-cell and the cross head
speed was 1mm min-1
, corresponding to a strain rate of 1.0×10⁻³
s–1
. In this study, 4
rounded bars with diameters of ~ 10 mm and a length-to-diameter ratio of 1.5 (according
to ASTM E9 – 09) were used to perform the tests.

28
3.6 Micro-structure Characterization
The microstructure characterization of the porous titanium structure was
conducted using the scanning electron microscope (SEM) (JEOL JSM-6460) equipped
with energy-dispersive X-ray spectroscopy (EDX) analysis (INCA 350 Microanalysis
System).
The sinter necks among the particles in the SEM images were measured using
ruler in the image processing tool box of MATLAB®
to compare the neck ratio (neck size
/particle size).
The characterization of the chemical composition of the produced samples was
carried out by the EDX. This method of analysis discovers any contamination that the
material may have been exposed to through the sintering process.
3.7 Results:
3.7.1 Structural Observation
A typical rounded bar sample with a diameter of 10 mm and height of 15 mm which was
fabricated using the 3D printing machine is depicted in Figure 3-4.
Figure 3-4 Fabricated Ti sample with a dimension of Ø10mm×15mm.
The SEM images of the porous structure in Figure 3-5 shows Ti particles are bound
together forming clusters of Ti when the additive PVA powder is used in the fabrication
process.
5 mm

29
Figure 3-5 Micrograph of the green sample printed from category A of powder demonstrates the
PVA binding Ti particles together before the burning process of PVA.
Figure 3-6 shows the microstructure of Ti samples after sintering. In Figure 3-6a, the neck
among the particles had just started at 1100 ºC; however, Figure 6b shows that large
necks have formed among the particles at higher sintering temperature (1400 ºC). This
evidence proves the influence of increasing the sintering temperature on improving the
sintering process.
Figure 3-6 SEM of Ti samples fabricated from category F with fine particles bounded with 3%
PVA and sintered for 1hr at (a) 1,100 ºC, (b) 1,400 ºC.
The chemical composition of Ti samples was evaluated by the EDX. The
histogram of the EDX reveals that the structure was not contaminated by any material
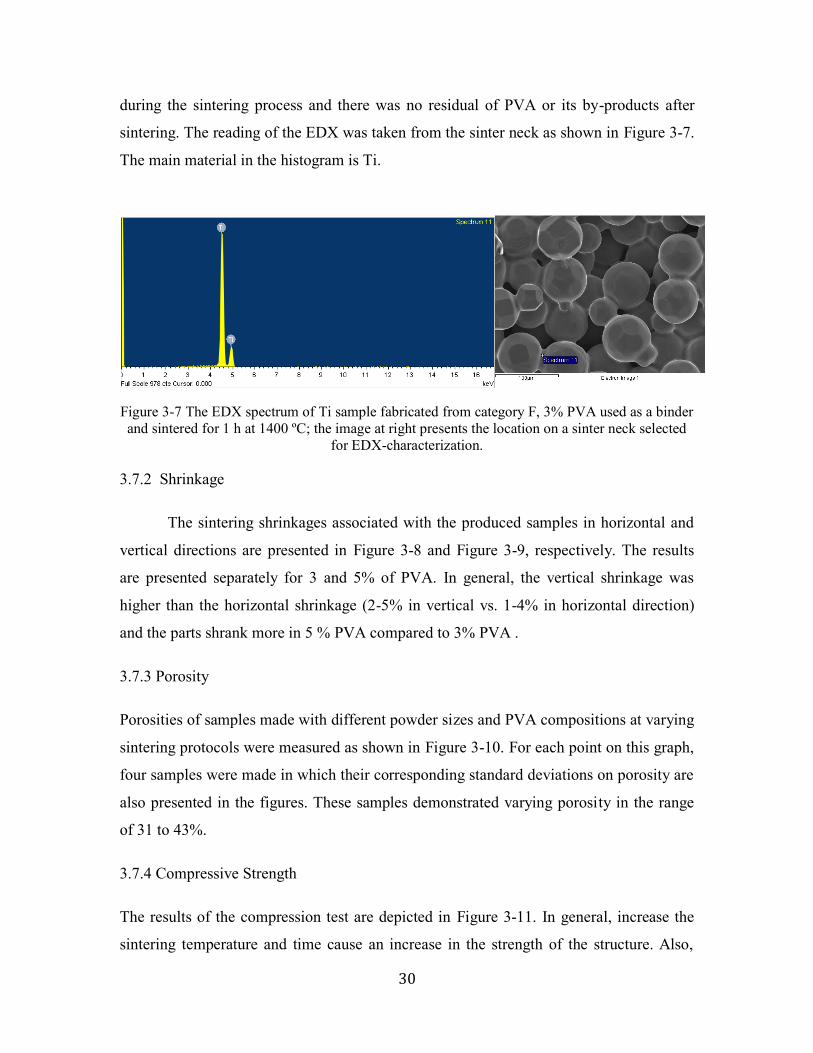
30
during the sintering process and there was no residual of PVA or its by-products after
sintering. The reading of the EDX was taken from the sinter neck as shown in Figure 3-7.
The main material in the histogram is Ti.
Figure 3-7 The EDX spectrum of Ti sample fabricated from category F, 3% PVA used as a binder
and sintered for 1 h at 1400 ºC; the image at right presents the location on a sinter neck selected
for EDX-characterization.
3.7.2 Shrinkage
The sintering shrinkages associated with the produced samples in horizontal and
vertical directions are presented in Figure 3-8 and Figure 3-9, respectively. The results
are presented separately for 3 and 5% of PVA. In general, the vertical shrinkage was
higher than the horizontal shrinkage (2-5% in vertical vs. 1-4% in horizontal direction)
and the parts shrank more in 5 % PVA compared to 3% PVA .
3.7.3 Porosity
Porosities of samples made with different powder sizes and PVA compositions at varying
sintering protocols were measured as shown in Figure 3-10. For each point on this graph,
four samples were made in which their corresponding standard deviations on porosity are
also presented in the figures. These samples demonstrated varying porosity in the range
of 31 to 43%.
3.7.4 Compressive Strength
The results of the compression test are depicted in Figure 3-11. In general, increase the
sintering temperature and time cause an increase in the strength of the structure. Also,

31
decrease the size of Ti particles causes an increase in the compressive strength. In this
study, compressive strength in the range of 56-509 MPa resulted from the four categories
of powder which were sintered under different sintering conditions.
3.8 Discussion
Porous Ti structures were produced using a powder-based adhesive bonding AM process
and the physical, chemical and mechanical properties of them were characterized. In
addition, the effective process parameters were assessed. For design and manufacturing
of orthopedic implants, the dimensional precision is a key factor. The implants should fit
in the spaces which are precisely targeted for. This precision is highly affected by
dimensional deviations occur during the manufacturing process. Structural shrinkage is a
critical cause of dimensional deviation which happens during sintering process. A low
percentage of shrinkage in the structure is preferred in order to obtain an effective control
over the geometrical accuracy. Using the measured dimensional deviations from original
CAD model to the final sintered part, an anisotropic compensation factor can be
determined. The compensation factor is applied on the CAD model to obtain the final
part with desired dimensions. However, anisotropic shrinkages cause nonuniform
dimensional deviations. Anisotropic shrinkages are incredibly difficult to accurately
compensate in the parts with complex surface due to the interactions between
dimensional deviations in x, y, and z directions. Thus, process parameters which results
in more uniform shrinkage are desired for AM of complex-shaped orthopedic devices.
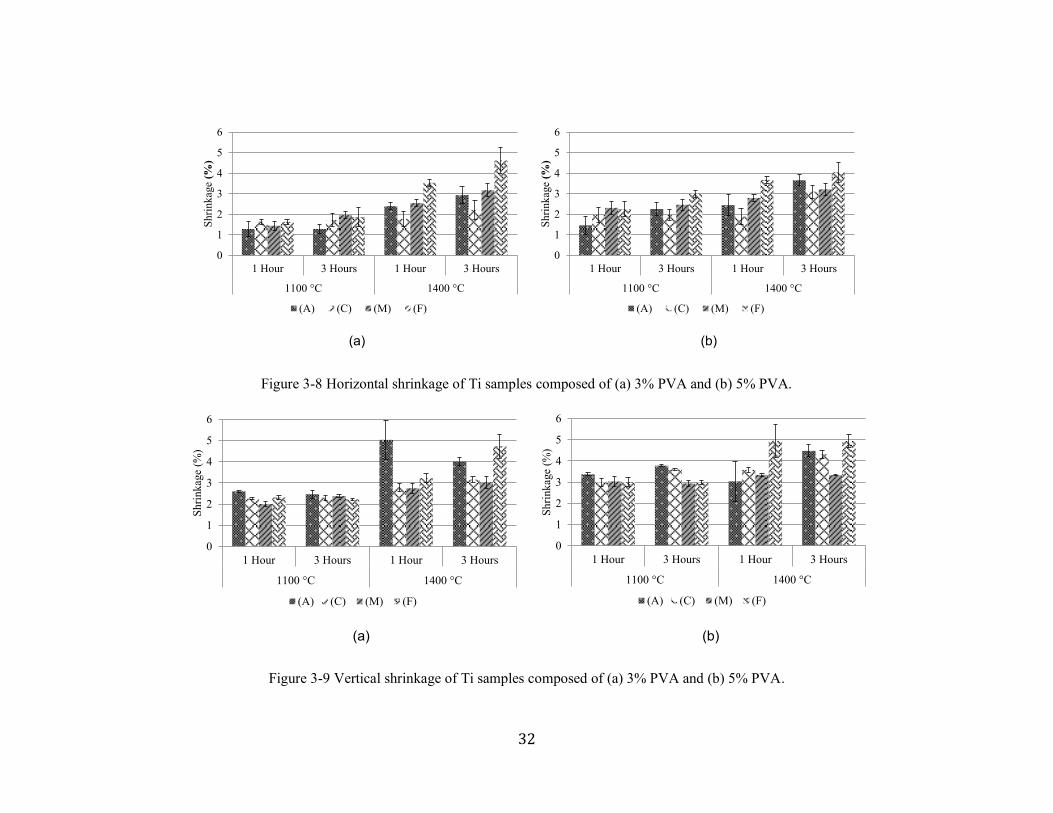
32
Figure 3-8 Horizontal shrinkage of Ti samples composed of (a) 3% PVA and (b) 5% PVA.
Figure 3-9 Vertical shrinkage of Ti samples composed of (a) 3% PVA and (b) 5% PVA.
0
1
2
3
4
5
6
1 Hour 3 Hours 1 Hour 3 Hours
1100 °C 1400 °C
Sh
rin
kag
e(%
)
(A) (C) (M) (F)
0
1
2
3
4
5
6
1 Hour 3 Hours 1 Hour 3 Hours
1100 °C 1400 °C
Sh
rin
kag
e(%
)
(A) (C) (M) (F)
(a) (b)
0
1
2
3
4
5
6
1 Hour 3 Hours 1 Hour 3 Hours
1100 °C 1400 °C
Sh
rin
kag
e (%
)
(A) (C) (M) (F)
0
1
2
3
4
5
6
1 Hour 3 Hours 1 Hour 3 Hours
1100 °C 1400 °C
Sh
rin
kag
e (%
)
(A) (C) (M) (F)
(a) (b)

33
Figure 3-10 Porosity of the porous structures fabricated by varied sizes of Ti powder and sintered with different sintering conditions and composed
of (a) 3% PVA (b) 5% PVA.
0
100
200
300
400
500
600
1 Hour 3 Hours 1 Hour 3 Hours
1100 °C 1400 °C
Co
mp
ress
ive
Str
eng
th (
MP
a)
(A) (C) (M) (F)
0
100
200
300
400
500
600
1 Hour 3 Hours 1 Hour 3 Hours
1100 °C 1400 °C
Co
mp
ress
ive
Str
eng
th (
MP
a)
(A) (C) (M) (F)
(a) (b)
Figure 3-11 Compressive strength of the porous structures fabricated by varied sizes of Ti powder and sintered with different sintering conditions
and composed of (a) 3% PVA (b) 5% PVA.
0
5
10
15
20
25
30
35
40
45
1 Hour 3 Hours 1 Hour 3 Hours
1100 °C 1400 °C
%
(A) (C) (M) (F)
0
5
10
15
20
25
30
35
40
45
1 Hour 3 Hours 1 Hour 3 Hours
1100 °C 1400 °C
%
(A) (C) (M) (F)
(a) (b)

34
In this study, sintering shrinkages were in the range of 1.28% ± 0.37% to 4.6% ±1.3%
in horizontal direction and 2% ± 0.11% to 5% ± 0.91% in vertical direction. The
shrinkages observed in the present study obtained via a direct AM process (adhesive
bonding 3D printing) is low compared to the shrinkages reported for other fabrication
processes including direct76
and indirect methods52
. Ti samples fabricated using the
electron beam melting (EBM) technique has shown horizontal and vertical shrinkage of
6.5% and 7.1%, respectively76
. In the indirect 3DP technique (which include 3D printing
of mold, casting the Ti powder followed by sintering at 1300 ºC), the horizontal and
vertical shrinkages were reported equal to 11.9% ± 1.1% and 9.2% ± 0.6%,
respectively52
. Also, the difference between horizontal and vertical shrinkages in the
present study (which is mainly due to gravity effect during sintering) is relatively small
(~1%). It should be noted that the above comparison on the shrinkage level of the
manufacturing techniques, assuming that optimum results are reported in these articles.
It is also noteworthy that the sintering shrinkage has a relation with the sinter-neck
size. To investigate this matter the neck sizes were measured using the SEM images of
the microstructures. Figure 3-12 presents the variation of sinter-neck-size to particle-
diameter ratio (x/a) for the category F (<75 µm). The trend resembles the trend of
sintering shrinkage as shown in Figure 3-8 and Figure 3-9. Sinter neck size has a
profound impact on the mechanical strength of structures that will be discussed later.
Figure 3-12 Variation of sinter-neck-size to particle-diameter ratio (x/a) for the category
F(<75µm).
0
0.1
0.2
0.3
0.4
0.5
0.6
3% PVA 5% PVA 3% PVA 5% PVA 3% PVA 5% PVA 3% PVA 5% PVA
1 Hour 3 Hours 1 Hour 3 Hours
1100 °C 1400 °C
x/a
a
x

35
Other than geometrical dimensions, porosity (i.e., void volume%) of the structures is
profoundly affected by the sintering shrinkage. In general, a higher sintering temperature
resulted in a higher shrinkage and, in turn, a lower porosity as seen in Figure 3-10. As
seen in the SEM image of the microstructures (Figure 3-6), sinter necks has started to
form at 1100 °C and well-developed at 1400 °C. Sintering time (3 h vs. 1 h) did not
significantly affect the porosity. Only in case of using fine powder (category F), the
porosity decreased ~6% more in 3 h sintering. The effect of mixing more PVA with Ti
(5% vs. 3%) was observed on the compressive strength of all categories of powder which
are sintered at 1400ºC (50-150 MPa). The increase in the amount of PVA caused a
decrease in compressive strength especially in categories A, C and M, but in category F
the reduction in the strength is not significant. This might be due to the fact that the
driving force of sintering is higher for fine particles that compensate the reduction caused
by increase of PVA. As shown in Figure 3-8 and Figure 3-9, it is obvious that using finer
Ti particles resulted in higher shrinkage and ended up with lower porosity that can be due
to higher driving force for atomic diffusion in high temperature50
. Some may argue that
the drop in porosity have been caused by the variation between the compact density of
green sample. However, Figure 3-13 shows that category F has the highest drop in the
porosity compared to the other categories. About 11% drop in porosity was observed for
the samples from category F, while 6% in category A sintered at 1400 ºC for 3 h using
5% PVA. The increase in compact density plays a role in decreasing the porosity, but the
powder particles size is the crucial factor in this reduction. It is noteworthy that category
M is composed of narrower range of powder particle size (75-106 um) and it presents
lowest porosity in all sintering conditions except at 1400 ºC and 3 h.

36
Figure 3-13 A comparison between the porosity of green samples and sintered samples which
sintered at 1400 ºC for 3 hours using 5% PVA.
The trend/variation of mechanical strengths of produced samples (Figure 3-11) is
almost in an agreement with the variation of associated porosity (Figure 3-10). The
samples with lower porosity (that were processed in higher temperature, i.e., 1400 °C)
showed higher compressive strength. For instance, the parts made from M and F powders
at 1400 °C were about five times stronger than those made at 1100°C (~500 MPa vs. 100
MPa). The effect of increase in sintering time and PVA% on mechanical strength was
not significant in samples which were sintered at 1100°C.
In summary, the variation of porosity and compressive strength of samples can be
classified into two trends: (1) the samples made from powder categories which have
small particles sizes (<100µm, i.e., categories M and F) show lower porosity and higher
strength, and (2) the samples consist of larger particles (i.e., categories C and A) have
higher porosity and lower strength. As explained previously, this matter may attributed to
dissimilarity in sintering driving force for fine and coarse particles. It is obvious that the
samples with lower porosity and larger sinter necks have higher mechanical strength
0
5
10
15
20
25
30
35
40
45
50
A C M F
%
Green Porosity Final Porosity

37
considering the fact that the fracture occurs on the sinter necks as was determined using
the SEM images of fracture surface (Figure 3-14).
Figure 3-14 SEM images showing the crack initiated at the sinter neck of sample.
In the present study, a wide range of compressive strength was achieved from 56 to
509 MPa. The results give the superiority to the present technique when compare it with
other AM techniques i.e., SLS used for the same purpose and the strength were in the
range of 0.5-350MPa40
, indirect printing using a wax mould produced samples had
strength in the range of 150-350 MPa52
and EBM which produced a sample with strength
of 116 MPa76
.
3.9 Relation between Porosity and Compressive Strength
The model of Gibson and Ashby77
can predict the compressive strength of porous
metals which have a homogenous porous structure78
. In this model, the relative density
ρ/ρs (Relative density = 1- Porosity) is the most important parameter in governing the
compressive strength of the open-cell porous structure as follows:
σ
σs= C (
ρ
ρs)
3
2 (7)
where σ and σs denote the strength of the porous and bulk Ti, respectively; ρ and ρs are
the density of the porous and bulk Ti, respectively; C is the proportionality constant.
Crack

38
In attempts to apply the model of Gibson and Ashby on the Ti porous structures in
Wen et al.79
and Zou et al.80
, they concluded the incompatibility of this model with
porous Ti structure since the difference between the experimental results and the
theoretical model is large. In the present study, another trial is carried out to fit the
experimental results to the model using a compressive strength σs = 760 MPa78
. The
proportionality constant C and the exponent factor were modified through regression
analysis and curve fitting of the experimental data as listed in Table 3-2.
Table 3-2 Gibson and Ashby Modified Models.
Sintering Temperature (°C) Relative Compressive Strength
1100 σ
σs= 3.04 (
ρ
ρs)
6.14
1400 σ
σs= 5.81 (
ρ
ρs)
6.18
In Figure 3-15, two trend lines represent the plotted data of samples sintered at
1100°C (the lower trend line) and 1400°C (the upper trend line). The influence of the
sinter neck in increasing the proportionality constant appears in Figure 3-15. When Ti
samples were sintered at 1100°C where the sinter necks between the particles were just
initiated, the plotted points in the figure are converged from the model line. These points
represent all four categories of powder which were sintered at the same temperature.
However, a different scenario occurred when the samples were sintered at 1400 °C, since
the plotted data remained close to the model line at Categories A and C, which have large
particles. After that, the plotted data of Categories M and F diverged away from the
model line. This divergence caused an increase in the proportionality constant in the
model when the samples sintered at 1400 °C, with the knowledge that a thick sinter neck
was formed in the samples of these categories. The difference in the value of the
exponent factor between the model of Gibson and Ashby and that in the present study
may be due to the geometrical characteristic of the cell wall. It should be noted that the
description of Eq.(7) by Gibson and Ashby is based on the structure of the unit cell as a
simple cubic array with a square cross-sectional member. However, in the present study

39
the simple structure of the unit cell is formed by four spherical particles connected to
each other by the sinter necks. These necks are in the shape of disc with a circular cross-
section.
Figure 3-15 Relative density of several powder categories for two sintering protocols as a
function of relative compressive strength.
To locate the results of the present study and compare those with the real bone, a
data regarding the cancellous bone mechanical properties was adapted from Gibson and
Ashby81
and depicted in Figure 3-16. According to Gibson and Ashby81
, the data of the
cancellous bone concentrated around the line defined by Eq. (7) as shown in Figure 3-16.
The results of the present study were also plotted in this figure. As seen in Figure 3-16,
the categories of Ti which sintered at 1100°C fall in the range of the cancellous bone.
However, the powder categories sintered at 1400°C that possessed a percentage of
porosity approaching the porosity of the cortical bone fall out of the range of the
cancellous bone.
0
0.1
0.2
0.3
0.4
0.5
0.6
0.7
0.56 0.58 0.6 0.62 0.64 0.66 0.68 0.7
Rel
ativ
e C
ompr
essi
ve S
tren
gth
Relative Density
(A),1400 °C (C),1400 °C (M),1400 °C (F),1400 °C
(A),1100 °C (C), 1100 °C (M),1100 °C (F), 1100 °C
Decrease th
e Sin
terining T
emperature
Sintering at 1100 °C
Sintering at 1400 °C

40
Figure 3-16 Relative density of Ti structure as a function of the relative compressive strength.
According to the obtained results, the mechanical properties are not solely
controlled by the relative density, but also the sinter neck plays a major role in
strengthening the structure. For instance, the results showed two cases of Ti samples
produced with different sizes of powder and sintered at different heating protocols, where
both samples have identical porosity of ~36%, but different compressive strengths of 144
and 408 MPa, respectively. This contrast may provide evidence of the effectiveness of
sinter neck in controlling the strength of structure. It should be emphasized that this
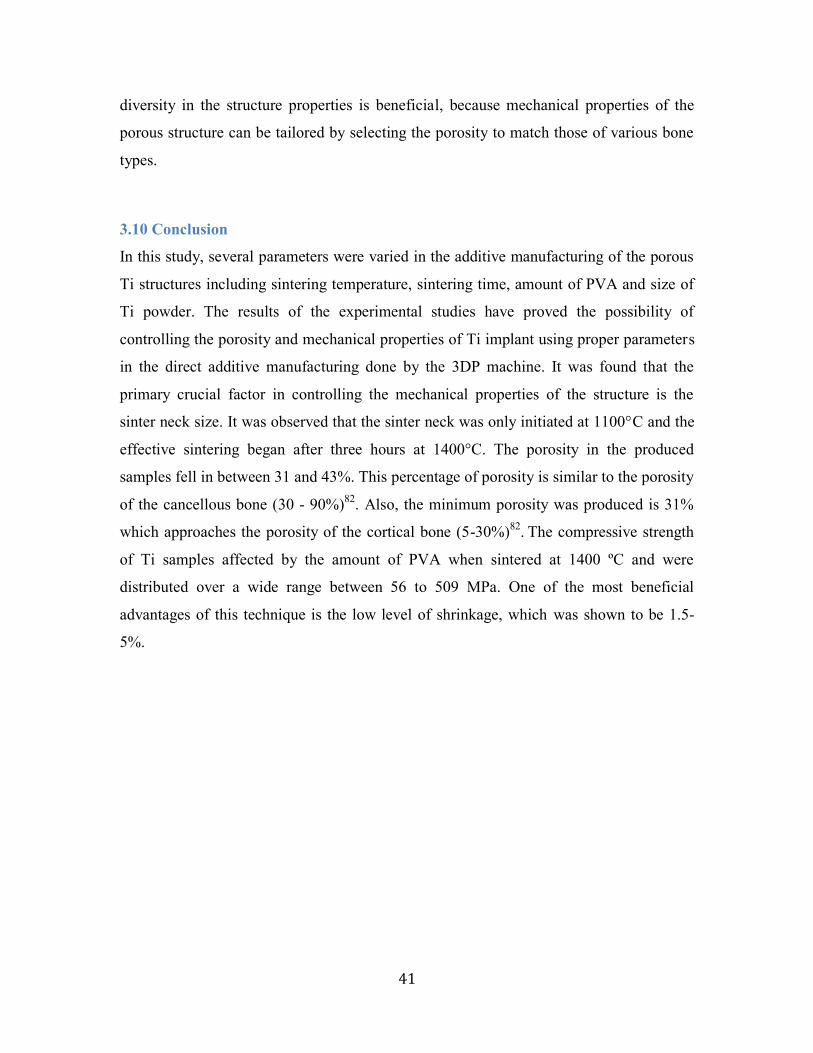
41
diversity in the structure properties is beneficial, because mechanical properties of the
porous structure can be tailored by selecting the porosity to match those of various bone
types.
3.10 Conclusion
In this study, several parameters were varied in the additive manufacturing of the porous
Ti structures including sintering temperature, sintering time, amount of PVA and size of
Ti powder. The results of the experimental studies have proved the possibility of
controlling the porosity and mechanical properties of Ti implant using proper parameters
in the direct additive manufacturing done by the 3DP machine. It was found that the
primary crucial factor in controlling the mechanical properties of the structure is the
sinter neck size. It was observed that the sinter neck was only initiated at 1100°C and the
effective sintering began after three hours at 1400°C. The porosity in the produced
samples fell in between 31 and 43%. This percentage of porosity is similar to the porosity
of the cancellous bone (30 - 90%)82
. Also, the minimum porosity was produced is 31%
which approaches the porosity of the cortical bone (5-30%)82
. The compressive strength
of Ti samples affected by the amount of PVA when sintered at 1400 ºC and were
distributed over a wide range between 56 to 509 MPa. One of the most beneficial
advantages of this technique is the low level of shrinkage, which was shown to be 1.5-
5%.

42
Chapter 4 On the influence of
sintering protocols and layer thickness
on the physical and mechanical
properties of additive manufactured
titanium porous structures
4.1 Introduction
Aseptic loosening is the main cause of revision surgery for total joint replacement 4.
Various factors cause the loosening, and the main mechanical factor is the stress-
shielding effect 5. Stress shielding is due to a mismatch in the stiffness of cementless
implant and cortical bone, which in turn leads to bone resorption83,84
. The structure of the
cortical bone is very dense with a porosity ranging between 3-30% 22,82
with varying
levels of mechanical properties. This variation is influenced by several factors including
bone location, bone age, mineralization, and hydration85
. As such, the design and
fabrication of a bone implant is a sophisticated process due to the anisotropic properties
of bone 44
.
Ti has been used for many decades due to its biocompatibility, and given the fact that the
biocompatibility of the metal mainly depends on the corrosion resistance. Ti provides a
higher corrosion resistance compared to other metals due to the protective oxide layer
that forms on its surface 34,86
. The best candidate to further minimize stress shielding
effects while retaining other beneficial characteristics is Ti foam structure, due to its
comparable stiffness with bone and excellent strength to weight ratio45,46
.
Many attempts have been made to mimic cortical bone properties by employing titanium
foam. Oh et al.50
fabricated porous Ti foam by cold pressing before sintering and
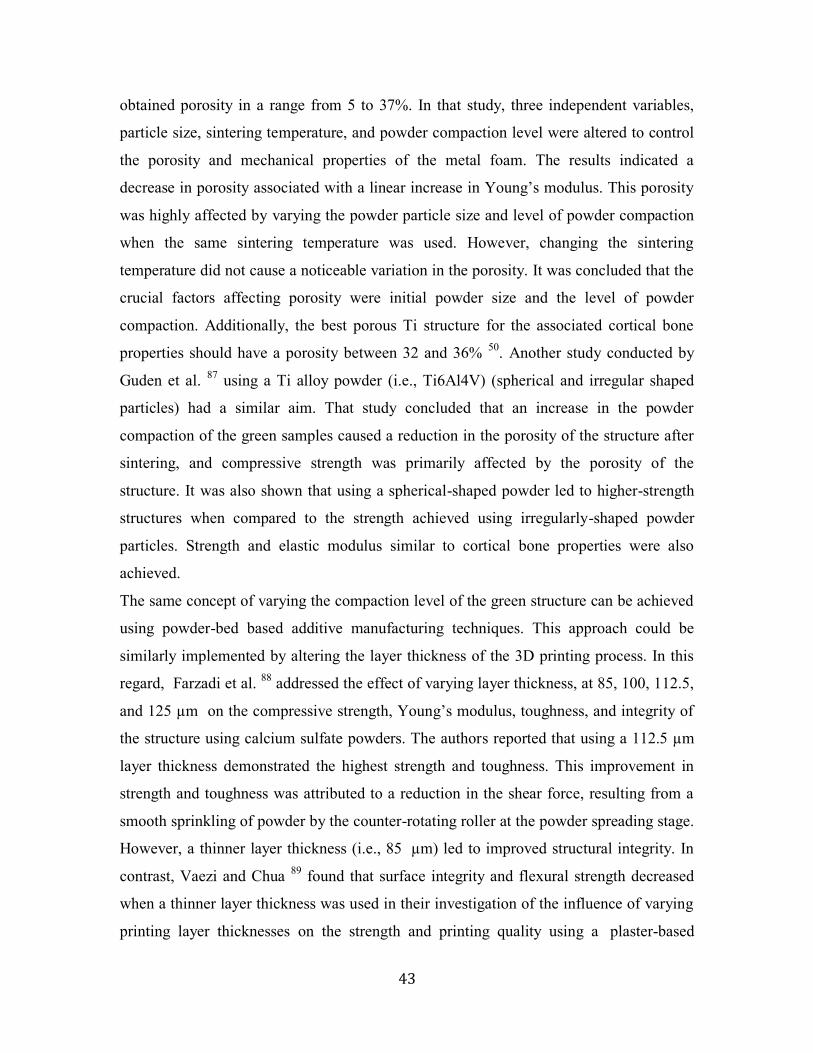
43
obtained porosity in a range from 5 to 37%. In that study, three independent variables,
particle size, sintering temperature, and powder compaction level were altered to control
the porosity and mechanical properties of the metal foam. The results indicated a
decrease in porosity associated with a linear increase in Young’s modulus. This porosity
was highly affected by varying the powder particle size and level of powder compaction
when the same sintering temperature was used. However, changing the sintering
temperature did not cause a noticeable variation in the porosity. It was concluded that the
crucial factors affecting porosity were initial powder size and the level of powder
compaction. Additionally, the best porous Ti structure for the associated cortical bone
properties should have a porosity between 32 and 36% 50
. Another study conducted by
Guden et al. 87
using a Ti alloy powder (i.e., Ti6Al4V) (spherical and irregular shaped
particles) had a similar aim. That study concluded that an increase in the powder
compaction of the green samples caused a reduction in the porosity of the structure after
sintering, and compressive strength was primarily affected by the porosity of the
structure. It was also shown that using a spherical-shaped powder led to higher-strength
structures when compared to the strength achieved using irregularly-shaped powder
particles. Strength and elastic modulus similar to cortical bone properties were also
achieved.
The same concept of varying the compaction level of the green structure can be achieved
using powder-bed based additive manufacturing techniques. This approach could be
similarly implemented by altering the layer thickness of the 3D printing process. In this
regard, Farzadi et al. 88
addressed the effect of varying layer thickness, at 85, 100, 112.5,
and 125 µm on the compressive strength, Young’s modulus, toughness, and integrity of
the structure using calcium sulfate powders. The authors reported that using a 112.5 µm
layer thickness demonstrated the highest strength and toughness. This improvement in
strength and toughness was attributed to a reduction in the shear force, resulting from a
smooth sprinkling of powder by the counter-rotating roller at the powder spreading stage.
However, a thinner layer thickness (i.e., 85 µm) led to improved structural integrity. In
contrast, Vaezi and Chua 89
found that surface integrity and flexural strength decreased
when a thinner layer thickness was used in their investigation of the influence of varying
printing layer thicknesses on the strength and printing quality using a plaster-based

44
powder. However, the tensile strength increased when a thinner layer thickness was used.
In the both preceding studies, the materials were not metal, so they did not require post-
processing sintering to form the rigid structure.
The influence of various sintering temperatures and binder contents along with the de-
binding heating protocol on the physical appearance and shrinkage of a porous Ti
structure were studied by Wiria et al. 6. In that study, two de-binding protocols were
followed, and the lower temperature protocol (250 and 415º C) showed lower shrinkage.
However, increasing the sintering temperature led to a higher level of shrinkage.
According to our previous work and the work of Zou et al. 66,90
, sintering temperature has
a highly significant impact on the development of the sinter neck, which directly
influences the strength of the structure.
There is a lack of contributions in regard to directly using a powder bed ink-jet based
additive manufacturing machine to fabricate Ti porous structures. The reason behind this
lack comes from the difficulties of dealing with Ti, since it requires a sophisticated
sintering condition in post processing and the machine since invented has been mainly
designed to fabricate ceramics and polymeric materials.
In this study, the effect of layer thickness which represents the level of compaction of the
powder during the 3D printing process will be addressed. In addition, the sintering
temperature variations, which represent diffusional bonding among the particles on the
printed Ti structure will be investigated and will form the scope of this study.
Furthermore, the interaction between both parameters, the level of powder compaction
and sintering temperatures, and their influence on the structure’s physical and mechanical
properties will be investigated. As there is no clear understanding in the literature on the
correlation of the sinter neck size between the particles in the additively manufactured
structure and the porosity of the structure, an analytical model will be developed in an
attempt to clarify the relationship between these factors based on the volume fraction of
the compacted powder.

45
4.2 Methodology
4.2.1 Material
Ti powder with particle size range of 38-45 µm was used in this study to produce the
samples. The received powder of CP Ti (CP Ti Grade 1, Advanced Powders and
Coatings, Inc., Boisbriand, QC, Canada) was less than 45 µm and a sieve (US standard
test sieve, No.400, Cole-Parmer, USA) with a mesh size of 38 µm was used to sift the
powder and obtain particles size between 38-45 µm. The metal powder was mixed with
the binding agent which was used to bind the Ti particles during the printing stage of the
green part. This agent is Polyvinyl alcohol (PVA) powder ,86–89% hydrolyzed, with a
low molecular weight (Alfa Aesar, Ward Hill, MA, USA) and the mixing recipe was 3
wt% of PVA mixed with Ti powder. The mixture was milled for four hours in a jar-mill
(LABMILL 8000 JAR MILL MACHINE, Paul N. Gardner Company, USA).
4.2.2 Manufacturing
The printing of the samples was carried out by using an ink-jet powder-based 3D printer
(ZPrinter310-Plus, 3D Systems, Rock Hill, SC, USA) in which the powder mixture (Ti
and PVA) was loaded in the machine. The printing process was implemented by printing
the samples layer over layer with the assistance of an aqueous-based binder (ZbTM
60 , 3D
Systems, Rock Hill, SC, USA), which was loaded in the print-head of the machine and
used to bind the Ti particles with the assistance of the PVA. In the factorial design of this
experiment, layer thickness and sintering temperature were chosen as parameters for the
variables in this study. There is a limitation in regard to varying the layer thicknesses
using the ZPrinter310-Plus. However, we've accessed and modified the machine code so
that the printer became capable of printing any layer thickness without limitation.
Therefore, different layer thicknesses were used for printing to represent different levels
of powder compaction (Table 4-1) and four samples of each layer thickness were printed
accordingly.

46
Table 4-1 Layer thicknesses used for printing and corresponding number of printed layers and
average green density for each sample.
Layer thickness (µm) 62.5 87.5 105 125 150 175
Actual No. of layers 177 127 106 89 73 63
Green density
(g/cc) 2.53 2.51 2.47 2.42 2.40 2.37
4.2.3 Sintering
Sintering temperatures were selected as: 800 ºC, 1000 ºC, 1200 ºC, and 1400 ºC. Before
the sintering process was launched, a PVA de-binding process was conducted over two
stages at 295 ºC and 500 ºC (Figure 4-1).
Figure 4-1 Four different heating profiles followed during the sintering process.

47
4.3 Characterization
4.3.1 Porosity
Porosity measurement was conducted using the Archimedes principal of buoyancy and
according to ASTM B 311-08 and ASTM C373-88 91,92
. This measurement was obtained
with the assistance of a Universal Specific Gravity Kit (Sartorius®, Bradford, MA, USA)
and an electronic balance (APX-203, Denver Instruments, NY, USA) with a precision of
0.001 g. The steps for measuring the porosity were similar to those followed by Basalah
et al. 66
.
4.3.2 Compression Test
A compression test was used to obtain the stress-strain curve for each sample. The curves
were then used to obtain Young’s modulus (E) and 0.2% offset yield strength (σ). The
0.2% yield strength was obtained according to ASTM Standard E9-09 93
. The
compression test was conducted using a uniaxial compression test machine (Instron-
4206, USA) with a cross head speed of 1 mm/min. The dimensions of the rounded bar
samples (n = 4) were Ø7.49 mm × 11.24 mm.
4.3.3 Shrinkage
Shrinkage measurements were conducted using an electronic Vernier caliper (Mitutoyo
Corp., Kawasaki, Japan) with a precision of 0.01 mm. The vertical and horizontal
dimensions of the samples were collected before and after the sintering process and the
compact dimensional change was divided by the initial dimension to obtain the rate of
shrinkage as reported by Basalah et al. 66
.
4.3.4 Microscopic Characterization
In this study, the sinter neck between the particles was quantified using the image
processing toolbox 8.3 (MATLAB R2013b, USA). The characterization was conducted
on an image shot by a scanning electron microscope (SEM) (JEOL JSM-6460). The
diameters of the necks between the particles and the diameters of the particles were
measured using the roller option from the image processing toolbox and compared to the

48
image scale. Next, the measured pixels were interpolated and converted to a real value
based on the image scale to obtain the real sinter neck diameter and particle diameters.
Finally, the sinter neck ration was calculated by dividing the sinter neck diameter over
the particle diameter.
4.3.5 Statistical Analysis
Two-way ANOVA test (a multifactorial statistical test) was conducted on the results for
porosity, yield strength, Young’s modulus, and vertical and horizontal shrinkages to
detect any significance among the results of each property. This test was used to
investigate the influence of two factors - compaction of powder (layer thickness) and
sintering temperature - on the above properties. Also, this test was able to detect whether
the interaction of both factors was influencing any property.
4.4 Results
4.4.1 Microscopic characterization
Figure 4-2 shows the SEM images which are used to characterize the microstructural
arrangements of particles. The sinter neck measurements obtained from these images by
dividing the sinter neck dimension (X) over the particle diameter (D).
4.4.2 Porosity
The porosity of the structure is significantly influenced by increasing the sintering
temperature (p<0.05) as shown in Figure 4-3. Furthermore, the decrease in the layer
thickness causes a significant reduction in the porosity at the highest sintering
temperature (1400 ºC) and relative reduction in porosity at other sintering temperatures.
Moreover, the interaction of the sintering temperature and the compaction of the powder
decrease the porosity of the structure significantly (p<0.05). In the current study, the
porosity levels in the produced samples are in the range of 17-44%.

49
Figure 4-2 SEM images of various samples sintered at different sintering temperature and printed
using two layers thickness, i.e. 62.5 and 175 represent the extreme edges of powder compaction.

50
Figure 4-3 Influence of two independent variables - layer thickness and sintering temperature - on
the porosity of the structure.
4.4.3 Young’s Modulus
In general, increasing the sintering temperature and/or increasing the compaction of
powder lead to an increase in the Young’s modulus, as depicted in Figure 4-4. The
statistical analysis using two-way ANOVA clarified that the interaction of both factors
(sintering temperature and powder compaction ) is significantly influential in increasing
Young’s modulus of the structure (p<0.05). In addition, the results show that each factor
individually influences Young’s modulus significantly (p<0.05). The samples observed a
Young’s modulus ranging between 0.77-11.46 GPa.
4.4.4 Yield Strength
The average yield strength of the samples increased significantly (p<0.05) when the
sintering temperature is increased, as depicted in Figure 4-5. Increasing the compaction
of powder has a significant influence on the yield strength of the structure at sintering
conditions of 1000, 1200, and 1400 º C; however, a sintering temperature of 800 ºC,

51
which is below the phase transformation temperature of Ti (882 º C)94
, was not
significant. The interaction between the sintering temperature and the compaction of
powder also increases the yield strength of the samples significantly (p<0.05), especially
at higher sintering temperatures (1000, 1200, and 1400 ºC). The observed results of the
yield strength ranged between 27-383 MPa.
Figure 4-4 Variation in Young’s modulus due to variations in layer thickness and sintering
temperature.
4.4.5 Shrinkage
Figure 4-6 and Figure 4-7 show the dimensional variations in the samples following the
sintering process. It is obvious that increasing the sintering temperature lead to significant
shrinkage in both directions (p<0.05), particularly at the highest sintering temperature
(1400 ºC). Similarly, increasing the powder compaction lead to an increase in shrinkage
(p<0.05). In addition, the interaction between the sintering temperature and the
compaction of powder significantly increases the shrinkage in both directions (p<0.05)
according to a two-way ANOVA statistical test.
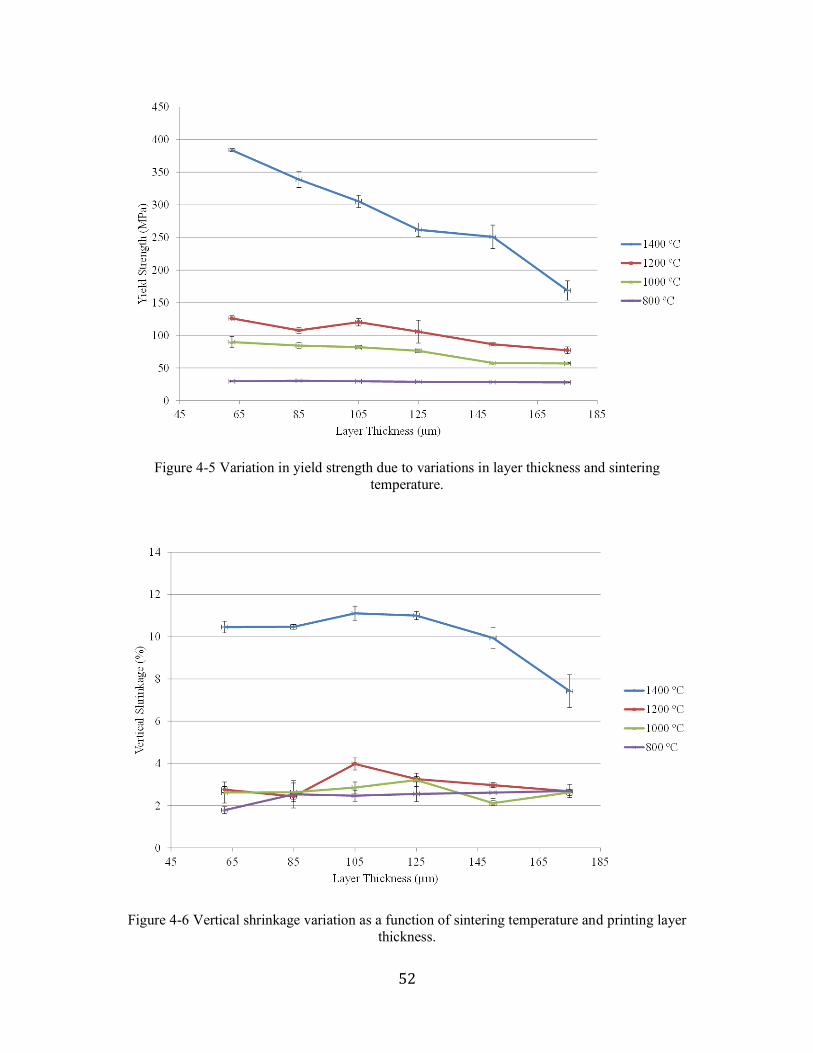
52
Figure 4-5 Variation in yield strength due to variations in layer thickness and sintering
temperature.
Figure 4-6 Vertical shrinkage variation as a function of sintering temperature and printing layer
thickness.

53
Figure 4-7 Horizontal shrinkage variation as a function of sintering temperature and printing layer
thickness.
4.5 Analytical Model of the Microstructural Arrangement of Ti Particles
The aim of this section is to derive a formula that relates the sinter neck between the
particles to the volume fraction (Porosity) of the simplest unit cell. The accumulations of
these unit cells form the entire porous structure. In the model of Gibson and Ashby77
, the
simplest level of the foam structure was assumed to be a cubic array with square cross
sections. However, in the present study, the assumption for the unit cell geometry was
evolved based on the microstructural observation, where four spherical particles of the
powder (Figure 4-8) form the simplest cubic unit cell, and the wall of the unit cell are the
sinter neck between the particles as shown in Figure 4-9. Knowing the volume fraction or
the porosity in the unit cell could be reflected to the larger scale or the entire structure’s
porosity.
In this study, the simplest cubic unit cell includes eight particles and each contributed by
one-eighth of its volume (Figure 4-9). In this model, the volume of this portion (Figure
4-9b) of the particle is calculated and the total volume of the eight portions is used to
obtain the volume fraction of the unit cell. First, a geometrical analysis for the spherical
particle is conducted, where the particle radius is (r) as shown in Figure 4-8. The

54
dimension from the center of the particle to cutting plane of the sinter neck segment is
(r-h), and the dimension of the edge of the unit cell (d) is as shown in Figure 4-9:
𝑑 = 2 × (𝑟 − ℎ) (1)
Thus, the bulk volume of the unit cell (Vb):
𝑉𝑏 = (2 × (𝑟 − ℎ))3 (2)
Figure 4-8 Assumed arrangement of particles at micro-scale
Figure 4-9 a) A cubic unit-cell which represents eight particles each contributed by one-eighth of
its volume, b) One-eighth particle represents the participation of the particle in the unit cell after
subtracting the volume of the sinter neck from three sides.

55
In order to calculate the volume of the material that is included in the unit cell, the
volume of the overlapped area between the sintered particles is subtracted from the total
volume of the material in the unit cell. Thus, the volume of three segments of the
participated particle is subtracted from the volume of the particle itself (Figure 4-9b).
Generally, the volume of a sphere segment according to Harris and Stocker 95
is:
𝑉𝑠𝑒𝑔𝑚𝑒𝑛𝑡 =
1
3𝜋ℎ2(3𝑟 − ℎ) (3)
The interface between any two particles includes a quarter of segment from each particle
shared in the sinter neck. Thus, the volume of subtracted segment (Vsubtracted) from each
particle:
Vsubtracted= 1
4𝑉𝑠𝑒𝑔𝑚𝑒𝑛𝑡 (4)
Given the volume of the unit cell and the spherical shape, the grain volume (Vg) or total
volume of eight particles contributed in the unit cell after subtracting segments of the
sinter neck is:
Vg= 8 ×1
6𝜋𝑟3 −
1
4𝜋ℎ2(3𝑟 − ℎ) (5)
The volume fraction ( 𝑉𝑓) of the unit cell is:
𝑉𝑓 =V𝑏 − V𝑔
V𝑏
=((2 × (𝑟 − ℎ))3) − (8 ×
16 𝜋𝑟3 −
14 𝜋ℎ2(3𝑟 − ℎ))
(2 × (𝑟 − ℎ))3
where
Vg= grain volume
Vb= Bulk volume
(6)
Porosity (P) is:
𝑃 = 𝑉𝑓 = 1 −V𝑔
V𝑏 (7)

56
From Figure 4-8, the sinter neck (X) = 2𝑎, and given the cell geometry and geometrical
relationship between r, h and a, the relation between porosity and sinter neck diameter is:
𝑃 = 1 −
𝜋 (16 𝑟3 −
14 (𝑟 − √𝑟2 − (
𝑥2)
2
)
2
(3𝑟 − (𝑟 − √𝑟2 − (𝑥2)
2
)))
(𝑟 − (𝑟 − √𝑟2 − (𝑥2)
2
))
3
(8)
This equation is used to predict porosity based on the measured values for X. The sinter
neck(X) obtained from the microstructural characterization of the SEM images were used
to calculate the theoretical porosity. The porosity obtained from the model was compared
against the experimental porosity data to validate the effectiveness of the model in
prediction of the porosity of the porous structure using the regression analyses.
4.6 Discussion
The results of this study demonstrate the significant influence of the layer thickness
(compaction of powder) and sintering temperature on the porosity, strength, stiffness, and
dimensional variation of a Ti porous structure made by a powder bed ink-jet based
additive manufacturing technique. The microstructural observation provides an insight
into sinter neck size among the particles and its progressive development due to an
increase in the compaction of powder or sintering temperature as shown in Figure 4-2.
The increase in the compaction of powder increased the contact area/force among the
particles, which positively influences the diffusion process among the particles.
According to Oh et al.50
, the influence of increasing the pressure in decreasing the
porosity is due to the plastic deformation of the particle above the β transition
temperature, which may lead to an increase in the contact area between the particles and
caused a decrease in the porosity. This effect was clearly proven from the porosity results
in Figure 4-3, where at 800 ºC sintering temperature, which is below the β transition
temperature, the variation in the porosity due to alteration of the compaction of powder is
not remarkable. However, with an increase in the sintering temperature the reduction in
the porosity increased significantly with the decrease in the layer thickness. The
correlation between the powder compaction and the sinter neck ratio is shown in Figure

57
4-10. At the thicker layer (175 um), which represents the lowest level of powder
compaction, the correlation between the neck ratio and the sintering temperature is linear;
however, this linearity degrades gradually when the compaction of powder is increased,
as shown by the R2 value for the other layer thickness.
Figure 4-10 The progression of the sinter neck ratio versus sintering temperature
In this study, a model was developed that could predict the porosity of the structure based
on the sinter neck measurements achieved by the microstructural observation of sinter
neck size using SEM (as typically shown in Figure 4-2). To examine the validity of this
model, experimental data is compared with the model output as shown in Figure 4-11. As
seen, an excellent correlation (r2 = 0.92) is observed between the model porosity and the
experimental porosity of the structure. Statistically, this means that the experimental
results are in good agreement with the model results.
Furthermore, the sinter neck has a highly significant impact on yield strength and
stiffness of the structure. Figure 4-12 shows that the increase in the sinter neck ratio is
associated with an increase in the yield strength of the samples. However, the relationship
between the sinter neck and the yield strength at the highest temperature (1400 ºC)

58
exponentially increases by increasing the level of powder compaction. The correlation of
yield strength and Young’s modulus is linear, as shown in Figure 4-13. However, this
linearity does not occur at the lower sintering temperature (800 ºC). This difference can
be attributed to the fragility of the structure at this sintering temperature, since the sinter
neck is not fully developed and the elasticity of the structure is very poor under this
condition.
Figure 4-11 Correlation between the experimental porosity and modeled porosity.
In this study, yield strength was considered to characterize the strength in a comparative
study among the groups. The highlight over the yield strength comes due to the variation
of this property between middle-aged and elderly cortical bone yield strength, while no
significant variation in ultimate strength results was detected96
. According to Figure 4-13,
samples compacted by varied layer thicknesses and sintered at 1200 ºC are comparable to
cortical bone mechanical properties, yield strength, and stiffness, as reported in the
literature 87,97
.

59
Figure 4-12 Sinter neck ratio as a function of the yield strength at different sintering temperatures.
Figure 4-13 Correlation of the yield strength and the Young’s modulus and the governing
equations for each sintering temperature.

60
The influence of the compaction level could also explain the variation in the vertical and
horizontal shrinkage, as depicted in Figure 4-14. For instance, at a higher compaction
level of powder, the horizontal shrinkage is higher than the vertical shrinkage, while at a
lower compaction level the vertical shrinkage is higher than the horizontal shrinkage. Our
previous work 66
and Wiria et al.6 suggest that vertical shrinkage was greater than
horizontal shrinkage due to gravitational effects. Thus, we considered the horizontal
shrinkage as the constant and vertical shrinkage as the variable according to the
conditions of the printing or sintering. Accordingly, the effect of the powder compaction
on the shrinkage isotropy is shown in Figure 4-14. This figure shows that the optimum
layer thickness for maintaining isotropic shrinkage is 105 µm; however, a decrease in the
layer thickness leads to less shrinkage in the vertical direction compared to the horizontal
direction due to a well compaction of powder and no much of voids left as in the other
extreme edge of layer thickness (175 µm). These voids allow for more reliance of the
structure toward shrinking in the vertical direction to fill these voids influenced by the
gravitational effect.
Figure 4-14 Influence of the compaction of powder on the anisotropy of shrinkage in the structure
for samples sintered at 1400 ºC.

61
4.7 Conclusions
Porous Ti samples were additive manufactured using a powder-based ink-jet additive
manufacturing process followed by post sintering. The porosity of samples ranged
between 17–44 %; Young’s modulus ranged between 0.77-11.46 GPa; and yield strength
ranged between 27 - 383 MPa, which was achieved by varying the layer thickness and
sintering temperature. It was observed that the level of compaction of powder and
sintering temperature were two parameters that significantly affect the mechanical and
physical properties of the printed structure. In addition, the regression analysis
demonstrates a good fit between the porosity model and the experimental data.

62
Chapter 5 Mechanical Properties of
Additive Manufactured Porous
Titanium Bio-Structures with
Oriented Macro-Scale Channels
5.1 Introduction:
Recently, with improvements in health systems, global life expectancy has increased,
thereby leading to an increase in the average age of the world population. Joint diseases
and osteoporotic fractures account for 50% of the chronic diseases that affect senior
citizens. Specifically, the parts of the body most susceptible to these diseases are the
spine, hip, and forearm69
.
For several decades, Ti and its alloys have been increasingly utilized for orthopedic
implants, in particular, in repairing large bone defects and in joint replacement owing to
their desirable physical and mechanical properties along with their biocompatibility45
.
However, loosening of the implant or failed bonding between the bone and the implant is
a common issue associated with the fixation of the bone implant which arise over
time5,70
. This problem is caused by several factors, including mechanical and biological
factors. One crucial biological factor is the poor osseointegration between the bone and
the implant5. For instance, inadequate integration between the cementless implant and the
bone allows debris particles to access the interface area between the implant and the bone
which in turn leads to the loosening of the implant5. Therefore, improving the
osseointegration process between the implant and the host bone would be beneficial in

63
avoiding aseptic loosening. An effective way to alleviate this problem is by designing
porous Ti structures that enhance the integration with the bone.
Recently, a few additive manufacturing techniques stated in ASTM F2792 - 12a have
been used in fabricating orthopaedic implants due to the ease of production compared to
conventional techniques 40,50,52–55,76
. Additive manufacturing techniques are capable of
building scaffolds (bone implant) with fine internal and external features. These features
might include macro-scale channels and micro-scale pores, and these channels assist the
osteointegration process between the implant and the host bone98,99
. The influence of
channels' various sizes or shapes on osteointegration has been the subject of two recent
studies98,99
. In these studies additive manufacturing techniques were used to fabricate
macro size channels in the implants. These fabricated implants were biologically tested
while the outcomes proving the importance of the channels in improving the
osteointegration process. However, no studies have addressed the influence of these
channels on the implant’s mechanical and physical properties. This study will address the
effects of open channels with various orientations on the physical and mechanical
properties of additive manufactured porous Ti samples. Porosity, shrinkage, and
mechanical properties of additive manufactured porous structure will be investigated.
5.2 Methodology:
The machining process of Ti using conventional techniques is complex; moreover,
creating macro channels inside of a Ti construct is considered challenging when using
conventional techniques, due to the rigidity and stiffness of Ti. However, with advances
in additive manufacturing techniques, this process has become possible with the
assistance of a powder based 3D printing (3DP) machine, which is capable of controlling
precise features of the internal and external architecture.
In the present study, commercially pure Ti powder (CP Ti, Phelly Materials, Bergenfield,
NJ) that meets the ASTM (F67-06 Grade 2) characteristics was used to build the testing
samples with the 3DP machine. The as-received powder had a spherical shape with a size
range of 45-90 µm. This powder was sifted through a sieve with a mesh size of 200 (US
Standard Sieve Series, Cole-Parmer, USA) and the outcome of this process was powder
particles in the range of 45-75 µm. Polyvinyl alcohol (PVA) powder 86–89% hydrolyzed

64
with low molecular weight (Alfa Aesar, Ward Hill, MA) was used as a binder. A mixture
of Ti and 3 wt% PVA was mixed for 4 hours using a jar-mill (LABMILL 8000 JAR
MILL MACHINE, Paul N. Gardner Company, USA). The production process of samples
conducted in two stages: manufacturing and sintering of green samples.
5.2.1 Manufacturing of Green Samples:
Solid-WorksVR, Ver. 2006 (SolidWorks, Concord, MA) was used to create a 3D model
for rounded bars with dimensions of Ø10.3×H15.45 mm×mm. These rounded bars were
classified into 4 categories according to the design of the experiment. The first category
(a) included control samples, as seen in Figure 5-1a. The second category (b) included
samples with two vertical channels (Ø1000 µm) running all the way through the sample,
as shown in Figure 5-1b. The third category (c) included samples which had two channels
(Ø1000 µm) that intersected at the centre and were inclined at 65.3º (Figure 5-1c). This
angle is equivalent to the principal stress angle corresponding to the geometry of the
control samples obtained by the assistance of COMSOL MULTIPHYSICS 3.5a. ®. The
last category (d) included the channels in category (c) in addition to a horizontal channel,
which also intersected other two channels at the center, as shown in Figure 5-1d.
Figure 5-1 Schematic presentation of Ti samples investigated in the current study and classified
into four categories: a) control, b) 2 vertical channels at 90º angle, c) 2 channels with 65.3º
inclination angle, and d) 2 channels inclined by 65.3º and one horizontal channel
These models were exported to a retrofitted powder-based 3D printing machine
(ZPrinter310-Plus, Z Corporation, Burlington, USA) in stereolithography (STL) format.

65
The printing process depended mainly on the packing of powder layers until the entire
structure was built. This process was concurred by the injection of an aqueous solvent
(Zb58TM
, Z Corporation, Burlington, USA) interfacially between the layers, which
represents the 2D shape of the targeted structure. This process was implemented using
two pistons, one in the feeding powder side and another in the build, as shown in Figure
5-2. The synchronized movements of these pistons along with the roller, which was used
in spreading of powder from the feeding side to the building side, allowed for the packing
the powder during the printing process of the structure as reported in our previous work66
.
In order to dry the printed samples, they were kept in the printer at 38 ºC for 1.5 hours
following printing. They were then pulled up from the machine and cleaned by
compressed air to extract the powder from the channels.
Figure 5-2 A schematic of the powder based 3D printer machine.

66
5.2.2 Sintering:
Green samples produced by the printing process were sintered to obtain the final porous
structure. An MTI®
High Temperature Tube Furnace (GSL—1500X-50, Richmond, CA)
and Argon atmosphere were used for sintering. The sintering process was initiated by
first burning the PVA used for the binding of Ti particles of green samples. The PVA
burning process was implemented through two stages: first at 295 ºC for 3 hours in an air
environment, and second at 500 ºC for 1 hour in an Argon environment. Next, samples
were sintered at 1400ºC for 1 hour. The heating rate was 10ºC/min until reaching 1000ºC,
and then reduced to 5ºC/min until reaching 1400ºC, as shown in Figure 5-3. The samples
were then furnace cooled at the end of sintering. Finally, the sintered samples were
cleaned in an ultrasonic bath filled with distilled water for 5 minutes. Figure 5-4, shows a
sintered and cleaned sample.
Figure 5-3 Heating profile used in the sintering process.
0
200
400
600
800
1000
1200
1400
1600
0 100 200 300 400 500 600
Tem
per
atu
re C
Time (min)
Stage1 of
burning PVA
Stage 2 of
burning PVA
Sintering

67
Figure 5-4 Ti sample with two diagonal channels with dimensions of Ø10 mm X H15mm.
5.2.3 Characterization:
In this study, samples were characterized by two non-destructive test methods; i.e
shrinkage and porosity measurements, and one destructive test method, which was the
compression test.
An electronic Vernier Caliber was used for the shrinkage measurements. As reported in
our previous work66
, this test was implemented by measuring the sample diameter before
(db) and after (da) the sintering process, and height before (hb) and after (ha) the sintering
process three times for each sample and the averages were considered. The percentages
of shrinkage in vertical (%V) and horizontal (%H) directions were calculated from the
following formula:
H% =da−db
db× 100 (1)
V% =ha−hb
hb× 100 (2)
Archimedes’ principle of buoyancy was adopted to measure the porosity of the samples
based on ASTM B 311& C373. In this characterization technique, three readings were
taken before and after boiling the sample in distilled water to remove air bubbles trapped
inside the sample’s pores. These readings were; sample dry weight (Wdry), wet weight
(Wwet), and submerged weight (Wsub). The measured porosity was obtained from the
following formula:
Porosity % =Wwet−Wdry
Wwet−WSub (3)

68
An Instron machine (Instron-4206, USA) was used for compression testing with a cross
head speed of 1mm/min. Sample dimensions were Ø10.3× 15.45 mm2, and 4 samples
from each category were tested. The results were analysed statistically using analysis of
variance (ANOVA) technique to examine the differences between categories’ averages.
Any significant result within the collected data was detected by alpha value (p<0.05), and
if that condition was satisfied then a Bonferroni correction technique was used to
discover the significance within the categories 100
.
5.2.4 Modelling:
Finite Element Analysis (FEA) using COMSOL MULTIPHYSICS 3.5a ® was employed
to investigate the mechanical influence of macro channels on the structure among four
different categories with different channels orientation. The outcome of the printing
process was a porous structure. Due to the technical complication in the modelling of a
porous structure101
, the structure was assumed to be solid and the mechanical data and
equivalent density based on the porosity of the structure were then used as input material
properties in the FEA. A static analysis was implemented by applying an axial load on
the samples to simulate the compression test. The results of the mesh generation process
(as shown in Figure 5-5) were 2888 elements for category a) , 16571 elements for
category b), 17192 elements for category c) and 23141 elements for category d). The Von
Mises results were used to address the influence of macro channels existence in the
structure and the stress concentration among four different categories of samples.
5.2.5 Biological Study:
Human osteosarcoma cell line (Saos-2) were cultured in McCoy’s-5A medium
supplemented with 10% fetal bovine serum (Sigma–Aldrich). Prior to seeding process,
the samples (n=20) were placed in a 24-well tissue culture plate to be equilibrated with
the 1 ml complete culture medium for 15 min. After that, the medium removed from the
plate before the seeding process, and followed by an immediate seeding of 100,000 cells
per sample. Samples were left for 30 min for cell attachment. Then, 1 ml of medium
added to the samples at 37 ºC, and this medium was changed on days 3,7,10 ,and 14.

69
The cell proliferation and osteoblast phenotype were assessed through; the alamarBlue®
Assay,Picogreen® assay DNA content, alkaline phosphatase activity, and
Osteocalcin production .
Figure 5-5 Samples after meshing process : a) control, b) 2 vertical channels with 90º angle, c) 2
channels with 65.3º inclination angle, and d) 2 channels inclined by 65.3º and one horizontal
channel.
5.3 Results
5.3.1 Shrinkage:
The results of the shrinkage analysis in the horizontal and vertical directions are
presented in Figure 5-6. No significant variation in horizontal or vertical shrinkage
among the categories is observed. The percentage of shrinkage is between 3.5 and 4.5%
in both directions.
Figure 5-6 Vertical and horizontal shrinkage of Ti samples after the sintering process.

70
5.3.2 Porosity:
The average porosities of 4 samples from each category are presented in Figure 5-7.
From this figure, there appears to be no significant variation between the first three
categories and the porosities range from 35-35.5%; however, a significant reduction
(p<0.05) in the porosity of category (d) compared to (a) , i.e. ~33.6%, is observed.
Figure 5-7 Porosity of Ti samples fabricated with different channel orientations.
5.3.3 Mechanical Properties:
The mechanical properties of the different samples characterized by the compression test
are listed in Table 5-1. In addition, the table includes the range of the mechanical
properties of cortical bone based on various ages as characterized by the compression
test. The statistical examination test (ANOVA) revealed no significance difference in
terms of the mechanical properties among categories a, b, c, and d with the exception of
the ultimate compressive strength. The ultimate compressive strength results are
presented in Figure 5-8. As shown in this figure, there is a slight improvement in the
strength of the structure due to the creation of vertical or inclined channels in the

71
direction of the principal stress; however, a significant reduction in the strength (p<0.05)
occurred after adding a horizontal channel.
Table 5-1 Mechanical properties obtained from the stress-strain curve for a) control; b) 2 vertical
channels with 90º angle; c) 2 channels with 65.3º inclination angle; and d) 2 channels inclined by
65.3º and one horizontal channel.
Yield Strength
0.2%(σy) MPa
Elastic Modulus ( E )
GPa
Yield Strain(ε)
%
Ultimate Strength
MPa
a 154.9 ± 9.2 3.25 ± 0.35 5.25 ± 0.84 374.27 ± 31.7
b 155.09 ± 3.4 3.37 ± 0.32 4.96 ± 0.54 392.70 ± 23.5
c 148.83 ± 6.2 3.18 ± 0.13 4.91 ± 0.37 414.51 ± 25.2
d 165.61 ± 3.3 2.98 ± 0.16 5.79 ± 0.28 306.61 ± 8.5
Cortical Bone
Based on Age102
50-232.5 4.25-22.5 0.72-1.45 52.7-246.3
Figure 5-8 Compressive strength resulting from testing Ti samples under the uniaxial
compression test: reduction in the strength of the (d) category was significant (p<0.05) when
compared to the (c) category.
5.3.4 Biological Study:
A cell culturing on the samples conducted at The University of Manchester to assess the
cell proliferation within the porous structure as shown in Appendix A. The results of the
channels orientation influence on the cell proliferation available in Appendix B, however,
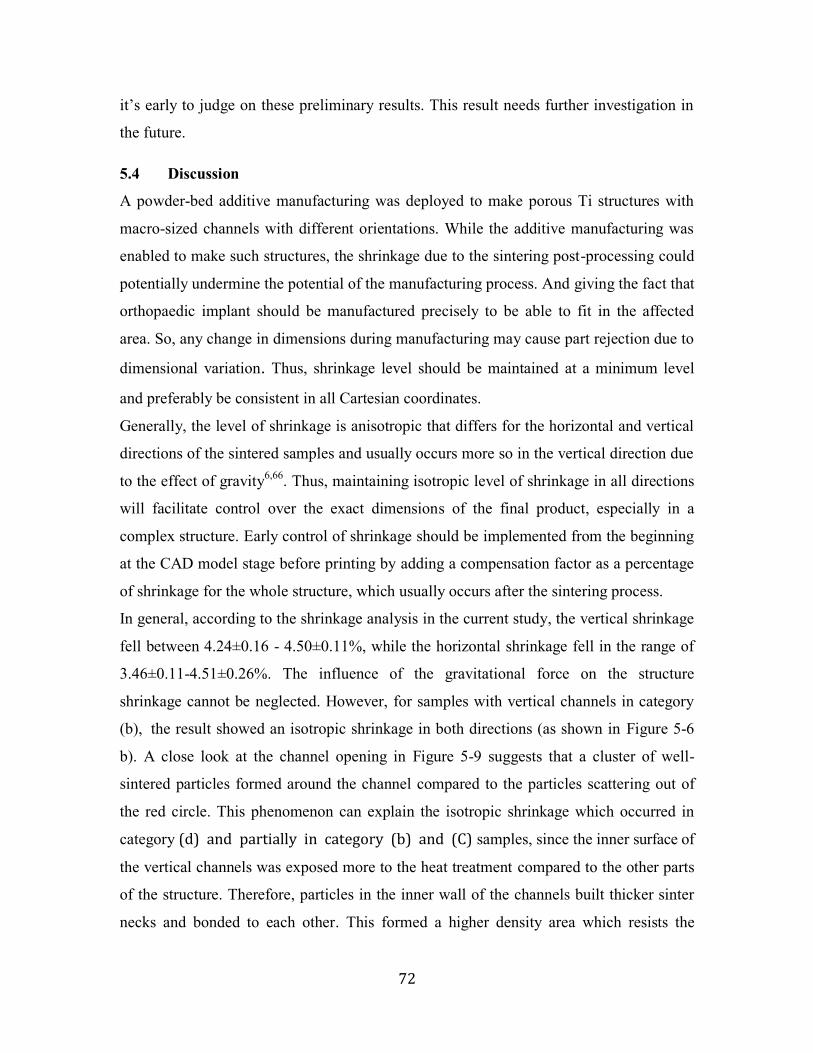
72
it’s early to judge on these preliminary results. This result needs further investigation in
the future.
5.4 Discussion
A powder-bed additive manufacturing was deployed to make porous Ti structures with
macro-sized channels with different orientations. While the additive manufacturing was
enabled to make such structures, the shrinkage due to the sintering post-processing could
potentially undermine the potential of the manufacturing process. And giving the fact that
orthopaedic implant should be manufactured precisely to be able to fit in the affected
area. So, any change in dimensions during manufacturing may cause part rejection due to
dimensional variation. Thus, shrinkage level should be maintained at a minimum level
and preferably be consistent in all Cartesian coordinates.
Generally, the level of shrinkage is anisotropic that differs for the horizontal and vertical
directions of the sintered samples and usually occurs more so in the vertical direction due
to the effect of gravity6,66
. Thus, maintaining isotropic level of shrinkage in all directions
will facilitate control over the exact dimensions of the final product, especially in a
complex structure. Early control of shrinkage should be implemented from the beginning
at the CAD model stage before printing by adding a compensation factor as a percentage
of shrinkage for the whole structure, which usually occurs after the sintering process.
In general, according to the shrinkage analysis in the current study, the vertical shrinkage
fell between 4.24±0.16 - 4.50±0.11%, while the horizontal shrinkage fell in the range of
3.46±0.11-4.51±0.26%. The influence of the gravitational force on the structure
shrinkage cannot be neglected. However, for samples with vertical channels in category
(b), the result showed an isotropic shrinkage in both directions (as shown in Figure 5-6
b). A close look at the channel opening in Figure 5-9 suggests that a cluster of well-
sintered particles formed around the channel compared to the particles scattering out of
the red circle. This phenomenon can explain the isotropic shrinkage which occurred in
category (d) and partially in category (b) and (C) samples, since the inner surface of
the vertical channels was exposed more to the heat treatment compared to the other parts
of the structure. Therefore, particles in the inner wall of the channels built thicker sinter
necks and bonded to each other. This formed a higher density area which resists the

73
gravitational influence and prevented the structure from shrinking vertically during the
cooling period. Also, the reduction in the porosity of the category (d) samples which has
higher surface area exposed to heat treatment supports the hypothesis of the variation of
density within the structure. This variation in sintering performance between the internal
structure and the extremity surfaces is supported by the study of Gagg et al. 103
. Based on
the morphology data in their study, the authors observed that the porosity in the centre of
the cylindrical samples was higher than the porosity at the periphery. This could be
attributed to the thicker sinter neck in the peripheral area, which is more exposed to the
thermal source.
Figure 5-9 SEM images of the channel opening of category (b) samples.
This technique of manufacturing Ti implants proved its superiority in having a low
shrinkage level compared to other costly manufacturing counterparts which have been
used in the manufacturing of porous Ti, such as electron beam melting (EBM), which has
shown a horizontal shrinkage of 6.5% and vertical shrinkage of 7.1%76
. As well, other
techniques such as the indirect additive manufacturing of Ti scaffold by printing a

74
scaffold of wax and filling it with Ti slurry showed horizontal and vertical shrinkages
after sintering at 1300ᵒC equal to 11.9%±1.1% and 9.2%±0.6%, respectively52
.
In the current study, the level of porosity was between 33.64±0.47% and 35.69±0.25%,
as shown in Figure 5-7. The presence of channels in the structure affected the porosity of
category (d) samples significantly, due to an increase in the surface area which was
exposed to heat treatment. In general, the compressive strength inversely scales with the
porosity of a porous material 77
. In contrast, Figure 5-8 shows a different behaviour
associated with the horizontal channel in category (d) structures. Apparently, the
significant reduction in the strength is caused by the existence of the horizontal channels.
Figure 5-10 Deformed Ti samples after the compression test: a) control, b) 2 vertical channels
with 90º angle, c) 2 channels with 65.3º inclination angle, and d) 2 channels inclined by 65.3º and
one horizontal channel.
As seen, the inclusion of vertical or inclined channels in the structure does not negatively
affect the strength of the structure; in the contrary, these channels enhanced the strength
of the structure slightly as shown in Figure 5-8 (b) and (c). However, adding a horizontal
channel to the structure, as in category (d), has significantly reduced the compressive
strength (p<0.05). This observation can be evaluated by the visual examination of the
mechanically tested samples. As Figure 5-10 depicts, the failure mechanism in the
samples of all categories is sheared along a ~65ᵒ plane, which represent the principal
stress angle and the shear stress at this specific plane is the maximum. Also, cracks have
not initiated or passed through vertical or inclined channels as in the first three categories

75
[Figure 5-10 (a), (b), and (c)], while these cracks clearly passed through a horizontal
channel as in Figure 5-10 (d). The FEA results provide insight into the influence of these
channels on the structure. Figure 5-11 (d) shows that the stress concentration is more
highly localized in the horizontal channel due to axial loading, while such concentration
does not appear in the vertical channels [Figure 5-11 (b)] and appear slightly in the
inclined channels [Figure 5-11 (c)]. Although the FEM analysis dealt with the structure as
a bulk metal with a reduced density, the case is completely different during the
experimental characterization. Characterization of a porous structure is not similar to the
bulk material because the mechanical properties of the porous structure conceptually
depends upon the density and the microstructural architecture of the construct 104,105
. As
the variation in the microstructure will highly change the mechanical properties, the same
doctrine could be applied to the macro- structure. Thus, including macro channels in the
structure should influence the mechanical properties of the structure. In the present study,
adding more channels to the structure as in category (d) led to a significant reduction in
the ultimate strength of the structure, as seen in Figure 5-8. This point can be
advantageous as one may tailor the mechanical strength of the implant by adding
channels that can be realized by AM. In this study, as seen from Table 5-1 some of the
obtained mechanical properties fell in the range of the cortical bone and other are very
close to this range. The scope of this study was to assess the influence of channel
orientation on the properties of the structure when the processing parameters were fixed
and not altered. However, several processing parameters could be manipulated to match
the properties of the structure to those of the bone, as conducted in our previous work66
.
Overall, a few number of channels have been used in each category and the results
showed some variations up and down. These variations expected to be scaled up or down
if the number of channels increased in a certain category.

76
Figure 5-11 Von Mises stress distribution within the compressed samples: a) control, b) 2 vertical
channels with 90º angle, c) 2 channels with 65.3º inclination angle, and d) 2 channels inclined by
65.3º and one horizontal channel.
5.5 Conclusions
The influence of macro channels with different orientations upon the mechanical and
physical properties of a porous Ti structure fabricated by additive manufacturing
technique was investigated. The following conclusions can be drawn from this study:
The results of the experimental work have proved the possibility of customizing the
mechanical and physical properties of the porous structure through the additive
manufacturing of bio-structures with macro-scale channels at different orientations.
The results of the compression test indicated that the ultimate strength of the additively
manufactured structure can be tailored and reduced by adding horizontal channels.
An increase in the number of channels in the additively manufactured structures led to
a reduction in porosity due to an increase in the surface area which is exposed to heat
treatment during the sintering process.
The investigation suggested that shrinkage in both horizontal and vertical directions of
the sample can be isotropic by adding horizontal channels to the structure.

77
Chapter 6 A Novel Additive
Manufacturing-based Technique for
Developing Bio-structures with
Conformal and Encapsulated
Channels
6.1. Introduction
Most fractured bones heal without any need to surgery. Yet treatment of a fracture can be
challenging if the gap between the fractured parts of the bone exceeds 2 mm 106
, as this
gap will hinder revascularization and cell proliferation 107
. Therefore, utilizing a
customized implant to precisly mimic the anatomical shape as well as geometrical
features of the cuts required for surgery can be considered a viable solution to this issue.
The structure of an appropriate bone implant should mimic the structure of real bone.
Cortical bone is composed of hydroxyapatite and type-I collagen, and its porosity is in
the range of 3-12% 22,108
. The structure of this type of bone includes the osteon system,
which consists of a network of channels: longitudinal channels (Haversian canals) linked
by transverse channels (Volkmanns canals). The main function of these channels is to
serve as conduits for blood vessels, which are crucial for nutrition, growing bone, and
repairing fractured sites 109
.
According to Frosch et al. and Fukuda et al. 98,99
, it is essentail for Ti bone implants to
have such channels to improve the osseointegration process. In these studies, longitudinal
channels ranging in size from 300-1000 µm were drilled, as in 98
, or channels were

78
fabricated ranging in size from 500-1000 µm using one of the additive manufacturing
(AM) techniques, i.e., Selective Laser Melting (SLM), as introduced in reference 99
. In
the studies conducted in 98,99
no encapsulated channels were created due to difficulties in
creating macro-sized encapsulated and conformal channels in the printed structure as a
result of the depowdering issue 110
.
The fabrication of a macro-sized channel using the powder bed AM technique is complex
because of the difficulty associated with depowdering, i.e., removing loose powder from
the fine details of the structure 58,68,111,112
. Macro-channels exemplify the fine details
inside the 3D printed structure. So, while depowdering of straight macro channels is
challenging, it is not a practical process for the case of conformal and encapsulated
macro-channels. Thus, depowdering after printing is a significant issue, and the inability
to accomplish this task is considered to be a major impediment in the use of powder bed
additive manufacturing techniques.
There have been many attempts to overcome the depowdering issue in 3D printed green
parts. Some of these attempts have focused on the design of the targeted model to
overcome this problem, as dicussed in reference 111
, according to which the scaffold was
designed as a cage with large windows to facilitate the depowdering process. Other
attempts have included changing some of the manufacturing parameters. For instance, the
orientation of the samples in the powder bed and its influence on the depowdering
process were investigated by Farzadi et al. 88
. In that study, cylindrical scaffolds were
printed in the X (horizontally in the powder spreading direction), Y (horizontally
perpendicular to the powder spreading direction), and Z direction (vertical). The
depowdering of samples that were printed horizontally in the X direction was somewhat
easier to accomplish than the depowdering of samples that were printed in the Y
direction. For both the X and Y printing directions, the samples were easier to depowder
in terms of the cleaning time required compared to those printed in the Z direction.
Since the primary goal of this study was the creation of macro-sized channels in order to
mimic the structure of real cortical bone, depowdering of these horizontal and vertical
channels (which has not been addressed in the literature to date) was a major concern. In
this study, the new approach of combining three manufacturing techniques, i.e. additive
manufacturing of laminated/partial parts and assembling/stacking the laminated parts,
79
followed by a propoer sintering protocol was used in an attempt to overcome the
depowdering obstacle of these channels. This new manufacturing approach was assessed
by a comparative characterization of mechanical and physical properties of the fabricated
samples (i.e. shear and compressive strengths, and porosity and dimensional shrinkage).
6.2. Methodology
6.2.1 Materials and Fabrication
The CAD model of the assembled additive manufactured (AAM) part was first developed
using SolidWorksVR, Ver. 2013 (SolidWorks, Concord, MA, USA). After developing
the model, which included a vertical channel (ϕ 1000 μm) and a horizontal channel (ϕ
500 μm), the model was sliced with a cut that went all the way through the channels, as
shown in Figure 6-1. Then, two slide guiders were added to the part at the plane of the
cut. The appropriate clearance was considered in the design of these guiders to allow
them to fit in the holes part of the counterpart. Then, the individual models were printed
separately using a powder-bed 3D Printer (ZPrinter310-Plus, Z Corporation, Burlington,
VT, USA) with a layer thickness of 85 µm packed with a mixture of powder. This
mixture was composed of commercially pure Ti powder (CP Ti Grade 1, Advanced
Powders and Coatings, Inc., Boisbriand, QC, Canada) that had spherically-shaped
particles with diameters less than 38 µm and 3 wt% of low molecular weight polyvinyl
alcohol (PVA) powder that was 86–89% hydrolyzed (Alfa Aesar, Ward Hill, MA, USA).
The PVA was used to bind the spherical Ti particles together after the jetting of the liquid
binder (ZbTM
58 , 3D Systems, Rock Hill, SC, USA) from the print head. Once the printed
parts dried, the green parts were depowdered and cleaned using compressed air and a soft
brush.
The next processing step is the sintering of the green parts after the assembly. This
process was conducted in an MTI®
High Temperature Tube Furnace (GSL—1500X-50,
Richmond, CA, USA) under a high-purity argon atmosphere. The sintering process
consists of two stages. First, the binding agent, PVA, is burned by heating in air for three
hours at 295°C, followed by purging argon gas and heating for one hour at 500° C.
Second, the Ti is sintered by heating the structure at the rate of 10°C/min to 1000°C,

80
followed by heating at 5°C/min to 1400°C. This temperature is maintained for three
hours, followed by furnace cooling. The heating protocol for sintering is shown in Figure
6-2.
Figure 6-1 Steps of building a structure using the AAM concept, starting with the CAD model
and ending with the final sintered structure.
Figure 6-2 Heating protocol used in the sintering process: two stages for burning PVA and one
stage for sintering Ti particles.

81
6.2.2 Characterization
To validate the AAM concept, samples (B) fabricated by this technique were
characterized for their mechanical and physical properties and compared with control
samples (A), which were printed in one printing cycle as shown in Figure 6-3. In
addition, the characterization included a comparison between two categories of samples
with horizontal channels (ϕ 750µm). The samples in the first category were printed
entirely during one printing job as in category (C), while the second category (D)
included the samples printed using the AAM technique. The sample shape characteristics
are shown in Figure 6-3. A sample with a straight horizontal channel was chosen to make
the depowdering process easier, particularly in category C, since, as mentioned
previously, it is not possible to depowder small-sized conformal channels that are printed
using a commercially-available 3D printer. Thus, this choice provides the basis for a
valid comparison between the two categories.
Figure 6-3 Schematic representation of the shear test samples: A) control sample printed entirely
in one cycle of printing; B) AAM sample; C) control sample printed in one printing cycle with a
horizontal channel; D) AAM sample with a horizontal channel.
6.2.2.1 Shear Test
First, the samples were characterized through a shear testing method to quantify the shear
strength of the adhesive bonding in the assembled structure. A specific fixture (Figure
6-4), similar to the fixture used by Bondioli et al., Salazar et al., and Cocr et al. 113–115
,

82
was fabricated to conduct the shear test. The fixture consisted of two pieces: a piston and
a cylinder composed of hardened tools steel . One side of the both piston and cylinder
was flattened, and a plate was installed in the section that was cut from the cylinder to
ensure that a straight shear cut was applied on the interfacial portion between the two
parts in categories (B) and (D) and on the control sample categories. The test sample was
placed in the 4-mm hole that had been drilled in both the plate and the piston. The entire
set, i.e., the sample and the fixture, was subjected to a compression load in a uniaxial
Instron machine (Instron-4206, MA, USA) with a crosshead speed of 0.5 mm/min. This
compression loading resulted in the application of a shear load at the interface layer
between the two assembled parts.
Figure 6-4 Shear test apparatus: A) fixture comprised of a fixed part (cylinder) attached to the
plate holds the sample and a moving part (piston), B) schematic of the loading force on the
sample that generates a shear force at the interfacial plane.
6.2.2.2 Compression Test
Compression test was conducted on the AAM and control samples. The dimensions of
the samples that were used for this test were Ø7.49 mm× 11.24 mm with a height to
diameter ratio of 1.5 according to ASTM E9-09. Categories (C) and (D) had a 750-µm
channel placed horizontally in the middle of the samples, as shown in Figure 6-5. A
uniaxial testing machine (Instron-4206, MA, USA) and a crosshead speed of 1 mm min-1
were used to compress (crush) the samples.

83
Figure 6-5 Schematic representation of the shear test samples: a) control sample printed entirely
in one cycle of printing; B) AAM sample; C) control sample printed in one printing cycle with a
horizontal channel; D) AAM sample with a horizontal channel.
6.2.2.3 Porosity Measurement
ASTM B311 and C373 require that porosity measurements are conducted using samples
with weight larger than 1g. Therefore, the compression test samples, which had weights
>1g, were used. Porosity of the structure was measured based on the Archimedes
principle, using the Universal Specific Gravity Kit (Sartorius®, Bradford, MA, USA) and
an electronic balance (APX-203, Denver Instruments,NY, USA) with a precision of
0.001g. The same procedure was used as the one previously reported by Basalah et al. 66
.
6.2.2.4 Shrinkage Measurements
The dimensional precision of the manufactured bone implant is very important. In this
study, an electronic Vernier caliper (Mitutoyo Corp., Kawasaki, Japan) with a precision
of 0.01mm was used to measure the variation in the dimensions of the rounded bar
samples (Ø7.49 mm × 11.24 mm), and the number of samples (n) was 6.
6.2.2.5 Visual Examination
A scanning electron microscope (SEM) (JEOL JSM-6460) was used to visually examine
the adhesive bonded surface of the assembled parts before and after sintering and to
observe the effect of sintering on the micro-structure of the fine particles.

84
6.2.2.6 Statistical Analysis
The analysis of variance (ANOVA) technique was used with the data that were obtained
to determine whether there were significant differences between the groups. This
significant difference was detected by alpha values of p < 0.05.
6.3. Results
6.3.1 Adhesive Bonding Shear Strength
Figure 6-6 shows the adhesive bonding strength for the two assembled parts produced by
the AAM concept and the control samples. The diagram of Figure 6-6 compares the
average shear strengths of (n = 9) samples in categories A, B, C and D. The results show
a significant reduction in shear strength when the AAM process is used (category B),
with a reduction in shear strength of approximately 25%. Similarly, when the horizontal
channel is added to the structure, as in categories C and D, the shear result shows a
reduction of approximately 32% in strength when applying the new concept, as in
category D.
Figure 6-6 Results of shear strength tests of Ti samples in four categories: A) control sample
without a channel; B) AAM-fabricated sample without a channel; C) control sample with a
channel; D) AAM-fabricated sample with a channel.

85
6.3.2 Compressive Strength
Figure 6-7 shows the compressive strength of the AAM-made structures. The figure
presents the average compressive strengths of (n = 6) samples from each category. The
figure indicates that there are no significant differences among the results of the four
categories. However, the variations in the margin of error in categories B and D, in which
AAM is used, are greater than those in categories A and C, the control samples.
Figure 6-7 Compressive strength results of Ti samples of four categories: A) control sample
without a channel; B) AAM-fabricated sample without a channel; C) control sample with a
channel; D) AAM-fabricated sample with a channel.
6.3.3 Porosity
Figure 6-8 compares the results of porosity measurements for A and C samples with
those of B and D samples (n = 6). The results show that there is a significant increase (p
< 0.05) in the porosity of category B compared to the porosity of category A of
approximately 2.2%. Also, there is a slight increase in the porosity of category D
compared to the porosity of category C. The results of the porosity measurements in all
cases varied between 12 and 16%.
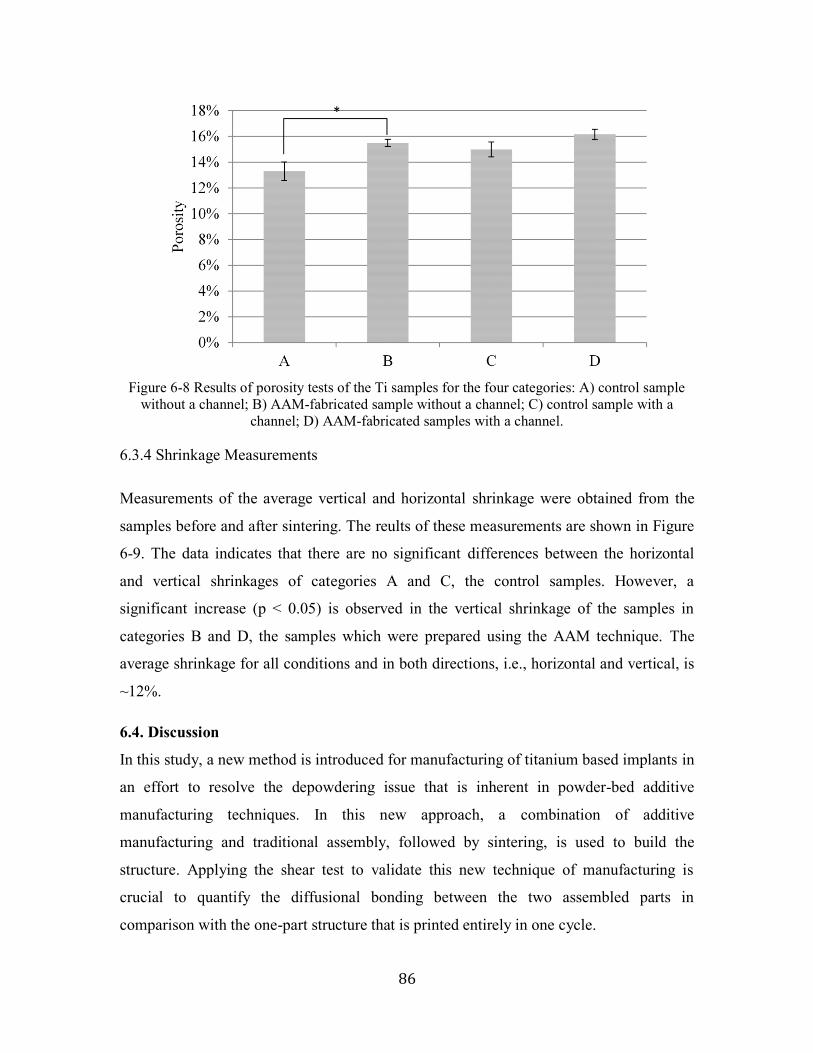
86
Figure 6-8 Results of porosity tests of the Ti samples for the four categories: A) control sample
without a channel; B) AAM-fabricated sample without a channel; C) control sample with a
channel; D) AAM-fabricated samples with a channel.
6.3.4 Shrinkage Measurements
Measurements of the average vertical and horizontal shrinkage were obtained from the
samples before and after sintering. The reults of these measurements are shown in Figure
6-9. The data indicates that there are no significant differences between the horizontal
and vertical shrinkages of categories A and C, the control samples. However, a
significant increase (p < 0.05) is observed in the vertical shrinkage of the samples in
categories B and D, the samples which were prepared using the AAM technique. The
average shrinkage for all conditions and in both directions, i.e., horizontal and vertical, is
~12%.
6.4. Discussion
In this study, a new method is introduced for manufacturing of titanium based implants in
an effort to resolve the depowdering issue that is inherent in powder-bed additive
manufacturing techniques. In this new approach, a combination of additive
manufacturing and traditional assembly, followed by sintering, is used to build the
structure. Applying the shear test to validate this new technique of manufacturing is
crucial to quantify the diffusional bonding between the two assembled parts in
comparison with the one-part structure that is printed entirely in one cycle.

87
Figure 6-9 Vertical and horizontal shrinkages of the Ti samples in the four categories: A) control
sample without a channel; B) AAM-fabricated sample without a channel; C) control sample with
a channel; D) AAM-fabricated samples with a channel.
A close look at the attachment interface through the SEM images (Figure 6-10 and Figure
6-11) provides insight into the reason for the variation in the shear and shrinkage results
among the different categories. Figure 6-10 shows that there are gaps at the interface of
the two assembled parts in the case of samples (B) and (D). The gaps attributes to more
shrinkage occurs in the vertical direction than in the horizontal direction, as Figure 6-9
suggests. A diffusional bonding occurs among the adjacent particles from each side of the
attached parts. However, full bonding between the two parts does not consistently occur.
The lack of such full bonding can (at least partially) explain the reduction in the shear
strength of the AAM structures. It should, however, be noted that this reduction in
strength is considered to be beneficial in the case of an orthopedic implant 66
because the
reduced shear strength can help to avoid a mismatch in the strength between the bone and
the implant. The minimum shear strength observed in this study is 200 MPa, and the
cortical bone shear strength, according to Turner et al. 116, is ~51.6 MPa. However, other
factors, such as sintering conditions and the size of the particles, could affect the
reduction of the shear strength of the structure to provide a better match with the strength

88
of cortical bone. These factors mainly reduce the density of the structure, which leads to a
reduction in the strength, as reported in the previous work 66
.
In addition, the SEM image in Figure 6-12 shows that sintering is extensive, relative to
the cases presented in reference 66
, where only sinter necks were formed among Ti
particles and the spherical shape of the particles was preserved. Comparison of the two
cases indicates that the very small size of the particles used in the current work (i.e.
diamters less than 38 µm, compared to 45-75 µm range) results in significant sintering
progress. This is an important consideration because the diameter of the particles is an
essential variable in all of the mass transport equations that address neck growth during
sintering 50,117
. The level of sintering is a crucial factor in determining the level of
porosity. In the present study, the porosity that is observed is in the same range as that of
cortical bone, i.e. 3-12%, which is approximately 50% of the level observed in the
previous work 66
(i.e. 31%). Comparing the porosity of the control to the AAM samples
indicates that the increase in the porosity of the AAM samples is influenced by several
factors including the availability of the guiders inside the structure, the voids surrounding
the guiders, and the precision of the human hand in applying the desired amount of
pressure, when both parts are stacked together.
From the manufacturing point of view, it is preferable for the shrinkage caused by
sintering to be minimal and isotropic. In this study, the shrinkage in all sintered samples
is relatively moderate due to the used fine particles. Furthermore, the inconsistant
shrinkage occuring in the AAM samples could be reduced or prevented by choosing
different compensation factors for each direction in the CAD model. Conversely, the
compressive strength is not affected by stacking the parts, since the force that is applied
axially is perpendicular to the plane of the stacked layers.
As evident in this study, this new method of manufacturing is feasible with a slight
sacrifice in terms of the shear strength of the structure. According to Butscher et al. 15
, the
precision of the powder-bed 3DP machine is 350-500 µm. However, in the screening
phase of this study, the minimum thickness of a sheet of Ti that could be printed and
handled was 250 µm, and as many laminated sheets of this size as required could be
assembled to form a complex-shaped structure with conformal channels. The use of
AAM may establish a new era of economical manufacturing, in which extremely

89
complex structures composed of many layers including complex channel networks could
be fabricated.
Figure 6-10 SEM images of samples before (green parts) and after sintering of: A) control sample
without a channel; B) AAM-fabricated sample without a channel.

90
Figure 6-11 SEM images of samples before (green parts) and after sintering of: C) control sample
with a channel; D) AAM-fabricated sample with a channel.

91
Figure 6-12 Shape of Ti particles before and after the sintering process.
6.5. Summary
In this study, we developed a new technique for manufacturing titanium bone implants.
The fabricated parts that made by stacking the additive manufactured segments of a part
followed by sintering was validated using various characterization techniques. The
experimental results indicated that this manufacturing technique has the potential to
produce a structure with macro-sized channels with a reduction in shear strength of 24-
30% compared to control samples. This technique did not affect compressive strength.
However, there was a relatively low increase in porosity of approximately 1.17-2.2% in
the AAM samples, with the total porosity falling in the range of 12-16%, which is
comparable to the porosity of cortical bone. Also, a slight increase in the vertical
shrinkage of ~ 0.4-0.5% was observed compared to horizontal shrinkage due to the use of
this new technique.
92
Chapter 7 Conclusions and Future
Work
7.1 Conclusions
The following conclusions can be drawn from this thesis:
- A powder based ink-jet printer was effectively used to print a porous Ti construct
with a highly complex external and internal geometry.
- The minimum amount of PVA in the powder mixture was determined to be no
less than 3%. Increasing the PVA content could play a role of the space-holder
and increase the porosity of the structure.
- It was found that the porosity contributes significantly to the strength of the
structure and can be controlled through different processing parameters such as
binder contents, the particle’s shape, and the powder’s level of compaction.
- The compressive strength of the porous Ti structure varied according to the
processing parameters. Some categories of powder failed at a very high value ~
1000 MPa which could be attributed to the microdamage among the sinter necks
of the particles that occurred at the large plastic region (yield plateau). Thus, the
compressive strength is not an effective measure compared to yield strength in
characterizing and comparing the strength of the porous structure to the bone
properties. Overall, the compressive strength ranged from 56-1000 MPa and the
yield strength ranged from 27-383 MPa in the produced samples.
- Characterizing the stiffness of the structure was achieved by obtaining the
Young’s modulus value. The achieved Young’s modulus was comparable to the
bone modulus and ranged from 0.77-11.46 GPa.

93
- The level of shrinkage that was achieved using the powder based ink-jet printer
was lower than what has been achieved by using additive manufacturing
counterparts and using the spherical powder, particularly, with a limited particles
range contributed significantly in lowering the level of shrinkage. The achieved
levels of shrinkage ranged from 1.5-12%.
- The isotropic shrinkage in the structure is very important. Thus, it was found that
manipulating the architecture of the structure by adding horizontal channels
assisted in producing isotropic shrinkage. The level of compaction also helps in
this regard.
- The assembled additive manufacturing (AAM) technique was developed. This
novel method has high potential to create a complex network of conformal
encapsulated macro-sized channels in the structure.
- The developed model which predicts the porosity based on the sinter neck was
validated by the experimental data. The results indicate a good match between the
experimental result and the model.
7.2 Recommendations and Future Work
7.2.1 Manufacturing
-In our commercial printer there is a limitation in manipulating two crucial printing
parameters, i.e. the linear speed of the gantry system and the rotational speed of the
counter rotating roller which are responsible about the process of spreading powder.
These parameters could potentially influence the printing quality.
- The assembled additive manufacturing (AAM) concept opens the possibility for
developing a highly complex structure with a sophisticated conformal channel by
assembling a large number of layers.
- The main purpose of using the PVA during the printing process is to form the green
samples. The existence of the PVA in the printed samples increases the heterogeneity and
the porosity of the structure. Thus, it would be beneficial to dispense the PVA during the
printing process. This could be achieved by increasing the binding agent in the injected
liquid binder. Any modification to this binder will cause the thermal actuator of the

94
printhead to overheat. Therefore, using a different printhead such as a micro piezoelectric
printhead which is principally works based on a vibrator actuator instead of the thermal
actuator will solve this problem.
7.2.2 Material Processing
- It was found that sintering was effective at 1400º C. Sintering at 1300 º C has not been a
part of my thesis. Future work should extensively investigate the range of effective
sintering starting from 1300 º C. This study was limited by the furnace not heating above
1400 º C to preserve the heating elements of the furnace.
- It seems that a discoloring on the top surface of the samples which is mainly comprised
of carbon was most likely left by one of two sources: the residue of the debinding process
or the contents of the flowing Argon gas. According to German 118
, Ti could react with
the carbon and form TiC. This discolouring could be alleviated by installing a vent at the
inlet of the tube furnace to properly suction the residue of the debinding process.
Alternatively, placing the samples in a crucible covered by a lid would avoid direct
contact between the flowing gas and the samples.
7.2.3 Modelling
- In this study, a model was developed to predict the porosity in the structure based on the
sinter necks progression among the particles. This model could be linked to the sinter
neck growth equations which include several material processing parameters related to
particle size, sintering temperature, and sintering duration.
- Starting from the cubical unit cell proposed in this study, an analytical model could be
developed to address the force which is applied to the unit cell and then reflected onto the
entire structure to predict the strength and the stiffness of the structure accordingly.
7.2.4 Biological Study
-Further investigation is required to assess cells behavior within the microstructure of the
porous Ti samples. Also the influence of channels number and orientation on the cell
proliferation requires a deep investigation.

95
- The mineralization need to be measured to assess the formation of the hydroxyapatite
in the culture.

96
Appendices

97
Appendix A
Cell culturing conducted on some samples of chapter 5 at The University of Manchester
by Prof. Julie Gough and Louise Carney, two groups of samples; the first group cultured
for one day, and the second group for three days. The SEM images (Fig. A-1) and (Fig.
A-2) shows the osteoblast spreaded and attached to the porous structure. Also, the cells
are bridging and filling the gap of the pores.
Figure A-1: Samples were cultured with an osteoblast for 1day.
Figure A-2: Samples were cultured with an osteoblast for 3 days.

98
Appendix B
In vitro cell culturing results of four different categories of samples used in chapter 5
with different channels orientations conducted by Prof. Julie Gough and Louise Carney.
Figure B-1 DNA Content (picogreen assay) shows the influence of the channel orientation on
cell density, there is a steady increase in the cell numbers with the time.
Figure B-2 Raw alamar blue data shows the metabolic activity at days 3, 7 and 14 of samples
from four different categories.

99
Figure B-3 Channels orientation influence on Alkaline Phosphate activity at days 3, 7 and 14.
Figure B-4 Channels orientaion Influence on osteocalcin production at days 3, 7 and 14.

100
Appendix D
Matlab code for the develped model in Chapter 4 which correlate between the porosity and the
sinter neck among the particles:
prompt = 'What is the mean diameter of the particles? '; D = input(prompt);% The user input the mean particle
diameter prompt1= 'What is the sinter neck ratio'; XD=input(prompt1);%The user input the sinter neck ratio X=XD*D; r=D/2; a=X/2; h=r-sqrt((r^2)-(a^2)); V=(((pi*((1/6)*r^3)))); f=((1/4)*pi*(h^2)*((3*r)-h)); vf=V-f; vff=vf; OT=(r-h)^3; vfff=vff/OT; Porosity=(1-vfff)*100

101
Appendix E

102
Appendix F
ELSEVIER LICENSE
TERMS AND CONDITIONS
Jul 22, 2015
This is a License Agreement between Ahmad Basalah ("You") and Elsevier ("Elsevier") provided by Copyright Clearance Center ("CCC"). The license consists of your order details, the terms and conditions provided by Elsevier, and the payment terms and conditions.
All payments must be made in full to CCC. For payment instructions, please see
information listed at the bottom of this form.
Supplier Elsevier Limited
The Boulevard,Langford Lane Kidlington,Oxford,OX5 1GB,UK
Registered Company Number 1982084
Customer name Ahmad Basalah
Customer address 206-350 Columbia Street West
Waterloo, ON N2L 6P6
License number 3638311376381
License date May 29, 2015
Licensed content publisher Elsevier
Licensed content publication Elsevier Books
Licensed content title 3D Bioprinting and Nanotechnology in Tissue Engineering and Regenerative Medicine
Licensed content author None
Licensed content date 2015
Number of pages 33
Start Page 231
End Page 263
Type of Use reuse in a thesis/dissertation
Intended publisher of new work other
Portion full chapter
Format both print and electronic
Are you the author of this Elsevier chapter?
Yes
How many pages did you author in this Elsevier book?
32
Will you be translating? No
Title of your thesis/dissertation Additive Manufacturing of Porous Titanium Structures for Use in
Orthopaedic Implants
Expected completion date Jun 2015
Estimated size (number of pages)
Elsevier VAT number GB 494 6272 12

103
References:
1. Bombardier, C, Hawker, G, & Mosher D. the Impact of Arthritis in Canada :
Today and Over the Next 30 Years. Arthritis Alliance of Canada 2011. Available
at:
http://www.arthritisalliance.ca/images/PDF/eng/Initiatives/20111022_2200_impac
t_of_arthritis.pdf.
2. Public Health Agency of Canada. Life with Arthritis in Canada: A Personal and
Public Health Challenge.; 2010. Available at: http://www.phac-aspc.gc.ca/cd-
mc/arthritis-arthrite/lwaic-vaaac-10/pdf/arthritis-2010-eng.pdf.
3. Macdonald K V, Sanmartin C, Langlois K, Marshall DA. Symptom onset,
diagnosis and management of osteoarthritis. Stat. Canada 2014;25(9):10-17.
4. Canadian Institute for Health Information. Hip and Knee Replacements in Canada:
Canadian Joint Replacement Registry 2014 Annual Report. 2014;(June).
5. Sundfeldt M, Carlsson L V, Johansson CB, Thomsen P, Gretzer C. Aseptic
loosening, not only a question of wear: a review of different theories. Acta Orthop.
2006;77(2):177-197. doi:10.1080/17453670610045902.
6. Wiria FE, Maleksaeedi S, He Z. Manufacturing and characterization of porous
titanium components. Prog. Cryst. Growth Charact. Mater. 2014.
doi:10.1016/j.pcrysgrow.2014.09.001.
7. Hutchinson MR. The Burden of Musculoskeletal Diseases in the United States:
Prevalance, Societal and Economic Cost, 1st Edition. J. Am. Coll. Surg.
2009;208(1):e5-e6. doi:10.1016/j.jamcollsurg.2008.06.146.
8. Canadian Institute for Health Information. Hip and Knee Replacements in Canada :
Canadian Joint Replacement Registry 2013 Annual Report. 2013:1-94.
9. Gikas PD, Bayliss L, Bentley G, Briggs TWR. An overview of autologous
chondrocyte implantation. J. Bone Joint Surg. Br. 2009;91(8):997-1006.
doi:10.1302/0301-620X.91B8.21824.
10. Bartel DL, Davy DT, Keaveny TM. Orthopaedic Biomechanics: Mechanics and
Design in Musculoskeletal Systems. 2006.
11. Koh JL, Wirsing K, Lautenschlager E, Zhang L-O. The effect of graft height
mismatch on contact pressure following osteochondral grafting: a biomechanical
study. Am. J. Sports Med. 2004;32(2):317-320. doi:10.1177/0363546503261730.

104
12. Vasiliadis HS, Wasiak J, Salanti G. Autologous chondrocyte implantation for the
treatment of cartilage lesions of the knee: A systematic review of randomized
studies. Knee Surgery, Sport. Traumatol. Arthrosc. 2010;18(12):1645-1655.
doi:10.1007/s00167-010-1050-3.
13. Hutmacher DW. Scaffolds in tissue engineering bone and cartilage. Biomaterials
2000;21(24):2529-2543. doi:10.1016/S0142-9612(00)00121-6.
14. Bohner M, Loosli Y, Baroud G, Lacroix D. Commentary: Deciphering the link
between architecture and biological response of a bone graft substitute. Acta
Biomater. 2011;7(2):478-84. doi:10.1016/j.actbio.2010.08.008.
15. Butscher A, Bohner M, Hofmann S, Gauckler L, Müller R. Structural and material
approaches to bone tissue engineering in powder-based three-dimensional printing.
Acta Biomater. 2011;7(3):907-20. doi:10.1016/j.actbio.2010.09.039.
16. Porter JR, Ruckh TT, Popat KC. Bone tissue engineering: A review in bone
biomimetics and drug delivery strategies. Biotechnol. Prog. 2009;25(6):1539-
1560. doi:10.1002/btpr.246.
17. Szpalski C, Wetterau M, Barr J, Warren SM. Bone Tissue Engineering: Current
Strategies and Techniques—Part I: Scaffolds. Tissue Eng. Part B Rev.
2012;18(4):246-257. doi:10.1089/ten.teb.2011.0427.
18. Bose S, Tarafder S. Calcium phosphate ceramic systems in growth factor and drug
delivery for bone tissue engineering: a review. Acta Biomater. 2012;8(4):1401-21.
doi:10.1016/j.actbio.2011.11.017.
19. Pilliar R., Filiaggi M., Wells J., Grynpas M., Kandel R. Porous calcium
polyphosphate scaffolds for bone substitute applications — in vitro
characterization. Biomaterials 2001;22(9):963-972. doi:10.1016/S0142-
9612(00)00261-1.
20. Leong KF, Cheah CM, Chua CK. Solid freeform fabrication of three-dimensional
scaffolds for engineering replacement tissues and organs. Biomaterials
2003;24(13):2363-2378. doi:10.1016/S0142-9612(03)00030-9.
21. Yang S, Leong KF, Du Z, Chua CK. The design of scaffolds for use in tissue
engineering. Part I. Traditional factors. Tissue Eng. 2001;7(6):679-689.
doi:10.1089/107632701753337645.
22. Karageorgiou V, Kaplan D. Porosity of 3D biomaterial scaffolds and osteogenesis.
Biomaterials 2005;26(27):5474-91. doi:10.1016/j.biomaterials.2005.02.002.
23. Frost HM. Bone’s mechanostat: a 2003 update. Anat. Rec. A. Discov. Mol. Cell.
Evol. Biol. 2003;275(2):1081-1101. doi:10.1002/ar.a.10119.

105
24. Mehrali M, Shirazi FS, Mehrali M, Metselaar HSC, Kadri NA Bin, Osman NAA.
Dental implants from functionally graded materials. J. Biomed. Mater. Res. - Part
A 2013;101(10):3046-3057. doi:10.1002/jbm.a.34588.
25. Chang BS, Lee CK, Hong KS, et al. Osteoconduction at porous hydroxyapatite
with various pore configurations. Biomaterials 2000;21(12):1291-8. Available at:
http://www.ncbi.nlm.nih.gov/pubmed/23732684.
26. Kujala S, Ryhänen J, Danilov A, Tuukkanen J. Effect of porosity on the
osteointegration and bone ingrowth of a weight-bearing nickel–titanium bone graft
substitute. Biomaterials 2003;24(25):4691-4697. doi:10.1016/S0142-
9612(03)00359-4.
27. Lin CY, Kikuchi N, Hollister SJ. A novel method for biomaterial scaffold internal
architecture design to match bone elastic properties with desired porosity. J.
Biomech. 2004;37(5):623-36. doi:10.1016/j.jbiomech.2003.09.029.
28. Cai S, Xi J. A control approach for pore size distribution in the bone scaffold
based on the hexahedral mesh refinement. Comput. Des. 2008;40(10-11):1040-
1050. doi:10.1016/j.cad.2008.09.004.
29. Sanz-Herrera J a, García-Aznar JM, Doblaré M. A mathematical approach to bone
tissue engineering. Philos. Trans. A. Math. Phys. Eng. Sci. 2009;367(1895):2055-
2078. doi:10.1098/rsta.2009.0055.
30. Hollister SJ. Porous scaffold design for tissue engineering. Nat. Mater.
2005;4(7):518-24. doi:10.1038/nmat1421.
31. Yarlagadda PKD V, Chandrasekharan M, Shyan JYM. Recent advances and
current developments in tissue scaffolding. Biomed. Mater. Eng. 2005;15(3):159-
77. Available at: http://www.ncbi.nlm.nih.gov/pubmed/15911997.
32. Stevens B, Yang Y, Mohandas A, Stucker B, Nguyen KT. A review of materials,
fabrication methods, and strategies used to enhance bone regeneration in
engineered bone tissues. J. Biomed. Mater. Res. B. Appl. Biomater.
2008;85(2):573-82. doi:10.1002/jbm.b.30962.
33. Navarro M, Michiardi A, Castaño O, Planell JA. Biomaterials in orthopaedics. J.
R. Soc. Interface 2008;5(27):1137-58. doi:10.1098/rsif.2008.0151.
34. Long M, Rack HJ. Titanium alloys in total joint replacement--a materials science
perspective. Biomaterials 1998;19(18):1621-39. Available at:
http://www.ncbi.nlm.nih.gov/pubmed/9839998.

106
35. Dabrowski B, Swieszkowski W, Godlinski D, Kurzydlowski KJ. Highly porous
titanium scaffolds for orthopaedic applications. J. Biomed. Mater. Res. B. Appl.
Biomater. 2010;95(1):53-61. doi:10.1002/jbm.b.31682.
36. Navarro M, Michiardi a, Castaño O, Planell J a. Biomaterials in orthopaedics. J. R.
Soc. Interface 2008;5(27):1137-58. doi:10.1098/rsif.2008.0151.
37. Krishna BV, Bose S, Bandyopadhyay A. Low stiffness porous Ti structures for
load-bearing implants. Acta Biomater. 2007;3(6):997-1006.
doi:10.1016/j.actbio.2007.03.008.
38. Reclaru L, Eschler P-Y, Lerf R, Blatter A. Electrochemical corrosion and metal
ion release from Co-Cr-Mo prosthesis with titanium plasma spray coating.
Biomaterials 2005;26(23):4747-56. doi:10.1016/j.biomaterials.2005.01.004.
39. Billi F, Campbell P. Nanotoxicology of metal wear particles in total joint
arthroplasty: a review of current concepts. J. Appl. Biomater. Biomech. (Vol 8
issue 1 (January-April 2010)):1-6. Available at: http://www.jab-
fm.com/article/nanotoxicology-of-metal-wear-particles-in-total-joint--arthroplasty-
-a-review-of-current-concepts-art006572. Accessed May 15, 2014.
40. Shishkovsky I V., Volova LT, Kuznetsov M V., Morozov YG, Parkin IP. Porous
biocompatible implants and tissue scaffolds synthesized by selective laser sintering
from Ti and NiTi. J. Mater. Chem. 2008;18(12):1309. doi:10.1039/b715313a.
41. Michiardi A, Aparicio C, Planell J a, Gil FJ. New oxidation treatment of NiTi
shape memory alloys to obtain Ni-free surfaces and to improve biocompatibility. J.
Biomed. Mater. Res. B. Appl. Biomater. 2006;77(2):249-56.
doi:10.1002/jbm.b.30441.
42. Wataha JC, Dell NLO, Singh BB, Ghazi M, Whitford GM, Lockwood PE.
Relating Nickel-Induced Tissue Inflammation to Nickel Release in vivo.
2001:537-544. doi:10.1002/jbm.xxxx.
43. Staiger MP, Pietak AM, Huadmai J, Dias G. Magnesium and its alloys as
orthopedic biomaterials: a review. Biomaterials 2006;27(9):1728-34.
doi:10.1016/j.biomaterials.2005.10.003.
44. Alvarez K, Nakajima H. Metallic Scaffolds for Bone Regeneration. Materials
(Basel). 2009;2(3):790-832. doi:10.3390/ma2030790.
45. Frosch K-H, Stürmer KM. Metallic Biomaterials in Skeletal Repair. Eur. J.
Trauma 2006;32(2):149-159. doi:10.1007/s00068-006-6041-1.

107
46. Ryan G, Pandit A, Apatsidis DP. Fabrication methods of porous metals for use in
orthopaedic applications. Biomaterials 2006;27(13):2651-70.
doi:10.1016/j.biomaterials.2005.12.002.
47. Okazaki Y. A New Ti–15Zr–4Nb–4Ta alloy for medical applications. Curr. Opin.
Solid State Mater. Sci. 2001;5(1):45-53. doi:10.1016/S1359-0286(00)00025-5.
48. Matassi F, Botti A, Sirleo L, Carulli C, Innocenti M. Porous metal for orthopedics
implants. Clin. Cases Miner. Bone Metab. 2013;10(2):111-115. Available at:
http://www.pubmedcentral.nih.gov/articlerender.fcgi?artid=3796997&tool=pmcen
trez&rendertype=abstract. Accessed May 5, 2014.
49. Balla VK, Bodhak S, Bose S, Bandyopadhyay A. Porous tantalum structures for
bone implants: fabrication, mechanical and in vitro biological properties. Acta
Biomater. 2010;6(8):3349-59. doi:10.1016/j.actbio.2010.01.046.
50. Oh I-H, Nomura N, Masahashi N, Hanada S. Mechanical properties of porous
titanium compacts prepared by powder sintering. Scr. Mater. 2003;49(12):1197-
1202. doi:10.1016/j.scriptamat.2003.08.018.
51. Weber JN, White EW. Carbon-metal graded composites for permanent osseous
attachment of non-porous metals. Mater. Res. Bull. 1972;7(9):1005-1016.
doi:10.1016/0025-5408(72)90092-X.
52. Ryan GE, Pandit AS, Apatsidis DP. Porous titanium scaffolds fabricated using a
rapid prototyping and powder metallurgy technique. Biomaterials
2008;29(27):3625-35. doi:10.1016/j.biomaterials.2008.05.032.
53. Murr LE, Esquivel EV, Quinones S a., et al. Microstructures and mechanical
properties of electron beam-rapid manufactured Ti–6Al–4V biomedical prototypes
compared to wrought Ti–6Al–4V. Mater. Charact. 2009;60(2):96-105.
doi:10.1016/j.matchar.2008.07.006.
54. Mullen L, Stamp RC, Brooks WK, Jones E, Sutcliffe CJ. Selective Laser Melting:
a regular unit cell approach for the manufacture of porous, titanium, bone in-
growth constructs, suitable for orthopedic applications. J. Biomed. Mater. Res. B.
Appl. Biomater. 2009;89(2):325-34. doi:10.1002/jbm.b.31219.
55. Dinda GP, Song L, Mazumder J. Fabrication of Ti-6Al-4V Scaffolds by Direct
Metal Deposition. Metall. Mater. Trans. A 2008;39(12):2914-2922.
doi:10.1007/s11661-008-9634-y.
56. Campanelli SL, Contuzzi N, Angelastro A, Ludovico AD. Capabilities and
Performances of the Selective Laser Melting Process. 1994.

108
57. Wong K V., Hernandez A. A Review of Additive Manufacturing. ISRN Mech.
Eng. 2012;2012:1-10. doi:10.5402/2012/208760.
58. Woesz A. Rapid Prototyping to Produce POROUS SCAFFOLDS WITH
CONTROLLED ARCHITECTURE for Possible use in Bone Tissue Engineering.
In: Bidanda B, Bártolo P, eds. Virtual Prototyping & Bio Manufacturing in
Medical Applications. Springer US; 2008:171-206. doi:10.1007/978-0-387-68831-
2_9.
59. Van Noort R. The future of dental devices is digital. Dent. Mater. 2012;28(1):3-12.
doi:10.1016/j.dental.2011.10.014.
60. Wen CE, Yamada Y, Shimojima K, Chino Y, Hosokawa H, Mabuchi M. Novel
titanium foam for bone tissue engineering. 2002;(July):22-25.
61. Pupo Y, Delgado J, Serenó L, Ciurana J. Scanning Space Analysis in Selective
Laser Melting for CoCrMo Powder. Procedia Eng. 2013;63:370-378.
doi:10.1016/j.proeng.2013.08.228.
62. Murr LE, Gaytan SM, Ramirez DA, et al. Metal Fabrication by Additive
Manufacturing Using Laser and Electron Beam Melting Technologies. J. Mater.
Sci. Technol. 2012;28(1):1-14. doi:10.1016/S1005-0302(12)60016-4.
63. Lin JG, Li YC, Wong CS, Hodgson PD, Wen CE. Degradation of the strength of
porous titanium after alkali and heat treatment. J. Alloys Compd. 2009;485(1-
2):316-319. doi:10.1016/j.jallcom.2009.05.048.
64. Li JP, Habibovic P, van den Doel M, et al. Bone ingrowth in porous titanium
implants produced by 3D fiber deposition. Biomaterials 2007;28(18):2810-20.
doi:10.1016/j.biomaterials.2007.02.020.
65. Li JP, de Wijn JR, van Blitterswijk C a, de Groot K. Porous Ti6Al4V scaffolds
directly fabricated by 3D fibre deposition technique: effect of nozzle diameter. J.
Mater. Sci. Mater. Med. 2005;16(12):1159-63. doi:10.1007/s10856-005-4723-6.
66. Basalah A, Shanjani Y, Esmaeili S, Toyserkani E. Characterizations of additive
manufactured porous titanium implants. J. Biomed. Mater. Res. B. Appl. Biomater.
2012;100(7):1970-9. doi:10.1002/jbm.b.32764.
67. Curodeau a, Sachs E, Caldarise S. Design and fabrication of cast orthopedic
implants with freeform surface textures from 3-D printed ceramic shell. J. Biomed.
Mater. Res. 2000;53(5):525-35. Available at:
http://www.ncbi.nlm.nih.gov/pubmed/10984701.

109
68. Hutmacher DW, Sittinger M, Risbud M V. Scaffold-based tissue engineering:
rationale for computer-aided design and solid free-form fabrication systems.
Trends Biotechnol. 2004;22(7):354-62. doi:10.1016/j.tibtech.2004.05.005.
69. WOOLF AD. The Bone and Joint Decade 2000-2010. Ann. Rheum. Dis.
2000;59(2):81-82. doi:10.1136/ard.59.2.81.
70. Sargeant A, Goswami T. Hip implants: Paper V. Physiological effects. Mater. Des.
2006;27(4):287-307. doi:10.1016/j.matdes.2004.10.028.
71. Bram BM, Stiller C, Buchkremer HP, Stöver D, Baur H, Ag D. High-Porosity
Titanium , Stainless Steel , and Superalloy Parts. 2000;(4):196-199.
72. Miyao R, Omori M, Watari F, et al. Fabrication of functionally graded implants by
Spark Plasma Sintering and their properties. Funtai Oyobi Fummatsu
Yakin/Journal Japan Soc. Powder Powder Metall. 2000;47(11):1239-1242.
Available at: http://www.scopus.com/inward/record.url?eid=2-s2.0-
0034314790&partnerID=tZOtx3y1.
73. Li JP, Li SH, de Groot K, Layrolle P. Preparation and Characterization of Porous
Titanium. In: Key Engineering Materials.Vol 218-220.; 2001:51-54. Available at:
http://www.scientific.net/KEM.218-220.51. Accessed June 29, 2014.
74. Wiria FE, Shyan JYM, Lim PN, Wen FGC, Yeo JF, Cao T. Printing of Titanium
implant prototype. Mater. Des. 2010;31:S101-S105.
doi:10.1016/j.matdes.2009.12.050.
75. Wiria FE, Chua CK, Leong KF, Quah ZY, Chandrasekaran M, Lee MW. Improved
biocomposite development of poly(vinyl alcohol) and hydroxyapatite for tissue
engineering scaffold fabrication using selective laser sintering. J. Mater. Sci.
Mater. Med. 2008;19(3):989-96. doi:10.1007/s10856-007-3176-5.
76. Li X, Wang C, Zhang W, Li Y. Fabrication and characterization of porous
Ti6Al4V parts for biomedical applications using electron beam melting process.
Mater. Lett. 2009;63(3-4):403-405. doi:10.1016/j.matlet.2008.10.065.
77. Gibson LJ, Ashby MF. The Mechanics of Three-Dimensional Cellular Materials.
Proc. R. Soc. A Math. Phys. Eng. Sci. 1982;382(1782):43-59.
doi:10.1098/rspa.1982.0088.
78. Erk K a., Dunand DC, Shull KR. Titanium with controllable pore fractions by
thermoreversible gelcasting of TiH2. Acta Mater. 2008;56(18):5147-5157.
doi:10.1016/j.actamat.2008.06.035.

110
79. Wen CE, Yamada Y, Shimojima K, Chino Y, Asahina T, Mabuchi M. Processing
and mechanical properties of autogenous titanium implant materials. J. Mater. Sci.
Mater. Med. 2002;13(4):397-401. doi:10.1023/A:1014344819558.
80. Zou C, Zhang E, Li M, Zeng S. Preparation, microstructure and mechanical
properties of porous titanium sintered by Ti fibres. J. Mater. Sci. Mater. Med.
2008;19(1):401-405. doi:10.1007/s10856-006-0103-0.
81. Gibson L, Ashby M. Cellular Solids Structure and Properties. 2nd Editio.
Cambridge University Press Available at:
http://www.cambridge.org/us/academic/subjects/engineering/materials-
science/cellular-solids-structure-and-properties-2nd-edition. Accessed April 15,
2015.
82. DR Carter, WC Hayes. The compressive behavior of bone as a two-phase porous
structure. J. Bone Joint Surg. Am. 1977;59(7):954-962. doi:10.1007/978-1-4471-
5451-8_116.
83. Sumner DR, Turner TM, Igloria R, Urban RM, Galante JO. Functional adaptation
and ingrowth of bone vary as a function of hip implant stiffness. J. Biomech.
1998;31(10):909-917. doi:10.1016/S0021-9290(98)00096-7.
84. Wan Z, Dorr LD, Woodsome T, Ranawat A, Song M. Effect of stem stiffness and
bone stiffness on bone remodeling in cemented total hip replacement. J.
Arthroplasty 1999;14(2):149-158. doi:10.1016/S0883-5403(99)90118-3.
85. Novitskaya E, Chen P-Y, Lee S, et al. Anisotropy in the compressive mechanical
properties of bovine cortical bone and the mineral and protein constituents. Acta
Biomater. 2011;7(8):3170-7. doi:10.1016/j.actbio.2011.04.025.
86. Pohler OE. Unalloyed titanium for implants in bone surgery. Injury 2000;31 Suppl
4:7-13. Available at: http://www.ncbi.nlm.nih.gov/pubmed/11270082.
87. Güden M, Celik E, Hizal A, Altindiş M, Cetiner S. Effects of compaction pressure
and particle shape on the porosity and compression mechanical properties of
sintered Ti6Al4V powder compacts for hard tissue implantation. J. Biomed. Mater.
Res. B. Appl. Biomater. 2007;85(2):547-55. doi:10.1002/jbm.b.30978.
88. Farzadi A, Solati-Hashjin M, Asadi-Eydivand M, Abu Osman NA. Effect of Layer
Thickness and Printing Orientation on Mechanical Properties and Dimensional
Accuracy of 3D Printed Porous Samples for Bone Tissue Engineering.
Claudepierre T, ed. PLoS One 2014;9(9):e108252.
doi:10.1371/journal.pone.0108252.

111
89. Vaezi M, Chua CK. Effects of layer thickness and binder saturation level
parameters on 3D printing process. Int. J. Adv. Manuf. Technol. 2010;53(1-4):275-
284. doi:10.1007/s00170-010-2821-1.
90. ZOU C, LIU Y, YANG X, WANG H, WEI Z. Effect of sintering neck on
compressive mechanical properties of porous titanium. Trans. Nonferrous Met.
Soc. China 2012;22:s485-s490. doi:10.1016/S1003-6326(12)61750-6.
91. ASTM B 311-08. Standard Test Method for Density of Powder Metallurgy ( PM )
Materials Containing Less Than Two Percent Porosity 1. 2013:1-5.
doi:10.1520/B0311-08.2.
92. Astm C373-88. Standard Test Method for Water Absorption, Bulk Density,
Apparent Porosity, and Apparent Specific Gravity of Fired Whiteware Products.
Astm C373-88 1999;88(Reapproved 2006):1-2. doi:10.1520/C0373-88R06.much.
93. ASTM Standard E9-09. Standard Test Methods of Compression Testing of
Metallic Materials at Room Temperature. Annu. B. ASTM Stand. 2012;3.01:92-
100. doi:10.1520/E0009-09.2.
94. Panigrahi BB, Godkhindi MM, Das K, Mukunda PG, Ramakrishnan P. Sintering
kinetics of micrometric titanium powder. Mater. Sci. Eng. A 2005;396(1-2):255-
262. doi:10.1016/j.msea.2005.01.016.
95. Harris JW, Stocker H. Handbook of mathematics and computational science.
Comput. Math. with Appl. 1999;37:133. doi:10.1016/S0898-1221(99)90385-1.
96. Leng H, Dong XN, Wang X. Progressive post-yield behavior of human cortical
bone in compression for middle-aged and elderly groups. J. Biomech.
2009;42(4):491-7. doi:10.1016/j.jbiomech.2008.11.016.
97. Reilly DT, Burstein AH. The Mechanical Properties of Cortical Bone Review
Article The Mechanical Properties of Cortical Bone *. 1974;65-A(5):1001-1022.
98. Frosch K-H, Barvencik F, Viereck V, et al. Growth behavior, matrix production,
and gene expression of human osteoblasts in defined cylindrical titanium channels.
J. Biomed. Mater. Res. A 2004;68(2):325-34. doi:10.1002/jbm.a.20010.
99. Fukuda a, Takemoto M, Saito T, et al. Osteoinduction of porous Ti implants with a
channel structure fabricated by selective laser melting. Acta Biomater.
2011;7(5):2327-36. doi:10.1016/j.actbio.2011.01.037.
100. Holm S. A Simple Sequentially Rejective Multiple Test Procedure. Scand. J. Stat.
1979;6(2):65-70. Available at:
http://www.ime.usp.br/~abe/lista/pdf4R8xPVzCnX.pdf.

112
101. Öchsner A, Lamprecht K. On the uniaxial compression behavior of regular shaped
cellular metals. Mech. Res. Commun. 2003;30(6):573-579. doi:10.1016/S0093-
6413(03)00058-2.
102. Öhman C, Baleani M, Pani C, et al. Compressive behaviour of child and adult
cortical bone. Bone 2011;49(4):769-76. doi:10.1016/j.bone.2011.06.035.
103. Gagg G, Ghassemieh E, Wiria FE. Effects of sintering temperature on morphology
and mechanical characteristics of 3D printed porous titanium used as dental
implant. Mater. Sci. Eng. C. Mater. Biol. Appl. 2013;33(7):3858-64.
doi:10.1016/j.msec.2013.05.021.
104. Lakes R. Materials with structural hierarchy. Nature 1993;361(6412):511-515.
Available at: http://dx.doi.org/10.1038/361511a0.
105. Currey JD. Bone strength: what are we trying to measure? Calcif. Tissue Int.
2001;68(4):205-10. doi:10.1007/s002230020040.
106. Gaston MS, Simpson a HRW. Inhibition of fracture healing. J. Bone Joint Surg.
Br. 2007;89(12):1553-60. doi:10.1302/0301-620X.89B12.19671.
107. Claes L, Eckert-Hübner K, Augat P. The fracture gap size influences the local
vascularization and tissue differentiation in callus healing. Langenbecks. Arch.
Surg. 2003;388(5):316-22. doi:10.1007/s00423-003-0396-0.
108. Brydone a S, Meek D, Maclaine S. Bone grafting, orthopaedic biomaterials, and
the clinical need for bone engineering. Proc. Inst. Mech. Eng. Part H J. Eng. Med.
2010;224(12):1329-1343. doi:10.1243/09544119JEIM770.
109. Qin L, Mak AT, Cheng CW, Hung LK, Chan KM. Histomorphological study on
pattern of fluid movement in cortical bone in goats. Anat. Rec. 1999;255(4):380-7.
doi:10.1002/(SICI)1097-0185(19990801)255:4<380::AID-AR3>3.0.CO;2-0.
110. Vlasea M., Basalah A., Azhari A., Kandel R. TE. Additive manufacturing for bone
load bearing applications. In: Lijie Grace Zhang, John Fisher KL, ed. 3D
Bioprinting and Nanotechnology in Tissue Engineering and Regenerative
Medicine. 1st Editio. Elsevier Inc.; 2015. Available at:
http://store.elsevier.com/3D-Bioprinting-and-Nanotechnology-in-Tissue-
Engineering-and-Regenerative-Medicine/Lijie-Grace-Zhang/isbn-
9780128005477/. Accessed January 25, 2015.
111. Butscher A, Bohner M, Doebelin N, Hofmann S, Müller R. New depowdering-
friendly designs for three-dimensional printing of calcium phosphate bone
substitutes. Acta Biomater. 2013;9(11):9149-58. doi:10.1016/j.actbio.2013.07.019.
113
112. Vaezi M, Seitz H, Yang S. A review on 3D micro-additive manufacturing
technologies. Int. J. Adv. Manuf. Technol. 2012;67(5-8):1721-1754.
doi:10.1007/s00170-012-4605-2.
113. Bondioli IR, Bottino MA. Evaluation of shear bond strength at the interface of two
porcelains and pure titanium injected into the casting mold at three different
temperatures. J. Prosthet. Dent. 2004;91(6):541-547.
doi:10.1016/j.prosdent.2004.03.033.
114. Salazar M, Pereira S. Shear bond strength between metal alloy and a ceramic
system, submitted to different thermocycling immersion times. Acta Odontol. …
2006;20(2):97-102. Available at: http://europepmc.org/abstract/MED/18590258.
Accessed January 26, 2015.
115. Cocr BDE, Cerâmica EUMA. Evaluation of the shear bond strength of the union
between two CoCr-alloys and a dental ceramic. J. Appl. Oral Sci. 2012;12(4):280-
284.
116. Turner CH, Wang T, Burr DB. Shear Strength and Fatigue Properties of Human
Cortical Bone Determined from Pure Shear Tests. Calcif. Tissue Int.
2001;69(6):373-378. doi:10.1007/s00223-001-1006-1.
117. German RM. Sintering Theory and Practice. illustrate. New York : Wiley, ©1996.;
1996. Available at: http://adsabs.harvard.edu/abs/1996stp..book.....G. Accessed
January 9, 2015.
118. German R. Progress in Titanium Metal Powder Injection Molding. Materials
(Basel). 2013;6(8):3641-3662. doi:10.3390/ma6083641.