Additional SAM Paper 1 · 7/28/1973 · Version 0.1 8035/1 SPECIMEN ASSESSMENT MATERIAL: SET 2 GCSE...
30
Version 0.1 8035/1 SPECIMEN ASSESSMENT MATERIAL: SET 2 GCSE GEOGRAPHY Paper 1 Living with the physical environment Specimen Time allowed: 1 hour 30 minutes Materials For this paper you must have: a pencil a ruler. Instructions Use black ink or black ball-point pen. Fill in the boxes at the bottom of this page. Answer all questions in Section A and Section B. Answer two questions in Section C. You must answer the questions in the spaces provided. Do not write outside the box around each page or on blank pages. Do all rough work in this book. Cross through any work you do not want to be marked. Information The marks for questions are shown in brackets. The total number of marks available for this paper is 88. Spelling, punctuation, grammar and specialist terminology will be assessed in Question 01.8. Advice For the multiple-choice questions, completely fill in the circle alongside the appropriate answer(s). If you want to change your answer you must cross out your original answer as shown. If you wish to return to an answer previously crossed out, ring the answer you now wish to select as shown. Please write clearly, in block capitals, to allow character computer recognition. Centre number Candidate number Surname Forename(s) Candidate signature CORRECT METHOD WRONG METHODS
Transcript of Additional SAM Paper 1 · 7/28/1973 · Version 0.1 8035/1 SPECIMEN ASSESSMENT MATERIAL: SET 2 GCSE...
Version 0.1 8035/1
SPECIMEN ASSESSMENT
MATERIAL: SET 2
GCSE
GEOGRAPHY
Paper 1 Living with the physical environment
Specimen Time allowed: 1 hour 30 minutes Materials For this paper you must have: a pencil a ruler.
Instructions Use black ink or black ball-point pen. Fill in the boxes at the bottom of this page. Answer all questions in Section A and Section B. Answer two questions in Section C. You must answer the questions in the spaces provided. Do not write outside the box around
each page or on blank pages. Do all rough work in this book. Cross through any work you do not want to be marked.
Information The marks for questions are shown in brackets. The total number of marks available for this paper is 88. Spelling, punctuation, grammar and specialist terminology will be assessed in Question 01.8.
Advice For the multiple-choice questions, completely fill in the circle alongside the appropriate answer(s).
If you want to change your answer you must cross out your original answer as shown.
If you wish to return to an answer previously crossed out, ring the answer you now wish to select as shown.
Please write clearly, in block capitals, to allow character computer recognition. Centre number Candidate number Surname Forename(s) Candidate signature
CORRECT METHOD WRONG METHODS
2
Version 0.1
Section A The challenge of natural hazards
Answer all questions in this section.
Question 1 The challenge of natural hazards
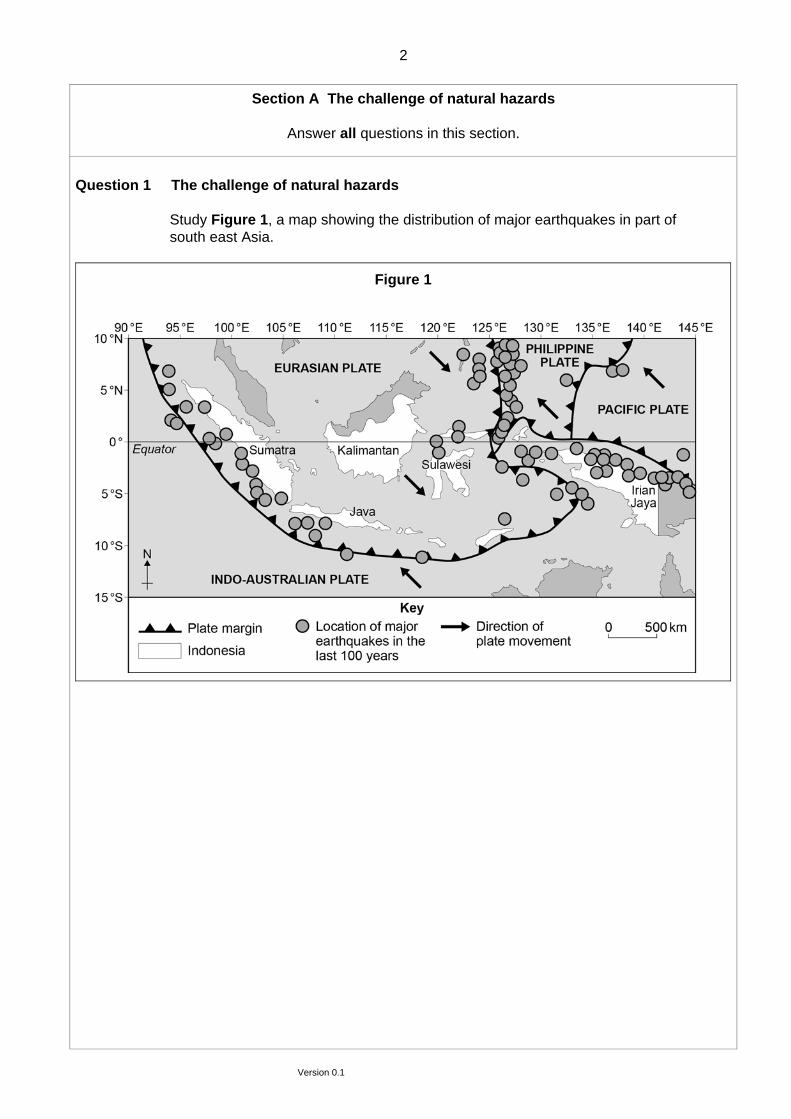
Study Figure 1, a map showing the distribution of major earthquakes in part of south east Asia.
Figure 1
3
Version 0.1 Turn over
Describe the distribution of major earthquakes shown in Figure 1.
[2 marks]
Outline one reason for the distribution of earthquakes in Figure 1.
[2 marks]
Question 1 continues on the next page
0 1 . 1
0 1 . 2
4
Version 0.1
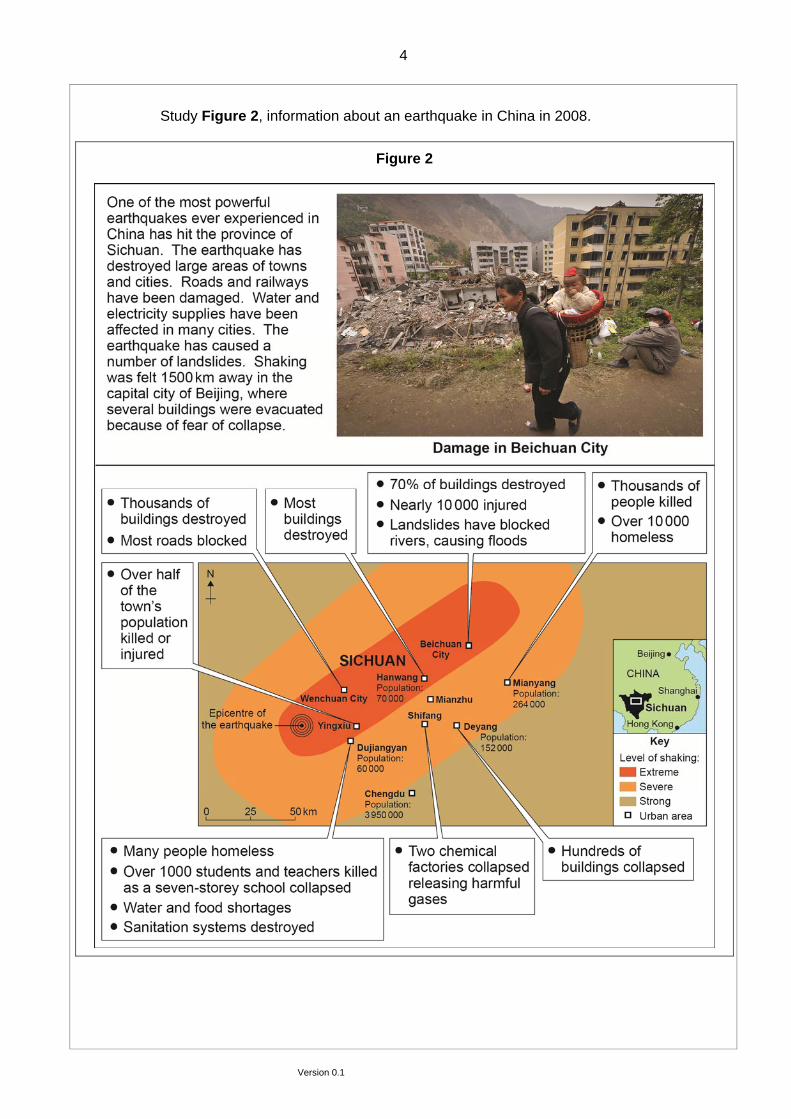
Study Figure 2, information about an earthquake in China in 2008.
Figure 2
5
Version 0.1 Turn over
Using Figure 2, which two of the following natural hazards were caused by the earthquake in China? Shade two circles only. A Wildfires B Landslides C Volcanoes D Tsunamis E Floods
[2 marks]
Using Figure 2 and your own knowledge, suggest why the effects of a tectonic hazard vary between areas of contrasting levels of wealth.
[6 marks]
Question 1 continues on the next page
0 1 . 3
0 1 . 4
6
Version 0.1
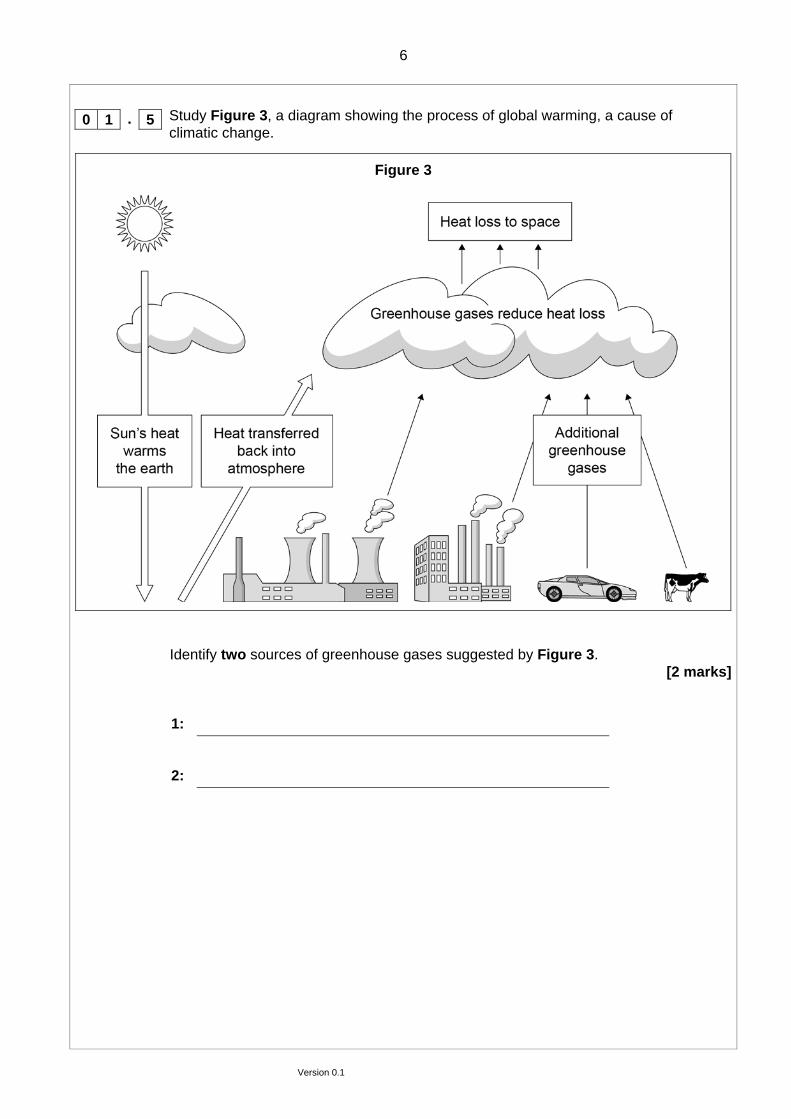
Study Figure 3, a diagram showing the process of global warming, a cause of
climatic change.
Figure 3
Identify two sources of greenhouse gases suggested by Figure 3. [2 marks]
1: 2:
0 1 . 5
7
Version 0.1 Turn over
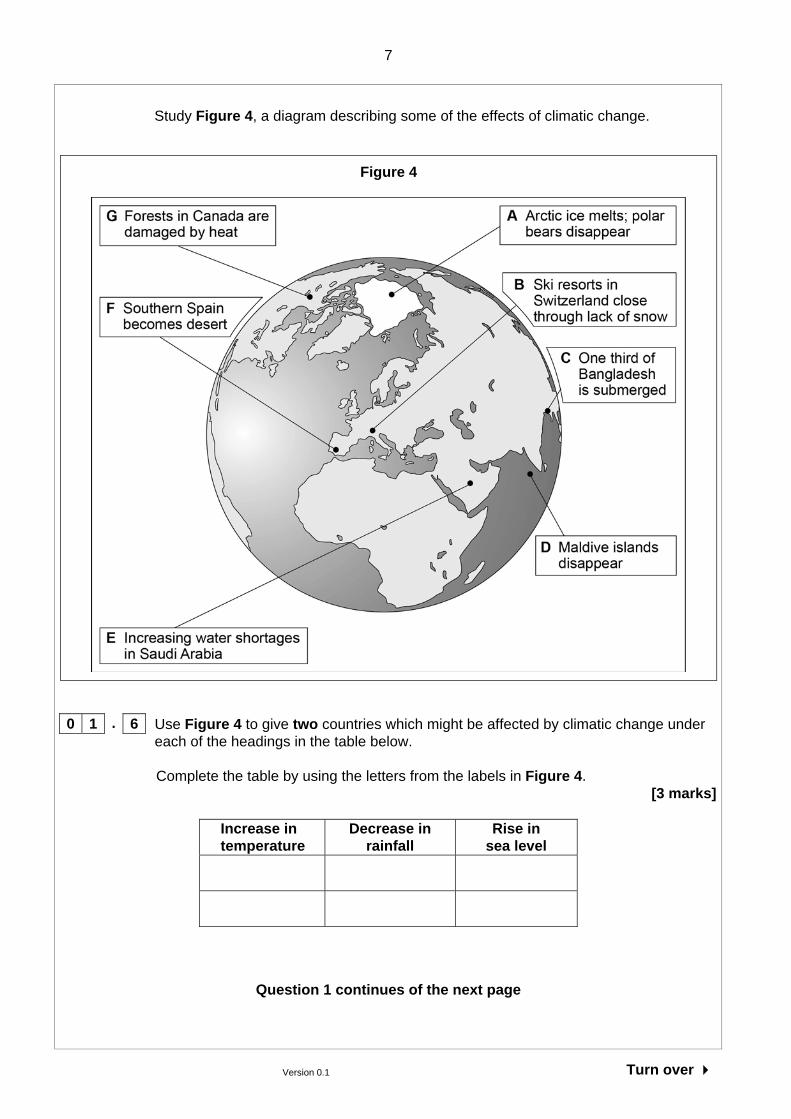
Study Figure 4, a diagram describing some of the effects of climatic change.
Figure 4
Use Figure 4 to give two countries which might be affected by climatic change under each of the headings in the table below.
Complete the table by using the letters from the labels in Figure 4.
[3 marks]
Increase in temperature
Decrease in rainfall
Rise in sea level
Question 1 continues of the next page
0 1 . 6
8
Version 0.1
Outline one strategy which aims to reduce the rate of climate change (mitigation).
[4 marks]
0 1 . 7
9
Version 0.1 Turn over
Assess the extent to which prediction is the most important factor in reducing the effects of tropical storms.
[9 marks] [+ 3 SPaG marks]
End of Section A
Turn over for Section B
0 1 . 8
10
Version 0.1
Section B The living world
Answer all questions in this section.
Question 2 The living world
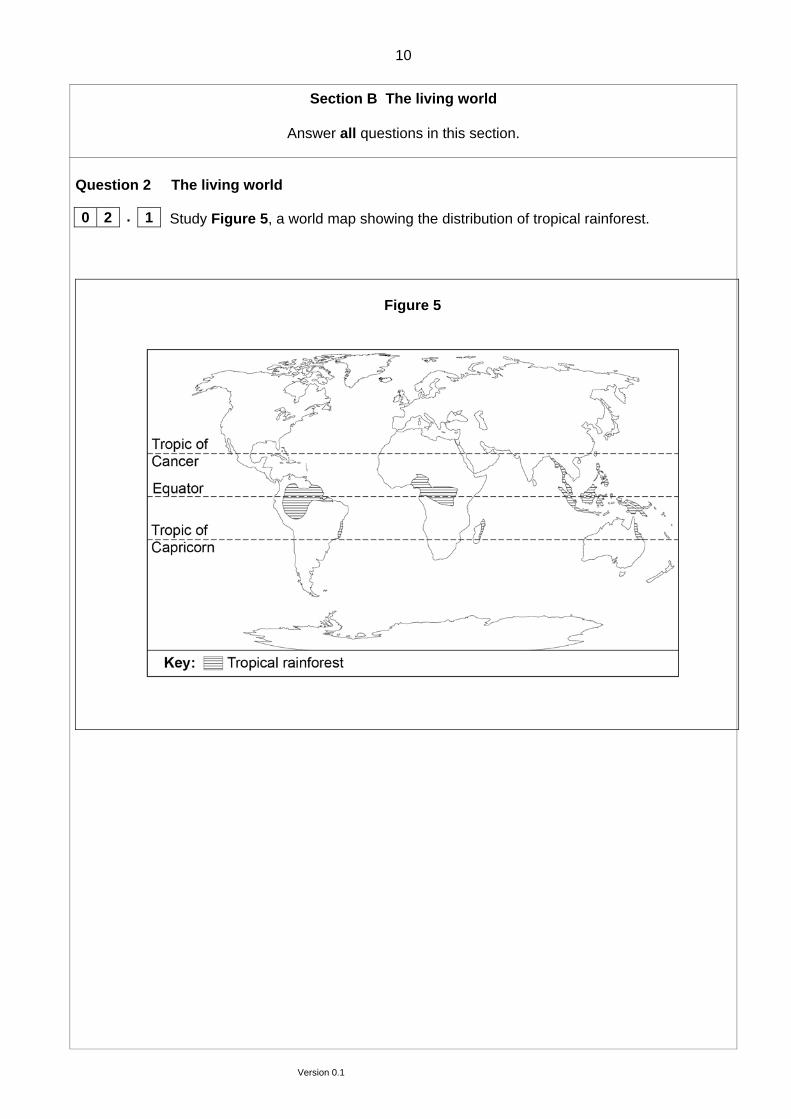
Study Figure 5, a world map showing the distribution of tropical rainforest.
Figure 5
0 2 . 1
11
Version 0.1 Turn over
In which two of the following continents are tropical rainforests found? Shade two circles only. A North America B South America C Asia D Antarctica E Europe
[2 marks]
Question 2 continues on the next page
12
Version 0.1
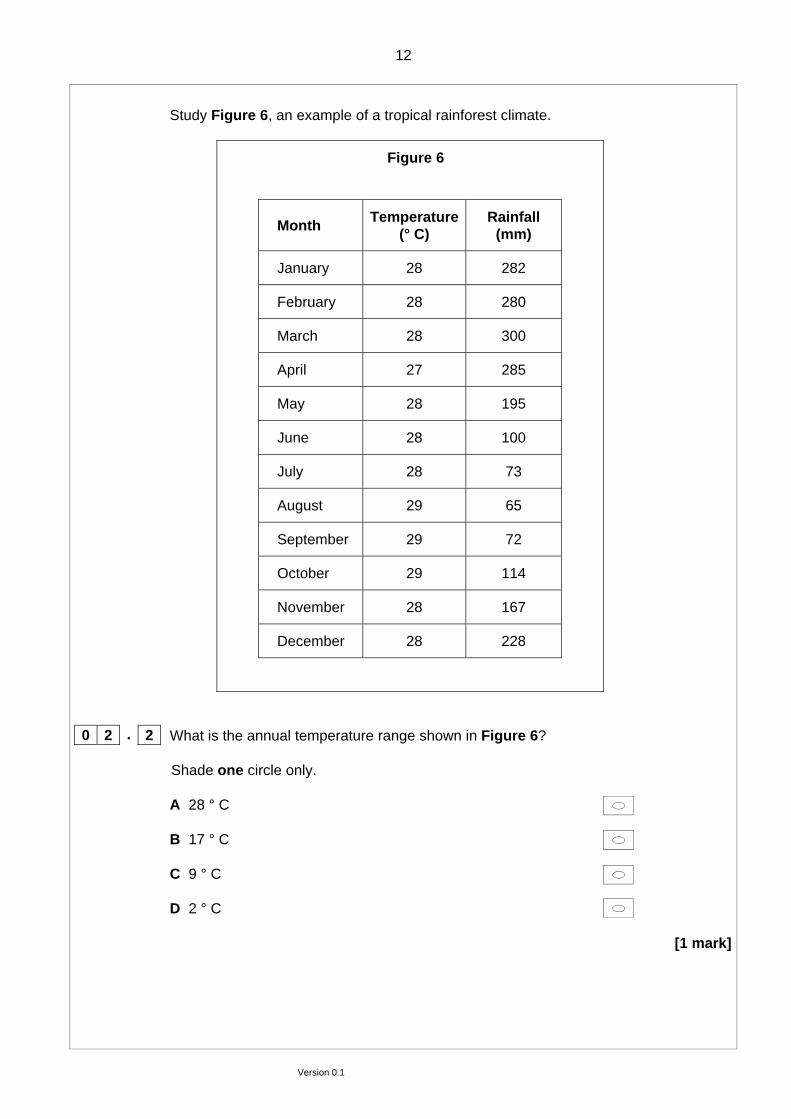
Study Figure 6, an example of a tropical rainforest climate.
Figure 6
Month Temperature
(° C) Rainfall
(mm)
January 28 282
February 28 280
March 28 300
April 27 285
May 28 195
June 28 100
July 28 73
August 29 65
September 29 72
October 29 114
November 28 167
December 28 228
What is the annual temperature range shown in Figure 6?
Shade one circle only.
A 28 ° C B 17 ° C C 9 ° C D 2 ° C
[1 mark]
0 2 . 2
13
Version 0.1 Turn over
What is the total annual rainfall shown in Figure 6?
Shade one circle only.
A 3875 mm B 2161 mm C 1521 mm D 742 mm
[1 mark]
Which one of the following describes the length of the growing season in a tropical rainforest climate?
Shade one circle only.
A 12 months B 9 months C 7 months D 1 month
[1 mark]
Question 2 continues on the next page
0 2 . 3
0 2 . 4
14
Version 0.1
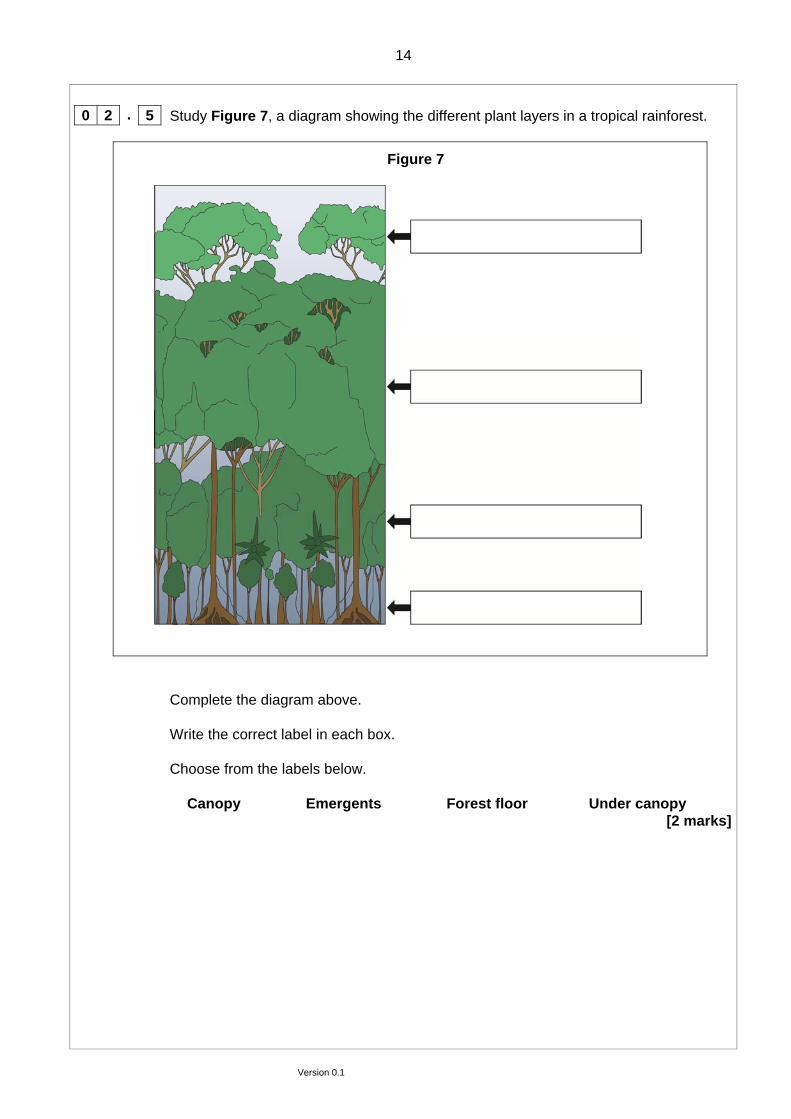
Study Figure 7, a diagram showing the different plant layers in a tropical rainforest.
Figure 7
Complete the diagram above. Write the correct label in each box. Choose from the labels below.
Canopy Emergents Forest floor Under canopy [2 marks]
0 2 . 5
15
Version 0.1 Turn over
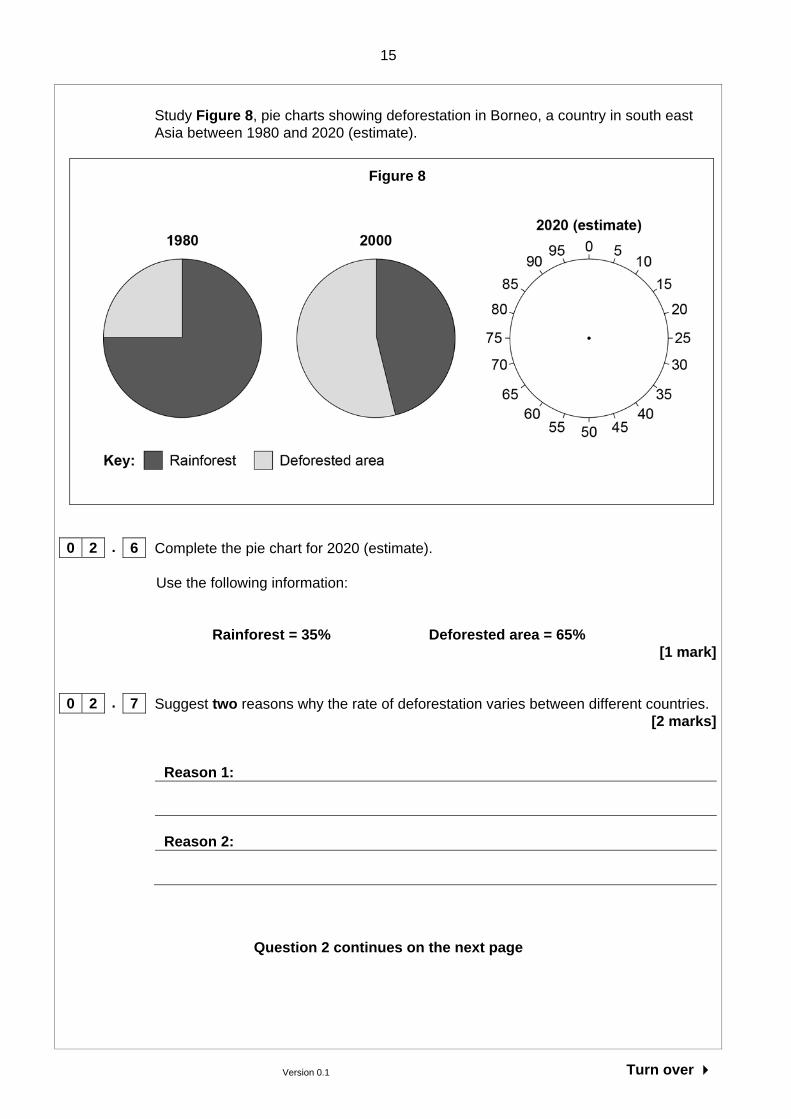
Study Figure 8, pie charts showing deforestation in Borneo, a country in south east Asia between 1980 and 2020 (estimate).
Figure 8
Complete the pie chart for 2020 (estimate).
Use the following information:
Rainforest = 35% Deforested area = 65% [1 mark]
Suggest two reasons why the rate of deforestation varies between different countries.
[2 marks]
Reason 1:
Reason 2:
Question 2 continues on the next page
0 2 . 7
0 2 . 6
16
Version 0.1
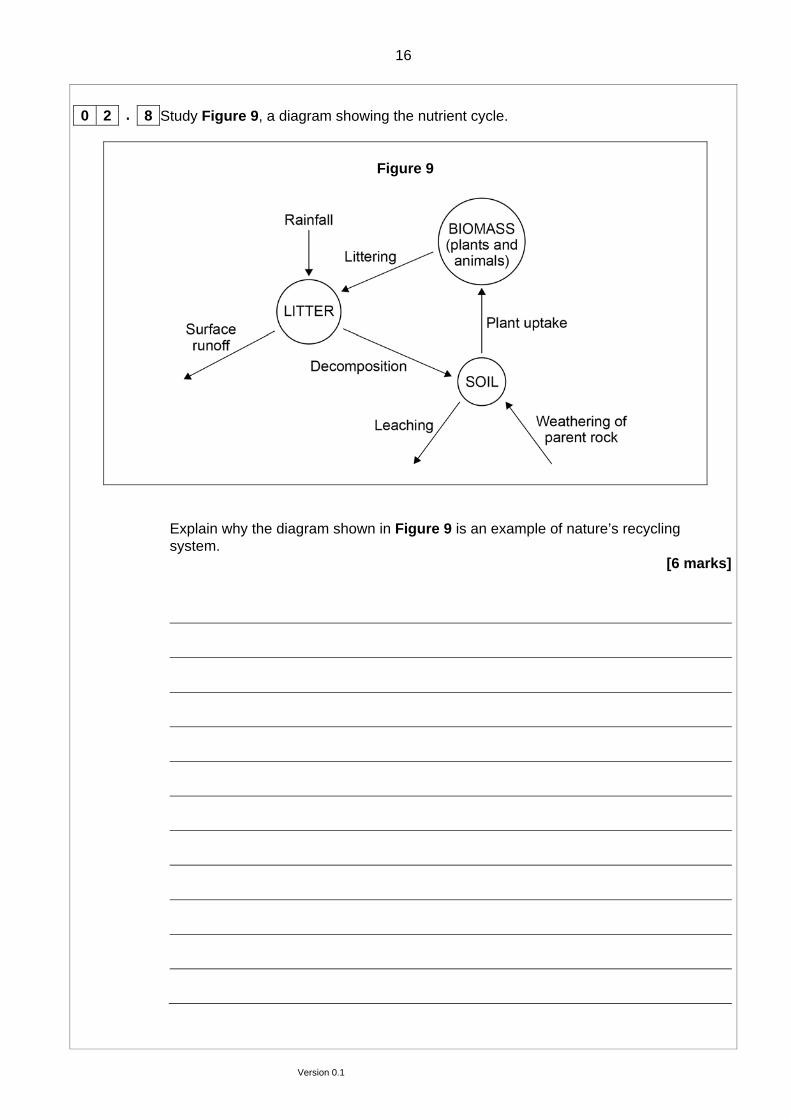
Study Figure 9, a diagram showing the nutrient cycle.
Figure 9
Explain why the diagram shown in Figure 9 is an example of nature’s recycling system.
[6 marks]
0 2 . 8
17
Version 0.1 Turn over
For a hot desert environment or a cold environment you have studied, assess the importance of management strategies used to reduce the risk of environmental damage.
[9 marks]
Chosen environment:
End of Section B
Turn over for the next question
0 2 . 9
18
Version 0.1
Section C Physical landscapes in the UK
Answer two questions from the following:
Question 3 (Coasts), Question 4 (Rivers), Question 5 (Glacial).
Shade the circle below to indicate which two optional questions you will answer.
Question 0 3 Question 0 4 Question 0 5
Question 3 Coastal landscapes in the UK
The following paragraph describes how coastal processes are linked. Complete the paragraph. Choose the correct words from the list below.
deposition transported weathering [2 marks]
Erosion and ……………………………………. break down rocks in coastal areas. Sediment is ……………………………………. by the action of waves and tides. Once the waves and tides have lost energy……………………………………. takes place.
0 3 . 1
CORRECT METHOD WRONG METHODS
19
Version 0.1 Turn over
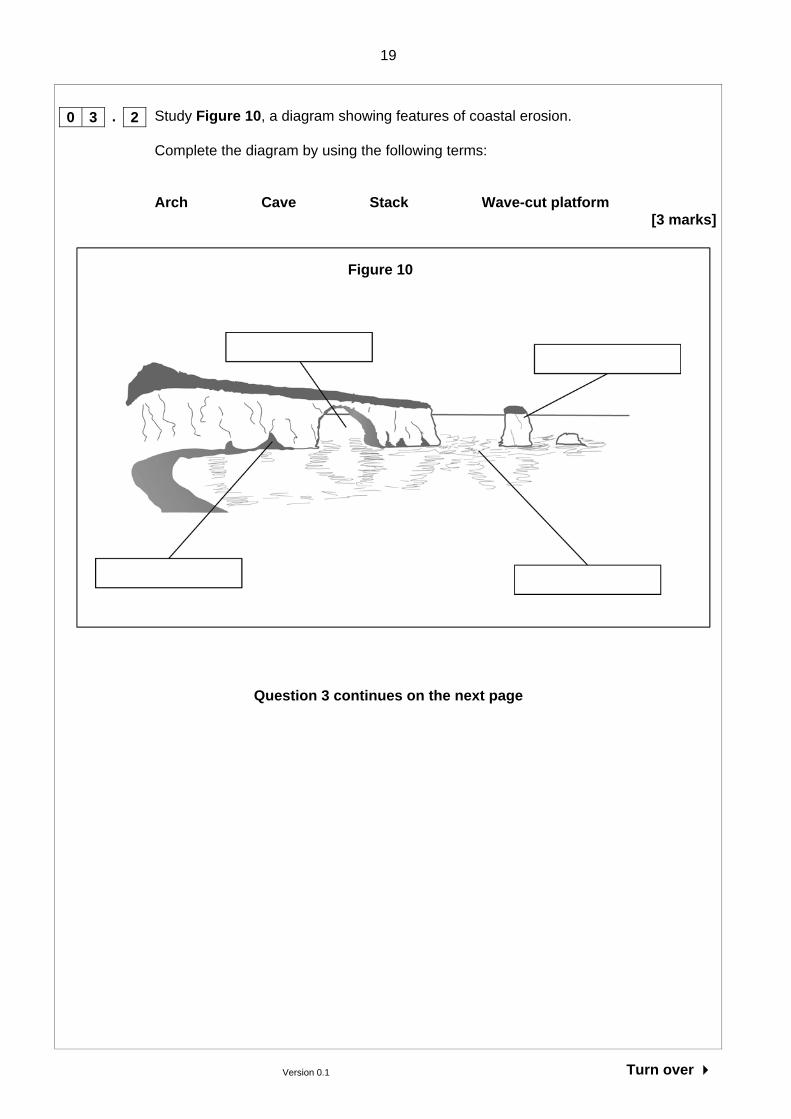
Study Figure 10, a diagram showing features of coastal erosion. Complete the diagram by using the following terms: Arch Cave Stack Wave-cut platform
[3 marks]
Question 3 continues on the next page
0 3 . 2
Figure 10
20
Version 0.1
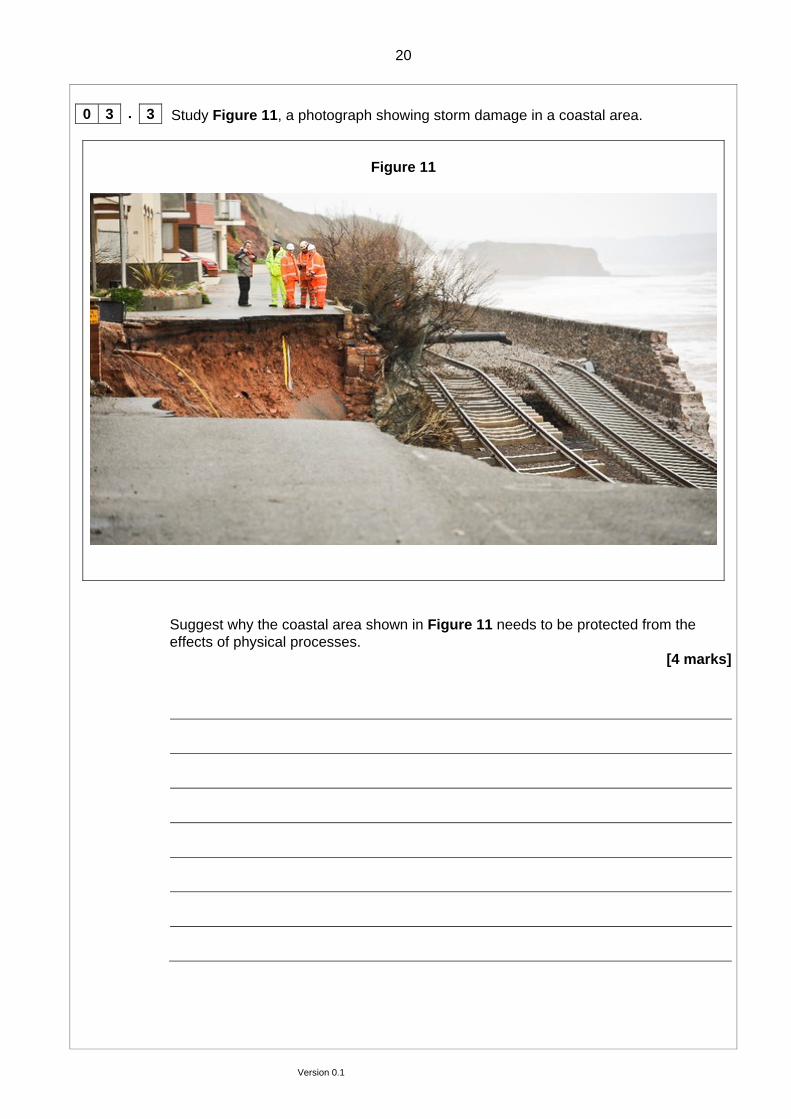
Study Figure 11, a photograph showing storm damage in a coastal area.
Figure 11
Suggest why the coastal area shown in Figure 11 needs to be protected from the effects of physical processes.
[4 marks]
0 3 . 3
21
Version 0.1 Turn over
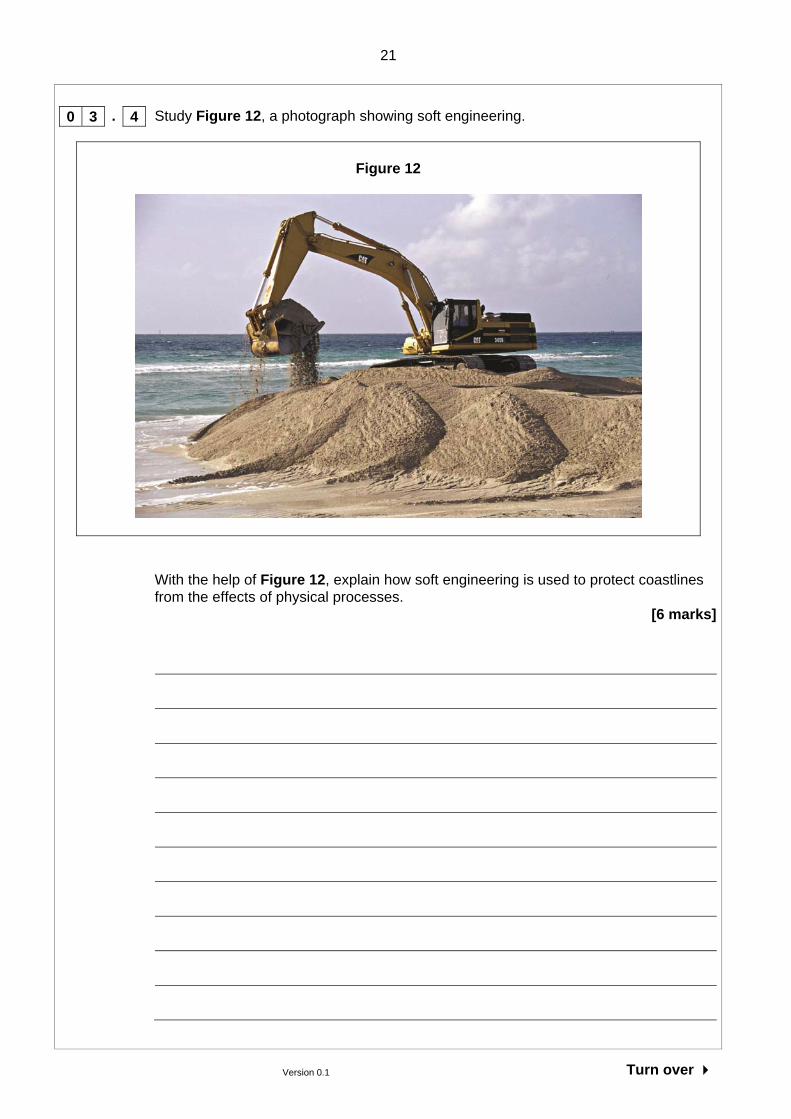
Study Figure 12, a photograph showing soft engineering.
Figure 12
With the help of Figure 12, explain how soft engineering is used to protect coastlines from the effects of physical processes.
[6 marks]
0 3 . 4
22
Version 0.1
Question 4 River landscapes in the UK
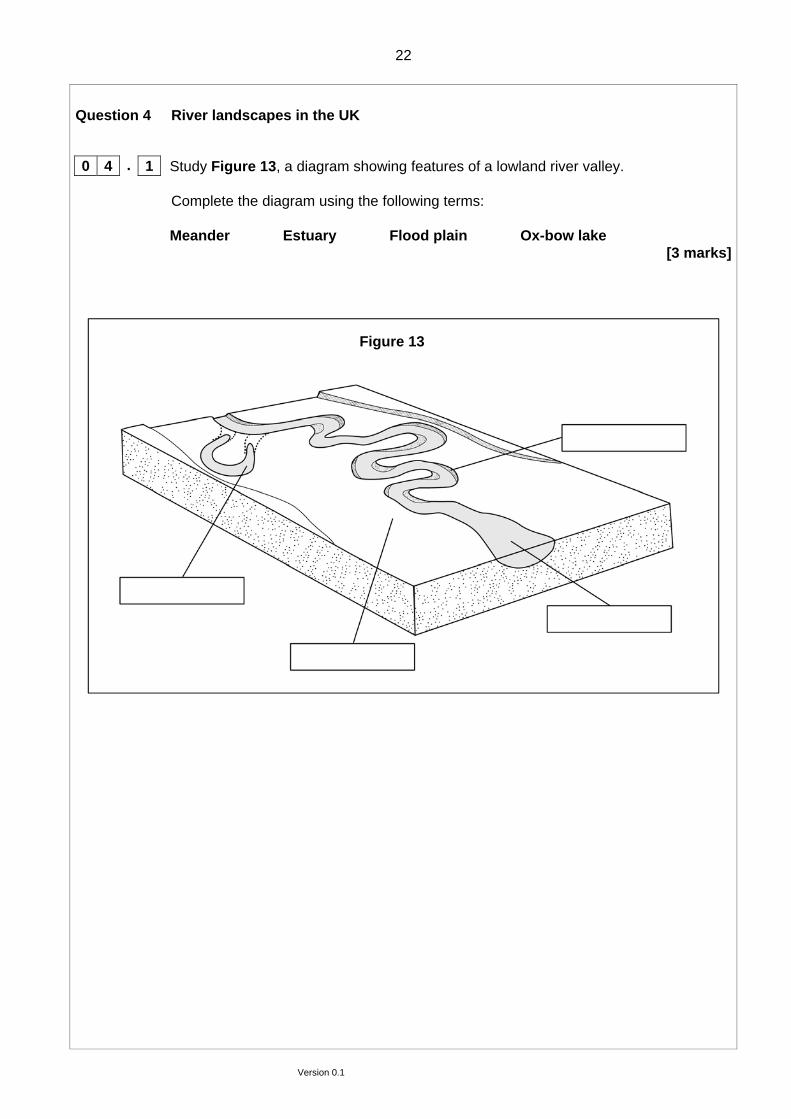
Study Figure 13, a diagram showing features of a lowland river valley.
Complete the diagram using the following terms: Meander Estuary Flood plain Ox-bow lake
[3 marks]
0 4 . 1
Figure 13
23
Version 0.1 Turn over
The following paragraph describes how sediment is transported by a river.
Complete the paragraph. Choose the correct words from the list below.
saltation suspension traction [2 marks]
Sediment is moved downstream by rivers in a number of ways. Small sediments
are carried in …………………………………. while larger pebbles are moved along
the river bed in small ‘hops’. This movement is called………………………………… .
Larger material is pushed along the river bed by …………………………………….. .
Question 4 continues on the next page
0 4 . 2
24
Version 0.1
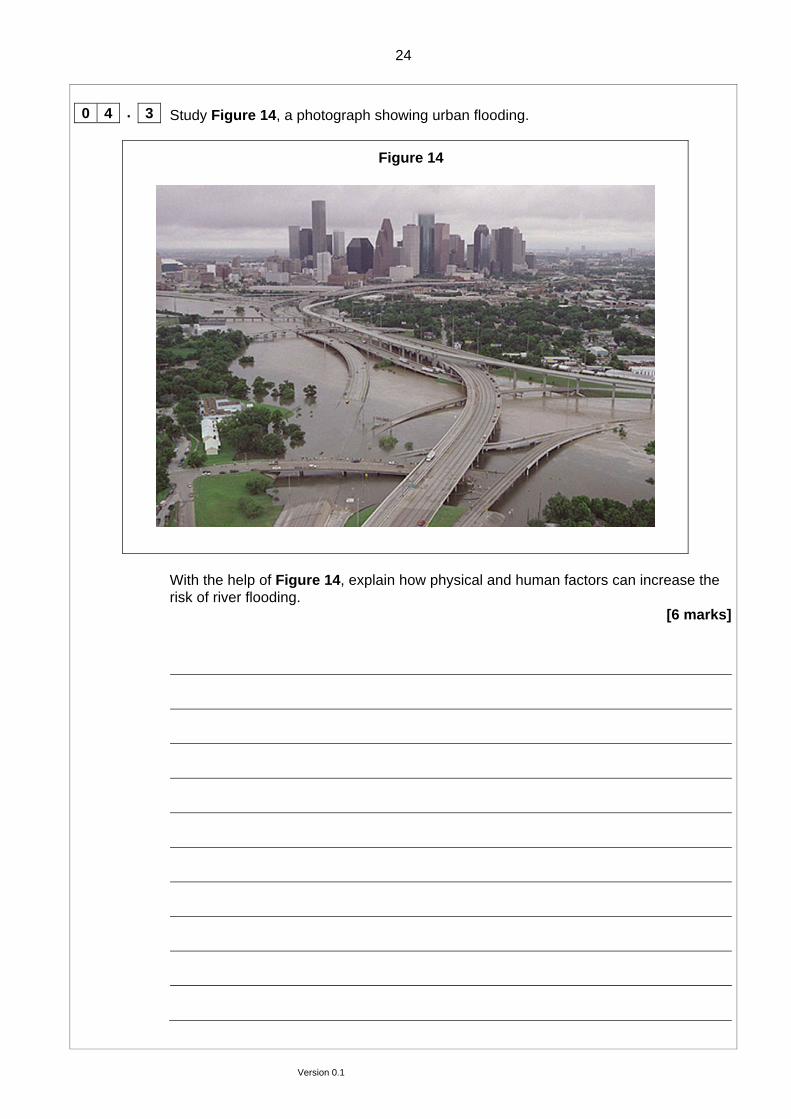
Study Figure 14, a photograph showing urban flooding.
Figure 14
With the help of Figure 14, explain how physical and human factors can increase the risk of river flooding.
[6 marks]
0 4 . 3
25
Version 0.1 Turn over
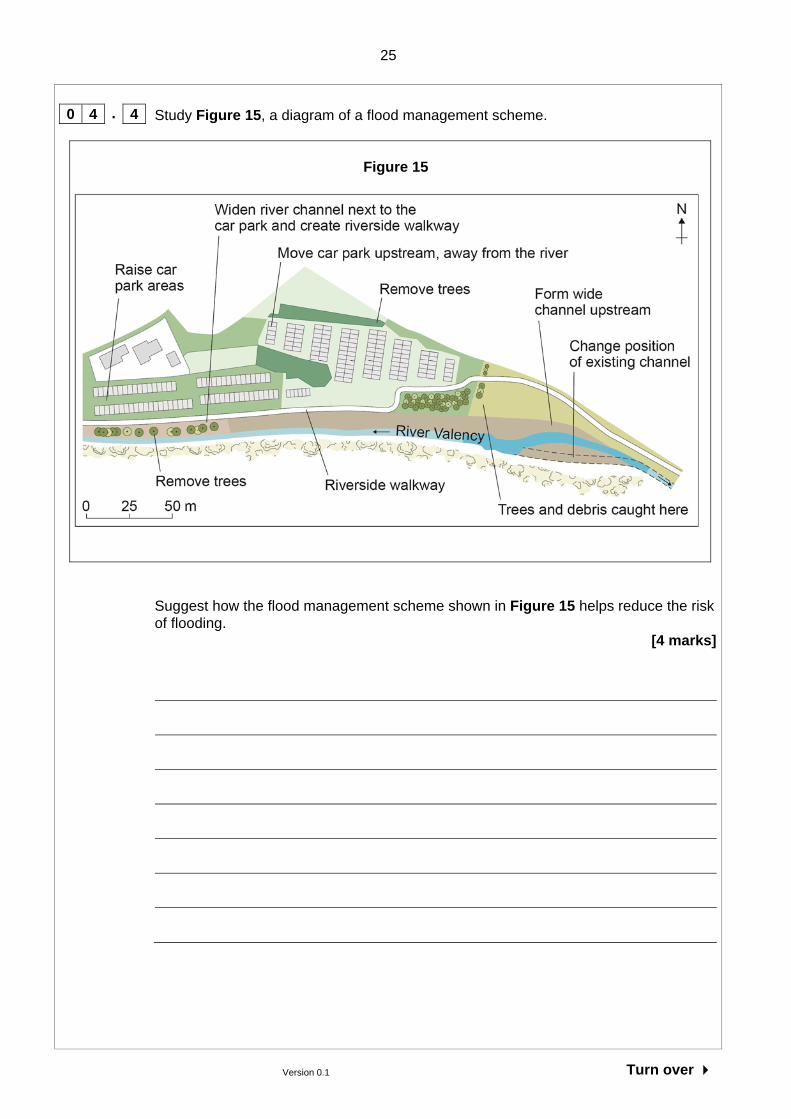
Study Figure 15, a diagram of a flood management scheme.
Figure 15
Suggest how the flood management scheme shown in Figure 15 helps reduce the risk of flooding.
[4 marks]
0 4 . 4
26
Version 0.1
Question 5 Glacial landscapes in the UK
The following paragraph describes how glacial processes shape the landscape in upland areas.
Complete the paragraph. Choose the correct words from the list below.
abrasion plucking weathering [2 marks]
In upland areas, the effects of freeze-thaw ………………………………. can be
significant. As ice moves over the land it can rip material out of the ground. This type
of erosion is called ………………………..……. . Moving glaciers often carry fragments
of rock which smooth the bedrock by a process of …….…………………..……. .
0 5 . 1
27
Version 0.1 Turn over
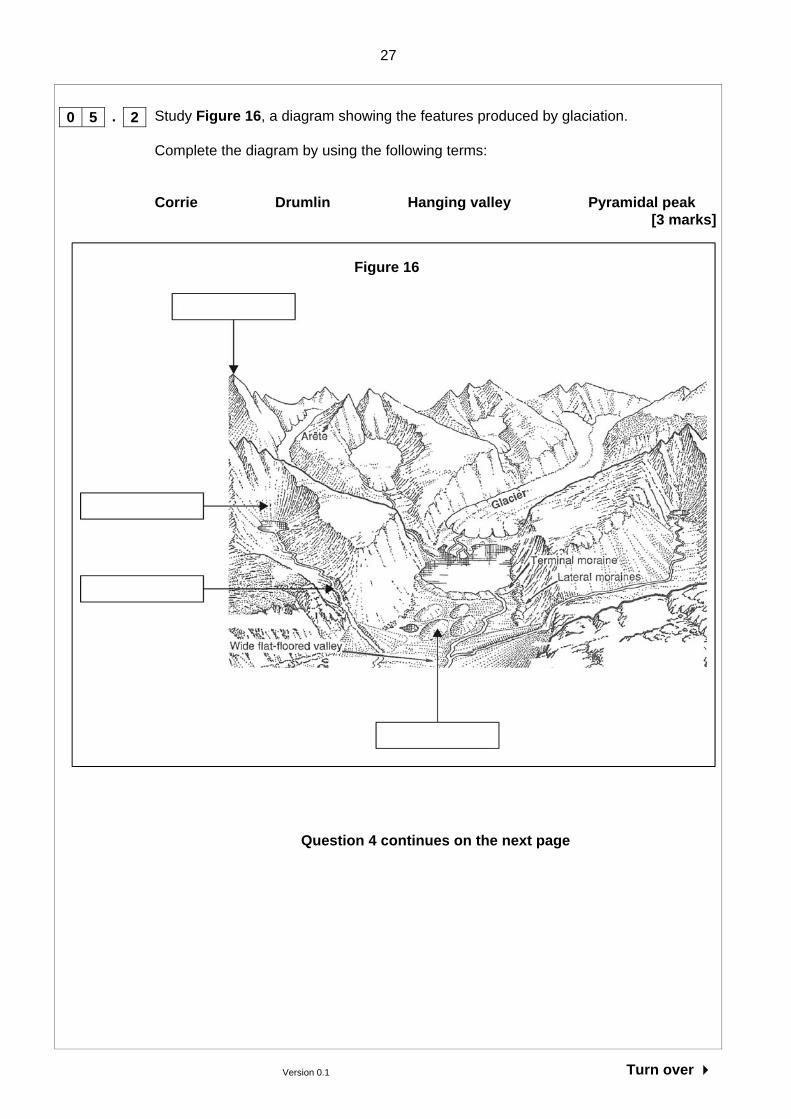
Study Figure 16, a diagram showing the features produced by glaciation. Complete the diagram by using the following terms: Corrie Drumlin Hanging valley Pyramidal peak
[3 marks]
Question 4 continues on the next page
0 5 . 2
Figure 16
28
Version 0.1
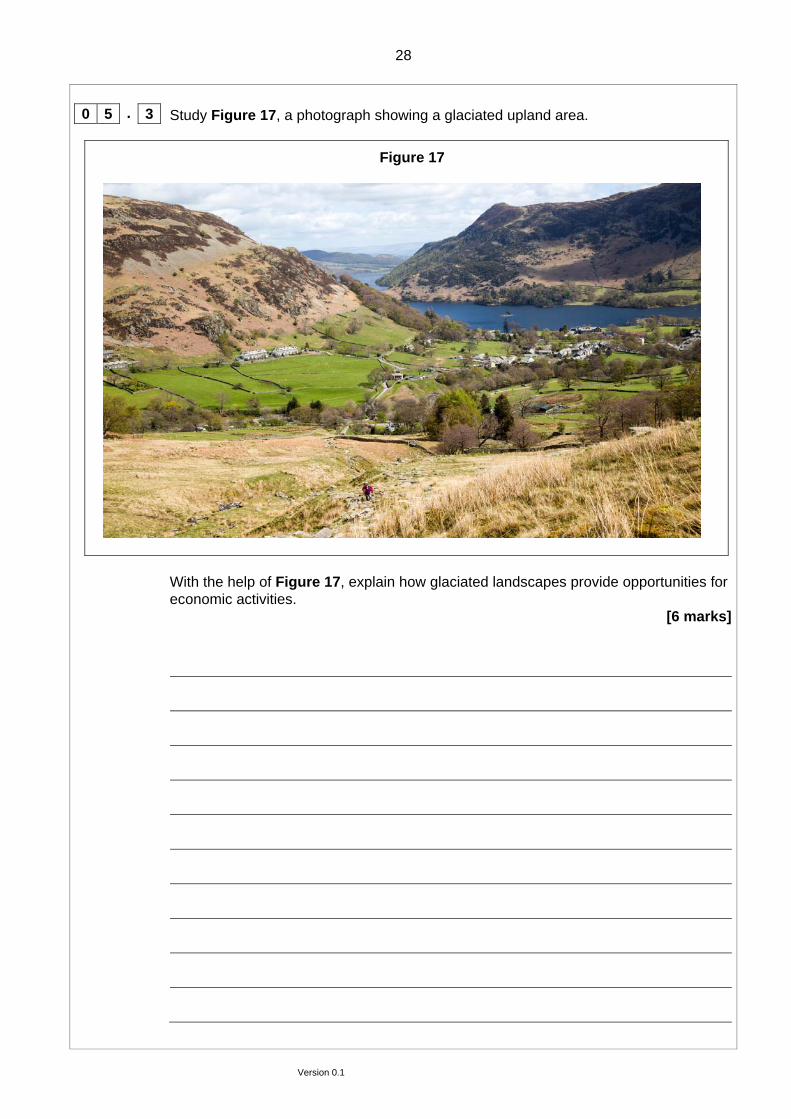
Study Figure 17, a photograph showing a glaciated upland area.
Figure 17
With the help of Figure 17, explain how glaciated landscapes provide opportunities for economic activities.
[6 marks]
0 5 . 3
29
Version 0.1
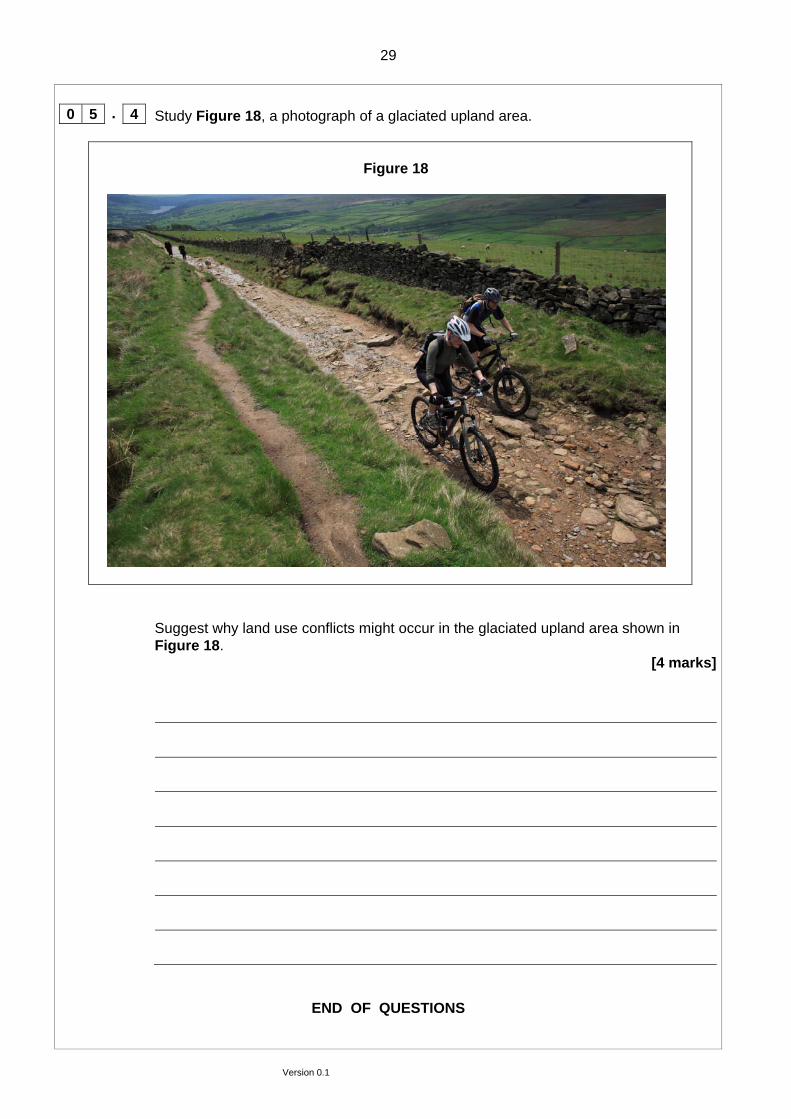
Study Figure 18, a photograph of a glaciated upland area.
Figure 18
Suggest why land use conflicts might occur in the glaciated upland area shown in Figure 18.
[4 marks]
END OF QUESTIONS
0 5 . 4
30
Version 0.1
There are no questions printed on this page
DO NOT WRITE ON THIS PAGE ANSWER IN THE SPACES PROVIDED
Acknowledgement of copyright holders and publishers Permission to reproduce all copyright material has been applied for. In some cases, efforts to contact copyright holders have been unsuccessful and AQA will be happy to rectify any omissions of acknowledgements in future papers if notified. Figure 2: © US Geological Survey, BBC Online © Getty Images/Peter Parks/AFP Figure 4: © Issues and Environments GCSE Geography for AQA Specification C, Payne and Jennings, Pearson Education Limited Figure 11: © Ben Birchall/PA Archive/Pres Association Images Figure 13: © Core Themes in Geography, Physical, Eddie Broadley and Ritchie Cunningham, Pearson Education Limited Figure 14: © NOAA/NWS Figure 16: © Core Themes in Geography, Physical, Eddie Broadley and Ritchie Cunningham, Pearson Education Limited Figure 17: © Alamy Images/Geogphotos Figure 18: © Getty Images/Wig Worland Copyright © 2016 AQA and its licensors. All rights reserved.