Adding value+ - EuroChemeurochemgroup.com/wp-content/uploads/2015/04/EuroChem-Group-AG... · Adding...
140
Adding value+ ANNUAL REPORT AND ACCOUNTS 2014
-
Upload
duongnguyet -
Category
Documents
-
view
216 -
download
2
Transcript of Adding value+ - EuroChemeurochemgroup.com/wp-content/uploads/2015/04/EuroChem-Group-AG... · Adding...
Addingvalue+
ANNUAL REPORT AND ACCOUNTS 2014

II EuroChem Annual Report and Accounts 2014
EuroChem is one of the world’s leading agrochemical companies. We make products that satisfy the demands of growers for an effective means of improving crop quality and yield.
Our business is vertically integrated and combines low-cost, high-quality resources and production assets with world-class operational systems and a global distribution network. Our investments in upstream resources such as potash and natural gas, as well as in production processes and logistics have put the Group on a clear path to growth over the next ten years.
Adding valueABOUT EUROCHEM
SEE PAGES 23-26
How we add value
See how EuroChem is strategically positioned for unparalleled value creation and growth.

ST
RA
TE
GIC
RE
PO
RT
CO
RP
OR
AT
E G
OV
ER
NA
NC
E
EuroChem Annual Report and Accounts 2014 1
STRATEGIC REPORTAdding value... 02 ...at source 04 ...through our diversified
product portfolio 06 ...through our global
distribution platform 08 ...through the right
investment strategy10 EuroChem at a glance12 Operational and financial highlights14 Our operations16 The issues that matter18 Chief Executive’s review20 Peer analysis23 Adding value... through low-cost
vertical integrationPerformance review – 28 Group performance 33 Reporting segments: 34 Nitrogen 38 Phosphates 44 Potash 48 Distribution 50 Logistics51 EuroChem investment program52 Sustainability56 Risks and uncertainties
CORPORATE GOVERNANCE60 EuroChem Group AG
Chairman’s statement62 EuroChem Group AG
Board of DirectorsEuroChem Group AG Committees – 64 The Audit Committee 64 The Strategy Committee 65 The Nomination and
Remuneration Committee66 MCC EuroChem
Corporate governance reportMCC EuroChem Committees – 72 The Audit Committee 73 The Strategy Committee 74 The Corporate Governance
& Personnel Committee
FINANCIAL STATEMENTS76 Independent Auditor’s Report77 Consolidated Statement of
Financial Position79 Consolidated Statement of Profit or
Loss and Other Comprehensive Income80 Consolidated Statement of Cash Flows82 Consolidated Statement of Changes
in Equity83 Notes to the Consolidated
Financial Statements132 Key financial and non-financial data136 Contact information
Our future global cost leadership in potash will increase our competitive advantages.
Read more about our Usolskiy and VolgaKaliy greenfield potash projects on pages 46-47
Potash projects
With the support of over 23,000 dedicated employees globally, we are quickly growing into one of the largest agrochemical businesses in the world.
Read more about our international footprint across key markets on pages 14-15
16
13
14
121
3
8 97
10 6
5
4
2
17 18
15
23
20
27
26
19
2930 24
22
Where we operate
FINA
NC
IAL S
TAT
EM
EN
TS
VIEWTHE REPORT
ONLINEView the Annual Report and Accounts 2014 on our website: www.eurochemgroup.com/reports/annual-reports
Addingvalue+ANNUAL REPORT AND ACCOUNTS 2014

...at sourceOur reserve base includes hydrocarbons, potash, phosphate rock, and iron ore. They underpin our vertically integrated business model and provide us with high-quality, cost-effective raw materials for our production facilities.
2 EuroChem Annual Report and Accounts 2014
ADDING VALUE...
4,239MMTPHOSPHATE ROCK RESOURCE BASE
585bcmNATURAL GAS RESOURCE BASE
10,291MMTPOTASH RESOURCE BASE

ST
RA
TE
GIC
RE
PO
RT
CO
RP
OR
AT
E G
OV
ER
NA
NC
EFIN
AN
CIA
L STA
TE
ME
NT
S
EuroChem Annual Report and Accounts 2014 3
READ MORE ON PAGE 24 R

...through our diversified product portfolio
We own and operate plants in Russia, Belgium, Lithuania and China and create more than 100 unique commodity and specialty products across our fertilizers, mining and industrial divisions. The depth of our vertical integration coupled with a diverse product mix means that we can respond rapidly to changing market demand, offering competitive advantages in global markets.
4 EuroChem Annual Report and Accounts 2014
ADDING VALUE...

ST
RA
TE
GIC
RE
PO
RT
CO
RP
OR
AT
E G
OV
ER
NA
NC
EFIN
AN
CIA
L STA
TE
ME
NT
S
EuroChem Annual Report and Accounts 2014 5
READ MORE ON PAGES
34-47
910
12
14
S
>100TYPES OF PRODUCT CREATED ACROSS OUR FERTILIZERS, MINING AND INDUSTRIAL DIVISIONS
2.2%OF THE WORLD’S PRODUCTION (IN NUTRIENT CONTENT) OF FERTILIZERS USED IN AGRICULTURE

...through our global distribution platform
6 EuroChem Annual Report and Accounts 2014
ADDING VALUE...
4.1MTTOTAL TRANSHIPMENT CAPACITY IN THE EU
8.8MTTOTAL TRANSHIPMENT CAPACITY IN RUSSIA

ST
RA
TE
GIC
RE
PO
RT
CO
RP
OR
AT
E G
OV
ER
NA
NC
EFIN
AN
CIA
L STA
TE
ME
NT
S
EuroChem Annual Report and Accounts 2014 7
Our logistics system allied with our global sales and distribution network ensure a steady flow of products, allowing us to serve and support more than 6,000 customers in over 100 countries across all markets and seasons.
READ MORE ON PAGES
48-49
REA

...through the rightinvestmentstrategy
8 EuroChem Annual Report and Accounts 2014
ADDING VALUE...
READ MORE ON PAGES 46-47
AND PAGE 51
RREAON P

ST
RA
TE
GIC
RE
PO
RT
CO
RP
OR
AT
E G
OV
ER
NA
NC
EFIN
AN
CIA
L STA
TE
ME
NT
S
EuroChem Annual Report and Accounts 2014 9
We continue to invest across our nitrogen and phosphates segments, while potash will come on stream in 2017, with a final capacity equivalent to around 10% of today’s global supply. This will make us one of only four companies in the world to produce fertilizers in all three primary nutrient categories.
US$439mPOTASH CAPEX IN 2014
US$1,102mTOTAL CAPEX IN 2014

10 EuroChem Annual Report and Accounts 2014
Who we are and what we doEuroChem is a vertically integrated agrochemical company, combining low-cost natural resources and production bases supported by wholly-owned logistics assets and a global advisory, sales and distribution platform.
In 2014, we finalized the establishment of EuroChem Group AG, a new holding company for the Group based in Zug, Switzerland. This move, one of the last in our planned reorganization which we have carried out since 2012, lays the foundation for further international expansion and is a cornerstone of EuroChem’s next growth phase. While at this level, the business will operate under Swiss law and financial regulations, operational functions will remain at the level of the operating companies, whether in Belgium or the CIS. Additionally, the reorganization and re-domiciliation of our headquarters will see all corporate-level decision making and strategic formulation done at EuroChem Group AG level.
We currently manufacture nitrogen and phosphate fertilizers and will soon launch potash operations to further enhance our product mix. Our range is of high-quality and includes standard and commodity products as well as a growing slow release and specialty fertilizer product offering, on which there is greater emphasis.
Our production base is becoming more international, with assets in Russia, Lithuania, Kazakhstan and Belgium, plus a joint venture recently launched in China. These assets have ready access to key markets through our logistics and distribution network that currently covers more than 25 countries.
We are one of the fastest growing fertilizer majors and plan to be a top five producer by nutrient capacity within the next three years.
We measure our performance in four reporting segments: Nitrogen, Phosphates, Potash and Distribution. In 2014 we have started to manage our business through five Business Divisions – Fertilizers, Mining, Logistics, Sales and Marketing, and Oil and Gas. These divisions may become our reporting segments in the future.
A world leaderOur vertically integrated business and access to lower cost raw materials and energy provides distinct cost advantages over many of our competitors. Our investments in major potash reserves will place us at the forefront of global fertilizer production when they come on stream in 2017.
EUROCHEM AT A GLANCE
EuroChem is one of the world’s largest producers of nitrogen-based fertilizers and organic synthesis products, with an ammonia capacity of 3.0 MMT pa. Our three nitrogen plants (two in Russia and one in Belgium) produce a wide range of mineral fertilizers such as urea, AN, UAN, CAN and a range of regular and tailored complex NPK grades. Our offering has continued to grow, now encompassing specialty products such as slow-release, non-chloride, and inhibitor-treated fertilizers. The latter products delay conversion of urea into ammonium and ammonia, leaving more nitrogen in the soil for crops.
We are Russia’s only producer of melamine and produce industrial products such as nitric acid and methanol and industrial gases, including argon, nitrogen, and oxygen.
30%of external sales
US$866mEBITDA (57% of total)
30%EBITDA margin
NitrogenN
The high-quality phosphate rock, mined and processed at our Kovdorskiy mine in Russia, is as a key component of our phosphate fertilizer production operations. Our manufacturing plants in Russia and Lithuania produce MAP, DAP, NP and feed phosphates. The start of our operations in Kazakhstan, where EuroChem has acquired mining rights on two deposits, will boost internal capacity while providing added flexibility to our raw material flows from mine to production. Our Kovdorskiy mine also produces iron ore concentrate that we sell on the open market and is the world’s only producer of baddeleyite concentrate.
Our phosphate fertilizer plants have a combined 1.2 MMT pa of phosphoric acid capacity and 3.0 MMT pa of sulphuric acid capacity. Our plant in Lithuania also produces aluminium fluoride which is used in the manufacture of aluminium, glass and optics as well as the tanning industry.
While we are selling the first ore out of our new mine in Kazakhstan, from 2015/16 we will operate a beneficiation unit to further process the rock and begin shipments to the Group’s phosphate plants in Southern Russia.
22%of external sales
US$476mEBITDA (31% of total)
30%EBITDA margin
PhosphatesP

ST
RA
TE
GIC
RE
PO
RT
CO
RP
OR
AT
E G
OV
ER
NA
NC
EF
INA
NC
IAL S
TAT
EM
EN
TS
EuroChem Annual Report and Accounts 2014 11
Strategic advantagesWe have access to low-cost, high-quality resources, which include phosphate rock, hydrocarbons, and potash.
We operate efficient and advanced production assets that are accessible to key markets.
We are vertically integrated, controlling raw materials, production, logistics and distribution assets, which offers cost advantages, sector knowledge and economies of scale.
All of our products are high-quality, with a growing emphasis on slow release and specialty grades to complement standard lines.
Our global distribution system keeps us close to customers – getting the right product to the right place at the right time.
Our investments in upstream supply, chiefly potash and phosphate rock gives us a clear growth pathway.
We have secured access to over a billion tonnes of proven and probable potash reserves in two key deposits. With initial production set to commence from 2017, our two key sites will have over 8.3 MMT KCI (5.0 MMT K2O) of capacity once fully ramped up, which is equivalent to approximately 10% of current global supply. This will make us one of only four companies in the world to produce fertilizers in all three primary nutrient categories and a top five global producer by total nutrient capacity. We also expect have one of the lowest ‘delivered to’ costs thanks to our mine design, use of the latest
technology, low energy prices and access to our own ports and transhipment operations. In fact, while industry experts project our Usolskiy operations to be amongst the lowest cost in the world, we expect our VolgaKaliy mine, which is 1,500km closer to port, to be the most competitive potash operation globally.
To the end of 2014, we had invested US$ 2.4 billion in our potash projects.
22%Completion of EuroChem Usolskiy1
36%Completion of EuroChem VolgaKaliy1
1 Based on capital expenditure incurred as at 31 December 2014, including both phases of the projects
PotashK
SALES BY REGION
2014 2013 2012
Europe 38% 32% 27%
Russia 20% 19% 21%
Asia 14% 18% 16%
Latin America 10% 9% 14%
North America 10% 10% 11%
CIS 6% 8% 8%
Africa 2% 3% 2%
Australasia 0% 1% 1%
SALES vOLumES (KmT)
2014 2013 2012
Nitrogen fertilizers 7,435 7,475 6,760
Phosphate fertilizers 2,346 2,389 2,359
Complex fertilizers 1,571 1,570 1,199
Other fertilizers 45 37 27
Total fertilizers 11,397 11,471 10,345
Raw material mining 5,521 5,998 5,459
Industrial products 598 582 509
Hydrocarbons 126 141 676
Total 17,642 18,192 16,989 We own and operate rolling stock and our own ocean-going cargo vessels. These are linked to our transhipment operations in Russia and Estonia. We will add a new bulk terminal in Russia at the Ust-Luga port to serve our potash operations from 2017 onwards.
Our distribution platform includes specialist sales, storage, blending and coating facilities and is divided across five main markets – Europe, the CIS, North America, Latin America and Asia, which are supported by our global trading center in Zug, Switzerland.
Our distribution centers in Russia, Ukraine and Belarus advise farmers on improving crop yields while controlling and optimizing their use of fertilizers.
45%of external sales
uS$90mEBITDA (6% of total)
4%EBITDA margin
DistributionD

12 EuroChem Annual Report and Accounts 2014
Strong operating progress
ObjectiveTo be a top five global player by production, sales and profitability.
We have demonstrated our ability to grow our business both organically and through targeted value accretive acquisitions. Our growth strategy enables us to consistently deliver solid financial results and puts us in a position to capture future opportunities.
We have established a clear set of financial and non-financial indicators to evaluate our performance, as well as to assess our prospects in the longer-term. These KPIs are continuously reviewed in the context of our corporate objectives, and the risks that relate to them.
The aim of this report is to demonstrate how our strategy works and where we are in achieving our objective of becoming a top five player within the global agrochemical sector.
US$1.51bnEBITDA
30%EBITDA MARGIN
17.6MMTTOTAL PRODUCTS SOLD
US$5.09bnTOTAL REVENUES
12%EBITDA INCREASE
US$1.1bnTOTAL CAPEX
2014 highlightsOur consolidated revenues for the year were US$ 5.09 billion (RUB 193 billion), or 8% lower than in 2013. Our vertically integrated business model and flexible cost base supported full-year EBITDA, which was US$ 1.51 billion (30%) – 12% higher year-on-year.
Full-year own nitrogen and phosphates sales volumes of 10.6 MMT, excluding raw material mining and hydrocarbons, were stable year-on-year as higher nitrogen volumes mitigated slightly lower phosphates volumes. Sale volumes of iron ore, a co-product of phosphate rock beneficiation operations at the Kovdorskiy mine, reflected the year’s weaker demand landscape and amounted to 5.5 MMT, representing a 6% decline on the 5.9 MMT of iron ore sold a year earlier. In addition to 10.6 MMT of fertilizers produced by EuroChem, the Group distributed 1.58 MMT of third-party products, mainly ammonium sulphate (2013: 1.63 MMT).
OPERATIONAL AND FINANCIAL HIGHLIGHTS

ST
RA
TE
GIC
RE
PO
RT
CO
RP
OR
AT
E G
OV
ER
NA
NC
EFIN
AN
CIA
L STA
TE
ME
NT
S
EuroChem Annual Report and Accounts 2014 13
RisksOur risk management function and internal controls are being actively developed and based on international standards, such as ISO 31000 and COSO ERM.
Read more about our risks anduncertainties on pages 56-59
Key Performance IndicatorsOur KPIs are reviewed by the Board and its Committees to ensure that they are relevant and relate to our key corporate objectives and associated risks.
REVENUE (US$m)
2013 20142012
5,354 5,5565,088
EBITDA MARGIN (%)
2013 20142012
30
24
30
TOTAL CAPEX (US$m)
2013 20142012
9041,024 1,102
PRODUCTION OUTPUT (tonne/employee)
2013 20142012
1,471 1,603
2,148
GROSS MARGIN (%)
2013 20142012
4136
40
NET DEBT/EBITDA
2013 20142012
1.50x
2.02x
1.77x
POTASH CAPEX (US$m)
2013 20142012
437388
439
FERTILIZER PRODUCTION (MMT)
2013 20142012
10.311.5 11.4
TOTAL PRODUCTION (MMT)*
2013 20142012
28.0 29.1 29.8
*excluding hydrocarbons
EBITDA (US$m)
2013 20142012
1,581
1,3491,513
NET WORKING CAPITAL (US$m)
2013 20142012
786707 708
EMPLOYEES
2013 20142012
22,073 22,310 22,435

21
23
20
Where we operateWe have raw materials and production operations in Russia, Kazakhstan, Ukraine, Belarus, Lithuania, Belgium and China. This growing asset base is supported by an active logistics and sales network across key markets including Russia and the CIS, Europe, USA, Mexico, and Central and South East Asia, supporting over 6,000 customers.
OUR OPERATIONS
14 EuroChem Annual Report and Accounts 2014
6,000+CUSTOMERS GLOBALLY
100+COUNTRIES CONSUMEEUROCHEM PRODUCTS
Mining1 Kovdorskiy GOK2 EuroChem VolgaKaliy3 EuroChem Usolskiy4 EuroChem Fertilizers
Fertilizers5 Novomoskovskiy Azot6 Nevinnomysskiy Azot7 EuroChem Antwerpen8 Lifosa9 Phosphorit10 BMU11 EuroChem Migao JV
12 Severneft-Urengoy13 Ozinskiy deposit (Saratov)14 Astrakhan Oil and Gas
Oil and gas
15 Tuapse16 Murmansk17 Sillamäe18 Ust-Luga
Logistics
Distribution19 Switzerland (Zug)20 USA (Tampa) 21 Brazil (São Paulo) 22 Germany23 Mexico24 Turkey25 Singapore26 Spain27 France28 China29 Italy30 Greece

16
13
14
28
25
121
3
8 97
10 6
5
11
4
2
17 18
15
27
26
19
2930 24
22
ST
RA
TE
GIC
RE
PO
RT
CO
RP
OR
AT
E G
OV
ER
NA
NC
EFIN
AN
CIA
L STA
TE
ME
NT
S
EuroChem Annual Report and Accounts 2014 15
EuroChem Fertilizers (Kz)Our phosphate rock mining project in Kazakhstan is a key part of our upstream raw material strategy. Close to a year after announcing the launch of drilling and blasting operations, we began mining the first ore from our site in the South East of Kazakhstan. Further transport infrastructure is being created and more equipment commissioned with a view to reaching full mining capacity in 2016.
EuroChem Migao JV (China)Accounting for around 30% of global consumption, China is the largest mineral fertilizer market in the world today. To further consolidate our position in this key market, in 2014, we established a joint venture with the Migao Corporation, a Yunnan-based manufacturer of potash and complex fertilizers. With 100 KMT in annual NPK capacity already running, the EuroChem Migao JV will be launching a second 100 KMT NPK line and a 60 KMT potassium nitrate (NK) line in 2015.
MINING DEVELOPMENTS IN 2014
PRODUCTION DEVELOPMENTS IN 2014

SECTION TITLE
16 EuroChem Annual Report and Accounts 2014
The global challenge of food securityFeeding the world’s growing population and improving the nutritional quality of diets are long-term challenges, complicated by a decreasing amount of available arable land and the growing frequency and severity of weather shocks across key agricultural areas. EuroChem makes the necessary fertilizer products to ensure soils retain their optimal nutrient balance, allowing farmers to increase their farm yields and provide the world with the food we need.
THE ISSUES THAT MATTER
1 Population growth
The world population grows by more than 200,000 every day, increasing the demand for food.
The UN predicts a global population of 9.6 billion by 2050. In this time the required rate of growth in food production is expected to exceed the actual rate of growth by 3-4%. This gap can be closed through improved trade and better yields.
2 Soil productivity
More intense agriculture is depleting soil fertility and increasing the importance of fertilizers.
Fertilizers are important for countering soil nutrient losses associated with intensive agriculture and shorter fallow periods. However, to increase yields further, there is widespread recognition that improved management practices, advanced fertilizers and more precise application will be required.
5
4
3
2
1
0
TOTAL POPULATION (millions)
1950
1960
1970
1980
2010
1990
2000
E2020
E2030
E2040
E2050
More developed countriesLess developed countries
200
150
100
50
0
GLOBAL FERTILIZER APPLICATION (MMT nutrients)
2000
2001
2002
2003
2006
2004
2005
2007
2008
2010
2009
2011
2012
2014
2013
Nitrogen (N) Phosphates (P2O5) Potash K2O
ARABLE LAND PER CAPITA
1960
1970
1980
1990
2000
2010
E2020
E2030
E2040
E2050
Population (billion) (left axis)
Arable land (hectacres per person) (right axis)
10
8
6
4
2
0
0.5
0.4
0.3
0.2
0.1
0

ST
RA
TE
GIC
RE
PO
RT
CO
RP
OR
AT
E G
OV
ER
NA
NC
EFIN
AN
CIA
L STA
TE
ME
NT
S
EuroChem Annual Report and Accounts 2014 17
ST
RA
TE
GIC
RE
PO
RT
CO
RP
OR
AT
E G
OV
ER
NA
NC
EFIN
AN
CIA
L STA
TE
ME
NT
S
4 Weather shocks
Extreme weather shocks can influence global crop productivity and prices.
Over the past ten years, extreme weather incidents such as drought and flooding have exerted more influence in major food-producing countries. This has been one factor contributing to a general rise and volatility in crop prices. Any growth in the frequency and intensity of such shocks will have an impact on agricultural productivity and associated techniques.
GLOBAL BIOFUEL PRODUCTION (Million tonnes oil equivalent)
1990
1995
2000
2005
E2015
2010
2013
E2020
E2025
E2030
E2035
North America South & Central AmericaEurope & Eurasia Middle East Africa Asia Pacific
7.1 9.0 9.219.7
59.6 65.3 68.382.1
99.4113.9
132.1
Sources: World Bank, UN, FAOSTAT, BP, EuroChem estimates
3 Food price volatility
After a steady decline up to 2000, food prices have been more volatile since.
The FAO expects food prices to generally rise over the next ten years thanks to continued population and economic growth and increased use of biofuels. Energy price volatility and natural resource constraints will also challenge food producers. Despite this, the potential exists to raise crop productivity through new materials and technologies.
500
400
300
200
100
0
GNI PER CAPITA GROWTH DYNAMIC (%)
2000
2001
2002
2003
2006
2004
2005
2007
2008
2010
2009
2011
2012
2013
BrazilChinaEuropean Union
IndiaRussian FederationUnited States
6 Crop substitution
Energy policies driven by GHG reductions are creating a higher demand for biomass based energy and fuels.
Renewable energy targets set for 2020 across the EU require growth in the use of biomass as a source of electricity and heat. In addition, global demand for biofuels for road transportation will grow from 32.4 billion gallons in 2013 to 51.1 billion gallons by 2022. This trend is changing land use and patterns of fertilizer demand.
5 Changing diets
Growing global prosperity is leading to greater demands for protein-rich foods.
Growing prosperity is leading to a demand for protein-rich foods such as red meat, poultry and dairy products which are more resource intensive to produce. At the same time, the overall amount of food consumed and wasted has also increased in the developed world.
3,000
2,500
2,000
1,500
1,000
500
0
CHANGING DIETS (kilocalories per capita/day)
1964-66 1997-99 2030
RiceWheatOther cereals
Vegetable oilsSugarMeat
Roots and tubersPulsesOther
140120100806040200
PER CAPITA MEAT CONSUMPTION (PPP dollars)
5,000
China
Brazil
Thailand
India
US
Japan
RussianFederation
0
10,00
0
15,00
0
25,00
0
35,00
0
20,00
0
30,00
0
40,00
0

...the fundamental drivers of a growing population and associated demand for food and nutrients remain strong.”Dmitry StrezhnevChief Executive Officer
18 EuroChem Annual Report and Accounts 2014
CHIEF EXECUTIVE’S REVIEW
We made significant advances with our reserves in Russia and Kazakhstan and continued to invest in our manufacturing capability, including a joint venture in China to produce NPK products. At the same time, we announced a corporate reorganization involving the creation of EuroChem Group AG, domiciled in Switzerland, which should support our ability to grow our business internationally and increase our flexibility in financial and banking markets.
Our growth plan is underpinned by a low cost base and vertically integrated model, which gives us greater control over raw materials and energy inputs, manufacturing technologies, distribution and sales. This offers a high level of cost control and flexibility to respond to market demands across a range of commodity and specialty products. We have a robust investment process that is supported by a strong track record of executing large-scale construction and M&A projects.
RESULTS AND OPERATIONAL UPDATEAgainst a backdrop of mixed market conditions our consolidated revenues for the year were US$ 5.09 billion (RUB 193 billion), or 8% lower than in 2013. However, our international footprint and flexible cost base, allied to currency movements, supported full-year EBITDA which was 12% higher year-on-year at US$ 1.51 billion. Carried by a strong fourth quarter performance, our EBITDA margin for the year reached 30%, as compared to 24% in 2013.
Sales of 10.6 million tonnes (MMT) of EuroChem-produced nitrogen and phosphate products, excluding raw materials and hydrocarbons, were 11% higher than 2013. This was complemented by 1.6 MMT of fertilizer sales sourced from third parties. Other products encountered weaker market conditions, and sales of iron ore, a co-product of phosphate rock beneficiation operations at the Kovdorskiy mine, declined by 8% to 5.5 MMT.
Our distribution platform continued to perform well and we grew our sales in Europe by 6% compared to 2013. With strong production figures from our operations in Belgium allied to excellent market coverage from our EuroChem Agro distribution platform, the European market contributed US$ 1.9 billion to Group sales in 2014.
Driving valueWe have made progress in a number of key areas in 2014 and delivered a solid performance while strengthening our position as a leading international agrochemical business.

ST
RA
TE
GIC
RE
PO
RT
CO
RP
OR
AT
E G
OV
ER
NA
NC
EFIN
AN
CIA
L STA
TE
ME
NT
S
EuroChem Annual Report and Accounts 2014 19
The Russian market remained stable at US$ 1 billion while sales in the rest of the CIS declined to US$ 313 million (from US$ 447 million in 2013), chiefly due to developments in Ukraine. A slow-down in sales to Asia was a reflection of softer demand for iron ore and associated pricing.
While sales were stable, the influence of changes in the value of the Russian rouble resulted in a 13% reduction in the Group’s cost of sales. Raw materials costs were lower, decreasing by 9% to US$ 1.4 billion compared to 2013.
We have completed a raft of key projects and made good progress with others during 2014. A significant milestone was reached in Kazakhstan, with the commencement of phosphate rock extraction at our Kok-Jon deposit. Our investments in upgrading and modernization bore fruit with our melamine plant at Nevinnomysskiy Azot, which came online in 2012, now running at full capacity of up to 50 thousand tonnes (KMT) per year. As well, we ended the year with the completion of our ammonia reconstruction program which increased Nevinnomysskiy’s ammonia capacity by 10% to 1,980 KMT per day.
Our project to open a new ore body at Kovdorskiy, in order to increase apatite production, progressed well and will be completed in the coming months.
Shaft sinking continued apace at our two potash operations, with Skip Shaft #1 and cage shaft completed at Usolskiy. VolgaKaliy achieved a major milestone as Skip Shaft #1 passed the freezing zone, finishing 2014 at a depth of 849m. On both sites, significant progress was made with surface infrastructure, including commissioning of the electrical substation at VolgaKaliy and associated social infrastructure in the nearby town of Kotelnikovo. As we approach the operational phase of our potash operations, the US$ 2.4 billion invested to date has taken us closer to the opportunity of exploiting some of the world’s largest potash deposits. To ensure the sustainability of our potash ambitions, the Group secured further mineral rights in Russia in 2014. As at the end of 2014, we now have an estimated 11 billion tonnes of potash resources anchoring our growth plans.
While we were able to become up to 25% self-sufficient in gas supply, we took a further
step in diversifying our gas supplies by signing a six-year supply contract with Rosneft, which will satisfy more than 60% of our plant demand in Russia’s Tula region.
OUTLOOKWhile 2014 saw shifts in demand and prices, reflecting market dynamics in China and India, in particular, the fundamental drivers of a growing population and associated demand for food and nutrients remain strong. We will continue adapting our business model to reflect the evolving needs of our customers with the broadening of our specialized product offering and targeted R&D initiatives.
Our new operations in Kazakhstan and their production potential, coupled with our new capacity in China, give us better access to growth markets in Asia ahead of 2017, when potash production comes online. These developments, allied to our other investments in vertical integration, new technologies, distribution and product development allow us to quickly respond to short-term market shifts. This strength and flexibility will place us at the forefront of global fertilizer production over the next ten years.
11.4MMTFERTILIZER PRODUCTION
US$5.09bnTOTAL REVENUES

20 EuroChem Annual Report and Accounts 2014
The global industry
EuroChem is the only fertilizer major globally to have such a clear path to earnings growth over the next ten years, thanks to a highly competitive cost base and the arrival of potash as a further high-value revenue stream.
We have access to the second largest potash and phosphate rock reserves across our global peers and thanks to the depth of our vertical integration, we are also amongst the most competitive on the urea and DAP ‘delivered to market’ cost curves.
In potash, leading edge technology and unparalleled logistics are expected to turn our two greenfield projects into some of the world’s most competitive potash capacity.
Our vertically integrated, efficient, and flexible business model provides stable cash flows that will also afford us the opportunity to take advantage of consolidation trends in the industry.
PEER ANALYSIS
SELECTED RANKING BY NUTRIENT CAPACITY (MMT pa)
Ammonia (N)
Phosphoric Acid (P2O5)
K2O MOP, SOP, Other
PotashCorp
1 Once both potash projects and Baltic ammonia are online, excluding all other projects2 Including Solikamsk-2Sources: Company data, CRU, Fertecon, IFA as at end 2014
Mosaic
EUROCHEM1
Uralkali2
Yara
CF Industries
Agrium
Belaruskali
ICL
OCP
K+S
EUROCHEM
PhosAgro
IFFCO
Sabic/Safco
UralChem
TogliattiAzot
Acron
Group DF/Ostchem
14.2
13.7
9.4
8.0
7.3
6.7
6.3
4.8
4.7
4.3
4.6
3.7
3.5
3.4
3.2
3.0
2.6
2.6
1.9
45%
39%
25%
23%
17%
16%
15%
12%
11%
11%
11%
10%
8%
8%
7%
7%
5%
4%
3%
2%
Netherlands
Belgium
Russia
Ukraine
Ireland
Greece
Austria
Germany
Norway
Portugal
Spain
Italy
UK
Switzerland
Turkey
Cyprus
Demark
Finland
Sweden
France
2014 MARKET SHARE IN DOMESTIC MARKETS(EUROPE AND CIS)
PRODUCTION IN NUTRIENT CONTENT (MMT pa)
2009 2014 2019 10-year CAGR
EuroChemN 2.3 2.8 2.8 1.9%P2O5 0.9 1.1 1.1 2.3%K2O 0.1 0.2 2.0 34.7%Total EuroChem* 3.3 4.1 5.9 5.9%WorldN 101.0 111.8 118.9 1.6%P2O5 36.0 41.6 46.5 2.6%K2O 22.6 30.6 40.6 6.0%Total World** 159.6 184.0 205.9 2.6%EuroChem Market Share 2.1% 2.2% 2.8%
* Without LDAN, feed phosphates and EuroChem’s phosphate project in Kazakhstan** Production of fertilizers consuming in agriculture Sources: Company data, CRU, Fertecon, IFA

EuroChem Annual Report and Accounts 2014 21
LTM Peer comparison
REVENUE (US$m)
Uralkali1
Acron2
UralChem2
PhosAgro2
Yara1
EUROCHEM1
CF Industries1
K+S1
Mosaic1
PotashCorp1
Agrium1
ICL1
16,042
15,134
9,056
7,115
6,111
5,077
5,088
4,743
3,559
3,178
1,986
1,974
CASH FROM OPERATIONS (US$m)
ICL1
UralChem2
Acron2
PhosAgro2
Mosaic1
Agrium1
K+S1
EUROCHEM1
CF Industries1
Uralkali1
PotashCorp1
Yara1
2,614
2,294
1,409
1,380
1,366
964
1,312
939
895
698
595
241
CAPEX (US$m)
PhosAgro2
Acron2
UralChem2
Uralkali1
CF Industries1
EUROCHEM1
ICL1
Mosaic1
K+S1
PotashCorp1
Agrium1
Yara1
2,021
1,809
1,532
1,138
1,114
929
1,102
752
482
349
335
122
NET DEBT/EBITDA (x)
ICL1
Agrium1
UralChem2
Acron2
Yara1
EUROCHEM1
K+S1
Uralkali1
CF Industries1
PotashCorp1
Mosaic1
PhosAgro2
0.71
0.72
0.94
1.30
1.49
1.80
1.77
1.90
1.98
2.47
2.49
8.15
EBITDA (US$m)
K+S1
UralChem2
Acron2
PhosAgro2
CF Industries1
Agrium1
ICL1
EUROCHEM1
Yara1
Mosaic1
PotashCorp1
Uralkali1
3,049
2,712
2,604
2,063
1,784
1,513
1,748
1,344
1,190
863
601
454
EBITDA MARGIN (%)
Mosaic1
Yara1
Agrium1
ICL1
Uralkali1
PhosAgro2
Acron2
K+S1
PotashCorp1
UralChem2
CF Industries1
EUROCHEM1
57%
50%
43%
30%
30%
23%
27%
23%
23%
22%
17%
11%
PRODUCT CAPACITY (MMT of nutrients)
Uralchem
Acron
PhosAgro
IFFCO
CF Industries
Sabic/Safco
EUROCHEM
TogliattiAzot
OCI
PotashCorp
Group DF/Ostchem
Mosaic
Yara
Agrium
Qafco
7.0
6.7
3.4
3.3
2.9
2.9
2.6
2.7
2.8
2.5
2.3
2.3
1.9
1.0
0.4
NitrogenNPRODUCT CAPACITY (MMT of nutrients)
Sabic/Safco
UralChem
Group DF/Ostchem
Yara
OCP
EUROCHEM
ICL
Agrium
PhosAgro
PotashCorp
Mosaic
IFFCO
5.3
4.7
1.9
1.9
1.3
Sinochem 1.0
Vale Fertilizantes 1.3
GCT 1.6
0.7
1.2
0.6
0.4
0.3
0.3
0.1
PhosphatesPPRODUCT CAPACITY (MMT of nutrients)
Uralkali
K+S
SQM
ICL
Mosaic
Belaruskali
PotashCorp
EUROCHEM
8.9
8.0
8.0
6.3
5.0
4.0
4.3
1.7
Agrium
APC 1.4
1.2
PotashK
Note: Figures may not recalculate exactly due to rounding. Percentage changes are calculated based on whole numbers, not the rounded numbers presented.
1 Twelve months ended 31 December 2014 2 Twelve months ended 30 September 2014

KEY SEGMENT:
STRONG ROOT AND SOIL QUALITY
HEALTHIER STEMDEVELOPMENT
ROBUSTSHOOT
GROWTH
(N) Nitrogen
22 EuroChem Annual Report and Accounts 2014
INCREASINGCROP STRENGTH
8.9MMTOF NITROGEN FERTILIZER CAPACITY
3.0MMTOF AMMONIA CAPACITY

23 EuroChem Annual Report and Accounts 2014
our owned transhipment operations at the ports of Tuapse and Murmansk in Russia and Sillamäe in Estonia. We also have plans to potentially increase our cargo and transhipment capacity as our potash production comes online.
SALES AND DISTRIBUTIONOur customers benefit from a global network of sales and support offices operated by EuroChem Agro. We have three trading centers in the USA, Switzerland and Brazil, alongside storage facilities in Russia, the CIS, Europe, North America and Mexico. EuroChem Agro supports wholesalers, distributors and co-operatives across Europe, South East Asia and the Americas. Our distribution centers in Russia, Ukraine and Belarus advise farmers on improving crop yields while controlling and optimizing their use of fertilizers.
RAW MATERIALSOur reserve base includes natural gas, apatite ore, iron ore and potash.
Natural gas is the key constituent of ammonia, the primary component of nitrogen-based fertilizers. We buy some 75% of our gas requirements from the market and have acquired our own operator, Severneft-Urengoy, to produce the remaining 25% of our total annual needs. The weakening of the Russian rouble has considerably lowered the cost of Severneft-Urengoy gas in US dollar terms. Delivered to Novomoskovskiy Azot, as of January 2015, the cost of natural gas from Severneft-Urengoy had decreased to approximately $1.80/mmBtu.
We have access to significant reserves of magnetite-apatite ores (high-quality phosphate rock) in Russia and phosphate rock in Kazakhstan. As a considerable addition to our phosphate segment performance, we also extract baddeleyite and iron ore concentrates as coproducts of apatite beneficiation. We sell both these products on the market, historically to Asian to Russian customers.
We have invested in some of the world’s biggest reserves of potash in Russia. When our two main sites come on stream, we will be one of only four fertilizer producers globally to produce nitrogen, phosphate and potash based fertilizers.
PRODUCTIONWe own and operate plants in Russia, Belgium, Lithuania and China and create more than 100 commodity and specialty products including an extensive mix of nitrogen, phosphates and complex fertilizers, acids, gases, de-icing agents, organic synthesis products and mineral raw materials. These geographically and technically diversified assets and their associated
product mix allow us to respond rapidly to changing market demand, offering competitive advantages in global markets.
Our manufacturing processes also allow us to create other products such as melamine and merchant-grade synthetic acetic acid. We also produce animal feed phosphate, which is an important supplement for cattle, chicken and pigs. EuroChem is the world’s only producer of baddeleyiteconcentrate, which is used in the production of refractories and electroceramics. As well, it is the only producer of melamine, which has a wide application in the construction and automotive industries in Russia.
LOGISTICSWe own and operate rolling stock and our own Panamax-class ocean going cargo vessels. These are linked to
ADDING VALUE...
...through low-cost vertical integrationOur world-class reserves underpin advanced, cost-efficient and flexible production capacity, allied to logistics and distribution assets that provide distinct cost advantages and economies of scale.
KEY PRODUCTION (MMT)*
2011 20142010 20132012
24.9 24.928.0 29.1 29.8
Ammonia Mining
+4.8 million tonnes of fertilizers
Fertilizers Others *excluding hydrocarbons
RAW MATERIAL RESOURCE BASE
Reserves Resources Total
Natural gas (bcm) 272 313 585Phosphate rock (MMT) 2,468 1,771 4,239Potash (MMT) 3,194 7,097 10,291Gas condensate (MMT) 27 173 200Oil (MMT) 27 29 56Sulphur (MMT) 91 0 91
According to Russian reserves classification.

03
02
01
07
07
07
RESOURCE BASE
01 PHOSPHATE ROCK RESERVES
Phosphate ore, produced by mining apatite and phosphate rock, is the key ingredient for phosphate fertilizers.
With our Kovdorskiy operations at full capacity, we are in the process of expanding the open pit to increase annual capacity. In parallel to this mine pushback, we have been developing a deposit in Kazakhstan.
We are currently 75% self-sufficient in phosphate rock and expect to close this gap as we increase output at our mining facility in Kazakhstan. As of 2014, we had 4.2 billion tonnes of phosphate rock reserves and resources.
STRATEGY & RISK MITIGATION
• Attain self-sufficiency in phosphate rock
• Given the proximity to Asian markets and the availability of energy and sulphur, the Kazakhstan site can potentially be developed to include a chemical and fertilizer plant
• Perform HSE audit at mining sites, further tightening of OHSA requirements
• Potential switch to underground mining at Kovdorskiy to increase output and mine life
RISKS
• For phosphates and iron ore, new capacity can change the supply-demand balance and pricing
• Mining operations are high-risk environments which expose workers to potential safety and health hazards
STRATEGY & RISK MITIGATION
• Use best-in-class technology to build mine and shafts
• Maximize use of technology and logistics assets to have one of the lowest ‘delivered costs’ for potash
• Maximize usage of potash within the Group for the production of SOP, NPK, NK, etc
• Maximize returns on potash investments via a controlled market entry and participation
RISKS
• Shaft sinking
• Water inflow/subsidence
• Deteriorating market conditions may affect the investment case
• Technical challenges associated with underground mining operations
• New capacity leading to over-supply
• HSE hazards during construction phase
STRATEGY & RISK MITIGATION
• Long-term supply agreements and continued review of owned capacity
• Add value to coproducts before bringing them to market
• Minimize energy losses during transformation stage
RISKS
• Alternative gas supplies elsewhere or rising prices in Russia can reduce the energy cost advantage
• Reliance on third parties and applicable legislation for gas transportation
02 POTASH RESERVES
Potash is a mineral that can be extracted by mining natural reserves.
We have secured rights to over 10 billion tonnes of potash reserves and resources in Russia.
Our two key potash assets are our future facilities at the Gremyachinskoe deposit in the Volgograd region and the Verkhnekamskoe deposit in the Perm region. Both are currently scheduled to commence operations in 2017 and are widely expected to be amongst the lowest cost potash operations globally.
03 HYDROCARBON RESERVES
Natural gas can account for more than 90% of the cost of ammonia, the main component in nitrogen fertilizers. We benefit from low natural gas prices in Russia, but our cost competitiveness is enhanced by our own hydrocarbon deposits and natural gas operation in Novy Urengoy. This currently supplies 25% of our total natural gas requirements.
Our total reserves and resources consist of over 585 bcm of natural gas, 200 MMT of condensate and 56 MMT of oil.

04
05
07
06
PRODUCTION AND DISTRIBUTION
STRATEGY & RISK MITIGATION
• Ongoing investment in new and upgraded equipment
• Broadening of phosphate fertilizer mix with the addition of specialized products
• Investment in new phosphate mining operations in Kazakhstan and increasing capacity at Kovdorskiy GOK
RISKS
• Transportation costs from phosphate rock sources and ongoing transition from older, less efficient equipment
• Reliance on third-party supply of phosphate rock
STRATEGY & RISK MITIGATION
• Ongoing investment in new and upgraded equipment, including to reduce the gas/ammonia ratio, and launching new ammonia production in low gas cost regions
• Proactive engagement with the community and its stakeholders prior to, during and after large-scale construction projects. Use of the best available technology to reduce the environmental impact and increase health and safety aspects
• Launch production of higher-value-added and premium specialty products
RISKS
• New ammonia capacity in lower-cost regions may alter supply-demand unfavorably
• In addition to construction risks, new large-scale ammonia projects carry social risks, including risks of being delayed or stopped due to community and environmental activists
STRATEGY & RISK MITIGATION
• Expand product mix to meet demand across markets
• R&D development to accompany the evolution of customer needs
• Increase warehousing capacity to increase market flexibility
• Cash pooling of trade receivables to optimize cash management
RISKS
• Price volatility, intensified competition and currency risks can change market conditions
• The number of customers increases as we move further down the distribution chain and increases receivables/customer/credit/currency risks
04 PHOSPHATE FERTILIZER FACILITIES
Our manufacturing plants in Russia and Lithuania produce MAP, DAP, NP and feed phosphates as well as an increasing amount and mix of complex products. All our facilities have sulphuric acid capacity and phosphoric acid units. Our plant in Lithuania also produces aluminium fluoride which is used in the manufacture of aluminium, glass and optics as well as in the tanning industry.
As much as possible, our facilities utilize phosphate rock from our Kovdorskiy mine and we plan to soon begin intra-group shipments from our Kazakhstan mine.
05 NITROGEN FERTILIZER FACILITIES
Our three nitrogen plants produce mineral fertilizers such as urea, AN, UAN, CAN and a range of regular and tailored complex NPK grades. We are Russia’s only producer of melamine and also produce nitric acid, methanol and industrial gases such as argon, nitrogen, oxygen, carbon dioxide and solid carbon dioxide (dry ice).
06 DISTRIBUTION
Our customers benefit from a global network of sales and support offices operated by EuroChem Agro and our distribution centers in Russia, Ukraine and Belarus advise farmers on improving crop yields and optimizing their use of fertilizers.
REPAIR & MAINTENANCE
We benefit from dedicated servicing, repair and construction centers which also significantly contribute to the construction of our large-scale development projects.
RISKS
• Unplanned process issues, equipment failure or any stoppage of production can impact Group performance
STRATEGY & RISK MITIGATION
• Experienced and well trained maintenance teams use the latest technology and equipment
• In-house dedicated teams reduce repair costs while driving the specialization of crews

091008
1213
14
16
15
S
11
S
EuroChem Annual Report and Accounts 2014 26
LOGISTICS CORE PRODUCTS
STRATEGY & RISK MITIGATION
• Build and operate own port terminals and transhipment capacity as well as storage facilities
• Accurate planning of logistics within investment/project planning
• Automation of the routing/dispatch model
• JV with commodity traders in target markets aimed at sharing risks and reducing capital and transportation costs
RISKS
• Transport costs and price volatility
• Limited fertilizer transhipment capacity in Russia
• Limited warehousing capacity within port infrastructure
• Losses from empty railcars on return legs
07 LOGISTICS
To optimize and guarantee both raw material and final product flows (+29 MMT pa) we own and operate trucks, rolling stock and ocean going cargo vessels as well as port facilities in Russia and Estonia. We also operate a railcar depot to service the Group’s more than 6,400 railcars and locomotives.
08 UREA Most widely used dry
nitrogen fertilizer
09 AMMONIUM NITRATE Typically applied in solid form, it is
water soluble and can be used in various fertilizer solutions
10 CAN Produced by mixing calcium
and/or magnesium carbonate into an AN solution before solidifying
11 UAN Solution fertilizer, can be
applied via fertigation systems, for increased effectiveness
12 NPK Multi-nutrient, complex fertilizers
13 MAP, DAP Complex mineral
fertilizers consisting primarily of phosphorus
14 FEED Feed additive in the
cattle, poultry and swine industries
15 MELAMINE Plastics
16 IRON ORE Steelmaking
SOCIAL
We set ourselves high standards in relation to our people, the environment and communities.
INFRASTRUCTUREWe are building new communities to support our evolving potash projects and investing in local educational and health facilities.
HSEWe aim to be a safety exemplar by 2018. All of our production sites operate environmental and safety management systems in accordance with ISO 9001, ISO 14001 and OHSAS 18001.
CAREER AND PERSONAL DEVELOPMENTOur seven training centers deliver technical and management courses to more than half of our workforce each year.
HEALTHY LIFESTYLESOur corporate culture and systems encourage employees and their families to lead healthy lifestyles. We build ice sports and multi-sports facilities, sponsor youth teams and organize international hockey and soccer tournaments.
DEVELOPING TALENTOur career guidance system is built on a EuroChem-funded network of 29 school laboratories in seven Russian regions.
STRATEGY & RISK MITIGATION
• Working with a specialist HSE consultancy, we have defined a roadmap and are rolling out revised policies, procedures and associated technologies across all of our sites. We are on track to achieve our aim of being a HSE exemplar by 2018
• We continue to invest in education, training and professional development

KEY SEGMENT:
(P) Phosphates
OPEN TO SEE HOW WE ADD
VALUE
SUSTAININGSEASONAL
GROWTH
EXPANDING GROWTHWINDOW
ENHANCING NUTRITIONAL
VALUES
INCREASING CROP YIELD
EuroChem Annual Report and Accounts 2014 27
5.1MMTOF PHOSPHATE FERTILIZER & FEED CAPACITY
2.5MMTOF MAP/DAP CAPACITY
28 EuroChem Annual Report and Accounts 2014
Group performance
FINANCIAL HIGHLIGHTS FOR 2014
2014 2013% change
Y-o-YUS$m RUBbn US$m RUBbn
Revenue 5,088 193 5,556 177 (8%)Gross profit 2,014 77 2,014 64 –EBITDA 1,513 60 1,349 43 12%Cash from operations 964 38 1,137 36 (15%)
31 December 2014 31 December 2013
Net Debt/LTM1 EBITDA2 1.77x 2.02x
Russian rouble (RUB) figures are provided for the convenience of the reader and are not part of EuroChem Group AG audited financial statements. 1 Last twelve months2 Including net income from associates and joint ventures
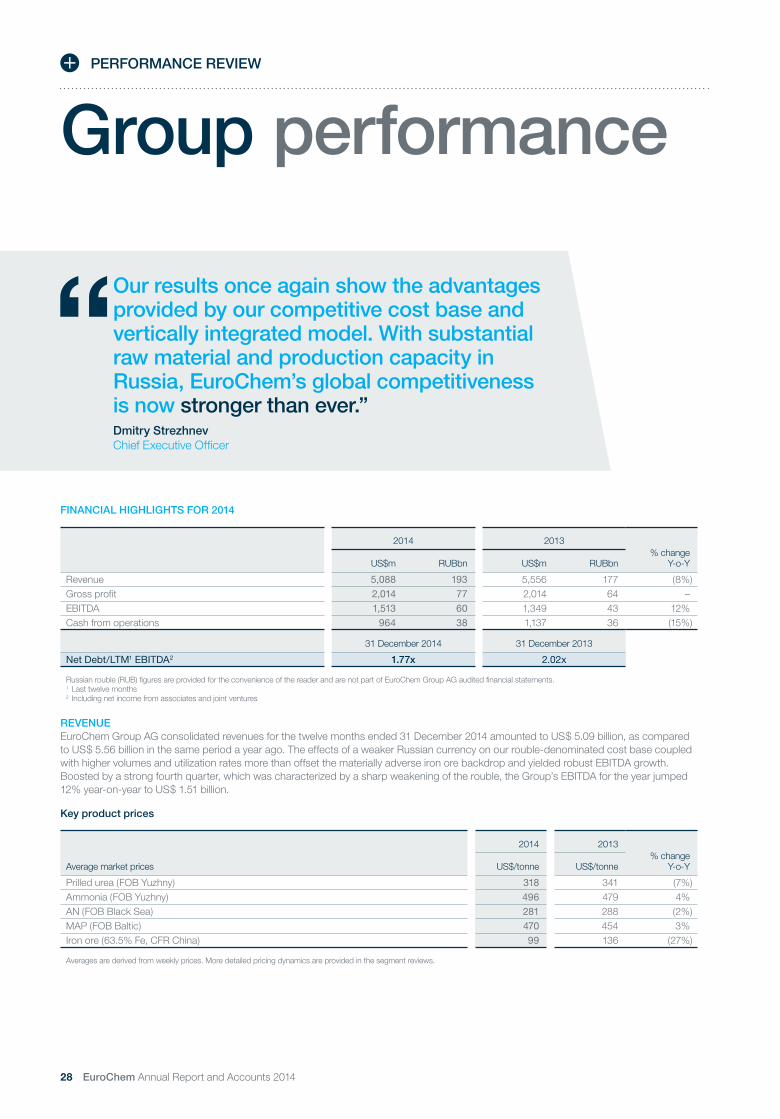
REVENUEEuroChem Group AG consolidated revenues for the twelve months ended 31 December 2014 amounted to US$ 5.09 billion, as compared to US$ 5.56 billion in the same period a year ago. The effects of a weaker Russian currency on our rouble-denominated cost base coupled with higher volumes and utilization rates more than offset the materially adverse iron ore backdrop and yielded robust EBITDA growth. Boosted by a strong fourth quarter, which was characterized by a sharp weakening of the rouble, the Group’s EBITDA for the year jumped 12% year-on-year to US$ 1.51 billion.
Key product prices
Average market prices
2014 2013% change
Y-o-YUS$/tonne US$/tonne
Prilled urea (FOB Yuzhny) 318 341 (7%)Ammonia (FOB Yuzhny) 496 479 4%AN (FOB Black Sea) 281 288 (2%)MAP (FOB Baltic) 470 454 3%Iron ore (63.5% Fe, CFR China) 99 136 (27%)
Averages are derived from weekly prices. More detailed pricing dynamics are provided in the segment reviews.
PERFORMANCE REVIEW
Our results once again show the advantages provided by our competitive cost base and vertically integrated model. With substantial raw material and production capacity in Russia, EuroChem’s global competitiveness is now stronger than ever.”Dmitry StrezhnevChief Executive Officer

ST
RA
TE
GIC
RE
PO
RT
CO
RP
OR
AT
E G
OV
ER
NA
NC
EFIN
AN
CIA
L STA
TE
ME
NT
S
EuroChem Annual Report and Accounts 2014 29
Total sales
2014 2013% change
Y-o-YUS$m US$m
Nitrogen 2,915 3,009 (3%)Phosphates 1,592 1,833 (13%)Potash – – n/aDistribution 2,315 1,834 26%Other 940 940 –Elimination (2,675) (2,061) n/aTotal 5,088 5,556 (8%)
EBITDA
2014 2013% change
Y-o-YUS$m US$m
Nitrogen 866 808 7%Phosphates 476 435 9%Potash (32) (24) n/aDistribution 90 87 4%Other 194 48 308%Elimination (82) (5) n/aTotal 1,513 1,349 12%
GEOGRAPHY OF SALESWith our distribution platform firmly in place we continued to grow our sales to Europe. For the full-year 2014, sales to Europe represented 38% of total Group sales, up 6 percentage points over the previous year. With production support from our operations in Belgium enhanced by the deep market coverage provided by our EuroChem Agro distribution platform, the European market contributed US$ 1.9 billion to Group sales in 2014. While the Russian market remained stable with contributions of US$ 1.0 billion to full-year revenues, sales from the CIS reflected the regional developments in neighboring Ukraine and declined to US$ 313 million, as compared to US$ 447 million a year earlier. The sharp decline in Group sales to Asia mirrored the global contraction in iron ore demand and pricing. Coming in US$ 302 million lower than a year ago, the Group’s sales to Asia declined 31% year-on-year to US$ 688 million.
Sales by region
2014 2013Percentage
points change
Europe 38% 32% 5Russia 20% 19% 1Asia 14% 18% (4)North America 10% 10% –Latin America 10% 9% 1CIS (excluding Russia) 6% 8% (2)Africa 2% 3% 0Australasia – 1% (1)
COST OF SALESWhile sales volumes remained stable, the significant exposure of the Group’s cost base to the Russian rouble resulted in a 13% reduction in cost of sales. For the full-year 2014, costs of sales amounted to US$ 3.1 billion, which was US$ 468 million lower than US$ 3.5 billion in 2013.
Raw materials costs, which accounted for 46% of costs in 2014 (2013: 44%), decreased 9% to US$ 1.4 billion. Cost of goods for resale declined 10% to US$ 387 million. The matching revenue from sales of third-party products amounted to US$ 439 million (2013: US$ 488 million).
SALES BY REGION (2014)
Europe (38%)
Russia (20%)
Asia (14%)
North America (10%)
CIS (excl. Russia) (6%)Africa (2%)Australasia (0%)
Latin America (10%)

30 EuroChem Annual Report and Accounts 2014
Group performance continued
Cost of sales structure
2014 2013% change
Y-o-YUS$m % of total US$m
Materials and components 2,010 65% 2,201 (9%)Labor 309 10% 343 (10%)Energy 222 7% 251 (12%)Depreciation of plants and equipment 219 7% 252 (13%)Utilities and fuel 123 4% 145 (15%)Changes in work in progress and finished goods (50) n/a 51 n/aOther costs 241 8% 298 (19%)Total 3,074 3,542 (13%)
Despite the implementation of tariff increases in the Russian power generation sector, with the bulk of our energy costs incurred in Russian roubles, the strengthening of the US dollar supported a US$ 29 million year-on-year decline in energy costs. Amounting to US$ 222 million, the Group’s energy costs for the 12-month period ended 31 December 2014 were 12% less than in 2013. In addition to the rouble effect, the Group also decreased energy expenses with the commissioning of additional internal power generation capacity at Phosphorit. As part of our upgrade of the facility’s sulphuric acid unit to 1 million tonnes per year, we expanded in-house power generation to 32 MW, allowing Phosphorit to become 71% self-sufficient, as compared to 37% in 2013.
Structure of materials and components
2014 2013% change
Y-o-YUS$m US$m
Natural gas 441 481 (8%)Sulphur 79 72 10%Apatite 260 320 (19%)Potassium chloride 68 79 (14%)Ammonia 413 424 (2%)Goods for resale 387 432 (10%)Other 363 396 (8%)Total 2,010 2,201 (9%)
Representing 10% of our total cost of sales, labor costs, including contributions to social funds, decreased 10% to US$ 309 million in 2014, as compared to US$ 343 million last year. While we had slight upward cost pressure following a salary indexation of 7% in Russia, on average, from January 2014, this was more than offset by the depreciation of the rouble, the euro and litas, which are the functional currencies of EuroChem Antwerpen and Lifosa respectively, against the US dollar.
DISTRIBUTION, GENERAL AND ADMINISTRATIVE EXPENSESFor the twelve-month period ended 31 December 2014, total distribution costs declined 13%, or by US$ 99 million, to US$ 694 million, as compared to US$ 793 million over the same period in 2013. Representing 75% of distribution costs, transportation costs amounted to US$ 521 million (2013: US$ 584 million). This 11% year-on-year decrease in transportation costs represented savings of US$ 63 million and was mainly generated by the combination of currency effects on railway expenses in Russia, which are rouble-based, and a switch in iron ore concentrate sales to FCA Kovdorskiy GOK delivery terms as opposed to DAP-Zabaikalsk (Sino-Russian border) previously. Additionally, we achieved further gains by optimizing our railcar planning.
Full-year general and administrative (G&A) expenses amounted to US$ 216 million, as compared to US$ 211 million during the same period a year ago. Labor costs accounted for 50% of G&A expenses and grew 10% to US$ 108 million as the Group increased staff to support EuroChem’s investment initiatives, including our Kazakhstan phosphate rock project, our railcar depot established to service part of the Group’s more than 6,400 rolling stock, and the two greenfield potash projects in Russia. Including social expenses, total Group-wide staff costs for the full-year 2014 were 6% lower year-on-year at US$ 487 million (2013: US$ 520 million).
PERFORMANCE REVIEW

ST
RA
TE
GIC
RE
PO
RT
CO
RP
OR
AT
E G
OV
ER
NA
NC
EFIN
AN
CIA
L STA
TE
ME
NT
S
EuroChem Annual Report and Accounts 2014 31
2014 2013% change
Y-o-YUS$m % of total US$m
DistributionTransportation 521 75% 584 (11%)Export duties 2 – 5 (56%)
Other distribution costs 170 25% 205 (17%)Subtotal Distribution 694 793 (13%)G&ALabor 108 50% 99 10%Audit, consulting and legal 25 12% 21 16%Provision for impairment of receivables 7 3% 4 97%Other G&A expenses 75 35% 87 (13%)Subtotal G&A 216 211 2%Other net operating (income)/expensesSponsorships 18 – 26 (33%)Foreign exchange (gain)/loss (120) – (12) n/aOther operating (income)/expenses, net (53) – (1) n/aSubtotal Other net operating (income)/expenses (156) 13 n/a
We recognized other operating income of US$ 156 million in 2014, against other operating expenses of US$ 13 million the previous year. The main items behind this reversal were operating foreign exchange gains of US$ 120 million (revaluation of foreign currency cash balances of the Group’s Russian subsidiaries) versus losses of US$ 12 million in 2013.
Below the operating profit line, we recognized unrealized financial foreign exchange losses of US$ 1.1 billion and unrealized financial losses from currency forwards and swaps of US$ 0.5 billion of a similar nature, as compared to losses of US$ 185 million in 2013. Both reflect the RUB 23.6 decline in value of the US$/RUB exchange rate during 2014 (from 32.7 to 56.3) on the mostly US$ denominated financial debt of the Group. At the end of 2014, out of a total financial debt of US$ 3.1 billion, US$ 3.0 billion was denominated in US$ either contractually or synthetically through swaps and forward contracts. As a matter of policy, the Group borrows in currencies for which expected net cash flows over the term of the borrowing materially exceed the amounts required to service and repay the debt.
Operating profit
2014 2013% change
Y-o-YUS$m/% US$m/%
Operating profit 1,260 997 26%Revenues 5,088 5,556 (8%)Operating profit margin 25% 18% 7 ppEBITDA margin 30% 24% 6 pp

32 EuroChem Annual Report and Accounts 2014
PERFORMANCE REVIEW
Group performance continued
BALANCE SHEETAs part of the re-domiciliation of the Group’s corporate headquarters, during the fourth quarter of 2014 we received consent from lenders and executed the novation of over 70% of external debt to EuroChem Group AG level (the new top holding company of the Group). Starting from 30 September 2014, the Group’s debt covenants are calculated with reference to the US$-denominated consolidated accounts of EuroChem Group AG. Given the sharp depreciation of the Russian rouble, as at 31 December 2014 the Group had a net debt (US$ 2.68 billion) to 12-month rolling EBITDA (US$ 1.51 billion) ratio of 1.77x.
In the fourth quarter of 2014, both S&P and Fitch Ratings assigned EuroChem Group AG a ‘BB’ rating with stable outlook and affirmed Russia-based MCC EuroChem, JSC at ‘BB’ with stable outlook. The ratings are underpinned by the Group’s high degree of self-sufficiency in raw materials, strong market presence in Europe and Russia, product diversification, and commitment to maintaining a moderate financial policy.
Working capital
2014 2013% change
Y-o-YUS$m US$m
Inventories 556 693 (20%)Including finished goods 261 293 (11%)Trade receivables 340 363 (6%)Other receivables and current assets 262 267 (2%)
Subtotal 1,158 1,323 (12%)Trade payables 199 261 (24%)Other accounts payable and current liabilities 251 355 (29%)Subtotal 450 616 (27%)Net working capital 708 707Finished goods, days 31 30Trade debtors, days 24 24Trade creditors, days 24 27
CASH FLOWGroup operating cash flow as per the financial statements was US$ 964 million as compared to US$ 1,137 million in 2013.
Total CAPEX spending for the year amounted to US$ 1.1 billion, of which US$ 439 million was allocated to the Group’s expansion into potash with the development of the VolgaKaliy and Usolskiy sites as well as work on new deposits. In nitrogen we invested US$ 340 million including, among others, such projects as the increase of ammonia capacity at Nevinnomysskiy Azot to 1,980 KMT per day and the installation of a low-density ammonium nitrate (LDAN) production line at the Group’s Novomoskovskiy Azot facility. We realized capital expenditures of US$ 282 million in phosphates, where investments were mainly directed at the development of a phosphate rock deposit in Kazakhstan and the expansion of the Kovdorskiy GOK mining area.
With around 60% of Group CAPEX denominated in roubles, the weakening of the Russian currency against the US dollar has significantly enhanced the economics of our investment projects in Russia. As for operational expenditures, given that approximately 40% of the Group’s OPEX is incurred in roubles, any prolonged currency weakness is expected to further decrease Group costs.
2014 2013
US$m US$m
Nitrogen 340 326Phosphate 282 271Potash 439 388Distribution 5 3Other 36 36Total 1,102 1,024
PROJECT FINANCEIn August 2014, the Group signed a US$ 750 million non-recourse project finance facility agreement for the financing of its Usolskiy potash project located in Russia’s Perm region. Given its non-recourse nature and in accordance with debt documentation, this facility will be excluded from financial covenants calculations and will be represented as a separate line on the balance sheet. In January 2015, the Group utilized the first loan under the Project Finance facility for an amount of US$ 39.9 million.
CAPEX
Nitrogen (31%)
Phosphate (26%)
Potash (40%)
Other (3%)Distribution (<1%)

ST
RA
TE
GIC
RE
PO
RT
CO
RP
OR
AT
E G
OV
ER
NA
NC
EFIN
AN
CIA
L STA
TE
ME
NT
S
EuroChem Annual Report and Accounts 2014 33
Nitrogen — includes the production and sale of nitrogen mineral fertilizers and organic synthesis products and the extraction of hydrocarbons (natural gas and gas condensate) where natural gas is used as the raw material for the production of nitrogen fertilizers and gas condensate is sold.
EuroChem is one of the world’s largest producers of nitrogen-based fertilizers and organic synthesis products, with an ammonia capacity of 3.0 MMT pa. In 2014, nitrogen sales volumes increased by 122 thousand tonnes (KMT) to 8,339 KMT. Full-year revenues were 3% lower than 2013, but the devaluation of the Russian rouble and continued access to low-cost gas supplies boosted segment EBITDA by 7% to US$ 866 million.
More information on our nitrogen segment can be found on pages 34-37
Phosphates — includes the production and sale of phosphate mineral fertilizers and the extraction of ores to produce and subsequently sell baddeleyite and iron ore concentrates.
EuroChem mines and processes high-quality phosphate rock and manufactures MAP, DAP, NP and a range of feed phosphate products. Our 2014 phosphates sales volumes of 2,277 KMT of product were 6% lower year-on-year, due to higher consumption of apatite rock output by our manufacturing operations and slightly lower NP sales. Despite higher MAP/DAP values, lower iron ore prices and volumes resulted in a 13% reduction in segment revenues to US$ 1.6 billion. However, a weaker Russian rouble supported lower phosphates costs and lifted full-year EBITDA by 9% to US$ 476 million.
More information on our phosphate segment can be found on pages 38-43
Potash — currently represents the development of potassium salts (potash) deposits. No sales have been recorded to date in this segment. We currently have access to over three billion tonnes of potash reserves in two key deposits in Russia and are conducting geological work on other deposits to which we have secured mining rights. Once on stream, our two ongoing potash projects will have over 8.3 MMT KCI (5.0 MMT K2O) of capacity, which is equivalent to approximately 10% of current global supply. The development of potash capacity is one of our main strategic priorities.
We are constructing mining and processing facilities at two locations in Russia; at the Gremyachinskoe deposit (EuroChem-VolgaKaliy, Volgograd region) and at the Verkhnekamskoe deposit (EuroChem Usolskiy, Perm region).
As of 31 December 2014, the Group had spent an aggregate total of US$ 2.4 billion on its two potash projects. While we manage potash as a separate segment, we will generate and report on revenues once the projects come on stream.
More information on our potash segment can be found on pages 44-47
Distribution — the Group’s distribution segment is comprised of retail sales of EuroChem fertilizers, as well as third-party lines such as ammonium sulphate (AS), seeds and crop protection products, via a distribution network comprising distribution centers located in Russia and the CIS and sales offices located in Germany, Spain, Italy, Greece, France, Turkey, Mexico, Singapore and China.
Full-year distribution revenues rose by 26% to US$ 2.3 billion, compared to 2013. While less pronounced than in other segments, the devaluation of the Russian rouble contributed to an EBITDA increase of 4% year-on-year to US$ 90 million.
More information on our distribution segment can be found on pages 48-49
The remaining part of the Group represents certain logistics and service activities, central management, investment income and other items.
Reporting segments The Group has four reportable operating segments identified by management as Nitrogen, Phosphates, Potash, and Distribution.
34 EuroChem Annual Report and Accounts 2014
PERFORMANCE REVIEW
MARKET DRIVERSDespite an unfavorable environment for spring planting across key agricultural regions, ideal summer growing conditions led to high grain yields in 2014. Expectations of a bumper crop applied constant pressure to soft commodity prices with rice depressed by 25%, soybeans by 20% and corn by 4%, compared to the previous year, according to CBOT data. Notwithstanding, increasing acreage and fertilizer affordability underpinned higher application rates by incentivizing farmers to maximize yields in light of lower crop prices.
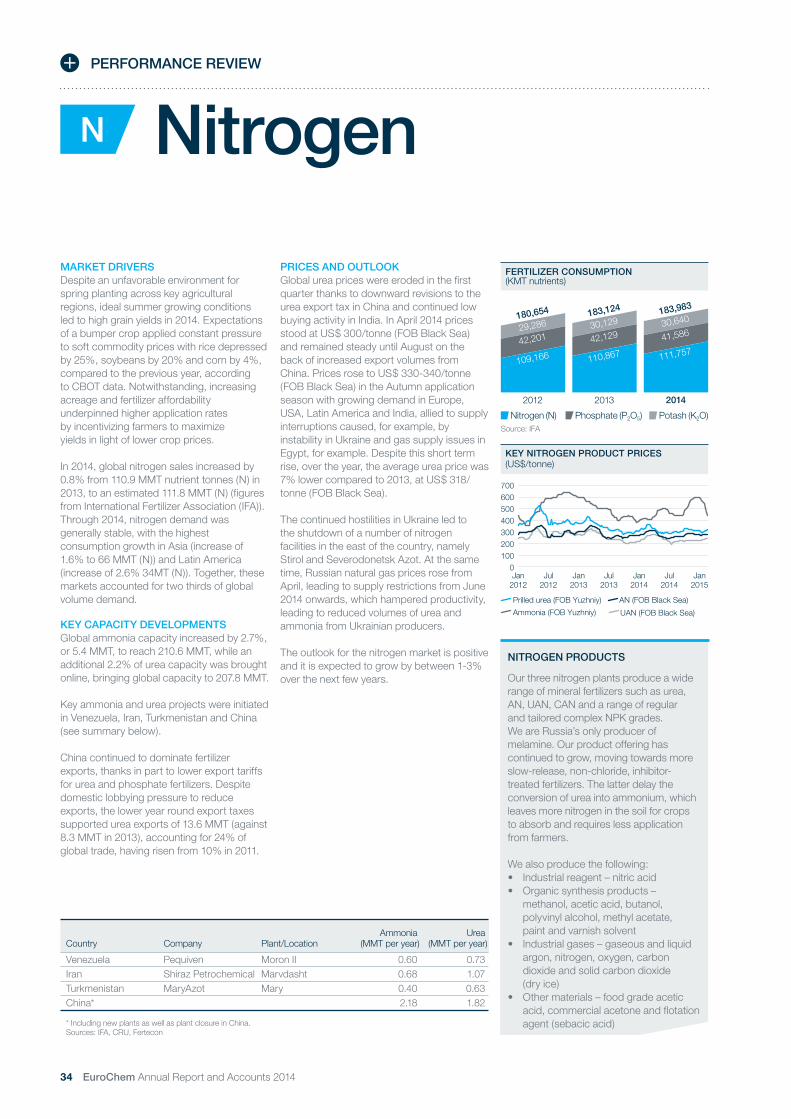
In 2014, global nitrogen sales increased by 0.8% from 110.9 MMT nutrient tonnes (N) in 2013, to an estimated 111.8 MMT (N) (figures from International Fertilizer Association (IFA)). Through 2014, nitrogen demand was generally stable, with the highest consumption growth in Asia (increase of 1.6% to 66 MMT (N)) and Latin America (increase of 2.6% 34MT (N)). Together, these markets accounted for two thirds of global volume demand.
KEY CAPACITY DEVELOPMENTSGlobal ammonia capacity increased by 2.7%, or 5.4 MMT, to reach 210.6 MMT, while an additional 2.2% of urea capacity was brought online, bringing global capacity to 207.8 MMT.
Key ammonia and urea projects were initiated in Venezuela, Iran, Turkmenistan and China (see summary below).
China continued to dominate fertilizer exports, thanks in part to lower export tariffs for urea and phosphate fertilizers. Despite domestic lobbying pressure to reduce exports, the lower year round export taxes supported urea exports of 13.6 MMT (against 8.3 MMT in 2013), accounting for 24% of global trade, having risen from 10% in 2011.
PRICES AND OUTLOOKGlobal urea prices were eroded in the first quarter thanks to downward revisions to the urea export tax in China and continued low buying activity in India. In April 2014 prices stood at US$ 300/tonne (FOB Black Sea) and remained steady until August on the back of increased export volumes from China. Prices rose to US$ 330-340/tonne (FOB Black Sea) in the Autumn application season with growing demand in Europe, USA, Latin America and India, allied to supply interruptions caused, for example, by instability in Ukraine and gas supply issues in Egypt, for example. Despite this short term rise, over the year, the average urea price was 7% lower compared to 2013, at US$ 318/tonne (FOB Black Sea).
The continued hostilities in Ukraine led to the shutdown of a number of nitrogen facilities in the east of the country, namely Stirol and Severodonetsk Azot. At the same time, Russian natural gas prices rose from April, leading to supply restrictions from June 2014 onwards, which hampered productivity, leading to reduced volumes of urea and ammonia from Ukrainian producers.
The outlook for the nitrogen market is positive and it is expected to grow by between 1-3% over the next few years.
NitrogenN
KEY NITROGEN PRODUCT PRICES (US$/tonne)
Jan2012
Jul2012
Jan2013
Jul2013
Jan2015
Jan2014
Jul2014
Prilled urea (FOB Yuzhniy) AN (FOB Black Sea)
UAN (FOB Black Sea)Ammonia (FOB Yuzhniy)
700600500400300200100
0
Country Company Plant/LocationAmmonia
(MMT per year)Urea
(MMT per year)
Venezuela Pequiven Moron II 0.60 0.73Iran Shiraz Petrochemical Marvdasht 0.68 1.07Turkmenistan MaryAzot Mary 0.40 0.63China* 2.18 1.82
* Including new plants as well as plant closure in China.Sources: IFA, CRU, Fertecon
FERTILIZER CONSUMPTION (KMT nutrients)
2013 20142012
109,166
42,20129,286180,654
110,867
42,12930,129183,124
111,757
41,58630,640183,983
Source: IFA
Nitrogen (N) Phosphate (P2O5) Potash (K2O)
NITROGEN PRODUCTS
Our three nitrogen plants produce a wide range of mineral fertilizers such as urea, AN, UAN, CAN and a range of regular and tailored complex NPK grades. We are Russia’s only producer of melamine. Our product offering has continued to grow, moving towards more slow-release, non-chloride, inhibitor-treated fertilizers. The latter delay the conversion of urea into ammonium, which leaves more nitrogen in the soil for crops to absorb and requires less application from farmers.
We also produce the following: • Industrial reagent – nitric acid • Organic synthesis products –
methanol, acetic acid, butanol, polyvinyl alcohol, methyl acetate, paint and varnish solvent
• Industrial gases – gaseous and liquid argon, nitrogen, oxygen, carbon dioxide and solid carbon dioxide (dry ice)
• Other materials – food grade acetic acid, commercial acetone and flotation agent (sebacic acid)

ST
RA
TE
GIC
RE
PO
RT
CO
RP
OR
AT
E G
OV
ER
NA
NC
EFIN
AN
CIA
L STA
TE
ME
NT
S
EuroChem Annual Report and Accounts 2014 35
GLOBAL UREA EXPORT COST CURVE (2015)
10 2 4 6 8 10 12 143 5 7 9 11 13 15
(MMT)
Ure
a co
st o
n D
DP
bas
is (U
S$/
tonn
e)
600
500
400
300
200
100
0
NEV AzotNAK Azot
CFR India = US$ 300
FOB Yuzhny = US$ 320
NATURAL GAS RESERVESAND AMMONIA CAPACITY
1,300
13
United States (5%)
12
6
Ukraine (<1%)
5
Canada (1%)
21
European Union (1%)
7
North Africa (4%)
15
Russia (17%)
71
China (2%)
1
2
3
4
Ammonia capacity (MMT pa)
18
Middle East (43%)
15
India (1%)
19
South East Asia (6%)
South &Central America (4%)
Source: BP Statistical Review of World Energy 2014
1 Novomoskovskiy Azot 2 Nevinnomysskiy Azot 3 EuroChem Antwerpen
4 Severneft-Urengoy
CAPACITY BY PRODUCT (KMT PA)
1,810Ammonia
1,640Urea
1,800AN/AN (gran)
450UAN
420CAN
CAPACITY BY PRODUCT (KMT PA)
1,250NPK/NP
1,150CAN/AN (gran)
CAPACITY BY PRODUCT
1.1Natural gas (billion m3)
220Gas condensate (KMT pa)
PROVEN AND PROBABLE RESERVES
50Natural gas (billion m3)
32Oil (KMT pa)
CAPACITY BY PRODUCT (KMT PA)
1,160Ammonia
930Urea
1,420AN
1,020UAN
460NPK
50Melamine
COST COMPETITIVENESS
Depending on its cost, natural gas accounts for up to 90% of the cost of producing ammonia, which is the foundation of all nitrogen fertilizers. While we benefit from low natural gas prices in Russia, our cost competitiveness is also enhanced by our wholly-owned hydrocarbon deposits and natural gas production operation in Novy Urengoy (Yamalo-Nenets Autonomous Region). This has a capacity of 1.1 billion m3 of gas and 220 KMT of gas condensate and currently supplies 25% of our total natural gas requirements.

36 EuroChem Annual Report and Accounts 2014
SEGMENT PERFORMANCEEuroChem is one of the world’s largest producers of nitrogen-based fertilizers and organic synthesis products, with an ammonia capacity of 3.0 MMT pa.
Our main nitrogen operations are: • Novomoskovskiy Azot (Russia) • Nevinnomysskiy Azot (Russia) • EuroChem Antwerpen (Belgium)
Full-year nitrogen sales volumes increased by 121 thousand tonnes (KMT) to 8,339 KMT. While we registered slight declines in urea, AN and UAN, which together retreated 138 KMT year-on-year, our sales efforts in calcium ammonium nitrate (CAN) continued to deliver solid growth. From 757 KMT in 2012 to 959 KMT in 2013, CAN sales volumes increased a further 26% to reach 1,206 KMT in 2014. The 4% pullback in AN volumes was the result of the reconfiguration of production units at Novomoskovskiy Azot in favor of higher-margin CAN production. The lower urea and UAN sales volumes, which declined 2% and 7% respectively, were primarily incurred as we shifted deliveries within the CIS.
Although sales volumes improved, lower year-on-year average prices for key nitrogen products led to a slight decline in segment revenues. Full-year nitrogen revenues of US$ 2.9 billion were 3% behind the US$ 3 billion recorded in 2013. The devaluation of Russian rouble against the US dollar and the ensuing positive effects on our nitrogen cost base boosted segment EBITDA by 7% to US$ 866 million.
While the Group’s nitrogen operations in Belgium require ammonia to be sourced from the market, our operations in Russia benefit from integrated ammonia capacity as well as captive natural gas production further upstream. In Russia, natural gas prices remained unchanged in rouble terms following the introduction of a series of pricing reviews in late 2013. However, the weakening
of the local currency against the US dollar yielded lower average natural gas prices in US$/mmBtu. For example, in January 2015, the average US$/RUB exchange rate of 62, meant that our Novomoskovskiy Azot nitrogen fertilizer facility paid US$ 2.11/mmBtu for natural gas, while further south our Nevinnomysskiy Azot facility paid US$ 2.23/mmBtu.
For the full-year 2014, benchmark natural gas hubs had average prices of US$ 4.35/mmBtu in the US (Henry Hub) and US$ 8.38/mmBtu in Western Europe (Zeebrugge)2. Our Severneft-Urengoy natural gas operations generated EBITDA of US$ 41 million on revenues of US$ 146 million. The 9% year-on-year decline was mainly the result of lower condensate sales.2 Average prices derived from weekly data points
NITROGEN2014 PERFORMANCE
PERFORMANCE REVIEW
N
In 2014, we invested US$ 340 million in our nitrogen operations including, among others, such projects as the increase of ammonia capacity at Nevinnomysskiy Azot and the installation of a low-density ammonium nitrate production line at the Novomoskovskiy Azot facility as well as improvements in energy efficiency.
Novomoskovskiy AzotUpgrading of weak nitric acid unit and start production of low-density ammonium nitrate (LDAN). This further broadens the product mix, increases efficiency and allows us to decommission outdated production units.
+300KMTLDAN, production increase
US$132mTotal CAPEX
+US$50mIncremental EBITDA1
78%Completed as at 31 December 2014
Nevinnomysskiy AzotOngoing reconstruction of the Ammonia unit, increasing capacity by 10% to 1,980 KMT per day. This unique upgrade project will reduce the shortfall in ammonia supply and increase production efficiency.
+117KMTAmmonia, production increase
US$80mTotal CAPEX
+US$20mIncremental EBITDA1
100%Completed in Q4 2014
1 Assuming full capacity utilization of projects
Segment developments in 2014

ST
RA
TE
GIC
RE
PO
RT
CO
RP
OR
AT
E G
OV
ER
NA
NC
EFIN
AN
CIA
L STA
TE
ME
NT
S
EuroChem Annual Report and Accounts 2014 37
Strengths • Diversified customer base in more
than 70 countries • Cost competitiveness in Russia on the
back of lower gas prices, boosted by rouble devaluation vs. US dollar
• Natural gas supply flexibility and security with addition of wholly-owned supply
• Established global distribution platform via EuroChem Agro as well as favorable logistics of EuroChem Antwerpen with excellent transport links and proximity to key customers
• Growing range of specialty products with low environmental impact – responding to market demand
• Continued investment in ammonia production
• Continued upgrading of plant and technology offering high efficiency and production flexibility
• Owned transport and transhipment operations
• Economies of scale
Weaknesses • Not yet completed a shift away from
ageing equipment, which is less efficient and has higher raw material, energy and maintenance costs
• Relatively high transportation costs from Novomoskovskiy Azot to key markets (as compared to Nevinnomysskiy Azot and Antwerp facilities)
• Not fully self-sufficient in terms of ammonia needs; requires external purchases of up to 0.8 MMT per year
Opportunities • Increased ammonia output at
Nevinnomysskiy Azot, currently ramping up
• Further broaden the product mix at Novomoskovskiy Azot
• Further efficiency improvements through ongoing investment
• Construction of new ammonia capacity located close to international ports and taking advantage of relatively low feedstock costs
Threats • Local and regional economic stability • Trade barriers in target markets • Growing unconventional gas production
is shifting supply-demand dynamics and decreasing gas costs in traditionally higher-cost regions
• New ammonia capacity in lower-cost regions may alter the supply-demand balance unfavorably
SWOT ANALYSIS
SALES BY PRODUCT (2014)
Urea (22%) -1*
Complex (19%) -2*
Ammonium nitrate (15%) -3*
CAN (11%) +2*
Other (6%) +1*Methanol (5%) 0*Ammonia (3%) +1*
UAN (9%) -1*
ANF (2%) +1*
Melamine (2%) +1*Acetic acid (2%) 0*Hydrocarbons (2%) 0*
NP (2%) 0*
* Change on 2013 (percentage points)
SALES (US$m)
2,942
2011 2013 20142012
2,148
3,0092,915
CAPEX (US$m)
203
2011 2013 20142012
159
326 340
EBITDA (US$m)
986
2011 2013 20142012
869808 866
CAPACITY UTILIZATION (%)
97
2011 2013 20142012
94 98 94

38 EuroChem Annual Report and Accounts 2014
MARKET DRIVERSIn 2014, world consumption of phosphate fertilizers decreased by 1.3%, from 42.1 MMT (P2O5) in 2013 to 41.6 MMT (P2O5). This reflected reduced demand in the key markets of Western Europe, North America, Middle East and South Asia. Although there was continued demand growth in emerging agricultural markets such as Latin America, East Asia, Africa and Oceania, the overall market in 2014 was characterized by an excess of supply.
India remained the world’s largest importer of DAP, buying 3.6 MMT, an increase of 3% on 2013. China remained the largest global exporter of phosphate fertilizers, selling 4.9 MMT of DAP and 2.3 MMT of MAP in 2014 (compared to 3.8 MMT and 0.7 MMT respectively in 2013).
Global phosphoric acid capacity reached 55.6 MMT P2O5 (an increase of 1.3 MMT over 2013), however, there was little or no growth in downstream MAP/DAP capacity.
New low-cost iron ore capacity allied to substantially weaker domestic steel demand in China put downward pressure on market prices. From January to December 2014, iron ore prices shifted from US$ 136/tonne (63.5% Fe, CFR China) to US$ 68/tonne. The average for the year of US$ 99/tonne, was 27% lower than the US$ 136/tonne achieved in 2013.
KEY CAPACITY DEVELOPMENTSAccording to the IFA, there was little movement in new developments during 2014, a situation that is expected to continue in 2015. Key developments are described below.
PRICES AND OUTLOOKDAP/MAP prices increased from US$ 400/tonne (FOB Baltic) in January 2014 to US$ 480/tonne at the end of March. Despite more material from China coming onto the global market, the price continued to rise and in August 2014 DAP reached US$ 500/tonne (FOB Baltic) and MAP US$ 510/tonne (FOB Baltic). Taking the year as a whole, the average price for DAP grew by 3% and for MAP by 4%.
The overall phosphate market is expected to grow by 1-2% over the next few years.
PhosphatesPERFORMANCE REVIEW
P
zKEY PHOSPHATE PRODUCT PRICES (US$/tonne)
Jan2012
Jul2012
Jan2013
Jul2013
Jan2015
Jan2014
Jul2014
MAP (FOB Baltic) DAP (FOB Baltic)
NPK 16:16:16 (FOB Baltic)
700600500400300200100
0
FERTILIZER CONSUMPTION (KMT nutrients)
2013 20142012
109,166
42,20129,286180,654
110,867
42,12930,129183,124
111,757
41,58630,640183,983
Nitrogen (N) Phosphate (P2O5) Potash (K2O)Source: IFA
Year Country Company Plant/Location
Phosphoric acid
(KT P2O5 per year)
Phosphate fertilizers (KT P2O5 per year)
2014 Morocco OCP Jorf Lasfar 4502014/2015 Morocco OCP Jorf Lasfar 450*2014/2015 Indonesia JV PKG**/JPMC Gresik 200
* MAP/DAP/TSP/NPK (totally 1.000 KT per year in physical weight)** PT Petrokimia GresikSources: IFA, CRU, Fertecon
PHOSPHATE PRODUCTS
We produce MAP, DAP, NP and feed phosphates as well as P2O5 rich (37-38%) magnetite-apatite ore. Kovdorskiy GOK also produces baddeleylite and iron ore concentrates.
All of our phosphate fertilizer plants produce sulphuric acid as well as phosphoric acid units. Lifosa produces aluminium fluoride which is used in the manufacture of aluminium, glass and optics as well as in the tanning industry.

ST
RA
TE
GIC
RE
PO
RT
CO
RP
OR
AT
E G
OV
ER
NA
NC
EFIN
AN
CIA
L STA
TE
ME
NT
S
EuroChem Annual Report and Accounts 2014 39
Source: U.S. Geological Survey (USGS)
1,3002
Canada (<1%)
260
Kazakhstan (<1%)
1,100
US (2%)
1,300
Jordan (2%)
1,300
Russia (2%)
1,500
South Africa (2%)
3,700
China (6%)
50,000
Morocco andWestern Sahara (75%)
820
Peru (1%)
870
Australia (1%)
2,200
Algeria (3%)
1,800
Syria (3%)
PHOSPHATE ROCK RESERVESMMT (% share of total)
1
2
6
3
45
1 Kovdorskiy GOK
4 EuroChem Fertilizers (Kz)
2 Phosphorit
5 EuroChem BMU 6 Lifosa
3 EuroChem Migao (JV)
CAPACITY BY PRODUCT (KMT PA)
5,550Iron ore
2,450Apatite
8Baddeleyite
PLANNED CAPACITY
600Phosphate rock mining 28% P2O5
515Reserves (MMT of P2O5)
CAPACITY BY PRODUCT (KMT PA)
810MAP
410DAP
220Feed phosphates
CAPACITY BY PRODUCT (KMT PA)
710MAP
470NP
CAPACITY BY PRODUCT (KMT PA)
950DAP
170Feed phosphates
CAPACITY BY PRODUCT (KMT PA)
100NPK Unit-1
100NPK Unit-2 (launch 2H 2015)
60NK Unit-1 (launch 2016)
COST COMPETITIVENESS
The market for phosphate rock, the key ingredient for the production of phosphate fertilizers, is highly concentrated. This makes access to in-house reserves crucial for the stability of production and its competitiveness in terms of delivered cost to key target markets. Our phosphate plants benefit from intra-group supplies of both apatite and ammonia, as well as from their proximity to ports. By virtue of its geological setting, we also extract iron ore and baddeleyite from our Kovdorskiy GOK mine, which significantly adds to the profitability of our operations.
GLOBAL DAP EXPORT COST CURVE (2015)
10 2 4 6 8 10 12 143 5 7 9 11 13 15
(MMT)
DA
P c
ost o
n D
DP
/FC
A b
asis
(US
$/to
nne) 600
500
400
300
200
100
0
CFR India = US$ 481 PhosphoritLifosa

40 EuroChem Annual Report and Accounts 2014
SEGMENT PERFORMANCEOur full-year phosphates sales volumes amounted to 2,277 KMT of product, of which more than 4/5 was MAP/DAP. While an additional 15 KMT in DAP/MAP sales helped to partially offset lower NP and feed sales, total segment volumes came down 6% year-on-year as we consumed more apatite rock internally at our phosphoric acid units.
Against a backdrop of weak demand and rising supply, iron sales volumes declined 6% year-on-year with mineral raw material sales volumes finishing the year at 5,517 KMT.
Despite market prices for MAP/DAP products moving up 3% year-on-year, the significant decline in iron ore prices, which retreated 27% over the same period, coupled with 6% lower volumes, dragged our phosphates segment revenues down 13% to US$ 1.6 billion. At the same time, the continued weakening of the Russian rouble throughout the year significantly reduced phosphates costs and helped lift full-year phosphates EBITDA by 9% to US$ 476 million.
Within phosphates, our mining operations, which include apatite, iron ore and baddeleyite sales to third parties, provided 30% and 40% of 2014 phosphates segment revenues and EBITDA, respectively, as compared to 38% and 74% in 2013. The contribution from mining was less pronounced as average iron prices decreased from US$ 136/tonne in 2013 to well below US$ 100/tonne in 2014 (a trend which continued in 2015), while average MAP/DAP prices moved in the opposite direction and gained 3% on their 2013 average.
PHOSPHATES2014 PERFORMANCE
PERFORMANCE REVIEW
P
We have opened a new seam and are working on increasing the extraction of magnetite-apatite ore at our Kovdorskiy GOK mine. Once beneficiated and the magnetite content is released, this high-quality ore is then used as a key component in our phosphate fertilizer production.
Kovdorskiy GOK supplies all three of our phosphate plants: Phosphorit (Russia), Lifosa (Lithuania) and EuroChem-BMU (Russia).
In order to meet the growing demand for phosphate rock and create a foothold in Central Asia, we established EuroChem Fertilizers, which in its first phase of development consists of open pit phosphate rock mining in southeast Kazakhstan. With production now underway, the next step is the commissioning of a beneficiation plant, which will allow us to reduce transport costs to our Russian phosphate fertilizer plants in Russia. As potash comes on stream, we plan to make full use of our logistics arm to bring phosphates into Russia and take potash back to Kazakhstan to produce complex products for fast growing Central Asian, Chinese, and Indian markets.
We realized capital expenditures of US$ 282 million in phosphates in 2014. Our investments were mainly directed at the development of the phosphate rock deposit in Kazakhstan and the expansion of the Kovdorskiy GOK mining area.
Kovdorskiy GOKOpening of new ore body adjacent to the main pit – increasing apatite production and reducing the raw material deficit.
+948KMT Apatite, production increase
+136KMTIron ore, production increase
US$104mTotal CAPEX
+US$35mIncremental EBITDA1
80%Completed as at 31 December 2014
EuroChem Fertilizers (Kz)Production of phosphate rock and shipments commenced, further reducing the raw material deficit.
+600KMTPhosphate rock
US$88mTotal CAPEX
+US$20mIncremental EBITDA1
80%Completed as at 31 December 2014
PhosphoritReconstruction of sulphuric acid unit with a capacity to 1,000 KMT pa and installation of 32 MW power generating unit.
+220KMTSulphuric acid
US$45mTotal CAPEX
33%IRR
US$76mNPV
100%Completed in Q2 2014
1 Assuming full capacity utilization of projects
Segment developments in 2014

ST
RA
TE
GIC
RE
PO
RT
CO
RP
OR
AT
E G
OV
ER
NA
NC
EFIN
AN
CIA
L STA
TE
ME
NT
S
EuroChem Annual Report and Accounts 2014 41
Strengths • Diversified customer base in more
than 70 countries • Owned supply of high-quality apatite
from open pit mining, c.75% • Phosphate fertilizer facilities close to
ports and target markets (Europe and Russia/CIS)
• Cost competitiveness in Russia and Lithuania because of lower natural gas prices
• Growing range of products with low environmental impact – responding to market demand
• Lifosa assets in the EU with supportive logistical position
• Lifosa is regarded as a high-quality producer
• Associated production of baddeleylite and iron ore at Kovdorskiy GOK
Weaknesses • Relatively high cost for transporting
Kovdorskiy GOK apatite to Lifosa and EuroChem-BMU
• Not yet completed a shift away from ageing equipment, which is less efficient and has higher maintenance costs
• Reliance on external supplies of phosphate rock for c.25% of the Group needs
Opportunities • Further develop phosphate rock
extraction at EuroChem Fertilizers in Kazakhstan
• Further increase production at Kovdorskiy GOK through the new ore deposit
• Further investment in operational efficiency at EuroChem-BMU and Phosphorit
• Achieve self-sufficiency in phosphate rock
Threats • New capacity can change the
supply-demand balance and pricing structure, working against EuroChem
• Further declines in iron ore price may reduce the phosphate segment economics at Kovdorskiy GOK
SWOT ANALYSIS
SALES BY PRODUCT (2014)
MAP, DAP (55%) +7*
Iron ore (28%) -8*
Feed phosphatesgroup (9%) +1*
Other (4%) +2*
NP (2%) 0*Apatite (0%) -2*Complex fertilizers (0%) 0*
Baddeleyite (2%) +1*
* Change on 2013 (percentage points)
SALES (US$m)
1,954
2011 2013 20142012
2,175
1,8341,592
CAPEX (US$m)
186
2011 2013 20142012
218
271 282
EBITDA (US$m)
522
2011 2013 20142012
816
435 476
CAPACITY UTILIZATION (%)
82
2011 2013 20142012
8678
91

42 EuroChem Annual Report and Accounts 2014
PHOSPHATESEXPANDING OUR FOOTPRINT IN ASIA
PERFORMANCE REVIEW
P
EuroChem expands distribution and production in China
China is the largest mineral fertilizer market in the world, accounting for around 30% of total global consumption. While almost all of the nitrogen and phosphate fertilizers consumed in China are made in China, some 65% of MOP is imported (over 8 MMT in 2014), with more than half of this total from Russia and Belarus.
As a consequence, China is a key target market for EuroChem, in particular for its future potash deliveries once its potash mines come on stream. By 2019, we plan to have increased fertilizer sales volumes threefold to 1.2 MMT of MOP and specialty products.
Our current distribution operation, EuroChem Agro China, is based in Shenzhen and focuses on SOP based NPKs and specialty products.
In 2014, we started testing and developing new NPK grades, which proved popular for Chinese corn and rice growers and we will do the same in 2015 for soy and wheat growers.
A key development in 2014 was the setup of a joint venture with the Migao Corporation, a Yunnan-based manufacturer of potash and complex fertilizers, as well as a leading producer of potassium sulphate and potassium nitrate, a premium fertilizer. In January 2014, the EuroChem Migao JV started a production line with an annual capacity of 100 KMT of NPK. A second 100 KMT NPK line and 60 KMT potassium nitrate (NK) line are expected to come on stream in the second half of 2015.
As well as capacity building, this partnership also offers access to Migao’s own distribution network.
c.30%China’s share of global fertilizer consumption
over 60%of China’s potash is imported
100KMT paNPK Unit-1 capacity
100KMT paNPK Unit-2 capacity (launch H2 2015)
60KMT paNK Unit-1 capacity (launch 2016)
CASE STUDY
EuroChem CEO Dmitry Strezhnev and team attend the EuroChem Migao JV ribbon-cutting ceremony.
CHINA FERTILIZER CONSUMPTION DYNAMICS AND FORECAST (MMT)
2005 2006 2007 20092008 2010 20122011 2013 E20152014 E2016 E2019E2018E2017
43.5 45.9 45.5 44.8 46.6 47.3 48.6 50.1 51.1 52.2 52.9 53.7 54.3 54.9 55.4
Nitrogen (N) Phosphate (P2O5) Potash (K2O) Sources: Fertceon, CRU

ST
RA
TE
GIC
RE
PO
RT
CO
RP
OR
AT
E G
OV
ER
NA
NC
EFIN
AN
CIA
L STA
TE
ME
NT
S
EuroChem Annual Report and Accounts 2014 43
Adding value in Kazakhstan
In 2013, we started developing our two phosphate rock deposits in the Zhambyl region of Southern Kazakhstan. We invested US$ 88.5 million to create and prepare the mine. Extraction began in early 2014 and is now proceeding while plans are developed for the plant that will produce SOP and NPK for the Chinese and Central Asian market. The beneficiation plant will also produce DCP for our own plant EuroChem BMU. Other products will include calcium chloride, gypsum and sulphuric acid.
Currently, further transport infrastructure is being created and more equipment commissioned with a view to reaching full mining capacity in 2016. As of early 2015, we had 180 KMT of raw ore mining, excavated, and piled on site with plans to produce over 120 KMT of finished phosphate in 2015.
In parallel, we are contemplating the construction of chemical and fertilizer processing and manufacturing capacity alongside the progress of our mining operations.
This project will develop a significant resource base which can be supplied into Kazakhstan as well as exported.
+600KMTPLANNED PHOSPHATE ROCK CAPACITY PER ANNUM
US$88mTotal CAPEX
+US$20mIncremental EBITDA1
80%Completed as at 31 December 2014
1 Assuming full capacity utilization of projects
CASE STUDY
Start of mining operations.
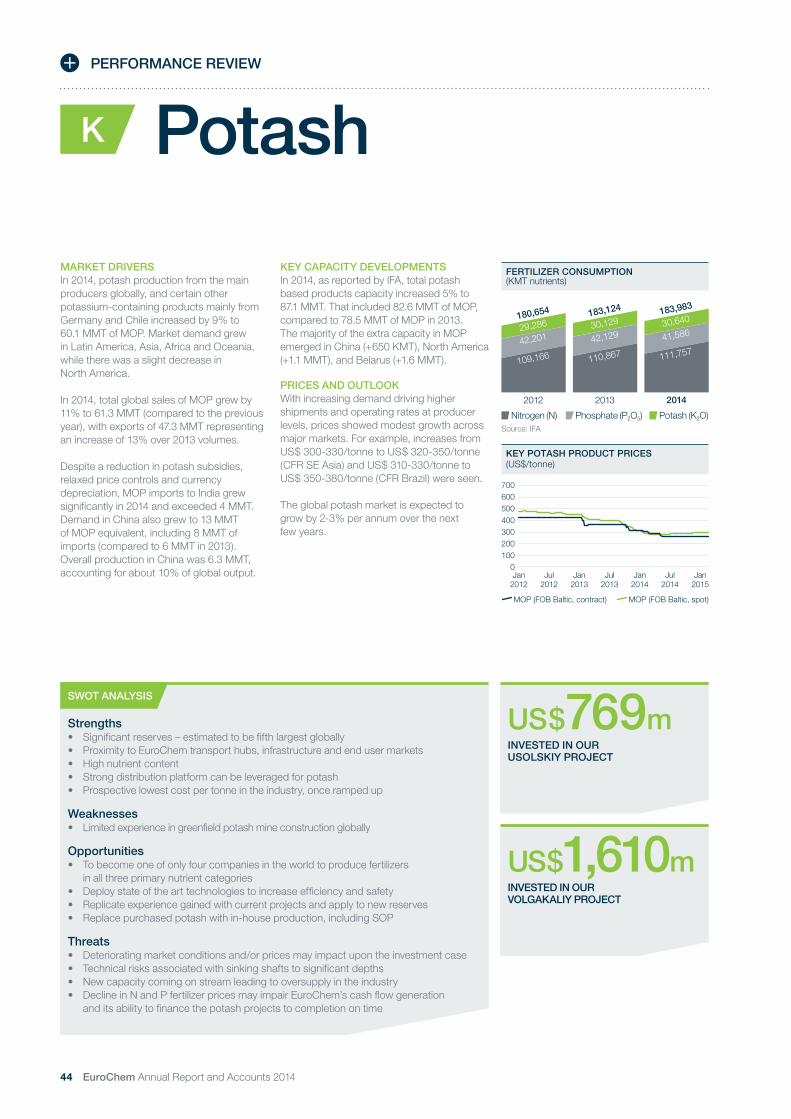
44 EuroChem Annual Report and Accounts 2014
MARKET DRIVERSIn 2014, potash production from the main producers globally, and certain other potassium-containing products mainly from Germany and Chile increased by 9% to 60.1 MMT of MOP. Market demand grew in Latin America, Asia, Africa and Oceania, while there was a slight decrease in North America.
In 2014, total global sales of MOP grew by 11% to 61.3 MMT (compared to the previous year), with exports of 47.3 MMT representing an increase of 13% over 2013 volumes.
Despite a reduction in potash subsidies, relaxed price controls and currency depreciation, MOP imports to India grew significantly in 2014 and exceeded 4 MMT. Demand in China also grew to 13 MMT of MOP equivalent, including 8 MMT of imports (compared to 6 MMT in 2013). Overall production in China was 6.3 MMT, accounting for about 10% of global output.
KEY CAPACITY DEVELOPMENTSIn 2014, as reported by IFA, total potash based products capacity increased 5% to 87.1 MMT. That included 82.6 MMT of MOP, compared to 78.5 MMT of MOP in 2013. The majority of the extra capacity in MOP emerged in China (+650 KMT), North America (+1.1 MMT), and Belarus (+1.6 MMT).
PRICES AND OUTLOOKWith increasing demand driving higher shipments and operating rates at producer levels, prices showed modest growth across major markets. For example, increases from US$ 300-330/tonne to US$ 320-350/tonne (CFR SE Asia) and US$ 310-330/tonne to US$ 350-380/tonne (CFR Brazil) were seen.
The global potash market is expected to grow by 2-3% per annum over the next few years.
PotashPERFORMANCE REVIEW
K
KEY POTASH PRODUCT PRICES(US$/tonne)
Jan2012
Jul2012
Jan2013
Jul2013
Jan2015
Jan2014
Jul2014
MOP (FOB Baltic, contract) MOP (FOB Baltic, spot)
700600500400300200100
0
FERTILIZER CONSUMPTION (KMT nutrients)
2013 20142012
109,166
42,20129,286180,654
110,867
42,12930,129183,124
111,757
41,58630,640183,983
Source: IFA
Nitrogen (N) Phosphate (P2O5) Potash (K2O)
Strengths • Significant reserves – estimated to be fifth largest globally • Proximity to EuroChem transport hubs, infrastructure and end user markets • High nutrient content • Strong distribution platform can be leveraged for potash • Prospective lowest cost per tonne in the industry, once ramped up
Weaknesses • Limited experience in greenfield potash mine construction globally
Opportunities • To become one of only four companies in the world to produce fertilizers
in all three primary nutrient categories • Deploy state of the art technologies to increase efficiency and safety • Replicate experience gained with current projects and apply to new reserves • Replace purchased potash with in-house production, including SOP
Threats • Deteriorating market conditions and/or prices may impact upon the investment case • Technical risks associated with sinking shafts to significant depths • New capacity coming on stream leading to oversupply in the industry • Decline in N and P fertilizer prices may impair EuroChem’s cash flow generation
and its ability to finance the potash projects to completion on time
SWOT ANALYSIS
US$769mINVESTED IN OUR USOLSKIY PROJECT
US$1,610mINVESTED IN OUR VOLGAKALIY PROJECT

ST
RA
TE
GIC
RE
PO
RT
CO
RP
OR
AT
E G
OV
ER
NA
NC
EFIN
AN
CIA
L STA
TE
ME
NT
S
EuroChem Annual Report and Accounts 2014 45
1,300
POTASH RESERVES(% share of total)
Potash reserves
Canada (46%)
US (1%)
Chile (1%)Brazil (3%)
Sources: U.S. Geological Survey (USGS)
Israel (0.5%)China (2%)
Russia (35%)
Germany (1%)
Belarus (8%)
Jordan (0.5%)
2
1
1 Usolskiy
CAPACITY BY PRODUCT (KMT PA)
2,300KMTPhase 1 (greenfield)
1,400KMTPhase 2 (brownfield)
3,700KMTTotal
PROVEN AND PROBABLE RESERVES
420MMT KCI (JORC)
2 VolgaKaliy
PROVEN AND PROBABLE RESERVES
492MMT KCI (JORC)
CAPACITY BY PRODUCT (KMT PA)
2,300KMTPhase 1 (greenfield)
2,300KMTPhase 2 (brownfield)
4,600KMTTotal
COST COMPETITIVENESS
We have access to over 3 billion tonnes of potash reserves in two key deposits, and have rights to over 7 billion tonnes of estimated resources in Russia. While the first phase of our development plans calls for potash production to begin in 2017, our two key sites will over time increase their capacity to a combined 8.3 MMT of KCI (5.0 MMT K2O), which is equivalent to approximately 10% of current global supply.
We expect to have one of the lowest ‘delivered to’ costs thanks to our mine design, use of the latest technology, low energy prices and proximity/access to our own ports and transhipment operations.
To the end of Q4 2014, we had invested US$ 2.4 billion in our two potash projects. The completion levels, including phase 2 brownfield expansions, stood at 22% for Usolskiy and 36% for VolgaKaliy.
GLOBAL POTASH COST CURVE (2020)
50 10 15 20 30 40 50 60 70 8025 35 45 55 65 75 85
Global potash capacity (MMT)
Pot
ash
cost
on
DD
B b
asis
(US
$/to
nne) 500
400
300
200
100
0
UsolskiyVolgaKaliy

46 EuroChem Annual Report and Accounts 2014
-669m
-520m
-918m
1
5
8
6
7
3
9
10
2
4
PERFORMANCE REVIEW
K VolgaKaliy Gremyachinskoe deposit
DevelopmentEUROCHEM-VOLGAKALIY, GREMYACHINSKOE DEPOSIT (VOLGOGRAD REGION, RUSSIA)The Gremyachinskoe deposit is one of the four largest deposits of potassium ore in Russia and is characterized by a 10-meter thick potash layer with an average KCl content of 39.5%. EuroChem-VolgaKaliy has mining rights on more than 1.6 billion tonnes of reserves in the deposit. With our investment in modern mining operations and ready access to our Tuapse transhipment port facility, we will have unmatched cost advantages.
A combined 277m were sunk across all three main shafts in the final quarter of 2014, making an annual total of 1,019m. The freeze plants secured freeze walls up to a depth of 820m. Skip shaft #1 moved beyond the freeze zone to a depth of 849m, where real-time temperature monitoring and 3D modelling provided vital data in an environment where the rock temperature was +26˚ Celsius. We also completed the construction of the hoist equipment above skip shaft #1.
As at 31 December 2014, we had installed the permanent headframe for the skip shaft #2 and sinking operations resumed according to their schedule. The cage shaft and skip shaft #2 had reached depths of 529m and 398m respectively, by the end of 2014.
Good progress was made with surface work, including concrete and steel fabrication of the beneficiation plant, finished product storage and the crushing and drying units. The 220kV electrical sub-station was certified and obtained its commissioning permit. In Kotelnikovo, the town closest to the site, we have built a hotel, sports complex and apartment buildings. In 2014, the freshwater and wastewater systems neared completion and work began on the second phase of the utilities upgrade program.
CASE STUDY
Progress as of April 2015
VOLGAKALIY CAPEX (US$m)
2010 2011 2013 20142012
166
286346
252218
1 Main beneficiation2 Administrative building3 Railcar loading station4 Mine rescue5 Cage shaft6 Skip shaft #17 Skip shaft #28 Product storage9 Ore storage10 Crushing unit
Sealing it with a first in RussiaAs we were once again reminded in 2014, flooding is a key risk to potash underground mining operations. It is estimated that over 50 salt and potash mines across the globe have some degree of water inflow and that one potash mine in four around the world has been closed due to flooding. Currently, inflows of some significance have caused large capital expenditures and/or have placed owners in position to close mines. Some well-known examples include Moab in the US, Cassidy Lake, Penobsquis, Esterhazy, and Patience Lake in Canada, as well as Solikamsk-2, Berezniki-1 and -3 in Russia.
While many technical solutions have been advanced and applied, we believe that EuroChem is the first company in Russia to equip shafts with innovative chemical seal rings with a new variant design. This ‘waterproof’ design is composed of a unique sealant material specifically designed to create a barrier to fluids and low-pressure gases. Similar seals have typically been used in very deep and high water bearing formations in Saskatchewan, Canada. Designed to seal shaft liners, the material is mixed as a slurry under very controlled settings and applied around the shaft below the water table in a specific contained location, which in the case of VolgaKaliy means at a depth of about 850m. It serves to fill the voids created between the interfaces of the shaft’s lining materials such

ST
RA
TE
GIC
RE
PO
RT
CO
RP
OR
AT
E G
OV
ER
NA
NC
EFIN
AN
CIA
L STA
TE
ME
NT
S
EuroChem Annual Report and Accounts 2014 47
K Usolskiy Verkhnekamskoe deposit
DevelopmentUSOLSKIY POTASH COMPLEX, VERKHNEKAMSKOE DEPOSIT (PERM REGION, RUSSIA)Located in the Perm region near Russia’s traditional potash production sites, the Verkhnekamskoe potash deposit is one of the largest in the world. Within this deposit, Usolskiy Potash has secured rights to over 1.5 billion tonnes of reserves with an average KCI content of 30.8% and an active mine life of 35+ years.
The cage shaft and skip shaft sinking operations were completed in 2014. Work in Q4 2014 focused on back grouting of the shafts, vertical guides in skip shaft #1 and steel work around loading pocket #1 and bins #1 and #2. The hoist building was also completed, including the installation of overhead cranes. Extensive test piling and permanent piling was carried out in the latter part of the year.
Further progress was made with the site’s railway line (including ground levelling work and a highway by-pass), as well as the gas infrastructure, with more than 29km of pipeline welded, insulated, tested and backfilled.
In June 2014, we gained the rights to explore and produce potash from the Belopashinsky plot of the Verkhnekamskoe deposit. The 65km2 licence area is adjacent to the Palashersky plot currently being developed. This brought the total licence area up to 188km2 and total reserves and resources to about 2.3 billion tonnes of ore. This offers a useful mine life of at least 60 years at today’s planned annual production capacity of 3.7 MMT of KCI.
-530m
-473m
Progress as of April 2015
USOLSKIY CAPEX (US$m)
2010 2011 2013 20142012
64 73 91
136
227
1 Administrative building2 Equipment and material storage 3 Railcar loading station4 Ore storage5 Cage shaft6 Skip shaft #2 (phase 2)7 Mine rescue8 Skip shaft #19 Product storage10 Main beneficiation11 Crushing unit
as between the watertight rock formation and the liners; in EuroChem’s case, the very large wedge rings are made from heavy grey cast iron. The material sets up, forming a consistency similar to a natural rubber, soaking up fluids and then expanding to provide a tighter seal between these boundary layers. This then prevents water from migrating down toward the mine or into lower geological formations which are not particularly watertight or impermeable. Similar sealants were used in our Usolskiy shafts, but none have the depths of our VolgaKaliy mine which required this unique design. Although the material and similar designs are used in Saskatchewan, they underwent thorough testing and certification through the proper Russian Institutes and laboratories to verify its suitability
and confirm it was correct for the task. More tests are being conducted against a variety and combination of surfaces to better understand how broad it can be applied in the future.
We installed the first seal on VolgaKaliy’s Skip Shaft #1 in late 2014 and will proceed to equip the other shafts as sinking progresses beyond the freeze wall. This approach affords an unprecedented level of protection to the deposit as well as those working on extracting the ore some 1,100 meters below ground. This use of an innovative yet proven technology is emblematic of EuroChem’s consistent application of best practice in order to maintain operational integrity, minimize risks and protect its employees.
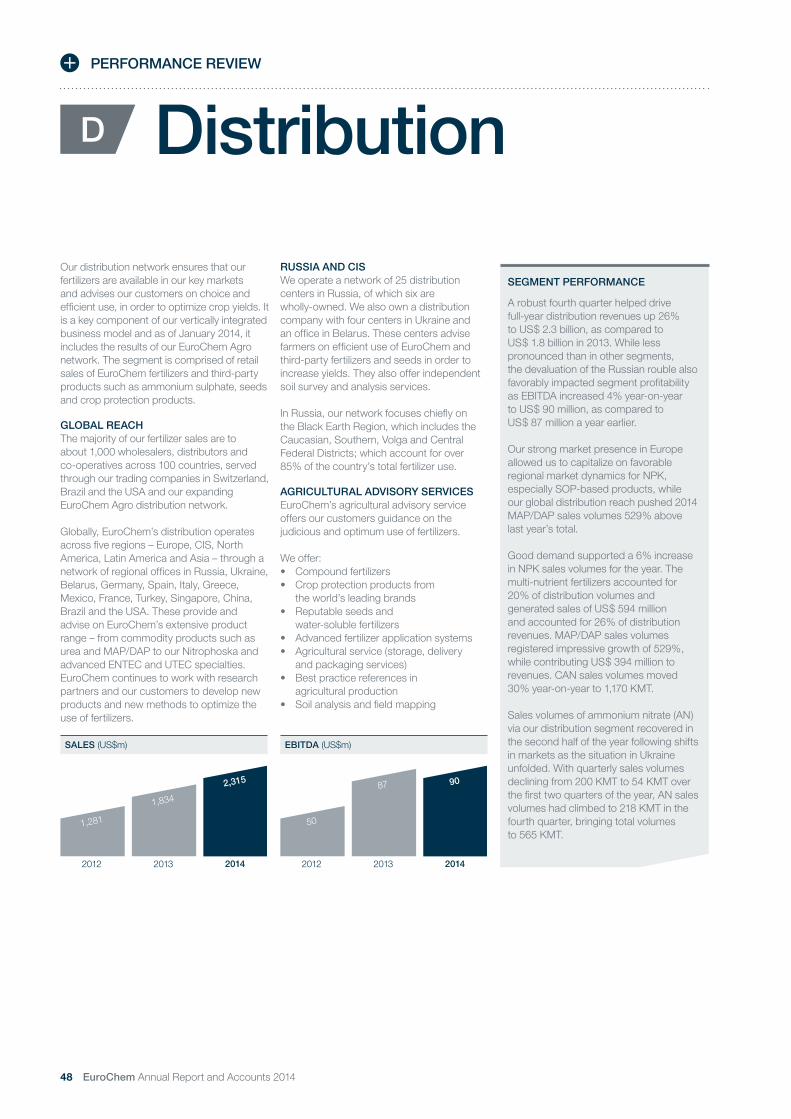
48 EuroChem Annual Report and Accounts 2014
Our distribution network ensures that our fertilizers are available in our key markets and advises our customers on choice and efficient use, in order to optimize crop yields. It is a key component of our vertically integrated business model and as of January 2014, it includes the results of our EuroChem Agro network. The segment is comprised of retail sales of EuroChem fertilizers and third-party products such as ammonium sulphate, seeds and crop protection products.
GLOBAL REACHThe majority of our fertilizer sales are to about 1,000 wholesalers, distributors and co-operatives across 100 countries, served through our trading companies in Switzerland, Brazil and the USA and our expanding EuroChem Agro distribution network.
Globally, EuroChem’s distribution operates across five regions – Europe, CIS, North America, Latin America and Asia – through a network of regional offices in Russia, Ukraine, Belarus, Germany, Spain, Italy, Greece, Mexico, France, Turkey, Singapore, China, Brazil and the USA. These provide and advise on EuroChem’s extensive product range – from commodity products such as urea and MAP/DAP to our Nitrophoska and advanced ENTEC and UTEC specialties. EuroChem continues to work with research partners and our customers to develop new products and new methods to optimize the use of fertilizers.
RUSSIA AND CISWe operate a network of 25 distribution centers in Russia, of which six are wholly-owned. We also own a distribution company with four centers in Ukraine and an office in Belarus. These centers advise farmers on efficient use of EuroChem and third-party fertilizers and seeds in order to increase yields. They also offer independent soil survey and analysis services.
In Russia, our network focuses chiefly on the Black Earth Region, which includes the Caucasian, Southern, Volga and Central Federal Districts; which account for over 85% of the country’s total fertilizer use.
AGRICULTURAL ADVISORY SERVICESEuroChem’s agricultural advisory service offers our customers guidance on the judicious and optimum use of fertilizers.
We offer: • Compound fertilizers • Crop protection products from
the world’s leading brands • Reputable seeds and
water-soluble fertilizers • Advanced fertilizer application systems • Agricultural service (storage, delivery
and packaging services) • Best practice references in
agricultural production • Soil analysis and field mapping
DistributionPERFORMANCE REVIEW
D
SEGMENT PERFORMANCE
A robust fourth quarter helped drive full-year distribution revenues up 26% to US$ 2.3 billion, as compared to US$ 1.8 billion in 2013. While less pronounced than in other segments, the devaluation of the Russian rouble also favorably impacted segment profitability as EBITDA increased 4% year-on-year to US$ 90 million, as compared to US$ 87 million a year earlier.
Our strong market presence in Europe allowed us to capitalize on favorable regional market dynamics for NPK, especially SOP-based products, while our global distribution reach pushed 2014 MAP/DAP sales volumes 529% above last year’s total.
Good demand supported a 6% increase in NPK sales volumes for the year. The multi-nutrient fertilizers accounted for 20% of distribution volumes and generated sales of US$ 594 million and accounted for 26% of distribution revenues. MAP/DAP sales volumes registered impressive growth of 529%, while contributing US$ 394 million to revenues. CAN sales volumes moved 30% year-on-year to 1,170 KMT.
Sales volumes of ammonium nitrate (AN) via our distribution segment recovered in the second half of the year following shifts in markets as the situation in Ukraine unfolded. With quarterly sales volumes declining from 200 KMT to 54 KMT over the first two quarters of the year, AN sales volumes had climbed to 218 KMT in the fourth quarter, bringing total volumes to 565 KMT.
SALES (US$m)
2013 20142012
1,281
1,834
2,315
EBITDA (US$m)
2013 20142012
50
87 90

ST
RA
TE
GIC
RE
PO
RT
CO
RP
OR
AT
E G
OV
ER
NA
NC
EFIN
AN
CIA
L STA
TE
ME
NT
S
EuroChem Annual Report and Accounts 2014 49
2014 NET TRADEBALANCES (KMT)
Sources: CRU, Fertecon
1 Excludes China and India
Strengths • Proximity to end user markets • Global reach through land and
sea-based infrastructure • Advisory services including soil analysis
coupled with high-quality products • Growing brand recognition built
on quality and reliability • Excellent storage capacity • Research partnerships
Weaknesses • Small-scale distribution platforms
in Latin America and Asia • Relatively sparse coverage
of Eastern Europe • Dependence on several large
counterparties for third-party product sourcing
Opportunities • Potential for development across
Asia to serve these markets • Development of a distribution
platform in Latin America • Continued development and
application of new low impact, high yield products
• Further growth and diversification of third-party product sourcing relationships
Threats • Price volatility can impact on margins • Intensified competition • Currency and political risks • Price regulation risks (e.g. Russia)
SWOT ANALYSIS
NORTH AMERICA
2009 2010 2011 2013 20142012
606887 864
1,430 1,5681,418
AFRICA
2009 2010 2011 2013 20142012
456
271 290 289
459386
EUROPE
2009 2010 2011 2013 20142012
1,747 1,7651,253
3,3924,460 4,958
RUSSIA
2009 2010 2011 2013 20142012
3,7625,048
4,5135,405
4,0524,824
ASIA
2009 2010 2011 2013 20142012
3,366
2,5113,341 3,545
4,870
3,694
CIS (excluding Russia)
2009 2010 2011 2013 20142012
2,030 2,254
1,801
1,024 1,207924
AUSTRALASIA
2009 2010 2011 2013 20142012
8249
108
181158
55
Fertilizers Mining Other
LATIN AMERICA
2009 2010 2011 2013 20142012
1,1841,458 1,567 1,723
1,418 1,382
TOTAL GROUP SALES (KMT)
Urea MAP/DAP KCI
NORTH AMERICA
8,738
3,082
(6,256)
WESTERN EUROPE
178
(2,457)
(2,502)
CIS
17,550
2,319
7,416
CHINA
(6,556)
6,472
12,620
SOUTH EAST ASIA1
(8,558)
(3,823)
(7,187)
INDIA
(3,868)
(4,198)
(8,023)
NORTH AFRICA
(364)
3,672
2,232
LATIN AMERICA
(9,297)
(5,778)
(7,773)
MIDDLE EAST
4,769
2,520
14,611

50 EuroChem Annual Report and Accounts 2014
EuroChem Terminal Sillamäe
TRANSHIPMENT CAPACITY (MILLION TONNES PA) 0.6NUMBER OF BERTHS 1DEPTH AT BERTH (METERS) 12.0DEADWEIGHT TONNAGE (TONNES) 35,000STORAGE CAPACITY(TONNES OF LIQUID CHEMICALS) 35,000
TRANSHIPMENT CAPACITY LOADING (FINISHED PRODUCT EXPORTS) (MILLION TONNES PA)
0.7UNLOADING (RAW MATERIAL IMPORTS)(MILLION TONNES PA) 2.8
LogisticsPERFORMANCE REVIEW
We produce more than 29 million tonnes of products per year. From raw material procurement, to intercompany shipments and final delivery, our logistical requirements are extensive and essential to the success of our business model, ensuring that our products are delivered to customers in the most effective and efficient way.
Transportation is a significant cost component of the mineral fertilizer value chain. Therefore, the main strategic objective of our logistics investments is to decrease our overall transportation costs – and consequently, the cost-to-market for our products to our more than 6,000 customers globally.
Tuapse Bulk Cargo Terminal
Iron ore concentrate
Murmansk
Apatite concentrate Fertilizers
EuroChem Antwerpen Jetty
Ust-Luga Terminal
Our logistics system is a vital part of our competitive, vertically integrated business model and includes port terminals and rail stock, as well as expertise in cargo vessels brokerage and other transportation services. Well-developed logistics functions are vital in minimizing efficiencies and capturing value.
We operate wholly-owned fertilizer transhipment terminals in the towns of Tuapse (Black Sea) and Murmansk (Barents Sea) in Russia, and Sillamäe (Gulf of Finland) in Estonia, as well as benefiting from dedicated jetty access in the port of Antwerp in Belgium.
Our terminal at Tuapse will be a vital link in the supply line for potash from our Gremyachinskoe development, which will place us amongst the cost leaders in the global potash segment. To support potash exports from our Usolskiy mine, we plan to construct a 5 million tonnes per annum bulk terminal in the Baltic port of Ust-Luga.
Beyond ports, EuroChem owns two Panamax vessels and over 6,400 rolling stock as well as a rail service center.
EuroChem terminals: key to logistics management and supply chain operations.
TRANSHIPMENT CAPACITY (MILLION TONNES PA) 2.3NUMBER OF BERTHS 1DEPTH AT BERTH (METERS) 12.5DEADWEIGHT TONNAGE (TONNES) 52,000STORAGE CAPACITY(TONNES OF DRY FERTILIZERS) 90,000
TRANSHIPMENT CAPACITY (MILLION TONNES PA) 3.0NUMBER OF BERTHS 1DEPTH AT BERTH (METERS) 12.7DEADWEIGHT TONNAGE (TONNES) 80,000STORAGE CAPACITY(TONNES) 100,000
TRANSHIPMENT CAPACITY (MILLION TONNES PA) 2.0NUMBER OF BERTHS 1DEPTH AT BERTH (METERS) 11.0DEADWEIGHT TONNAGE (TONNES) 40,000STORAGE CAPACITY(TONNES) 25,000
TRANSHIPMENT CAPACITY (MILLION TONNES PA) over 1.5NUMBER OF BERTHS 1DEPTH AT BERTH (METERS) 11.1SHIP LOADING RATE(TONNES PER DAY) 5,000RAILWAY CAR UNLOADING RATE(TONNES PER DAY) 7,800
The terminal is under construction and expected to be completed in 2018-19.Expected capacity: 5.0 MMT pa.

ST
RA
TE
GIC
RE
PO
RT
CO
RP
OR
AT
E G
OV
ER
NA
NC
EFIN
AN
CIA
L STA
TE
ME
NT
S
EuroChem Annual Report and Accounts 2014 51
InvestmentsEUROCHEM INVESTMENT PROGRAM
NEVINNOMYSSKIY AZOT • Import substitution –
Russia’s only melamine production facility
• Efficiency gains (per tonne of urea): • Ammonia –
0.58 to 0.57 tonne • Steam – 0.94 to 0.65 Gcal • Electricity –
200 to 179 kWh
US$311m Total CAPEX
+52KMT pa Melamine capacity increase
+250MT/dayUrea capacity increase
Q1 2014Completion date
Project: Melamine
TUAPSE • Construction of
transhipment terminal in Tuapse (Black Sea)
• 2.3 MMT pa of dry fertilizer capacity
• c.600km from VolgaKaliy mine
US$2,041m Total CAPEX
+2.3MMT pa Transhipment (dry) capacity increase
Q4 2011Completion date
Project: Loading terminal
NOVOMOSKOVSKIY AZOT • Overhaul and increase of
urea unit-3 production line with prilled/granular capacity
• Integration of urea unit moved from Europe
• 25% decrease in natural gas consumption
• 63% reduction in dust emissions
• 36% less water effluent discharge
US$233m Total CAPEX
+410KMT pa Urea capacity increase
+600KMT pa Urea (gran) capacity increase
Q3 2010Completion date
Project: Urea unit upgrade
SEVERNEFT-URENGOY • Provides upstream integration
into a producing asset in the wet gas region of Yamal – ‘The Qatar of Russia’ – and a hedge against natural gas price volatility
• Reserves: • Natural gas – 50 billion m3
• Oil – 32 MMT
US$400m Total CAPEX
+1.1bcm pa Natural gas capacity increase
+220KMT/dayGas condensate increase
Q1 2012Completion date
Project: M&A1
EUROCHEM ANTWERPEN AND EUROCHEM AGRO • Access to European/Global
specialty customer base via established global distribution platform
• Includes fertilizers with inhibitors and stabilizers (UTEC, ENTEC) and the Nitrophoska range
• Superior logistics – includes the right to distribute over 1 MMT pa of AS/ASN produced by BASF
US$1.1bn Total CAPEX
+1,250KMT pa NPK/NP capacity increase
+1,150KMT paCAN/AN capacity increase
Q3 2012Completion date
Project: M&A1
Solid track record in large-scale industrial and M&A projects delivering superior returns.
1 Selected deals from more than 20 projects screened

ISSUES OF INTEREST FOR OUR STAKEHOLDERS
Stakeholdergroup Skills
Employ-ment access Training
Salaries/benefits
Health & Safety
Compli-ance Strategy
Gover-nance
RiskManage-ment Financials
Invest-ment
Environ-ment
Commu-nication
Product price
Product quality
Product availability
Young people
Shareholders and investorsCustomers
Employees
Trade unions
Federal authoritiesRegional/local authoritiesLocal communitiesEnvironmental organizationsProfessionals/universitiesMedia
Partners/suppliersNon profit organizations
52 EuroChem Annual Report and Accounts 2014
SUSTAINABILITY
A talented team adding sustainable value
STAKEHOLDER ENGAGEMENTWe communicate with 13 key stakeholder groups.
Our dialogue with stakeholders is required by law and/or takes place as part of our day to day operations. The dialogue is normally formal, planned, structured and documented. The focus will be different where we are developing a new asset, as opposed to existing operations. However, in all cases we communicate internally and with external parties such as the relevant government authorities, regulators and local community representatives. This dialogue assists us in defining our sustainability strategy and priorities.
Objective
To be a top five global fertilizer producer by size and profitability.
Values
Our business is founded on four key values:• Integrity• Openness• Trust• Respect
Mission
To make a significant contribution to driving progress in global agriculture.Our mission is to help the world grow the food, feed, fiber and fuel needed to sustain our growing population.

ST
RA
TE
GIC
RE
PO
RT
CO
RP
OR
AT
E G
OV
ER
NA
NC
EFIN
AN
CIA
L STA
TE
ME
NT
S
EuroChem Annual Report and Accounts 2014 53
SUSTAINABILITY STRATEGYWe have a fundamental long-term growth strategy that requires us to sustain and develop our vertically integrated business, from raw materials to production and distribution. While economic success is a key measure, we also recognize that to maintain this in the long-term we must maintain the highest levels of employee relations, safety, environmental stewardship and community engagement.
ECONOMIC
Strategic goals 2014 outcomes
Promote and support sustainable agriculture
• Ensured that all products complied with the Responsible Care standard• Continued to operate and develop the E-Generation education program
Invest in new technologies, products and vertical integration
• First company in Russia to use innovative Chemical Seal Ring technology to protect against flooding at VolgaKaliy • Started phosphate rock extraction and planning for fertilizer manufacture in Kazakhstan• Invested in state of the art technology to reduce sulphurous anhydride emissions at Lifosa sulphuric acid unit• EuroChem Antwerpen reduced CO2 emissions (in the form of N2O) from the nitric acid plants by 17% (compared to 2013)• Opened new ore body at Kovdorskiy GOK
Ensure financial stability and shareholder returns
• Increased EBITDA by 12%• Established new Group headquarters in Switzerland, which enables us to participate in global consolidation and
continue to fund our ambitious capital investment program
Meet and exceed customer expectations
• Maintained our network of agri-centers• Continued to invest in our logistics and distribution network
Maintain excellent working relationships with suppliers
• Specified and worked with suppliers that operate to highest international standards on products, services, employment, quality and environment
ENVIRONMENT
Strategic goals 2014 outcomes
Reduce our environmental footprint
• Targeted environmental protection expenditure• Continual reduction of air emissions, effluents and waste per tonne of production within statutory frameworks and
production modernization
SOCIAL
Strategic goals 2014 outcomes
Recruit and retain motivated employees
• Increased the number of permanent employees by 2% (over 2013)
Create a safe and healthy working environment
• Six workplace fatalities• 48 Lost Time Injuries
Maintain excellent working relationships with government
• Opened new sports arenas in Russia and Lithuania in conjunction with federal and regional administrations• Development of phosphate rock extraction and processing operation with the support of the national government
of Kazakhstan
Support and invest in local communities
• Invested US$ 17.5 million in communities
Our sustainability strategy in action
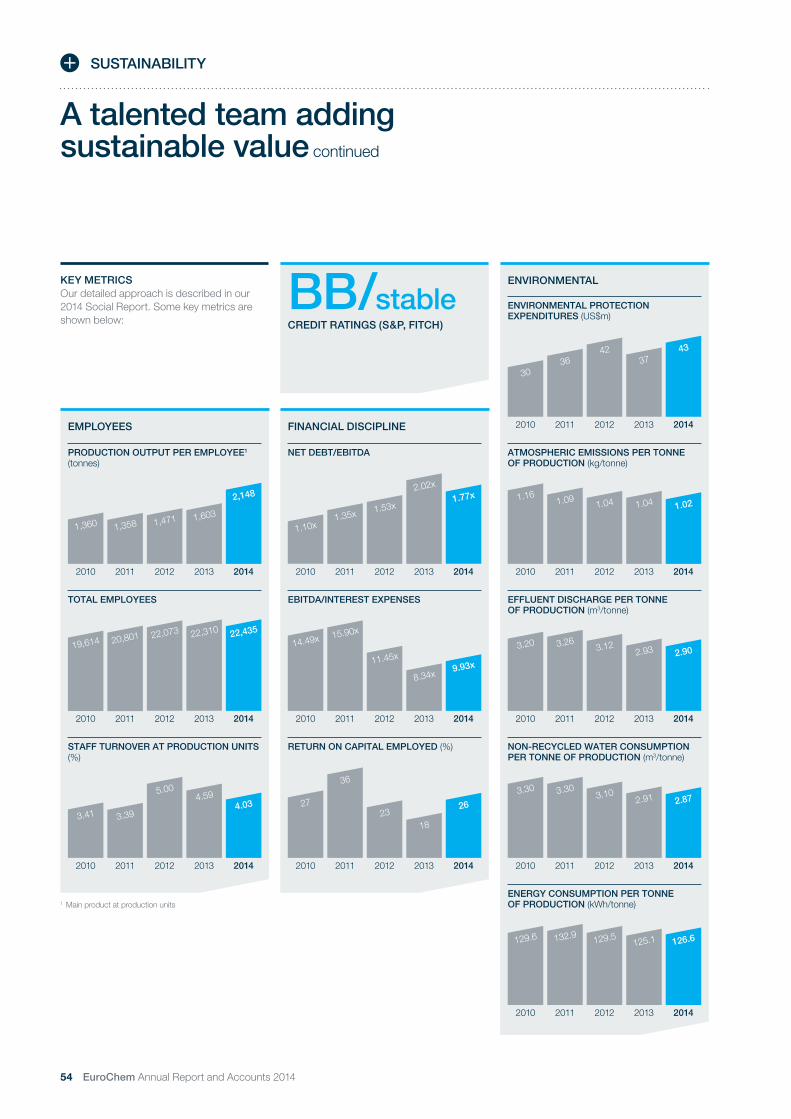
54 EuroChem Annual Report and Accounts 2014
SUSTAINABILITY
KEY METRICSOur detailed approach is described in our 2014 Social Report. Some key metrics are shown below:
EMPLOYEES
ENVIRONMENTAL
FINANCIAL DISCIPLINE
2010 2011 2013 20142012
TOTAL EMPLOYEES
19,614 20,801 22,073 22,310 22,435
2010 2011 2013 20142012
EBITDA/INTEREST EXPENSES
14.49x 15.90x
11.45x
8.34x9.93x
2010 2011 2013 20142012
ATMOSPHERIC EMISSIONS PER TONNEOF PRODUCTION (kg/tonne)
1.161.09
1.04 1.04 1.02
2010 2011 2013 20142012
NON-RECYCLED WATER CONSUMPTION PER TONNE OF PRODUCTION (m3/tonne)
3.30 3.303.10
2.91 2.87
2010 2011 2013 20142012
STAFF TURNOVER AT PRODUCTION UNITS(%)
3.41 3.39
5.004.59
4.03
2010 2011 2013 20142012
RETURN ON CAPITAL EMPLOYED (%)
27
36
2318
26
2010 2011 2013 20142012
EFFLUENT DISCHARGE PER TONNEOF PRODUCTION (m3/tonne)
3.20 3.263.12
2.93 2.90
2010 2011 2013 20142012
ENERGY CONSUMPTION PER TONNE OF PRODUCTION (kWh/tonne)
129.6 132.9 129.5125.1 126.6
2010 2011 2013 20142012
PRODUCTION OUTPUT PER EMPLOYEE1 (tonnes)
1,360 1,358 1,471 1,603
2,148
2010 2011 2013 20142012
NET DEBT/EBITDA
1.10x1.35x 1.53x
2.02x
1.77x
2010 2011 2013 20142012
ENVIRONMENTAL PROTECTION EXPENDITURES (US$m)
3036
4237
43
A talented team adding sustainable value continued
BB/stableCREDIT RATINGS (S&P, FITCH)
1 Main product at production units

ST
RA
TE
GIC
RE
PO
RT
CO
RP
OR
AT
E G
OV
ER
NA
NC
EFIN
AN
CIA
L STA
TE
ME
NT
S
EuroChem Annual Report and Accounts 2014 55
Usolskiy project finance – a unique project and a testament to our management strength and commitment to social and environmental best practice.
To support the ongoing development of our Usolskiy potash project, in August 2014, we secured a non-recourse US$ 750 million finance facility over eight years with a 3.5-year availability period. It was one of the very few such deals in Russia to successfully close in 2014.
As part of the due diligence, the syndicate of lenders, together with their external advisor, assessed the social and environmental risks attached to the project. A key part of this process was a detailed review of how well it complied with local and International Finance Corporation (IFC)/World Bank requirements and those of the Equator Principles (EP), a social and environmental risk management framework for financial institutions.
A number of targeted environmental and social studies and audits were undertaken. These also focused on appropriate design criteria to ensure that the project utilizes best international practice and procedures. To aid this process, we prepared an Environmental and Social Impact Assessment (ESIA) and implemented a comprehensive Environmental and Social Action Plan. While these are not requirements under Russian law, all parties agreed that the project should comply with the latest EP standards.
The Mandated Lead Arrangers of the facility were Société Générale S.A., OJSC Rosbank, ING Bank N.V., HSBC Bank PLC, Crédit Agricole CIB, ZAO UniCredit Bank
and Sberbank CIB, with Société Générale acting as both facility and security agent.
The Usolskiy facility won the 2014 European Mining and Metals Deal of the Year from Infrastructure Journal Global. It is also the first fertilizer project in Russia to comply with the Equator Principles (EP) III standards, and is testament to our management strength and our commitment to social and environmental best practice.
CASE STUDY

56 EuroChem Annual Report and Accounts 2014
Risk managementEVOLUTION OF OUR RISK MANAGEMENT FUNCTIONOur risk management function and internal controls are being actively developed and based on international standards, such as ISO 31000 and COSO ERM. Prior to a full implementation throughout the Group, the concepts and functions are tried and tested. Our risk management methodology evolves and progresses and is adjusted throughout its implementation.
RISK MANAGEMENT STRATEGYWe manage risks in a proactive and effective manner at all levels within the Group. It is a corporate objective to prepare and review risk assessments for all material KPIs. Process owners define the associated risk and maintain internal controls.
2014 DEVELOPMENTSDuring 2014, we redefined our methodology for financial risk management. This addresses risks associated with foreign exchange, interest rate, market/product price and credit. The methodology, currently being tested, incorporates quantification techniques, key indicators, and a hedging mechanism. In addition, we rolled-out a new integrated insurance program, across all business units and geographies. This includes project finance insurance for underground risks at one of our potash projects.
PLANS AND OUTLOOK FOR UPCOMING 12-18 MONTHSWe will review how we implement quantification techniques to measure material risks and the associated potential losses. Additionally, indicators will be developed to provide process owners with early warning on risk movements and threat levels. This will enhance their ability to monitor risk variations and address them as efficiently as possible.
A key goal in 2015 is to upgrade our investment management methodology with embedded risk analysis tools and procedures for each step of an investment project’s life-cycle.
Operational risks UNPLANNED PRODUCTION SHUTDOWNS OR EQUIPMENT FAILUREUnplanned process issues, equipment failure or any stoppage of production can have a material impact on Group performance. To mitigate these risks we invest in and operate high-quality systems, technology, equipment and maintenance/repair programs. This is supported by technical training for employees and robust equipment and business insurance.
HEALTH, SAFETY AND ENVIRONMENT (HSE)We have a corporate HSE lead and department that defines Group practice and works closely with HSE specialists at each operating company. Our core requirement is that all of our production sites operate environmental and safety management systems in accordance with ISO 9001, ISO 14001 and OHSAS 18001.
Under the auspices of our corporate HSE lead, we are on track to achieve our aim of being a HSE exemplar by 2018. Working with a specialist HSE consultancy, we have defined a roadmap and are rolling out revised policies, procedures and associated technologies across all of our sites.
Logistics
Generating, shipping and delivering 15 million tonnes of products safely and efficiently is a key challenge. To maintain a steady flow of raw materials and finished products we use best in class planning, management techniques and equipment. Our insurance is also tailored and effective, to cover any unscheduled stoppages or delays.
COMPLIANCEAll of our employees comply with our codes of conduct and understand that the Group has a zero tolerance policy towards fraud and bribery. We monitor this behavior through our Internal Affairs and internal Audit units and transaction monitoring procedures. All key purchases are channelled through a tender process, unless there is a transparent business reason why this should not be the case.
Construction risk
Our significant investment in the business requires the construction of new extraction and manufacturing facilities and associated infrastructure. Any problems or delays in this investment and construction program can erode our competitiveness and diminish performance; consequently, we carefully plan projects, screen contractors and monitor progress. We employ a strong team of commissioning and management personnel and work with leading contracting companies and advisors. This is backed up by robust insurance covering mining, logistics, property and business continuity.
FINANCIAL RISKSWe assess and prioritize financial risks based on their potential impact on cash flow within individual businesses and across the Group. Our approach is built on our knowledge of the fertilizer market and many years of experience dealing with price volatility relating to nitrogen and phosphate fertilizers and iron ore concentrate. This volatility is generated by variations in raw material volumes on the market, political and regulatory change, farming economics, seasonality and extremes of weather. Our primary risk management aim is therefore to anticipate market volatility and act appropriately in order to protect cash flows and maintain a strong balance sheet (across-the-cycle net debt/next twelve months’ EBITDA ratio within a 1.5-2.0x band).
Managing our risks
RISKS AND UNCERTAINTIES

ST
RA
TE
GIC
RE
PO
RT
CO
RP
OR
AT
E G
OV
ER
NA
NC
EFIN
AN
CIA
L STA
TE
ME
NT
S
EuroChem Annual Report and Accounts 2014 57
Product pricing
Variations in fertilizer and iron ore prices have an impact on cash flow. While mitigating these risks through financial instruments is constrained by liquidity, we review the use of such instruments on a regular basis. Strategically, we mitigate product risk by controlling costs and broadening our product portfolio, as exemplified through our potash investments. This, allied to ongoing efficiency improvements, our ever-strengthening model of vertical integration, and geographic diversity, offer predictable and stable margins across the business.
FOREIGN CURRENCY RISKOur revenues, expenses, capital expenditure, acquisitions and borrowings are denominated in different currencies. We analyze our exposure to various exchange rate risks by looking at our projected 12 months’ rolling cash flows by currency and by business units within the Group, and take measures to reduce our cash flow exposures using a variety of tools, including borrowing in a specific currency and various derivative instruments.
INTEREST RATE RISKA proportion of our borrowings are subject to variable interest rates. While we occasionally enter into hedging arrangements to mitigate the risks associated with interest rate variations, the impact on our cash flow is usually limited. This is mainly because periods of high rates historically correspond with periods of raised commodity prices.
INCREASE IN COSTSSignificant increases in major spending items such as natural gas, electricity and transportation can have a negative impact on our cost base. We mitigate these risks in a range of ways, including investment in our own natural gas supplies, enhanced energy efficiency at our production plants and optimizing logistics through our own rail infrastructure, rolling stock, transhipment terminals and cargo vessels.
OTHER FINANCIAL RISKSOther financial risks that we monitor and mitigate relate to liquidity, credit, financial covenants, ratings and tax.
Strategic risks
Our key strategic risks relate to business and investment decisions. We identify, assess and map our response through a regular review of strategy in our main business segments. More detail on the strategic risks associated with these segments can be found on pages 24-26.
REPUTATIONAL RISKSOperational, financial and strategic issues can influence reputation; we therefore ensure that our governance and management systems are robust and effective. Clear, accurate and timely communication is crucial, therefore we have a clear strategy and processes in place, managed by our public relations, government and investor relations teams. We also have a crisis communications process that follows best international practice with the aim of informing rapidly and accurately.
Reorganization/expansion
The Group has been rapidly expanding its business and entering new markets, which poses additional risks that need to be properly assessed. In addition, in 2014 the Group embarked on the reorganization of its legal and corporate structure, which included the relocation of its headquarters to Switzerland. These recent and ongoing developments require diligent changes to the Group’s operational model.
To mitigate the above-mentioned risks, we initiated a Management Development Project (MDP), where the Group’s senior management work closely with leading international specialists.

58 EuroChem Annual Report and Accounts 2014
HIG
HP
RO
BA
BIL
ITY
LOW
LOW IMPACT HIGH
Managing our risks continued
RISKS AND UNCERTAINTIES
Preceding six months Next six months
Code Direction Event/causes Direction Event/causes
K2Decline in potash prices
Stable • Gradual rebalancing of the market post-BPC breakup with buyers replenishing stocks
Stable • The market appears balanced with supply disruptions, such as the Solikamsk-2 flooding, unlikely to significantly impact the market
N3Decline in nitrogen prices
Stable • Seasonal demand volatility and currency devaluation in developing/importer countries were mitigated by supply disruptions in Ukraine and Northern Africa
Increasing • Increasing supply from low-cost gas regions (MENA) • Reduction in urea export duty in China • An easing in the shortage of gas in Trinidad and North America • The decline in global market prices for gas resulting from lower oil prices and shale gas developments
P1Decline in iron ore prices
Increasing • A slowdown in the Chinese economy reducing construction activity. Substantial stocks of iron ore stored in Chinese ports
Increasing • Significant increases in exports from Brazil and Australia in particular
• Further decline in the demand from China
P2Decline in phosphate prices
Stable • Steady demand from India, Pakistan and other Asian countries
Stable • Steadily increasing supply from China due to a revision of export tariffs
• Growing demand from European, North and South American markets
• Record lows in stock levels point to stronger demand in the first half of 2015
• Sales volumes will be influenced by lower demand from India due to a decrease in farming subsidies
F1Cash flow/refinancing risks
Increasing • Downgrade of Russian credit rating
• Economic sanctions
Increasing • Further downgrade of Russian credit rating • Tightening of economic sanctions
F2Foreign exchange risks
Decreasing • Devaluation of Russian rouble due to oil price reduction and imposition of economic sanctions
Increasing • ECB support for a slight devaluation of the euro • Possible strengthening of the rouble’s value on improving geopolitics
F3Off-market price regulations
Stable • Economic sanctions in Russia did not have a significant influence on the fertilizer industry
Increasing • The Russian Government and State Duma are considering the introduction of export duties to limit exports of mineral fertilizers; regulatory pressures on fertilizer prices in Russia
• Tougher economic sanctions against Russian businesses
Overview and assessment of main risks and trendsThe dotted arrows illustrate potential changes to risk perception over the next six month period. The absence of an arrow implies a stable risk perception. The table below summarizes the key factors behind the highlighted changes in the risk assessments shown:
P1 N3
F1
F3
F3
F1
F2
P1N3
F2
L1
P2
N1
K1N2K2 E1
High risk probability and impact
Medium risk probability and impact
Low risk probability and impact

ST
RA
TE
GIC
RE
PO
RT
CO
RP
OR
AT
E G
OV
ER
NA
NC
EFIN
AN
CIA
L STA
TE
ME
NT
S
EuroChem Annual Report and Accounts 2014 59
Area Code Risk nature Description Mitigation Direction
PO
TAS
H K1Technical • Failure to meet potash project
deadlines and budgets due to various issues surrounding logistics, geological conditions, shaft sinking and ore extraction operations
• Involvement of experienced mining sub-contractors • Constant monitoring of project management systems and controls
• Insurance taken out for shafts
Stable
K2Potash prices • Decline in price for potash fertilizers
may result in sub-optimal returns from the potash projects
• Achieve the lowest cost-delivered-to-market globally among peers
• Increase own consumption of K by raising NPK capacity and other K-containing products
• Secure own logistics and distribution channels in key markets
Stable
NIT
RO
GE
N N1Increase in gas costs
• Differential in natural gas cost between Russian and European/US producers is decreasing
• Upstream integration • Deep modernization of ammonia production to improve ammonia gas efficiency
• Launch production of higher-value-added and premium specialty products
Stable
N2Technical • Unplanned business interruption,
including accidents and incidents due to the age and depreciation of equipment, breach of technological processes and logistics
• Full insurance coverage, including business interruptions • Controls over maintenance and repairs • Logistics management/new storage facilities
Stable
N3Nitrogen prices
• New supply from low gas cost areas may cause unfavorable shifts in EuroChem’s position on the global cost curve
• Cost reduction, deep modernization and efficiency upgrade of ammonia units
• Own natural gas capacity • Branding of specialty products
Increasing
PH
OS
PH
AT
ES
P1Iron ore • Declining iron ore prices represent
a risk to EuroChem cash flows • Iron ore hedging mechanisms • Diversification of customer base • Reduction of mining and logistics costs
Increasing
P2Phosphate prices
• New supply from low-cost areas may lead to the gradual erosion of EuroChem’s position on the global cost curve
• Partial reliance on third-party phosphate rock supply
• Tight cost control; added flexibility at production plants • Increase NPK production in line with own potash ramp-up • Increase foothold in the Group’s domestic markets • Target reductions in logistics costs • Increase own phosphate rock resource base
Stable
LOG
IST
ICS
L1Bottlenecks/increasing prices
• Limited fertilizer transhipment capacity in Russia
• Growth in the cost of rail and port services
• Limited warehousing capacity within port infrastructure
• Limited in-house transportation and freight capability
• New projects/mining and production capacities
• Build and operate own port terminals and transhipment capacity as well as storage facilities
• Acquisition of rolling stock and vessels • Accurate planning of logistics within investment/project planning • Automation of routing/dispatch model
Stable
HS
E
E1Environmen-tal/reputational
• Environmental/reputational damages due to the nature of production coupled with the age of certain assets
• Measure and monitor environmental footprint and public perception
• Reduce the environmental impact of operations • Rapid response to environmental emergencies – real and alleged • Policy of openness to the public • Insurance program
Stable
FIN
AN
CIA
L
F1Cash flow/refinancing risks
• EuroChem may not be able to cover all its planned investments from operating cash flows and new debt due to delays in the launch of projects and/or main products price reductions
• The cost of funding may increase significantly
• Maintain maximum readiness to tap all possible sources of debt and/or equity finance; including asset-based financing
• Maximum utilization of non-Russian debt capacity
Increasing
F2Foreign exchange risks
• Cash flow structure is exposed to currency exchange rate volatility
• Monitoring of positions in high risk currencies; hedging to the extent possible
• Match borrowing and cash inflow currencies
Increasing
F3Off-market price regulations
• Implementation of protective import/export duties and other restrictions
• Regulation of fertilizers prices in Russia
• Continuous monitoring of trade legislation and potentially restrictive initiatives across all markets
Increasing

60 EuroChem Annual Report and Accounts 2014
EuroChem’s business model was formulated in 2001 with the ambitious goal of creating a global player in the agrochemical sector. We have come a long way since then.
Our strategy dictated a significant level of investment in phosphate and nitrogen production alongside wholly-owned raw material, infrastructure, logistics, and distribution capabilities. While the Group’s core assets were predominantly in Russia, we also looked for international growth opportunities from the outset. Complementing our operations in Russia, we now operate assets in Belgium, Lithuania and Kazakhstan and in 2014 entered into a joint venture in China.
Today, the depth of our business model is unmatched. Underpinned by the Group’s access to low-cost and high-quality resources, our vertical integration encompasses world-class facilities offering an advanced product mix coupled with global logistics and distribution infrastructure reaching more than 6,000 customers in over 100 countries. As the years pass, we have
grown with our customers’ needs, moving towards specialty products and a more tailored approach to production and sales.Looking further ahead, our strategy evolved to include potash. Our ambitious plan to operate in the potash segment is being realized as we continue to make progress with our two key mining and processing assets. While we realize the commercial benefits of our investments in assets and people, we have created a new corporate structure to secure the next globalizing phase of our development. This is a strong and secure vehicle to maximize the potential of our assets and support our ambition of becoming a top five player globally and a model company within the agrochemical sector.
REALIZING OUR INVESTMENTS IN ASSETSWe have completed a raft of key projects and made significant progress with others over the last year, with a strong drive towards the further integration of our raw materials operations. We upgraded and added ammonia production at our Novomoskovskiy
Azot and Nevinnomysskiy Azot facilities and further refined our plans to commission new large-scale ammonia facilities within the next five years. Our melamine plant at Nevinnomysskiy Azot, which came online in 2012, is now running at full capacity and the sulphuric acid plant at Phosphorit was re-commissioned following an extensive upgrade. Our potash projects continued at great pace with shaft sinking completed and funding secured to implement the first phase of our Usolskiy project and shaft sinking progressing beyond the last water bearing rock at our VolgaKaliy project.
OUR BUSINESS MODEL DELIVERSWe have also continued to realize our ambition to produce more higher-value, specialty fertilizer products, tailored to the varied needs of our customers, based on geography and application and engineered for optimal yield growth. This shift has driven the development of a more flexible distribution system that can flex with the varied demands of both commodity and specialty products, as well as accommodate the scheduled increase in our output once our potash operations come on stream from 2017.
A GLOBAL COMPANYIn July 2014 we established EuroChem Group AG, a new holding company for all our group operations, based in Zug, Switzerland. This marked a significant step in our long-term ambition to become a global player, strengthening our ability to access financial markets, strike strategic alliances and exploit international expansion opportunities.
RIGOR IN GOVERNANCEWe have also continued reshaping corporate governance to fully reflect and support our new corporate structure. This transition is now complete as the Board of EuroChem Group AG is constituted in line with Swiss law. This body delegates and oversees the work of the Management Board. Bringing further valuable international experience to the Board we welcomed Kent Potter in June 2014, who was appointed as Chairman of the Audit Committee. Recognizing our growing footprint and complexity, we are very pleased to welcome Manfred Wennemer, Juerg Seiler and Nicholas Page to the Board, adding to our pool of deep extensive industry expertise combined with global perspectives.
A year of transition...EUROCHEM GROUP AG CHAIRMAN’S STATEMENT
Alexander LandiaChairman of the BoardEuroChem Group AG

CO
RP
OR
AT
E G
OV
ER
NA
NC
EFIN
AN
CIA
L STA
TE
ME
NT
S
EuroChem Annual Report and Accounts 2014 61
INVESTING SUSTAINABLYSustainability is in-built to our business strategy. Our investment in existing and new assets will be realized through our ability to recruit, develop and retain the skills of current and prospective employees. Our aim is to develop and harness a talented team that will add sustainable value to the business. We will do this through our ability to attract skilled individuals from new areas of operation, our ongoing focus on science and engineering education in schools and universities, innovative ways of sharing knowledge through the business and our value chain, as well as an ability to develop the competence and career aspirations of our employees.
We have also made a commitment to become a health and safety exemplar company by 2018. We are two years into the associated roadmap, which has involved working with world leading advisors and piloting best in class safety systems. Our ambition from 2015 is to embed these systems and behaviors across the group.
We have a long-standing commitment to environmental sustainability, which for us means a strong focus on waste and effluent reduction, recycling, emissions control and improved water and enhanced energy efficiency. Having further bolstered our HSE function, we expect to see continued progress in this area.
THE PATH TO GROWTHWe have set out a clear pathway to double current earnings growth organically over the next ten years. This is based on our track record over the past years, creating and enacting our business model. With the Group’s new corporate structure in place, we are confident that we have the right platform to release the full commercial potential of existing and potential assets. Looking ahead, we are well positioned to leverage our low cost base and integrated value chain in order to take advantage of the trend for consolidation in our industry, and we are committed to securing superior shareholder returns as we create the ideal agrochemical company for the 21st century.
...paving the way for growth
ST
RA
TE
GIC
RE
PO
RT
Reorganization noteDriven by the growing internationalization of its businesses, the rising number of international M&A opportunities and other capital markets considerations, the Group has initiated a corporate reorganization, including the re-domiciling of its headquarters to Switzerland. For this purpose, the Group established EuroChem Group AG, a new holding company based in Zug, Switzerland.
EuroChem Group AG’s consolidated financial information should be viewed as a continuation of the consolidated financial statements of EuroChem Group prior to the change in corporate structure. The change in the Group’s presentation currency from the Russian rouble to the US dollar was introduced by management as it considers the US dollar to be more appropriate for the understanding and comparability of consolidated financial information.
Initiated in 2012, the optimization of the Group’s structure was approved by the Board of Directors in 2014. This information had been previously disclosed in corporate presentations and the Information Memorandum for the Group’s Eurobonds issued in December 2012.
The reorganization was agreed with the Group’s lenders as well as pre-agreed by Eurobond holders upon issuance. EuroChem Group AG guarantees the Eurobonds issued by EuroChem Global Investments Limited.
In the fourth quarter of 2014, both S&P and Fitch Ratings assigned EuroChem Group AG a ‘BB’ rating with stable outlook and affirmed Russia-based MCC EuroChem, JSC at ‘BB’ with stable outlook. The ratings are underpinned by the Group’s high degree of self-sufficiency in raw materials, strong market presence in Europe and Russia, product diversification, and commitment to maintaining a moderate financial policy.
The Group remains committed to following best international corporate governance practices as the necessary amendments to its corporate governance structure are being implemented to reflect its new legal structure.
TRANSITION TO EUROCHEM GROUP AG CORPORATE GOVERNANCE STRUCTUREWhile this annual report presents the financial results of EuroChem Group AG (Switzerland) as at 31 December 2014, the description and overview of the activities of the Board and its Committees contained in this report mostly relate to MCC EuroChem, JSC (Russia).
The Board of Directors of EuroChem Group AG formulates the strategy for the Group and ensures that proper checks and balances are in place to serve our stakeholders. By keeping management accountable for its performance and monitoring the execution of strategic projects, the Board will continue its role of supporting and developing the Group’s core activities, while sustaining the creation of corporate value.
The members of the Board of Directors of EuroChem Group AG presented on pages 62-63 were elected at the Group’s first AGM on 13 April 2015.

62 EuroChem Annual Report and Accounts 2014
EUROCHEM GROUP AG BOARD OF DIRECTORS
On board
CHAIRMAN AND INDEPENDENT DIRECTORMember of the Strategy Committee.
BACKGROUND AND EXPERIENCEMr Landia joined Dresdner Bank in Frankfurt in 1993, and left in 2001 as First Vice President Oil & Gas Global Debt. Between 2001 and 2006, he was a Partner of Accenture, as General Director of Accenture Russia and subsequently Global Gas Lead Partner. Between 2006 and 2010 he chaired OAO SUEK’s Board of Directors, and currently is a director and chairman of the Nomination and Compensation Committee and a member of the Strategy Committee of SUEK PLC.Alexander is a co-founder and Director of MFEP Mature Fields Enterprise Partners (UK) and a co-founder and
NON-EXECUTIVE DIRECTORChairman of the Strategy Committee.
BACKGROUND AND EXPERIENCEOver the past 20 years, Mr Melnichenko co-founded a number of successful Russian companies including MDM-Bank, EuroChem, SUEK, SGC (Siberian Generating Company) and TMK. He is the main beneficiary of EuroChem, SUEK and SGC. Mr Melnichenko chairs the Boards of Directors of SUEK PLC and SGK. He sits on the board of the Russian Union of Industrialists and Entrepreneurs.
CHIEF EXECUTIVE OFFICER
BACKGROUND AND EXPERIENCEDmitry has extensive experience in business administration, particularly in large industrial corporations.
During his career, Dmitry has served as the Head of Agrodortekhsnab LLP and Tekhsnab-2000 LLC – trading companies that sell road and construction machinery and provide maintenance work. He was also deputy Director of Dorstroykomplekt CJSC, before becoming Director General of JSC Likino Bus Plant.Prior to EuroChem, Dmitry held executive positions in the automobile industry at RusPromAvto LLC, and GAZ OJSC.
INDEPENDENT DIRECTORChairman of the Audit Committee.
BACKGROUND AND EXPERIENCEMr Potter joined Chevron in 1974. In his 27 years with Chevron he held financial management positions in all areas of Chevron’s operations. These included Finance Director for Chevron’s North Sea operations, CFO of Tengizchevroil in Kazakhstan and CFO of Chevron Overseas Petroleum, Chevron’s international exploration and production company.In 2003, Mr Potter was appointed Chief Financial Officer of TNK-BP, which at the time was Russia’s second largest oil company. In addition to being responsible for all financial
INDEPENDENT DIRECTORMember of the Strategy Committee.
BACKGROUND AND EXPERIENCEFollowing 42 years in the mining industry, Mr Moore retired in July 2012 from his position as President, PCS Potash, a division of Potash Corporation of Saskatchewan Inc. Prior to his appointment in 1997, he was Senior Vice President of Technical Services for the Corporation. Joining PCS in 1982, Garth held senior mine operating positions including General Manager at both the Rocanville and Lanigan Operations. Prior to this, he held various positions with Noranda Inc., Central Canada Potash and International Minerals and Chemicals Corporation.He is a past Director of Arab Potash Company, the Canadian Environmental Technology Advancement
managing director of Bernotat & Cie (Germany). He is a member of the Board of directors of Lambert Energy Advisory (UK) and Barloworld (South Africa). He is also a shareholder and member of the Supervisory Board of The Mobility House AG (Switzerland).
QUALIFICATIONSAlexander graduated from Tbilisi State University with honours, and has a Candidate’s Degree (PhD) in mathematics from the Minsk Institute of Mathematics of the National Academy of Science (Belarus).
Does not hold Company shares.
QUALIFICATIONSMr Melnichenko studied physics at the Lomonosov Moscow State University and graduated from the Plekhanov Russian Academy of Economics majoring in finance and credit.
QUALIFICATIONSDmitry graduated with honours from Lomonosov Moscow State University with a degree in Physics and has an MBA from the Academy of National Economy under the Government of the Russian Federation.
Dmitry Strezhnev is a beneficiary of a company which owns 7.8% of EuroChem Group SE.
activities for TNK-BP, he also directed the company’s corporate restructuring and accounting transformation initiatives.Most recently, Mr Potter has served as Executive Vice President and CFO of LyondellBasell, the world’s third largest petrochemical company, playing an instrumental role in helping the company emerge from Chapter 11.Kent is a member of the Board of Directors of SUEK.
QUALIFICATIONSKent holds a BA in engineering and an MBA from the University of California, Berkeley.
Does not hold Company shares.
Corporation, past Chairman and Director of the Saskatchewan Potash Producers Association, and past President and Director of the Saskatchewan Mining Association.He is currently a member of the Association of Professional Engineers and Geoscientists of Saskatchewan and the Canadian Institute of Mining, Metallurgy and Petroleum.
QUALIFICATIONSGarth graduated from the University of Saskatchewan with a Bachelor of Science degree in Mining Engineering in 1970. He also completed the Columbia Senior Executive Program at Columbia Business School in 1997.
Does not hold Company shares.
The members of the Board of Directors of EuroChem Group AG were elected at the Group’s first AGM on 13 April 2015. Additional details on the transition from MCC EuroChem, JSC to EuroChem Group AG level are presented on page 61.
01
02
03
04
05
Alexander Landia
Andrey Melnichenko
Dmitry Strezhnev
Kent Potter
Garth Moore

ST
RA
TE
GIC
RE
PO
RT
CO
RP
OR
AT
E G
OV
ER
NA
NC
EFIN
AN
CIA
L STA
TE
ME
NT
S
EuroChem Annual Report and Accounts 2014 63
NON-EXECUTIVE DIRECTORMember of the Audit Committee and Nomination and Remuneration Committee.
BACKGROUND AND EXPERIENCEFrom 2006 to 2008 Nikolay was the CFO of EuroChem, a position which has provided him with an in-depth knowledge of the Company’s operations and financial management.Before joining EuroChem, he worked for ABB Group, holding various of managerial positions in Russia, Spain and Switzerland.Nikolay is a member of the Board of Directors of the Siberian Generating Company LLC (since 2012).
INDEPENDENT DIRECTORChairman of the Nomination and Remuneration Committee.
BACKGROUND AND EXPERIENCEIn 1989 Vladimir founded and was CEO of ECOPSY Consulting company, specializing in human resource management, motivation and development. He also served as chairman of its board. He had previously worked as a consultant at RHR International (Chicago, US). From 2006-2007, Mr Stolin was a member of the Pharmacy Chain 36.6 Board of Directors. During this time he also served as chairman of the MDM Bank Board of Directors.Since 2011, Mr Stolin has been a member of the Board of Directors of the Siberian Generating Company LLC, where
INDEPENDENT DIRECTORMember of the Nomination and Remuneration Committee.
BACKGROUND AND EXPERIENCEManfred started his career at Procter & Gamble, Germany. After a short period at Arthur D. Little Wiesbaden, Mr Wennemer took up several management positions in companies and business units belonging to the Freudenberg Group in Germany, South Africa and North America, where from 1992-1994 he bore responsibility for the worldwide spun bond business. In 1994 he moved to the Continental Group where he started as Executive Board Chairman at Benecke-Kaliko AG, a company belonging to the Continental Corporation’s ContiTech division. In 1998 Mr Wennemer was appointed chairman of the management board of ContiTech Holding GmbH and, at the same time, was assigned a seat on the Continental AG Executive Board. In 2001 he was nominated
INDEPENDENT DIRECTORMember of the Audit Committee.
BACKGROUND AND EXPERIENCEMr Seiler served as a Chief Financial Officer (CFO) at Ventyx, the Enterprise Software business of ABB from 2012 till 2014. Prior to taking up this role, he was global CFO at ABB Power Systems Division and earlier CFO at ABB Lummus Global. Mr Seiler has over 30 years of international experience including assignments in South Africa, Hong Kong, USA and Switzerland. He previously held several key financial positions across countries and businesses.
NON-EXECUTIVE DIRECTOR
BACKGROUND AND EXPERIENCEMr Page’s career includes nearly 25 years working for PricewaterhouseCoopers (PwC) in the UK and Russia. He was a partner in the UK firm from 2003 to 2014, and from 2013 to 2014 was a member of the PwC Central and Eastern European (CEE) Management Board and the CEE-UK Development Committee.At PwC, Nicholas specialized in advice to financial institutions, financial sponsors and multi-national companies in relation to domestic and cross-border M&As, IPOs and restructuring.
QUALIFICATIONSMr Pilipenko graduated from Moscow State University and holds a PhD in economics.
Does not hold Company shares.
he chairs the Personnel Committee.Vladimir is a member of the American Society of Training and Development and he is the author of numerous scientific publications in the fields of management and psychology, including three monographs.
QUALIFICATIONSVladimir graduated from Lomonosov Moscow State University with a degree in Psychology. He went on to earn a Doctorate in Psychology.
Does not hold Company shares.
by the Supervisory Board to chair the Executive Board and held this position until August 2008.Mr Wennemer has 30 years of experience in the manufacturing industry. He holds several advisory and supervisory board positions for German and international companies. He is a member of the supervisory boards at Allianz Deutschland AG and Knorr-Bremse AG, the Chairman of the board at SAG AG and the Chairman of the Shareholder Committee at Hella KGaA Hueck & Co. He serves as an Independent Director and Member of the Strategic Committee in NV Bekaert SA.
QUALIFICATIONSManfred holds a Master’s Degree in Mathematics from the University of Münster, Germany and an MBA from INSEAD Fontainebleau, France.
Does not hold Company shares.
QUALIFICATIONSMr Seiler holds a Master’s degree in Economics from University of St. Gallen, Switzerland. Does not hold Company shares.
Nicholas is a member of the Board of Directors of SUEK. He is also a member of the non-executive Strategic Advisory Board of the School of Business & Economics at Loughborough University in the UK.
QUALIFICATIONSHe holds a BEng (Hons) from Loughborough University and has been awarded FCA status by the Institute of Chartered Accountants of England and Wales (ICAEW).
Does not hold Company shares.
COMPOSITION OF COMMITTEES
Audit 04 06 09
Strategy 01 02 05
Nomination and Remuneration
06 07 08
06
07
08
09
10
Nikolay Pilipenko
Vladimir Stolin
Manfred Wennemer
Juerg Seiler
Nicholas Page
64 EuroChem Annual Report and Accounts 2014
THE STRATEGY COMMITTEETHE AUDIT COMMITTEE
EUROCHEM GROUP AG COMMITTEES
Chairman: Andrey Melnichenko (NED)
Alexander Landia (IND)
Garth Moore (IND)
Chairman: Kent Potter (IND)
Juerg Seiler (IND)
Nikolay Pilipenko (NED)
StrategyCommittee
AuditCommittee
PRIORITIES FOR 2015The Committee will focus on the Company’s strategic plans and investment projects. It will tackle capital management and the creation of shareholder value. The Committee is also expected to play a key role in the introduction of advanced management methods, the evolution of the Company’s structure, the reorganization and adjustment of business processes, the implementation of the new economic model, and building up the management team in line with the Company’s targets.
The Committee and key managers assess growth opportunities within the context of industry developments and the wider economy. A primary aim is to ensure that we maintain steady growth and minimize the potential risks from negative economic externalities.
Given the Group’s ongoing and potential large-scale industrial projects, the Committee will focus on oversight and control over investment decisions, processes, and reporting, the latter improved to encapsulate sensitivity analysis and recording of management decisions and corrective actions. Project completion reports will provide an improved view on project efficiency.
The Committee will also consider the level of financing required to implement the Group’s strategic plans. It will coordinate improved business planning, finance, budget policy and the review the Company’s valuation methodology.
PRIORITIES FOR 2015The Committee will continue improving external reporting to provide all stakeholders the timely information they need to understand the Group’s strategy, and financial and operating performance. At the same time, we are expanding our internal management reporting, consistent with building a world-class internal control environment. Our goal will be to provide decision makers at all levels of the organization the information they need to make decisions while providing the Board and senior management with the insights they need to drive improved business performance.
We are also examining and strengthening all of the Group’s compliance activities in view of the additional requirements under our new corporate legal structure. Fundamental to our business success is the existence of a strong culture of corporate compliance and internal control.
Finally, we are restructuring the Group’s internal audit function to support the company’s international expansion and increasing compliance requirements. This will involve targeted recruitment, and additional training and development to insure our internal audit staff has the skills necessary to support the Company’s compliance program.

ST
RA
TE
GIC
RE
PO
RT
CO
RP
OR
AT
E G
OV
ER
NA
NC
EFIN
AN
CIA
L STA
TE
ME
NT
S
EuroChem Annual Report and Accounts 2014 65
THE NOMINATION AND REMUNERATION COMMITTEE
The reorganization of the EuroChem Group brings new challenges and opportunities to our company’s compliance and internal control activities. In 2015 we will focus on improving our internal management reporting to strengthen internal controls and management accountability, expanding our international compliance activities consistent with our new structure and increasing the effectiveness of our internal audit function.”Kent PotterChairman of the Audit Committee
The Committee will play a key role in strengthening the links between management performance in relation to safety and the Group’s strategic objectives.”Vladimir StolinChairman of the Nomination and Remuneration Committee
The Committee will continue to define and monitor the Group’s strategic course, ensuring the creation of sustainable shareholder value.”Andrey MelnichenkoChairman of the Strategy Committee
Chairman: Vladimir Stolin (IND)
Manfred Wennemer (IND)
Nikolay Pilipenko (NED)
Nomination and Remuneration Committee
PRIORITIES FOR 2015Our growth and expansion creates opportunities but also produces new challenges, which we need to tackle accordingly. Over the coming year the Committee will continue in its effort of bringing new expertise and building the additional skills needed by the Group, whether at the Board level or within the senior management team.
The Committee will actively participate in the Group’s reorganization with the goal to align management structure to strategic initiatives and key business processes. We will approve the incentives programs linked to major investment projects as well as set and monitor senior management targets.
Our commitment to high standards of corporate governance and social responsibility remains unchanged but requires strengthening and focus. In 2015 the Committee will oversee the further development of Health, Safety and Environment (HSE) objectives and the introduction of HSE KPIs throughout the Group.

66 EuroChem Annual Report and Accounts 2014
MCC EUROCHEM CORPORATE GOVERNANCE REPORT
THE BOARD’S STRATEGIC ROLEOur aim has been to become a world leader in the agrochemical sector. Consequently, the Board’s mission is to ensure that we have a solid and consistent strategy, achieve business goals, and can deliver shareholder and stakeholder value in the long-term. The Board also ensures that we adopt international standards and best practice and monitors our accounting function, risk management processes, internal controls and governance framework.
Each member of the Board has built a sound understanding of the business and our industry. They develop relationships with – and access information from – the management team, in particular on strategy implementation, risk monitoring and assessment of key material issues. We make full use of each Board member’s skills sets and experience and ensure that each individual has ample opportunity to express opinions and have their say.
TAKING INFORMED DECISIONSIn addition to materials prepared for formal quarterly meetings, Board members are provided with periodic updates, including management accounts, flash reports, status updates on industrial health and safety, updates on the Group’s legal proceedings, media overviews, information on corporate events and reviews of strategic projects. When a significant event occurs, Board members are the first to obtain up-to-date information from the management team. This communication process is defined in a policy and associated procedures.
Equal treatment of our shareholders, and recognition and protection of their rights
Highest levels of business ethics
Operating an effective system of internal control and audit
Providing an excellent working environment, career progression and effective communication mechanisms
Ensuring access to Company information and financial transparency
EuroChem’s corporate governance system is based on the following principles:
EQUAL TREATMENT
BUSINESSETHICS
INTERNAL CONTROL
WORKING ENVIRONMENT
TRANSPARENCY
Board’s prioritiesThe Board’s primary activities include:
• Developing strategic long-term vision and corresponding goals
• Reviewing management performance against these goals
• Management succession
• Approval of target states and key functions of the Company
• Exercising oversight of control and risk management procedures
• Consideration of strategic opportunities
• Guiding EuroChem’s senior management and advise on key strategic decisions
2014 Governance Report The description and overview of the Board, its activities and Committees for the year ended 31 December 2014 contained in this section relate to MCC EuroChem, JSC (Russia). The EuroChem AG Board of Directors, Committees and priorities for 2015 are presented on pages 62-65.

ST
RA
TE
GIC
RE
PO
RT
CO
RP
OR
AT
E G
OV
ER
NA
NC
EFIN
AN
CIA
L STA
TE
ME
NT
S
EuroChem Annual Report and Accounts 2014 67
To facilitate the understanding of our operations, Board members undertake yearly site visits to one of our facilities.
The agenda for Board activity is planned twelve months in advance, taking into account the optimal cycle for reviewing recurrent issues such as budgets, financial reporting and strategy. The timing, expectations and goals of these reviews are well understood by both the Board and management team and include detailed updates on core operational areas, investment projects and strategy.
Each Board member is assessed annually by their fellow Directors, at which time they also evaluate their own contribution. The assessment has focused on strategy and risk resilience, but this was strengthened and improved in 2014.
THOROUGH INDUCTIONWe provide every new Director with a clear picture of our business and operations as soon as they join the Board. This formal induction process also requires learning the regulations pertaining to Board procedures, standing items on the Board’s forward agenda and a round of meetings with key managers. New Directors are also given the opportunity to visit one of our facilities during their induction.
In 2014 we started an integrated training program for Board members. This supplements the general induction and is designed to enhance decision making.
INDEPENDENT JUDGEMENTWe have adopted the UK Corporate Governance Code definition of ‘independent’ Director. A key criterion is that the individual is free from any conflicts of interest. If such actual or potential conflicts arise, independent Directors are notified and are required to act appropriately.
New Directors are required to declare any conflicts of interest and sign up to the Company’s Board Regulations. This requires them to refrain from taking action that could lead to a conflict of interest and the
responsibility to inform the Chairman as soon as possible. According to Russian legislation, information on related party transactions are disclosed. The annual report and website disclose cross Board memberships, the existence of controlling shareholders and related parties.
At the end of 2014, five of the Board’s nine Directors were fully independent of the Company’s executives, affiliates and major counterparties. Their independent status is confirmed by the Board of Directors after each election or re-election using a standard questionnaire relating to the declaration of interests. All Directors are required to inform the Company of any events which could lead to the loss of their independent status.
LEADERSHIP BY EXAMPLEThe Chairman oversees and guides the Board and is responsible for ensuring its effectiveness by facilitating open communications, developing relations and creating a culture of mutual respect and constructive debate.
The Board sets company strategy and monitors its progress. The strategy is implemented by the General Director and members of the Management Board, who are responsible for company performance. The Management Board is comprised of key managers with responsibility for finance, fertilizer production, mining, sales, logistics, marketing and administration.
The Board of Directors appoints the CEO and the members of the Management Board and determines the length of their terms.
There are three Committees chaired by Board members – the Audit Committee, the Corporate Governance & Personnel Committee and the Strategy Committee.
The Audit Committee’s primary function is to oversee the quality of financial and sustainability reporting and the integrity of information disclosure. The Finance Director and Head of Internal Audit attend all meetings with active participation from external auditors and the Corporate Secretary.
The Administrative Director is ultimately responsible for the timely production of the sustainability report.
The Strategy Committee reviews and approves divisional and departmental strategy, development projects, acquisitions and significant investment decisions. This requires environmental and social impact competence as our investment activity can impact the local environment and create infrastructure and opportunities for local employment.
The Corporate Governance & Personnel Committee focuses on remuneration and incentives, staffing requirements at ongoing investment projects, the introduction of health and safety performance indicators within the management incentive program and reviewing and updating the EuroChem Codes of Business Conduct and Ethics.
MCC EuroChem, JSC is a member of the Russian National Council for Corporate Governance, a non-governmental organization aiming to educate Boards and improve standards of governance throughout the country.
IMPROVING DIVERSITYIn line with our Human Resources Policy, we aim to attract the best people with the right talent to complement our skills, irrespective of gender or ethnicity.
Our Board of Directors demonstrates diversity of experience, opinion, and nationality. The gender imbalance across our Group companies is an ongoing issue, as it is for many other businesses in the science, mining and engineering sectors. Nevertheless, we continue to look at ways of improving gender balance in senior roles, including our E-Generation program, which is identifying the bright and motivated young men and women who will lead the Company in the years ahead.
ETHICS AND CORPORATE BEHAVIOREuroChem has operated a formal Code of Ethics and Code of Conduct since 2007.

68 EuroChem Annual Report and Accounts 2014
GOVERNANCE STRUCTURE The Company’s highest-ranking governance body is the General Meeting of Shareholders (GM). The Board of Directors reports directly to the GM. The primary focus of the Board itself is to steer and support the Company’s strategic development, with an emphasis on oversight in the implementing of strategic initiatives.
Elected by the GM, the Board of Directors appoints the General Director and the Management Board and determines the length of their terms. These executive bodies report directly to the Board of Directors, which is represented by the Chairman.
The Board of Directors works to a forward agenda that is updated annually. The schedule for a year includes six joint-presence meetings covering the issues that require substantive discussion. When necessary, additional meetings are held either by conference call or, for procedural issues, by absentee vote.
The Board considers all issues that are referred to it by law and the Company Charter. This includes key decisions for the production companies and exercising oversight down through the management structure.
The Corporate Secretary oversees all preparations for Board and Committee meetings. All documentation for the Board of Directors and Board Committees is prepared in both Russian and English, and synchronized interpretation is provided at meetings. These efforts allow each Director to express their own opinion in his or her preferred language while putting aside any risk of misunderstandings.
The key Company documents defining our approach to corporate governance are: • Company Charter • Board of Directors’ Regulations • Committee Regulations • Management Board Regulations • Code of Corporate Conduct • Code of Ethics • Information Policy • Insider Information Regulations
These documents are available on the corporate website and are updated as and when necessary.
THE LEGAL AND REGULATORY ENVIRONMENTWe follow the Code of Corporate Governance recommended by the UK Corporate Governance Code and apply recognized international best practice, for example: • The positions of Chairman of the Board
of Directors and Chief Executive Officer are kept separate
• Members of the Board of Directors are elected, and the Board’s performance is assessed annually
• The Board (not including the Chairman) consists mainly of independent non-executive Directors
• The independence of individual members is verified by the Board of Directors
• Independent Directors are represented on the Company’s Corporate Governance & Personnel and Audit Committees. All Directors have experience relevant to their work on the Committee
• Individual Board members avoid potential conflicts of interest when making decisions
SHAREHOLDER STRUCTUREAt 31 December 2014, EuroChem Group SE owned 100% of the share capital of EuroChem Group AG. A company that holds business interests beneficially for Mr Andrey Melnichenko and his family owns 100% of Linea Ltd registered in Bermuda, which in turn owns 92.2% (31 December 2013: 92.2%) of EuroChem Group SE. The remaining 7.8% (31 December 2013: 7.8%) of EuroChem Group SE is held indirectly by Mr Dmitry Strezhnev, CEO of the Group.
CHARTERED CAPITALMCC EuroChem, JSC chartered capital equals RUB 6,800,000,000 (six billion eight hundred million). MCC EuroChem, JSC chartered capital has been divided into 68,000,000 (sixty-eight million) common shares with a par value of RUB 100 (one hundred) each.
BOARD COMPOSITIONAs of the beginning of 2014, the Board consisted of eight members: Andrey Melnichenko, Andrea Wine, Nikolay Pilipenko, Vladimir Stolin, Dmitry Strezhnev, Alexander Landia, Garth William Moore and Richard Lindsey Sheath.
At the Annual General Meeting of Shareholders on 16 June 2014, seven Directors were re-elected to the board: Andrey Melnichenko, Andrea Wine, Nikolay Pilipenko, Vladimir Stolin, Dmitry Strezhnev, Alexander Landia and Garth William Moore. Two new Directors were elected – Clifford Kent Potter and Mikhail Kuznetsov.
As at 31 December 2014, EuroChem’s Board of Directors comprised nine Directors: Andrey Melnichenko, Dmitry Strezhnev, Andrea Wine, Nikolay Pilipenko, Vladimir Stolin, Garth William Moore, Clifford Kent Potter, Mikhail Kuznetsov and Alexander Landia.
MCC EUROCHEM CORPORATE GOVERNANCE REPORT
EUROCHEM SHAREHOLDERS
As at 31 December 2014 As at 31 December 2013
Sharesnumber
Share capital%
Sharesnumber
Share capital%
EuroChem Group SE – – 59,401,991 87.36EuroChem Capital
Management LTD – – 8,598,009 12.64EuroChem Group AG 68,000,000 100 – –
2014 Governance Report continued
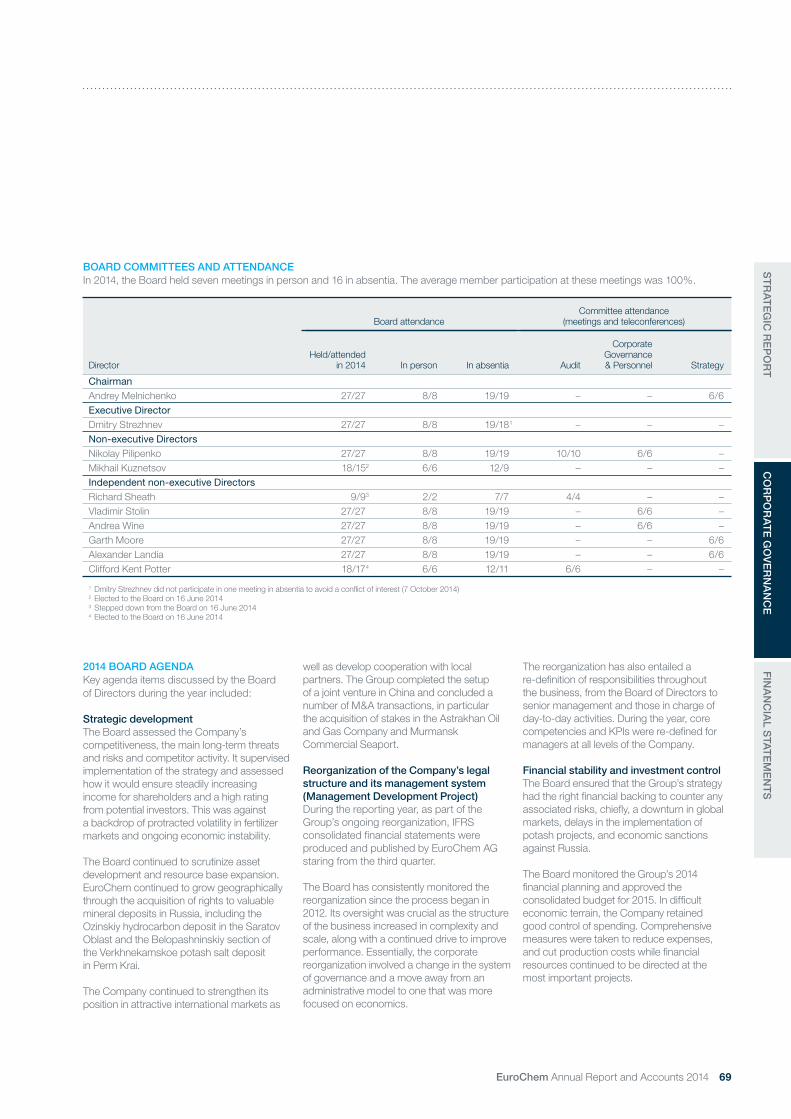
ST
RA
TE
GIC
RE
PO
RT
CO
RP
OR
AT
E G
OV
ER
NA
NC
EFIN
AN
CIA
L STA
TE
ME
NT
S
EuroChem Annual Report and Accounts 2014 69
BOARD COMMITTEES AND ATTENDANCEIn 2014, the Board held seven meetings in person and 16 in absentia. The average member participation at these meetings was 100%.
Director
Board attendanceCommittee attendance
(meetings and teleconferences)
Held/attended in 2014 In person In absentia Audit
Corporate Governance & Personnel Strategy
ChairmanAndrey Melnichenko 27/27 8/8 19/19 – – 6/6Executive DirectorDmitry Strezhnev 27/27 8/8 19/18 1 – – –Non-executive DirectorsNikolay Pilipenko 27/27 8/8 19/19 10/10 6/6 –Mikhail Kuznetsov 18/152 6/6 12/9 – – –Independent non-executive DirectorsRichard Sheath 9/93 2/2 7/7 4/4 – –Vladimir Stolin 27/27 8/8 19/19 – 6/6 –Andrea Wine 27/27 8/8 19/19 – 6/6 –Garth Moore 27/27 8/8 19/19 – – 6/6Alexander Landia 27/27 8/8 19/19 – – 6/6Clifford Kent Potter 18/17 4 6/6 12/11 6/6 – –
1 Dmitry Strezhnev did not participate in one meeting in absentia to avoid a conflict of interest (7 October 2014) 2 Elected to the Board on 16 June 20143 Stepped down from the Board on 16 June 20144 Elected to the Board on 16 June 2014
2014 BOARD AGENDAKey agenda items discussed by the Board of Directors during the year included:
Strategic developmentThe Board assessed the Company’s competitiveness, the main long-term threats and risks and competitor activity. It supervised implementation of the strategy and assessed how it would ensure steadily increasing income for shareholders and a high rating from potential investors. This was against a backdrop of protracted volatility in fertilizer markets and ongoing economic instability.
The Board continued to scrutinize asset development and resource base expansion. EuroChem continued to grow geographically through the acquisition of rights to valuable mineral deposits in Russia, including the Ozinskiy hydrocarbon deposit in the Saratov Oblast and the Belopashninskiy section of the Verkhnekamskoe potash salt deposit in Perm Krai.
The Company continued to strengthen its position in attractive international markets as
well as develop cooperation with local partners. The Group completed the setup of a joint venture in China and concluded a number of M&A transactions, in particular the acquisition of stakes in the Astrakhan Oil and Gas Company and Murmansk Commercial Seaport.
Reorganization of the Company’s legal structure and its management system (Management Development Project)During the reporting year, as part of the Group’s ongoing reorganization, IFRS consolidated financial statements were produced and published by EuroChem AG staring from the third quarter.
The Board has consistently monitored the reorganization since the process began in 2012. Its oversight was crucial as the structure of the business increased in complexity and scale, along with a continued drive to improve performance. Essentially, the corporate reorganization involved a change in the system of governance and a move away from an administrative model to one that was more focused on economics.
The reorganization has also entailed a re-definition of responsibilities throughout the business, from the Board of Directors to senior management and those in charge of day-to-day activities. During the year, core competencies and KPIs were re-defined for managers at all levels of the Company.
Financial stability and investment controlThe Board ensured that the Group’s strategy had the right financial backing to counter any associated risks, chiefly, a downturn in global markets, delays in the implementation of potash projects, and economic sanctions against Russia.
The Board monitored the Group’s 2014 financial planning and approved the consolidated budget for 2015. In difficult economic terrain, the Company retained good control of spending. Comprehensive measures were taken to reduce expenses, and cut production costs while financial resources continued to be directed at the most important projects.

70 EuroChem Annual Report and Accounts 2014
A number of major loans from leading banks were approved, including the project finance of the Usolskiy potash project and geological surveying at Severneft-Urengoy.
Various large-scale investment projects to upgrade outdated facilities, introduce new technology, develop deposits and improve competitiveness were approved.
The Board Committees made sure that executives used reliable project control mechanisms. The Board receive regular status reports on the biggest projects, including potash and phosphate rock projects, low-density ammonium nitrate production, and ammonia plant upgrades and construction projects. Board members also visited operations to personally observe the status of projects.
During the reporting year, the Board reviewed an environmental project at Phosphorit, where the water runoff and treatment system were reconstructed. The Board also focused on the independent assessment of this new equipment and its reliability, which has been regularly monitored by independent experts since 2012.
Production safetyProduction safety performance was a priority issue. The Board was informed promptly about significant incidents affecting employees, contractors and the environment.
Unfortunately, the Group witnessed six fatal accidents in 2014, all involving employees of contractors working at its facilities. As a consequence, further work was done to strengthen the requirements for contractors. The latter are now legally obliged to comply with our safety requirements and manage the behavior of their employees.
With the help of DuPont consultants, training events are ongoing for mid-level employees. In addition, working groups have been set up to focus on working at height procedures, moving around sites and electrical safety. Employees also have opportunities to visit other companies in order to share safety culture experiences. More training workshops are also being held and a system for communicating operational safety information across all sites is being created.
Although the overall injury rate is within our target limits, the Company implemented a range of injury prevention measures to, as a minimum, ensure compliance with legal regulations. Key measures focused on those activities carrying a high risk of injury, such as chemical equipment cleaning and construction.
In 2014, a complete review of the Company’s production safety regulations was initiated with KPIs for occupational safety developed and linked to personnel incentive programs. HSE reporting is being developed in three core areas: Occupational Health and Safety, Industrial Safety and Environmental Safety.
EuroChem actively invested in further measures to mitigate its environmental impact, including a continued focus on emission and discharge reductions and increasing the effectiveness of internal industrial environmental controls. The Company is adopting standards based on the best available technology, which will improve compliance and may exempt it from additional risks and charges. Across the Group, our managers and specialists have contributed to the development of tighter Group-wide environmental laws and regulations.
Risks and internal controlThe Board ensured that risk management is fully integrated into ongoing decision-making. A new risk management standard was first introduced within Treasury operations during the reporting year, and should be incorporated into all business processes in future. An updated risk map is being developed as a strategic management and planning tool and will encompass: • The risks associated with adverse
developments in the Company’s business activity in Ukraine
• Assessment of the financing risks associated with the business strategy
• Issues related to the financing of major projects and the risks associated with the economic sanctions against Russia
• The main challenges and risks arising from the reform of labor and environmental law in Russia, including the potential economic effects on the Company’s business
TRANSACTIONS WITH POTENTIAL CONFLICTS OF INTERESTSAs required by the Board of Directors’ Regulations, the CEO informed the Board about transactions that had taken place between EuroChem companies and other enterprises where EuroChem is a beneficiary. The Board was presented with a written report on the terms of such transactions within the reporting year. These transactions all took place at arm’s length on a competitive basis. Information on related party transactions is provided in the 2014 IFRS consolidated financial statements.
APPOINTMENTS AND INCENTIVESOne of the Board’s main objectives is to ensure management continuity. During the reporting year, a number of key managers were appointed, including heads of Oil and Gas, Sales and Internal Audit.
The Board assessed executives’ performance against their objectives for the previous year, and set future targets. Given the importance of production safety, two new indicators, ‘Environmental Safety’ and ‘Environmental Protection’ were added to annual targets for all managers. We also improved the assessment methodology for Group-wide HSE targets.
The Board approved an incentive program linked to strategic projects, ensuring that projects did not overlap or conflict with core activities, and that the incentives were suitable to encourage the achievement of non-routine objectives.
ASSESSMENT OF THE BOARDThe Corporate Governance & Personnel Committee oversaw the annual assessment of Board performance.
During the assessment, the Board’s role and function, work priorities, practical aspects of preparing and running meetings, and the status of procedures were discussed. The balance of competencies across the Board, and whether the Directors’ knowledge, skills, experience and personal qualities were sufficient to ensure effective management control, were reviewed.
2014 Governance Report continued
MCC EUROCHEM CORPORATE GOVERNANCE REPORT

ST
RA
TE
GIC
RE
PO
RT
CO
RP
OR
AT
E G
OV
ER
NA
NC
EFIN
AN
CIA
L STA
TE
ME
NT
S
EuroChem Annual Report and Accounts 2014 71
In recent years, the assessment took the form of a questionnaire completed by Board members, followed by a discussion. In the reporting year, the Board reviewed this approach and concluded that it is a balanced and useful mechanism.
As a result of the assessment, the Board approved the approach to financial statement preparation, the implementation of Company strategy, provision of information on significant events and the status of corporate governance. However, the Board questioned whether the Company has sufficient management and HR resources to effectively deal with the growth in size and complexity of the business. The relationship between the Board, management, and the organization of internal audit were also identified as an area in need of development and improvement.
The assessment also concluded that the competencies and experience of Board members in company reorganization, information technology and specific aspects of the oil and gas industry were proving especially valuable.
CORPORATE GOVERNANCEThe Board oversaw changes to the Company’s system of governance (both corporate and organizational). Changes to the Management Board were approved, including the appointment of a new Sales and Marketing Director.
The Corporate Governance & Personnel Committee identified potential Board members with additional experience and knowledge. Recommendations were also made on the provision of competitive remuneration for Board members.
The Board worked on the preparation and running of general meetings, approving accounts, distribution of profit, appointment of an external auditor and agreeing the right mix of Director experience.
During the reporting year, a new edition of the Regulations on Remuneration of Members of the Board of Directors was approved; amendments were made to the Company Charter and major transactions and interested party transactions (including ones involving liability insurance) were also approved. Recommendations were made to the governing bodies of subsidiaries on amending their charters in line with changes in the law and changes in the nature of their business, and on preparing annual meetings.
REMUNERATION OF THE BOARD MEMBERSIssues concerning Board member remuneration are referred to the General Meeting of Shareholders. Remuneration is fixed and adjusted according to Committee memberships and Chairmanships; however, as set out in the Board Member Remuneration Regulations, only non-executive Directors are entitled to remuneration.
The total amount of remuneration paid to Board members for their contribution in 2014 amounted to US$ 1.1 million, including US$ 77 thousand in compensation for work-related expenses.
DIVIDENDSThe Board of Directors recommends dividend payments, taking into account the long-term development of the Company and interests of the shareholders.
At the Annual General Meeting held on 16 June 2014, the decision was taken not to distribute EuroChem’s 2013 net profit of US$ 387 million. The Group did not declare or pay dividends during 2013 or 2014.The history of dividend payments and the Company’s Dividend Policy can be found on our website at www.eurochemgroup.com/dividends
2014 2013
US$k US$k
Total remuneration paid to the members of the Board 1,037 1,137Total compensation for work-related expenses 76.7 72.2

72 EuroChem Annual Report and Accounts 2014
Audit CommitteeMCC EUROCHEM COMMITTEES
2014 AUDIT COMMITTEE MEETINGS AND ATTENDANCEAs at 31 December 2014, the Committee had two members – Committee Chairman Clifford Kent Potter (IND) and Nikolay Pilipenko (NED).
The primary purpose of the Audit Committee is to provide oversight of the financial reporting process, the audit process (both external and internal) and the system of internal controls and compliance with laws and regulations.
The Committee: • Oversees the quality of the financial
reporting process. The Committee reviews all external financial reports, assessing the integrity and reliability of the financial information disclosed
• Is responsible for the appointment of the external auditors and provides oversight of the audit process, regularly reviewing the effectiveness of the audit process with management and the external auditors
• Provides guidance to the internal audit function in the Company, reviews and approves the audit plan, and meets
regularly with management and the internal audit department to review audit findings and evaluate the effectiveness of the internal audit process
• Considers the Company’s internal controls and reviews their effectiveness; monitors the development of the Company’s risk management systems and procedures
In 2014, the Committee held a total of ten meetings comprised of seven held in person and three conference calls. The 2014 attendance table is provided on page 69.
OVERVIEW OF AUDIT COMMITTEE ACTIVITY DURING 2014
External audit • Appointment, compensation, retention and oversight of the Group’s Auditor (PwC)• Review and determination of external auditor independence • Review of the extent of non-audit services provided and related fees, and pre-approval of any non-audit relationships• Evaluation of external Audit Plan
Financial reporting and budgeting
• Review with management of significant financial reporting issues, judgements and estimates used in developing the financial statements
• Review of draft quarterly and annual consolidated financial statements, and the external auditor’s report• Review of press releases containing significant financial information• Discussions with the external auditor without management on issues related to the audit of financial statements• Review of reporting at new Group entities, oversight of their transition process to the Group-wide accounting
system (Oracle)• Budget implementation, budgeting procedures review
Risk management and internal control
• Review with management of their approach to monitoring the performance of internal controls over financial reporting • Review of recommendations from external auditors, including internal control • Review with external auditor of any corporate transactions with potential conflict of interest• Review of significant fraud cases • Review of D&O liability insurance policy and Group insurance policy • Oversight over implementation of the Group’s Compliance Policy• Review of reports on compliance with the Group’s covenants• Assessment of risks and the Groups’ internal control framework
Internal audit • Oversight over Internal Audit Department performance: current activities, future priorities and regulations • Appointment of new Head of Internal Audit Department (MCC level) • Assessment of internal audit staffing, budget and responsibilities• Evaluation of internal Audit Plan• Review of internal audit reports on the results of its work and the management responsiveness to its findings
and recommendations• Oversight of internal audit participation (role) in the management system development project• Revision of commission report review • Oversight over collaboration between internal and external auditor• Monitoring and assessment of internal audit effectiveness
Information disclosure
• Oversight over preparation of financial and non-financial reports (2013 and 2014 Annual Report and 2014 CSR Report) • Review of procedures for communication with shareholders on such matters as approval of disclosures related to the
Company’s ownership structure; and approval of restrictive provisions in credit agreements
Reorganization of the Company
• Oversight over the new Economic Model implementation: pricing, cost centers, cost and capital allocation methodologies, transfer pricing, accounting principles
• Control over new divisional management reporting implementation • Focus on changes in IFRS reporting required for the new legal structure
Company performance review
• Review of the management accounts and monthly (flash) reports for the period

ST
RA
TE
GIC
RE
PO
RT
CO
RP
OR
AT
E G
OV
ER
NA
NC
EFIN
AN
CIA
L STA
TE
ME
NT
S
EuroChem Annual Report and Accounts 2014 73
The Strategy Committee is responsible for the analysis and review of the Company’s general development initiatives, long-term goals and investment projects. It reports to the Board on the results of its discussions. All divisional and segment strategies, large-scale projects, M&A deals and other strategic proposals from management are reviewed and considered.
As at 31 December 2014, the Committee had three members – Committee Chairman Andrey Melnichenko (NED), Alexander Landia (IND), and Garth Moore (IND), from 16 June 2014.
The CEO, CFO and Head of Strategy and Investment regularly attend meetings at the Committee’s invitation.
STRATEGY COMMITTEE MEETINGS AND ATTENDANCEIn 2014, the Committee held six meetings in person. The 2014 attendance table is provided on page 69.
Strategy Committee
OVERVIEW OF STRATEGY COMMITTEE ACTIVITY DURING 2014
Strategy and development
• Approval of the business development strategy for 2014-2018, development strategy for the Group’s divisions – Sales, Oil and Gas, Mining, Fertilizers, Logistics, and IT strategy
• EuroChem business valuation• EuroChem financing plans and strategy • Geographical expansion of the business, including via cooperation with local partners (JV, etc.)• Development of ammonia and phosphate ore resource base; launch of new premium products
Investment activity and strategic projects
• Regular control of the implementation of strategic investment projects (potash, phosphate rock, LDAN, ammonia) • Improving the reporting format for major investment projects • Control of geological and seismic work at potash/magnesium salt deposits in Russia• Approval of significant investment projects relating to asset development and inventory management• Analysis of returns obtained on completed projects
Financing and budgeting
• 2014 budget implementation, 2015 investment budget and priorities • Monitoring of financing plans for strategic investments, including project financing, and covenant compliance
Reorganization of the Company
• Changes to EuroChem’s legal structure• Reorganization of commercial business processes• Review of the Logistics reorganization • Monitoring of the implementation of the Management System Development project• Monitoring of the introduction of a quality management approach (compliance with ISO 9004:2009 (E): Managing for the
sustained success of an organization)
New economic model
• Development of a division-based economic model, including pricing, structure of financial accounting centers, and cost and capital allocation by Management Responsibility Center (MRC)
• Transition to economic governance at lower levels within the divisions (MRCs) • Review of forecasting methodology for strategic planning purposes• Review of operating performance indicators at production units

74 EuroChem Annual Report and Accounts 2014
Corporate Governance & Personnel Committee
MCC EUROCHEM COMMITTEES
The Corporate Governance & Personnel Committee focuses primarily on remuneration and incentives, staffing requirements at ongoing investment projects and the introduction of health and safety performance indicators within the management incentive program. The Committee has made considerable progress towards establishing international standards of governance – and an important part of its role is to ensure that these standards are maintained.
The Committee’s main objective is to protect shareholder interests through ensuring control over the quality of corporate governance; the quality of HR strategy, policy and practice; and the quality and effectiveness of the appointment system, the remuneration system in general, and remuneration of senior executives in particular.
CORPORATE GOVERNANCE & PERSONNEL COMMITTEE MEETINGS AND ATTENDANCEAs at 31 December 2014, the Corporate Governance & Personnel Committee had three members – Committee Chairman Vladimir Stolin (IND), Andrea Wine (IND) and Nikolay Pilipenko (NED).
In 2014, the Committee held six meetings in person. The 2014 attendance table is provided on page 69.
OVERVIEW OF CORPORATE GOVERNANCE & PERSONNEL COMMITTEE ACTIVITY DURING 2014
Production safety • Regular monitoring of HSE status within the Group• Development of the Company’s HSE function and culture of industrial safety• Review of methodology for establishing unified HSE targets for management
Personnel management policy
• Monitoring the implementation of the HR management strategy• Support management with senior appointments, including managers for the Oil and Gas and Sales divisions, the Internal
Audit Department and the Management Board• Support on corporate governance and social matters• Review of HR budget and costs and staffing requirements within the context of the Group’s expansion plans • Consideration of issues pertaining to top management remuneration and benefits at EuroChem and its subsidiaries
Reorganization of the management system
• Refined corporate management system in line with the internalization of the Group• Establishing and refining functions and targets – HR management, HSE function • Developed an organizational structure accompanying the development of the Company’s management system
Remuneration and incentives
• Evaluation of top management target achievement, setting new targets for the upcoming year, including methodological issues pertaining to the evaluation of target achievement, recommendations on bonus payments.
• Improvement of the system of project incentives for the top management • Development and approval of project-based incentives programs for strategic and large-scale investment projects• Reviewing the implementation of certain key projects, including the integration of the ORACLE-EBS system throughout the
Group’s new assets and the upgrade of nitric acid production at Nevinnomysskiy Azot• Recommendations on awarding milestone bonuses to key managers• Assessment of performance of the Corporate Secretary
Board succession and development
• Attract competent and active professionals with pertinent and desired experience to the Board of Directors • Assessment of the Board’s performance, including the efficiency of the review system and changes to the
assessment format• Approval of an induction program for new Board members• Review of the Board of Directors’ remuneration and incentives

ST
RA
TE
GIC
RE
PO
RT
CO
RP
OR
AT
E G
OV
ER
NA
NC
EFIN
AN
CIA
L STA
TE
ME
NT
S
EuroChem Annual Report and Accounts 2014 75
Financial Statements
Notes to the Consolidated Financial Statements
76 Independent Auditor’s Report
77 Consolidated Statement of Financial Position as at 31 December 2014
79 Consolidated Statement of Profit or Loss and Other Comprehensive Income for the year ended 31 December 2014
80 Consolidated Statement of Cash Flows for the year ended 31 December 2014
82 Consolidated Statement of Changes in Equity for the year ended 31 December 2014
83 1 The EuroChem Group and its operations
83 2 Basis of preparation and significant accounting policies
93 3 Critical accounting estimates and judgments in applying accounting policies
94 4 Adoption of new or revised standards and interpretations
95 5 Statement of cash flows
95 6 Principal subsidiaries, associates and joint ventures
96 7 Fair value of financial instruments
98 8 Segment information
101 9 Property, plant and equipment
103 10 Mineral rights
103 11 Goodwill
105 12 Intangible assets
105 13 Investment in associates and joint venture
107 14 Inventories
107 15 Trade receivables, prepayments, other receivables and other current assets
108 16 Originated loans
109 17 Cash and cash equivalents, fixed-term deposits and restricted cash
110 18 Equity
110 19 Bank borrowings and other loans received
112 20 Project finance
113 21 Bonds issued
113 22 Derivative financial assets and liabilities
114 23 Other non-current liabilities and deferred income
115 24 Provision for land restoration
116 25 Trade payables, other accounts payable and accrued expenses
117 26 Sales
117 27 Cost of sales
118 28 Distribution costs
118 29 General and administrative expenses
119 30 Other operating income and expenses
119 31 Other financial gain and loss
119 32 Income tax
122 33 Earnings/(loss) per share
122 34 Balances and transactions with related parties
123 35 Contingencies, commitments and operating risks
125 36 Financial and capital risk management
76 EuroChem Annual Report and Accounts 2014
FINANCIAL STATEMENTS
Report of the statutory auditor to the General Meeting of EuroChem Group AG, Zug
Report of the statutory auditor on the consolidated financial statementsAs statutory auditor, we have audited the consolidated financial statements of EuroChem Group AG, which comprise the consolidated statement of financial position, consolidated statement of profit or loss and other comprehensive income, consolidated statement of cash flows, consolidated statement of changes in equity and notes (pages 81 to 135), for the year ended December 31, 2014.
Board of Directors’ responsibilityThe Board of Directors is responsible for the preparation and fair presentation of the consolidated financial statements in accordance with the International Financial Reporting Standards (IFRS) and the requirements of Swiss law. This responsibility includes designing, implementing and maintaining an internal control system relevant to the preparation and fair presentation of consolidated financial statements that are free from material misstatement, whether due to fraud or error. The Board of Directors is further responsible for selecting and applying appropriate accounting policies and making accounting estimates that are reasonable in the circumstances.
Auditor’s responsibilityOur responsibility is to express an opinion on these consolidated financial statements based on our audit. We conducted our audit in accordance with Swiss law and Swiss Auditing Standards as well as the International Standards on Auditing. Those standards require that we plan and perform the audit to obtain reasonable assurance whether the consolidated financial statements are free from material misstatement.
An audit involves performing procedures to obtain audit evidence about the amounts and disclosures in the consolidated financial statements. The procedures selected depend on the auditor’s judgment, including the assessment of the risks of material misstatement of the consolidated financial state-ments, whether due to fraud or error. In making those risk assessments, the auditor considers the internal control system relevant to the entity’s preparation and fair presentation of the consolidated financial statements in order to design audit procedures that are appropriate in the circumstances, but not for the purpose of expressing an opinion on the effectiveness of the entity’s internal control system. An audit also includes evaluating the appropriateness of the accounting policies used and the reasona-bleness of accounting estimates made, as well as evaluating the overall presentation of the consolidat-ed financial statements. We believe that the audit evidence we have obtained is sufficient and appro-priate to provide a basis for our audit opinion.
OpinionIn our opinion, the consolidated financial statements for the year ended December 31, 2014 give a true and fair view of the financial position, the results of operations and the cash flows in accordance with the International Financial Reporting Standards (IFRS) and comply with Swiss law.
Report on other legal requirementsWe confirm that we meet the legal requirements on licensing according to the Auditor Oversight Act (AOA) and independence (article 728 CO) and that there are no circumstances incompatible with our independence.
In accordance with article 728a paragraph 1 item 3 CO and Swiss Auditing Standard 890, we confirm that an internal control system exists which has been designed for the preparation of consolidated financial statements according to the instructions of the Board of Directors.
We recommend that the consolidated financial statements submitted to you be approved.
PricewaterhouseCoopers AG
Matthias von Moos Daniel WyssAudit expert Audit expertAuditor in charge
Zug, February 6, 2015
Independent Auditor’s Report

ST
RA
TE
GIC
RE
PO
RT
CO
RP
OR
AT
E G
OV
ER
NA
NC
EFIN
AN
CIA
L STA
TE
ME
NT
S
EuroChem Annual Report and Accounts 2014 77
Consolidated Statement of Financial Positionas at 31 December 2014(all amounts are presented in thousands of US dollars, unless otherwise stated)
The accompanying notes on pages 83-131 are an integral part of these consolidated financial statements.
Note31 December
201431 December
2013 1 January
2013
ASSETS Non-current assets:Property, plant and equipment 9 3,465,620 4,670,781 4,207,705Mineral rights 10 298,371 466,771 504,918Goodwill 11 339,728 387,335 374,405Intangible assets 12 159,695 213,866 237,895Investment in associates and joint venture 13 112,665 107,905 –Available-for-sale investments – – 63,038Available-for-sale investments pledged as collateral – – 29,929Originated loans 16 40,170 12,700 –Derivative financial assets 22 – 32,502 64,150Restricted cash 17 10,125 2,706 1,449Deferred income tax assets 32 219,877 182,393 161,284Prepayment for investment in associate – – 83,060Other non-current assets 110,816 21,995 6,459Total non-current assets 4,757,067 6,098,954 5,734,292Current assets:Inventories 14 555,649 692,677 757,467Trade receivables 15 339,856 363,439 347,929Prepayments, other receivables and other current assets 15 259,936 261,110 322,657Income tax receivable 2,400 5,660 6,226Originated loans 16 29,402 3,000 –Derivative financial assets 22 – 10,130 2Restricted cash 17 – – 13,349Fixed-term deposits 17 13,440 74,605 120,885Cash and cash equivalents 17 363,418 505,738 508,488Total current assets 1,564,101 1,916,359 2,077,003TOTAL ASSETS 6,321,168 8,015,313 7,811,295

78 EuroChem Annual Report and Accounts 2014
Note31 December
201431 December
2013 1 January
2013
LIABILITIES AND EQUITYEquity attributable to owners of the parent:Share capital 18 111 – –Equity not directly owned by the Company – 3,716,670 3,510,025Retained earnings and other reserves 2,195,774 – –
2,195,885 3,716,670 3,510,025Non-controlling interests 1,490 5,167 6,177Total equity 2,197,375 3,721,837 3,516,202Non-current liabilities:Bank borrowings and other loans received 19 1,470,119 2,005,907 1,961,182Bonds issued 21 748,154 1,050,543 1,072,999Derivative financial liabilities 22 180,445 4,350 –Deferred income tax liabilities 32 142,176 197,859 207,311Other non-current liabilities and deferred credits 23 89,838 155,884 203,933Total non-current liabilities 2,630,732 3,414,543 3,445,425Current liabilities:Bank borrowings and other loans received 19 662,029 255,758 224,148Bonds issued 21 177,404 – –Derivative financial liabilities 22 203,513 6,883 –Trade payables 25 199,011 260,900 276,121Other accounts payable and accrued expenses 25 196,422 307,965 278,197Income tax payable 26,346 16,026 41,255Other taxes payable 28,336 31,401 29,947Total current liabilities 1,493,061 878,933 849,668Total liabilities 4,123,793 4,293,476 4,295,093TOTAL LIABILITIES AND EQUITY 6,321,168 8,015,313 7,811,295
Approved on behalf of the Board of Directors.
6 February 2015.
Dmitry StrezhnevChairman of the Board of DirectorsEuroChem Group AG
Andrey IlyinMember of the Board of DirectorsEuroChem Group AG
Consolidated Statement of Financial Position continued
as at 31 December 2014(all amounts are presented in thousands of US dollars, unless otherwise stated)
The accompanying notes on pages 83-131 are an integral part of these consolidated financial statements.
FINANCIAL STATEMENTS

ST
RA
TE
GIC
RE
PO
RT
CO
RP
OR
AT
E G
OV
ER
NA
NC
EFIN
AN
CIA
L STA
TE
ME
NT
S
EuroChem Annual Report and Accounts 2014 79
Note 2014 2013
Sales 26 5,087,500 5,555,658Cost of sales 27 (3,073,665) (3,541,730)
Gross profit 2,013,835 2,013,928
Distribution costs 28 (693,845) (793,188)General and administrative expenses 29 (215,868) (210,670)Other operating income/(expenses), net 30 156,132 (13,356)
Operating profit 1,260,254 996,714
Share of profit from associates 18,211 11,904Dividend income – 3,651Loss on disposal of available-for-sale investments – (46,970)Interest income 11,939 7,907Interest expense (152,345) (161,809)Financial foreign exchange gain/(loss), net (1,067,225) (184,997)Other financial gain/(loss), net 31 (527,718) (29,663)Profit/(loss) before taxation (456,884) 596,737
Income tax expense 32 (120,693) (210,180)
Profit/(loss) for the period (577,577) 386,557
Other comprehensive income/(loss) that may be reclassified to profit or loss in subsequent periods
Currency translation differences (1,203,355) (83,753)Revaluation of available-for-sale investments, net of tax – (45,293)Disposal of available-for-sale investments – reclassification of revaluation to profit or loss, net of tax – 46,970Total other comprehensive loss for the period that may be reclassified to profit or loss in
subsequent periods (1,203,355) (82,076)
Other comprehensive income that will not be reclassified to profit or loss in subsequent periodsRemeasurements of post-employment benefit obligations, net of tax 3,895 844Total other comprehensive income for the period that will not be reclassified to profit or loss
in subsequent periods 3,895 844Total comprehensive income/(loss) for the period (1,777,037) 305,325
Profit/(loss) of the period attributable to: Owners of the parent (577,482) 386,755Non-controlling interests (95) (198)
(577,577) 386,557
Total comprehensive income/(loss) attributable to: Owners of the parent (1,775,779) 305,749Non-controlling interests (1,258) (424)
(1,777,037) 305,325
Earnings/(loss) per share – basic and diluted 33 (577.48) 386.76
Consolidated Statement of Profit or Loss and Other Comprehensive Income for the year ended 31 December 2014 (all amounts are presented in thousands of US dollars, unless otherwise stated)
The accompanying notes on pages 83-131 are an integral part of these consolidated financial statements.

80 EuroChem Annual Report and Accounts 2014
Note 2014 2013
Operating profit 1,260,254 996,714Income tax paid (170,889) (251,054)Operating profit less income tax paid 1,089,365 745,660
Depreciation and amortization 29 267,254 310,104Net loss on disposals and write-off of property, plant and equipment 11,696 23,908Change in provision for impairment of receivables and provision for obsolete and damaged
inventories, net 9,157 3,599Other non-cash (income)/expenses, net 131,183 36,521Gross cash flow 5 1,508,655 1,119,792
Changes in operating assets and liabilities:Trade receivables (195,308) (40,172)Advances to suppliers (12,800) 19,516Other receivables (142,065) (1,114)Inventories (225,469) (4,936)Trade payables 36,392 (6,103)Advances from customers (5,546) 10,768Other payables 12,647 27,610Restricted cash, other assets and liabilities (12,521) 11,332Net cash – operating activities 963,985 1,136,693
Cash flows from investing activitiesCapital expenditure on property, plant and equipment and intangible assets (1,063,985) (1,018,355)Purchase of mineral rights (32,661) –Payment related to mineral rights acquisition (5,489) (5,179)Investment in associates 13 (37,500) (19,909)Investment in joint venture 13, 34 (18,000) –Prepayment for acquisition of subsidiary (108,054) –Prepayments for other non-current assets – (491)Portion of deferred compensation related to business combination, paid 23 (44,276) (48,290)Proceeds from sale of available-for-sale investments – 3,081Proceeds from sale of property, plant and equipment 1,581 4,995Cash proceeds/(payments) on derivatives, net 22 (1,805) –Dividends received and refunded withholding tax on dividends received 440 3,085Net change in fixed-term deposits 43,150 38,605Originated loans 16, 34 (28,627) (35,700)Repayment of originated loans 16, 34 – 63,779Interest received 11,138 7,210Net cash – investing activities (1,284,088) (1,007,169)
Consolidated Statement of Cash Flowsfor the year ended 31 December 2014 (all amounts are presented in thousands of US dollars, unless otherwise stated)
The accompanying notes on pages 83-131 are an integral part of these consolidated financial statements.
FINANCIAL STATEMENTS

ST
RA
TE
GIC
RE
PO
RT
CO
RP
OR
AT
E G
OV
ER
NA
NC
EFIN
AN
CIA
L STA
TE
ME
NT
S
EuroChem Annual Report and Accounts 2014 81
Note 2014 2013
Free cash inflow/(outflow) 5 (320,103) 129,524
Cash flows from financing activitiesProceeds from bank borrowings and other loans received 19 1,776,089 2,367,442Repayment of bank borrowings and other loans 19 (1,639,012) (2,266,581)Prepaid and additional transaction costs (3,976) (2,393)Prepaid and additional transaction costs related to Project Finance (24,167) –Interest paid (160,998) (158,091)Cash proceeds/(payments) on derivatives, net 22 (19,904) 6,649Acquisition of additional interest in subsidiaries (2,536) (390)Purchase of ordinary shares of MCC EuroChem 34 (126,000) (427,000)Proceeds from sale of ordinary shares of MCC EuroChem 34 435,000 300,000Capital contribution – 50,000Share capital of the Company issued and paid in 18 111 –Contribution to legal reserve of the Company 18 5,000 –Net cash – financing activities 239,607 (130,364)Effect of exchange rate changes on cash and cash equivalents (61,824) (1,910)Net decrease in cash and cash equivalents (142,320) (2,750)Cash and cash equivalents at the beginning of the period 17 505,738 508,488Cash and cash equivalents at the end of the period 17 363,418 505,738
Consolidated Statement of Cash Flows continued
for the year ended 31 December 2014 (all amounts are presented in thousands of US dollars, unless otherwise stated)
The accompanying notes on pages 83-131 are an integral part of these consolidated financial statements.

82 EuroChem Annual Report and Accounts 2014
Attributable to owners of the parent
Sharecapital
Equity not owned
directly by the Company
Cumulativecurrency
translationdifferences
Retainedearnings
and otherreserves Total
Non-controlling
interestTotal
equity
Balance at 1 January 2013 – 3,510,025 – – 3,510,025 6,177 3,516,202Comprehensive income/(loss)Profit/(loss) for the period – 386,755 – – 386,755 (198) 386,557
Other comprehensive income/(loss) Actuarial gain on post-employment
benefit obligations – 844 – – 844 – 844 Currency translation differences – (83,527) – – (83,527) (226) (83,753) Revaluation of available-for-sale investments – (45,293) – – (45,293) – (45,293) Disposal of available-for-sale investments – 46,970 – – 46,970 – 46,970Total other comprehensive loss – (81,006) – – (81,006) (226) (81,232) Total comprehensive income/(loss) – 305,749 – – 305,749 (424) 305,325Transactions with ownersCapital contribution – 50,000 – – 50,000 – 50,000Transactions with ordinary shares of MCC EuroChem – (149,300) – – (149,300) – (149,300)Acquisition of additional interest in subsidiaries – 196 – – 196 (586) (390)Total transactions with owners – (99,104) – – (99,104) (586) (99,690)Balance at 31 December 2013 – 3,716,670 – – 3,716,670 5,167 3,721,837Balance at 1 January 2014 – 3,716,670 – – 3,716,670 5,167 3,721,837Comprehensive income/(loss)Profit for the period – 303,649 – – 303,649 – 303,649
Other comprehensive income/(loss) Currency translation differences – (57,503) – – (57,503) – (57,503)Total other comprehensive income/(loss) – (57,503) – – (57,503) – (57,503)Total comprehensive income – 246,146 – – 246,146 – 246,146Transactions with ownersReclassification from capital contribution to bank
borrowings and other loans received (Note 19) – (50,000) – – (50,000) – (50,000)Transactions with ordinary shares of
MCC EuroChem (Note 34) – 300,000 – – 300,000 – 300,000Total transactions with owners – 250,000 – – 250,000 – 250,000Balance before the restructuring – 4,212,816 – – 4,212,816 5,167 4,217,983Reorganization under the parent company 111 – – 5,000 5,111 – 5,111Changes due to restructuring – (4,212,816) (311,690) 4,524,506 – – –Comprehensive lossLoss for the period – – – (881,131) (881,131) (95) (881,226)
Other comprehensive income/(loss) Currency translation differences – – (1,144,689) – (1,144,689) (1,163) (1,145,852) Actuarial gain on post-employment
benefit obligations – – – 3,895 3,895 – 3,895Total other comprehensive income/(loss) – – (1,144,689) 3,895 (1,140,794) (1,163) (1,141,957)Total comprehensive loss – – (1,144,689) (877,236) (2,021,925) (1,258) (2,023,183)Transactions with ownersAcquisition of additional interest in subsidiaries – – – (117) (117) (2,419) (2,536)Total transactions with owners – – – (117) (117) (2,419) (2,536)Balance at 31 December 2014 111 – (1,456,379) 3,652,153 2,195,885 1,490 2,197,375
Consolidated Statement of Changes in Equityfor the year ended 31 December 2014 (all amounts are presented in thousands of US dollars, unless otherwise stated)
The accompanying notes on pages 83-131 are an integral part of these consolidated financial statements.
FINANCIAL STATEMENTS

ST
RA
TE
GIC
RE
PO
RT
CO
RP
OR
AT
E G
OV
ER
NA
NC
EFIN
AN
CIA
L STA
TE
ME
NT
S
EuroChem Annual Report and Accounts 2014 83
1 The EuroChem Group and its operations
The EuroChem Group comprises the parent entity, EuroChem Group AG (the ‘Company’) and its subsidiaries (collectively the ‘Group’ or ‘EuroChem Group’). The Company was incorporated under the laws of Switzerland on 16 July 2014 and has its registered office at: Alpenstrasse 9, 6300, Zug, Switzerland.
EuroChem Group AG became the parent company of the Group in September 2014 after EuroChem Group SE contributed 89.83% of the shares of JSC “Mineral Chemical Company ‘EuroChem’” (hereinafter – ‘MCC EuroChem’) to the Swiss-based Company (Note 2). In December 2014, EuroChem Capital Management Ltd., the Group’s wholly-owned subsidiary, sold to EuroChem Group AG the remaining 10.17% interest in MCC EuroChem. Further details regarding the Group’s structure are presented in Note 6.
At 31 December 2014, EuroChem Group SE owned 100% of the share capital of EuroChem Group AG.
A company that holds business interests beneficially for Mr Andrey Melnichenko and his family owns 100% of Linea Ltd registered in Bermuda, which in turn owns 92.2% (31 December 2013: 92.2%) of EuroChem Group SE. The remaining 7.8% (31 December 2013: 7.8%) of EuroChem Group SE is held indirectly by Mr Dmitry Strezhnev, CEO of the Group.
The Group’s principal activity is the production of mineral fertilizers (nitrogen and phosphate based) as well as mineral extraction (apatite, phosphate rock, iron ore, baddeleyite and hydrocarbons), and the operation of a distribution network. The Group is developing potassium salts deposits with a view to starting the production and marketing of potassium fertilizers. The Group has a worldwide presence with direct distribution in Europe, Russia, the CIS, the USA, Mexico and South Asia and its main manufacturing facilities located in Russia, Belgium and Lithuania.
2 Basis of preparation and significant accounting policies
Basis of preparationThese consolidated financial statements have been prepared in accordance with International Financial Reporting Standards (‘IFRS’) under the historical cost convention, as modified by the initial recognition of financial instruments based on fair value and derivative financial instruments, which are accounted for at fair value.
These consolidated financial statements should be viewed as a continuation of the consolidated financial statements of EuroChem Group issued by its former parent MCC EuroChem prior to the change in the corporate structure following the re-domiciliation of the corporate headquarters to Zug, Switzerland.
The principal accounting policies applied in the preparation of these consolidated financial statements are set out below. These policies have been consistently applied to all periods presented, unless otherwise stated.
Functional and presentation currencyThe functional currency of each of the Group’s entities is the currency of the primary economic environment in which the entity operates.
While the Company’s functional currency is the US dollar (US$), the functional currency for each of the Group’s subsidiaries is determined separately. For Russian subsidiaries, the functional currency is the Russian rouble (‘RUB’); the functional currency for most of the Group’s subsidiaries located in Europe is the Euro (‘EUR’); and, for subsidiaries located in Lithuania the functional currency is the Lithuanian Lita (‘LTL’) with adoption of the Euro on 1 January 2015 as the official currency.
Monetary assets and liabilities are translated into each entity’s functional currency at the official exchange rate at the respective reporting dates. Foreign exchange gains and losses resulting from the settlement of the transactions and from the translation of monetary assets and liabilities into each entity’s functional currency at year-end official exchange rates are recognized in profit and loss. Translation differences on non-monetary financial assets and liabilities such as equities held at fair value through profit and loss are recognized in profit and loss as part of the fair value gain or loss. Translation differences on non-monetary financial assets such as equities classified as available-for-sale are recognized in other comprehensive income.
Foreign exchange gains and losses that relate to bank borrowings, third party loans, intragroup loans and deposits are presented in the consolidated statement of profit or loss and other comprehensive income in a separate line ‘Financial foreign exchange gain/(loss), net’. All other foreign exchange gains and losses are presented in the consolidated statement of profit or loss and other comprehensive income within ‘Other operating income/(expenses), net’.
Goodwill and fair value adjustments arising on the acquisition of a foreign entity are treated as assets and liabilities of the foreign entity and translated at the closing rate.
In the third quarter 2014 the Group changed its presentation currency from the Russian rouble to the US dollar since the management considers the US dollar to be more appropriate for the understanding and comparability of consolidated financial information. These are the first annual consolidated financial statements presented in US dollars. Following the changes in its presentation currency, in these consolidated financial statements the Group presents an additional balance sheet as at 1 January 2013 in accordance with IAS 1, ‘Presentation of Financial Statements’ and IAS 8, ‘Accounting Policies, Changes in Accounting Estimates and Errors’, however, it need not present the related notes to the opening statement of financial position of the preceding period.
Notes to the Consolidated Financial Statementsfor year ended 31 December 2014(all amounts are presented in thousands of US dollars, unless otherwise stated)

FINANCIAL STATEMENTS
84 EuroChem Annual Report and Accounts 2014
2 Basis of preparation and significant accounting policies continued
The results and financial position of each of the Group’s subsidiaries were translated to the presentation currency as required by IAS 21, ‘The Effects of Changes in Foreign Exchange Rates’:
(i) assets and liabilities for each consolidated statement of financial position presented are translated at the closing rate at the date of that consolidated statement of financial position;
(ii) income and expenses for each consolidated statement of profit or loss and other comprehensive income are translated at average exchange rates (unless this average is not a reasonable approximation of the cumulative effect of the rates prevailing on the transaction dates, in which case income and expenses are translated at the dates of the transactions);
(iii) components of equity are translated at the historical rate; and
(iv) all resulting exchange differences are recognized as currency translation differences in other comprehensive income.
At 31 December 2014, the official exchange rates were: US$ 1 = RUB 56.2584, US$ 1 = EUR 0.8232 (31 December 2013: US$ 1 = RUB 32.7292, US$ 1 = EUR 0.7278). Average rates for the year ended 31 December 2014 were: US$ 1 = RUB 38.4217, US$ 1 = EUR 0.7561, (2013: US$ 1 = RUB 31.8480, US$ 1= EUR 0.7527).
Due to the higher volatility of the RUB exchange rate in the fourth quarter 2014 monthly exchange rates were used to translate income and expenses of all subsidiaries with the Russian rouble as a functional currency. The average rates for October 2014 was US$ 1 = RUB 40.7710, for November 2014 was US$ 1 = RUB 45.9143 and for December 2014 was US$ 1 = RUB 55.5389.
At 5 February 2015 the official exchange rate was US$ 1 = RUB 65.4470, US$ 1 = EUR 0.8721.
Consolidated financial statementsSubsidiaries are entities (including structured entities) over which the Group has control. The Group controls an entity when the Group is exposed to, or has rights to, variable returns from its involvement with the entity and has the ability to affect those returns through its power over the entity. Subsidiaries are fully consolidated from the date on which control is transferred to the Group (acquisition date) and are de-consolidated from the date that control ceases.
The acquisition method of accounting is used to account for business combinations. Identifiable assets acquired and liabilities and contingent liabilities assumed in a business combination are measured at their fair values at the acquisition date, irrespective of the extent of any non-controlling interest. The Group measures non-controlling interest on a transaction-by-transaction basis, either at: (a) fair value, or (b) the non-controlling interest’s proportionate share of net assets of the acquiree.
Goodwill is measured by deducting the net assets of the acquiree from the aggregate of the consideration transferred for the acquiree, the amount of non-controlling interest in the acquiree and fair value of an interest in the acquiree held immediately before the acquisition date. Any negative amount (‘negative goodwill’ or ‘bargain purchase’) is recognized in profit or loss, after management reassesses whether it identified all the assets acquired and all liabilities and contingent liabilities assumed and reviews the appropriateness of their measurement.
The consideration transferred for the acquiree is measured at the fair value of the assets given up, equity instruments issued and liabilities incurred or assumed, including fair value of assets or liabilities from contingent consideration arrangements but excludes acquisition related costs such as advisory, legal, valuation and similar professional services. Transaction costs related to the acquisition and incurred for issuing equity instruments are deducted from equity; transaction costs incurred for issuing debt as part of the business combination are deducted from the carrying amount of the debt and all other transaction costs associated with the acquisition are expensed.
Intercompany transactions, balances and unrealized gains on transactions between group companies are eliminated; unrealized losses are also eliminated unless the cost cannot be recovered.
The Company and all of its subsidiaries use uniform accounting policies consistent with the Group’s policies. Non-controlling interest is that part of the net results and of the equity of a subsidiary attributable to interests which are not owned, directly or indirectly, by the Company. Non-controlling interest forms a separate component of the Group’s equity.
Capital reorganizationUnder the 2014 capital reorganization of the Group (Note 1), the consolidated financial statements of the new holding company (the Company) reflect the predecessor carrying amounts of MCC EuroChem and its subsidiaries. Comparative information of MCC EuroChem and its subsidiaries is presented for each of the periods as if the transfer had occurred at the beginning of the earliest period presented as no substantive economic change has occurred.
Purchases and sales of non-controlling interestsThe Group applies the economic entity model to account for transactions with owners of non-controlling interests that do not result in a loss of control. Any difference between the purchase consideration and the carrying amount of non-controlling interest acquired is recorded as a capital transaction directly in equity. The Group recognizes the difference between sales consideration and carrying amount of non-controlling interest sold as a capital transaction in the consolidated statement of changes in equity.
Notes to the Consolidated Financial Statements continued
for year ended 31 December 2014(all amounts are presented in thousands of US dollars, unless otherwise stated)

ST
RA
TE
GIC
RE
PO
RT
CO
RP
OR
AT
E G
OV
ER
NA
NC
EFIN
AN
CIA
L STA
TE
ME
NT
S
EuroChem Annual Report and Accounts 2014 85
2 Basis of preparation and significant accounting policies continued
Disposals of subsidiariesWhen the Group ceases to have control or significant influence, any retained interest is remeasured to its fair value at the date when control is lost, with the change in carrying amount recognized in profit or loss.
Property, plant and equipmentProperty, plant and equipment are stated at historical cost, less accumulated depreciation and a provision for impairment, where required.
Subsequent costs are included in the asset’s carrying amount or recognized as a separate asset, as appropriate, only when it is probable that future economic benefits associated with the item will flow to the Group and the cost of the item can be measured reliably. The cost of replacing major parts or components of property, plant and equipment items is capitalized and the replaced part is retired. Minor repair and maintenance costs are expensed when incurred.
At each reporting date management assesses whether there is any indication of impairment of property, plant and equipment. If any such indication exists, management estimates the recoverable amount, which is determined as the higher of an asset’s fair value less costs to sell and its value in use. The carrying amount is reduced to the recoverable amount and the impairment loss is recognized in the profit and loss. An impairment loss recognized for an asset in prior years is reversed if there has been a change in the estimates used to determine the asset’s value in use or fair value less costs to sell.
Gains and losses on disposals determined by comparing proceeds with carrying amount are recognized in the profit and loss.
Capitalization of borrowing costsGeneral and specific borrowing costs directly attributable to the acquisition, construction or production of assets that necessarily take a substantial time to get ready for intended use or sale (qualifying assets) are capitalized as part of the costs of those assets, if the commencement date for capitalization is on or after 1 January 2009. The commencement date for capitalization is when (a) the Group incurs expenditures for the qualifying asset; (b) it incurs borrowing costs; and (c) it undertakes activities that are necessary to prepare the asset for its intended use or sale. Capitalization of borrowing costs continues up to the date when the assets are substantially ready for their use or sale.
The Group capitalises borrowing costs that could have been avoided if it had not made capital expenditure on qualifying assets. Borrowing costs capitalized are calculated at the Group’s average funding cost (the weighted average interest cost is applied to the expenditures on the qualifying assets), except to the extent that funds are borrowed specifically for the purpose of obtaining a qualifying asset. Where this occurs, actual borrowing costs incurred less any investment income on the temporary investment of those borrowings are capitalized.
DepreciationLand as well as assets under construction are not depreciated. Depreciation of other items of property, plant and equipment (other than oil and gas assets) is calculated using the straight-line method to allocate their cost to their residual values over their estimated useful lives from the time they are ready for use:
Useful lives in years
Buildings and land improvements 15 to 80Transfer devices 25 to 30Machinery and equipment 2 to 30Transport 5 to 25Other items 1 to 8
Depreciation of oil and gas assets is calculated using the unit-of-production method.
The residual value of an asset is the estimated amount that the Group would currently obtain from disposing of the asset less the estimated costs of disposal, if the asset were already of the age and in the condition expected at the end of its useful life. The residual value of an asset is nil if the Group expects to use the asset until the end of its physical life. The assets’ residual values and useful lives are reviewed, and adjusted if appropriate, at each reporting date.
Remaining useful life of property, plant and equipmentManagement assesses the remaining useful life of property, plant and equipment in accordance with the current technical conditions of assets and the estimated period during which these assets will bring economic benefit to the Group.
Development expendituresDevelopment expenditures incurred by the Group are accumulated separately for each area of interest in which economically recoverable resources have been identified. Such expenditures comprise cost directly attributable to the construction of a mine and the related infrastructure. Once a development decision has been taken, the expenditures in respect of the area of interests are classified in the assets under construction category.
Notes to the Consolidated Financial Statements continued
for year ended 31 December 2014(all amounts are presented in thousands of US dollars, unless otherwise stated)

FINANCIAL STATEMENTS
86 EuroChem Annual Report and Accounts 2014
2 Basis of preparation and significant accounting policies continued
Exploration assetsExploration and evaluation costs related to an area of interest are written off as incurred except they are carried forward as an asset in the consolidated statement of financial position where the rights of tenure of an area are current and it is considered probable that the costs will be recouped through successful development and exploitation of the area of interest. Capitalized costs include costs directly related to exploration and evaluation activities in the relevant area of interest. In accordance with IFRS 6, ‘Exploration for and Evaluation of Mineral Resources’, exploration assets are measured applying the cost model described in IAS 16, ‘Property, Plant and Equipment’ after initial recognition. Depreciation and amortization are not calculated for exploration assets because the economic benefits that the assets represent are not consumed until the production phase. Capitalized exploration and evaluation expenditure is written off where the above conditions are no longer satisfied.
All capitalized exploration and evaluation expenditures are assessed for impairment if facts and circumstances indicate that impairment may exist. Exploration and evaluation assets are also tested for impairment once commercial reserves are found, before the assets are transferred to development properties.
Operating leasesWhere the Group is a lessee in a lease which does not transfer substantially all the risks and rewards incidental to ownership from the lessor to the Group, the total lease payments are charged to profit and loss on a straight-line basis over the period of the lease. The lease term is the non-cancelable period for which the lessee has contracted to lease the asset together with any further terms for which the lessee has the option to continue to lease the asset, with or without further payment, when at the inception of the lease it is reasonably certain that the lessee will exercise the option.
When assets are leased out under an operating lease, the lease payments receivable are recognized as rental income on a straight-line basis over the lease term.
GoodwillGoodwill is carried at cost less accumulated impairment losses, if any. The Group tests goodwill for impairment at least annually and whenever there are indications that goodwill may be impaired. The carrying value of goodwill is compared to the relevant amount, which is the higher of value in use and the fair value less cost of disposal. Any impairment is recognized immediately as an expense and is not subsequently reversed. Goodwill is allocated to the cash-generating units, or groups of cash-generating units, that are expected to benefit from the synergies of the business combination. Such units or groups of units represent the lowest level at which the Group monitors goodwill and are not larger than an operating segment.
Gains or losses on disposal of an operation within a cash generating unit to which goodwill has been allocated include the carrying amount of goodwill associated with the operation disposed of, generally measured on the basis of the relative values of the operation disposed of and the portion of the cash-generating unit which is retained.
Mineral rightsMineral rights include rights for evaluation, exploration and production of mineral resources under the licenses or agreements. Such assets are carried at cost, amortization is charged on a straight line basis over the shorter of the valid period of the license or the agreement, or the expected life of mine, starting from the date when production activities commence. The costs directly attributable to acquisition of rights for evaluation, exploration and production are capitalized as a part of the mineral rights. If the reserves related to the mineral rights are not economically viable, the carrying amount of such mineral rights is written off.
Mineral resourcesMineral resources are recognized as assets when acquired as part of a business combination and then depleted using the unit-of-production method for oil and gas assets based on total proved mineral reserves and straight line method for other assets. Estimated proven and probable mineral reserves reflect the economically recoverable quantities which can be legally recovered in the future from known mineral deposits and were determined by independent professional appraisers when acquired as part of a business combination.
Intangible assetsThe Group’s intangible assets have definite useful lives and primarily include acquired core process technology, distribution agreements, customer relationships, trademarks, capitalized computer software costs and other intangible assets.
These assets are capitalized on the basis of the costs incurred to acquire and bring them to use.
Notes to the Consolidated Financial Statements continued
for year ended 31 December 2014(all amounts are presented in thousands of US dollars, unless otherwise stated)

ST
RA
TE
GIC
RE
PO
RT
CO
RP
OR
AT
E G
OV
ER
NA
NC
EFIN
AN
CIA
L STA
TE
ME
NT
S
EuroChem Annual Report and Accounts 2014 87
2 Basis of preparation and significant accounting policies continued
Intangible assets with definite useful lives are amortized using the straight-line method over their useful lives:
Useful lives in years
Land use rights 50Know-how and production technology 5 to 18Trademarks 15Customer relationships 10Distribution agreement 8Software licenses 5
The Group tests intangible assets for impairment whenever there are indications that intangible assets may be impaired.
If impaired, the carrying amount of intangible assets is written down to the higher of value in use and fair value less cost of disposal.
Financial instruments – key measurement termsDepending on their classification financial instruments are carried at fair value or amortized cost as described below.
Fair value is the price that would be received to sell an asset or paid to transfer a liability in an orderly transaction between market participants at the measurement date. The best evidence of fair value is the price in an active market. An active market is one in which transactions for the asset or liability take place with sufficient frequency and volume to provide pricing information on an ongoing basis.
Fair value of financial instruments traded in an active market is measured as the product of the quoted price for the individual asset or liability and the number of instruments held by the entity. This is the case even if a market’s normal daily trading volume is not sufficient to absorb the quantity held and placing orders to sell the position in a single transaction might affect the quoted price. The quoted market price used to value financial assets is the current bid price; the quoted market price for financial liabilities is the current asking price.
Valuation techniques such as discounted cash flow models or models based on recent arm’s length transactions or consideration of financial data of the investees are used to measure fair value of certain financial instruments for which external market pricing information is not available. Fair value measurements are analyzed by level in the fair value hierarchy as follows: (i) Level 1 are measurements at quoted prices (unadjusted) in active markets for identical assets or liabilities; (ii) Level 2 measurements are valuations techniques with all material inputs observable for the asset or liability, either directly (that is, as prices) or indirectly (that is, derived from prices); and (iii) Level 3 measurements are valuations not based on solely observable market data (that is, the measurement requires significant unobservable inputs).
Cost is the amount of cash or cash equivalents paid or the fair value of the other consideration given to acquire an asset at the time of its acquisition and includes transaction costs. Measurement at cost is only applicable to investments in equity instruments that do not have a quoted market price and whose fair value cannot be reliably measured and derivatives that are linked to, and must be settled by, delivery of such unquoted equity instruments.
Transaction costs are incremental costs that are directly attributable to the acquisition, issue or disposal of a financial instrument. An incremental cost is one that would not have been incurred if the transaction had not taken place. Transaction costs include fees and commissions paid to agents (including employees acting as selling agents), advisors, brokers and dealers, levies by regulatory agencies and securities exchanges, and transfer taxes and duties. Transaction costs do not include debt premiums or discounts, financing costs or internal administrative or holding costs.
Amortized cost is the amount at which the financial instrument was recognized at initial recognition less any principal repayments, plus accrued interest, and for financial assets less any write-down for incurred impairment losses. Accrued interest includes amortization of transaction costs deferred at initial recognition and of any premium or discount to the maturity amount using the effective interest method. Accrued interest income and accrued interest expense, including both accrued coupon and amortized discount or premium (including fees deferred at origination, if any), are not presented separately and are included in the carrying values of the related items in the consolidated statement of financial position.
The effective interest method is a method of allocating interest income or interest expense over the relevant period, so as to achieve a constant periodic rate of interest (effective interest rate) on the carrying amount. The effective interest rate is the rate that exactly discounts estimated future cash payments or receipts (excluding future credit losses) through the expected life of the financial instrument or a shorter period, if appropriate, to the net carrying amount of the financial instrument. The effective interest rate discounts cash flows of variable interest instruments to the next interest repricing date, except for the premium or discount which reflects the credit spread over the floating rate specified in the instrument, or other variables that are not reset to market rates. Such premiums or discounts are amortized over the whole expected life of the instrument. The present value calculation includes all fees paid or received between parties to the contract that are an integral part of the effective interest rate.
Notes to the Consolidated Financial Statements continued
for year ended 31 December 2014(all amounts are presented in thousands of US dollars, unless otherwise stated)

FINANCIAL STATEMENTS
88 EuroChem Annual Report and Accounts 2014
2 Basis of preparation and significant accounting policies continued
Classification of financial assetsThe Group classifies its financial assets into the following measurement categories: a) loans and receivables; b) available-for-sale financial assets; c) financial assets held to maturity; and d) financial assets at fair value through profit and loss. Financial assets at fair value through profit and loss have two subcategories: (i) assets designated as such upon initial recognition; and (ii) those classified as held for trading.
Financial assets held for trading are classified in this category if acquired principally for the purpose of selling in the short term.
Loans and receivables are non-derivative financial assets with fixed or determinable payments that are not quoted in an active market. They are included in the current assets, except for those with maturities greater than 12 months after the reporting date, which are classified as non-current assets.
The ‘Held-to-maturity’ classification includes quoted non-derivative financial assets with fixed or determinable payments and fixed maturities that the Group has both the intention and ability to hold to maturity. Management determines the classification of investment securities held to maturity at their initial recognition and reassesses the appropriateness of that classification at each reporting date. At 31 December 2014 and 31 December 2013 the Group did not have any ‘Held-to-maturity’ investments.
All other financial assets are included in the available-for-sale category.
The Group may choose to reclassify a non-derivative trading financial asset out of the fair value through profit or loss category if the asset is no longer held for the purpose of selling it in the near term. Financial assets other than loans and receivables are permitted to be reclassified out of the fair value through profit or loss category only in rare circumstances arising from a single event that is unusual and highly unlikely to reoccur in the near term. Financial assets that would meet the definition of loans and receivables may be reclassified if the Group has the intention and ability to hold these financial assets for the foreseeable future or until maturity.
Initial recognition of financial instrumentsTrading investments and derivatives are initially recorded at their fair value. All other financial assets and liabilities are initially recorded at their fair value plus transaction costs. Fair value at initial recognition is best evidenced by the transaction price. A gain or loss on initial recognition is only recorded if there is a difference between fair value and the transaction price which can be evidenced by other observable current market transactions in the same instrument or by a valuation technique whose inputs include only data from observable markets.
All purchases and sales of financial assets that require delivery within the time frame established by regulation or market convention (‘regular way’ purchases and sales) are recorded at their trade date, which is the date that the Group commits to deliver a financial asset. All other purchases are recognized when the entity becomes a party to the contractual provisions of the instrument.
De-recognition of financial assetsThe Group derecognizes financial assets when: (i) the assets are redeemed or the rights to cash flows from the assets have otherwise expired; or (ii) the Group has transferred substantially all the risks and rewards of ownership of the assets; or (iii) the Group has neither transferred nor retained substantially all risks and rewards of ownership but has not retained control. Control is retained if the counterparty does not have the practical ability to sell the asset in its entirety to an unrelated third party without needing to impose additional restrictions on the sale.
Derivative financial instrumentsThe Group’s derivative financial instruments comprise forwards, options and swap contracts in foreign exchange and securities. Derivative financial instruments, including forward rate agreements, options and interest rate swaps, are carried at their fair value. All derivative instruments are carried as assets when fair value is positive and as liabilities when fair value is negative. Changes in the fair value of derivative instruments are included in profit or loss.
The Group has no derivatives accounted for as hedges.
Offsetting financial instrumentsFinancial assets and liabilities are offset and the net amount reported in the consolidated statement of financial position only when there is a legally enforceable right to offset the recognized amounts, and there is an intention to either settle on a net basis, or to realize the asset and settle the liability simultaneously. Such a right of set off: (a) must not be contingent on a future event; and (b) must be legally enforceable in all of the following circumstances: (i) in the normal course of business; (ii) in the event of default; and (iii) in the event of insolvency or bankruptcy.
Available-for-sale investmentsAvailable-for-sale investments are carried at fair value. Interest income on available-for-sale debt securities is calculated using the effective interest method and recognized in profit or loss for the year as finance income. Dividends on available-for-sale equity instruments are recognized in profit or loss for the year as finance income when the Group’s right to receive payment is established and it is probable that the dividends will be collected. All other elements of changes in the fair value are recognized in other comprehensive income until the investment is derecognized or impaired at which time the cumulative gain or loss is reclassified from other comprehensive income to finance income in profit or loss for the year.
Notes to the Consolidated Financial Statements continued
for year ended 31 December 2014(all amounts are presented in thousands of US dollars, unless otherwise stated)

ST
RA
TE
GIC
RE
PO
RT
CO
RP
OR
AT
E G
OV
ER
NA
NC
EFIN
AN
CIA
L STA
TE
ME
NT
S
EuroChem Annual Report and Accounts 2014 89
2 Basis of preparation and significant accounting policies continued
Impairment losses are recognized in profit or loss for the year when incurred as a result of one or more events (‘loss events’) that occurred after the initial recognition of available-for-sale investments. A significant or prolonged decline in the fair value of an equity security below its cost is an indicator that it is impaired. The cumulative impairment loss – measured as the difference between the acquisition cost and the current fair value, less any impairment loss on that asset previously recognized in profit or loss – is reclassified from other comprehensive income to finance costs in profit or loss for the year.
Impairment losses on equity instruments are not reversed and any subsequent gains are recognized in other comprehensive income. If, in a subsequent period, the fair value of a debt instrument classified as available-for-sale increases and the increase can be objectively related to an event occurring after the impairment loss was recognized in profit or loss, the impairment loss is reversed through current period’s profit or loss.
Trading investmentsTrading investments are carried at fair value. Interest earned on trading investments calculated using the effective interest method is presented as finance income in profit or loss for the year. Dividends are included in finance income when the Group’s right to receive the dividend payment is established and it is probable that the dividends will be collected. All other elements of the changes in the fair value and gains or losses on derecognition are recorded in profit or loss for the year as gains less losses from trading investments in the period in which they arise.
AssociatesAssociates are entities over which the Group has significant influence (directly or indirectly), but not control, generally accompanying a shareholding of between 20 and 50 percent of the voting rights. Investments in associates are accounted for using the equity method of accounting and are initially recognized at cost, and the carrying amount is increased or decreased to recognize the investor’s share of the profit or loss of the investee after the date of acquisition. Dividends received from associates reduce the carrying value of the investment in associates. Other post-acquisition changes in the Group’s share of net assets of an associate are recognized as follows: (i) the Group’s share of profits or losses of associates is recorded in the consolidated profit or loss for the year as the share of results of associates; (ii) the Group’s share of other comprehensive income is recognized in other comprehensive income and presented separately; (iii) all other changes in the Group’s share of the carrying value of net assets of associates are recognized in profit or loss within the share of results of associates.
However, when the Group’s share of losses in an associate equals or exceeds its interest in the associate, including any other unsecured receivables, the Group does not recognize further losses, unless it has incurred obligations or made payments on behalf of the associate. Unrealized gains on transactions between the Group and its associates are eliminated to the extent of the Group’s interest in the associates; unrealized losses are also eliminated unless the transaction provides evidence of an impairment of the asset transferred.
Joint arrangementsUnder IFRS 11, investments in joint arrangements are classified as either joint operations or joint ventures depending on the contractual rights and obligations of each investor. The Company has assessed the nature of its joint arrangements and determined them to be joint ventures. Joint ventures are accounted for using the equity method.
Under the equity method of accounting, interests in joint ventures are initially recognized at cost and adjusted thereafter to recognize the Group’s share of the post-acquisition profits or losses and movements in other comprehensive income. When the Group’s share of losses in a joint venture equals or exceeds its interests in the joint ventures (which includes any long-term interests that, in substance, form part of the Group’s net investment in the joint ventures), the Group does not recognize further losses, unless it has incurred obligations or made payments on behalf of the joint ventures.
Unrealized gains on transactions between the Group and its joint ventures are eliminated to the extent of the Group’s interest in the joint ventures. Unrealized losses are also eliminated unless the transaction provides evidence of an impairment of the asset transferred. Accounting policies of the joint ventures have been changed where necessary to ensure consistency with the policies adopted by the Group.
Income taxesIncome taxes have been provided for in the consolidated financial statements in accordance with tax legislation enacted or substantively enacted by the reporting date for each country where the Group subsidiaries are registered. The income tax expense comprises current tax and deferred tax and is recognized in the profit and loss unless it relates to transactions that are recognized in other comprehensive income or directly in equity.
The Group companies are subject to tax rates depending on the country of domicile (Note 32).
Current tax is the amount expected to be paid to or recovered from the tax authorities in respect of taxable profits or losses for the current and prior periods.
Notes to the Consolidated Financial Statements continued
for year ended 31 December 2014(all amounts are presented in thousands of US dollars, unless otherwise stated)

FINANCIAL STATEMENTS
90 EuroChem Annual Report and Accounts 2014
2 Basis of preparation and significant accounting policies continued
Deferred income tax is provided using the balance sheet liability method for tax loss carry forwards and temporary differences arising between the tax bases of assets and liabilities and their carrying amounts for financial reporting purposes. In accordance with the initial recognition exemption, deferred taxes are not recorded for temporary differences on initial recognition of an asset or a liability in a transaction other than a business combination if the transaction, when initially recorded, affects neither accounting nor taxable profit. Deferred tax liabilities are not recorded for temporary differences on initial recognition of goodwill and subsequently for goodwill which is not deductible for tax purposes. Deferred tax balances are measured at tax rates enacted or substantively enacted at the reporting date which are expected to apply to the period when the temporary differences will reverse or the tax loss carry forwards will be utilized. Deferred tax assets and liabilities are netted only within the individual companies of the Group. Deferred tax assets for deductible temporary differences and tax loss carry forwards are recorded only to the extent that it is probable that future taxable profit will be available against which the deductions can be utilized. Deferred income tax assets and liabilities are offset when there is a legally enforceable right to offset current tax assets against current tax liabilities and when the deferred income taxes assets and liabilities relate to income taxes levied by the same taxation authority on either the same taxable entity or different taxable entities where there is an intention to settle the balances on a net basis.
Deferred income tax is provided on post acquisition retained earnings of subsidiaries, except where the Group controls the subsidiary’s dividend policy and it is probable that the difference will not be reversed through dividends or upon disposal in the foreseeable future.
Deferred income tax liabilities are provided on taxable temporary differences arising from investments in associates and joint arrangements except for deferred income tax liability where the timing of the reversal of the temporary difference is controlled by the Group and it is probable that the temporary difference will not reverse in the foreseeable future. Generally the Group is unable to control the reversal of the temporary difference for associates only where there is an agreement in place that gives the Group the ability to control the reversal of the temporary difference is not recognized.
Deferred income tax assets are recognized on deductible temporary differences arising from investments in associates and joint arrangements only to the extent that it is probable the temporary difference will reverse in the future and there is sufficient taxable profit available against which the temporary difference can be utilized.
Uncertain tax positionsThe Group’s uncertain tax positions are reassessed by management at the end of each reporting period. Liabilities are recorded for income tax positions that are determined by management as more likely than not to result in additional taxes being levied if the positions were to be challenged by the tax authorities. The assessment is based on the interpretation of tax laws that have been enacted or substantively enacted by the end of the reporting period, and any known court or other rulings on such issues. Liabilities for penalties, interest and taxes other than on income are recognized based on management’s best estimate of the expenditure required to settle the obligations at the end of the reporting period. Adjustments for uncertain income tax positions are recorded within the income tax charge.
InventoriesInventories are recorded at the lower of cost and net realisable value. The cost of inventory is assigned on the weighted-average basis. The cost of finished goods and work in progress comprises raw material, direct labor, other direct costs and related production overheads (based on normal operating capacity) but excludes borrowing costs. Net realisable value is the estimated selling price in the ordinary course of business, less the cost of completion and selling expenses.
Trade and other receivablesTrade receivables are recognized initially at fair value and subsequently measured at amortized cost using the effective interest method.
Impairment of financial assets carried at amortized costImpairment losses are recognized in profit or loss when incurred as a result of one or more events (‘loss events’) that occurred after the initial recognition of the financial asset and which have an impact on the amount or timing of the estimated future cash flows of the financial asset or group of financial assets that can be reliably estimated. If the Group determines that no objective evidence exists that impairment was incurred for an individually assessed financial asset, whether significant or not, it includes the asset in a group of financial assets with similar credit risk characteristics, and collectively assesses them for impairment. The primary factors that the Group considers in determining whether a financial asset is impaired are its overdue status and realisability of related collateral, if any. The following other principal criteria are also used to determine whether there is objective evidence that an impairment loss has occurred:
• any portion or installment is overdue and the late payment cannot be attributed to a delay caused by the settlement systems;
• the counterparty experiences a significant financial difficulty as evidenced by its financial information that the Group obtains;
• the counterparty considers bankruptcy or a financial reorganization;
• there is adverse change in the payment status of the counterparty as a result of changes in the national or local economic conditions that impact the counterparty; or
• the value of collateral, if any, significantly decreases as a result of deteriorating market conditions.
Notes to the Consolidated Financial Statements continued
for year ended 31 December 2014(all amounts are presented in thousands of US dollars, unless otherwise stated)

ST
RA
TE
GIC
RE
PO
RT
CO
RP
OR
AT
E G
OV
ER
NA
NC
EFIN
AN
CIA
L STA
TE
ME
NT
S
EuroChem Annual Report and Accounts 2014 91
2 Basis of preparation and significant accounting policies continued
For the purposes of a collective evaluation of impairment, financial assets are grouped on the basis of similar credit risk characteristics. Those characteristics are relevant to the estimation of future cash flows for groups of such assets by being indicative of the debtors’ ability to pay all amounts due according to the contractual terms of the assets being evaluated. Future cash flows, in a group of financial assets that are collectively evaluated for impairment, are estimated on the basis of the contractual cash flows of the assets and the experience of management in respect of the extent to which amounts will become overdue as a result of past loss events and the success of recovery of overdue amounts. Past experience is adjusted on the basis of current observable data to reflect the effects of current conditions that did not affect past periods, and to remove the effects of past conditions that do not exist currently.
If the terms of an impaired financial asset held at amortized cost are renegotiated or otherwise modified because of financial difficulties of the counterparty, impairment is measured using the original effective interest rate before the modification of terms. The renegotiated asset is then derecognized and a new asset is recognized at its fair value only if the risks and rewards of the asset substantially changed. This is normally evidenced by a substantial difference between the present values of the original cash flows and the new expected cash flows.
Impairment losses are always recognized through an allowance account to write down the asset’s carrying amount to the present value of expected cash flows (which exclude future credit losses that have not been incurred) discounted at the original effective interest rate of the asset. The calculation of the present value of the estimated future cash flows of a collateralized financial asset reflects the cash flows that may result from foreclosure less costs for obtaining and selling the collateral, whether or not foreclosure is probable.
If, in a subsequent period, the amount of the impairment loss decreases and the decrease can be related objectively to an event occurring after the impairment was recognized (such as an improvement in the debtor’s credit rating), the previously recognized impairment loss is reversed by adjusting the allowance account through profit or loss for the year.
Uncollectible assets are written off against the related impairment loss provision after all the necessary procedures to recover the asset have been completed and the amount of the loss has been determined. Subsequent recoveries of amounts previously written off are credited to the impairment loss account within the profit or loss for the year.
PrepaymentsPrepayments are carried at cost less provision for impairment. A prepayment is classified as non-current when the goods or services relating to the prepayment are expected to be obtained after one year, or when the prepayment relates to an asset which will itself be classified as non-current upon initial recognition. Prepayments to acquire assets are transferred to the carrying amount of the asset once the Group has obtained control of the asset and it is probable that future economic benefits associated with the asset will flow to the Group. Other prepayments are written off to profit or loss when the goods or services relating to the prepayments are received. If there is an indication that the assets, goods or services relating to a prepayment will not be received, the carrying value of the prepayment is written down accordingly and a corresponding impairment loss is recognized in profit or loss for the year.
Cash and cash equivalentsCash and cash equivalents include cash in hand, term deposits held with banks, and other short-term highly liquid investments with original maturities of three months or less and bank overdrafts.
Term deposits for longer than three months that are repayable on demand within one working day without penalties or that can be redeemed/withdrawn, subject to the interest income being forfeited, are classified as cash equivalents if the deposit is held to meet short-term cash needs and there is no significant risk of a change in value as a result of an early withdrawal. Other term deposits are included into fixed-term deposits.
Cash and cash equivalents are carried at amortized cost using the effective interest method.
Restricted balances are excluded from cash and cash equivalents. Balances restricted from being exchanged or used to settle a liability for at least twelve months after the reporting date are included in non-current assets in the consolidated statement of financial position.
Fixed-term depositsFixed-term deposits are deposits held with banks and have various original maturities and can be withdrawn with early notification and/or with penalty accrued or interest income forfeited. They are included in the current assets, except for those with maturities greater than 12 months after the reporting date, which are classified as non-current assets.
Share capitalOrdinary shares are classified as equity. Incremental costs directly attributable to the issue of new shares are shown in equity as a deduction, net of tax, from the proceeds. Any excess of the fair value of consideration received over the par value of shares issued is presented in the consolidated statement of changes in equity as a share premium.
Capital contributionThe capital contribution received from shareholder which does not require repayment, or for which the Group will be able to avoid any payments is classified as a component of the equity and recorded as a separate reserve in the consolidated statement of changes in equity.
Notes to the Consolidated Financial Statements continued
for year ended 31 December 2014(all amounts are presented in thousands of US dollars, unless otherwise stated)

FINANCIAL STATEMENTS
92 EuroChem Annual Report and Accounts 2014
2 Basis of preparation and significant accounting policies continued
DividendsDividends are recognized as a liability and deducted from equity at the reporting date only if they are declared and approved before or on the reporting date. Dividends are disclosed when they are proposed before the reporting date or proposed or declared after the reporting date but before the consolidated financial statements are authorised for issue.
Value added taxOutput value added tax related to sales is payable to tax authorities on the earlier of: (a) collection of receivables from customers; or (b) delivery of goods or services to customers. VAT incurred on purchases may be offset, subject to certain restrictions, against VAT related to revenues, or can be reclaimed in cash from the tax authorities under certain circumstances. VAT related to sales and purchases is recognized in the consolidated statement of financial position on a gross basis and disclosed separately as an asset and liability. Where provision has been made for the impairment of receivables, the impairment loss is recorded for the gross amount of the debtor, including VAT.
Management periodically reviews the recoverability of VAT receivables and believes the amount reflected in the consolidated financial statements is fully recoverable within one year.
BorrowingsBorrowings are initially recognized at fair value, net of transaction costs incurred, and are subsequently stated at amortized cost using the effective interest method.
Trade and other payablesTrade payables are recognized initially at fair value and subsequently measured at amortized cost using the effective interest method.
Investment grantsInvestment grants are recognized at their fair value where there is a reasonable assurance that the grant will be received and the Group will comply with all attached conditions. Investment grants relating to the purchase of property, plant and equipment are included in non-current liabilities as deferred income and are credited to the profit and loss on a straight-line basis over the expected lives of the related assets.
Provisions for liabilities and chargesProvisions for liabilities and charges are recognized when the Group has a present legal or constructive obligation as a result of past events, it is probable that an outflow of resources will be required to settle the obligation, and a reliable estimate of the amount can be made. Provisions are measured at the present value of the expenditures expected to be required to settle the obligation using pre-tax rate that reflects current market assessments of the time value of money and the risks specific to obligation. The increase in the provision due to the passage of time is recognized as an interest expense.
Where the Group expects a provision to be reimbursed, for example under an insurance contract, the reimbursement is recognized as a separate asset but only when the reimbursement is virtually certain.
Asset retirement obligationsThe Group’s mining, extraction and processing activities are subject to requirements under federal, state and local environmental regulations which result in asset retirement obligations. Such retirement obligations include restoration costs primarily relating to mining and drilling operations, decommissioning of underground and surfacing operating facilities.
The estimated future land restoration costs, discounted to net present value, are capitalized in respective items of property, plant and equipment either when an item is acquired or as the item is used during a particular period for purposes other than to produce inventories during that period. Corresponding obligations are raised when the constructive obligation to incur such costs arises and these costs could be reliably estimated. Additional items of property, plant and equipment are amortized on a straight-line basis over the useful life of the corresponding asset. The unwinding of the obligation is recognized in profit and loss as part of other financial gain/loss.
Changes to estimated future costs are recognized in the consolidated statement of financial position by either increasing or decreasing the provision for land restoration and asset to which it relates. The Group reassesses its estimation of land restoration provision as at the end of each reporting period. Ongoing restoration costs are recognized as expenses when incurred.
Revenue recognitionRevenues from sales of goods are recognized at the point of transfer of risks and rewards of ownership of the goods. If the Group agrees to transport goods to a specified location, revenue is recognized when the goods are passed to the customer at the destination point. Revenues from sales of services are recognized in the period the services are provided, by reference to the stage of completion of the specific transaction assessed on the basis of the actual service provided as a proportion of the total services to be provided.
Sales are shown net of VAT and other sales taxes.
Revenues are measured at the fair value of the consideration received or receivable, taking into account the amount of any trade discounts and volume rebates allowed.
Interest income is recognized on a time-proportion basis using the effective interest method.
Notes to the Consolidated Financial Statements continued
for year ended 31 December 2014(all amounts are presented in thousands of US dollars, unless otherwise stated)

ST
RA
TE
GIC
RE
PO
RT
CO
RP
OR
AT
E G
OV
ER
NA
NC
EFIN
AN
CIA
L STA
TE
ME
NT
S
EuroChem Annual Report and Accounts 2014 93
2 Basis of preparation and significant accounting policies continued
Employee benefitsWages, salaries, contributions to the Russian Federation state pension and social insurance funds, paid annual leave and sick leave, bonuses, and non-monetary benefits (such as health services, etc.) are accrued in the year in which the associated services are rendered by the employees of the Group.
EuroChem Antwerpen NV and EuroChem Agro operate defined benefit pension plans, which represent an amount of pension benefit that an employee will receive on retirement, usually dependent on one or more factors such as age, years of service and compensation. The defined benefit obligation is calculated annually by independent actuaries using the projected unit credit method. Remeasurements of post-employment benefit obligations are recognized in other comprehensive income. The defined pension obligation of the Group is not material.
Earnings per shareEarnings per share is determined by dividing the profit or loss attributable to equity holders of the Company by the weighted average number of ordinary shares outstanding during the reporting period.
Segment reportingA segment is a distinguishable component of the Group that is engaged in providing products or services (operating segment). Segments whose sales or results are ten percent or more of all the segments are reported separately. Segment reporting is prepared in a manner consistent with the internal reporting provided to the chief operating decision-maker.
Changes in presentationStarting from 1 January 2014, certain changes have been applied to the presentation of the notes:
• Segment results of EuroChem Agro companies’ (distribution network) are reallocated from ‘Nitrogen’ and ‘Other’ segments to the ‘Distribution’ segment (Note 8).
• Sales are presented by product groups with indication of sales volumes (Note 26).
• The cost of sales line ‘Materials and components used or resold’ is divided into the lines ‘Raw materials’, ‘Other materials’ and ‘Goods for resale’ (Note 27).
• After the capital reorganization of the Group (Note 1), comparative information about earnings per share has been recalculated (Note 33).
The comparative figures are presented and reallocated respectively to reflect these changes.
3 Critical accounting estimates and judgments in applying accounting policies
The Group makes estimates and assumptions that affect the reported amounts of assets and liabilities within the next financial year. Estimates and judgments are continually evaluated and are based on management’s experience and other factors, including expectations of future events that are believed to be reasonable under the circumstances. Management also makes certain judgments, apart from those involving estimations, in the process of applying the accounting policies. Judgments that have the most significant effect on the amounts recognized in the consolidated financial statements and estimates that can cause a significant adjustment to the carrying amount of assets and liabilities within the next financial year include:
TaxationJudgments are required in determining current income tax liabilities (Note 32). The Group recognizes liabilities for taxes based on estimates of whether additional taxes will be due. Where the final outcome of various tax matters is different from the amounts that were initially recorded, such differences will impact the current and deferred income tax assets and liabilities in the period in which such determination is made.
Deferred income tax asset recognitionThe recognized deferred tax assets represent income taxes recoverable through future deductions from taxable profits and are recorded in the consolidated statement of financial position. Deferred income tax assets are recorded to the extent that realization of the related tax benefit is probable. This includes temporary difference expected to reverse in the future and the availability of sufficient future taxable profit against which the deductions can be utilized. The future taxable profits and the amount of tax benefits that are probable in the future are based on the medium-term business plan prepared by management and extrapolated results thereafter. The business plan is based on management expectations that are believed to be reasonable under the circumstances (Note 32).
Deferred income tax on post-acquisition retained earnings of subsidiariesDeferred income tax is provided on post-acquisition retained earnings and other post acquisition movements in reserves of subsidiaries, except where the Group controls the subsidiary’s dividend policy and it is probable that the difference will not reverse through dividends or otherwise in the foreseeable future.
LandCertain industrial premises of the Group’s subsidiary LLC EuroChem Terminal Ust-Luga are located on land occupied under a short-term lease. The management believes that no losses will be sustained by the Group due to the short-term nature of the land lease since it will be able to either purchase the land or to secure its use via a long-term lease agreement in due course.
Notes to the Consolidated Financial Statements continued
for year ended 31 December 2014(all amounts are presented in thousands of US dollars, unless otherwise stated)

FINANCIAL STATEMENTS
94 EuroChem Annual Report and Accounts 2014
3 Critical accounting estimates and judgments in applying accounting policies continued
Related party transactionsThe Group enters into transactions with related parties in the normal course of business. These transactions are priced predominantly at market rates. Judgement is applied in determining whether transactions are priced at market or non-market rates where there is no active market for such transactions. Judgments are made by comparing prices for similar types of transactions with unrelated parties.
4 Adoption of new or revised standards and interpretations
The following new standards, amendments to standards and interpretations became effective from 1 January 2014:
• IFRIC 21 − Levies (issued on 20 May 2013 and effective for annual periods beginning on or after 1 January 2014);
• Amendments to IFRS 10, IFRS 12 and IAS 27 – Investment entities (issued on 31 October 2012 and effective for annual periods beginning on or after 1 January 2014);
• Offsetting Financial Assets and Financial Liabilities – Amendments to IAS 32 (issued in December 2011 and effective for annual periods beginning on or after 1 January 2014);
• Amendments to IAS 36 – Recoverable amount disclosures for non-financial assets (issued on 29 May 2013 and effective for annual periods beginning on or after 1 January 2014; earlier application is permitted if IFRS 13 is applied for the same accounting and comparative period);
• Amendments to IAS 39 – Novation of Derivatives and Continuation of Hedge Accounting (issued on 27 June 2013 and effective for annual periods beginning on or after 1 January 2014).
Unless otherwise described above, these standards, amendments to standards and interpretations did not have any impact or did not have a material impact on these consolidated financial statements.
A number of new standards, amendments to standards and interpretations are not yet effective as at 31 December 2014, and have not been early adopted by the Group:
• IFRS 9, Financial Instruments: Classification and Measurement (issued in July 2014 effective for annual periods beginning on or after 1 January 2018). The Group is currently assessing the impact of the standard on its consolidated financial statements;
• Amendments to IAS 19 – Defined benefit plans: Employee contribution (issued in November 2013, effective for annual periods beginning on or after 1 July 2014);
• IFRS 14, Regulatory Deferral Accounts (issued in January 2014 and effective for annual periods beginning on or after 1 January 2016);
• Improvements to International Financial Reporting Standards 2012 and 2013 (issued in December 2013 and effective for annual periods beginning on or after 1 July 2014);
• Amendments to IFRS 11 – Accounting for Acquisitions of interests in Joint Operations (issued on 6 May 2014 and effective for the periods beginning on or after 1 January 2016);
• Amendments to IAS 16 and IAS 38 – Clarification of Acceptable Methods of Depreciation and Amortisation (issued on 12 May 2014 and effective for the periods beginning on or after 1 January 2016);
• IFRS 15, Revenue from Contracts with Customers (issued on 28 May 2014 and effective for the periods beginning on or after 1 January 2017). The Group is currently assessing the impact of the standard on its consolidated financial statements;
• Amendments to IAS 16 and IAS 41 – Agriculture: Bearer plants (issued on 30 June 2014 and effective for annual periods beginning 1 January 2016);
• Amendments to IAS 27 – Equity Method in Separate Financial Statements (issued on 12 August 2014 and effective for annual periods beginning 1 January 2016);
• Amendments to IFRS 10 and IAS 28 regarding the sale or contribution of assets between an investor and its associate or joint venture (issued on 11 September 2014 and effective for annual periods beginning on or after 1 January 2016);
• Annual Improvements to IFRS 5, IFRS 7, IAS 19, IAS 34 (issued on 25 September 2014 and effective for annual periods beginning on or after 1 January 2016);
• Disclosure Initiative Amendments to IAS 1 (issued in December 2014 and effective for annual periods on or after 1 January 2016);
• Investment Entities: Applying the Consolidation Exception Amendment to IFRS 10, IFRS 12 and IAS 28 (issued in December 2014 and effective for annual periods on or after 1 January 2016).
Unless otherwise described above, the new standards, amendments to standards and interpretations are not expected to have any impact or to have a material impact on the Group’s consolidated financial statements.
Notes to the Consolidated Financial Statements continued
for year ended 31 December 2014(all amounts are presented in thousands of US dollars, unless otherwise stated)

ST
RA
TE
GIC
RE
PO
RT
CO
RP
OR
AT
E G
OV
ER
NA
NC
EFIN
AN
CIA
L STA
TE
ME
NT
S
EuroChem Annual Report and Accounts 2014 95
5 Statement of cash flows
In managing the business, management focuses on a number of cash flow measures including ‘gross cash flow’ and ‘free cash flow’. Gross cash flow refers to the operating profit after income tax and adjusted for items which are not of a cash nature, which have been charged or credited to the profit and loss. The gross cash flow is available to finance movements in operating assets and liabilities, investing and financing activities. The gross cash inflow for the year ended 31 December 2014 was US$ 1,508,655 thousand (2013: inflow of US$ 1,119,792 thousand).
Free cash flows are the cash flows available to the debt or equity holders of the business. The free cash outflow for the year ended 31 December 2014 was US$ 320,103 thousand (2013: inflow of US$ 129,524 thousand).
Since these terms are not standard IFRS measures EuroChem Group’s definition of gross cash flow and free cash flow may differ from that of other companies.
6 Principal subsidiaries, associates and joint ventures
The Group had the following principal subsidiaries, associates and joint ventures as at 31 December 2014:
Name Nature of businessPercentage of voting rights
Percentage of ownership
Country of registration
EuroChem Group AG Holding company – – Switzerland
Subsidiaries:Phosphorit Industrial Group, LLC Manufacturing 100% 100% RussiaNovomoskovskiy Azot, JSC Manufacturing 100% 100% RussiaNovomoskovskiy Chlor, LLC Manufacturing 100% 100% RussiaNevinnomysskiy Azot, JSC Manufacturing 100% 100% RussiaEuroChem-Belorechenskie Minudobrenia, LLC Manufacturing 100% 100% RussiaKovdorskiy GOK, JSC Mining 100% 100% RussiaLifosa AB Manufacturing 100% 100% LithuaniaSeverneft-Urengoy, LLC Gas extraction 100% 100% RussiaEuroChem Antwerpen NV Manufacturing 100% 100% BelgiumEuroChem-VolgaKaliy, LLC Potash project under development 100% 100% RussiaEuroChem-Usolsky potash complex, LLC Potash project under development 100% 100% RussiaEuroChem-Fertilizers, LLP Phosphate project under development 100% 100% KazakhstanSary-Tas Fertilizers, LLP Other service 85.79% 85.79% KazakhstanEuroChem Karatau, LLP Other service 100% 100% KazakhstanEuroChem Trading GmbH Trading 100% 100% SwitzerlandEuroChem Trading USA Ltd Trading 100% 100% USAEuroChem Agro SAS Distribution 100% 100% FranceEuroChem Agro Asia Pte. Ltd Distribution 100% 100% SingaporeEuroChem Agro Iberia Distribution 100% 100% SpainEuroChem Agricultural Trading Hellas SA Distribution 100% 100% GreeceEuroChem Agro Spa Distribution 100% 100% ItalyEuroChem Agro GmbH Distribution 100% 100% GermanyEuroChem Agro Mexico SA de CV Distribution 100% 100% MexicoEuroChem Agro Fertilizer Trade LLP Distribution 100% 100% Turkey EuroChem Comercio de Produtos Quimicos Ltda Distribution 100% 100% BrazilEuroChem Agro Trading (Shenzhen) Co., Ltd Distribution 100% 100% ChinaAgroCenter EuroChem-Volgograd, LLC Distribution 100% 100% RussiaAgroCenter EuroChem-Krasnodar, LLC Distribution 100% 100% RussiaAgroCenter EuroChem-Lipetsk, LLC Distribution 100% 100% RussiaAgroCenter EuroChem-Orel, LLC Distribution 100% 100% RussiaAgroCenter EuroChem-Novomoskovsk, LLC Distribution 100% 100% RussiaAgroCenter EuroChem-Nevinnomyssk, LLC Distribution 100% 100% RussiaAgroCenter EuroChem-Ukraine, LLC Distribution 100% 100% UkraineUral-RemStroiService, LLC Repair and constructions 100% 100% RussiaKingisepp RemStroiService, LLC Repair and constructions 100% 100% Russia
Notes to the Consolidated Financial Statements continued
for year ended 31 December 2014(all amounts are presented in thousands of US dollars, unless otherwise stated)

FINANCIAL STATEMENTS
96 EuroChem Annual Report and Accounts 2014
6 Principal subsidiaries, associates and joint ventures continued
Name Nature of businessPercentage of voting rights
Percentage of ownership
Country of registration
Kovdor RemStroiService, LLC Repair and constructions 100% 100% RussiaNovomoskovsk RemStroiService, LLC Repair and constructions 100% 100% RussiaNevinnomyssk RemStroiService, LLC Repair and constructions 100% 100% RussiaVolgograd RemStroiService, LLC Repair and constructions 100% 100% RussiaTulagiprokhem, LLC Design engineering 100% 100% RussiaHarvester Shipmanagement Ltd Logistics 100% 100% CyprusEuroChem Logistics International, UAB Logistics 100% 100% LithuaniaEuroChem Terminal Sillamäe Aktsiaselts Logistics 100% 100% EstoniaEuroChem Terminal Ust-Luga, LLC Logistics 100% 100% RussiaTuapse Bulk Cargo Terminal, LLC Logistics 100% 100% RussiaMurmanskiy Bulk Cargo Terminal, LLC Logistics 100% 100% RussiaDepot-EuroChem, LLC Logistics 100% 100% RussiaEuroChem-Energo, LLC Other service 100% 100% RussiaEuroChem Usolsky Mining S.à.r.l. Finance 100% 100% LuxemburgEuroChem International Holding B.V. Holding company 100% 100% NetherlandsEuroChem A.M. Ltd Finance 100% 100% CyprusEuroChem Capital Management Ltd Finance 100% 100% BVIMCC EuroChem, JSC Holding company 100% 100% Russia
Associates:Murmansk Commercial Seaport, PJSC Logistics 36.20% 48.26% RussiaAstrakhan Oil and Gas Company, OJSC Gas project under construction 20.1% 20.1% Russia
Joint venture:EuroChem Migao Ltd Holding company 50.0% 50.0% Hong-Kong*
* Represents the country of incorporation of holding company which owns manufacturing facilities located in Yunnan, China
7 Fair value of financial instruments
Fair value measurements are analyzed by level in the fair value hierarchy as follows: (i) Level 1 are measurements at quoted prices (unadjusted) in active markets for identical assets or liabilities; (ii) Level 2 measurements are valuations techniques with all material inputs observable for the asset or liability, either directly (that is, as prices) or indirectly (that is, derived from prices); and (iii) Level 3 measurements are valuations not based on observable market data (that is, unobservable inputs). Management applies judgement in categorizing financial instruments using the fair value hierarchy. If a fair value measurement uses observable inputs that require significant adjustment, that measurement is a Level 3 measurement. The significance of a valuation input is assessed against the fair value measurement in its entirety.
Recurring fair value measurementsRecurring fair value measurements are those that the accounting standards require or permit in the statement of financial position at the end of each reporting period.
Notes to the Consolidated Financial Statements continued
for year ended 31 December 2014(all amounts are presented in thousands of US dollars, unless otherwise stated)
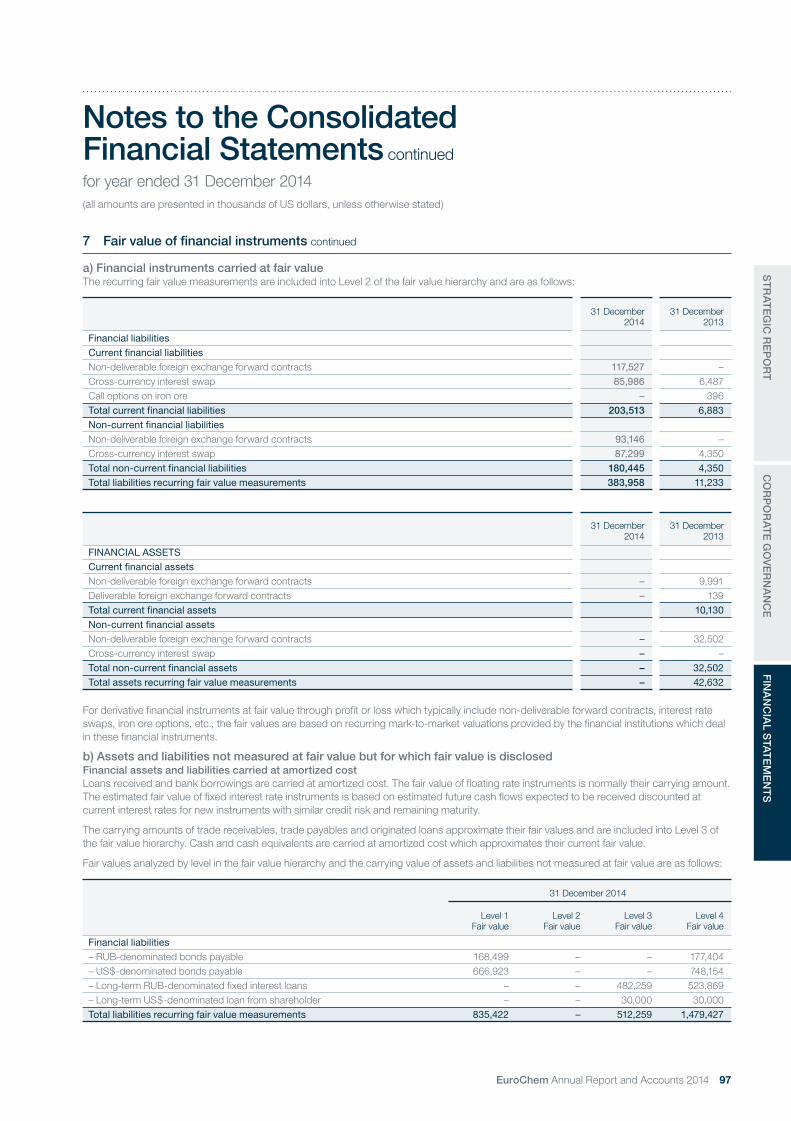
ST
RA
TE
GIC
RE
PO
RT
CO
RP
OR
AT
E G
OV
ER
NA
NC
EFIN
AN
CIA
L STA
TE
ME
NT
S
EuroChem Annual Report and Accounts 2014 97
7 Fair value of financial instruments continued
a) Financial instruments carried at fair valueThe recurring fair value measurements are included into Level 2 of the fair value hierarchy and are as follows:
31 December2014
31 December2013
Financial liabilitiesCurrent financial liabilitiesNon-deliverable foreign exchange forward contracts 117,527 –Cross-currency interest swap 85,986 6,487Call options on iron ore – 396Total current financial liabilities 203,513 6,883Non-current financial liabilitiesNon-deliverable foreign exchange forward contracts 93,146 –Cross-currency interest swap 87,299 4,350Total non-current financial liabilities 180,445 4,350Total liabilities recurring fair value measurements 383,958 11,233
31 December2014
31 December2013
FINANCIAL ASSETSCurrent financial assetsNon-deliverable foreign exchange forward contracts – 9,991Deliverable foreign exchange forward contracts – 139Total current financial assets 10,130Non-current financial assetsNon-deliverable foreign exchange forward contracts – 32,502Cross-currency interest swap – –Total non-current financial assets – 32,502Total assets recurring fair value measurements – 42,632
For derivative financial instruments at fair value through profit or loss which typically include non-deliverable forward contracts, interest rate swaps, iron ore options, etc., the fair values are based on recurring mark-to-market valuations provided by the financial institutions which deal in these financial instruments.
b) Assets and liabilities not measured at fair value but for which fair value is disclosedFinancial assets and liabilities carried at amortized costLoans received and bank borrowings are carried at amortized cost. The fair value of floating rate instruments is normally their carrying amount. The estimated fair value of fixed interest rate instruments is based on estimated future cash flows expected to be received discounted at current interest rates for new instruments with similar credit risk and remaining maturity.
The carrying amounts of trade receivables, trade payables and originated loans approximate their fair values and are included into Level 3 of the fair value hierarchy. Cash and cash equivalents are carried at amortized cost which approximates their current fair value.
Fair values analyzed by level in the fair value hierarchy and the carrying value of assets and liabilities not measured at fair value are as follows:
31 December 2014
Level 1 Fair value
Level 2 Fair value
Level 3 Fair value
Level 4 Fair value
Financial liabilities– RUB-denominated bonds payable 168,499 – – 177,404– US$-denominated bonds payable 666,923 – – 748,154– Long-term RUB-denominated fixed interest loans – – 482,259 523,869– Long-term US$-denominated loan from shareholder – – 30,000 30,000Total liabilities recurring fair value measurements 835,422 – 512,259 1,479,427
Notes to the Consolidated Financial Statements continued
for year ended 31 December 2014(all amounts are presented in thousands of US dollars, unless otherwise stated)

FINANCIAL STATEMENTS
98 EuroChem Annual Report and Accounts 2014
7 Fair value of financial instruments continued
31 December 2013
Level 1 Fair value
Level 2 Fair value
Level 3 Fair value
Level 4 Fair value
Financial liabilities– RUB-denominated bonds payable 307,157 – – 304,779– US$-denominated bonds payable 756,443 – – 745,764– RUB-denominated fixed interest loans – – 628,113 609,733Total liabilities recurring fair value measurements 1,063,600 – 628,113 1,660,276
The following information sets out the key inputs relevant to the determination of the fair value of the assets and liabilities for which fair value information is provided as a disclosure only.
• For US$ and RUB-denominated bonds traded on organized financial markets, quotations obtained from Moscow Exchange and Irish stock exchange are used as the key inputs to fair value determination. These instruments are included in Level 1 of the fair value hierarchy.
• The fair value of long-term loans and borrowings bearing a fixed interest rate is determined by a discounted cash flows method. The discount factor applied to principal and interest repayments in the valuation model is calculated as a risk free rate on the reporting date adjusted for the Group’s credit risk. The Group’s credit risk component in the discount factor at inception is assumed to remain unchanged on the reporting date and is calculated as a difference between the contract interest rate and the risk-free interest rate in effect on loan inception date for debt instruments with similar maturities. These instruments are included in Level 3 of fair value hierarchy.
During the year ended 31 December 2014 there were no transfers between Levels 1, 2 and 3 in the fair value hierarchy.
8 Segment information
The Group has four reportable operating segments identified by the management: nitrogen, phosphates, potash, and distribution. The development and approval of strategies, market and risk analysis, the investment focus, technological process changes, and the setting of goals and priorities of the Group are undertaken in line with these segments:
• Nitrogen – the production and sale of nitrogen mineral fertilizers and organic synthesis products and the extraction of hydrocarbons (natural gas and gas condensate) where natural gas is used as the raw material for the production of nitrogen fertilizers and gas condensate is sold;
• Phosphates – the production and sale of phosphate mineral fertilizers and the extraction of ores to produce and subsequently sell baddeleyite and iron-ore concentrates;
• Potash – the development of deposits of potassium salts (‘potash’) under the licenses acquired by the Group for production of potassium fertilizers. No sales have been recorded to date in this segment;
• Distribution – retail sales of mineral fertilizers (including those not produced by the Group), seeds, crop protection and other items, via a distribution network comprising distribution centers located in Russia, the CIS and sales offices located in Germany, Spain, Italy, Greece, France, Turkey, Mexico, Singapore and China.
The remaining part of the Group represents certain logistics and service activities, central management, investment income and other items.
On a monthly basis, the Management Board reviews the financial reports of the Group, evaluates the operating results and allocates resources between the operating segments. Budgets and financial reports are prepared in a standard format according to the IFRS accounting policy adopted by the Group. Sales between segments are carried out on an arm’s length basis. The Management Board assesses the performance of the operating segments based on, among other factors, a measure of profit before taxation adjusted by interest expense, depreciation and amortization, financial foreign exchange gain or loss, other non-cash and extraordinary items, excluding net profit for the period attributed to non-controlling interests (EBITDA). Since this term is not a standard IFRS measure, EuroChem Group’s definition of EBITDA may differ from that of other companies.
During 2014, the Group has been considering a change in its management and organizational structure to a divisional model. Management anticipates that they will finalize management changes and organization structuring and will start to report its operating results based on the new divisional organizational structure in 2015.
Notes to the Consolidated Financial Statements continued
for year ended 31 December 2014(all amounts are presented in thousands of US dollars, unless otherwise stated)

ST
RA
TE
GIC
RE
PO
RT
CO
RP
OR
AT
E G
OV
ER
NA
NC
EFIN
AN
CIA
L STA
TE
ME
NT
S
EuroChem Annual Report and Accounts 2014 99
8 Segment information continued
The segment results for the year ended 31 December 2014 were:
External sales Internal sales Total sales EBITDA
Nitrogen 1,532,037 1,383,258 2,915,295 866,293Phosphates 1,134,060 457,708 1,591,768 475,894Potash – – – (31,835)Distribution 2,301,075 14,351 2,315,426 90,411Other 120,328 819,461 939,789 194,426Elimination – (2,674,778) (2,674,778) (82,197)Total 5,087,500 – 5,087,500 1,512,992
The segment results for the year ended 31 December 2013 were:
External sales Internal sales Total sales EBITDA
Nitrogen 1,811,389 1,197,435 3,008,824 808,458Phosphates 1,726,195 106,820 1,833,015 435,461Potash – – – (24,324)Distribution 1,822,786 11,648 1,834,434 86,841Other 195,288 745,081 940,369 47,699Elimination – (2,060,984) (2,060,984) (5,141)Total 5,555,658 – 5,555,658 1,348,994
A reconciliation of EBITDA to profit/(loss) before taxation for the year ended 31 December 2014 and 2013 is provided below:
Note 2014 2013
EBITDA 1,512,992 1,348,994Depreciation and amortization 29 (267,254) (310,104)Write-off of idle property, plant and equipment 9, 27, 30 (5,639) (18,516)Non-recurring income from settlement agreement 30 50,400 –Loss on disposal of available-for-sale investments – (46,970)Interest expense (152,345) (161,809)Financial foreign exchange gain/(loss), net (1,067,225) (184,997)Other financial gain/(loss), net 31 (527,718) (29,663)Non-controlling interests (95) (198)Profit/(loss) before taxation (456,884) 596,737
The segmental capital expenditure on property, plant and equipment, intangible assets and mineral rights for the years ended 31 December 2014 and 31 December 2013 were:
2014 2013
Nitrogen 340,413 325,908Phosphates 281,778 270,597Potash 439,390 387,902Distribution 4,603 3,310Other 35,951 35,817Total capital expenditure 1,102,135 1,023,534
Notes to the Consolidated Financial Statements continued
for year ended 31 December 2014(all amounts are presented in thousands of US dollars, unless otherwise stated)

FINANCIAL STATEMENTS
100 EuroChem Annual Report and Accounts 2014
8 Segment information continued
The analysis of non-current assets other than financial instruments, deferred income tax assets and post-employment benefit assets by geographical location was:
31 December2014
31 December2013
Russia 3,374,460 4,715,864Europe 855,107 1,007,053Kazakhstan 141,520 90,992Other countries 4,992 32,749Total 4,376,079 5,846,658
The main Group’s manufacturing facilities are based in the Russian Federation, Lithuania and Belgium.
The analysis of Group sales by region was:
2014 2013
Europe 1,916,536 1,797,506Russia 1,023,853 1,046,888Asia 687,684 989,499North America 503,861 551,028Latin America 494,384 510,584CIS 313,148 447,134Africa 123,657 157,383Australasia 24,377 55,636Total sales 5,087,500 5,555,658
The sales are allocated to regions based on the destination country. During the year ended 31 December 2014, the Group had sales to Russia representing 20% of total Group revenues (2013: there were sales in excess of 10% to Russia and China, representing 19% and 11% of total Group revenues, respectively).
During the years ended 31 December 2014 and 31 December 2013, there were no sales in excess of 10% to one customer.
Notes to the Consolidated Financial Statements continued
for year ended 31 December 2014(all amounts are presented in thousands of US dollars, unless otherwise stated)

ST
RA
TE
GIC
RE
PO
RT
CO
RP
OR
AT
E G
OV
ER
NA
NC
EFIN
AN
CIA
L STA
TE
ME
NT
S
EuroChem Annual Report and Accounts 2014 101
9 Property, plant and equipment
Movements in the carrying amount of property, plant and equipment were:
Buildings
Land and land
improvementsTransfer devices
Machineryand
equipment Transport Other
Assetsunder
construction Total
CostBalance at 1 January 2014 559,902 614,634 381,999 1,955,009 382,787 109,447 2,118,086 6,121,864Additions and transfers from assets
under construction 71,100 95,674 47,955 310,151 20,630 33,020 579,144 1,157,674Disposals (551) (1,906) (1,278) (14,230) (9,304) (1,815) (4,497) (33,581)Changes in estimates of asset retirement
obligations (Note 24) – 1,692 – – – – – 1,692Disposal of property, plant and equipment related
to sale of subsidiaries – – – – (28,171) – – (28,171)Write-off of idle property, plant and equipment (371) (852) (1,059) (897) (1,546) (1,053) (3,921) (9,699)Currency translation difference (224,613) (267,197) (159,706) (775,828) (147,192) (51,864) (1,039,708) (2,666,108)Balance at 31 December 2014 405,467 442,045 267,911 1,474,205 217,204 87,735 1,649,104 4,543,671Accumulated DepreciationBalance at 1 January 2014 (153,164) (114,394) (131,647) (833,727) (159,984) (58,167) – (1,451,083)Charge for the year (21,050) (26,313) (23,681) (155,245) (23,681) (13,157) – (263,127)Disposals 401 1,422 1,151 13,034 8,445 1,490 – 25,943Disposal of property, plant and equipment related
to sale of subsidiaries – – – – 4,544 – – 4,544Write-off of idle property, plant and equipment 481 228 647 1,142 1,342 220 – 4,060Currency translation difference 60,728 49,545 56,360 341,195 67,301 26,483 – 601,612Balance at 31 December 2014 (112,604) (89,512) (97,170) (633,601) (102,033) (43,131) – (1,078,051)Net Carrying ValueBalance at 1 January 2014 406,738 500,240 250,352 1,121,282 222,803 51,280 2,118,086 4,670,781Balance at 31 December 2014 292,863 352,533 170,741 840,604 115,171 44,604 1,649,104 3,465,620
Buildings
Land and land
improvementsTransfer devices
Machineryand
equipment Transport Other
Assetsunder
construction Total
CostBalance at 1 January 2013 531,226 565,574 377,749 1,859,781 388,579 99,466 1,634,475 5,456,850Additions and transfers from assets
under construction 62,472 98,113 30,976 211,173 28,729 20,168 627,242 1,078,873Disposals (576) (4,453) (1,449) (13,016) (8,797) (2,261) (1,569) (32,121)Changes in estimates of asset retirement
obligations (Note 24) – (4,722) – – – – – (4,722)Write-off of idle property, plant and equipment (3,493) (2,488) (2,149) (8,107) (590) (1,065) (10,270) (28,162)Currency translation difference (29,727) (37,390) (23,128) (94,822) (25,134) (6,861) (131,792) (348,854)Balance at 31 December 2013 559,902 614,634 381,999 1,955,009 382,787 109,447 2,118,086 6,121,864Accumulated DepreciationBalance at 1 January 2013 (134,732) (92,494) (115,864) (705,617) (150,055) (50,383) – (1,249,145)Charge for the year (28,482) (28,302) (25,394) (185,539) (27,979) (14,135) – (309,831)Disposals 484 950 1,234 10,940 7,098 1,966 – 22,672Write-off of idle property, plant and equipment 1,792 346 967 5,298 348 895 – 9,646Currency translation difference 7,774 5,106 7,410 41,191 10,604 3,490 – 75,575Balance at 31 December 2013 (153,164) (114,394) (131,647) (833,727) (159,984) (58,167) – (1,451,083)Net Carrying ValueBalance at 1 January 2013 396,494 473,080 261,885 1,154,164 238,524 49,083 1,634,475 4,207,705Balance at 31 December 2013 406,738 500,240 250,352 1,121,282 222,803 51,280 2,118,086 4,670,781
Notes to the Consolidated Financial Statements continued
for year ended 31 December 2014(all amounts are presented in thousands of US dollars, unless otherwise stated)

FINANCIAL STATEMENTS
102 EuroChem Annual Report and Accounts 2014
9 Property, plant and equipment continued
The analysis of the Group’s assets under construction, which are included in property, plant and equipment, is as follows:
31 December2014
31 December2013
Construction in progress 1,516,059 1,916,896Advances given to construction companies and suppliers of property, plant and equipment 125,478 191,802Evaluation expenses 7,567 9,388Total assets under construction 1,649,104 2,118,086
Idle property, plant and equipment write-offDuring the year ended 31 December 2014, the Group decided to write off certain production equipment with the cost and accumulated depreciation of US$ 9,699 thousand and US$ 4,060 thousand, respectively (2013: cost of US$ 28,162 thousand and accumulated depreciation of US$ 9,646 thousand) and recognized a loss of US$ 5,639 thousand in these consolidated financial statements (2013: US$ 18,516 thousand) (Notes 27, 30).
Evaluation expenses at the Darganovsky and Ravninny potash fieldsAt 31 December 2014, the Group has capitalized expenses relating to the evaluation stage of the Darganovsky and Ravninny potash fields of US$ 7,567 thousand, including borrowing costs capitalized of US$ 760 thousand (31 December 2013: US$ 9,388 thousand, including borrowing costs capitalized of US$ 623 thousand). These expenses were recognized in property, plant and equipment. In most cases, these expenses were paid in the period when the services were provided.
Borrowing costs capitalizedDuring the year ended 31 December 2014, borrowing costs totalling US$ 34,152 thousand (2013: US$ 16,894 thousand) were capitalized in property, plant and equipment at an average interest rate of 4.73% pa (2013: 5.05% pa).
Operating leasesAs at 31 December 2014, the land plots under the main production facilities were owned by the Group. Also, several Group subsidiaries occupied the land under non-cancelable operating lease agreements, for which the future minimum payments are as follows:
31 December2014
31 December2013
Shorter than 1 year 3,553 6,119Between 1 and 5 years 13,342 23,411Longer than 5 years 104,462 174,739Total payments 121,357 204,269
10 Mineral rights
31 December2014
31 December2013
Rights for exploration and production: Verkhnekamskoe potash deposit 72,650 124,878 Gremyachinskoe potash deposit 53,641 92,205 Kok-Jon and Gimmelfarbskoe phosphate deposits 29,213 35,758 Kovdorskiy apatite deposits 2,960 5,089Rights for exploration, evaluation and extraction: Belopashninskiy potash deposit 15,733 – Ozinskiy hydrocarbon deposit 4,383 – Zapadno-Perelyubskiy potash deposit 534 917 Perelyubsko-Rubezhinskiy hydrocarbon deposit 392 675 Vostochno-Perelyubskiy potash deposit 416 715Rights for proven and unproven mineral resources: Zapadno-Yaroyakhinsky hydrocarbon deposit 118,449 206,534Total mineral rights 298,371 466,771
Notes to the Consolidated Financial Statements continued
for year ended 31 December 2014(all amounts are presented in thousands of US dollars, unless otherwise stated)

ST
RA
TE
GIC
RE
PO
RT
CO
RP
OR
AT
E G
OV
ER
NA
NC
EFIN
AN
CIA
L STA
TE
ME
NT
S
EuroChem Annual Report and Accounts 2014 103
10 Mineral rights continued
Rights for exploration and productionVerkhnekamskoe and Gremyachinskoe potash depositsIn accordance with the conditions of license agreements and related license amendments for developing the potash deposits, the Group has major commitments.
The license terms in respect of the timing of the Verkhnekamskoe potash deposit were renegotiated in 2014 allowing the Group some flexibility as to timing of first extraction as the amended terms state it is subject to ‘Project Documentation’. The Group is in compliance with the new terms and will continue on this basis without requiring further license revision. Before revision in 2014, the license agreement required potash salt (first ore) extraction at the Verkhnekamskoe potash deposit by 15 October 2015.
The license terms in respect of the timing of Gremyachinskoe potash deposit were renegotiated in 2014 requiring potash extraction (first ore) no later than the end of November 2017. Before revision in 2014, the license required potash salt extraction at the Gremyachinskoe potash deposit by 1 November 2014.
The Group has started construction of the mining and surface facilities at both sites.
Management believes that each stage under the current license terms for both of the Verkhnekamskoe and the Gremyachinskoe potash deposits development will be completed according to the revised and approved schedules.
As at 31 December 2014 both of the Verkhnekamskoe and Gremyachinskoe potash deposits were in the development phase with the shafts sinking completed for the first two shafts at Verkhnekamskoe and all three shafts are progressing with shaft sinking at Gremyachinskoe.
Kok-Jon and Gimmelfarbskoe phosphate depositsIn 2013 the Group started the development of the Kok-Jon phosphate rock deposit in Kazakhstan’s Zhambyl region and in July 2014 the production of the phosphate ore was launched. The project continues on schedule with the planned increase of the production capacity.
As at 31 December 2014, the Group is in compliance with terms of the contract signed with the authorities of the Republic of Kazakhstan.
Rights for exploration, evaluation and extractionAs of 31 December 2014 all other deposits under licenses for the exploration, evaluation and extraction were in the exploration phase.
Belopashninskiy potash depositIn July 2014, the Group acquired mineral rights for exploration and production at the Belopashninskiy potash deposit. The area of the deposit is adjacent to Verkhnekamskoe potash deposit where the Group is developing the mine. The close proximity of the two deposits will allow the Group to more efficiently utilise its resources. As at 31 December 2014 the Group is in the process of preparing its Exploration Plan for this deposit which will be submitted to the license authorities in 2015 for their review and approval in order to remain in compliance with the license terms of this new deposit.
Ozinskiy hydrocarbon depositIn March 2014, the Group acquired mineral rights for exploration, evaluation and extraction at the Ozinskiy hydrocarbon deposit in the Saratov region of Russian Federation.
Under the terms of valid licenses for the exploration and development of mineral resource deposits, the Group is required to comply with a number of conditions, including preparation of design documentation, commencement of the construction of mining facilities and commencement of the extraction of mineral resources by certain dates. If the Group fails to materially comply with the terms of the license agreements there are circumstances whereby the licenses can be revoked. The management of the Group believes that the Group faces no material regulatory risks in relation to the validity and operation of any of its licenses.
11 Goodwill
Movements in goodwill arising from the acquisition of subsidiaries are:
2014 2013
Carrying amount at 1 January 387,335 374,405Currency translation difference (47,607) 12,930Carrying amount at 31 December 339,728 387,335
Notes to the Consolidated Financial Statements continued
for year ended 31 December 2014(all amounts are presented in thousands of US dollars, unless otherwise stated)

FINANCIAL STATEMENTS
104 EuroChem Annual Report and Accounts 2014
11 Goodwill continued
Goodwill impairment testGoodwill is allocated to cash-generating units (CGUs) which represent the lowest level within the Group at which the goodwill is monitored by management and which are not larger than a segment, as follows:
31 December2014
31 December2013
EuroChem Antwerpen NV 313,365 354,431EuroChem Agro 21,115 23,882Other 5,248 9,022Total carrying amount of goodwill 339,728 387,335
The recoverable amount of each CGU was determined based on value-in-use calculations. These calculations use cash flow projections based on development strategy and financial budgets approved by management covering a five-year period. Cash flows beyond the five-year period are extrapolated using the estimated growth rates stated below. The growth rates do not exceed the long-term average growth rate for the business sector of the economy in which the CGU operates.
Management determined budgeted prices and expenses based on past performance and market expectations. The weighted average growth rate used is consistent with the forecasts included in industry reports.
Assumptions used for value-in-use calculations are listed below:
31 December2014
31 December2013
Adjusted US$ WACC rates 9.0% 8.8%Long-term annual inflation rate 0.9%-1.4% 1.6%-2.0%Estimated nominal growth rate beyond the five-year period 2.0% 2.0%
The Group did not recognize any goodwill impairment at 31 December 2014 and 31 December 2013.
Notes to the Consolidated Financial Statements continued
for year ended 31 December 2014(all amounts are presented in thousands of US dollars, unless otherwise stated)

ST
RA
TE
GIC
RE
PO
RT
CO
RP
OR
AT
E G
OV
ER
NA
NC
EFIN
AN
CIA
L STA
TE
ME
NT
S
EuroChem Annual Report and Accounts 2014 105
12 Intangible assets
Movements in the carrying amount of intangible assets were:
Know-howand production
technologyCustomer
relationships
Acquiredsoftware
and licenses Other Total
Cost at 1 January 2013 112,287 84,276 37,785 44,161 278,509Accumulated amortization (9,581) (2,738) (19,127) (9,168) (40,614)
Carrying amount at 1 January 2013 102,706 81,538 18,658 34,993 237,895
Additions – – 3,481 260 3,741Disposals: Cost – – – (185) (185) Accumulated amortization – – – 14 14Amortization charge (13,434) (5,790) (9,689) (4,858) (33,771)Currency translation difference: Cost 4,095 2,882 82 (1,186) 5,873 Accumulated amortization (716) (1) 337 679 299Cost at 31 December 2013 116,382 87,158 41,348 43,050 287,938Accumulated amortization (23,731) (8,529) (28,479) (13,333) (74,072)
Carrying amount at 31 December 2013 92,651 78,629 12,869 29,717 213,866
Additions – – 1,473 817 2,290Disposals: Cost – – – (8) (8) Accumulated amortization – – – 5 5Amortization charge (13,763) (5,468) (9,087) (2,345) (30,663)Currency translation difference: Cost (13,336) (9,530) (8,935) (12,133) (43,934) Accumulated amortization 3,724 948 7,863 5,604 18,139Cost at 31 December 2014 103,046 77,628 33,886 31,726 246,286Accumulated amortization (33,770) (13,049) (29,703) (10,069) (86,591)Carrying amount at 31 December 2014 69,276 64,579 4,183 21,657 159,695
13 Investment in associates and joint venture
As at 31 December 2014 and 2013, the Group’s investments in associates and joint venture were as follows:
31 December2014
31 December2013
Investment in associate PJSC ‘Murmansk Commercial Seaport’ 75,772 107,905Investment in associate OJSC ‘Astrakhan Oil and Gas Company’ 23,785 –Investment in joint venture ‘EuroChem Migao Ltd’ 13,108 –Total investments in associates and joint venture 112,665 107,905
Notes to the Consolidated Financial Statements continued
for year ended 31 December 2014(all amounts are presented in thousands of US dollars, unless otherwise stated)

FINANCIAL STATEMENTS
106 EuroChem Annual Report and Accounts 2014
13 Investment in associates and joint venture continued
Movements in the carrying amount of the Group’s investment in associates and joint venture were:
31 December2014
31 December2013
Carrying amount at 1 January 107,905 –Acquisition of interest in associates 37,500 101,925Contribution of funds to a joint venture 18,000 –Share of profit from associates 19,031 11,904Currency translation difference (69,771) (5,924)Carrying amount at 31 December 112,665 107,905
Reconciliation of the summarized financial information presented to the carrying amount of Group’s interest in associates and joint ventures as at 31 December 2014:
PJSC ‘Murmansk
Commercial Seaport’
OJSC ‘Astrakhan
Oil and Gas Company’
‘EuroChem Migao Ltd’
Opening net assets at 1 January 2014 107,905 – –Net assets at acquisition date – 186,562 36,000Profit for the period 43,394 – –Accrued dividends on preference shares for the period* (3,960) – –Currency translation difference arising on consolidation (36,770) (68,232) (9,785)Closing net assets at 31 December 2014 110,569 118,330 26,215Interest, % 48.26% 20.10% 50.00%Interest in associates and joint venture 53,360 23,785 13,108Goodwill 22,412 – –Carrying value at 31 December 2014 75,772 23,785 13,108
* Represents theoretical dividends on preference shares, determined as 10% of net statutory profit for the reporting period
Investment in associate PJSC ‘Murmansk Commercial Seaport’ The aggregated assets, liabilities, revenues and results of associate as at 31 December 2014 are as follows:
31 December2014
Current assets 79,497Non-current assets 73,294Current liabilities (9,152)Non-current liabilities (33,070)Net assets 110,569
Sales for the year ended 31 December 2014 135,765Net profit for the year ended 31 December 2014 43,394
Investment in associate OJSC ‘Astrakhan Oil and Gas Company’In February 2014, the Group acquired 20.1% of the issued capital of OJSC ‘Astrakhan Oil and Gas Company’ located in the Astrakhan region of Russian Federation for US$ 37,500 thousand paid in cash.
The Group is performing the valuation of the fair value of the associate’s identifiable assets and liabilities and intends to finalize the fair value measurement within 12 months of the acquisition date.
Investment in joint ventureIn November 2013 the Group signed a joint agreement with H.K. Migao Industry Limited to set up a joint venture named ‘EuroChem Migao Ltd’ and located in Hong Kong. ‘EuroChem Migao Ltd’ was incorporated in February 2014 and following the statutory approval granted by local authorities the company acquired 100% interest in ‘Yunnan Migao Fertilizer Co. Ltd’, the plant manufacturing potassium nitrate and complex fertilizers in China. In 2014, the Group made a contribution into a joint venture of US$ 18,000 thousand.
Notes to the Consolidated Financial Statements continued
for year ended 31 December 2014(all amounts are presented in thousands of US dollars, unless otherwise stated)

ST
RA
TE
GIC
RE
PO
RT
CO
RP
OR
AT
E G
OV
ER
NA
NC
EFIN
AN
CIA
L STA
TE
ME
NT
S
EuroChem Annual Report and Accounts 2014 107
14 Inventories
31 December2014
31 December2013
Finished goods 260,585 293,037Materials 181,155 233,817Catalysts 73,076 101,806Work in progress 48,107 74,225Less: write-off obsolete and damaged inventories (7,274) (10,208)Total inventories 555,649 692,677
15 Trade receivables, prepayments, other receivables and other current assets
31 December2014
31 December2013
Trade receivablesTrade receivables denominated in US$ 130,054 125,826Trade receivables denominated in RUB 23,838 56,490Trade receivables denominated in EUR 184,947 161,639Trade receivables denominated in other currencies 5,159 27,179Less: impairment provision (4,142) (7,695)Total trade receivables – financial assets 339,856 363,439
Prepayments, other receivables and other current assetsAdvances to suppliers 61,173 90,124VAT recoverable and receivable 154,591 139,863Other taxes receivable 1,891 11,141Other receivables 11,014 19,070Less: impairment provision (5,852) (6,588)Subtotal non-financial assets 222,817 253,610Other receivables 30,212 6,536Collateral held by banks to secure derivative transactions 1,771 -Interest receivable 5,136 964Subtotal financial assets 37,119 7,500Total prepayments, other receivables and other current assets 259,936 261,110
Total trade receivables, prepayments, other receivables and other current assets 599,792 624,549IncludingFinancial assets 376,975 370,939Non-financial assets 222,817 253,610
Management believes that the fair value of accounts receivable does not differ significantly from their carrying amounts.
As at 31 December 2014, trade receivables, prepayments, other receivables and other current assets of US$ 9,994 thousand (31 December 2013: US$ 14,281 thousand) were individually impaired and an impairment provision was recognized. The individually impaired receivables mainly relate to counterparties which are facing significant financial difficulties. The ageing of these receivables is as follows:
31 December2014
31 December2013
Less than 3 months 23 1,298From 3 to 12 months 2,960 2,133Over 12 months 7,011 10,852Total gross amount of impaired trade receivables, prepayments, other receivables and other current assets 9,994 14,283
Notes to the Consolidated Financial Statements continued
for year ended 31 December 2014(all amounts are presented in thousands of US dollars, unless otherwise stated)

FINANCIAL STATEMENTS
108 EuroChem Annual Report and Accounts 2014
15 Trade receivables, prepayments, other receivables and other current assets continued
As at 31 December 2014, trade receivables of US$ 32,644 thousand (31 December 2013: US$ 39,163 thousand) were past due but not impaired; of this amount US$ 27,802 thousand (31 December 2013: US$ 22,446 thousand) were covered either by credit insurance, bank guarantees or backed by solid ratings from independent rating agencies. The aging analysis of these trade receivables from past due date is:
31 December2014
31 December2013
Less than 3 months 29,770 31,188From 3 to 12 months 2,874 8,826Over 12 months – 1,014Trade accounts receivable past due not impaired 32,644 41,028
For the analysis of credit quality of trade receivables please refer to Note 36.
The movements in the provision for impairment of accounts receivable are:
2014 2013
Trade receivables
Other receivables
Trade receivables
Other receivables
As at 1 January 7,695 6,588 9,875 7,245Provision charged 10,762 5,068 2,339 3,118Provision used (3,122) (1,032) (3,371) (2,543)Provision reversed (8,777) (467) (982) (831)Foreign exchange (gain)/loss, net 647 246 503 117Currency translation difference (3,063) (4,551) (669) (518)Total provision for impairment of accounts receivable as at 31 December 4,142 5,852 7,695 6,588
16 Originated loans
Note31 December
201431 December
2013
Current originated loansUnsecured US$-denominated loan to the partner of the Hong Kong joint venture, fixed interest
rate 6.5% pa 3,000 3,000Unsecured US$-denominated loan to parent company, fixed interest rate 5.5% pa 34 21,800 –Unsecured RUB-denominated loans to associate, interest rate ranging from 8.0% to 19.2% pa 34 4,602 –Total current originated loans 29,402 3,000
Non-current originated loansUnsecured US$-denominated loans to related party which is an entity under common control
with Group, interest rates ranging from 1.57% to 2.62% pa 34 13,170 12,700Secured US$-denominated loans to related parties which are the entities under common
control with the Group, interest rates ranging from 6.7% to 8.0% pa 34 27,000 –Total non-current originated loans 40,170 12,700Total originated loans 69,572 15,700
Notes to the Consolidated Financial Statements continued
for year ended 31 December 2014(all amounts are presented in thousands of US dollars, unless otherwise stated)

ST
RA
TE
GIC
RE
PO
RT
CO
RP
OR
AT
E G
OV
ER
NA
NC
EFIN
AN
CIA
L STA
TE
ME
NT
S
EuroChem Annual Report and Accounts 2014 109
16 Originated loans continued
Movements in the Group’s originated loans during years ended 31 December 2014 and 31 December 2013 were as follows:
Note 2014 2013
Balance as at 1 January 15,700 –Originated loan recognized from sale of K+S Group shares to parent company – 39,504Originated loans to parent company 34 21,800 20,000Originated loans to associate 6,357 –Originated loans to other related party 34 470 12,700Originated loan to JV partner – 3,000Repayment of originated loans to parent company – (63,779)Reclassification of intragroup loans provided to subsidiaries before disposal 34 27,000 –Foreign exchange gain/(loss), net 19,915 1,629Currency translation differences (21,670) 2,646Balance as at 31 December 69,572 15,700
In July 2014, the Group sold two subsidiaries, engaged in shipping operations (Note 34) and reclassified the intragroup loans provided to these subsidiaries before disposal amounting to US$ 27,000 thousand to non-current originated loans. These loans are secured with two vessels owned by the disposed subsidiaries.
17 Cash and cash equivalents, fixed-term deposits and restricted cash
31 December2014
31 December2013
Cash on hand* 43 69Bank balances denominated in US$ 147,553 178,131Bank balances denominated in RUB 22,464 19,382Bank balances denominated in EUR 93,668 216,686Bank balances denominated in other currencies 19,107 13,095Term deposits denominated in US$ 24,388 35,211Term deposits denominated in RUB 36,676 30,123Term deposits denominated in EUR 18,884 1,635Term deposits denominated in other currencies 635 11,406Total cash and cash equivalents 363,418 505,738
Fixed-term deposits in US$ 4,378 2,826Fixed-term deposits in RUB 6,028 71,545Fixed-term deposits in EUR – 234Fixed-term deposits in other currencies 3,034 –Total fixed-term deposits 13,440 74,605Non-current restricted cash 10,125 2,706Total restricted cash 10,125 2,706
* Includes cash on hand denominated in different currencies
Term deposits at 31 December 2014 and 31 December 2013 are held to meet short-term cash needs and have various original maturities but can be withdrawn on request without any restrictions.
Fixed-term deposits have various original maturities and can be withdrawn with an early notification and/or with a penalty accrued or interest income forfeited.
Notes to the Consolidated Financial Statements continued
for year ended 31 December 2014(all amounts are presented in thousands of US dollars, unless otherwise stated)

FINANCIAL STATEMENTS
110 EuroChem Annual Report and Accounts 2014
17 Cash and cash equivalents, fixed-term deposits and restricted cash continued
No bank balances, term and fixed-term deposits are past due or impaired. The analysis of the credit quality of bank balances, term and fixed-term deposits are as follows*:
31 December2014
31 December2013
A to AAA rated 250,753 442,874BB- to BBB+ rated 109,523 121,674B- to B+ rated 6,873 17,278C to CCC rated 19,741 –Unrated 50 1,154Total** 386,940 582,980
* Based on the credit ratings of independent rating agencies Standard & Poor’s and Fitch Ratings as at 15 January 2015** The rest of the statement of financial position item ‘cash and cash equivalents’ is cash on hand
At 31 December 2014, non-current restricted cash consisted of US$ 7,627 thousand held in a debt service reserve account as required by the Project Finance Facility Agreement (Note 20) and US$ 2,498 thousand held in bank accounts as security deposits for third parties (31 December 2013: US$ 2,706 thousand held in bank accounts as security deposits for third parties).
18 Equity
Share capitalAs described in Note 1, the Company was incorporated on 16 July 2014. As at 31 December 2014, the nominal registered amount of the Company’s issued share capital in Swiss francs (CHF) was CHF 100 thousand (US$ 111 thousand). The total authorised number of ordinary shares is 1,000 shares with a par value of CHF 100 (US$ 111) per share. All authorised shares have been issued and fully paid.
Other reservesAt 31 December 2014, other reserves of the Company included a cash contribution of US$ 5,000 thousand from EuroChem Group SE (Note 34).
After the capital reorganization of the Group (Note 1), all components of equity related to MCC EuroChem, the former parent company, have been appropriately accumulated in the ‘Equity not owned directly by the Company’ category in the consolidated statement of changes in equity. This category was subsequently reallocated to all other relevant items within the consolidated statement of changes in equity in line with the capital structure of the new Group.
DividendsDuring 2014 and 2013 the Group did not declare or pay dividends.
19 Bank borrowings and other loans received
Currency Fixed or
floating rate Interest rate
2014*Interest rate
2013*31 December
201431 December
2013
Current loans and borrowingsShort-term unsecured bank loans US$ Floating 2.49%-3.14% 2.88% 286,996 30,000Current portion of unsecured long-term loans US$ Floating 2.04% 2.54%-3.66% 200,000 148,573Current portion of unsecured long-term loans RUB Fixed 8.20% 8.20% 177,751 76,384Current portion of unsecured long-term loans EUR Floating – 2.33% – 4,935Less: short-term portion of transaction costs
loans and borrowings (2,718) (4,134)Total current loans and borrowings 662,029 255,758
* Effective interest rate on the reporting date
Notes to the Consolidated Financial Statements continued
for year ended 31 December 2014(all amounts are presented in thousands of US dollars, unless otherwise stated)

ST
RA
TE
GIC
RE
PO
RT
CO
RP
OR
AT
E G
OV
ER
NA
NC
EFIN
AN
CIA
L STA
TE
ME
NT
S
EuroChem Annual Report and Accounts 2014 111
19 Bank borrowings and other loans received continued
Currency Fixed or
floating rate Interest rate
2014*Interest rate
2013*31 December
201431 December
2013
Non-current bank borrowingsLong-term loan from shareholder US$ Fixed 5.0%-5.5% – 30,000 -Long-term portion of unsecured bank loans US$ Floating 2.04% 2.04%-3.66% 1,100,000 1,469,634Long-term portion of unsecured bank loans RUB Fixed 8.2%-12.25% 8.2% 346,615 534,691Long-term portion of unsecured bank loans EUR Floating – 2.33% – 41,947Less: long-term portion of transaction costs
loans and borrowings (6,496) (40,365)Total non-current loans and borrowings 1,470,119 2,005,907Total loans and borrowings 2,132,148 2,261,665
* Effective interest rate on the reporting date
Movements in Group’s bank borrowings and other loans received during year ended 31 December 2014 and 31 December 2013 were as follows:
2014 2013
Balance as at 1 January 2,261,665 2,185,330Reclassification from capital contribution 50,000 –Bank loans received, denominated in US$ 937,996 2,348,262Bank loans received, denominated in RUB 770,754 –Bank loans received, denominated in Ukrainian Hryvna 4,339 19,180Loan received from shareholder, denominated in US$ 63,000 –Bank loans repaid, denominated in US$ (999,207) (2,225,424)Bank loans repaid, denominated in RUB (507,345) –Bank loans repaid, denominated in EUR (45,152) (22,267)Loan repaid to shareholder, denominated in US$ (83,000) –Bank loans repaid, denominated in Ukrainian Hryvna (4,308) (18,890)Capitalization and amortization of transaction costs, net 24,413 18,844Foreign exchange (gain)/loss, net 1,119,535 132,011Currency translation differences, net (1,460,542) (175,381)Balance as at 31 December 2,132,148 2,261,665
The Group’s bank borrowings and other loans received mature:
31 December2014
31 December2013
– within 1 year 662,029 255,758– between 1 and 2 years 530,736 610,189– between 2 and 5 years 939,383 1,358,264– more than 5 years – 37,454Total bank borrowings and other loans received 2,132,148 2,261,665
At 31 December 2014 and 31 December 2013, the fair value of current bank borrowings and borrowings bearing floating interest rates was not materially different from their carrying amounts.
The fair value of the non-current borrowings bearing fixed interest rate is estimated based on expected cash flows discounted at a prevailing market interest rate. At 31 December 2014, the fair value of the borrowings estimated with an interest rate of 13.78% and 17.53% was less their carrying amount by US$ 42,107 thousand on the net basis (31 December 2013: fair value estimated with interest rate of 6.81% exceeded the carrying amount by US$ 17,038 thousand).
Under the terms of loan agreements, the Group is required to comply with a number of covenants and restrictions, including the maintenance of certain financial ratios and financial indebtedness and cross-default provisions. The Group was in compliance with covenants at 31 December 2014 and 31 December 2013.
Notes to the Consolidated Financial Statements continued
for year ended 31 December 2014(all amounts are presented in thousands of US dollars, unless otherwise stated)

FINANCIAL STATEMENTS
112 EuroChem Annual Report and Accounts 2014
19 Bank borrowings and other loans received continued
Interest rates and outstanding amounts of major loans and borrowingsIn September 2013, the Group obtained a credit facility of US$ 1.3 billion bearing interest at 3-month Libor +1.8% and maturing in September 2018. At 31 December 2014, the outstanding amount was US$ 1.3 billion (31 December 2013: US$ 1.3 billion).
In 2011, the Group signed a RUB 20 billion 5-year non-revolving fixed-interest rate loan facility with a leading Russian bank. As at 31 December 2014, the outstanding amount was RUB 17.5 billion (31 December 2013: RUB 20 billion).
In October 2013, the Group signed a US$ 100 million revolving fixed interest rate credit facility with a Russian bank, the credit limit of which was subsequently increased to US$ 200 million. In May 2014, the Group signed another credit facility with the same bank. In accordance with the terms agreed upon with the bank the combined credit limit on both of the facilities may not exceed US$ 700 million. The funds through this facility may be obtained in multiple currencies. At 31 December 2014, the outstanding amount was RUB 12 billion (31 December 2013: nil).
In October 2013, the Group signed a US$ 250 million 2-year loan agreement bearing a floating interest rate. At 31 December 2014, the outstanding amount was US$ 111,996 thousand (31 December 2013: nil).
In July 2014, the Group obtained fixed interest loans of RUB 15 billion from a Russian commercial bank. As at 31 December 2014 these loans were fully repaid.
Undrawn facilitiesIn December 2014 the Group signed a RUB 9.5 billion revolving committed credit facility with a major Russian bank.
In 2012 the Group signed a US$ 100 million framework agreement for a 2-year revolving facility bearing a floating interest rate based on Libor which was converted to a 4-year facility in 2014 (31 December 2013: the outstanding amount was US$ 30 million).
The above credit facilities had no outstanding balances at 31 December 2014, and are available to the Group.
Collaterals and pledgesAt 31 December 2013 and 31 December 2014, the Group did not have assets pledged or held as collateral to secure borrowings and other loans received listed above.
20 Project finance
In August 2014, the Group signed a US$ 750 million Non-recourse Project Finance Facility Agreement (‘Project Financing’ or the ‘facility’) maturing in 8 years after Financial Closing Date with a floating interest rate based on 3-month Libor for financing of the Usolskiy potash project located at the Palashersky and Balakhontsevsky blocks of the Verkhnekamskoe field of potassium and magnesium salt in the Perm region of the Russian Federation. Financial Closing Date was on 23 December 2014 and the facility has become available for utilization. At 31 December 2014 costs associated with arrangement of the facility (including consultants, coordinators, agency and up-front fees) in the amount of US$ 17,053 thousand have been paid.
Due to the non-recourse nature of the facility, the facility will be presented as a separate line in the non-current liabilities section of consolidated statement of financial position and is to be excluded from financial covenants calculations in accordance with the Group’s various debt, project, finance, legal and other documents.
A debt service reserve account of US$ 7,627 thousand was held at banks in compliance with the terms of Project Finance Facility agreement.
As at 31 December 2014, 100% of the issued share capital of EuroChem Usolskiy Mining S.à.r.l., the project owner and wholly-owned subsidiary of the Group, were pledged as collateral under the terms of Project Finance facility agreement. The carrying value of the assets related to the project described above amounted to US$ 503,500 thousand.
In January 2015 the Group utilized the first loan (i.e. made the first drawndown) under Project Finance Facility of US$ 39,892 thousand.
Notes to the Consolidated Financial Statements continued
for year ended 31 December 2014(all amounts are presented in thousands of US dollars, unless otherwise stated)

ST
RA
TE
GIC
RE
PO
RT
CO
RP
OR
AT
E G
OV
ER
NA
NC
EFIN
AN
CIA
L STA
TE
ME
NT
S
EuroChem Annual Report and Accounts 2014 113
21 Bonds issued
31 December 2014 31 December 2013
Currency RateCoupon
rate MaturityFair
valueCarrying amount
Fair value
Carryingamount
Current bondsShort-term unsecured bonds payable RUB Fixed 8.25% 2015 81,321 88,876 – –Short-term unsecured bonds payable RUB Fixed 8.9% 2015 87,178 88,876 – –Less: transaction costs – (348) – –Total current bonds 168,499 177,404 – –
Non-current bondsLong-term unsecured bonds payable US$ Fixed 5.125% 2017 666,923 750,000 756,443 750,000Long-term unsecured bonds payable RUB Fixed 8.25% 2015 – – 153,166 152,769Long-term unsecured bonds payable RUB Fixed 8.9% 2015 – – 153,991 152,769Less: transaction costs – (1,846) – (4,995)Total non-current bonds 666,923 748,154 1,063,600 1,050,543Total bonds issued 835,422 925,558 1,063,600 1,050,543
The RUB-denominated bonds mature in 2018 but are callable by investors in 2015.
The fair value of the outstanding US$-denominated bonds and RUB-denominated bonds was determined with reference to their quotations on the Irish Stock Exchange and the Moscow Exchange, respectively.
22 Derivative financial assets and liabilities
At 31 December 2014, net derivative financial assets and liabilities were:
Assets Liabilities
Non-current Current Non-current Current
RUB/US$ non-deliverable forward contracts with a nominal amount of RUB 7,500 million – – 93,146 –
RUB/US$ non-deliverable forward contracts with a nominal amount of RUB 11,500 million – – – 117,527
Cross-currency interest rate swap – – 87,299 85,986Total – – 180,445 203,513
At 31 December 2013, net derivative financial assets and liabilities were:
Assets Liabilities
Non-current Current Non-current Current
RUB/US$ non-deliverable forward contracts with a nominal amount of RUB 19,000 million 32,502 – – –
RUB/US$ non-deliverable forward contracts with a nominal amount of RUB 6,600 million – 9,991 – –
EUR/US$ deliverable forward contracts with a nominal amount of US$ 3,575 thousand – 139 – –
Cross-currency interest rate swap – – 4,350 6,487Call options on iron ore – – – 396Total 32,502 10,130 4,350 6,883
Notes to the Consolidated Financial Statements continued
for year ended 31 December 2014(all amounts are presented in thousands of US dollars, unless otherwise stated)

FINANCIAL STATEMENTS
114 EuroChem Annual Report and Accounts 2014
22 Derivative financial assets and liabilities continued
Movements in the carrying amount of derivative financial assets/(liabilities) were:
1 January2014
Gain/(loss) from changes
of fair value, net
Cash (proceeds)/
payments on derivatives, net
Currency translation difference
31 December 2014
Operating activities (257) 216 – 41 –Call options on iron ore (396) 337 – 59 –Foreign exchange deliverable forward contracts, net 139 (121) – (18) –Investing activities 2,687 (3,989) (1,805) 3,107 –Foreign exchange non-deliverable forward contracts, net 2,687 (3,989) (1,805) 3,107 –Financing activities 28,969 (519,605) 19,904 86,774 (383,958)Cross-currency interest rate swaps, net (10,837) (196,467) (3,571) 37,590 (173,285)Foreign exchange non-deliverable forward contracts, net 39,806 (323,138) 23,475 49,184 (210,673)Total derivative financial assets and liabilities, net 31,399 (523,378) 18,099 89,922 (383,958)
During the year ended 31 December 2014, the Group entered into four RUB/US$ non-deliverable forward contracts to sell a notional amount of RUB 5,500 million, one of which was used to offset another forward contract dated May 2012 with a notional amount of RUB 4,100 million. As of 31 December 2014, all of these contracts matured.
A non-deliverable forward contract with a notional amount of RUB 2,500 million which was entered into by the Group in June 2011 matured in December 2014.
In October and November 2014, the Group entered into three RUB/US$ cross-currency interest swap contracts with a total notional amount of US$ 235 million. These contracts mature in September 2018.
Changes in the fair value of derivatives, which are entered into for the purpose of mitigating risks linked to cash flows from operating activities of the Group, amounting to US$ 216 thousand were recognized as a gain within ‘Other operating income and expenses’.
Changes in the fair value of derivatives related to investing and financing activities, which are entered into for the purpose of hedging the investing and financing cash flows, totalling US$ 523,594 thousand were recognized as a loss within ‘Other financial gain and loss’ (Note 31).
Some financial institutions may require the Group to pay collateral to secure its obligations when the amount of liability arising on a derivative contract reaches a certain threshold. Due to higher than normal volatility of the RUB/US$ exchange rate in the final months of 2014, the Group transferred funds in and out of its margin account to satisfy margin call requirements. As at 31 December 2014, the outstanding balance in the margin account was US$ 1,470 thousand, which was accounted for as other financial receivable within ‘Prepayments, other receivables and other current assets’ in the consolidated statement of financial position.
23 Other non-current liabilities and deferred income
Note 2014 2013
Deferred payable related to business combination 40,832 90,991Deferred payable related to mineral rights acquisition 15,600 18,314Provisions for age premium, retirement benefits, pensions and similar obligations 22,064 31,036Provision for land restoration 24 8,423 11,616Deferred income – Investment grant received 2,919 3,927Total other non-current liabilities and deferred income 89,838 155,884
The carrying value of other non-current liabilities approximates their fair values.
In December 2014, the Group paid a portion of deferred compensation of US$ 44,276 thousand (2013: US$ 48,290 thousand) related to the business combination occurred in 2012.
Notes to the Consolidated Financial Statements continued
for year ended 31 December 2014(all amounts are presented in thousands of US dollars, unless otherwise stated)
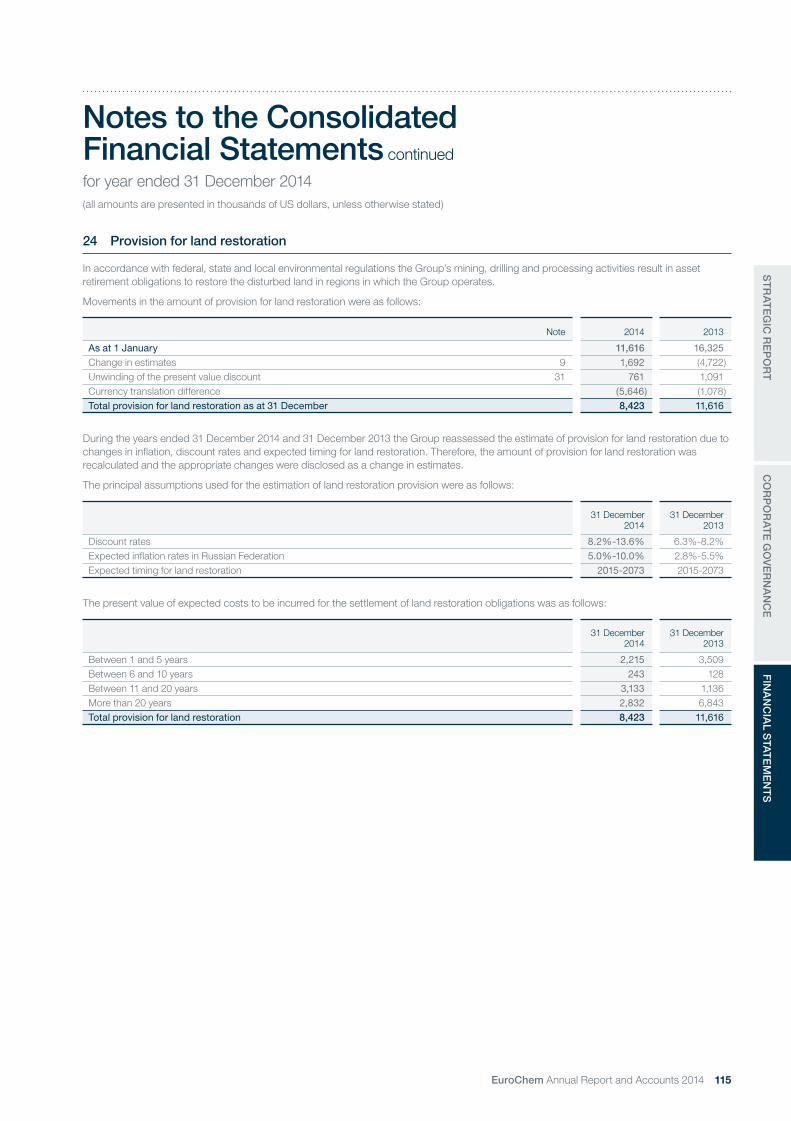
ST
RA
TE
GIC
RE
PO
RT
CO
RP
OR
AT
E G
OV
ER
NA
NC
EFIN
AN
CIA
L STA
TE
ME
NT
S
EuroChem Annual Report and Accounts 2014 115
24 Provision for land restoration
In accordance with federal, state and local environmental regulations the Group’s mining, drilling and processing activities result in asset retirement obligations to restore the disturbed land in regions in which the Group operates.
Movements in the amount of provision for land restoration were as follows:
Note 2014 2013
As at 1 January 11,616 16,325Change in estimates 9 1,692 (4,722)Unwinding of the present value discount 31 761 1,091Currency translation difference (5,646) (1,078)Total provision for land restoration as at 31 December 8,423 11,616
During the years ended 31 December 2014 and 31 December 2013 the Group reassessed the estimate of provision for land restoration due to changes in inflation, discount rates and expected timing for land restoration. Therefore, the amount of provision for land restoration was recalculated and the appropriate changes were disclosed as a change in estimates.
The principal assumptions used for the estimation of land restoration provision were as follows:
31 December2014
31 December2013
Discount rates 8.2%-13.6% 6.3%-8.2%Expected inflation rates in Russian Federation 5.0%-10.0% 2.8%-5.5%Expected timing for land restoration 2015-2073 2015-2073
The present value of expected costs to be incurred for the settlement of land restoration obligations was as follows:
31 December2014
31 December2013
Between 1 and 5 years 2,215 3,509Between 6 and 10 years 243 128Between 11 and 20 years 3,133 1,136More than 20 years 2,832 6,843Total provision for land restoration 8,423 11,616
Notes to the Consolidated Financial Statements continued
for year ended 31 December 2014(all amounts are presented in thousands of US dollars, unless otherwise stated)

FINANCIAL STATEMENTS
116 EuroChem Annual Report and Accounts 2014
25 Trade payables, other accounts payable and accrued expenses
31 December2014
31 December2013
Trade payablesTrade payables denominated in US$ 13,025 19,945Trade payables denominated in RUB 65,199 79,534Trade payables denominated in EUR 108,056 154,385Trade payables denominated in other currencies 12,731 7,036Total trade payables – financial liabilities 199,011 260,900 Other accounts payable and accrued expensesAdvances received 39,134 73,779Payroll and social tax 5,868 13,094Accrued liabilities and other creditors 90,813 161,370Subtotal non-financial liabilities 135,815 248,243Interest payable 6,237 6,702Payable relating to buy-back of ordinary shares of MCC EuroChem 9,000 –Short-term part of deferred payable related to mineral rights acquisition 3,328 5,468Short-term part of deferred payable related to business combination 42,042 47,552Subtotal financial liabilities 60,607 59,722Total other payables 196,422 307,965Total trade payables, other accounts payable and accrued expenses 395,433 568,865
Including:Financial liabilities 259,618 320,622Non-financial liabilities 135,815 248,243
As at 31 December 2014, trade payables included payables to suppliers of property, plant and equipment amounting to US$ 47,176 thousand (31 December 2013: US$ 42,451 thousand).
Notes to the Consolidated Financial Statements continued
for year ended 31 December 2014(all amounts are presented in thousands of US dollars, unless otherwise stated)

ST
RA
TE
GIC
RE
PO
RT
CO
RP
OR
AT
E G
OV
ER
NA
NC
EFIN
AN
CIA
L STA
TE
ME
NT
S
EuroChem Annual Report and Accounts 2014 117
26 Sales
The external sales by product group for the years ended 31 December 2014 and 31 December 2013 were:
2014 2013
Sales volume (thousand
metric tonnes)Sales
(thousand US$)
Sales volume (thousand
metric tonnes)Sales
(thousand US$)
Nitrogen products 7,435 2,199,713 7,476 2,317,240Nitrogen fertilizers 7,419 2,197,067 7,454 2,313,478Other products 16 2,646 22 3,762Phosphate products 2,346 1,104,793 2,389 1,129,011Phosphate fertilizers 2,052 958,463 2,082 975,632Feed phosphates 294 146,330 307 153,379Complex fertilizers 1,571 685,566 1,570 751,600Other fertilizers 45 16,776 37 14,587Iron ore concentrate 5,508 438,621 5,851 661,134Apatite and baddeleyite concentrates – 33,473 – 58,947Apatite concentrate 4 736 140 33,050Baddeleyite concentrate 9 32,737 7 25,897Industrial products – 443,793 – 426,932Organic synthesis products 598 344,262 582 320,207Other products – 99,531 – 106,725Hydrocarbons 126 55,421 141 63,887Other sales – 109,344 – 132,320Logistic services – 15,912 – 16,352Other products – 30,133 – 34,841Other services – 63,299 – 81,127Total sales 5,087,500 5,555,658
27 Cost of sales
The components of cost of sales were:
2014 2013
Raw materials 1,414,390 1,548,234Goods for resale 387,328 431,543Other materials 208,641 221,697Energy 221,851 251,041Utilities and fuel 122,977 145,224Labor, including contributions to social funds 308,516 343,230Depreciation and amortization 218,928 251,557Repairs and maintenance 87,497 85,940Production overheads 83,417 96,599Property tax, rent payments for land and related taxes 55,461 60,402Idle property, plant and equipment write-off 5,003 18,406Write-off for obsolete and damaged inventories, net 2,571 (45)Changes in work in progress and finished goods (50,341) 50,804Other costs 7,426 37,098Total cost of sales 3,073,665 3,541,730
Notes to the Consolidated Financial Statements continued
for year ended 31 December 2014(all amounts are presented in thousands of US dollars, unless otherwise stated)

FINANCIAL STATEMENTS
118 EuroChem Annual Report and Accounts 2014
28 Distribution costs
Distribution costs were:
2014 2013
Transportation 521,438 583,703Export duties, other fees and commissions 2,125 4,867Labor, including contributions to social funds 69,682 77,783Depreciation and amortization 30,268 39,274Repairs and maintenance 12,404 25,170Provision/(reversal of provision) for impairment of receivables, net 1,399 (58)Other costs 56,529 62,449Total distribution costs 693,845 793,188
29 General and administrative expenses
General and administrative expenses were:
2014 2013
Labor, including contributions to social funds 108,492 98,837Depreciation and amortization 18,058 19,273Audit, consulting and legal services 24,935 21,436Rent 7,087 7,154Bank charges 5,842 7,911Social expenditure 4,191 5,401Repairs and maintenance 2,255 3,413Provision/(reversal of provision) for impairment of receivables, net 7,285 3,702Other expenses 37,723 43,543Total general and administrative expenses 215,868 210,670
The total depreciation and amortization expenses included in all captions of the consolidated statement of profit or loss and other comprehensive income amounted to US$ 267,254 thousand (2013: US$ 310,104 thousand).
The total staff costs (including social expenses) included in all captions of the consolidated statement of profit or loss and other comprehensive income amounted to US$ 486,690 thousand (2013: US$ 519,850 thousand).
The total statutory pension contributions included in all captions of the consolidated statement of profit or loss and other comprehensive income amounted to US$ 75,211 thousand (2013: US$ 76,107 thousand).
The fees for the audit of the consolidated and statutory financial statements for the year ended 31 December 2014 amounted to US$ 3,062 thousand (2013: US$ 3,590 thousand). The auditors also provided the Group with consulting and other services amounting to US$ 1,009 thousand (2013: US$ 1,726 thousand).
Notes to the Consolidated Financial Statements continued
for year ended 31 December 2014(all amounts are presented in thousands of US dollars, unless otherwise stated)

ST
RA
TE
GIC
RE
PO
RT
CO
RP
OR
AT
E G
OV
ER
NA
NC
EFIN
AN
CIA
L STA
TE
ME
NT
S
EuroChem Annual Report and Accounts 2014 119
30 Other operating income and expenses
The components of other operating (income) and expenses were:
2014 2013
Sponsorship 17,528 26,344(Gain)/loss on disposal of property, plant and equipment and intangible assets, net 11,286 2,583Foreign exchange (gain)/loss, net (120,377) (12,338)Idle property, plant and equipment write-off 636 110(Gain)/loss on sales and purchases of foreign currencies, net (6,820) (1,620)Non-recurring income from settlement agreement (50,400) –Other operating (income)/expenses, net (7,985) (1,723)Total other operating (income)/expenses, net (156,132) 13,356
In the fourth quarter 2014, the Group recorded income of US$ 50,400 thousand resulting from a settlement agreement with a counterparty concerning trading activities of the Group, out of which US$ 25,200 thousand was received in November 2014. The outstanding amount receivable was accounted for within ‘Other account receivables’.
31 Other financial gain and loss
The components of other financial (gain) and loss were:
Note 2014 2013
Changes in fair value of foreign exchange non-deliverable forward contracts 22 327,127 16,794Changes in fair value of cross-currency interest rate swaps 22 196,467 5,174Gain on disposal of subsidiaries 34 (1,611) –Unwinding of discount on deferred payables 4,974 6,604Unwinding of discount on land restoration obligation 24 761 1,091Total other financial (gain)/loss, net 527,718 29,663
32 Income tax
2014 2013
Income tax expense – current 202,826 219,155Deferred income tax – origination and reversal of temporary differences (81,852) (22,246)Prior periods adjustments recognized in the current period for income tax (281) 9,655Reassessment of deferred tax assets/liabilities due to change in the tax rate – 3,616Income tax expense 120,693 210,180
Notes to the Consolidated Financial Statements continued
for year ended 31 December 2014(all amounts are presented in thousands of US dollars, unless otherwise stated)

FINANCIAL STATEMENTS
120 EuroChem Annual Report and Accounts 2014
32 Income tax continued
A reconciliation between theoretical income tax charge calculated at the applicable tax rates enacted in the countries where Group companies are incorporated, and actual income tax expense calculated as follows:
2014 2013
Profit/(loss) before taxation (456,884) 596,737
Theoretical tax charge at statutory rate of subsidiaries (52,205) (169,511)Tax effect of items which are not deductible or assessable for taxation purposes:– Non deductible expenses (5,769) (6,392)– Foreign exchange gain of the subsidiaries with tax reporting currency different from functional currency (69,104) (9,271)– Write-off of previously recognized tax loss carry forward – (2,168)– Unrecognized tax loss carry forward for the year – (7,744)– Utilization of previously non-recognized tax-losses carry forward 6,531 –– Reassessment of deferred tax assets/liabilities due to change in the tax rate – (3,616)– Adjustment on deferred tax assets/liabilities on prior periods (831) (2,220)– Withholding tax refund on dividends paid in prior periods 404 397Prior periods adjustments recognized in the current period for income tax 281 (9,655)Income tax expense (120,693) (210,180)
The Group companies are subject to tax rates depending on the country of domicile.
Subsidiaries located in the Russian Federation applied a tax rate of 20.0% on taxable profits during the year ended 31 December 2014 (2013: 20.0%), except for several subsidiaries which applied reduced income tax rates within a range from 15.5% to 19.3% according to regional tax law and agreements with regional authorities.
Two major manufacturing entities located in the European Union, Lifosa AB in Lithuania and EuroChem Antwerpen NV in Belgium, apply tax rates of 15.0% and 33.99% on taxable profits, respectively (2013: 15.0% and 33.99%).
The rest of the subsidiaries are subject to the tax rates on taxable profit ranging from 7.8% to 37.7%.
At 31 December 2014, the Group had US$ 203,947 thousand (31 December 2013: US$ 218,108 thousand) of accumulated tax losses carried forward. Out of these, US$ 179,687 thousand were recognized as deferred tax assets (31 December 2013: US$ 187,317 thousand) as the realization of the related tax benefits is probable through future taxable profits. The Group did not recognize deferred tax assets of US$ 24,260 thousand (31 December 2013: US$ 30,791 thousand) because it is not probable that future taxable profit will be available against which the Group can utilise such benefits. The unrecognized tax loss carry forwards expire as follows:
31 December2014
31 December2013
Tax loss carry forwards expiring by:– 31 December 2018 – 1,860– 31 December 2019 3,612 8,283– 31 December 2020 4,610 4,610– 31 December 2021 8,294 8,294– 31 December 2022 7,744 7,744Tax loss carry forward 24,260 30,791
The Group did not recognize a deferred tax liability in respect of temporary differences associated with investments in subsidiaries of US$ 1,052,401 thousand (31 December 2013: US$ 1,887,573 thousand). The Group controls the timing of the reversal of these temporary differences and does not expect to reverse them in the foreseeable future. The Group recognized a deferred tax liability in respect of temporary differences related to the investments in associates of US$ 1,726 thousand (2013: US$ 1,042 thousand).
Notes to the Consolidated Financial Statements continued
for year ended 31 December 2014(all amounts are presented in thousands of US dollars, unless otherwise stated)

ST
RA
TE
GIC
RE
PO
RT
CO
RP
OR
AT
E G
OV
ER
NA
NC
EFIN
AN
CIA
L STA
TE
ME
NT
S
EuroChem Annual Report and Accounts 2014 121
32 Income tax continued
The movement in deferred tax (assets) and liabilities during 2014 and 2013 was as follows:
1 January 2014
Differences recognition
and reversals
Write-off of previously
recognized tax loss
carry forward
Utilization of previously non-
recognized tax-losses
carry forward
Currency translation difference
(Note 2)
Effect of change in
the tax rate31 December
2014
Tax effects of (deductible)/taxable temporary differences:
Property, plant and equipment and Intangible assets 216,966 66,922 – (105,209) – 178,679
Accounts receivable (5,613) 228 – 2,122 – (3,263)Accounts payable (9,987) 5,043 – 2,145 – (2,799)Inventories (1,578) (29,932) – 8,530 – (22,980)Other 2,995 (60,421) – 9,775 – (47,651)Tax losses carried-forward (218,108) (63,692) – 6,531 71,322 – (203,947)Less: Unrecognized deferred
tax assets 30,791 – – (6,531) – – 24,260Net deferred tax (asset)/liability 15,466 (81,852) – – (11,315) – (77,701)
Recognized deferred tax assets (182,393) (116,404) – – 78,920 – (219,877)Recognized deferred
tax liabilities 197,859 34,552 – – (90,235) – 142,176Net deferred tax (asset)/liability 15,466 (81,852) – – (11,315) – (77,701)
1 January 2013
Differences recognition
and reversals
Write-off of previously
recognized tax loss
carry forward
Utilization of previously non-
recognized tax-losses
carry forward
Currency translation difference
(Note 2)
Effect of change in
the tax rate31 December
2013
Tax effects of (deductible)/ taxable temporary differences:
Property, plant and equipment and Intangible assets 158,655 72,969 – – (16,049) 1,391 216,966
Accounts receivable (8,675) 2,746 – – 316 – (5,613)Accounts payable (7,184) (3,051) – – 248 – (9,987)Inventories (8,611) 6,583 – – 492 (42) (1,578)Other 6,323 (5,169) – – (426) 2,267 2,995Tax losses carried forward (117,528) (106,753) 2,168 – 4,005 – (218,108)Less: Unrecognized deferred
tax assets 23,047 7,744 – – – – 30,791Net deferred tax (asset)/liability 46,027 (24,931) 2,168 – (11,414) 3,616 15,466
Recognized deferred tax assets (161,284) (25,352) 2,168 – 2,075 – (182,393)Recognized deferred
tax liabilities 207,311 421 – – (13,489) 3,616 197,859Net deferred tax (asset)/liability 46,027 (24,931) 2,168 – (11,414) 3,616 15,466
The amounts shown in the Consolidated Statement of Financial Position include the following:
31 December2014
31 December2013
Deferred tax assets expected to be recovered after more than 12 months (165,491) (148,829)Deferred tax liabilities expected to be settled after more than 12 months 137,644 188,245
The total amount of the deferred tax charge for 2014 is recognized in profit and loss (2013: US$ 517 thousand of deferred tax charge was recognized in Other Comprehensive Income).
Notes to the Consolidated Financial Statements continued
for year ended 31 December 2014(all amounts are presented in thousands of US dollars, unless otherwise stated)

FINANCIAL STATEMENTS
122 EuroChem Annual Report and Accounts 2014
33 Earnings/(loss) per share
Basic earnings/(loss) per share are calculated by dividing the net profit or loss attributable to equity holders of the Company by the weighted average number of ordinary shares in issue during the period, excluding treasury shares. The Company has no dilutive potential ordinary shares and, therefore, the diluted earnings or loss per share equals the basic earnings or loss per share.
After the capital reorganization of the Group (Note 1), comparative information about earnings per share has been recalculated with the weighted average number of ordinary shares issued by the Company.
2014 2013
Net profit/(loss) for the period attributable to owners of the parent (577,482) 386,755Weighted average number of ordinary shares outstanding 1,000 1,000Earnings/(loss) per share – basic and diluted (577.48) 386.76
34 Balances and transactions with related parties
The Group related parties are considered to include the ultimate beneficiaries, affiliates and entities under common ownership and control within the Group and/or entities having common principal ultimate beneficiaries. In considering each possible related party relationship, attention is directed to the substance of the relationship, not merely the legal form. The relationships with those related parties with whom the Group entered into significant transactions or had significant balances outstanding are detailed below:
Financial statements caption Nature of relationship31 December
201431 December
2013
Statement of financial position Non-current originated loans (Note 16) Other related parties* 40,170 12,700Current originated loans (Note 16) Parent company 21,800 –Current originated loans Associates 4,602 –Prepayments, other receivables and other current assets: Interest receivables Associates 3,260 – Interest receivables Other related parties* 1,518 177 Other receivables Other related parties 3,577 1,037Bonds issued Other related parties 2,500 2,500Loan received from shareholder (Note 19) Other related parties** 30,000 –Trade payables Other related parties – 2,311Other accounts payable and accrued expenses: Payable relating to buy-back of ordinary shares of MCC EuroChem Other related parties* 9,000 –
Financial statements caption Nature of relationship 2014 2013
Statement of profit or loss and other comprehensive income Sales Other related parties 1,307 3,866Distribution costs Associates (2,157) (7,644)Distribution costs Other related parties (4,201) (6,980)General and administrative expenses Other related parties (11) (1,759)Interest income Other related parties* 1,267 182Interest expense Other related parties** (2,653) –
* Related parties represented by the companies under common control with the Group** Related party represented by the Company ultimately controlled by one of the Group’s shareholders
Notes to the Consolidated Financial Statements continued
for year ended 31 December 2014(all amounts are presented in thousands of US dollars, unless otherwise stated)
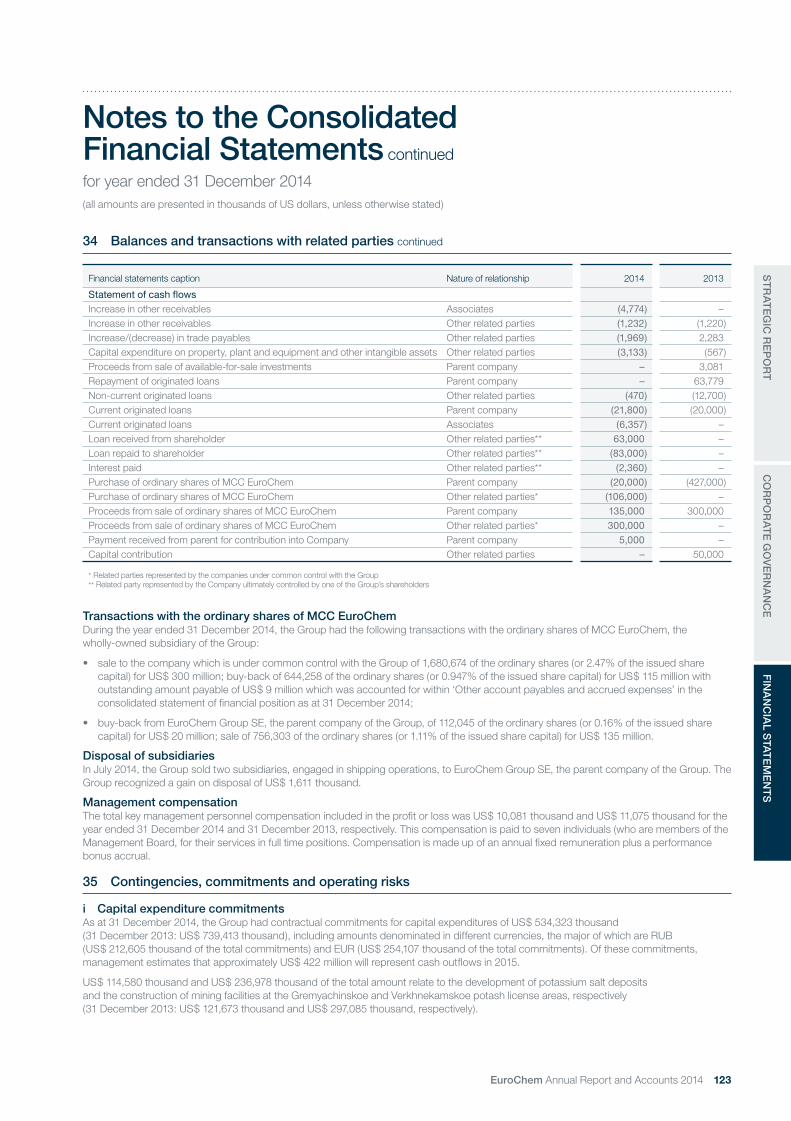
ST
RA
TE
GIC
RE
PO
RT
CO
RP
OR
AT
E G
OV
ER
NA
NC
EFIN
AN
CIA
L STA
TE
ME
NT
S
EuroChem Annual Report and Accounts 2014 123
34 Balances and transactions with related parties continued
Financial statements caption Nature of relationship 2014 2013
Statement of cash flows Increase in other receivables Associates (4,774) –Increase in other receivables Other related parties (1,232) (1,220)Increase/(decrease) in trade payables Other related parties (1,969) 2,283Capital expenditure on property, plant and equipment and other intangible assets Other related parties (3,133) (567)Proceeds from sale of available-for-sale investments Parent company – 3,081Repayment of originated loans Parent company – 63,779Non-current originated loans Other related parties (470) (12,700)Current originated loans Parent company (21,800) (20,000)Current originated loans Associates (6,357) –Loan received from shareholder Other related parties** 63,000 –Loan repaid to shareholder Other related parties** (83,000) –Interest paid Other related parties** (2,360) –Purchase of ordinary shares of MCC EuroChem Parent company (20,000) (427,000)Purchase of ordinary shares of MCC EuroChem Other related parties* (106,000) –Proceeds from sale of ordinary shares of MCC EuroChem Parent company 135,000 300,000Proceeds from sale of ordinary shares of MCC EuroChem Other related parties* 300,000 –Payment received from parent for contribution into Company Parent company 5,000 –Capital contribution Other related parties – 50,000
* Related parties represented by the companies under common control with the Group** Related party represented by the Company ultimately controlled by one of the Group’s shareholders
Transactions with the ordinary shares of MCC EuroChemDuring the year ended 31 December 2014, the Group had the following transactions with the ordinary shares of MCC EuroChem, the wholly-owned subsidiary of the Group:
• sale to the company which is under common control with the Group of 1,680,674 of the ordinary shares (or 2.47% of the issued share capital) for US$ 300 million; buy-back of 644,258 of the ordinary shares (or 0.947% of the issued share capital) for US$ 115 million with outstanding amount payable of US$ 9 million which was accounted for within ‘Other account payables and accrued expenses’ in the consolidated statement of financial position as at 31 December 2014;
• buy-back from EuroChem Group SE, the parent company of the Group, of 112,045 of the ordinary shares (or 0.16% of the issued share capital) for US$ 20 million; sale of 756,303 of the ordinary shares (or 1.11% of the issued share capital) for US$ 135 million.
Disposal of subsidiariesIn July 2014, the Group sold two subsidiaries, engaged in shipping operations, to EuroChem Group SE, the parent company of the Group. The Group recognized a gain on disposal of US$ 1,611 thousand.
Management compensationThe total key management personnel compensation included in the profit or loss was US$ 10,081 thousand and US$ 11,075 thousand for the year ended 31 December 2014 and 31 December 2013, respectively. This compensation is paid to seven individuals (who are members of the Management Board, for their services in full time positions. Compensation is made up of an annual fixed remuneration plus a performance bonus accrual.
35 Contingencies, commitments and operating risks
i Capital expenditure commitmentsAs at 31 December 2014, the Group had contractual commitments for capital expenditures of US$ 534,323 thousand (31 December 2013: US$ 739,413 thousand), including amounts denominated in different currencies, the major of which are RUB (US$ 212,605 thousand of the total commitments) and EUR (US$ 254,107 thousand of the total commitments). Of these commitments, management estimates that approximately US$ 422 million will represent cash outflows in 2015.
US$ 114,580 thousand and US$ 236,978 thousand of the total amount relate to the development of potassium salt deposits and the construction of mining facilities at the Gremyachinskoe and Verkhnekamskoe potash license areas, respectively (31 December 2013: US$ 121,673 thousand and US$ 297,085 thousand, respectively).
Notes to the Consolidated Financial Statements continued
for year ended 31 December 2014(all amounts are presented in thousands of US dollars, unless otherwise stated)

FINANCIAL STATEMENTS
124 EuroChem Annual Report and Accounts 2014
35 Contingencies, commitments and operating risks continued
ii Tax legislationThe management of the Group believes that its interpretation of the tax legislation is generally appropriate and the Group’s tax, currency and customs positions will be sustained.
Given the scale and international nature of the Group’s business, intragroup transfer pricing is an inherent tax risk as it is for other international businesses. Changes in tax laws or their application with respect to matters such as transfer pricing in the countries where the Group has subsidiaries could increase the Group’s effective tax rate.
The majority of Group’s subsidiaries are located in the Russian Federation and required to comply with Russian tax, currency and customs legislation which is subject to varying interpretations. The Russian tax authorities may be taking a more assertive position in their interpretation of the legislation and assessments than the management of the Group, and it is possible that transactions and activities that have not been challenged in the past may be challenged. Fiscal periods remain open to review by the authorities in respect of taxes for three calendar years preceding the year of review with possible extension of this period under certain circumstances.
In 2014, the Controlled Foreign Company (CFC) legislation introduced Russian taxation of profits of foreign companies and non-corporate structures controlled by Russian tax residents (controlling parties). Starting from 2015, CFC income will be subject to a 20% tax rate if the CFC is controlled by a legal entity and a rate of 13% if it is controlled by an individual.
Where management believes that it is probable that certain tax positions taken by the Group may not be sustained if challenged by the tax authorities, the Group recognizes provisions for related taxes, interest and penalties. There were no such provisions recorded by the Group at 31 December 2014 and 31 December 2013.
iii Insurance policiesThe Group obtains risk insurance cover as mandated by statutory requirements. The Group also holds voluntary insurance policies covering directors’ and officers’ liability (D&O insurance), general liability, physical property and business interruption insurance at nitrogen and phosphate production plants, as well as insurance policies related to trade operations, including export shipments, and credit insurance of trade debtors.
The Group also carries voluntary life and accident insurance for employees.
Additionally, as part of the Verkhnekamskoe potash project the Group has voluntarily insured construction risks of all mining and surface facilities related to this project including third party liability insurance during construction works. The insurance covers the risks of destruction and damage related to all facilities including previously constructed starting from November 2014 to July 2020, including a two year guarantee period.
iv Environmental mattersThe Group is subject to federal, state and local environmental regulations in the regions in which it operates. Environmental regulation in the Russian Federation, where the majority of Group’s subsidiaries are located, is evolving and the enforcement posture of government authorities is continually being reconsidered.
The Group periodically evaluates its obligations under environmental regulations and an immediate response is formulated as required. Potential liabilities, which might arise as a result of changes in existing regulations, civil litigation or legislation, cannot be estimated but could be material. The Group’s management believes that it is in compliance with all current existing health, safety and environmental laws and regulations in the regions in which it operates and that there are no significant liabilities for environmental damage.
v Legal proceedingsDuring the reporting period, the Group was involved in a number of court proceedings (both as a plaintiff and a defendant) arising in the ordinary course of business. In the opinion of management, there are no current legal proceedings or other claims outstanding which could have a material effect on the results of operations or the financial position of the Group.
In October 2012, the Group filed a claim against SHAFT SINKERS (PTY) LTD and ROSSAL 126 (PTY) LIMITED (formerly known as SHAFT SINKERS (PTY) LTD.), (‘Shaft Sinkers’), the contractor involved in the construction of the mining shafts at the Gremyachinskoe potash deposit, seeking US$ 800 million compensation for the direct costs and substantial lost profits arising from the delay in commencing potash production, due to the inability of that construction company to fulfil its contractual obligations. Based upon the damages report provided by an independent expert, the amount of the claim was increased up to US$ 1.06 billion which includes net wasted costs to the amount of US$ 248 million and lost profits in the amount of US$ 812 million.
In December 2012, Shaft Sinkers filed a counterclaim against the Group, seeking US$ 44 million without Russian VAT of 18% or US$ 52 million with VAT under the construction contract. In its counterclaim, Shaft Sinkers admits that it will give credit, in respect of any sums awarded to it, for a deduction of US$ 30.6 million in respect of advance payments made by the Group with the result that the maximum net claim from Shaft Sinkers is US$ 14 million. Management believes that this counterclaim is without merit.
The above disputes are subject to arbitration as specified in the contract.
Notes to the Consolidated Financial Statements continued
for year ended 31 December 2014(all amounts are presented in thousands of US dollars, unless otherwise stated)

ST
RA
TE
GIC
RE
PO
RT
CO
RP
OR
AT
E G
OV
ER
NA
NC
EFIN
AN
CIA
L STA
TE
ME
NT
S
EuroChem Annual Report and Accounts 2014 125
35 Contingencies, commitments and operating risks continued
In March 2013, the Group filed a claim against International Mineral Resources B.V. (‘IMR’) which, the Group believes, held a controlling interest in Shaft Sinkers, claiming IMR is responsible for its subsidiary’s actions. In July 2013, the Dutch Court granted EuroChem definitive leave for levying the requested prejudgment attachments against IMR’s Dutch assets, while fixing the amount for which the leave is granted, including interest and cost at EUR 886 million. The court held an in-depth hearing on 21 January 2014 where it considered the arguments and witnesses of both sides. Following that hearing, the court rejected IMR’s request to suspend the case and stated that IMR would not be permitted to submit any additional evidence. On 25 June 2014, the Dutch court denied the Group’s claim against IMR. On 18 September 2014, the Group filed a writ supported by newly discovered additional evidence with the Dutch appeal court. The management of the Group believes that it has very strong evidence to support its case against IMR.
vi Operating environment of the Group The Group operates in the fertilizers industry primarily in the Russian Federation and European countries. The highly competitive nature of the market makes prices of the key Group products relatively volatile.
Possible deteriorating economic conditions, including continuing depreciation of RUB exchange rate (see rates described in Note 2), may have an impact on management’s cash flow forecasts and assessment of the impairment of financial and non-financial assets. Debtors of the Group may also become adversely affected by the financial and economic environment, which could in turn impact their ability to repay the amounts owed or fulfil the obligations undertaken.
Management is unable to predict all developments which could have an impact on the industry and the wider economy and consequently what effect, if any, they could have on the future financial position of the Group. Management believes all necessary measures are being taken to support the sustainability and growth of the Group’s business in the current circumstances.
During the year ended 31 December 2014, political and economic instability in Ukraine increased significantly. Sales to Ukraine accounted for 4.7% of total revenue in the year ended 31 December 2014. Group assets in Ukraine are insignificant and have been provided for accordingly. Management is monitoring and assessing the situation and believes that it would be able to redirect sales to other markets at minimal costs should its ability to maintain profitable business in the Ukrainian market be impaired.
36 Financial and capital risk management
36.1 Financial risk managementThe Group’s activities expose it to a variety of financial risks: market risk (including foreign currency risk, interest rate risk and price risk), credit risk and liquidity risk. The overall risk management program seeks to minimise potential adverse effects on the financial performance of the Group.
(a) Market risk (i) Foreign currency risk The Group’s revenues, expenses, capital expenditure, investments and borrowings are denominated in foreign currencies as well as in Russian roubles. The Group is exposed to foreign exchange risk to the extent that its future cash inflows and outflows over a certain period of time are denominated in different currencies.
The objective of the Group’s foreign exchange risk management is to minimise the volatility of the Group’s cash flows arising from fluctuations in foreign exchange rates. Management focuses on assessing the Group’s future cash flows in foreign currencies and managing the gaps arising between inflows and outflows.
Translation gains and losses arising from the revaluation of its monetary assets and liabilities are therefore not viewed as an indicator of the total impact of foreign exchange fluctuations on its future cash flows since such gains or losses do not capture the impact on cash flows of foreign exchange-denominated revenues, costs, future capital expenditure, investment and financing activities.
Notes to the Consolidated Financial Statements continued
for year ended 31 December 2014(all amounts are presented in thousands of US dollars, unless otherwise stated)

FINANCIAL STATEMENTS
126 EuroChem Annual Report and Accounts 2014
36 Financial and capital risk management continued
The table below summarizes the Group’s financial assets and liabilities which are subject to foreign currency risk at the reporting date:
31 December 2014 US$ EUR RUB Other currencies
ASSETS Non-current financial assets:Restricted cash 8,345 50 – 220Originated loans 40,170 – – –Other non-current assets 5,230 – – –Total non-current financial assets 53,745 50 – 220Current financial assets:Trade receivables 127,292 3,284 – 63Interest receivable 1,814 – – –Other receivables 27,200 – – –Originated loans 24,800 – – –Fixed-term deposits 4,378 – – –Cash and cash equivalents 162,605 34,041 – 4,646Total current financial assets 348,089 37,325 – 4,709Total financial assets 401,834 37,375 – 4,929LIABILITIESNon-current liabilities:Loan received from shareholder 30,000 – – –Bank borrowings – – 346,615 –Bonds issued 750,000 – – –RUB/US$ cross-currency swap (gross amount) 235,000 – – –RUB/US$ non-deliverable forwards 93,146 – – –Deferred payable related to mineral rights acquisition 12,520 – – –Total non-current financial liabilities 1,120,666 – 346,615 –Current liabilities:Bank borrowings 111,996 – 177,751 –RUB/US$ cross-currency swap (gross amount) 159,084 – – –RUB/US$ non-deliverable forwards 117,527 – – –Trade payables 4,418 11,987 – 417Interest payable 2,534 – 299 –Deferred payable related to mineral rights acquisition 2,842 – – –Total current financial liabilities 398,401 11,987 178,050 417Total financial liabilities 1,519,067 11,987 524,665 417
Notes to the Consolidated Financial Statements continued
for year ended 31 December 2014(all amounts are presented in thousands of US dollars, unless otherwise stated)

ST
RA
TE
GIC
RE
PO
RT
CO
RP
OR
AT
E G
OV
ER
NA
NC
EFIN
AN
CIA
L STA
TE
ME
NT
S
EuroChem Annual Report and Accounts 2014 127
36 Financial and capital risk management continued
31 December 2013 US$ EUR Other currencies
ASSETS Non-current financial assets:Restricted cash 718 74 212Originated loans 12,700 – –RUB/US$ non-deliverable forwards 32,502 – –Total non-current financial assets 45,920 74 212Current financial assets:Trade receivables 119,927 5,777 69Interest receivable 193 – –Other receivables 882 341 –Originated loans 3,000 – –RUB/US$ non-deliverable forward contracts 9,991 – –Euro/US$ deliverable forwards 139 – –Fixed-term deposits 2,826 234 –Cash and cash equivalents 203,776 13,548 1,237Total current financial assets 340,734 19,900 1,306Total financial assets 386,654 19,974 1,518LIABILITIESNon-current liabilities:Bank borrowings 1,469,635 41,946 –Bonds issued 750,000 – –RUB/US$ cross-currency swap (gross amount) 159,084 – –Deferred payable related to mineral rights acquisition 14,387 – –Total non-current financial liabilities 2,393,106 41,946 –Current liabilities:Bank borrowings 178,573 4,935 –Trade payables 19,743 80,385 1,251Interest payable 4,365 367 –Deferred payable related to mineral rights acquisition 4,740 – –Total current financial liabilities 207,421 85,687 1,251Total financial liabilities 2,600,527 127,633 1,251
The Group includes a number of subsidiaries with Russian rouble functional currency which have a significant volume of US$-denominated transactions. At 31 December 2014, if the RUB exchange rate against the US$ had been higher/lower by 1%, all other things being equal, after tax result for the year and equity would have been US$ 10,765 thousand (2013: US$ 14,318 thousand) lower/higher, purely as a result of foreign exchange gains/losses on translation of US$-denominated assets and liabilities and with no regard to the impact of this appreciation/depreciation on sales.
The Group is disclosing the impact of such a 1% shift in the manner set out above to ease the calculation for the users of these consolidated financial statements of the impact on the after tax profit and equity resulting from subsequent future exchange rate changes; this information is not used by the management for foreign currency risk management purposes.
During 2014 and 2013, the Group entered into foreign exchange non-deliverable forward contracts to reduce volatility of its future cash flows matching the currency of its borrowings with the currency, in which a positive gap between proceeds and outgoings is expected by the time the borrowings mature (the largest such gap being in the US$ (Note 22)).
Notes to the Consolidated Financial Statements continued
for year ended 31 December 2014(all amounts are presented in thousands of US dollars, unless otherwise stated)

FINANCIAL STATEMENTS
128 EuroChem Annual Report and Accounts 2014
36 Financial and capital risk management continued
The Group’s sales for the years ended 31 December 2014 and 31 December 2013 are presented in the table below:
US$ EUR RUB Other currencies Total
2014 2,409,513 1,393,008 1,010,625 274,354 5,087,50047% 27% 20% 6% 100%
2013 2,941,774 1,170,104 1,072,997 370,783 5,555,65853% 21% 19% 7% 100%
The Group believes that it has significant positive foreign exchange exposure towards the RUB/US$ exchange rate given that the expected US$-denominated revenues exceed the planned outflows in US$, mostly related to servicing of debt and capital expenditure.
(ii) Interest rate riskThe Group’s income and operating cash flows are substantially independent of changes in market interest rates. The Group’s principal interest rate risk arises from long-term and short-term borrowings.
The Group is exposed to risk from floating interest rates due to the fact that it has US$ 1,586,996 thousand of US$-denominated loans outstanding at 31 December 2014 (31 December 2013: US$ 1,648,207 thousand) bearing floating interest rates varying from 1-month Libor +2.25% to 1-month Libor +2.5%, 3-month Libor +1.8% to 3-month Libor +2.9% (2013: from 1-month Libor +2.5% to 1-month Libor +3.25%, 3-month Libor +2.3% and 6-month Libor +2.5%). There were no Euro-denominated loans outstanding at 31 December 2014 (31 December 2013: US$ 46,881 thousand bearing 6-month Euribor +1.95%). The Group’s profit after tax for the year ended 31 December 2014 and equity would have been US$ 1,089 thousand, or 0.2% lower/higher (2013: US$ 1,389 thousand, or 0.4% lower/higher) if the US$ Libor interest rate was 10 bps higher/lower than its actual level during the year. The Group’s profit after tax for the year ended 31 December 2014 and equity would have been US$ 23 thousand, or 0.004% lower/higher (2013: US$38 thousand or 0.01% lower/higher) if the Euribor interest rate was 10 bps higher/lower than its actual level during the year. During 2014 and 2013, the Group did not hedge this exposure using financial instruments.
The Group does not have a formal policy of determining how much exposure the Group should have to fixed or variable rates for as long as the impact of changes in interest rates on the Group’s cash flows remains immaterial. The Group performs periodic analysis of the current interest rate environment on the basis of which management makes decisions on the appropriate mix of fixed-rate and variable-rate debt for both existing and planned new borrowings.
(iii) Financial investments riskThe Group can be exposed to equity securities price risk because of investments that can be held by the Group. As at 31 December 2014 and 31 December 2013 the Group was not exposed to equity securities price risk. During 2013 and 2014, the Group did not hedge this exposure using financial instruments.
The Group does not enter into any transactions with financial instruments whose value is exposed to the value of any commodities traded on a public market.
(b) Credit risk Credit risk arises from the possibility that counterparties to transactions may default on their obligations, causing financial losses for the Group. Financial assets, which potentially subject Group entities to credit risk, consist principally of trade receivables, cash and bank deposits. The objective of managing credit risk is to prevent losses of liquid funds deposited with or invested in financial institutions or the loss in value of receivables.
The maximum exposure to credit risk resulting from financial assets is equal to the carrying amount of the Group’s financial assets, which at 31 December 2014 amounted to US$ 838,760 thousand (31 December 2013: US$ 969,688 thousand). The Group has no significant concentrations of credit risk.
Cash and cash equivalents and fixed-term depositsCash and short-term deposits are mainly placed in major multinational banks and banks with independent credit ratings. No bank balances and term deposits are past due or impaired. See the analysis by credit quality of bank balances, term and fixed-term deposits in Note 17.
Trade receivablesTrade receivables are subject to a policy of active credit risk management which focuses on an assessment of ongoing credit evaluation and account monitoring procedures. The objective of the management of trade receivables is to sustain the growth and profitability of the Group by optimizing asset utilization whilst maintaining risk at an acceptable level. The Group holds voluntary credit insurance policies of some trade debtors relating to the distribution of fertilizers.
Trade receivables are to a large extent secured against a default risk by means of appropriate insurance coverage. Receivables management is geared towards collecting all outstanding accounts punctually and in full and to avoid the loss of receivables.
Notes to the Consolidated Financial Statements continued
for year ended 31 December 2014(all amounts are presented in thousands of US dollars, unless otherwise stated)

ST
RA
TE
GIC
RE
PO
RT
CO
RP
OR
AT
E G
OV
ER
NA
NC
EFIN
AN
CIA
L STA
TE
ME
NT
S
EuroChem Annual Report and Accounts 2014 129
36 Financial and capital risk management continued
The monitoring and controlling of credit risk is performed by the corporate treasury function of the Group. The credit policy requires the performance of credit evaluations and ratings of customers. The credit quality of each new customer is analyzed before the Group provides it with the standard terms of delivery and payment. The Group gives preference to customers with an independent credit rating. New customers without an independent credit rating are evaluated on a sample basis by an appointed rating agency or the score and credit limits for new customers are set by the appointed insurance company. The credit quality of other customers is assessed taking into account their financial position, past experience and other factors.
Customers that do not meet the credit quality requirements are supplied on a prepayment basis only.
Although the collection of receivables could be influenced by economic factors, management believes that there is no significant risk of loss to the Group beyond the provision already recorded (Note 15).
The major part of trade receivables that is neither past due nor impaired relates to wholesale distributors and steel producers for which the credit exposures and related ratings are presented below:
Group of customers Rating agency Credit rating/Other31 December
201431 December
2013
Wholesale customers – Credit Insurance 211,676 156,499Wholesale customers – Letter of credit 53,891 71,247Wholesale customers – Bank guarantee 18,049 17,799Wholesale customers and
steel producersStandard & Poor's 2014: A+ to BBB
2013: BB+ to BBB10,661 27,497
Wholesale customers Credit Reform* Good 1,466 3,010Wholesale customers Dun & Bradstreet Credibility Corp.* 2014: Minimum risk of failure
2013: Strong3,214 13,710
Wholesale customers Dun & Bradstreet Credibility Corp.* 2014: Lower than average risk2013: Good
7,596 13,712
Wholesale customers Dun & Bradstreet Credibility Corp.* Average risk of failure 2,145 6,282Wholesale customers LINCE – cerved group A 2.2 - B 1.2 681 260Wholesale customers ICAP 5 stars – 383Wholesale customers CreditInfo A-very good 687 1,281Wholesale customers AK&M A – 1,335Wholesale customers Other local credit agencies – 1,035 –Total 311,101 313,015
* Independent credit agencies used by the Group for evaluation of customers’ credit quality
The rest of trade receivables is analyzed by management who believes that the balance of the receivables is of good quality due to strong business relationships with these customers. The credit risk of every individual customer is monitored.
(c) Liquidity riskLiquidity risk results from the Group’s potential inability to meet its financial liabilities, such as settlements of financial debt and payments to suppliers. The Group’s approach to liquidity risk management is to maintain sufficient readily available reserves in order to meet its liquidity requirements at any point in time.
In order to take advantage of financing opportunities in the international capital markets, the Group maintains credit ratings from Fitch Ratings and Standard & Poor’s. As at 31 December 2014, these institutions had affirmed the Group’s rating at BB with stable outlook (31 December 2013: BB with stable outlook).
Cash flow forecasting is performed throughout the Group. Group finance monitors rolling forecasts of the Group’s liquidity requirements to ensure it has sufficient cash to meet operational needs while maintaining sufficient headroom on its undrawn committed borrowing facilities (Note 19) at all times so that the Group does not breach borrowing limits or covenants on any of its borrowing facilities. Such forecasting takes into consideration the Group’s debt financing plans, covenant compliance and compliance with internal balance sheet ratio targets.
Notes to the Consolidated Financial Statements continued
for year ended 31 December 2014(all amounts are presented in thousands of US dollars, unless otherwise stated)

FINANCIAL STATEMENTS
130 EuroChem Annual Report and Accounts 2014
Notes to the Consolidated Financial Statements continued
for year ended 31 December 2014(all amounts are presented in thousands of US dollars, unless otherwise stated)
36 Financial and capital risk management continued
The table below analyzes the Group’s financial liabilities into the relevant maturity groupings based on the time remaining from the reporting date to the contractual maturity date.
Less than 1 year
Between 1 and 2 years
Between 2 and 5 years
More than 5 years Total
As at 31 December 2014Trade payables 199,011 – – – 199,011Gross-settled swap:**– Inflows (116,608) (20,422) (214,204) – (351,234)– Outflows 177,104 11,829 255,762 – 444,695Derivative financial liabilities 117,527 93,146 – – 210,673Bank borrowings* 664,050 708,702 1,044,988 – 2,417,740Bonds issued* 227,680 38,437 788,438 – 1,054,555Other liabilities 46,694 45,695 4,492 18,853 115,734
As at 31 December 2013Trade payables 260,900 – – – 260,900Gross-settled swap:**– Inflows (12,569) (165,338) – – (177,907)– Outflows 6,193 165,276 – – 171,469Derivative financial liabilities 396 – – – 396Bank borrowings* 358,675 691,368 1,464,750 47,315 2,562,108Bonds issued* 61,405 363,728 826,875 – 1,252,008Other liabilities 54,602 52,451 54,635 20,810 182,498
* The table above shows undiscounted cash outflows for financial liabilities (including interest together with the borrowings) based on conditions existing as at 31 December 2014 and 31 December 2013, respectively
** Payments in respect of the gross settled swap will be accompanied by related cash inflows
The Group controls the minimum required level of cash balances available for short-term payments in accordance with the financial policy of the Group. Such cash balances are represented by current cash balances on bank accounts, bank deposits, short-term investments, cash and other financial instruments, which may be classified as cash equivalents in accordance with IFRS.
The Group assesses liquidity on a weekly basis using a twelve-month cash flow rolling forecast.
36.2 Capital risk managementThe Group’s objectives when managing capital are to safeguard its ability to continue as a going concern, to provide returns for shareholders and benefits for other stakeholders, to have available the necessary financial resources for investing activities and to maintain an optimal capital structure in order to reduce the cost of capital. The Group considers total capital under management to be equity as shown in the IFRS consolidated statement of financial position. This is considered more appropriate than alternatives, such as the value of equity shown in the Company’s statutory financial (accounting) reports.
The Group monitors capital on the basis of the gearing ratio. Additionally, the Group monitors the adequacy of its debt levels using the net debt to EBITDA ratio.
Gearing ratioThe gearing ratio is determined as net debt to net debt plus shareholders’ equity.
The gearing ratio as at 31 December 2014 and 31 December 2013 is shown in the table below:
31 December2014
31 December2013
Total debt 3,057,706 3,312,208Less: cash and cash equivalents and fixed-term deposits 376,858 580,343Net debt 2,680,848 2,731,865Equity attributable to the holders of the Company 2,195,885 3,716,670Net debt and shareholders’ equity 4,876,733 6,448,535Gearing ratio, % 55% 42%

ST
RA
TE
GIC
RE
PO
RT
CO
RP
OR
AT
E G
OV
ER
NA
NC
EFIN
AN
CIA
L STA
TE
ME
NT
S
EuroChem Annual Report and Accounts 2014 131
36 Financial and capital risk management continued
Net debt/EBITDAThe Group has established a policy that the ratio of the Group’s net debt to its 12 months’ rolling EBITDA should not exceed two and a half times in normal market conditions. For this purpose net debt is determined as the sum of short-term borrowings, long-term borrowings and bonds balance outstanding, less cash and cash equivalents.
The ratio of net debt to EBITDA as at 31 December 2014 and 31 December 2013 is shown in the table below:
Note31 December
201431 December
2013
EBITDA 8 1,512,992 1,348,994Share of net profit from PJSC ‘Murmansk Commercial Seaport’ from 1 January 2013 to the date
of acquisition – 5,955EBITDA including share of net profit in associates before acquisition 1,512,992 1,354,949Net debt 2,680,848 2,731,865Net debt/EBITDA 1.77 2.02
For the purpose of this calculation EBITDA includes EBITDA of acquired subsidiaries and share of net profit in acquired associates for the period from 1 January to the date of acquisition.
Since EBITDA is not a standard IFRS measure, EuroChem Group’s definition of EBITDA may differ from that of other companies.
Notes to the Consolidated Financial Statements continued
for year ended 31 December 2014(all amounts are presented in thousands of US dollars, unless otherwise stated)
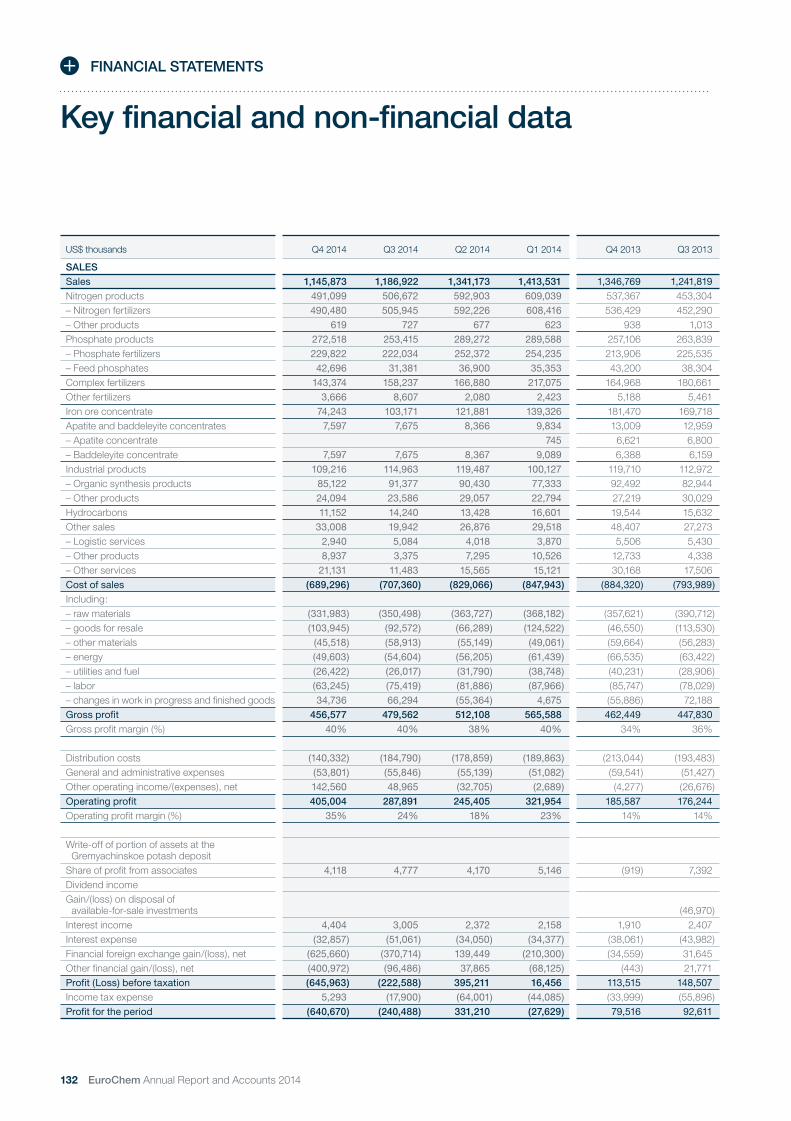
132 EuroChem Annual Report and Accounts 2014
Key financial and non-financial data
FINANCIAL STATEMENTS
US$ thousands Q4 2014 Q3 2014 Q2 2014 Q1 2014 Q4 2013 Q3 2013
SALESSales 1,145,873 1,186,922 1,341,173 1,413,531 1,346,769 1,241,819Nitrogen products 491,099 506,672 592,903 609,039 537,367 453,304– Nitrogen fertilizers 490,480 505,945 592,226 608,416 536,429 452,290– Other products 619 727 677 623 938 1,013Phosphate products 272,518 253,415 289,272 289,588 257,106 263,839– Phosphate fertilizers 229,822 222,034 252,372 254,235 213,906 225,535– Feed phosphates 42,696 31,381 36,900 35,353 43,200 38,304Complex fertilizers 143,374 158,237 166,880 217,075 164,968 180,661Other fertilizers 3,666 8,607 2,080 2,423 5,188 5,461Iron ore concentrate 74,243 103,171 121,881 139,326 181,470 169,718Apatite and baddeleyite concentrates 7,597 7,675 8,366 9,834 13,009 12,959– Apatite concentrate 745 6,621 6,800– Baddeleyite concentrate 7,597 7,675 8,367 9,089 6,388 6,159Industrial products 109,216 114,963 119,487 100,127 119,710 112,972– Organic synthesis products 85,122 91,377 90,430 77,333 92,492 82,944– Other products 24,094 23,586 29,057 22,794 27,219 30,029Hydrocarbons 11,152 14,240 13,428 16,601 19,544 15,632Other sales 33,008 19,942 26,876 29,518 48,407 27,273– Logistic services 2,940 5,084 4,018 3,870 5,506 5,430– Other products 8,937 3,375 7,295 10,526 12,733 4,338– Other services 21,131 11,483 15,565 15,121 30,168 17,506Cost of sales (689,296) (707,360) (829,066) (847,943) (884,320) (793,989)Including:– raw materials (331,983) (350,498) (363,727) (368,182) (357,621) (390,712)– goods for resale (103,945) (92,572) (66,289) (124,522) (46,550) (113,530)– other materials (45,518) (58,913) (55,149) (49,061) (59,664) (56,283)– energy (49,603) (54,604) (56,205) (61,439) (66,535) (63,422)– utilities and fuel (26,422) (26,017) (31,790) (38,748) (40,231) (28,906)– labor (63,245) (75,419) (81,886) (87,966) (85,747) (78,029)– changes in work in progress and finished goods 34,736 66,294 (55,364) 4,675 (55,886) 72,188Gross profit 456,577 479,562 512,108 565,588 462,449 447,830Gross profit margin (%) 40% 40% 38% 40% 34% 36%
Distribution costs (140,332) (184,790) (178,859) (189,863) (213,044) (193,483)General and administrative expenses (53,801) (55,846) (55,139) (51,082) (59,541) (51,427)Other operating income/(expenses), net 142,560 48,965 (32,705) (2,689) (4,277) (26,676)Operating profit 405,004 287,891 245,405 321,954 185,587 176,244Operating profit margin (%) 35% 24% 18% 23% 14% 14%
Write-off of portion of assets at the Gremyachinskoe potash deposit
Share of profit from associates 4,118 4,777 4,170 5,146 (919) 7,392Dividend incomeGain/(loss) on disposal of
available-for-sale investments (46,970)Interest income 4,404 3,005 2,372 2,158 1,910 2,407Interest expense (32,857) (51,061) (34,050) (34,377) (38,061) (43,982)Financial foreign exchange gain/(loss), net (625,660) (370,714) 139,449 (210,300) (34,559) 31,645Other financial gain/(loss), net (400,972) (96,486) 37,865 (68,125) (443) 21,771Profit (Loss) before taxation (645,963) (222,588) 395,211 16,456 113,515 148,507Income tax expense 5,293 (17,900) (64,001) (44,085) (33,999) (55,896)Profit for the period (640,670) (240,488) 331,210 (27,629) 79,516 92,611

ST
RA
TE
GIC
RE
PO
RT
CO
RP
OR
AT
E G
OV
ER
NA
NC
EFIN
AN
CIA
L STA
TE
ME
NT
S
EuroChem Annual Report and Accounts 2014 133
Q2 2013 Q1 2013 Q4 2012 Q3 2012 Q2 2012 Q1 2012 2014 2013 2012
1,433,202 1,533,868 1,341,797 1,477,145 1,352,946 1,182,299 5,087,500 5,555,658 5,354,187664,422 662,147 653,650 662,563 557,285 426,144 2,199,713 2,317,240 2,299,642663,466 661,293 652,705 661,684 556,479 425,518 2,197,067 2,313,478 2,296,386
957 854 945 879 806 626 2,646 3,762 3,256265,004 343,062 240,390 341,030 325,694 385,390 1,104,793 1,129,011 1,292,504234,468 301,723 204,267 307,999 284,664 346,328 958,463 975,632 1,143,25830,536 41,339 36,123 33,031 41,030 39,062 146,330 153,379 149,246
190,514 215,457 161,035 226,928 135,679 59,395 685,566 751,600 583,0371,864 2,074 4,797 5,632 963 524 16,776 14,587 11,916
169,918 140,028 127,747 108,962 170,373 166,582 438,621 661,134 573,66411,934 21,045 18,545 17,542 19,869 18,495 33,473 58,947 74,4515,599 14,030 10,533 11,200 8,791 11,760 736 33,050 42,2846,335 7,015 8,012 6,342 11,078 6,735 32,737 25,897 32,167
88,273 105,976 93,775 79,695 94,008 84,234 443,793 426,931 351,71262,751 82,020 59,987 51,828 61,933 63,070 344,262 320,207 236,81825,521 23,956 33,789 27,867 32,075 21,164 99,531 106,725 114,89514,831 13,880 16,863 12,436 15,229 15,485 55,421 63,887 60,01326,442 30,199 24,995 22,357 33,846 26,050 109,344 132,321 107,2483,633 1,783 4,404 5,028 6,532 3,709 15,912 16,352 19,6736,290 11,480 6,014 6,008 12,023 10,483 30,133 34,841 34,528
16,517 16,937 14,575 11,321 15,293 11,857 63,299 81,128 53,046(897,312) (966,109) (834,944) (930,089) (734,327) (645,005) (3,073,665) (3,541,730) (3,144,365)
(365,930) (433,971) (443,047) (437,878) (369,072) (271,200) (1,414,390) (1,548,234) (1,521,197)(145,919) (125,544) (112,948) (169,928) (53,199) (28,230) (387,328) (431,543) (364,305)(55,203) (50,547) (51,797) (48,936) (44,457) (45,390) (208,641) (221,697) (190,580)(55,285) (65,799) (62,098) (54,096) (51,457) (56,938) (221,851) (251,041) (224,589)(34,897) (41,190) (40,669) (27,509) (33,114) (40,433) (122,977) (145,224) (141,725)(89,344) (90,110) (87,824) (71,301) (79,810) (77,591) (308,516) (343,230) (316,526)(24,180) (42,926) 91,349 (4,701) 3,670 (46,208) 50,341 (50,804) 44,110
535,889 567,760 506,852 547,056 618,619 537,295 2,013,835 2,013,928 2,209,82237% 37% 38% 37% 46% 45% 40% 36% 41%
(192,497) (194,164) (199,640) (195,334) (179,842) (174,253) (693,845) (793,188) (749,069)(51,493) (48,209) (56,459) (41,134) (43,275) (39,193) (215,868) (210,670) (180,061)19,393 (1,796) (240) (22,344) 45,500 (10,999) 156,132 (13,356) 11,917
311,292 323,591 250,513 288,244 441,002 312,850 1,260,254 996,714 1,292,60922% 21% 19% 20% 33% 26% 25% 18% 24%
(2,420) (99,959) 1,962 (18,131) (118,548)5,431 18,211 11,9043,651 1 (50) 3,319 3,651 3,270
3 (274) (229) 18,780 (46,970) 18,2801,824 1,766 2,234 2,863 3,664 11,659 11,939 7,907 20,420
(39,448) (40,318) (36,206) (32,490) (32,173) (37,212) (152,345) (161,809) (138,081)(126,986) (55,097) 39,093 111,080 (190,799) 179,415 (1,067,225) (184,997) 138,789
(40,746) (10,245) 47,166 45,515 (66,430) 53,066 (527,718) (29,663) 79,317115,018 219,697 300,384 314,929 160,315 520,428 (456,884) 596,737 1,296,056(59,045) (61,240) (43,740) (68,742) (69,579) (66,520) (120,693) (210,180) (248,581)55,973 158,457 256,644 246,187 90,737 453,907 (577,577) 386,557 1,047,475

134 EuroChem Annual Report and Accounts 2014
Key financial and non-financial data continued
FINANCIAL STATEMENTS
US$ thousands Q4 2014 Q3 2014 Q2 2014 Q1 2014 Q4 2013 Q3 2013
EBITDA 422,024 364,573 321,129 405,266 282,679 258,677EBITDA margin (%) 37% 31% 24% 29% 21% 21%– Nitrogen 208,045 212,885 207,114 238,249 157,279 154,716– Phosphates 149,180 112,737 104,343 109,634 89,954 114,999– Potash (14,587) (6,428) (3,444) (7,376) (8,939) (8,845)– Distribution 26,070 24,373 7,206 32,762 37,447 (3,851)– Others 106,595 41,913 9,966 35,952 7,668 9,347– Elimination (53,279) (20,907) (4,056) (3,955) (730) (7,689)
Total equity 2,197,375 3,511,669 4,217,091 3,461,308 3,721,837 3,336,927Net debt 2,680,848 2,599,492 2,568,201 2,846,555 2,731,865 2,995,222Net debt/LTM EBITDA (x) 1.77x 1.89x 2.03x 2.11x 2.02x 2.13xNet Working Capital 707,726 675,849 814,841 854,542 706,593 748,228
Gross cash flow 515,652 372,568 242,638 377,797 249,555 229,639Cash from operating activities 176,572 320,832 343,903 122,678 305,110 239,049Cash flow from investing activities (231,492) (594,550) (263,074) (194,970) (325,141) (281,618)Free cash inflow/(outflow) (54,920) (273,718) 80,827 (72,292) (12,920) (49,680)Cash flow from financing activities (130,463) 319,150 67,757 (16,837) 69,164 (37,499)Effect of exchange rates 871 (57,324) 83,623 (88,996) 2,357 8,296Net increase/(decrease) in cash and
cash equivalents (184,512) (11,892) 232,209 (178,125) 51,490 (71,772)Capital expenditure on PP&E and intangible assets (329,937) (310,860) (244,501) (178,687) (294,594) (253,585)
SALES BY REGIONEurope 499,802 393,132 430,784 592,818 475,076 328,403Russia 236,941 255,037 243,076 288,799 258,416 243,433
Asia 148,758 149,841 231,018 158,067 271,711 249,876Latin America 67,540 174,685 163,271 88,888 77,088 146,842North America 87,053 87,449 185,156 144,203 137,729 101,173CIS 74,380 90,336 38,722 109,710 93,309 118,991Africa 30,272 29,270 39,034 25,081 27,651 35,716Australasia 1,127 7,172 10,113 5,965 5,789 17,385Total sales 1,145,873 1,186,922 1,341,174 1,413,531 1,346,769 1,241,819
SALES VOLUMES (METRIC TONNES)Nitrogen products 1,767,267 1,781,496 1,940,287 1,945,244 1,968,546 1,589,448 – Nitrogen fertilizers 1,778,372 1,777,464 1,936,782 1,941,676 1,962,877 1,583,825 – Other products 4,646 4,032 3,505 3,568 5,669 5,623Phosphate products 560,643 528,589 606,732 650,119 623,317 553,847 – Phosphate fertilizers 471,719 466,078 534,935 579,737 534,065 478,839 – Feed phosphates 88,924 62,511 71,797 70,382 89,252 75,008Complex fertilizers 343,752 378,278 376,236 472,407 375,957 387,292Other fertilizers 10,095 25,005 5,870 4,248 12,450 16,010Iron ore concentrate 1,348,186 1,431,342 1,404,890 1,323,470 1,586,407 1,569,568Apatite and baddeleyite concentrates – Apatite concentrate 3,888 30,969 31,002 – Baddeleyite concentrate 2,162 2,079 2,194 2,466 1,709 1,629Industrial products – Organic synthesis products 161,345 149,840 150,003 136,398 165,874 158,872 – Other products Hydrocarbons 30,722 31,210 28,226 36,017 39,457 34,972

ST
RA
TE
GIC
RE
PO
RT
CO
RP
OR
AT
E G
OV
ER
NA
NC
EFIN
AN
CIA
L STA
TE
ME
NT
S
EuroChem Annual Report and Accounts 2014 135
Q2 2013 Q1 2013 Q4 2012 Q3 2012 Q2 2012 Q1 2012 2014 2013 2012
401,514 406,124 331,101 361,920 514,047 374,238 1,512,992 1,348,994 1,581,30628% 26% 25% 25% 38% 32% 30% 24% 30%
232,851 263,612 243,542 218,300 321,570 202,093 866,293 808,458 985,505118,216 112,292 72,094 134,501 177,168 138,697 475,894 435,461 522,460
(6,575) 35 (4,816) (3,281) (5,081) (4,432) (31,835) (24,324) (17,610)18,807 34,438 24,772 9,508 7,755 8,463 90,411 86,841 50,49833,408 (2,724) (3,024) 9,503 19,107 22,014 194,426 47,699 47,600
4,807 (1,529) (1,467) (6,611) (6,472) 7,403 (82,197) (5,141) (7,147)
3,273,162 3,321,783 3,516,202 3,498,291 3,098,551 3,304,048 2,197,375 3,721,837 3,516,2022,857,970 2,829,241 2,615,607 2,198,347 2,105,272 2,219,061 2,680,848 2,731,865 2,615,607
1.89x 1.73x 1.57x 1.23x 1.14x 1.16x 1.77x 2.02x 1.57x791,999 800,346 786,239 682,917 733,377 697,218 707,726 706,593 786,239
321,098 319,500 289,479 311,027 430,196 291,402 1,508,655 1,119,792 1,322,104303,111 289,423 167,247 362,204 357,372 363,499 963,985 1,136,693 1,250,322
(248,628) (151,782) (261,763) (371,894) (374,384) 438,952 (1,284,088) (1,007,169) (569,089)54,483 137,641 (94,516) (9,687) (17,015) 802,451 (320,103) 129,524 681,233(39,842) (122,187) (14,091) 46,420 81,467 (559,997) 239,607 (130,364) (446,201)105,234 (117,797) 7,004 12,867 123,284 (133,922) (61,824) (1,910) 9,233
119,875 (102,343) (101,603) 49,597 187,739 108,532 (142,320) (2,750) 244,265(228,388) (241,788) (296,505) (205,787) (206,456) (196,815) (1,063,985) (1,018,355) (905,563)
391,749 602,278 460,639 437,988 259,012 276,516 1,916,536 1,797,506 1,434,155226,265 318,774 285,468 258,499 280,582 315,580 1,023,853 1,046,888 1,140,129
270,306 197,606 203,853 203,972 249,271 178,792 687,684 989,499 835,888208,435 78,219 108,796 226,269 266,854 132,177 494,384 510,584 734,096133,364 178,762 170,475 179,897 129,196 132,790 503,861 551,028 612,358123,500 111,334 68,270 124,243 110,879 112,381 313,148 447,134 415,77358,081 35,935 17,505 42,992 30,668 25,373 123,657 157,383 116,53821,501 10,961 26,790 3,285 26,484 8,691 24,377 55,636 65,250
1,433,201 1,533,869 1,341,796 1,477,145 1,352,946 1,182,300 5,087,500 5,555,658 5,354,187
2,022,630 1,894,504 1,939,663 2,041,377 1,487,868 1,291,408 7,434,294 7,475,128 6,760,3162,017,632 1,889,275 1,933,001 2,036,030 1,483,113 1,287,727 7,434,294 7,453,609 6,739,871
4,998 5,229 6,662 5,347 4,755 3,681 15,751 21,519 20,445531,789 680,472 444,255 622,707 602,092 689,551 2,346,083 2,389,425 2,358,605471,235 598,034 375,882 556,679 521,986 614,293 2,052,469 2,082,173 2,068,84060,554 82,438 68,373 66,028 80,106 75,258 293,614 307,252 289,765
384,077 422,347 308,130 444,633 305,173 140,798 1,570,673 1,569,673 1,198,7344,420 3,874 10,977 13,242 2,114 1,070 45,218 36,754 27,403
1,482,307 1,213,115 1,368,305 1,132,247 1,397,906 1,388,136 5,507,888 5,851,397 5,286,594
23,197 54,357 38,876 42,705 34,917 48,092 3,888 139,525 164,5901,630 1,709 1,872 1,504 2,728 1,904 8,901 6,677 8,008
108,951 148,417 123,596 117,371 131,663 136,272 597,586 582,114 508,902
36,345 30,501 162,955 136,747 193,737 182,662 126,175 141,275 676,101

136 EuroChem Annual Report and Accounts 2014
EuroChem Group AGAddress: Alpenstrasse 9, 6300 Zug, SwitzerlandTel: +41 (41) 727 16 00Fax: +41 (41) 727 16 16Website: www.eurochemgroup.com
Investor RelationsE-mail: [email protected]
PR and Communications DepartmentE-mail: [email protected]
EuroChem’s IFRS auditorFull name: PricewaterhouseCoopers SchweizShort name: PwC SchweizAddress: Birchstrasse 160, 8050 Zürich, SwitzerlandTel: +41 58 792 00 00Website: www.pwcglobal.com
CONTACT INFORMATION

EuroChem Annual Report and Accounts 2014 137
Forward-looking statements
This annual report has been prepared by EuroChem Group AG (‘EuroChem’ or the ‘Company’) for informational purposes, and may include forward-looking statements or projections. These forward-looking statements or projections include matters that are not historical facts or statements and reflect the Company’s intentions, beliefs or current expectations concerning, among other things, the Company’s results of operations, financial condition, liquidity, performance, prospects, growth, strategies, and the industry in which the Company operates. By their nature, forwarding-looking statements and projections involve risks and uncertainties because they relate to events and depend on circumstances that may or may not occur in the future. The Company cautions you that forward-looking statements and projections are not guarantees of future performance and that the actual results of operations, financial condition and liquidity of the Company and the development of the industry in which the Company operates may differ materially from those made in or suggested by the forward-looking statements or projections contained in this publication. Factors that could cause the actual results to differ materially from those contained in forward-looking statements or projections in this publication may include, among other things, general economic conditions in the markets in which the Company operates, the competitive environment in, and risks associated with operating in, such markets, market change in the fertilizer and related industries, as well as many other risks affecting the Company and its operations. In addition, even if the Company’s results of operations, financial condition and liquidity and the development of the industry in which the Company operates are consistent with the forward-looking statements or projections contained in this publication, those results or developments may not be indicative of results or developments in future periods. The Company does not undertake any obligation to review or confirm expectations or estimates or to update any forward-looking statements or projections to reflect events that occur or circumstances that arise after the date of this publication.
Statements regarding competitive position
Statements referring to EuroChem’s competitive position are based on the Company’s belief and, in some cases, rely on a range of sources, including investment analysts’ reports, independent market studies and EuroChem’s internal assessments of market share based on publicly available information about the financial results and performance of market participants.


![Adding value to_your_degree[1]](https://static.fdocuments.net/doc/165x107/559755c61a28abd2238b4603/adding-value-toyourdegree1.jpg)